Abstract
The study presents original research focused on improving the reliability and energy efficiency of electric railway turnout heating systems under severe winter conditions. An innovative diagnostic methodology using high-resolution infrared thermography was developed and applied to evaluate heating uniformity and technical performance within the Polish railway infrastructure. Field investigations were carried out on operational turnouts at Gdańsk Osowa and Międzylesie stations, covering both conventional EOR systems and the advanced ESAR system. The results demonstrated that the ESAR system effectively prevented ice and snow accumulation while enabling up to a 30% reduction in active power supplied to heating elements, resulting in annual energy savings of approximately 750 kWh per turnout (29% compared with the reference system). Incorporating radiative overlays in ESAR allowed lower average surface temperatures and improved heat distribution efficiency. Temperature and energy indicators confirmed significantly higher performance of ESAR, with annual CO2 emissions reduced by 447.75 kg and air pollutants (SOx, NOx, CO, particulates) by around 30%. The proposed thermographic approach proved to be a non-invasive and efficient diagnostic tool, supporting adaptive control, enhanced operational reliability, and reduced environmental impact of turnout heating systems.
1. Introduction
Railway turnouts are special elements in the track system that allow rolling stock to change direction. Turnouts are key elements of railway infrastructure and are exposed to adverse weather conditions, including rain, sleet, snow, and, at low temperatures, snow and ice accumulation. Most often in winter, during periods of low temperatures and snowfall or freezing rain, mechanisms may freeze, and difficulties may arise in adjusting the moving parts of turnouts, leading to delays and dangerous situations on the tracks [1,2]. Any failure of these systems can lead to severe operational disruptions, including derailments and delays, posing a serious threat to passenger safety and reliability [3]. During winter, the freezing of turnout mechanisms limits mobility, causing operational difficulties. For example, low temperatures combined with snowfall and freezing rain can make it impossible to manually switch turnouts, forcing the use of automatic systems to improve operational safety. The presence of ice or snow between the moving parts of a switch disrupts its operation, so regular maintenance and de-icing are crucial for its operational reliability [2,4,5]. These activities are supported by advanced technical solutions, including mechanical snow removal systems and dedicated heating mechanisms that maintain the efficiency of turnouts [6,7]. To increase effectiveness of turnouts, various strategies are being implemented, including integrating advanced monitoring technologies and heating systems to counteract the effects of adverse weather conditions [8]. Many studies emphasise the effectiveness of various heating technologies. Thanks to their widespread use and energy efficiency, resistance systems enjoy great popularity [7,9]. Furthermore, recent studies analyse the use of induction heating, pointing to its greater energy efficiency and potential for better performance under specific operating conditions compared to conventional systems [5,10]. Each heating system offers different advantages—from installation costs and maintenance requirements to operational efficiency—highlighting the need to tailor solutions to local climatic conditions and operational requirements [6].
Turnout heating systems have evolved significantly—from traditional water- and combustion-based solutions to the currently dominant electric resistance heating systems. Resistance heating using heating cables has become standard in many European railway systems, including Poland, where thousands of turnouts are equipped with this type of installation [7]. The effectiveness of these systems in preventing icing and maintaining mechanical efficiency of turnouts has been widely documented. Work is also underway on the application of induction technologies, which offer benefits in terms of energy savings and efficient heat distribution [5,11]. Such systems effectively melt ice at switching points and prevent it from accumulating.
Regular inspections and proper maintenance of railway turnouts are essential to ensure safety [12,13]. Neglecting infrastructure maintenance can lead to mechanical wear or corrosion of control components, which may result in train derailment [14]. The recommended measures emphasise automating processes related to railway traffic control to reduce the risk of human error [15], while increasing the level of safety and reliability of the system [13]. The lack of operational efficiency of railway turnouts directly affects railway traffic safety and causes traffic disruptions, often leading to delays and economic losses for carriers [12]. Research suggests that a significant proportion of delays on railway networks can be attributed to malfunctioning points and crossings [13]. Therefore, by adopting condition-based maintenance practices supported by comprehensive fault detection systems, railways can increase the reliability of their infrastructure while managing costs [13,16]. Therefore, the concept of merging data from multi-sensor systems is being increasingly developed. This forms the basis for fault detection using machine learning methods and optimised heating techniques [17,18,19,20]. Integrating these solutions with improved sensor placement strategies and predictive maintenance models provides a comprehensive approach that ensures increased safety and reliability of railway infrastructure operation in harsh winter conditions [21,22,23].
Turnout problems are one of the leading causes of railway incidents [14], especially on heavily used infrastructure, which leads to faster degradation [2,12]. The deterioration of turnout technical condition is also related to the need for heating systems to prevent freezing in winter [24]. Faulty railway turnouts seriously threaten rail transport safety due to the risk of train derailment. The possibility of serious injuries, fatalities, and significant material losses is further exacerbated by the risk of malfunctions, despite the use of advanced sensor systems to warn of irregularities [14]. In areas particularly prone to turnout failures, it is necessary to implement regular maintenance procedures, such as periodic removal of accumulated snow and ice, to mitigate these risks [24,25].
The costs of maintaining turnouts are complex and depend on many factors, including the type of turnout and the intensity of rail traffic. These costs can be divided into several key categories: inspection, maintenance, and repair [14,16]. Regular inspections and maintenance are essential to minimise failures, translating into stable railway system maintenance costs [13,14]. A detailed analysis of the life cycle costs associated with railway turnouts suggests that although they represent a small part of railway investments—their share is about 10% of the total track costs—they account for about 50% of the total track maintenance costs due to their relatively short service life compared to other railway components [16]. This disproportionate cost distribution highlights the critical nature of implementing effective maintenance strategies. Current practices rely mainly on preventive maintenance to minimise operational downtime, which is essential to ensure the reliability and safety of railway operations [12,13]. Implementing condition monitoring systems using thermal imaging has shown promise in optimising heating processes by accurately assessing turnout thermal condition. This enables targeted heating and, as a result, reduces unnecessary energy expenditure [24]. The energy management strategies discussed by Alfieri et al. further emphasise the importance of a comprehensive assessment of the entire railway electrical infrastructure, integrating both AC and DC systems to increase the energy efficiency of turnouts across the broader network [15].
Traditional inspection approaches for railway switch heating systems have primarily relied on visual inspection methods and basic electrical testing protocols. Visual inspection methodologies include physical examination procedures, such as manual inspection of heater mounting brackets, cable connections, and assessment of visible damage to heating elements and their supporting infrastructure. Operational testing typically involves manual activation of heating systems during scheduled maintenance windows, requiring system shutdown and direct human intervention to verify functionality. Component evaluation procedures focus on the visual assessment of heater element positioning, integrity of fastening components, and overall system configuration, largely dependent on the inspector’s experience and subjective judgement. Documentation review processes analyse maintenance logs and failure history to identify recurring issues and predict potential system failures [26,27].
Currently, resistance heating using heating cables is Europe’s most popular electric turnout heating (EOR) system. The EOR system works by heating the rails and turnout components with resistance heaters, preventing them from freezing and enabling the switch to be moved correctly. In Poland, in the area managed by PKP Polskie Linie Kolejowe S.A., Warsaw, Poland, this solution is installed in over 22,000 turnouts [28]. It is estimated that the energy consumption costs for the proper operation of railway turnouts in winter amount to several million zlotys [28]. It should be noted that the solution currently in use is highly reliable but does not take into account modern energy reduction requirements. This article is related to work carried out as part of the project ‘Energy-efficient Electric Turnout Heating System with Adaptive Heating Power Distribution’ (ESAR), developed by AREX WB GROUP [29] (Poland), which aims to create a more effective solution for heating railway turnouts in winter. The article presents a measurement procedure using thermal imaging to assess the condition of turnouts and identify the actual operation of resistance heating systems in Polish conditions.
One proposed solution for replacing the current EOR systems is induction heating. When optimised for 40–70 kHz frequencies, these systems can provide sufficient energy to maintain railway functionality and melt snow and ice. This solution generates potential energy savings of 30–50% compared to resistive heating. However, it is essential to highlight the technical problems of the system related to impedance matching, coil design optimisation, and the use of low dielectric loss materials, which are necessary to maintain reliability [7,10,30].
The thermal imaging methodology proposed by the authors as a diagnostic tool is an innovative and new solution that can be adapted to monitor the technical condition of turnout heating systems. The method is non-invasive and does not require additional measuring systems. All that is needed is to train staff in using the device and interpreting the results, from the simplest—the system works/does not work—to more complex assessments. A dedicated application for recognising thermal imaging images can be used to support the interpretation of results. However, this solution is planned for further research and development work.
2. Materials and Methods
The elements heated in the turnout area in the radiator–rail system and the surrounding area are primarily the turnout point and the guard rail (Figure 1), switch closures, and other elements depending on the type of turnout. The selection and arrangement of individual heaters is specified in the EOR cards constituting Appendix 1 to the normative document entitled ‘Guidelines for the Design of Electric Turnout Heating Devices let-5—Volume 1’ [31].
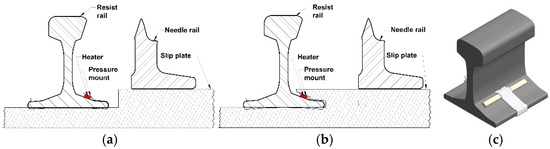
Figure 1.
Example of how to mount a heater to a support rail: (a) classic mounting of support brackets, (b) spring-loaded mounting of support brackets, and (c) mounting the heater to the rail (Arex, catalogue card).
Resistance heaters [32] are attached to the foot of the stock rail using special brackets [33], and heating plates and other special heaters are used to heat turnouts. Track-mounted electric turnout heating devices consist of components such as heaters [32], isolation transformers [34], and distribution cabinets [35]. These complex devices are controlled by weather transducers, which enable automatic switching to adjust the heating intensity according to the weather conditions at a given time. Modern systems are adapted for remote control and for changing settings in the control system. Separation transformers for electric turnout heating devices are designed to power heaters installed in turnouts. Additional tasks of isolation transformers include protecting operators against electric shock from the 230 V power supply, separating power supply circuits from stray currents, and preventing the transfer of 3 kV DC potential outside the area of influence of the electric traction under fault conditions. Depending on the type and application, EOR electric turnout heating transformers can have a power rating of 150 to 4600 VA. Electric turnout heating devices are manufactured and used in turnouts with single-heater powers ranging from 50 to 1600 W, while the power of the entire electric turnout heating system for a single turnout ranges from 2400 to over 25,000 W. Heaters with power ratings of 900, 1050, 1250, and 1600 W are used to heat the switch blades and stock rails in turnouts, the parameters of which are given in Table 1. The heater consists of a rod with a 330 W/m spiral inside, a 3 × 1.5 mm2 power cable with a protective conductor connected to the heater jacket, and a cable sleeve marked with a colour corresponding to the heater power. Electrical heating switch distribution cabinets are used to power electrical heating switch transformer boxes. Heating circuits should be designed so that it is possible to switch individual switches on and off depending on the traffic situation [31].

Table 1.
Technical data for heating elements installed along rails and track axles in accordance with Iet-118 [32].
The process of continuous modernisation and adaptation of railway lines to accommodate trains travelling at ever-increasing speeds determines the development of turnout designs, including their reliability in winter conditions. The design, efficiency, and effectiveness of the structural elements of electrical turnout heating systems are being developed, especially those exposed to adverse atmospheric factors in winter, i.e., snow and ice. For this reason, new types and design solutions for turnouts require extensive, effective, and efficient heating. Railway infrastructure managers in Poland typically assume an average annual electricity consumption of over 20 GWh for electric turnout heating systems. For example, in 2018 it was 29 GWh, and the power ordered for connections supplying electric turnout heating systems was 148 MW, which is increasing annually. This generates fixed costs in correlation with weather conditions and rising energy prices. Given rising electricity prices, measures to optimise consumption are becoming increasingly important. Depending on weather conditions, the operating time of electric turnout heating devices is usually over 300 h per year and is closely related to the aforementioned atmospheric factors. There is therefore a justified need to seek technical and functional solutions in the field of operation that will contribute to reducing the electricity consumption of electric turnout heating devices. Even a reduction of 1% can bring measurable savings on an annual basis.
Appropriately selected heating element power ensures sufficiently effective heating of turnouts. However, from the point of view of energy consumption, this solution results in high electricity demand during the heating season on a national scale. Currently, there is no standardised technical solution for all types of turnouts. Heating cables (Figure 2) of various lengths and power ratings (Table 1) are used, adapted to the configuration and type of turnout, and attached to the turnout rails with clamps (Figure 3 and Figure 4) [1].
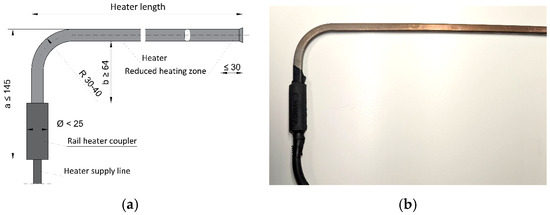
Figure 2.
Dimensions of heating elements installed along the rails (a); photo of a heating element (b).
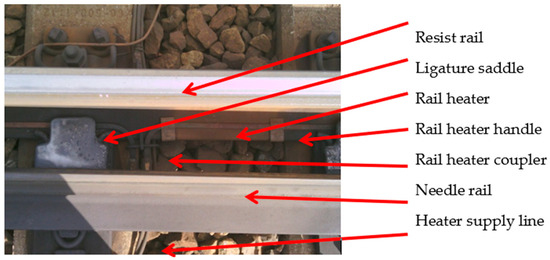
Figure 3.
Heating elements for electric turnout heating are installed in a railway turnout.
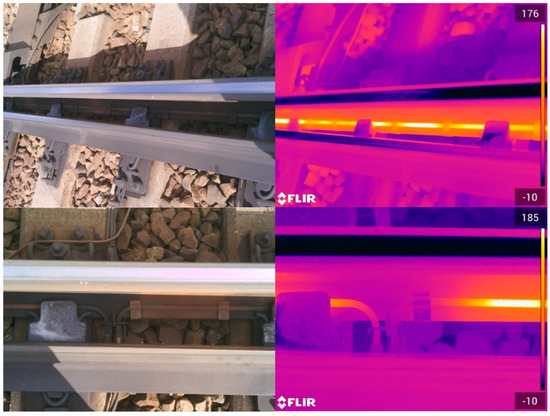
Figure 4.
Resistance heater: on the left are photos of the heater, and on the right are thermograms.
The normative document [31] defines and develops catalogue cards for each type of turnout, containing guidelines for selecting and placing electric turnout heating radiators. Heaters and heating cables of various lengths and powers, as specified in Table 1, are used, adapted to the configuration and type of turnout, and mounted on the turnout rails using brackets. Resistance heaters are flat-oval heaters with a cross-section of 12 mm × 6 mm, in accordance with Iet-118.
Figure 3 shows the heating elements of the electric turnout heating system installed on the foot of a railway turnout rail.
Figure 4 shows the operation of the connected resistance heater as measured by thermal imaging.
The turnout heating system supplies electrical energy from an electric current to heating elements (rails, points, or other mechanisms) along the turnout. The heaters, powered by a transformer, are arranged symmetrically along two rails over a length determined by the type of turnout (Figure 5).
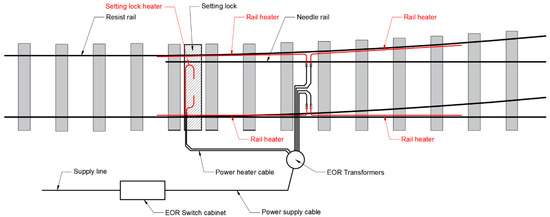
Figure 5.
Arrangement of heating elements at a railway turnout.
The heat generated keeps the turnouts at the right temperature, prevents the closing mechanism from freezing, and melts snow from the space between the rails, ensuring proper adhesion of the rail components. Turnout heating is activated when weather conditions occur, such as low temperatures or snowfall. Electric turnout heating systems are designed to operate only when necessary. Turnout heating is essential for maintaining the safety and regularity of rail traffic in countries with harsh climates, where winter conditions can pose challenges for rail infrastructure. The relevant track maintenance services often monitor electric turnout heating systems to ensure efficient operation, especially during winter.
Technical inspection of electric turnout heating is the process of monitoring and evaluating the railway turnout heating system to ensure its reliability, efficiency, and operational safety. Electric turnout heating systems are essential for maintaining regular rail traffic, so checking their condition and functioning regularly, even in challenging winter conditions, is vital. The inspection may consist of various activities as follows:
- Visual inspection: Inspectors regularly check the condition of the turnout heating system by observing visible components such as rails, points, turnout huts, and electrical cables. Ensuring there is no visible damage, corrosion, or other mechanical problems is essential.
- Technical condition monitoring: Electric turnout heating systems are often equipped with remote monitoring, which allows their condition to be tracked continuously. Inspectors can analyse telemetry data in real time to ensure the system functions correctly.
- Operational tests: Conducting regular operational tests of the turnout heating system, including activating the heating in various weather conditions to ensure the system functions properly.
- Documentation review: Inspectors may also review the technical documentation for the electrical turnout heating system, including electrical diagrams, maintenance plans, and repair and maintenance history.
- Repairs and maintenance: If faults or damage are found during the inspection, inspectors can plan and supervise repairs and maintenance of the electrical turnout heating system to restore it to full working order.
- Staff training: Inspectors may also check whether the staff responsible for operating and maintaining the electric turnout heating system are adequately trained and aware of safety procedures and standards.
Regularly inspecting electric turnout heating is key to ensuring that turnout heating systems operate efficiently and reliably. This contributes to maintaining high reliability, safety, and uninterrupted rail traffic, especially during winter.
According to [36], the technical condition of EOR equipment is an assessment expressing the current technical condition of the equipment in relation to that assumed at the design (manufacturing) stage. It compares current measurable and non-measurable parameters with their limit values or acceptable conditions.
The technical condition of EOR equipment is assessed based on, among other things, the results of measurements, visual inspections, reviews, and repairs.
The technical condition assessment scale includes the following grades: good, satisfactory, unsatisfactory, and inadequate.
- Good condition (db)—equipment with a depreciation period that has not been exceeded, a degree of wear that has not been exceeded, and whose technical condition allows for safe operation.
- Satisfactory condition (sat)—equipment whose depreciation period is ending or has been exceeded, but whose technical condition allows for safe operation.
- Unsatisfactory condition (unsat)—equipment whose depreciation period has ended, is technically functional, but has been classified for modernisation.
- Insufficient condition (ndst)—equipment that must be taken out of service.
Visual inspection of EOR equipment is an ongoing visual assessment of the technical condition of the visible elements of EOR equipment.
2.1. Diagnostic Testing Methodology
Thermography can be used to inspect electrical heating systems for railway points. Thermal imaging is a measurement technique that uses thermal imaging cameras to record infrared radiation emitted by objects and convert it into thermal images that show the temperature distribution on the surface of these objects. Thermal imaging measurements on railways have several applications that help monitor, maintain, and improve the safety of railway infrastructure.
The primary purpose of thermographic inspection tests is to verify the correct functioning of the heating elements of the electrical heating systems for turnouts installed in the track bed.
The components of the electric heating system for turnouts subject to inspection are heating elements of various lengths and power ratings, installed in target configurations required by the applicable documents.
Thermal imaging cameras can monitor and control railway turnout heating systems. Thermal imaging can be used to check whether electric turnout heating systems are working correctly, whether heating is uniform across the entire monitored turnout structure, whether adequate heating power is provided, and whether any areas require additional heating. The measurements allow for quick identification of problems and preventive measures to be taken, improving railway traffic safety and efficiency.
Polish regulations do not specify the basic requirements for the measuring equipment used. Considering the specific nature of the tests, it should be assumed that they comply with the VdS-02859 regulation ‘Mindestanforderungen an geeignete Kamerasysteme (Anhang C)’ [37]. Based on experience and standards analysis, the following minimum requirements for a thermal imaging camera to perform thermal imaging tests of electrical turnout heating systems are proposed in Table 2.
Table 2.
Requirements for a thermal imaging camera.
The following activities are performed as part of a thermal imaging inspection of electric turnout heating systems:
- the geometric arrangement of individual heating elements in the monitored turnout area is identified,
- the overall technical condition of the electric turnout heating elements is assessed,
- the correctness of the mounting of the heating elements is assessed,
- the temperature distribution along individual heating elements located in the monitored area of the turnout is assessed,
- the average temperature value of individual heating elements is determined,
- the temperatures of individual heating elements in the monitored area are compared,
- the time taken to reach the rated operating temperatures on the surface of the monitored heating elements is assessed,
- the effectiveness of the electric turnout heating system is assessed,
- appropriate technical documentation and an inspection sheet are prepared, and an appropriate entry is made in the EOR logbook for electric turnout heating.
Recommendations for conducting inspection measurements in field conditions are as follows:
- Obtain the appropriate approvals and permits to conduct thermal imaging inspections of electric turnout heating systems in railway areas.
- Elements of electric heating should be replaced or repaired with the participation of authorised energy personnel [in accordance with Id-4: Instructions for Visual Inspection, Technical Testing and Maintenance of Turnouts] [27].
- Thermal imaging inspections shall be carried out by specially trained personnel with appropriate knowledge of the functioning of the EOR system and authorisation to perform thermal imaging tests and electrical tests in the field of supervision and operation.
- Visual and track inspections shall be carried out in accordance with the safety requirements for this type of track work.
- The inspection scope, consisting of a visual inspection and a thermal imaging test, shall be agreed upon with the operator (applicant, infrastructure manager) and the personnel performing the test before the measurements are taken. It shall be included in the inspection report.
- Inspection measurements and thermal imaging inspections should be carried out during daylight hours under defined weather conditions recommended for thermal imaging measurements.
- Tests carried out during inspections should be performed at the rated power of the electrical heating system for turnouts and under quasi-stationary measurement conditions.
- The impact of environmental and weather conditions (humidity, atmospheric temperature, precipitation, wind speed, cloud cover, etc., that significantly affect the measurement results) should be documented.
- Due to the possibility of significant changes in atmospheric conditions, it is recommended that thermal imaging measurements for turnouts be carried out efficiently and without undue delay.
- Due to the significant impact of wind on the heating process of turnout zones observed for different geolocations, it is recommended that inspection measurements be performed in windless weather.
- To assess and define the initial temperature conditions, thermal imaging measurements of the electrical heating system of turnouts should be performed before its start-up, in the so-called cold state.
- The atmospheric temperature near the assessed element should be recorded for the monitored turnout area under operating conditions.
- The process and heating status of individual heating elements of the turnout should be recorded after the temperature of the heating elements has stabilised or after the snow or ice has melted, allowing direct observation of the heating surfaces.
- The surface temperature for each heating element shall be recorded in a steady state, heated, at least 30 min after the system has been started.
- The surfaces of the heaters and the monitored surfaces of the turnout may have significantly different emission parameters, resulting, among other things, from their material properties and operation in difficult and varied environmental conditions. A standardised emissivity coefficient of at least 0.9 may be used for inspection tests. If the emissivity coefficient of the tested material is unknown, it is recommended to use the value of 0.95 defined for the automatic camera mode.
- When determining the image composition, the entire area of the turnout should be covered by thermal imaging, setting the camera in such a way that each heater can be analysed separately (and, if required, also for the entire working area of the heated turnout), bearing in mind the need to assess its continuity and uniformity of temperature distribution along its entire length.
- The results should be archived and compiled according to the template for thermal imaging inspection test reports.
- Thermal imaging measurements should be carried out at least as often as specified in the operating instructions for the electrical turnout heating device. If no date is specified, measurements shall be carried out at least once a year, before the autumn–winter period.
- Due to the need to observe the heating surface of the heated monitored area, measurements should be carried out in conditions without snow or ice in the monitored area.
- In the case of detailed inspections, the components, subassemblies, and EOR heaters to be inspected should be viewed from as close a distance as possible and from the best possible observation point. As in the case of electrical measurements, the DIN EN 50110-1 (VOE 0105-1) standard applies to safe distances [38]. DIN EN 16714-1 [28] and DIN EN 16714-2 [29] standards must be observed for camera adjustments.
- During measurements, pay attention to possible anomalies in false readings caused by reflections and/or differences in emissivity. Incorrect measurements caused by reflections can be detected and eliminated by adjusting the image composition, camera settings, changing the camera’s position, and/or the angle of observation of the heating elements.
- Each thermal anomaly should be photographed simultaneously with the thermogram.
- Document the condition and basic operating parameters of the installation (e.g., set power value, rated power value, current consumption, operating time) during the thermal imaging measurement.
Before proceeding with inspection measurements, the power ratings of individual heating elements (heaters and heating elements) installed in the turnout must be identified based on technical documentation and the electrical turnout heating catalogue card [31]. An example of an EOR card is shown in Figure 6.
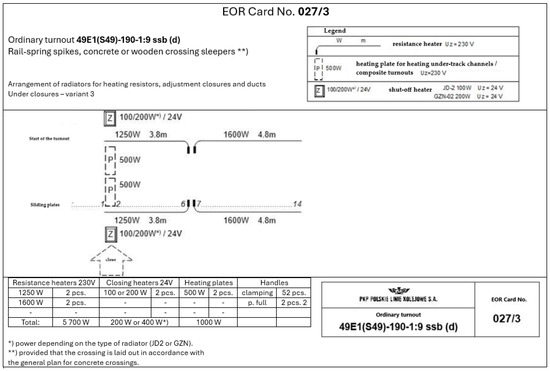
Figure 6.
Sample of an EOR catalogue card [31].
General inspection covers the entire monitored turnout area on a single thermogram displaying all installed heaters. Inspection measurements of electric turnout heating using a thermal imaging camera are carried out using the accepted image composition and camera settings corresponding to the geometry shown in Figure 7.
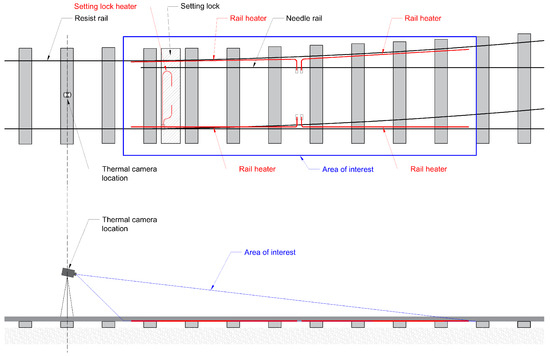
Figure 7.
Positioning of a thermal imaging camera in the track bed for general inspection.
Next, detailed measurements are taken of individual areas and sections of the electric heating elements of the turnouts in the geometry shown in Figure 8. The number of measurement areas depends on the number and length of the heating elements used and the camera’s measurement field. The measurement should be carried out so that the measurement fields overlap.
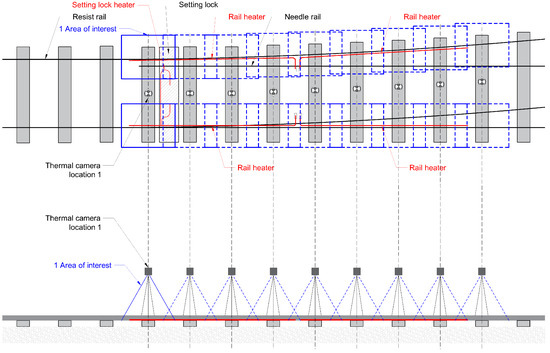
Figure 8.
Positioning of a thermal imaging camera on the track for detailed inspection with marked measurement fields B.
2.2. Thermal Camera Calibration
This study’s FLIR SC660 and T1020 cameras underwent factory calibration following FLIR’s precision calibration procedures. The calibration process includes three critical stages as follows [39]:
- 1.
- Image Uniformity Calibration: Ensuring all pixels across the camera’s imager respond consistently to infrared energy.
- 2.
- Temperature Point Correlation: Correlating incoming energy with known temperature points using calibrated blackbody references in controlled laboratory conditions.
- 3.
- Ambient Temperature Compensation: Measuring camera and optical path temperatures at multiple locations to ensure accurate readings across the entire operating temperature range (−15 °C to +50 °C).
Temperature Measurement Uncertainty are as follows:
- Measurement accuracy: ±2% or ±2 K (whichever is greater) [40].
- Thermal sensitivity (NETD): <0.08 K at 30 °C for both camera models.
- Calibration certificates were obtained for both cameras with traceability to international standards.
Additional uncertainty factors considered are as follows:
- Emissivity variations: ±0.05 (using standardised value of 0.9–0.95 for steel surfaces).
- Atmospheric attenuation: Negligible for distances < 5 m in dry conditions.
- Reflected radiation: Compensated through background temperature settings.
The combined measurement uncertainty for the temperature range of interest (0–200 °C) is estimated at ±3 °C or ±2.5% of the reading, whichever is greater. Environmental variables significantly affecting thermographic measurements were systematically controlled and documented, according to Table 3.
Table 3.
Requirements for environmental condition control and monitoring.
Thermal Image Acquisition Methodology are as follows:
- General coverage images: 3–5 wide-angle thermograms per turnout covering the heated area.
- Detailed section analysis: 8–12 focused thermograms per turnout, with overlapping measurement fields.
- Total images per measurement session: 15–20 thermal images per turnout, plus corresponding visible light photographs.
- Temporal sequence: Images captured at 0 s (cold state), 5 min, 15 min, 30 min, 1 h, and 3 h intervals during heating cycles.
Representative sections for detailed analysis were selected based on the following:
- Critical heating zones: Switch blade contact areas, closure panels, and frog regions.
- Heater element distribution: Each heating element type (900 W, 1050 W, 1250 W, and 1600 W) was individually analysed.
- Thermal uniformity assessment: Sections showing the most significant temperature variations.
- Comparative analysis: Identical geometric sections between EOR and ESAR systems for direct comparison.
- Measurement field overlap: Minimum 20% overlap between adjacent measurement areas to ensure continuity.
2.3. Calculation of Energy Indicators
- 1.
- Energy efficiency indicators are employed to compare technical solutions and estimate the electrical energy demand of the electric turnout heating system.
- 2.
- For the purpose of comparing and monitoring the energy performance characteristics of the electric turnout heating system, the following indicators are utilised:
- active power supplied to the heating installation [W],
- linear power density index [W/m],
- temperature power index [W·°C−1·m−1], and
- energy consumption index [Wh/m].
- The values and indicators for each turnout are presented collectively.
- 3.
- The calculation of the energy indicators relies on the following input parameters:
- Heating installation power [W]—power supplied to the heating elements associated with the heated surface of the turnout (either aggregated or separated by specific areas) and required for the operation of the applied heating system; power calculations consider dissipated in heating cables and plates, auxiliary devices, heating control components, etc.
- Length of heating cables [m]—total length of the heating installation, understood as the sum of lengths of individual heating elements or their segments.
- Average temperature parameter [°C] for the analysed heating element.
- Operating time parameter of the heating cable [h].
- 4.
- The active power [W] related to turnout heating is determined for the system according to Equation (1):where—active power of the -th heating cable [W], and—active power of auxiliary devices in the heating installation [W].
- 5.
- The linear power density [W/m] is calculated for the entire turnout by considering the total active power supplied to linear heating elements and the total length of heating cables , as expressed in Equation (2):where—total active power supplied to the turnout heating elements [W], and—total length of heating cables [m].
- 6.
- The temperature power index [W·°C−1·m−1] for the turnout is computed based on the temperatures of individual linear heating cables according to Equation (3):where—total active power supplied to the turnout heating elements [W],—average temperature of the -th linear heating cable [°C], established via thermographic imaging, and—length of the -th linear heating cable [m].
- 7.
- The energy consumption index [Wh/m] associated with the heating cables’ operating cycle is calculated using Equation (4):where—active power supplied to the -th heating cable [W],—operating time of the -th heating cable [h], and—total length of heating cables [m].
- 8.
- The index is determined using actual operating times of the heating cables on an annual basis, considering the entire heating period (e.g., from June to June).
- 9.
- The percentage reduction coefficient of heating power for electric turnout heating installations is calculated as follows:where—active power supplied to turnout heating elements after reduction application [W] (e.g., power provided to the ESAR system), and—active power supplied to turnout heating elements before reduction application [W] (e.g., power provided to the reference EOR system).
2.4. Research Objects
Gdańsk Osowa railway station, a junction station in the Pomeranian Voivodeship, serves as a convergence point for four railway lines numbered 201, 235, 248, and 253. Line 201, on which Gdańsk Osowa station is situated, constitutes the northern segment of the interwar Coal Main Line. This line historically connected Silesia with the port in Gdynia and is currently a double-track railway linking Nowa Wieś Wielka with the Gdynia Port freight station. The line accommodates passenger traffic (trains operating between Gdynia Główna and Kościerzyna) and freight operations. The single-track line 235 between Kokoszki and Gdańsk Osowa exclusively serves freight traffic.
Line 248, connecting Gdańsk Wrzeszcz and Gdańsk Osowa, is a passenger railway line (Pomeranian Metropolitan Railway). Additionally, the single-track line 253 between Gdańsk Osowa and Gdańsk Rębiechowo enables trains from line 248 to proceed towards Kartuzy and Kościerzyna without the necessity of reversing direction at Gdańsk Osowa station.
The maximum speed limit for passenger trains passing the station is 120 km/h. During one measurement session at Gdańsk Osowa station, one type of standard turnout was examined:
- standard turnout no. 11 and 12 (Rz-60E1–1:12–500). The turnout, located in the southern part of the station turnout head, connecting track no. 3a and the guard rail, are depicted in Figure 9 and Figure 10.
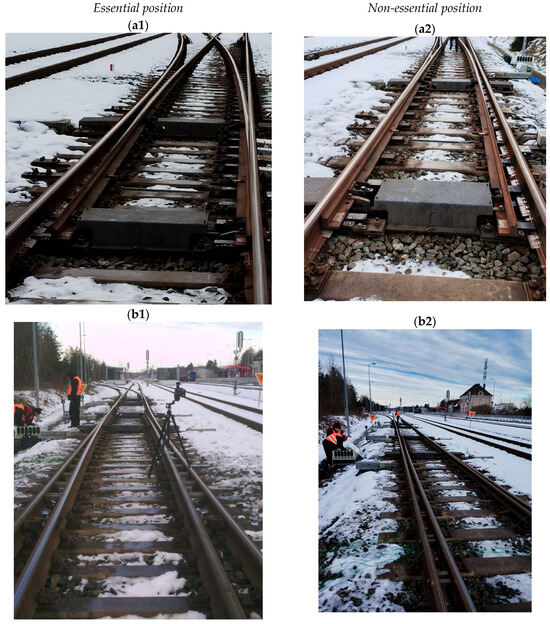 Figure 9. View of turnout no. 11 from the beginning (a1,a2) and end (b1,b2) of the turnout.
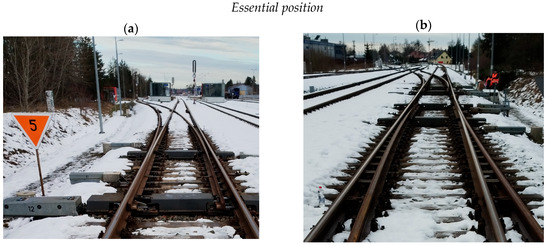 Figure 10. View of turnout No. 12 from the beginning (a) and end (b) of the turnout.
3. Results
Within the scope of field testing, thermographic examinations and, in select cases, measurements utilising thermoelectric sensors were conducted on various types of standard turnouts employed in the PKP PLK S.A. railway network. The study encompassed turnouts constructed from 49E1 and 60E1 rail profiles. The investigation focused on the most commonly used turnout types in track layouts, specifically as follows:
- Rz-49E1–1:9–190,
- Rz-60E1–1:9–190,
- Rz-60E1–1:9–300,
- Rz-60E1–1:12–500, and
- Rz-60E1–1:18.5–1200.
Meteorological data for weather-related measurements were sourced from reports issued by the Institute of Meteorology and Water Management—National Research Institute (IMGW-PIB) corresponding to the locations where measurements occurred.
Thermographic assessments were performed at two test sites: Gdańsk Osowa and Międzylesie (near Kłodzko) railway stations. The first measurement session occurred at Gdańsk Osowa station between 15 January 2025 and 17 January 2025. The second session was conducted at Międzylesie station from 11 to 14 February 2025. All measurement sessions during this period involved the following turnouts and types:
- Gdańsk Osowa—turnouts no. 11 and 12—Rz-60E1–1:12–500,
- Międzylesie—turnout no. 38—Rz-60E1–1:9–300,
- Międzylesie—turnout no. 39—Rz-60E1–1:9–300,
- Międzylesie—turnout no. 201—Rz-49E1–1:9–190, and
- Międzylesie—turnout no. 35—Rkpd-60E1–1:9–300
The selection of research test sites was primarily based on the presence of the required turnout types at the stations and favourable weather conditions, notably low air temperatures and snowfall. The article presents detailed results of measurements conducted on a reference turnout equipped with a traditional EOR turnout 12 and on turnout 11 fitted with the ESAR system. All measurements took place on the same day under comparable temperature conditions.
Thermographic examinations were performed on the aforementioned turnout types, incorporating the newly developed ESAR system, which is founded on the following principles:
- snow-free and snow-covered turnout areas, evaluated across three zones in both (+) and (−) positions; and
- heating intervals from the initiation of the heating process.
Results of Thermographic Measurements
Thermographic measurements were conducted using the following equipment:
- Measurement cycles: Gdańsk Osowa (15–17 January 2025) and Międzylesie (11–14 February 2025)—FLIR SC660 and FLIR T1020 cameras.
The thermal imaging results are summarised in Table 4 and Table 5. These investigations considered several turnout design aspects, they are as follows:
Table 4.
Summary of results for the tested Rz 60E1-1:12–500 turnout—turnout no. 11—switch blade position (half-turn with switch blade moved away or moved closer).
Table 5.
Summary of results for the tested Rz 60E1-1:12–500 turnout—turnout no. 12—switch blade position (half-turn—switch with switch blade moved away or moved closer).
- needle position (partly switched turnout with needle retracted or extended),
- variable distances between the needle and the stock rail for the partly switched turnout with retracted needle,
- variable cross-section and mass distribution of the needle along its length,
- different rail types of the turnout and consequently varied heat capacity (49E1, 60E1), and
- heating intervals from the start of heating for t = 0 s, 300 s, 10 min, 30 min, 1 h, and 3 h until temperature stabilisation.
For easier visual evaluation of the EOR system’s performance, Table 4 and Table 5 present thermograms of turnouts in cold and heated states, considering the needle position (partly switched turnout with needle retracted or extended). Comparative tests were also performed for a turnout equipped with the ESAR system and a reference turnout covered with snow.
Figure 11 and Figure 12 show the fundamental temperature values obtained from thermograms of the tested turnouts at the test sites in Gdańsk Ossowa and Międzylesie.
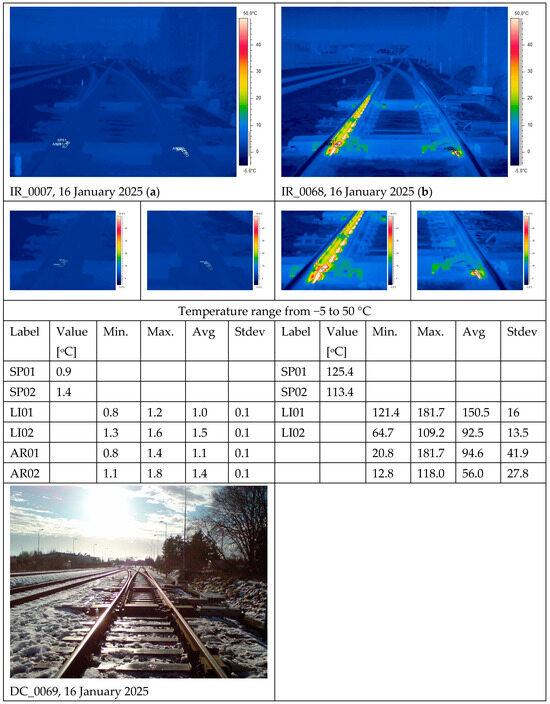
Figure 11.
Thermograms showing sections of the track system with visible track heaters of the electric turnout heating system: (a) cold state and (b) heated state for turnout Rz-60E1-500-1:12 and turnout no. 11 with radiation covers installed for the ESAR system. Note: the symbols in the tables are as follows: SP—point, LI—line, and AR—measurement area.
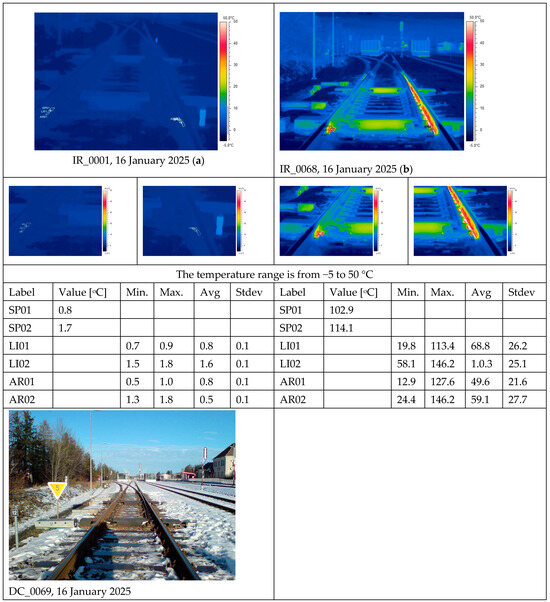
Figure 12.
Thermograms showing sections of the track system with visible track heaters of the electric turnout heating system: (a) cold state and (b) heated state for turnout Rz-60E1-500-1:12, turnout no. 12. Note: the symbols in the tables are as follows: SP—point, LI—line, and AR—measurement area.
Based on the results of thermal imaging, thermoelectric, and electrical measurements carried out in field conditions of EOR and ESAR installations, energy and environmental indicators were determined for individual turnouts under investigation. The calculations took into account the current emission factors (Table 6).
Table 6.
Emission factors for end users of electricity [41].
The analyses were performed for turnouts no. 11, 12, 35, 38, 39, and 201. For all turnouts examined, the power dissipated on the heating elements was determined based on the control method used and the length of the heating elements. The results of the basic calculations for the Wp, WT, and WE indices are summarised in Table 7.
Table 7.
Calculated energy indicators for the railway turnouts examined.
To calculate energy efficiency indicators, turnouts no. 11 and 12 located at the Gdańsk Osowa station, identical in terms of type, track layout, and power of installed heating elements (heating power and length of heating elements), were compared (Figure 13). The target ESAR system was installed on turnout no. 11, whose linear heating elements were equipped with radiation covers. The results of the calculations were compared with the reference turnout no. 12, which uses a standard EOR system.
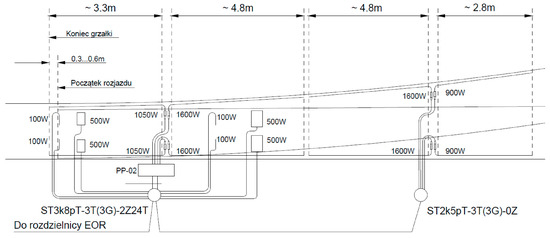
Figure 13.
Sketch of the layout of heaters along turnouts no. 11 and 12.
Turnout no. 12 operates at the nominal power of the heating elements installed in the EOR system; 100% power was supplied to each heater (Table 8). At turnout 11, individual power control was used for each heater (Table 9). A constant operating time of 200 h/year was assumed for further calculations.
Table 8.
Parameters of reference turnout Rz 60E1-1:12–500—no. 12 with standard EOR system (Gdańsk Osowa).
Table 9.
Parameters of turnout Rz 60E1-1:12–500—no. 11 equipped with the target ESAR system and radiation overlays (Gdańsk Osowa).
The results of calculations for turnouts 11 and 12 are summarised in Table 10.
Table 10.
Comparison of parameters and indicators calculated for turnouts Rz 60E1-1:12–500—no. 12 (EOR) and Rz 60E1-1:12–500—no. 11 (ESAR).
As the manufacturer declared, the linear power distribution coefficient of linear heaters is 330 W/m. For turnout no. 12 equipped with the EOR system, the linear power coefficient reached a value close to the manufacturer’s data, amounting to 328 W/m (reference value) (Table 10). By implementing control systems in the ESAR system on turnout 11, it is possible to reduce the power individually dissipated in heating elements. In the analysed case, the linear heating elements achieved a value of 208.6 W/m.
By reducing the power supplied to the heating elements on turnout no. 11 equipped with the ESAR system by nearly 30%, power consumption was lowered by 3750 W (compared to the EOR system), which, for 200 operating hours, translates to an annual electrical energy savings of approximately 750 kWh (Table 11).
Table 11.
Summary of savings for turnouts Rz 60E1-1:12–500—no. 12 (EOR) and Rz 60E1-1:12–500—no. 11 (ESAR).
Reducing the power supplied to the heating elements decreased the temperature of the heating elements (Table 10). The temperature index and energy consumption index were reduced. The reduction in the temperature of the linear heating elements was due to two reasons: the power supplied to the linear heating elements was reduced, and radiation covers were used to cool the surfaces of the linear heaters effectively.
Based on the data obtained, a 30% reduction in the power consumption of the ESAR system compared to the EOR system was documented. To determine the potential environmental savings and compare the EOR and ESAR control systems, appropriate calculations were performed using the data from Table 6, Table 10, and Table 11. The ecological indicators are presented in Table 12.
Table 12.
Environmental indicators for turnouts Rz 60E1-1:12–500—no. 12 (EOR) and Rz 60E1-1:12–500—no. 11 (ESAR).
A significant reduction in harmful environmental emissions, caused by a decrease in electricity consumption for heating purposes, justifies the use of the ESAR system. Using the ESAR system has allowed for a proportional 30% reduction in harmful compounds emitted into the environment (Table 11). The calculations assume an identical annual operating time of the heating system of 200 h. It should be noted that there is significant potential for reducing the operating time of the ESAR heating system in winter due to the use of control and measurement elements that monitor the temperature, humidity, and snowfall parameters in the vicinity of the turnout. These local factors determine the need to activate the heating system and select the heating power of individual heaters to meet the actual needs while minimising the annual maintenance costs of the ESAR system. Therefore, the target operating time of 200 h may be further reduced.
4. Discussion and Conclusions
Electric resistance heating remains the primary method for maintaining the reliability of railway turnouts in Europe, especially in regions with harsh winter conditions. Numerous studies confirm that these systems prevent ice and snow accumulation, ensuring safe and regular railway traffic [42,43]. The results indicate high energy consumption associated with traditional resistance heating systems, a significant problem in rising electricity prices. Therefore, reducing the WP, WT, and WE indices is an important aspect, as emphasised by research on energy efficiency and cost optimisation [24,44]. Studies comparing traditional resistance heaters with innovative non-contact heating methods (such as induction or conductive heating) show that alternative technologies can significantly reduce energy consumption [7,42,45].
Examples are as follows:
- Non-contact heaters can reduce the time required to reach the melting point and lower overall energy consumption compared to conventional systems [7].
- Numerical and experimental analyses confirm that optimising the design and installation of heaters, including thermal insulation and heat distribution, can further increase efficiency [9,42,45].
- Adaptive heating power control can significantly reduce energy consumption and operating costs without compromising safety and reliability [7,10,46]. Adaptive control strategies that adjust heating power based on real-time environmental and operational data have shown promising results in reducing energy consumption. Experimental studies indicate that such systems can reduce energy consumption by 15–20% over the entire winter compared to conventional on/off methods [7,10]. Adaptive systems also allow for removing contact temperature sensors, improving system reliability, and reducing maintenance requirements [7].
Thermographic inspection is a tool for assessing the condition and performance of electric turnout heating systems, enabling early fault detection and supporting condition-based maintenance [47,48,49,50]. As a non-invasive technique, it allows rapid diagnosis of the operational condition of electric turnout heating (ETH) systems. Regular, standardised inspections and data-based maintenance are essential for optimising safety, reliability, and cost-effectiveness of railway turnouts [44,47,51]. Studies show that thermal imaging enables the following:
- Early detection of faults such as uneven heating or damaged components [44,51].
- Optimise maintenance schedules based on condition rather than fixed time intervals [44,51].
- Verification of installation quality and repair effectiveness [51].
- Identification of excessive heat loss or insufficient heating, leading to targeted interventions [24].
Although turnouts account for only a small fraction of total railway infrastructure investment, they have a disproportionately high share of maintenance costs due to their complexity and critical operational importance [1]. Scientific analyses of life cycle costs emphasise the importance of condition-based maintenance and targeted interventions, which are facilitated by thermographic diagnostics and advanced monitoring systems [1,44,52]. Despite advances in diagnostics and energy consumption optimisation, several challenges remain:
- Standardisation of thermographic inspection protocols and equipment requirements [51].
- Integrating thermographic data with other diagnostic and monitoring systems, including a machine learning approach to automatic fault detection [44].
- Further research on the long-term impact of adaptive and alternative heating systems and the development of predictive maintenance algorithms [7,44,52].
The primary objective of conducting thermographic inspection testing is to verify the proper functioning of the heating elements of electric turnout heating systems installed in the track. Regular operational tests of turnout heating systems are recommended. This task includes activating the heating under various weather conditions to ensure the system operates correctly. Due to the significant influence of wind on the heating process, inspection measurements should preferably be conducted under calm weather conditions.
A comparative analysis of the electric turnout heating installations of turnouts no. 11 and no. 12 at the Gdańsk Osowa station revealed notable differences in energy efficiency and environmental impact from the heating systems used. Turnout no. 11, equipped with the target ESAR system—featuring individual heater power control and radiation covers—demonstrates a significant reduction in the power supplied to the heating elements compared to turnout No. 12, which operates with the standard EOR system. Specifically, the power output of the linear heaters in turnout no. 11 was reduced by approximately 30% (from 10,300 W to 6550 W), contributing to an annual reduction in electricity consumption of 750 kWh, i.e., over 29% compared to the reference installation.
The power reduction also resulted in lower average surface temperatures of heaters and radiators, indicating effective heat distribution due to the radiation covers. Analysis of energy consumption (WE) and temperature (WT) indicators confirmed improved efficiency of the ESAR system, which allows for better alignment of heating power with actual heating requirements. This limits energy losses and reduces emissions of harmful substances into the environment. Reduced energy use by the ESAR system led to a significant decrease in CO2 emissions (by 447.75 kg/year) and other pollutants (SOx, NOx, CO, and total particulate matter) by approximately 30%, highlighting the environmental benefits of the advanced control system.
In conclusion, the implementation of the ESAR system on turnout no. 11 constitutes an energy-efficient and environmentally friendly solution which, through individual heater power control and optimised heat distribution, delivers substantial energy savings and a reduced environmental footprint compared to the traditional EOR system used on turnout no. 12. Further optimisations and reduced operating time of the ESAR installation may yield additional economic and environmental benefits.
The thermographic methodology for inspecting railway switch heating systems is characterised by its applicability to diverse climatic conditions. However, it requires calibration for local climatic conditions. Additionally, seasonal temperature ranges and typical operating periods of switch heating systems must be considered. This will enable economic assessment of the implementation of the solution concerning local energy costs and operational intensity. Conventional methods for inspecting railway switch heating systems primarily detect only visual defects, require 2–4 h per switch for inspection, and necessitate system downtime for electrical testing, posing high safety risks due to direct contact with powered equipment. Quantitative data are limited to basic electrical measurements, and documentation relies on manual logs. In contrast, the proposed thermographic method improves defect detection by identifying temperature differences as small as ±2 °C, enabling early identification of developing defects. It significantly reduces inspection time to 30–60 min per turnout—a 60–75% time saving—operates without system shutdown (thus causing zero operational disruption), and involves minimal safety risks as inspections are conducted remotely. Moreover, thermography offers comprehensive thermal mapping and characterisation, enabling predictive maintenance through thermal trend analysis. Documentation with automated data archiving is digital, significantly enhancing data management and reliability. This represents a significant advancement over conventional inspection approaches.
Future research should continue to integrate advanced monitoring technologies, predictive analytics, and alternative heating methods to improve the sustainability and efficiency of railway infrastructure [2,7]. The proposed thermographic methodology aligns with the digitalisation trends of railway infrastructure under the Industry 4.0 concept [53]. However, this requires integrating thermal imaging cameras with IoT-enabled temperature sensors for continuous monitoring [54] and may be the subject of further research. In subsequent studies, the inspection should be extended to include data analysis using machine learning algorithms correlating thermal patterns with maintenance needs, potentially reducing inspection intervals by 30–40% [44,53].
The article presents a part of a project related to shortening the heating zone and limiting the installed power of EOR devices. The proposed work fulfils paragraph 2.1b of Resolution No. 380/2019 of the Management Board of PKP Polskie Linie Kolejowe S.A. of 11 June 2019 concerning the ‘Plan for the adaptation of railway infrastructure to climate change’ as well as the Energy Efficiency Improvement Programme adopted by the Company’s Management Board in 2014. Increasing the energy efficiency of electric turnout heating equipment will also contribute to building a positive image of the Company regarding care for the natural environment, among other things, by reducing CO2 emissions. The expected results are to increase energy efficiency, mainly by proposing technical/organisational solutions to reduce electricity consumption for the operation of electric turnout heating devices.
Author Contributions
Conceptualisation, J.K., K.S., P.T. and P.J.; methodology, J.K., K.S., P.T. and P.J.; software, J.K., K.S. and P.T.; validation, J.K., K.S., P.T. and P.J.; formal analysis, J.K., K.S. and P.T.; investigation, J.K., K.S., P.T. and P.J.; resources, J.K., K.S., P.T. and P.J.; data curation, J.K. and K.S.; writing—original draft preparation, J.K., K.S., P.T. and P.J.; writing—review and editing, J.K., K.S., P.T. and P.J.; visualisation, J.K., K.S. and P.T.; supervision, J.K., K.S., P.T. and P.J.; project administration, J.K. and K.S.; funding acquisition, J.K. and K.S. All authors have read and agreed to the published version of the manuscript.
Funding
This research was funded by the project BRIK-II/0036/2022—(Energy-efficient Electric Turnout Heating System with Adaptive Heating Power Distribution).
Institutional Review Board Statement
Not applicable.
Informed Consent Statement
Not applicable.
Data Availability Statement
The original contributions presented in this study are included in the article. Further inquiries can be directed to the corresponding author.
Acknowledgments
This work was supported by project BRIK-II/0036/2022—(Energy-efficient Electric Turnout Heating System with Adaptive Heating Power Distribution) and joint undertaking with NCBIR-PLK S.A., consisting of supporting scientific research and development work in the area of railway infrastructure, called Research and Development in Railway Infrastructure BRIK II.
Conflicts of Interest
The authors declare no conflicts of interest.
References
- Brodowski, D.; Flis, M. Experimental Verification of Contactless Heating Method in Railway Turnouts Heating System. Probl. Kolejnictwa-Railw. Rep. 2022, 66, 73–79. [Google Scholar] [CrossRef]
- Wołoszyn, M. Analysis of Resistive and Inductive Heating of Railway Turnouts. Prz. Elektrotech. 2016, 1, 54–57. [Google Scholar] [CrossRef][Green Version]
- Toletti, A.; Weidmann, U. Mitigating the Impacts of Unreliable Railway Components on Service Availability and Punctuality. In Safety and Reliability of Complex Engineered Systems, Proceedings of the 25th European Safety and Reliability Conference, ESREL 2015, Zürich, Switzerland, 7–10 September 2015; CRC Press: Boca Raton, FL, USA, 2015; Volume 7–10, pp. 2307–2314. [Google Scholar] [CrossRef]
- Luan, X.; Wang, Y.; Schutter, B.D.; Meng, L.; Lodewijks, G.; Corman, F. Integration of Real-Time Traffic Management and Train Control for Rail Networks—Part 1: Optimization Problems and Solution Approaches. Transp. Res. Part B Methodol. 2018, 115, 41–71. [Google Scholar] [CrossRef]
- Oh, H.; Park, C.-B.; Lee, S.H.; Lee, H. Study on 200w-Class Heating System of Induction Heating Type to Melt Snow in Railway Turnout. J. Korean Soc. Railw. 2019, 22, 762–767. [Google Scholar] [CrossRef]
- Heger, J. Inductive Railway Turnout Heating Systems—A Review of Scientific Publications. In Proceedings of the 8th International Conference on Road and Rail Infrastructure, Cavtat, Croatia, 15–17 May 2024; Volume 8, pp. 533–541. [Google Scholar] [CrossRef]
- Szychta, E.; Szychta, L. Comparative Analysis of Effectiveness of Resistance and Induction Turnout Heating. Energies 2020, 13, 5262. [Google Scholar] [CrossRef]
- Rajabighamchi, F.; Hajlou, E.M.H.; Hassannayebi, E. A Multi-Objective Optimization Model for Robust Skip-Stop Scheduling With Earliness and Tardiness Penalties. Urban Rail Transit 2019, 5, 172–185. [Google Scholar] [CrossRef]
- Lotfi, A.; Yousuf, A.; Virk, M.S. Study of Heat Distribution in Railway Switch Using Resistive Heater in Cold Climate Conditions. Appl. Sci. 2024, 14, 8151. [Google Scholar] [CrossRef]
- Żelazny, R.; Jabłoński, P.; Szczegielniak, T. Operation of the Prototype Device for Induction Heating of Railway Turnouts at Various Operating Frequencies. Energies 2021, 14, 476. [Google Scholar] [CrossRef]
- Oh, H.; Kim, D.-K.; Hong, S.-M.; Ryu, S.-G.; Park, C.-B.; Lee, J.; Lee, J.; Lee, H.-W. Anti-Icing System on Railway Turnouts Using Induction Heating Technology for Energy Saving. In Proceedings of the 2022 IEEE 21st Mediterranean Electrotechnical Conference (MELECON), Palermo, Italy, 14–16 June 2022; pp. 342–347. [Google Scholar] [CrossRef]
- Paś, J. Diagnostic of railway turnouts condition on high-speed railway lines. J. Civ. Eng. Transp. 2025, 3, 23–32. [Google Scholar]
- Reetz, F.; Zimmermann, J.; Meier, A. Trackside Monitoring of Railway Turnouts with Accelerometers for Condition-Based Maintenance. Sensors 2024, 24, 477. [Google Scholar] [CrossRef]
- Ou, D.; Ji, Y.; Zhang, L.; Liu, H. An Online Classification Method for Fault Diagnosis of Railway Turnouts. Sensors 2020, 20, 4627. [Google Scholar] [CrossRef]
- Alfieri, F.; Bracco, S.; Delfino, F.; Pampararo, F. Energy management strategies for railway infrastructure. Energies 2018, 11, 3456. [Google Scholar] [CrossRef]
- Sysyn, M.; Gerber, U.; Nabochenko, O. Life cycle cost analysis of railway turnouts. In Proceedings of the International Symposium on Rail Infrastructure Systems Engineering, Aachen, Germany, 26–28 November 2019. [Google Scholar]
- Wu, X.; Li, W. Sound signal-based lightweight fault diagnosis for railway turnout system via combining transformer and CNN. Eng. Res. Express 2025, 7, 25225. [Google Scholar] [CrossRef]
- Chen, C.; Shao, H.; Xu, Z.; Huang, K.; Chen, Q.; Mei, M. A Fault Detection Method for Railway Turnout with Convex Hull-based One-Class Tensor Machine. In Proceedings of the IEEE Instrumentation and Measurement Technology Conference, Kuala Lumpur, Malaysia, 22–25 May 2023. [Google Scholar] [CrossRef]
- Yu, C.; Lu, Z. YOLO-VSI: An Improved YOLOv8 Model for Detecting Railway Turnouts Defects in Complex Environments. Comput. Mater. Contin. 2024, 81, 3261–3280. [Google Scholar] [CrossRef]
- Adke, P.; Kushwaha, A.K.; Khatavkar, S.M.; Shende, D. Use of Improved Generative Adversarial Network (GAN) Under Insufficient Data. In Cognitive Computing and Cyber Physical Systems, Proceedings of the 4th EAI International Conference, IC4S 2023, Bhimavaram, India, 4–6 August 2023; Springer: Cham, Switzerland, 2024; Volume 536, pp. 288–299. [Google Scholar] [CrossRef]
- Wang, G.; Xu, T.; Tang, T.; Yuan, T.; Wang, H. A Bayesian network model for prediction of weather-related failures in railway turnout systems. Expert Syst. Appl. 2017, 69, 247–256. [Google Scholar] [CrossRef]
- Wang, G.; Xu, T.; Wang, H.; Zou, Y. AdaBoost and Least Square Based Failure Prediction of Railway Turnouts. In Proceedings of the 2016 9th International Symposium on Computational Intelligence and Design (ISCID), Hangzhou, China, 10–11 December 2016; Volume 1, pp. 434–437. [Google Scholar] [CrossRef]
- Ma, Y.; Yuan, J.; Ni, J. A strategy for the sensor placement optimization for machine thermal errr compensation. In Proceedings of the ASME International Mechanical Engineering Congress and Exposition, Proceedings (IMECE), Nashville, TN, USA, 14–19 November 1999; pp. 629–637. [Google Scholar] [CrossRef]
- Stypułkowski, Ł.; Żelazny, B. Thermal Imaging for Railway Turnout Heating Systems Diagnostics. Arch. Transp. 2021, 58, 45–58. [Google Scholar]
- Barkhordari, P.; Galeazzi, R.; Tejada, A.d.M.; Santos, I.F. Identification of Behavioural Models for Railway Turnouts Monitoring. arXiv 2019, arXiv:1910.06582. [Google Scholar] [CrossRef]
- Kisilowski, J.; Kowalik, R. Railroad Turnout Wear Diagnostics. Sensors 2021, 21, 6697. [Google Scholar] [CrossRef]
- Du, J.; King, P.; Gardiner, A.; Li, J.-P. Railway Electric Points Heating: From Design to Maintenance; Polish Railways: Warsaw, Poland, 2024; 51p. [Google Scholar]
- PKP Polskie Linie Kolejowe S.A. Raport Roczny 2023; PKP Polskie Linie Kolejowe S.A.: Warsaw, Poland, 2024. [Google Scholar]
- Energooszczędny System Elektrycznego Ogrzewania Rozjazdów z Adaptacyjną Dystrybucją Mocy Grzewczej. Available online: https://arex.pl/energooszczedny-system-elektrycznego-ogrzewania-rozjazdow-z-adaptacyjna-dystrybucja-mocy-grzewczej/ (accessed on 28 October 2025).
- Kim, J.-C.; Ji, W.-Y.; Park, C.-B.; Lee, J.-B.; Jeong, G.; Lee, H.-W. Design considering the impedance of induction heating system for 200W-class railway turnout. J. Korean Soc. Railw. 2020, 23, 1124–1132. [Google Scholar] [CrossRef]
- PKP Polskie Linie Kolejowe S.A. Wytyczne Projektowania Urządzeń Elektrycznego Ogrzewania Rozjazdów Iet-5; PKP Polskie Linie Kolejowe S.A.: Warsaw, Poland, 2015. [Google Scholar]
- PKP Polskie Linie Kolejowe S.A. Iet-118 Dokument Normatywny 01-8/ET/2008. Grzejniki Elektrycznego Ogrzewania Rozjazdów; PKP Polskie Linie Kolejowe S.A.: Warsaw, Poland, 2008. [Google Scholar]
- PKP Polskie Linie Kolejowe S.A. Iet-119 Dokument Normatywny 01-9/ET/2008. Uchwyty Grzejników Elektrycznego Ogrzewania Rozjazdów; PKP Polskie Linie Kolejowe S.A.: Warsaw, Poland, 2008. [Google Scholar]
- PKP Polskie Linie Kolejowe S.A. Iet-117 Dokument Normatywny 01-7/ET/2008. Skrzynia Transformatorowa Elektrycznego Ogrzewania Rozjazdów; PKP Polskie Linie Kolejowe S.A.: Warsaw, Poland, 2008. [Google Scholar]
- PKP Polskie Linie Kolejowe S.A. Iet-116 Dokument Normatywny 01-6/ET/2008. Szafa Rozdzielcza Elektrycznego Ogrzewania Rozjazdów; PKP Polskie Linie Kolejowe S.A.: Warsaw, Poland, 2008. [Google Scholar]
- PKP Polskie Linie Kolejowe S.A. Warunki Techniczne Utrzymania Nawierzchni na Liniach Kolejowych; PKP Polskie Linie Kolejowe S.A.: Warsaw, Poland, 2015. [Google Scholar]
- VdS Schadenverhütung GmbH: VdS 2859: Anerkennung von Sachverständigen für Elektrothermografie (Elektrothermografen). Anhang C: Mindestanforderungen an Geeignete Kamerasysteme. 2019. Available online: https://shop.vds.de/download/vds-2859/6fa97b10-14cb-4894-bde7-66c5467c7fe5 (accessed on 29 October 2025).
- DIN EN 50110-1 (VDE 0105-1); Operation of Electrical Installations—Part 1: General Requirements. Deutsches Institut für Normung (DIN): Berlin, Germany, 2014.
- FLIR Systems: How Do You Calibrate a Thermal Imaging Camera? Available online: https://www.flir.com/discover/professional-tools/how-do-you-calibrate-a-thermal-imaging-camera/ (accessed on 28 October 2025).
- Dziarski, K.; Hulewicz, A. Uncertainty of Thermographic Temperature Measurement with an Additional close-up Lens. Meas. Sci. Rev. 2021, 21, 185–190. [Google Scholar] [CrossRef]
- National KOBiZE Database Management Team. CO2, SO2, NOx, CO and total dust emission factors for electricity based on information contained in the National Database on Greenhouse Gas Emissions and Other Substances for 2023. In National Database on Greenhouse Gas Emissions and Other Substances; National KOBiZE Database Management Team: Warsaw, Poland, 2024. [Google Scholar]
- Flis, M. Metody ogrzewania rozjazdów kolejowych. Pozn. Univ. Technol. Acad. Journals. Electr. Eng. 2015, 83, 245–252. [Google Scholar]
- Kiraga, K.; Szychta, E.; Andrulonis, J. Wybrane metody ogrzewania rozjazdów kolejowych—artykuł przeglądowy. Prz. Elektrotech. 2010, 86, 247–252. [Google Scholar]
- Stypułkowski, K.; Gołda, P.; Lewczuk, K.; Tomaszewska, J. Monitoring System for Railway Infrastructure Elements Based on Thermal Imaging Analysis. Sensors 2021, 21, 3819. [Google Scholar] [CrossRef] [PubMed]
- Szychta, E.; Szychta, L.; Luft, M.; Kiraga, K. Application of 3D Simulation Methods to the Process of Induction Heating of Rail Turnouts. In Infrastructure Design, Signalling and Security in Railway; InTechOpen: London, UK, 2012. [Google Scholar]
- Yousuf, A.; Khawaja, H.; Virk, M.S. A review of infrared thermography applications for ice detection and mitigation. Cold Reg. Sci. Technol. 2024, 218, 104058. [Google Scholar] [CrossRef]
- Laiton-Bonadiez, C.; Branch-Bedoya, J.W.; Zapata-Cortes, J.; Paipa-Sanabria, E.; Arango-Serna, M. Industry 4.0 Technologies Applied to the Rail Transportation Industry: A Systematic Review. Sensors 2022, 22, 2491. [Google Scholar] [CrossRef]
- Oswald-Tranta, B. Induction Thermography for Surface Crack Detection and Depth Determination. Appl. Sci. 2018, 8, 257. [Google Scholar] [CrossRef]
- Lotfi, A.; Virk, M.S. Ice mitigation in railway turnouts using a conductive heater: An experimental study. Transp. Res. Interdiscip. Perspect. 2025, 31, 101474. [Google Scholar] [CrossRef]
- Tuschl, J.; Oswald-Tranta, B.; Eck, S. Inductive Thermography as Non-Destructive Testing for Railway Rails. Appl. Sci. 2021, 11, 1003. [Google Scholar] [CrossRef]
- Kukulski, B.; Stypułkowski, M. The use of thermal imaging studies in the diagnosis of railroad infrastructure elements. Rail Veh. 2023, 2023, 40–46. [Google Scholar]
- Usamentiaga, R.; Sfarra, S.; Fleuret, J.; Yousefi, B.; Garcia, D. Rail inspection using active thermography to detect rolled-in material. In Proceedings of the 2018 International Conference on Quantitative InfraRed Thermography, Berlin, Germany, 25–29 June 2018. [Google Scholar]
- Phusakulkajorn, W.; Núñez, A.; Wang, H.; Jamshidi, A.; Zoeteman, A.; Ripke, B.; Dollevoet, R.; De Schutter, B.; Li, Z. Artificial intelligence in railway infrastructure: Current research, challenges, and future opportunities. Intell. Transp. Infrastruct. 2023, 2, liad016. [Google Scholar] [CrossRef]
- Fraga-Lamas, P.; Fernández-Caramés, T.; Castedo, L. Towards the Internet of Smart Trains: A Review on Industrial IoT-Connected Railways. Sensors 2017, 17, 1457. [Google Scholar] [CrossRef] [PubMed]


Disclaimer/Publisher’s Note: The statements, opinions and data contained in all publications are solely those of the individual author(s) and contributor(s) and not of MDPI and/or the editor(s). MDPI and/or the editor(s) disclaim responsibility for any injury to people or property resulting from any ideas, methods, instructions or products referred to in the content. |
© 2025 by the authors. Licensee MDPI, Basel, Switzerland. This article is an open access article distributed under the terms and conditions of the Creative Commons Attribution (CC BY) license (https://creativecommons.org/licenses/by/4.0/).