1. Introduction
With the acceleration of urbanization and rapid socioeconomic development, the number of global vehicles continues to grow. While the traditional internal combustion engine (ICE) vehicles have facilitated transportation convenience, they have also led to severe environmental pollution, including tailpipe emissions and carbon emissions. Excessive consumption of fossil fuels would intensify the greenhouse effect and air pollution, threatening ecological balance and human health [
1,
2]. Hence, the electric vehicles (EVs), with their low-carbon advantages such as zero tailpipe emissions, high energy efficiency, and strong compatibility with renewable energy sources, have become a key solution to replace the ICE vehicles. However, challenges should be considered with the large-scale integration of EVs into the power grid [
3,
4].
The concentration of EVs charging during peak demand periods would exacerbate the grid peak load pressure [
5], while the grid operators have to dispatch high-cost peaking generators or implement load shedding, substantially increasing the operational costs [
6]. The integration of numerous charging stations (CS) into low-voltage distribution networks may induce voltage sags, three-phase imbalance, and harmonic pollution, threatening the voltage stability and power quality, thereby affecting the residential appliance operation and grid equipment safety [
7,
8]. Pricing strategies are critical regulatory mechanisms, where well-designed electricity tariffs can incentivize users to flexibly adjust the charging behaviors across different time periods, alleviating the peak-hour power demand pressure so as to enhance the operational efficiency and stability of the power systems [
9,
10].
The current pricing strategies of EVs can be categorized into static and dynamic pricing mechanisms based on their tariff structures [
11], where the static strategies normally include conventional flat-rate tariffs and tiered electricity pricing [
12]. The traditional flat-rate tariff refers to a fixed rate and cost-based uniform pricing, which is simple to implement but lacks price guidance [
13]. The tiered electricity pricing is used to divide the price into different groups according to the user’s electricity consumption, as the price increases as the usage rises. However, this approach has a limited direct impact on the grid load regulation and cannot precisely guide the charging behaviors [
14]. Dynamic pricing strategies contain time-of-use (ToU) pricing, peak pricing, extreme-day pricing, and real-time pricing mechanisms [
15]. A mathematical model for EV charging/discharging under ToU is proposed to enable the load shifting by guiding EV charging behaviors [
16]. Further, a pricing mechanism combining ToU and peak pricing is developed with a large reduction in peak electricity consumption [
17]. Besides, a real-time pricing-based EV tariff model has been further developed to mitigate the grid load fluctuation [
18]. These studies collectively indicate that the dynamic pricing strategies can effectively reduce the negative impacts of uncoordinated large-scale EV charging behaviors.
The pricing strategy should be determined not only by the pricing methodology but also by practical application requirements. From such a perspective, the EV pricing strategies can be categorized as grid-side optimization-oriented pricing, profit-driven pricing, and cross-system collaborative pricing mechanisms [
19,
20,
21]. The first category primarily aims to ensure safe and stable grid operation. For instance, a dynamic pricing-based load control mechanism has been proposed to guide EV users to optimize the electricity consumption behaviors [
22], where the load curves can be adjusted into reasonable intervals under the constraint of the electricity demand within maximum supply capacity limits, thereby reducing the grid expansion pressure. Another day-ahead EV scheduling strategy is proposed, considering peak load reduction and energy arbitrage [
23], which can alleviate the feeder load demand stress in the distribution networks.
The second category focuses on the revenue of the power plants, distribution networks, EVs, and other entities in the system. A hierarchical vehicle-to-grid (V2G) pricing dispatch model is established to achieve optimal grid energy consumption with enhanced economic efficiency for the market entities [
24]. A tripartite cost-minimization framework was further developed for the grid operators, aggregators, and EV users, where a decomposition-based multi-objective evolutionary algorithm was employed to determine the optimal charging and discharging tariffs, thereby enabling the fair profit allocation among the V2G participants [
25].
The third category is featured by the involved spatial factors, where the EV charging tariffs are associated with the V2G interactions. In [
26], a non-collaborative game model is proposed with the integration of EV and CSs co-planning when the electricity price is tuned to guide the charging behaviors and redistribute the spatial charging loads. The current pricing methodologies are predominantly oriented towards supply-side optimization or revenue allocation among electricity market stakeholders, while the scenario-specific and heterogeneous nature of the EV charging demands remains insufficiently addressed. In particular, the emergency charging scenarios often require prioritized service provision. Hence, we design an optimal charging strategy with a charging urgency index and a charging service satisfaction index to quantitatively assess user acceptance in this paper.
Furthermore, the electricity market and the carbon market share common decarbonization objectives, with the same participants and closely correlated price dynamics [
27]. It is therefore useful to leverage the integrated regulatory potential of EVs within the carbon market mechanisms to enhance the resource allocation and support the emission control, thereby promoting a cleaner, low-carbon, cost-effective, and efficient transformation of the power sector [
28,
29]. In ref. [
30], a bi-level optimization framework is proposed for low-carbon economic dispatch under various EV charging modes to mitigate the grid impacts. Interactive optimization strategies between EVs and virtual power plants under tiered carbon trading mechanisms are investigated in [
31]. A carbon footprint management strategy for EVs is developed considering both the grid-side and the load-side interventions to reduce the emission [
32]. Whereas these studies confirm the carbon reduction potential of EVs, they primarily concentrate on the emission cost impacts within the electricity markets, lacking a coordinated integration of the electricity and carbon markets.
In this paper, a cross-market trading mechanism is proposed to enable the EV participation in the coupled electricity–carbon markets. Considering the emergency charging demand of EVs, an electricity–carbon joint market pricing incentive mechanism is then established. A Stackelberg game model between the CSs and EVs is further constructed such that the optimal electricity price in the joint market for EVs is ultimately derived. The main contribution of the paper is summarized as follows:
(1) An integrated electricity–carbon market framework is proposed, enabling optimal EV charging pricing under the joint mechanism.
(2) A Stackelberg game model is developed to characterize the interaction between CSs and EVs, incorporating both the emergency charging demand of EV users and the carbon trading revenue generated during the charging process.
(3) Comparative experiments have been performed with different pricing strategies to alleviate the grid load to verify the effectiveness of the proposed optimal EV charging strategy.
The remainder of the paper is organized as follows.
Section 2 describes the electricity–carbon joint market framework. A leader-follower game model is formulated for electricity–carbon market transactions, while the solution method is also provided in
Section 3. In
Section 4, comparative experiments are performed and results are discussed with an explanation. The conclusion is given in
Section 5.
2. Problem Formulation
The EV charging model and the carbon trading model are explained in detail, together with the related impact factors. Then, the integrated electricity–carbon market framework is formulated to balance the profits between the CS and EVs in hierarchical optimization.
2.1. Problem Description
In this paper, the CS acts as the strategy maker to determine the electricity price, while EV users act as the information providers and select their corresponding charging strategies. EV users are required to provide their charging demand, including the required charging energy, available charging time, and the estimated travel distance, along with tradable carbon quota data. Then, the CS aggregates the collected charging demands from all signed EVs, calculates the total carbon revenue based on the carbon quota submitted by EV users, and conducts the transactions in the carbon market accordingly.
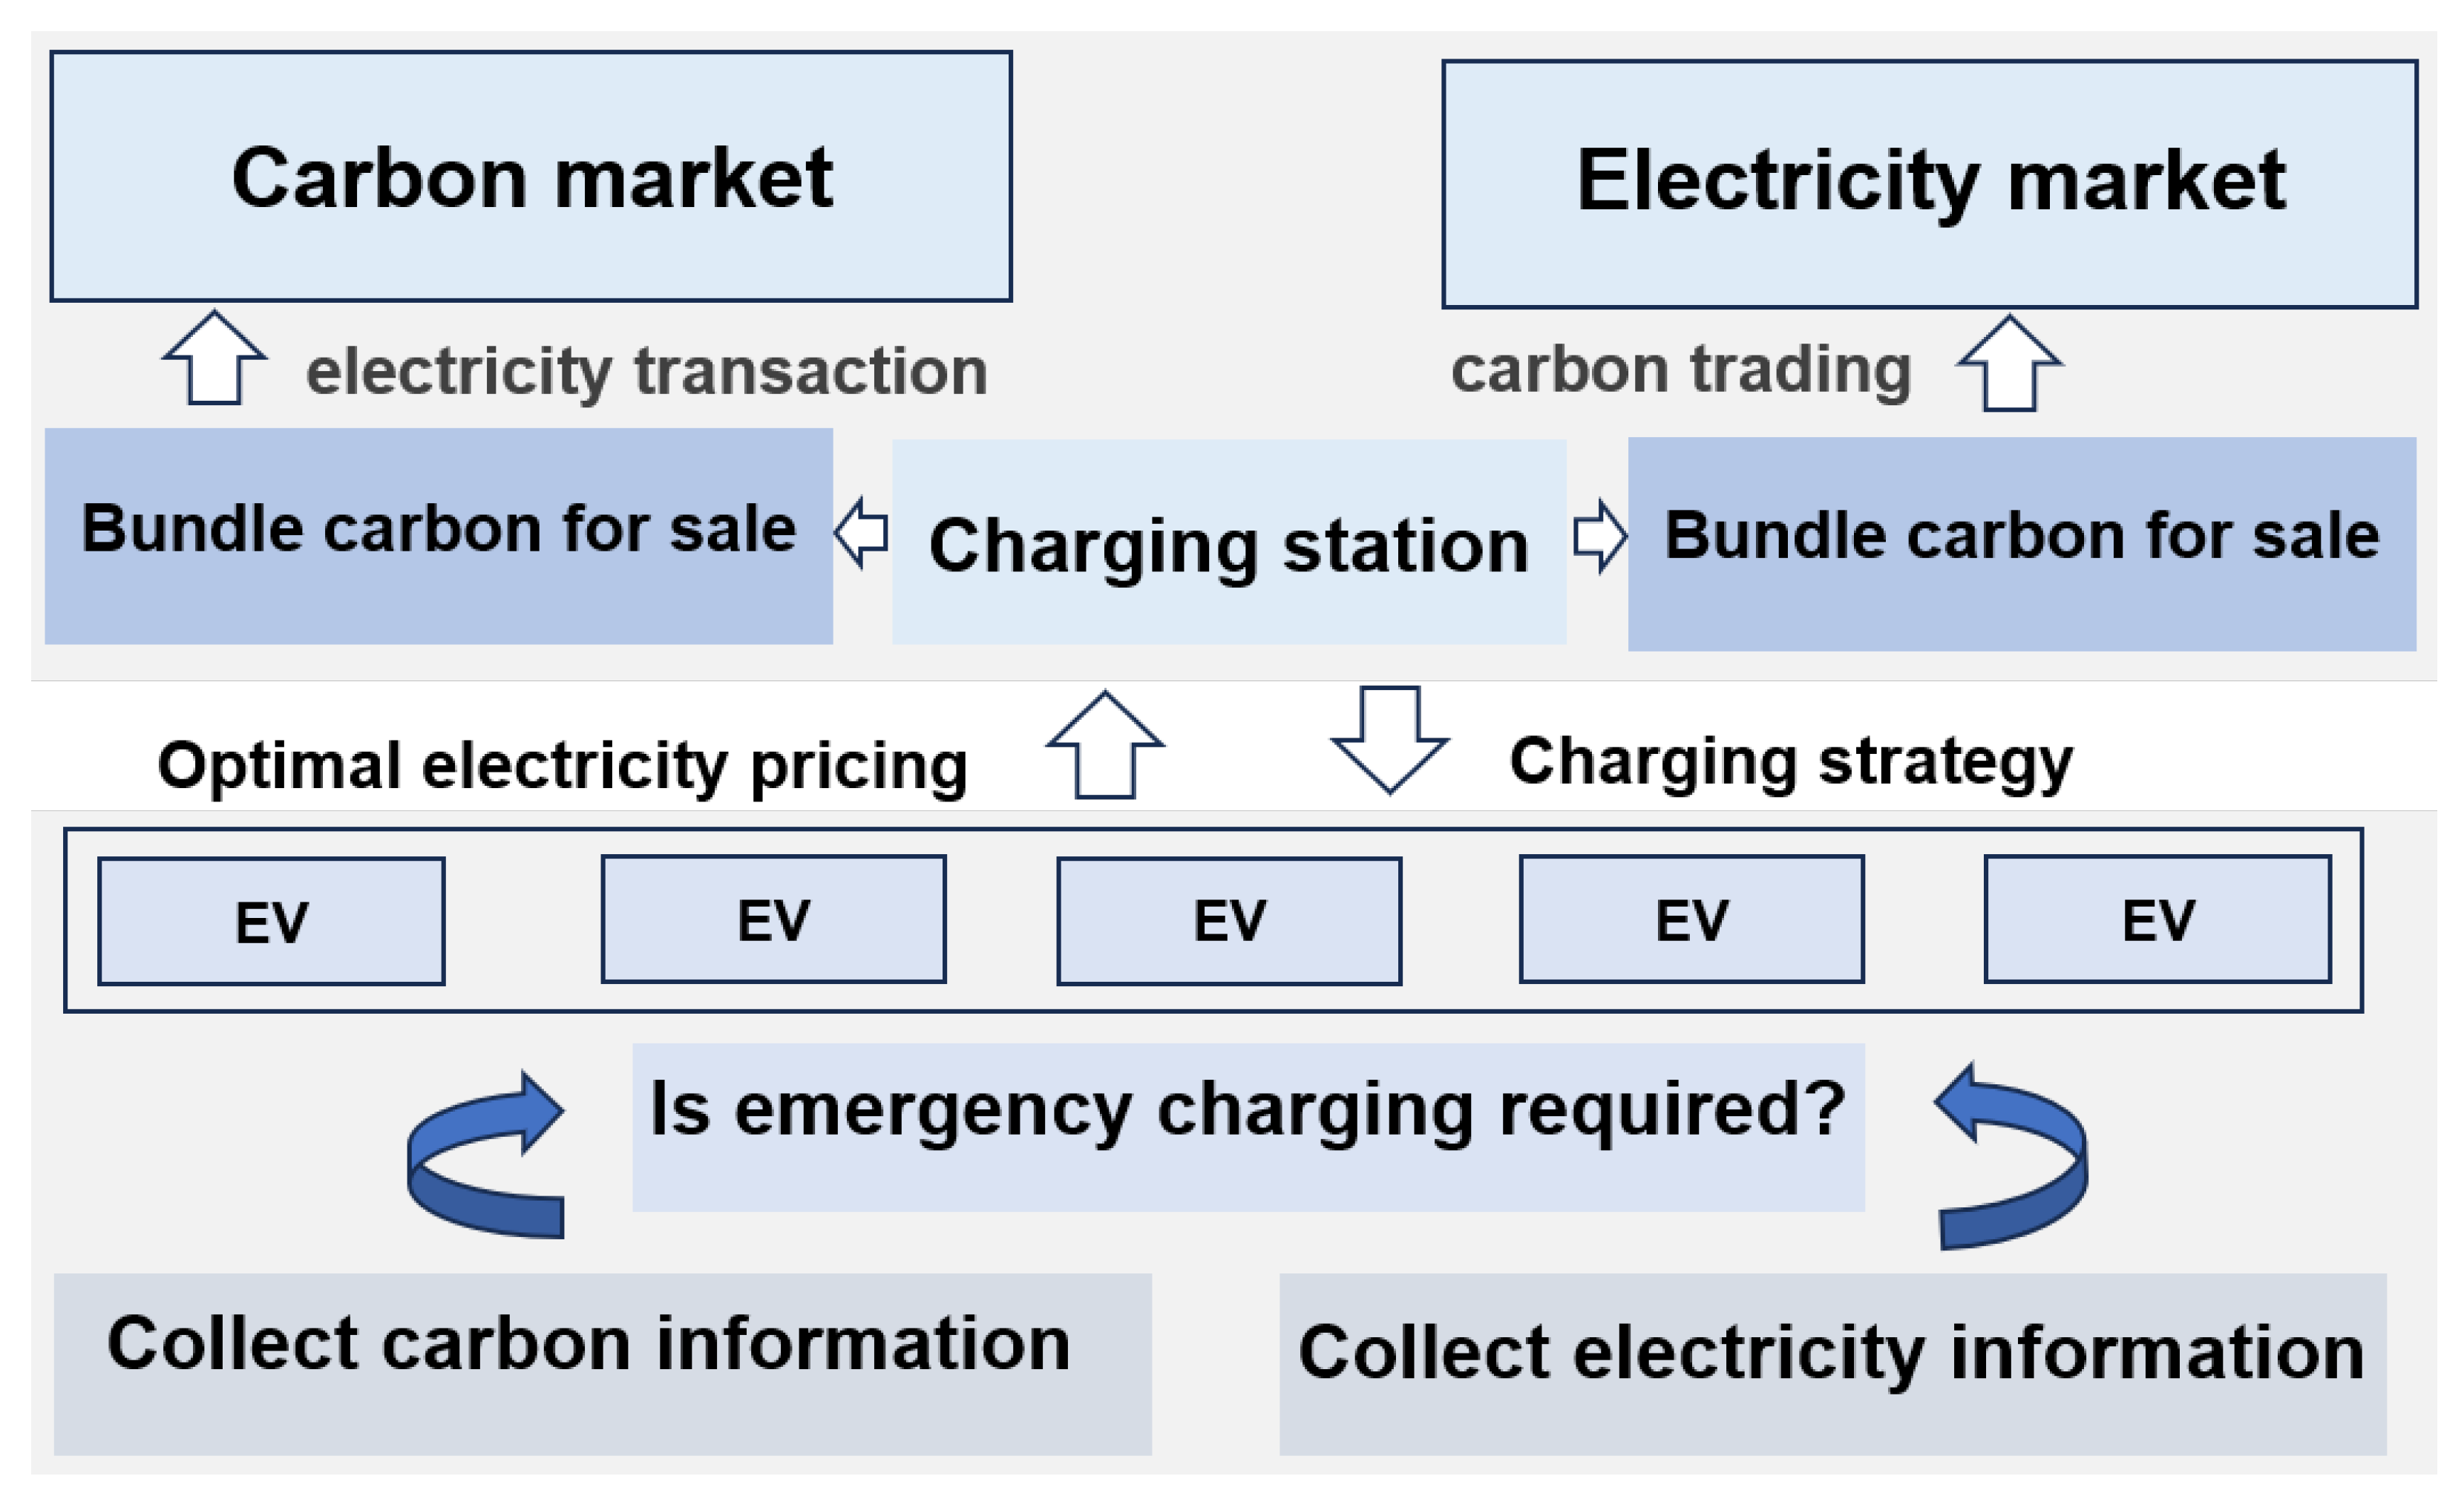
The transaction framework is illustrated in
Figure 1. In this framework, the CS is used as a two-way trading hub, interacting with both EVs and the integrated electricity–carbon market. For the electricity trading, the CS is required to conduct two transactions. The first one involves purchasing day-ahead electricity from the market, which is used for sale to the EVs on the following day. Since the day-ahead electricity price is generally lower than that of the real-time price, the second transaction takes place when the purchased day-ahead electricity is insufficient, such that the CS has to purchase additional electricity at the real-time market price. By contrast, the carbon trading is performed only once per day. The CS aggregates the carbon quota provided by EVs and trades them in the carbon market. Since the EV users cannot directly participate in the real-time carbon trading, the CS retains a portion of the carbon revenue as compensation for EVs providing the trading service. Therefore, the CS needs to determine a reasonable electricity price to maximize its own profit as much as possible. Meanwhile, EV users select their optimal charging times based on the announced price to achieve their individual profit maximization.
Therefore, when EVs and CS pursue their own profit maximization, an interaction would be interrelated between them since the EV users aim to minimize their charging cost by selecting low-price periods, while the CS seeks to increase its revenue by encouraging charging during high-price periods. The revenue structure of both parties changes with the introduction of the carbon market. The EVs and the CS can reformulate their charging strategies and reach a new equilibrium of interests in the integrated electricity–carbon market. Under this framework, the pursuit of profit maximization by both sides forms a typical bi-level optimization problem. Accordingly, this paper focuses on the following research objectives:
(1) Designing an electricity pricing incentive mechanism suitable for the integrated electricity–carbon market; (2) developing a model that accurately describes the bi-level optimization relationship; (3) addressing the conflict of interest between EV users and the CS during their individual profit-maximizing processes.
2.2. EV Charging Model Considering Emergency Charging Demand
A charging model considering the emergency situations of the EVs is designed via the Monte Carlo simulation method, as illustrated in
Figure 2.
- (1)
Initial charging time
According to the National Household Travel Survey (NHTS) in the United States, the initial charging time of EVs follows a normal distribution [
33],
where
is the probability distribution of the initial charging time,
denotes the expected value of the initial charging time distribution,
is the variance,
and
vary depending on the type of the EVs.
- (2)
Daily mileage and initial charging state of EV
The daily driving distance of the EVs is a key indicator for measuring the energy consumption, which not only reflects the user’s driving & charging habits but also serves as the data basis for calculating the initial battery state of charge (SOC). According to the survey of NHTS, the daily driving mileage of EVs follows a lognormal distribution,
where
s is the probability distribution function of the initial charging time,
and
are the expected value and variance, respectively.
The SOC of an EV is assumed to decrease linearly with its driving distance. Hence, the initial SOC of the EV can be estimated based on the vehicle’s daily travel mileage,
where
is the initial charging SOC of the EV, and
denotes the EV SOC at the end of the previous charging session.
- (3)
Charging emergency index
Each EV has its own charging requirements, then an index is required to quantify the urgency of the charging demand. It is defined based on whether the slow charging power can meet the minimum required charging energy of the EV user, formulated as,
where
is the indicator of the emergency charging demand,
is the duration of the EV connection to the power grid,
is the charging power of the slow charging,
is the minimum SOC required by the EV owner,
is the maximum charging capacity of the EV, and
is the charging and discharging efficiency parameter.
- (4)
Charging mode selection
With the integration into the power grid, the EV users submit the minimum acceptable SOC threshold. The CS subsequently evaluates the necessity of emergency charging based on the following criterion,
where
is the charging power of the EV, and
is the required fast charging power.
In order to evaluate whether the charging demand of the EV users is satisfied, a comprehensive assessment criterion is established for emergency charging satisfaction, including the amount of energy replenished, the ability to meet the maximum expected travel distance on the following day and the allocated charging duration,
where
is the maximum achievable SOC of the EV;
is the SOC upon departure from the CS. Similarly,
corresponds to the maximum attainable driving range post-charging, whereas
represents the actual travel distance covered by the EV.
is the actual charging duration, and the weights
correspond to the evaluation criteria.
- (5)
Daily mileage and initial charging state of EVs
The charging duration (
) of an EV is affected by multiple factors, i.e.,
,
and
, expressed as,
where
U corresponds to the rated battery capacity of the EV.
2.3. Carbon Trading Mechanism
To accelerate the widespread adoption of EVs, designing effective incentive mechanisms remains a key strategy. The carbon trading mechanism typically follows a reward-and-penalty framework, where the entities exceeding their carbon emission limits are required to pay a carbon tax, while those with less emission will receive carbon quotas. In this study, the carbon quota allocation is determined based on the EV charging volume. Instead, their carbon footprint is attributed to the electricity consumption, with emissions calculated based on the fossil fuel consumption during the power generation.
- (1)
Carbon quota model
In practical scenarios, the real-time carbon trading for individual EV users is not feasible. Instead, CS can compensate EV users by paying them the equivalent carbon benefits, packaging them into bulk transactions for trading in the carbon market. The carbon quota for an individual EV can be calculated based on the daily carbon emissions of a conventional fuel vehicle, described as,
where
is the carbon quota allocated to the EV,
is the actual charging energy of the EV,
is the distance which can travel per unit of the charging energy,
is the fuel consumption per unit distance for a conventional ICE vehicle, and
is the carbon emission factor of the ICE vehicle.
- (2)
Carbon emission model and trading model
The carbon emissions associated with EVs primarily originate from the power generation processes within the grid. Since the renewable energy sources, such as hydropower and wind power, generate negligible carbon emissions during electricity production, they can be disregarded in the estimation. Under this assumption, the carbon emissions from thermal power generation (e.g., coal-fired and gas-fired power plants) become the primary source. The carbon intensity of the thermal power generation can directly affect the overall carbon footprint of EVs, which can be expressed as,
where
is the carbon emissions from the power plant, and
is the generated electricity output of the power plant. For an individual EV owner,
, and
for a CS,
is the carbon emission factor of the thermal power generation.
- (3)
The carbon trading model
In the carbon trading model, the carbon revenue or cost is determined by the difference between the actual carbon emissions and the allocated carbon quotas, multiplied by the carbon price. Specifically, the economic value of the carbon trading is calculated as the product of the carbon price and the disparity between the actual carbon emissions of the EV and its allocated carbon quota. If an EV’s carbon emission is lower than its allocated carbon quota, a positive carbon revenue is generated. Otherwise, EV users will pay the carbon cost. Since the CS acts as the media, it can effectively calculate the carbon revenue derived from the EV charging, thereby facilitating efficient carbon quota allocation and trading,
where
R represents the carbon revenue or carbon incentive, and
denotes the carbon price in the carbon market.
3. Stackelberg Game Model of the Electricity–Carbon Trading
In this section, a Stackelberg game model is developed to solve the trade-off of electricity–carbon trade between the CS and EVs, where the original bi-level nonlinear and non-convex optimization problem is transformed into an equivalent single-level optimization model.
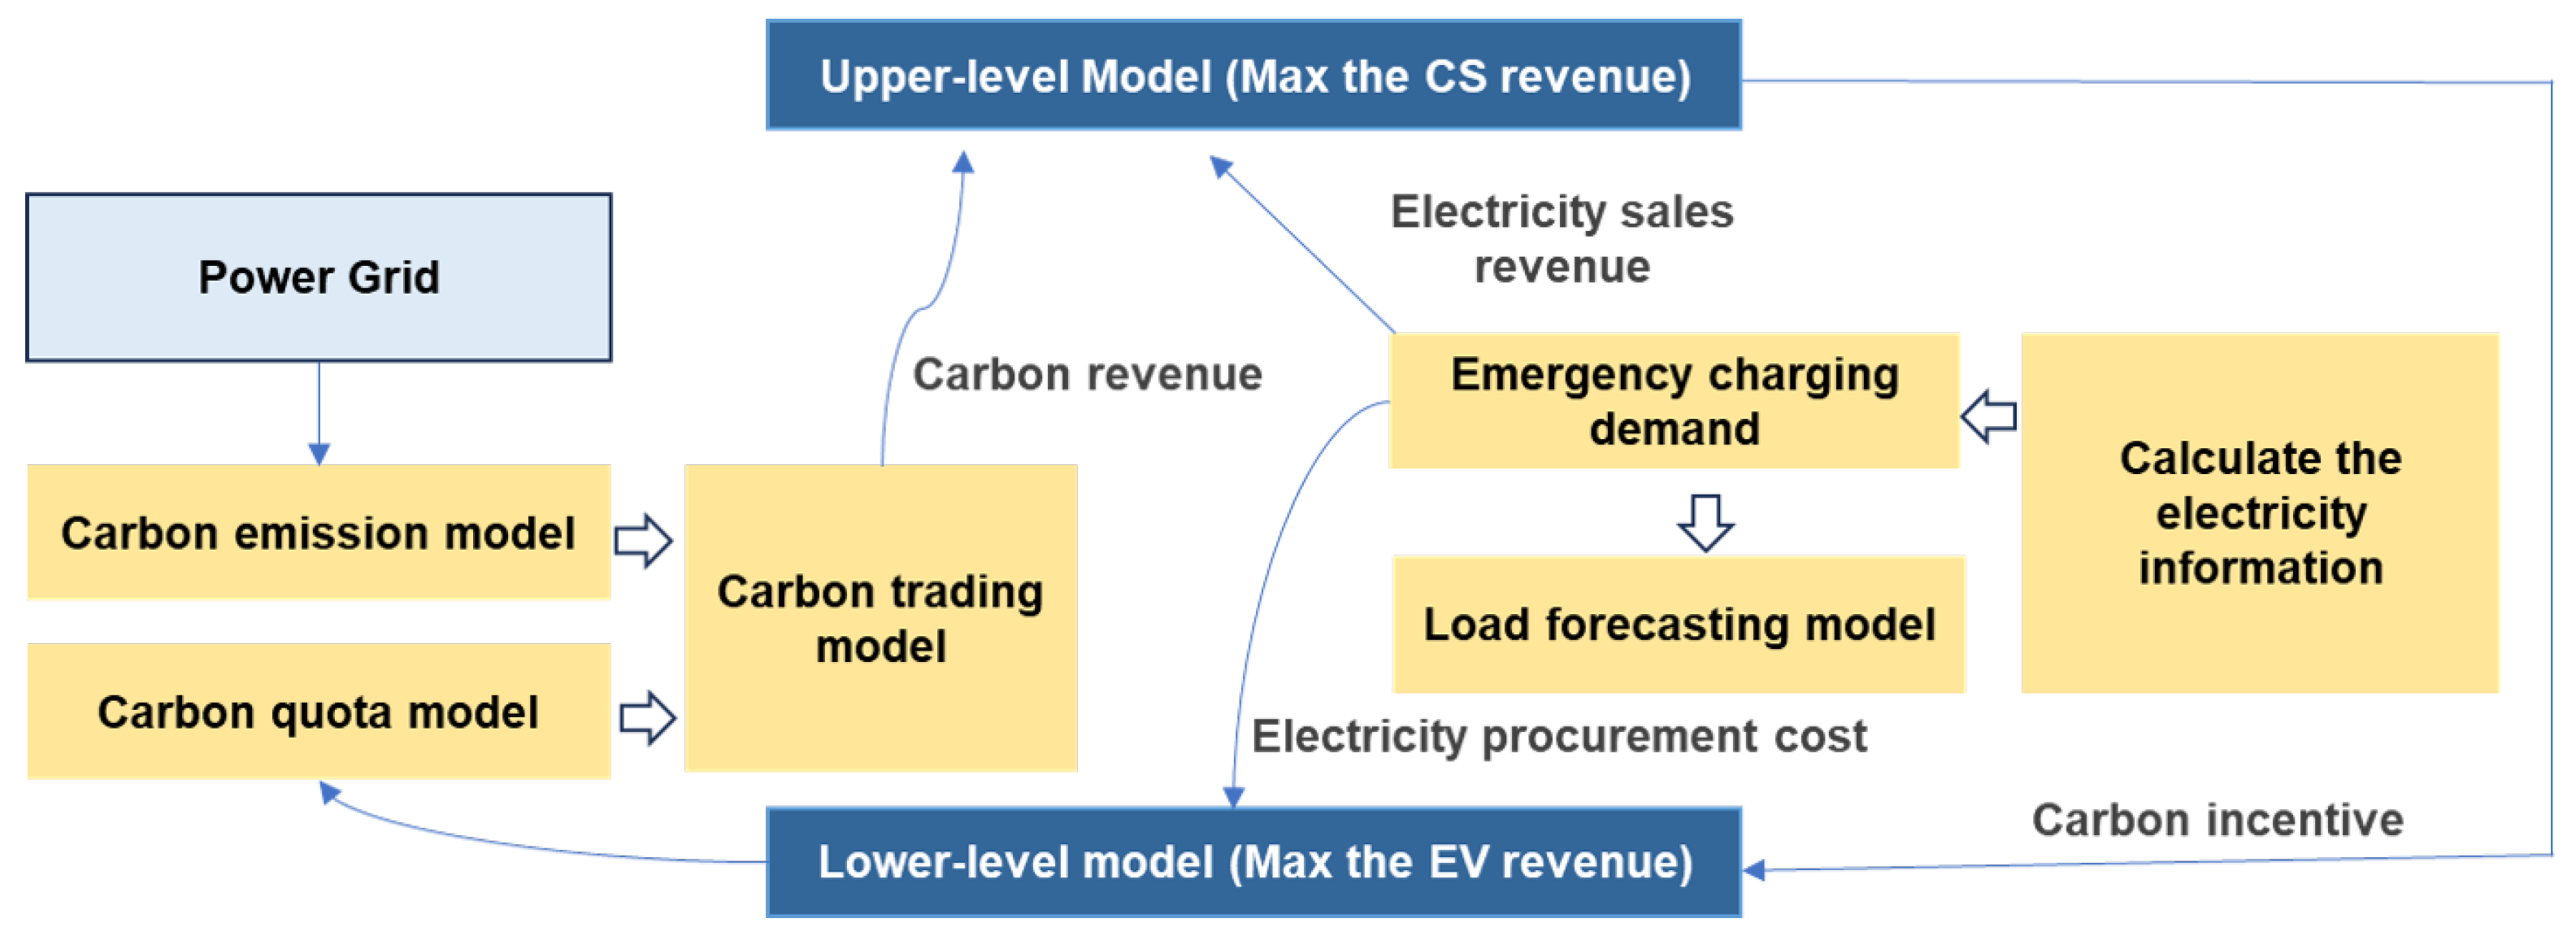
As the electricity price setter and charging strategy designer, the CS is assumed as the leader, while EV users are the participants; thus, a Stackelberg game relationship is established between the two sides, as illustrated in
Figure 3.
3.1. Stackelberg Game Model
The CS collects the electricity price from the grid and charging time preferences from the EV users to formulate the optimal charging price strategy. Once the CS sets the price, EV users can determine their charging strategies accordingly. The process is described as follows: (1) EV users submit their preferred charging periods and required charging energy for the following day to the CS; (2) the CS aggregates the reported charging requirement to confirm the total energy demand and designs an available schedule for the charging; (3) the CS participates in the day-ahead electricity market, signs the power purchase agreements and determines the electricity procurement volume for each time slot; (4) the CS announces the next-day electricity price for each charging period; (5) EV users respond by selecting the charging time slots based on the price.
Therefore, in the upper-level model, the game is to maximize the revenue of the CS, while the goal is to minimize the charging cost (i.e., maximize the revenue) for EV users in the lower-level follower model.
- (1)
Upper-level model
The objective consists of five components: (1) the electricity procurement cost incurred by the CS when purchasing the electricity from the grid; (2) the carbon revenue from selling carbon credits in the carbon market; (3) the charging revenue from selling electricity to EV users; (4) the electricity sales revenue from reselling excess electricity to the grid; (5) the day-ahead electricity purchase cost, written as,
where
is the EV charging price,
is the EV charging power which can be obtained from Equation (
5);
is the real-time electricity purchase price in the electricity market, while
denotes the real-time electricity purchase volume. Similarly,
is the real-time electricity selling price,
is the real-time electricity sale volume;
is the day-ahead electricity purchase volume, while
is the day-ahead electricity purchase price. The total carbon revenue,
, can be derived from Equations (
8)–(
10). Finally,
is the proportional coefficient representing the share of carbon market trading revenue allocated to the CS for acting as an agent on behalf of EV users.
The electricity price constraints can be described as,
where
is the minimum charging price for EVs,
is the maximum charging price, and
is the average charging price.
The electricity quantity constraint is,
It is used to ensure that the electricity flow within the CS remains balanced over a 24-h period.
- (2)
Lower-level model
The EV objective consists of three components: electricity purchase cost, carbon revenue, and battery degradation cost,
The electricity purchase cost is given as,
where
is the set of time periods during which the EV is connected to the grid. The electricity sales revenue
is obtained from Equation (
12).
The battery degradation cost is given as,
where
k is the linear relationship coefficient between the battery lifespan and the number of discharge cycles,
denotes the
battery.
The EV energy balance constraints can be written as,
and the EV charging power constraints is,
where
is a binary decision variable to ensure that the charging is allowed only within the designated charging period.
is the maximum charging power which can be obtained from Equation (
5).
Therefore, the upper-level model is formulated as maximizing Equation (
11) subjected to the constraints in Equations (
13) and (
14). Similarly, the lower-level model is formulated as minimizing Equation (
15) subjected to the constraints in Equations (
19) and (
20).
3.2. The Solution of the Stackelberg Game Model
In the bi-level optimization problem, a sequential decision-making relationship exists between the upper-level (leader) and the lower-level (follower) decision makers, and the overall structure is typically expressed in a nested optimization form. Since the optimal response of the lower level depends on the upper-level decision variables, the entire model exhibits strong non-convexity and pronounced nonlinearity. As a result, obtaining an exact solution is computationally demanding and is generally regarded as an NP-hard problem. Therefore, analytical reformulation, iterative approximation, and heuristic algorithms are often employed to obtain an approximate equilibrium solution.
In the proposed model, the non-convexity and nonlinearity arise primarily from the coupling between the upper- and lower-level decision variables. The upper-level model involves the purchase price, selling price, and charging power of the EVs, while the lower-level model includes the charging price and corresponding charging power for the selected charging periods. Since the CS must take the responses of EV users into account when making decisions, the interaction between the CS and the EVs is inherently neither linear nor convex. To achieve the game equilibrium between the upper-level and lower-level models, the lower-level problem can be reformulated as a constraint within the upper-level problem. Specifically, the objective and constraints from Equations (
13)–(
18) are transformed via the Karush–Kuhn–Tucker (KKT) conditions, converting the problem into a Mixed-Integer Linear Programming (MILP) formulation. By converting the nonlinear Stackelberg game model into a charging management model, the upper-level objective is optimized while ensuring compliance with the lower-level KKT conditions. The solution obtained from the upper-level problem is then substituted into the lower-level objective, effectively transforming the bilevel optimization problem into a single-level optimization problem. The solution process is illustrated in
Figure 4, and the detailed transformation process is as follows.
- Step 1:
Equivalent Nonlinear Transformation
When solving the lower-level model, the charging price for EVs is predetermined at a given moment. Applying the KKT conditions, the constraints from Equations (
15)–(
20) can be equivalently transformed into a set of linear conditions,
where
is the dual variable associated with the constraint in Equation (
19),
and
are the dual variables corresponding to the inequality constraints in Equation (
20), and
is the dual variable associated with the equality constraint in Equation (
20). The first-order gradient condition of the objective function in Equation (
15) with respect to
is given in Equation (
21), while the original constraints are retained in Equation (
22). Furthermore, the complementary slackness conditions, which enforce feasibility in the KKT formulation, are provided in Equations (
23)–(
26) to represent the necessary conditions for optimality.
- Step 2:
Linearization of Inequality Constraints
It can be observed that in the KKT constraints mentioned above, the complementary slackness conditions in Equations (
23)–(
26) are nonlinear. To address this, the binary variables
and
, along with sufficiently large positive integers
and
, are introduced to convert Equations (
23)–(
24) into linear inequalities:
where Equations (
27) and (
28) are equivalent to Equation (
23), and Equations (
29)–(
30) are equivalent to Equation (
24). Thus, all constraints in the lower-level model Equations (
15) and (
20) have been fully transformed into linear inequalities. However, the upper-level objective Equation (
11) still contains the product of two unknown variables, requiring further transformation to complete the linearization process. Based on Equations (
15), (
21) and (
22), Equation (
11) can be transformed as,
In summary, the bi-level model is equivalently transformed into a mixed-integer single-level model, where the objective is given in Equation (
31) subjected to the constraints under Equations (
13), (
14), (
21), (
25) and (
30). The commercial solver CPLEX in YALMIP is utilized to solve the transformed mixed-integer model after linearization.
4. Experiments and Result Analysis
In this Section, experiments are performed from three aspects to evaluate the effectiveness of the proposed strategy. First, the optimization and regulation effects on the grid load are analyzed, then the model’s capability to meet emergency charging demands of EV users is examined. Further, the economic benefits in practical operation are evaluated. Based on this validation framework, three comparative strategies are designed for analysis:
- (1)
Strategy 1 is defined as uncoordinated charging of EVs;
- (2)
Strategy 2 refers to a pricing strategy that considers only the emergency charging demands of EVs;
- (3)
Strategy 3 represents the proposed strategy, where the emergency charging demands are taken into account and EVs are further integrated into the coupled electricity–carbon market for pricing and trading activities.
To evaluate the impact of different numbers of electric vehicles (EVs) connected to the grid under Strategy 1, we have conducted experiments with 200, 400, and 600 EVs, respectively. In contrast, the number of EVs connected to the grid is uniformly set to 200 for the comparative experiments of the three strategies.
All experiments are conducted on a Windows 10 Professional 64-bit (version 19045) operating system. The hardware platform is equipped with an Intel 12th Gen Core i5-12600KF @ 3.70 GHz processor (10 cores, 16 threads) and 32 GB of RAM. The software environment consisted of MATLAB R2022b and the YALMIP toolbox (R2023.05) for optimization modeling and solution.
4.1. Experimental Parameter Settings
- (1)
EV charging parameter settings
In this simulation, the number of EVs is set to 200. Based on the parameters of mainstream EV models with high market penetration (i.e., Tesla and BYD), the rated battery capacity of EVs is uniformly set as 48 kWh. The energy consumption per unit mileage is set as 15 kWh per 100 km. The normal charging power is set as 6 kW, while the emergency charging power is set to 12 kW. The
and the initial charging time of each EV are randomly generated according to Equations (
1)–(
3). The
follows a uniform distribution in the range of [0.4, 0.6], while the expected SOC upon departure, i.e., the
, is set to 0.9. Besides,
,
,
.
- (2)
Carbon trading parameter settings
Considering that non-clean energy power generation in China is currently primarily based on carbon-intensive fuels, coal is selected as the carbon-emitting fuel. Here, the carbon emission factor of the power generation is set to . This study focuses on the orderly charging of private EVs, and the carbon quotas are calculated based on the benchmark of gasoline vehicles using No. 93 gasoline. The fuel consumption of gasoline vehicles is set to , and the mileage achievable per unit of electricity is . The carbon emission intensity of the gasoline vehicles is set to .
- (3)
Electricity trading parameters
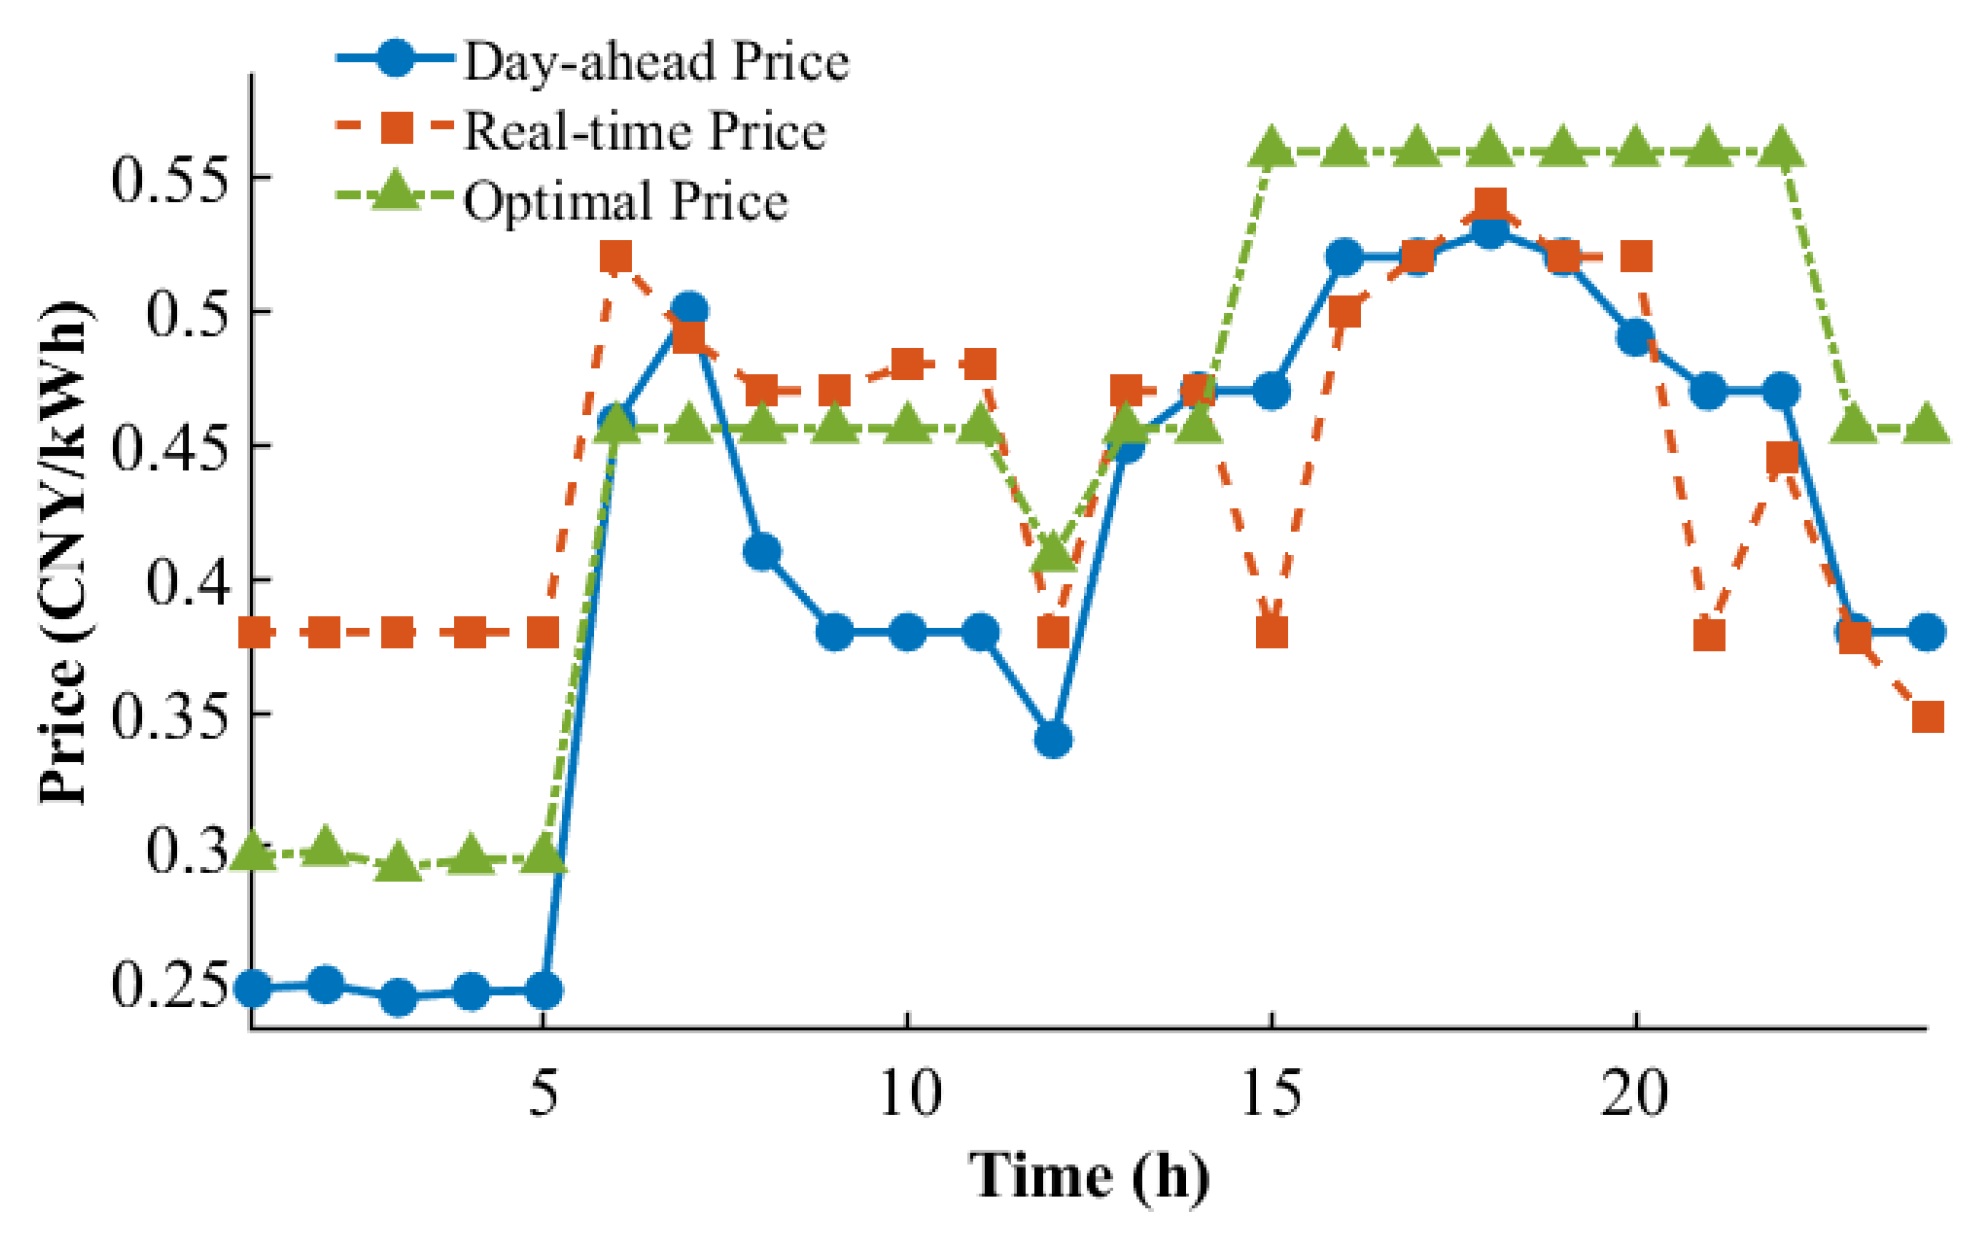
The electricity trading price between the CS and the grid is divided into
day-ahead price and
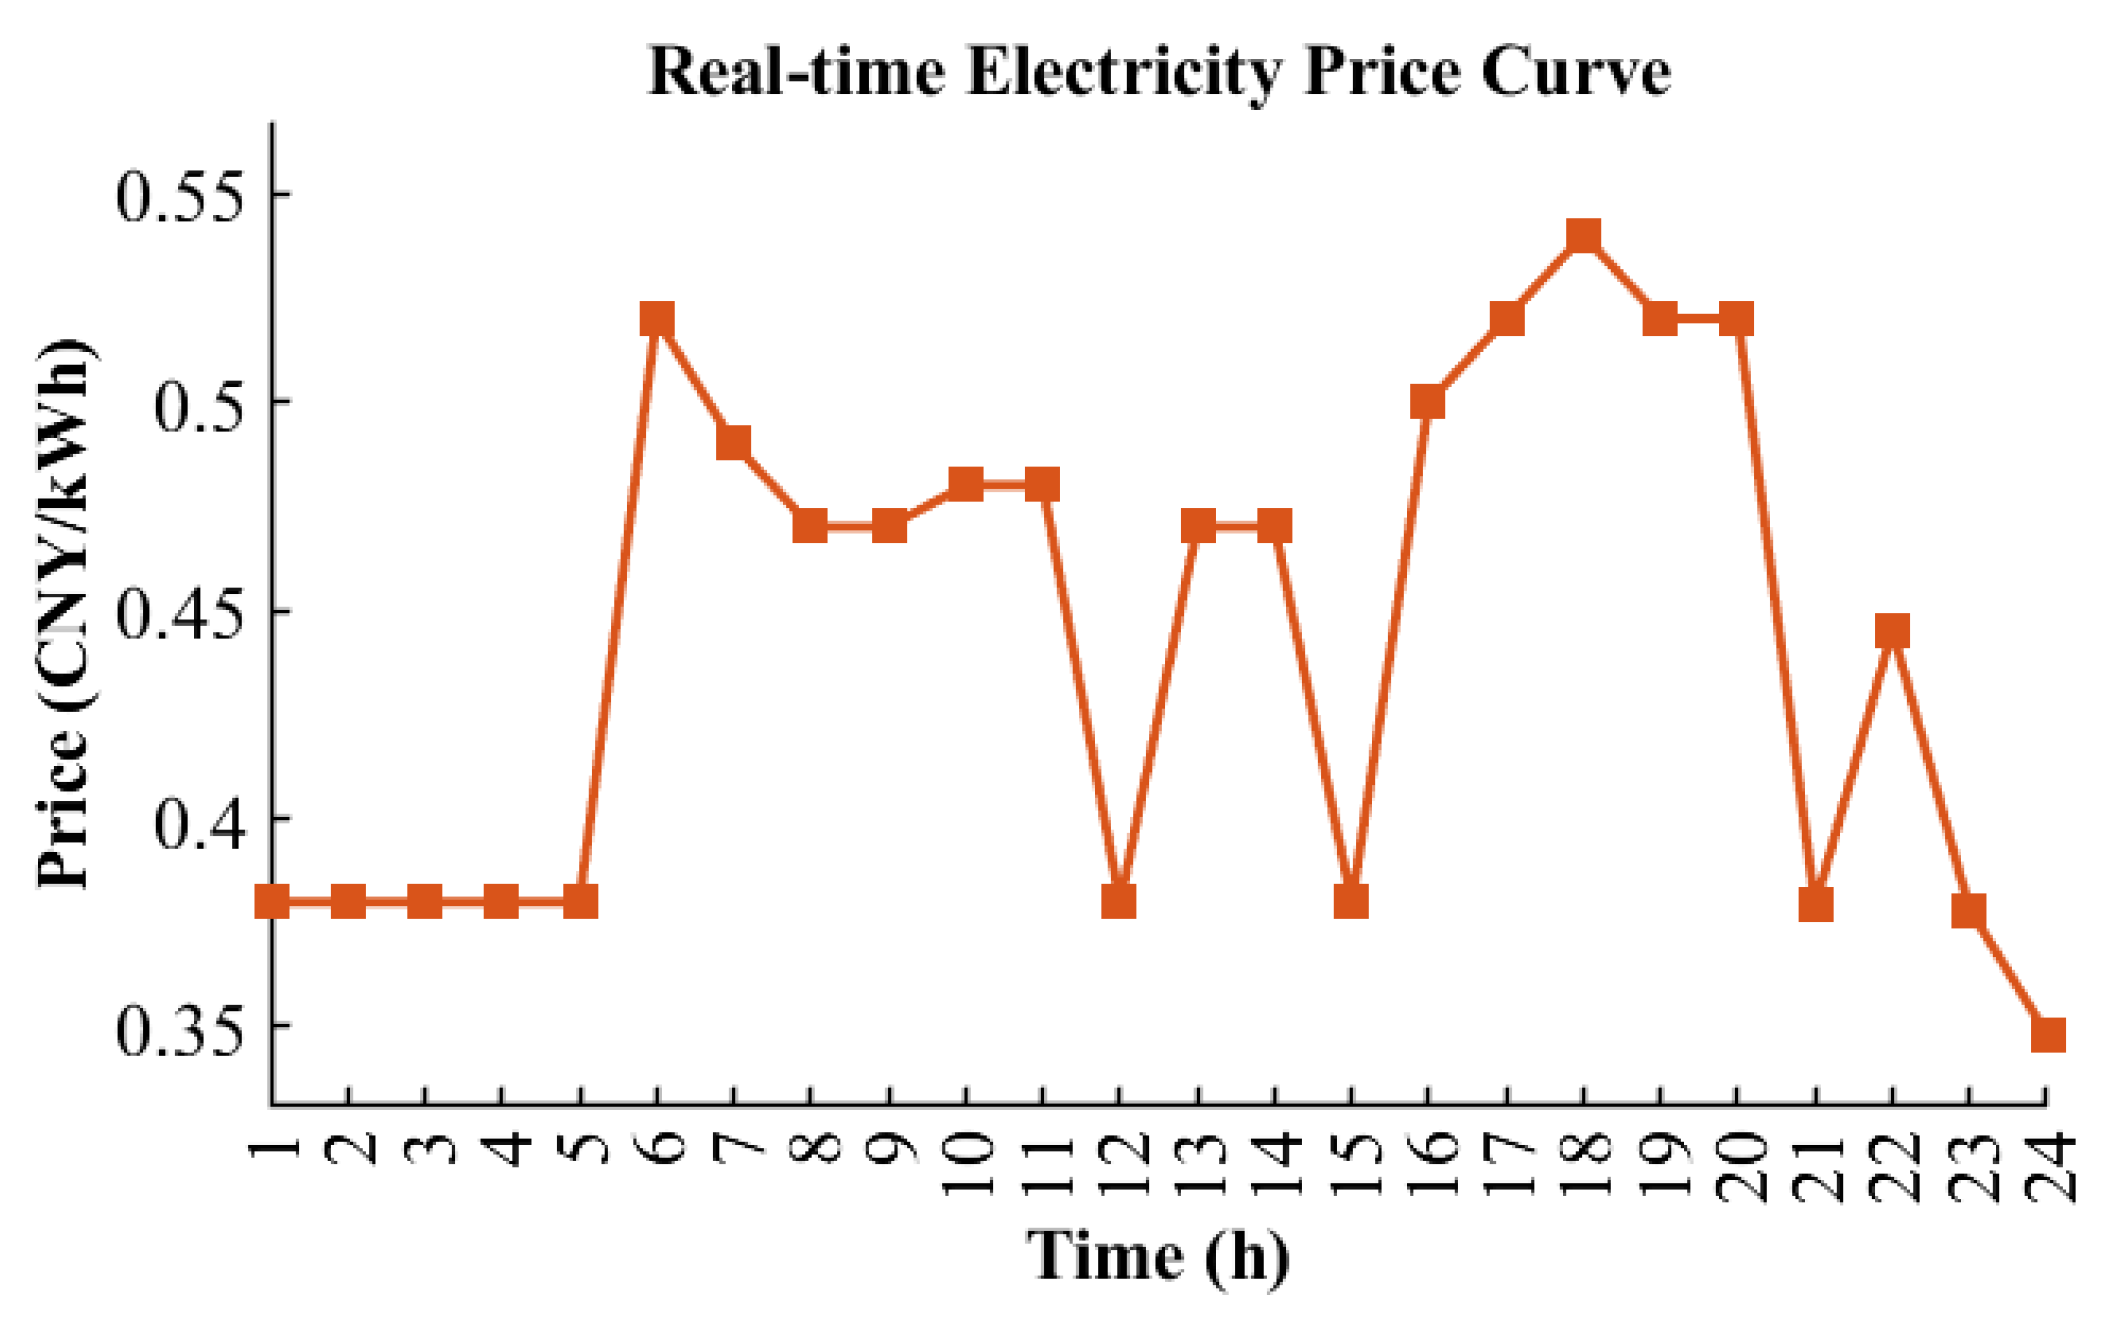
real-time price, which are obtained from the data released by the Liaoning Provincial Development and Reform Commission [
34]. The day-ahead and real-time price curves are illustrated in
Figure 5 and
Figure 6, respectively. As constrained in Equations (
13) and (
14), the average electricity price is set at
, and the parameters
&
are set to
and
times of the day-ahead price, respectively.
4.2. Monte Carlo-Based Simulation of EV Grid Integration
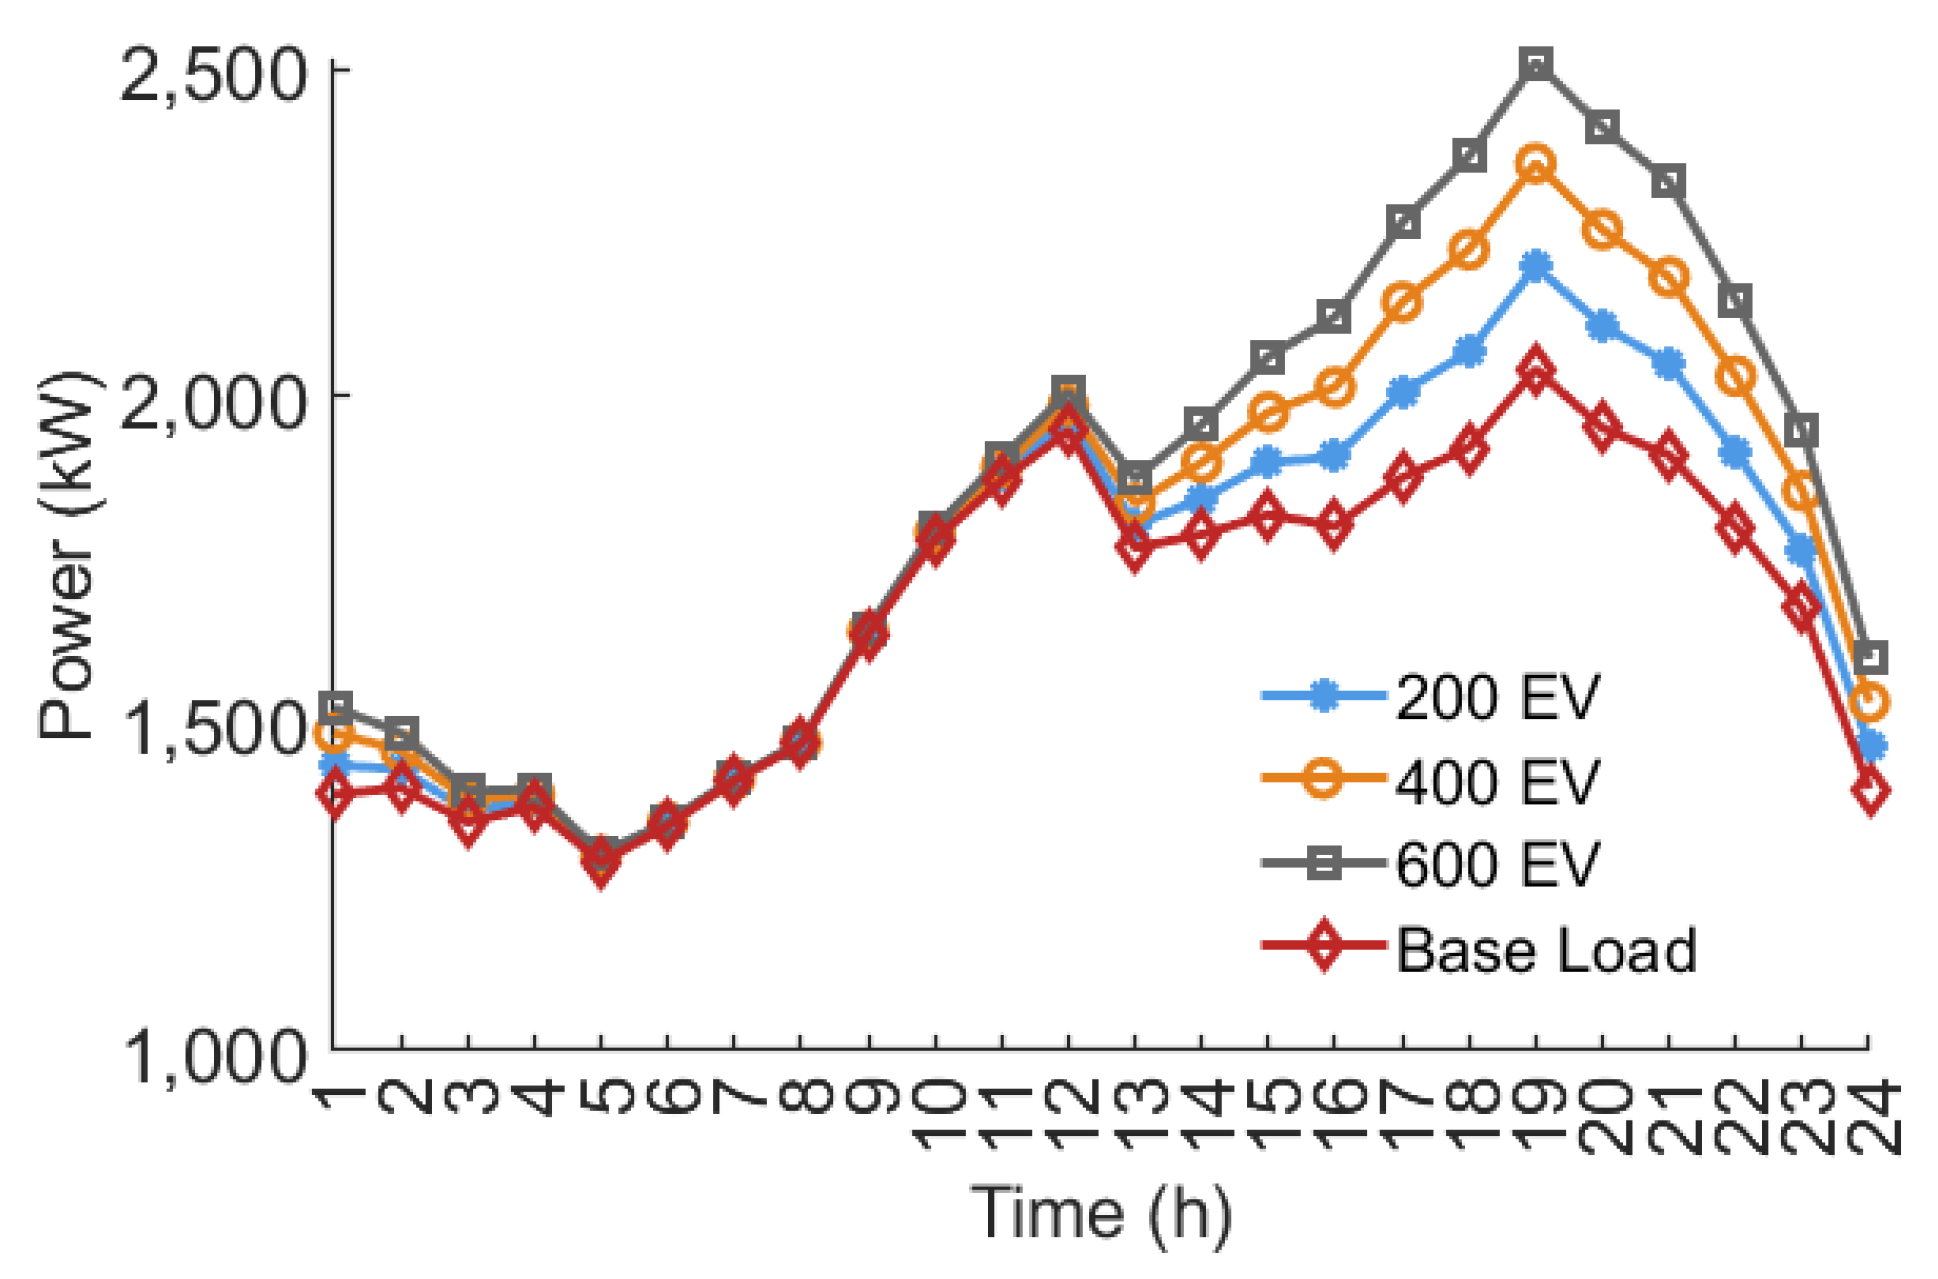
To independently verify the impact of EV charging loads on the grid load, we conduct the experiments by individually connecting 200, 400, and 600 private EVs to the grid. The simulation is carried out with the charging model designed in
Section 2.2.
According to
Figure 7, the initial base load of the power grid has a maximum of
and a minimum of
, resulting in a peak–valley difference of
and a corresponding peak–valley ratio of
. As private EVs are progressively connected to the grid, the load characteristics would undergo huge variations. Specifically, when 200 private EVs are connected, the grid peak load increases to
, and the valley load rises to
. The peak–valley difference expands to
, and the peak–valley ratio increases to
. When 400 private EVs are connected, the peak load reaches
, the valley load increases to
, and the peak–valley difference further grows to
, with a peak–valley ratio of
. When 600 private EVs are connected, the grid peak load reaches
, the valley load increases to
, and the peak–valley difference reaches
, resulting in a peak–valley ratio of
. These results clearly demonstrate that the larger the scale of private EV integration into the grid, the more pronounced the impact on the grid load characteristics.
4.3. Impact of the Hybrid Charging Strategy on Grid Load Regulation
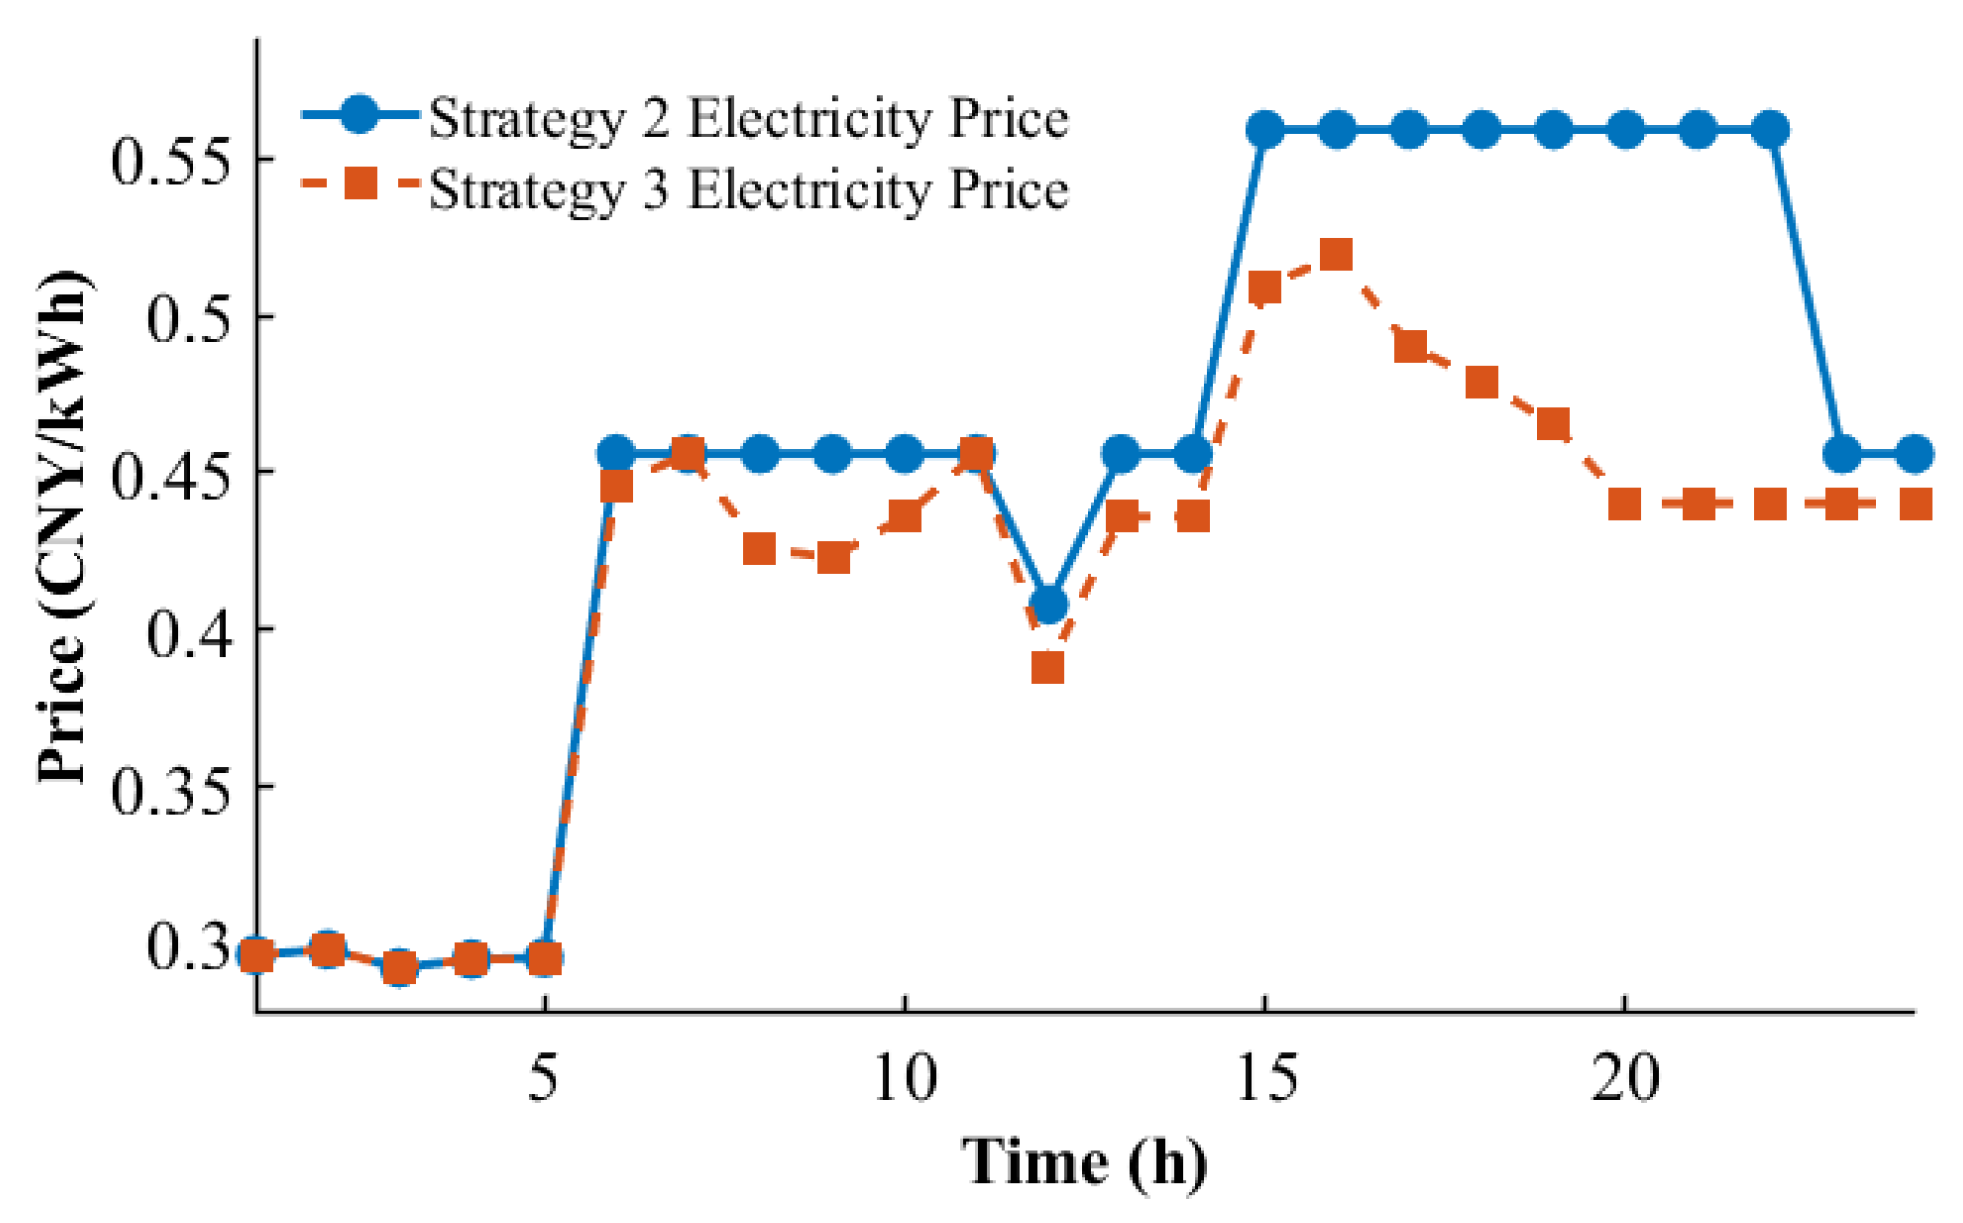
By solving the linear integer model in Equation (
31) with the parameter settings in
Section 4.1, the optimal pricing results with
Strategy 2 and
Strategy 3 are obtained and shown in
Figure 8 and
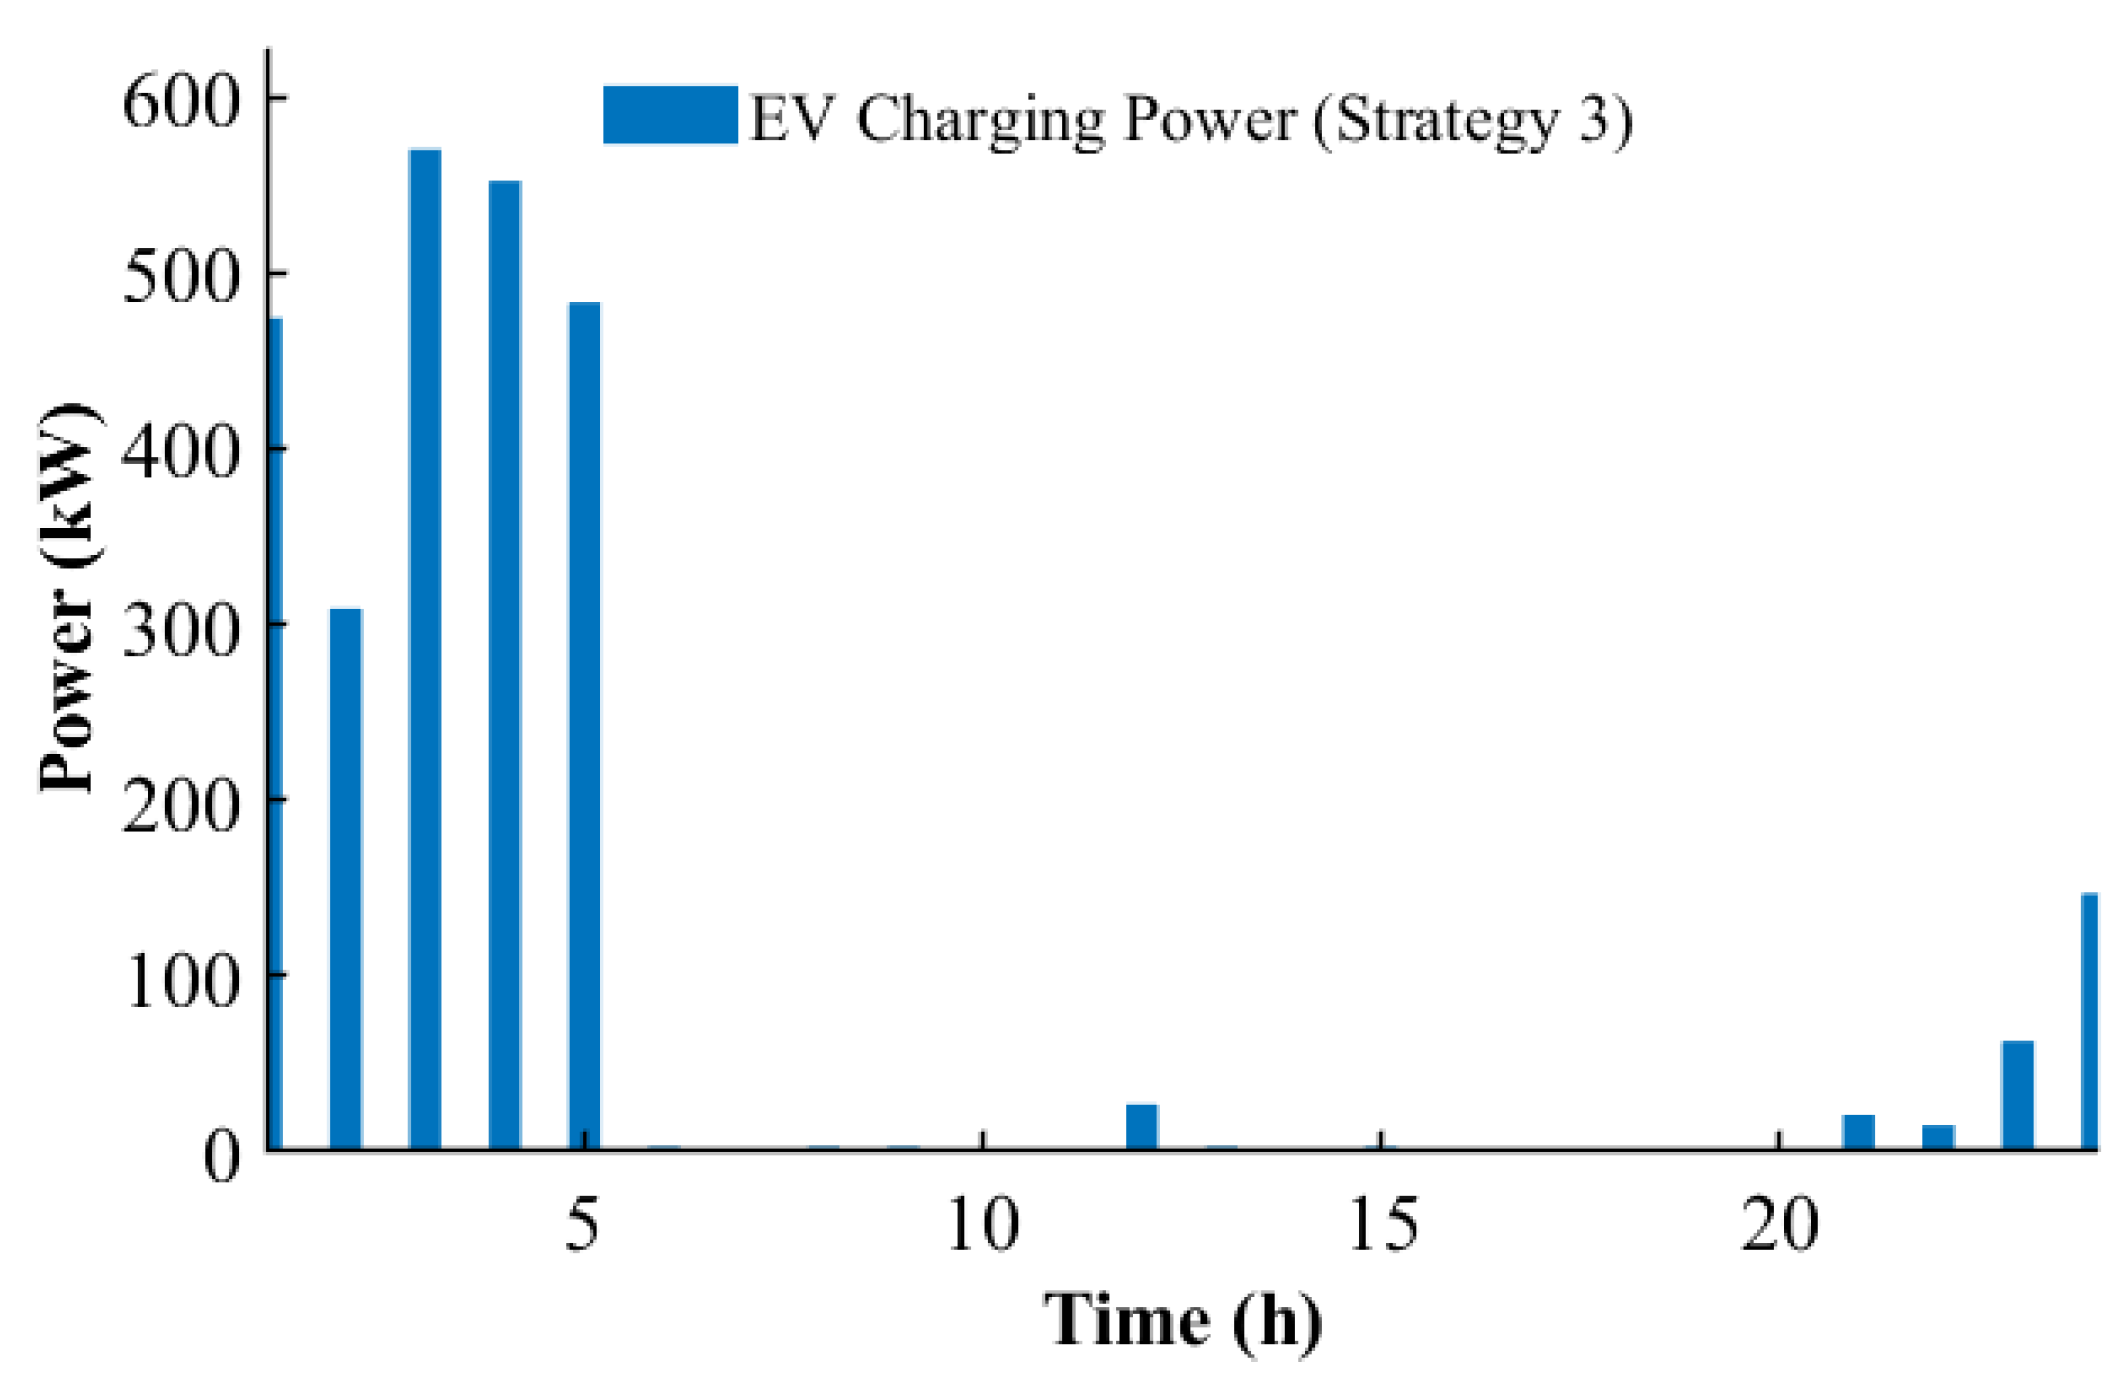
Figure 9, respectively. The required power with charging
Strategy 2 and
Strategy 3 are illustrated in
Figure 10 and
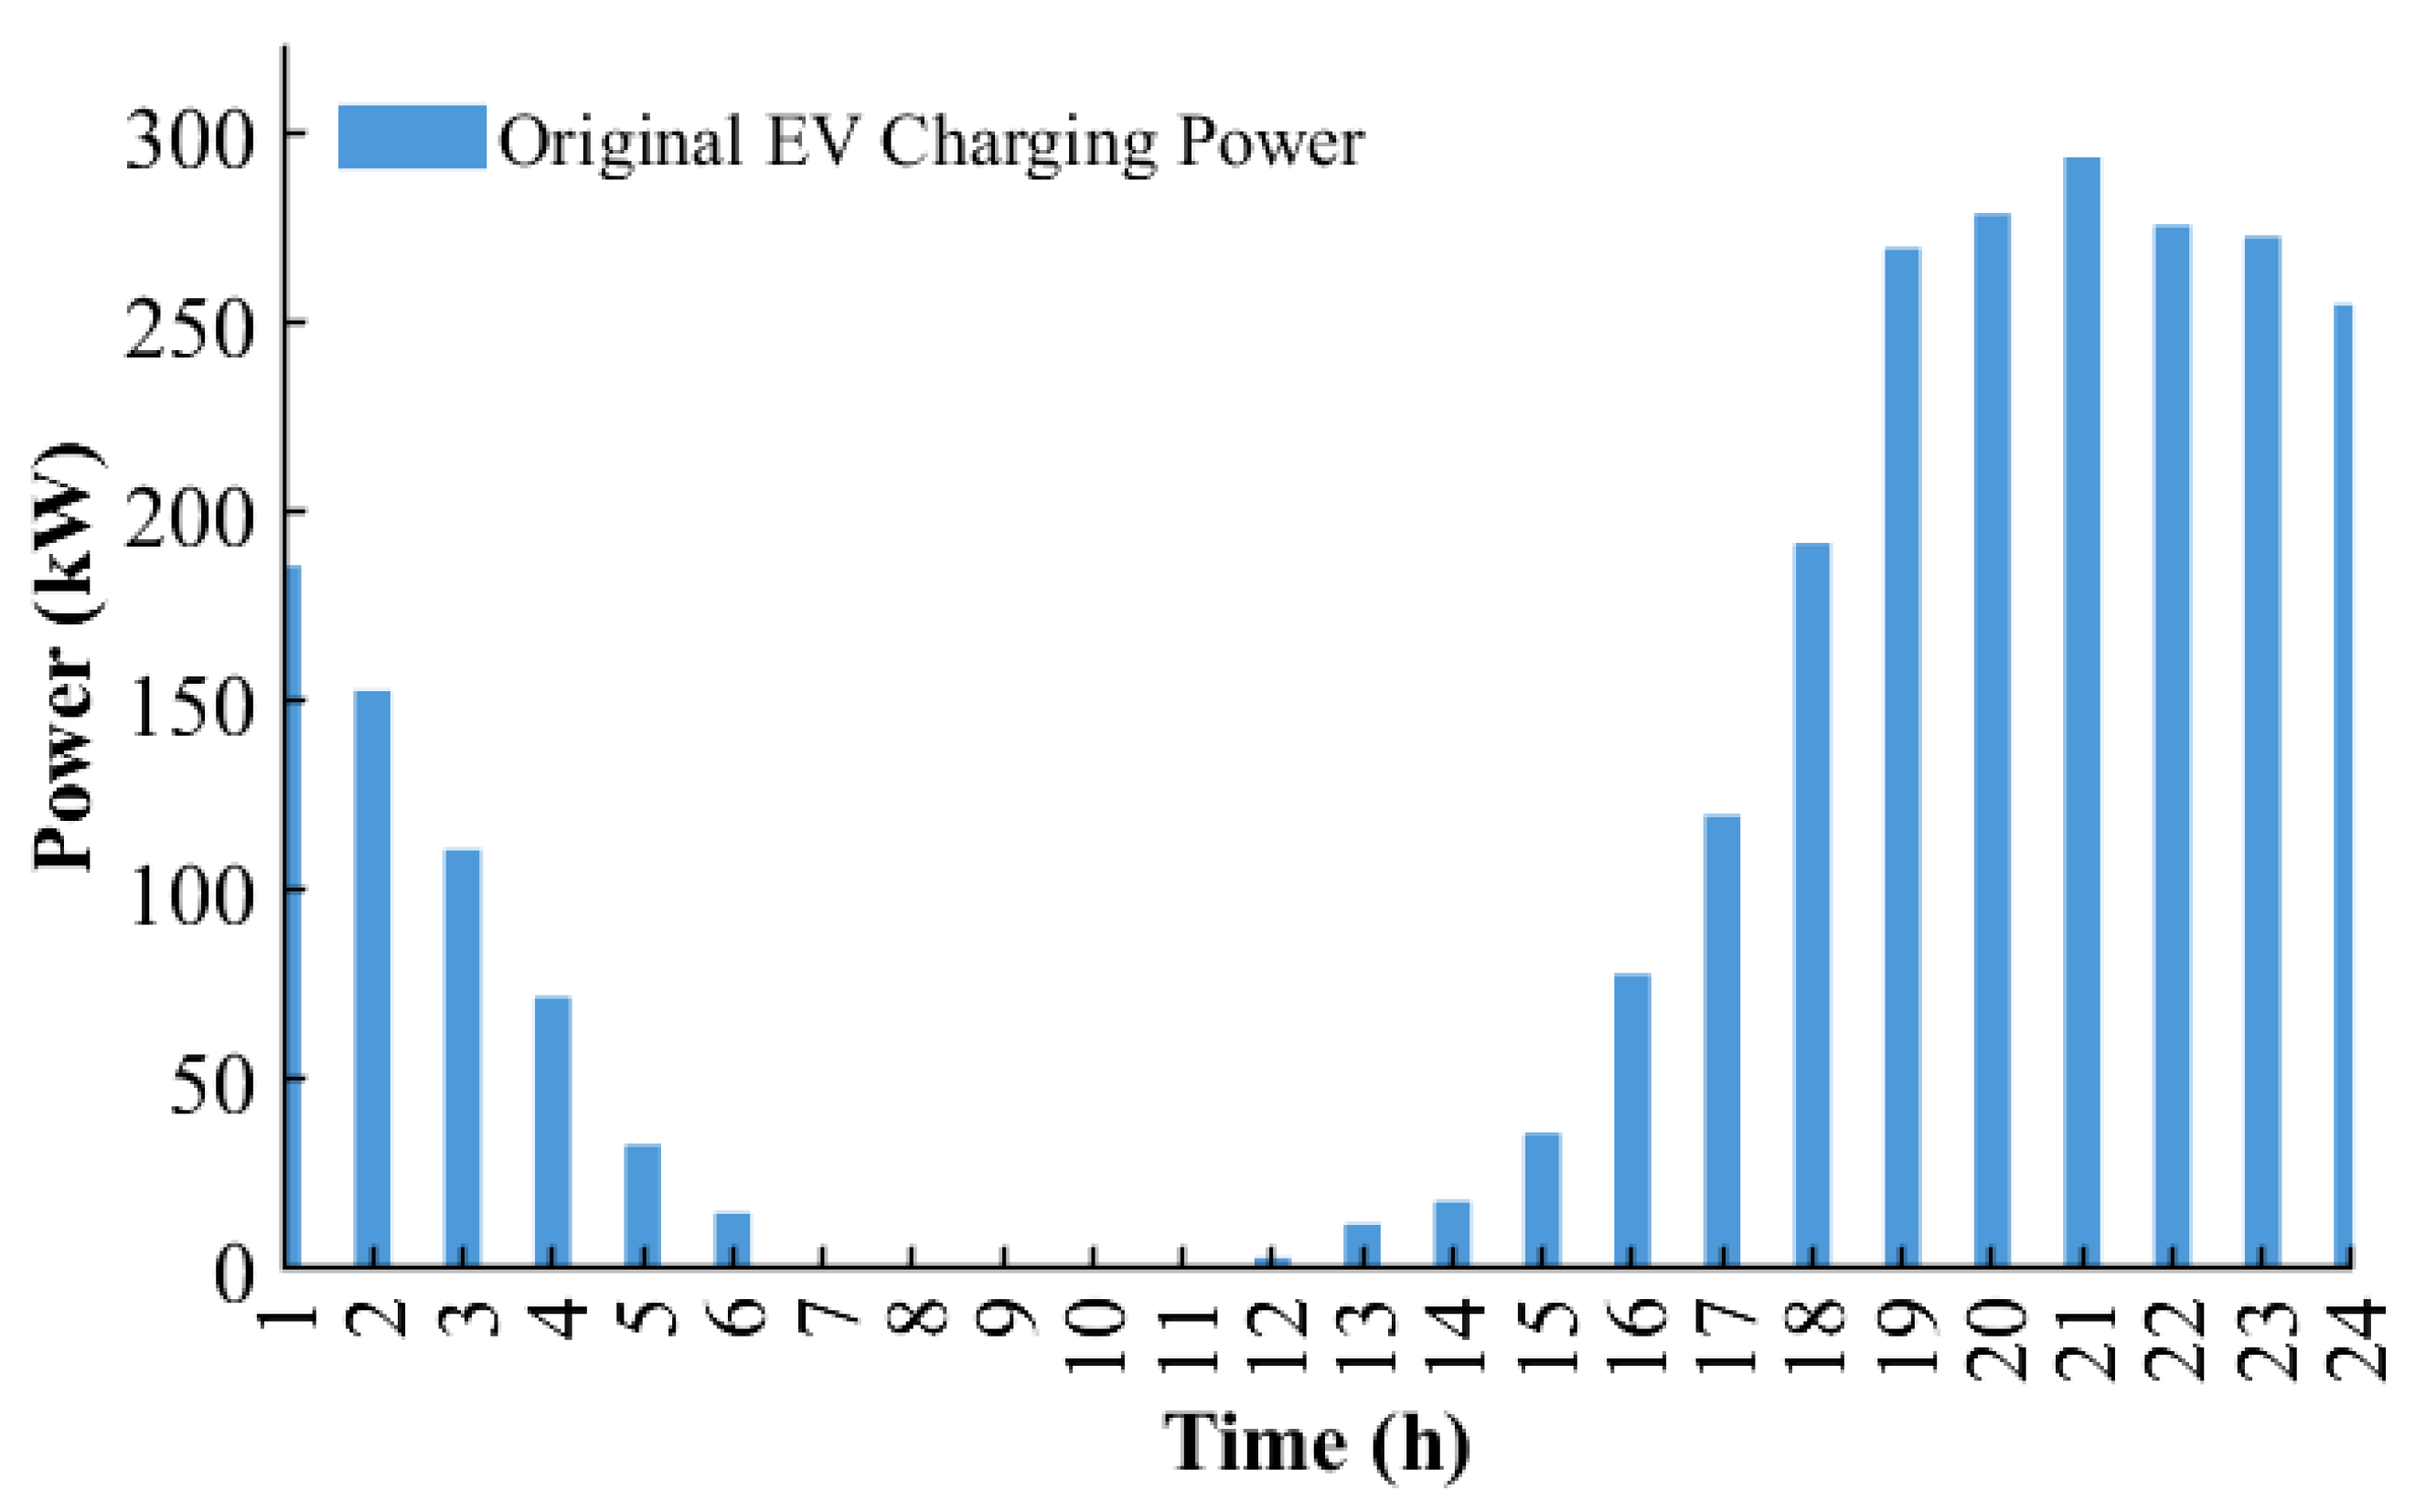
Figure 11, respectively. The required power with charging
Strategy 1 under uncoordinated EV charging access is depicted in
Figure 12.
From
Figure 10,
Figure 11 and
Figure 12, it can be observed that under
Strategy 1 (free charging scenario), the charging time is primarily concentrated between 18:00 and 24:00. In contrast, under
Strategy 2 and
Strategy 3, the charging duration is predominantly scheduled after 24:00.
After integrating the charging loads under
Strategy 1,
Strategy 2 and
Strategy 3 into the power grid, the resulting grid load profiles are shown in
Figure 13. Compared with
Strategy 1, the load variance under
Strategy 2 is reduced by
, while the load variance under
Strategy 3 is reduced by
. These results demonstrate that the proposed pricing strategy is effective in alleviating grid load pressure. However, after introducing carbon market trading, the load regulation effect of the grid is weakened compared to
Strategy 2. This is likely due to the pursuit of maximum carbon revenue, leading EV users to charge as much as possible without considering the optimal charging time.
4.4. Impact of the Hybrid Charging Strategy on Emergency Charging Service
To verify whether the emergency charging strategy meets the urgent charging demand of EV users, the performance is calculated via Equation (
5). Based on this metric, the satisfaction of EV users with the charging service can be classified into five levels, as shown in
Table 1. The EV charging service performances under
Strategy 1 and
Strategy 2 are listed in
Table 2.
4.5. Advantages of the Integrated Electricity–Carbon Trading Market
From
Figure 7 and
Figure 8, it can be seen that the optimal pricing under
Strategy 3 is relatively flat, since the CS revenue is no longer solely dependent on the electricity sales. With the incorporation of carbon revenue, the reduction in the direct charging income can be compensated for by the carbon trading gains. After participating in the carbon market, EV users prioritize not only charging when prices are lower but also purchasing electricity from renewable sources to earn carbon revenue.
As shown in
Table 3, the total revenue of the CS under
Strategy 3 is approximately
higher than that under
Strategy 2, although the charging revenue decreases slightly. With the incorporation of carbon revenue, the CS is more inclined to purchase additional electricity in the day-ahead market even at higher prices to maximize its participation in the integrated electricity–carbon trading market. Due to the increased power demand of the CS, electricity will be purchased during the peak pricing periods, leading to a rise in power costs. However, more costs would be incurred from the effort to obtain higher carbon trading revenue, so the profit of the cs still increases in total.
Further, the three designed charging strategies are compared, i.e., uncoordinated charging, coordinated charging, and coordinated charging with carbon–revenue consideration, and the results are listed in
Table 4. It can be seen that the load variance is the highest under uncoordinated charging, and it can also be greatly reduced with the introduction of the price-based coordination mechanism with a flat load profile, but decreased CS revenue. When the carbon trading mechanism is further incorporated, the total revenue is significantly increased due to the additional income from carbon allowances. At the same time, the load is slightly fluctuating compared with that of the only coordination mechanism, but still with a more practical perspective.
It should be acknowledged that the experiments still have limitations. The EV charging load is generated via a Monte Carlo simulation, which may not fully capture the variability observed in real-world settings, and certain practical costs associated with carbon trading have not been fully incorporated. Besides, the battery degradation cost is represented by a simplified linear model, whereas the SOC in practice is affected by multiple coupled factors, such as temperature and charging conditions. Despite these simplifications, the overall findings consistently support the feasibility and applicability of the proposed pricing mechanism.
