Systematic Review

A Structured Review of IoT-Based Embedded Systems and Machine Learning for Water Quality Monitoring

by
Eduardo C. Vicente
1,
Luis Augusto Silva
2,*,
Anita M. da Rocha Fernandes
1 and
Wemerson D. Parreira
3
1
Polytechnic School, University of Vale do Itajaí, Uruguai St., n. 458, Itajaí 88302-901, SC, Brazil
2
Department of Computer Science, Faculty of Science, Universidad de Salamanca, 37008 Salamanca, Spain
3
Faculty of Electrical Engineering, Polytechnic School, Pontifical Catholic University of Campinas, Prof. Dr. Euryclides de Jesus Zerbini St., n. 1516, Campinas 13087-571, SP, Brazil
*
Author to whom correspondence should be addressed.
Appl. Sci. 2025, 15(21), 11719; https://doi.org/10.3390/app152111719
Submission received: 9 September 2025 / Revised: 22 October 2025 / Accepted: 30 October 2025 / Published: 3 November 2025
(This article belongs to the Special Issue Advanced IoT/ICT Technologies in Smart Systems)

Abstract

This paper presents the results of a structured scoping review (SSR) that explores the integration of the Internet of Things (IoT) and embedded systems in creating a sustainable and interconnected technological ecosystem. The study focuses on water quality monitoring, an area where these technologies have demonstrated significant potential. The SSR follows a meticulous methodology, covering planning, execution, and documentation stages to ensure a comprehensive and unbiased review of the existing literature. Key research questions guide the review, focusing on extracting and analyzing water sample characteristics, using machine learning algorithms for classification, and the technologies utilized in these systems. The search process involved multiple databases, yielding 343 articles, of which 8 met the stringent inclusion and exclusion criteria. The review highlights the widespread use of IoT for real-time data collection and artificial intelligence (AI) for analyzing complex patterns in water quality data. Our findings underscore the significance of temperature, pH, turbidity, and conductivity, commonly utilized in water classification. In addition, prevalent machine learning techniques for analyzing water quality data include K-Nearest Neighbors (KNN) and artificial neural networks (ANN). Despite the advances, challenges such as implementation costs, connectivity in remote areas, and the interpretability of AI models remain. This review underscores the transformative potential of IoT and AI in water quality monitoring, with implications for ensuring safe drinking water and sustainable water resource management.

1. Introduction

In recent years, water monitoring has become a global priority due to the growing scarcity and degradation of freshwater resources. According to the United Nations World Water Development Report (2023), between two and three billion people experience water shortages for at least one month per year, and nearly 1.8 billion could face absolute water scarcity by 2025 [1]. The combined effects of climate change, urban expansion, and agricultural demand have intensified pressure on surface and groundwater quality [2]. Consequently, effective water management requires continuous, high-resolution monitoring to support decision-making in supply, sanitation, and environmental protection. These demands make water monitoring a strategic and high-impact domain for IoT applications [3,4,5,6], where connected sensing and analytics can enhance both spatial coverage and temporal responsiveness.
At the same time, society is experiencing significant technological advancements across various fields such as communication, processing, wearable devices, security, etc. With the number of devices used daily, the need for integration between them for communication and data sharing is growing. This exchange of information between devices forms an increasingly vast and interconnected technological ecosystem in a globalized world. The harmonious integration of technological advancement and human values is a great challenge in building a sustainable and beneficial future for all of society [7,8].
An intelligent environment refers to how devices are interconnected and information exchange is carried out. According to [9], several Internet-enabled connected devices characterize the IoT. These “things” range from small objects to environments and cities and can communicate with each other and, consequently, with the humans in the ecosystem. The IoT field stands out in the use of embedded systems. An embedded system is an application designed for a specific purpose or part of something larger, easily implemented in processors and microprocessors [10].
Embedded systems are dedicated computing units designed to execute a bounded set of functions under tight constraints of energy, memory, computation, and real-time determinism. Typical nodes rely on low-power microcontrollers (8–32-bit), limited RAM/flash, and interrupt-driven I/O to interface with analog and digital sensors (e.g., ADC, I2C, SPI, UART). In water-monitoring deployments, additional challenges arise: long unattended operation, rugged enclosures and ingress protection, sensor calibration and drift compensation, time synchronization, and fault-tolerant storage. Duty-cycling, edge preprocessing (denoising, compression, feature extraction), and secure over-the-air updates are recurrent design patterns to meet lifetime and reliability goals. Compared with general-purpose computers, embedded nodes trade throughput for predictability and energy efficiency, which is essential at the edge of the network and in remote hydrological settings [10].
IoT architectures are well-suited for water resource management because they (i) increase spatiotemporal coverage with dense, distributed sensing; (ii) enable continuous, real-time observation instead of sparse grab sampling; (iii) reduce operational costs via remote telemetry and automated alerts; (iv) integrate edge nodes, gateways, and cloud/analytics to close the loop for early-warning (e.g., turbidity spikes), optimization (e.g., pump scheduling), and compliance reporting; and (v) interoperate with existing infrastructure. In rural areas, low-cost sensor nodes extend monitoring to previously under-instrumented watersheds, while in utilities, IoT supports leakage detection, potability classification, and treatment control. These characteristics make IoT a practical and scalable pathway to safer drinking water and more sustainable water resource operations [3].
While IoT technologies represent a paradigm shift toward continuous, automated data acquisition, traditional “grab sampling” remains a dominant method for water quality monitoring. This is particularly true in developing nations, where the high capital investment for advanced, widespread sensor networks can be prohibitive. National surveys in countries like Bangladesh and Nepal, for instance, have included on-site testing for contaminants as part of their data collection efforts [11]. Similarly, in resource-constrained edge connectivity–analytics stacks for IoT-based embedded systems used in areas of Colombia, Mexico, and Malawi, monitoring often relies on manual sampling protocols and accessible, low-cost field kits [12]. In community-based monitoring, as seen in India’s Jal Jeevan Mission, manual methods persist for practical reasons, such as monitoring remote or hard-to-access water bodies (e.g., alpine lakes, intermittent streams) or for periodically verifying specific, low-frequency contaminants where deploying permanent automated systems is not economically or logistically feasible.
This study aims to consolidate design evidence across the sensing–edge connectivity–analytics stack of IoT-based embedded systems for water quality monitoring. To achieve this aim, we pursued three objectives: (O1) identify which water quality parameters are most frequently instrumented in recent deployments; (O2) map the machine learning and statistical models applied to classification or prediction tasks; and (O3) compare connectivity and microcontroller choices vis-à-vis deployment contexts.
This paper is organized as follows: In Section 2, we present the methodology that guided this work. In Section 3, we present the results, and Section 4 presents the discussions. In Section 5, we conclude this work.

2. The Proposed Structured Review of the Literature

We have conducted a structured scoping review (SSR) to achieve the objectives of this study, following the stages of planning, execution, and documentation as proposed by [13]. Figure 1 presents the primary step. We also used previous works by [13,14] as a foundation for our approach. The SSR, considered a secondary study, aims to aggregate existing evidence on a research problem and identify, select, evaluate, and summarize relevant primary studies in an unbiased and repeatable manner.
Prior reviews typically emphasize either hardware/communication aspects of IoT platforms or the machine learning models used for classification. On the other hand, this SSR jointly maps parameters (e.g., pH, turbidity, temperature, conductivity) to algorithms, communications, and microcontrollers, creating a multi-dimensional roadmap that exposes design trade-offs across the full stack (sensing, edge, connectivity, and analytics). The process with search strings, inclusion/exclusion, and quality scoring standardizes data extraction through a structured form implemented in Parsifal, improving reproducibility. This integrated lens yields actionable guidance for practitioners (e.g., when Wi-Fi/ESP-class MCUs dominate, when LoRa is preferred, and which parameter sets drive classification), which we did not find consolidated in earlier surveys.
In Figure 1, the planning stages include identifying the research objective, defining research questions, and developing and evaluating the review protocol, which can be performed iteratively. The execution stage encompasses identifying primary studies, selecting studies based on inclusion and exclusion criteria, and extracting and synthesizing data. Finally, the publication stage involves specifying, formatting, and evaluating the SSR report.

2.1. Search Criteria

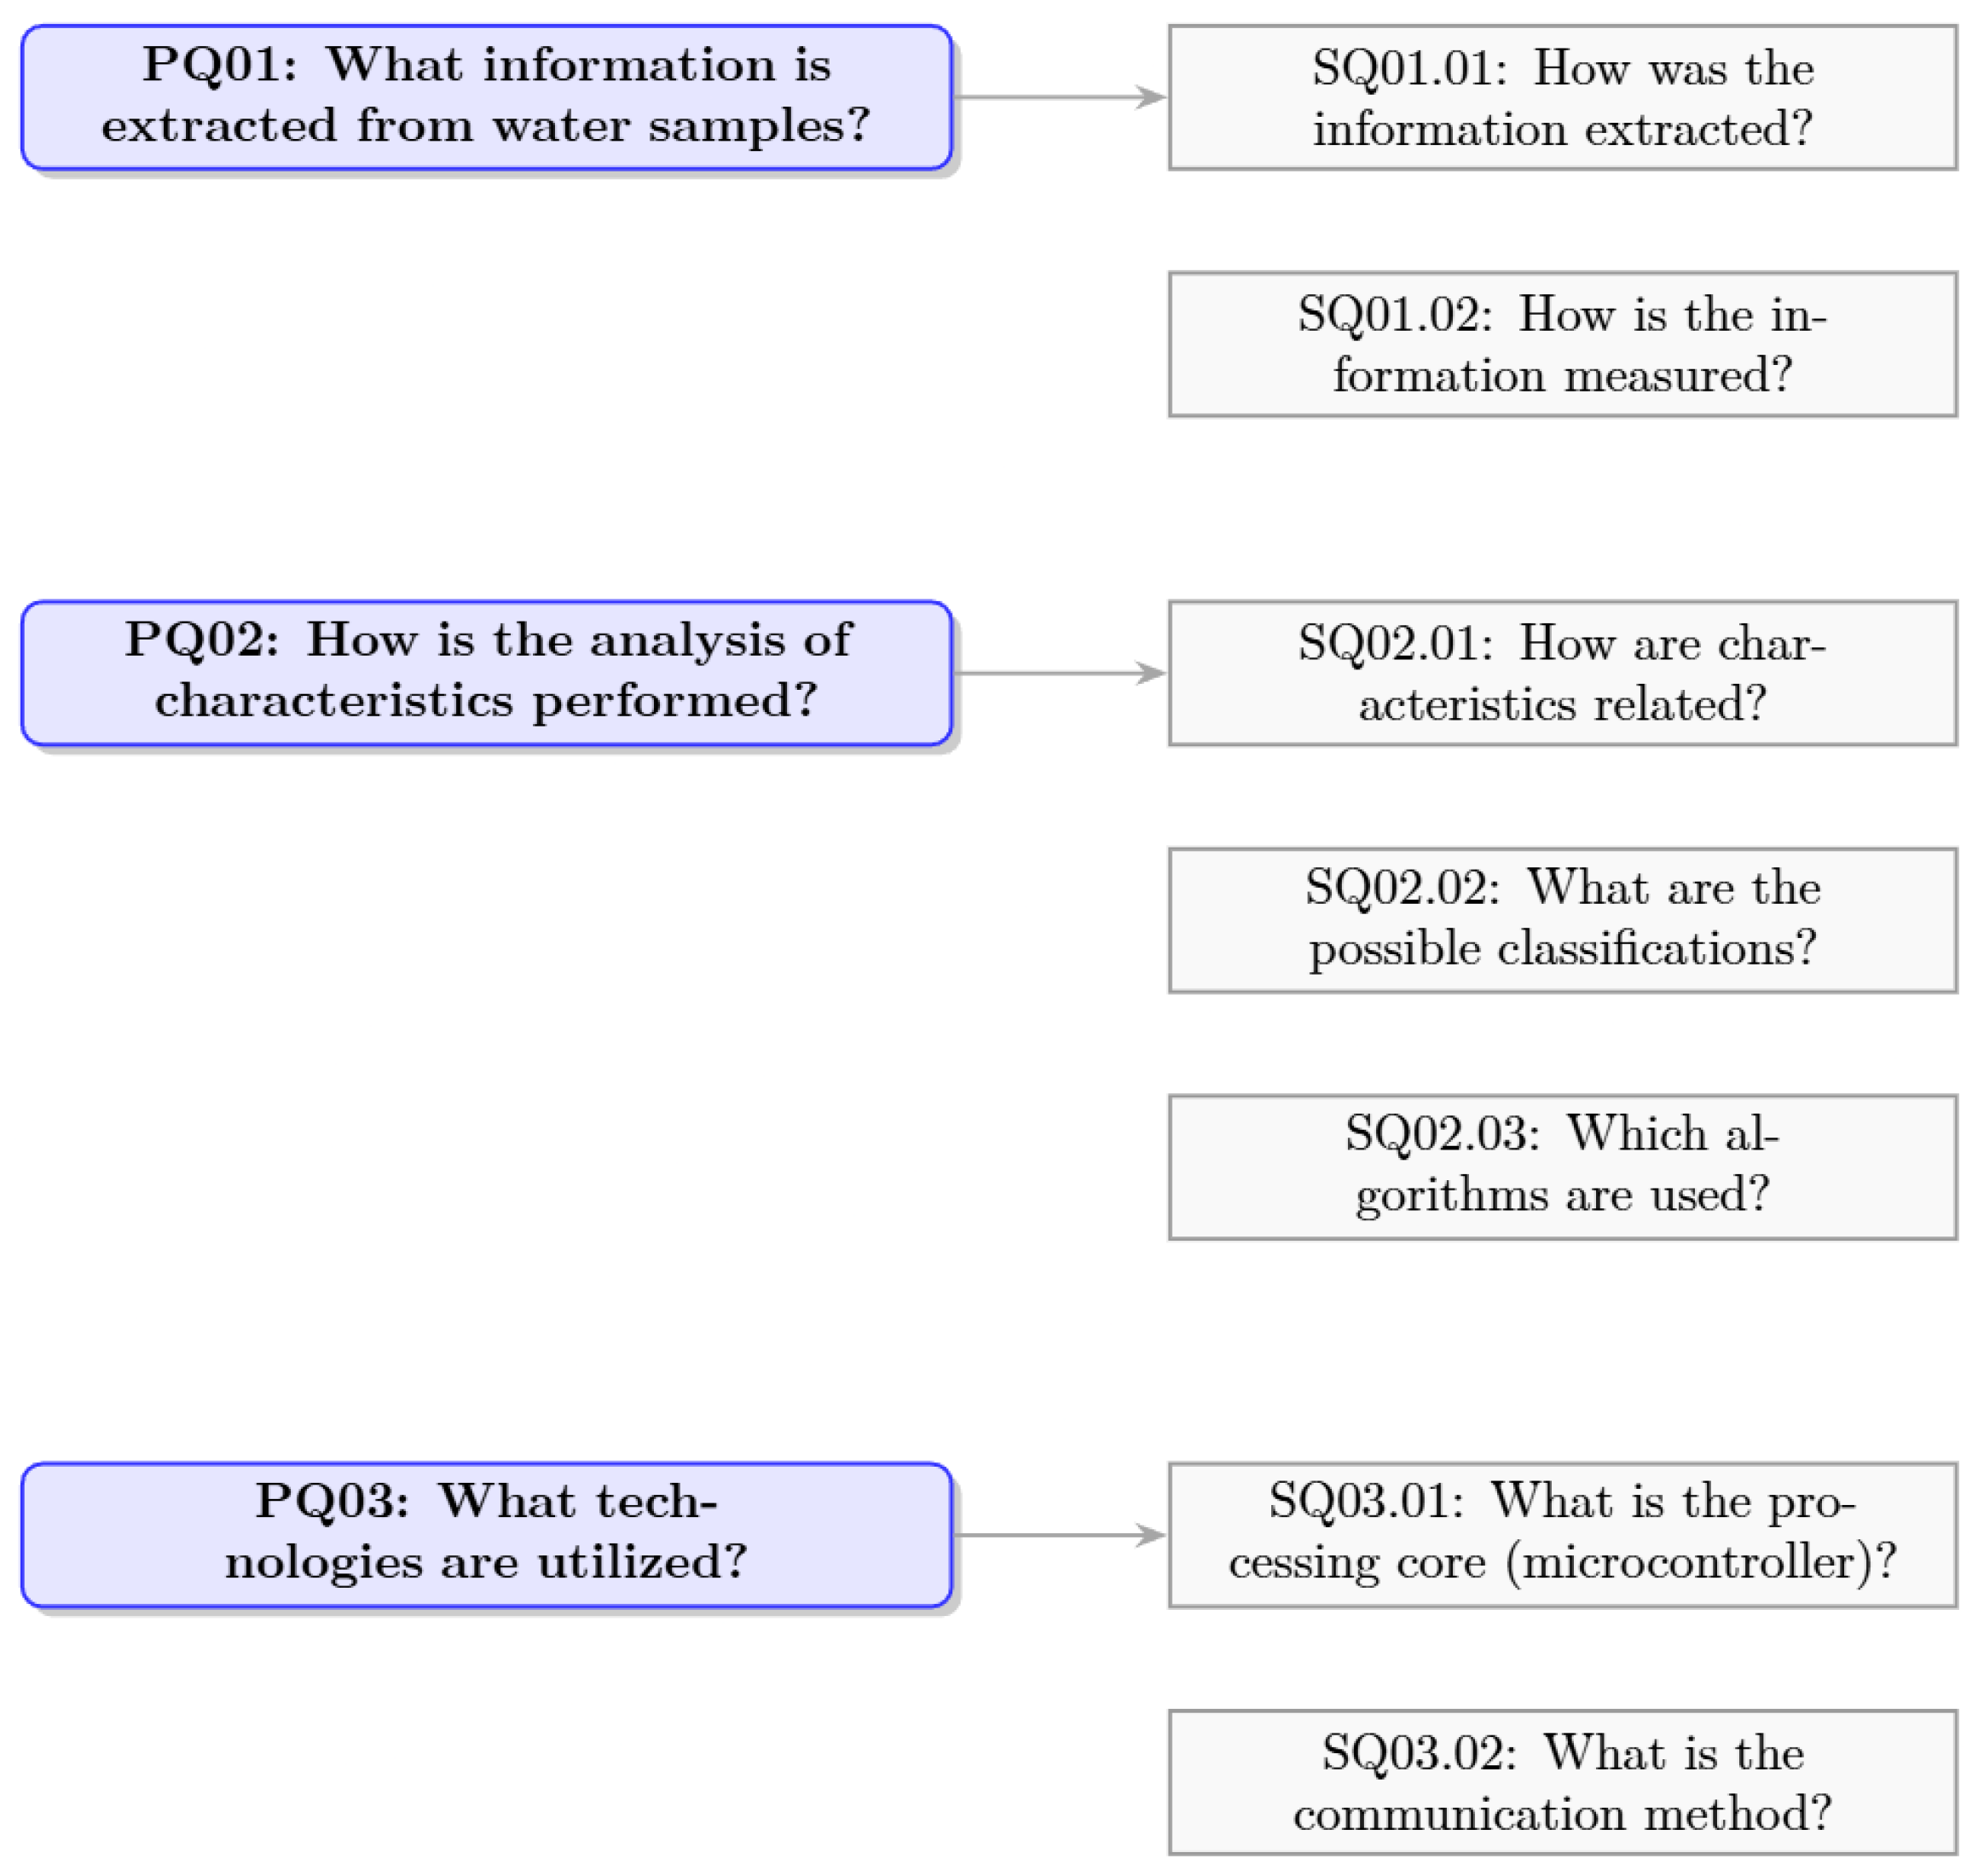
The objective of this phase was to identify the main characteristics of the water samples analyzed, the technologies used, and the algorithms applied in the context of automatic water sampling for water monitoring. To assist in addressing these primary questions (PQs), secondary questions (SQs) were also formulated as described below in Figure 2:
From the definition of the research questions, PQ01 to PQ03, we selected three search engines to find related works based on the constructed search strings. Each search engine has a different method for conducting searches, so it was necessary to define the main idea to adapt to each engine individually. Table 1 shows the search engines used and their respective access addresses.
We focused the search on finding articles with the term “water monitoring” in their title and at least one of the following words also in their title: “IoT”, “artificial intelligence”, or “smart”. Based on these definitions, search strings were constructed for each engine, as shown in Table 2.
Applying the search terms in each engine resulted in Table 3, which shows the number of articles returned by each search engine and the total number of articles found across all engines used.

2.2. Criteria and Procedures for Selecting Works

We defined transparent inclusion and exclusion criteria a priori to minimize selection bias and improve reproducibility, as summarized in Table 4. We included peer-reviewed, English-language articles (≥January 2015) that report water quality monitoring using sample-based data and apply machine learning or statistically equivalent analysis. Eligible works also describe at least two of the following IoT/embedded facets: (i) explicit sensing, (ii) a communication substrate (e.g., Wi-Fi, LoRa, cellular), and (iii) an embedded processing core (e.g., Arduino-class MCU). We excluded studies outside the water quality domain, lacking ML/statistical analysis, or without a hardware description.
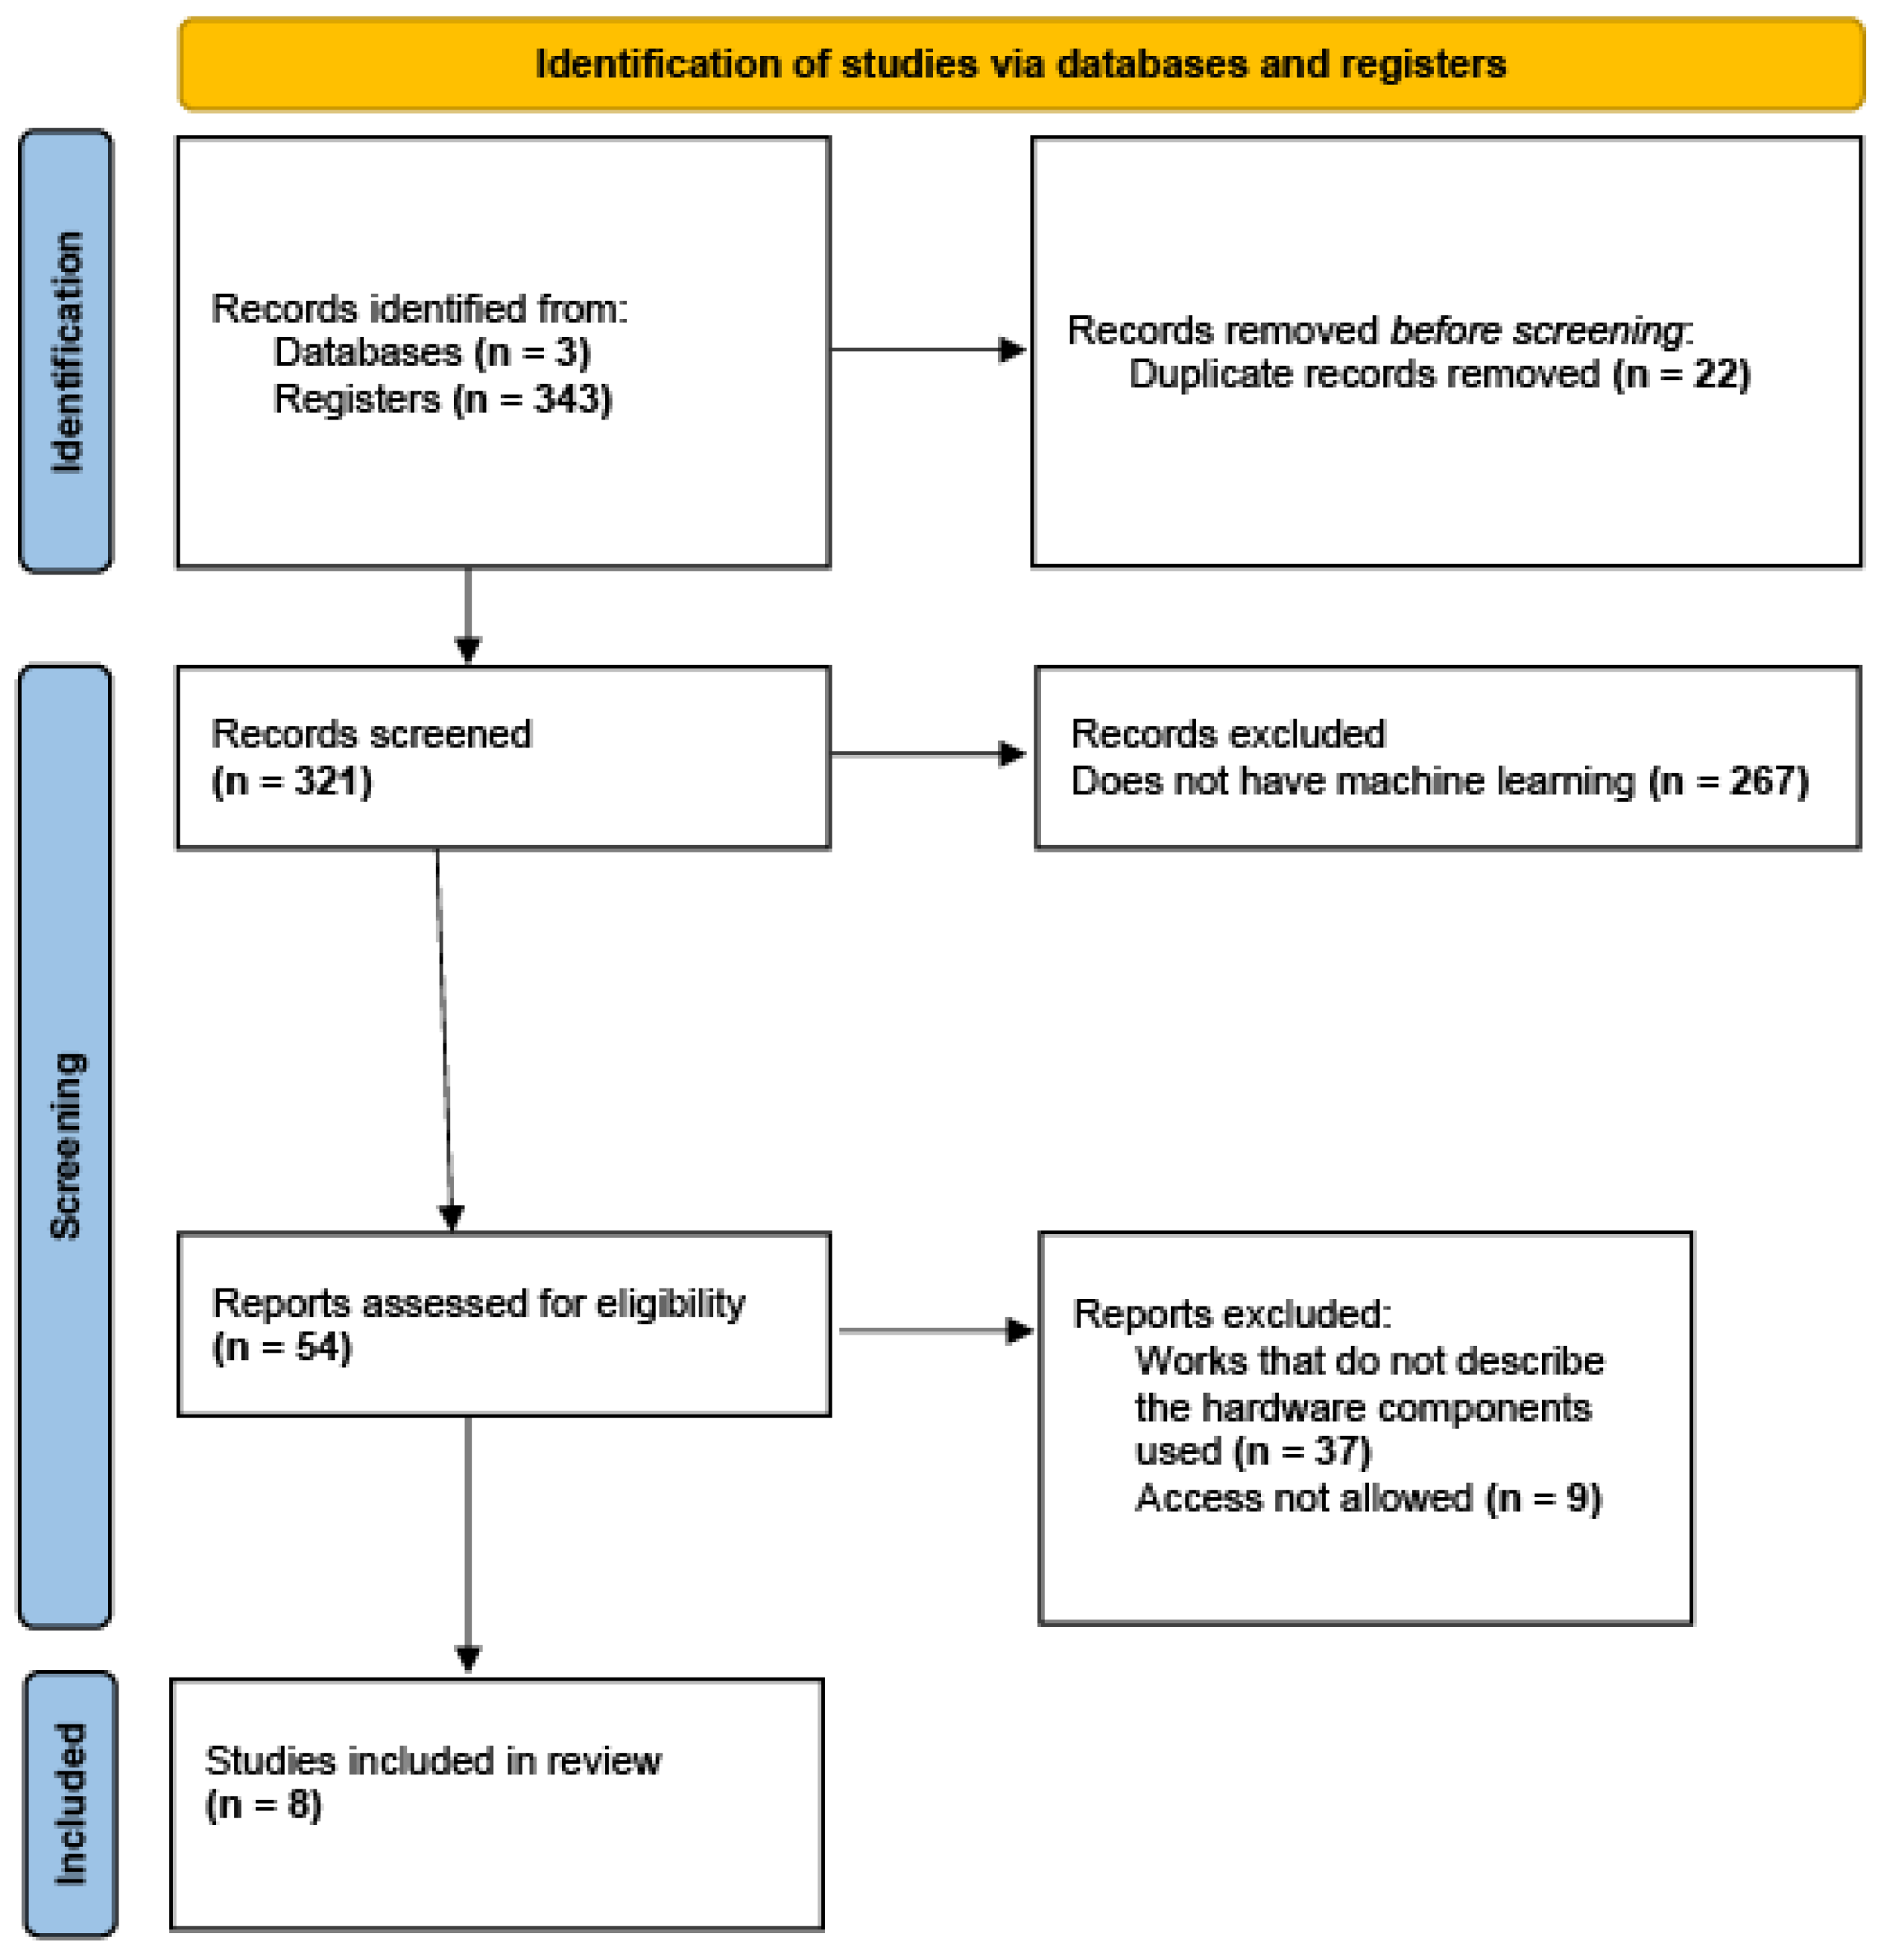
This structured scoping review was conducted following the PRISMA-ScR framework [15], which ensures transparency and reproducibility in article identification and selection. The identification, screening, eligibility assessment, and inclusion steps are depicted in the PRISMA-ScR framework flow diagram (Figure 3), which leads to the final set of eight primary studies considered in this structured mapping.

2.3. Paper Selection

In this section, we present the quality assessment of the SSR with details of the selection process of the pre-selected articles. We have conducted evaluation through a questionnaire with five questions described in Table 5. Each inquiry presents three potential responses—“yes”, “partially”, and “no”—each associated with scores of 1.0, 0.5, and 0.0. The total score of each article, calculated by summing the responses, will determine its suitability for the review, with 5.0 being the maximum score (well-suited article) and 0.0 the minimum (unsuitable article). Only articles with a score higher than 2.0 will be accepted, ensuring the quality of the data extracted in the subsequent stage and the relevance of the studies to answer the research questions. This evaluation method was implemented and applied using the Parsifal software v2.2.
Following a thorough review and assessment of all eight articles, we determined that each article scored a minimum of 2.0, meeting the required standard. Consequently, all articles have been deemed suitable for advancing to the subsequent phase of the SSR involving data extraction. The results are presented in Table 6.

2.4. Data Extraction

The data extraction methodology employed for this SSR revolves around utilizing a predetermined form integrated within the Parsifal software. After reviewing each chosen article, this form is completed, thereby facilitating the accumulation of metadata crucial for identifying studies and pertinent data required to address the stipulated research inquiries, as delineated in Table 7. Notably, data property PD1 is allocated explicitly for article delineation, whereas properties PD02 to PD05 are deemed to correspond to research inquiries PQ1 to PQ3. The Parsifal tool meticulously organizes the extracted data after our comprehensive review of the designated articles, streamlining the overall extraction process.

3. Results

This section presents a synthesis of the analysis results of the 8 articles selected for this SSR from an initial total of 343. Section 3.1 highlights the contribution of articles with scores above 2, while Section 3.3 addresses the research questions based on the extracted data. Finally, Section 4 provides an overview of the analyzed research questions’ answers.

3.1. Contribution of the Selected Articles

The analysis of the eight articles reveals a remarkable convergence in the application of the IoT and artificial intelligence (AI) to enhance water quality monitoring and management. This technological convergence is evident in all the articles, which explore different approaches and applications to ensure drinking water’s safety and water resources’ sustainability.
Real-time data collection is a central point in all studies. Various types of sensors are used to measure the physicochemical parameters of water, such as pH, temperature, turbidity, conductivity, dissolved oxygen, and specific pollutant levels, such as nitrate and phosphate. IoT plays a crucial role in connecting these sensors, enabling the transmission of data to centralized systems, which facilitates remote monitoring and real-time water quality analysis. This emphasis on real-time data collection underscores the importance of up-to-date information for making quick and effective water management decisions.
AI, mainly through machine learning techniques like artificial neural networks (ANNs), is widely used to analyze the data collected by the sensors. These techniques allow the identification of complex patterns in the data, classification of water potability, and prediction of future trends. Ref. [20] uses regression models to estimate biological indicators, while refs. [17,18] employ machine learning algorithms to analyze sensor data and detect anomalies in water quality. Ref. [5] uses ensemble learning to classify water potability, combining different algorithms to improve prediction accuracy. Ref. [19] explores advanced deep learning techniques, such as Time-Distributed Convolutional Neural Network–Long Short-Term Memory (TD-CNN-LSTM), to further enhance the accuracy of water quality prediction.
Water quality monitoring systems based on IoT and AI find applications in various areas. Ref. [20] focuses on catchment areas, while [5] develops a portable and low-cost system for rural areas where access to safe drinking water is challenging. Ref. [17] addresses monitoring at water treatment plants, and [21] proposes a system to monitor water consumption in apartments. This diversity of applications demonstrates the flexibility and potential of these technologies to be adapted to different contexts and needs.
Despite significant advances, challenges such as the costs of implementing and maintaining systems, limited connectivity in remote areas, and the need to ensure the quality of collected data still need to be addressed. The interpretability of AI models is also crucial, as it allows decision-makers to understand the factors influencing water quality and take appropriate measures.
This review reveals a dynamic and constantly evolving field of research. The combination of IoT and AI is revolutionizing water quality monitoring and management, offering innovative solutions to ensure safe drinking water, the sustainability of water resources, and public health. Continued research in these areas can significantly advance society and the environment.

3.2. Comparative Synthesis of the Selected Works

A01 [16] provides a broad review that consolidates IoT + AI applications for water quality monitoring and prediction. Its advantages are as follows: scope and synthesis across sensing, connectivity, and ANN-based analytics; and providing context to subsequent primary studies. A02 [5] conducts rural potability classification using KNN/CART/HV-NB with Zigbee and 2G/3G backhaul; parameters include pH, turbidity, TDS, and temperature. Its advantages include low-cost design targeting underserved areas with intermittent connectivity. A03 [17] addresses real-time drinking-water monitoring with KNN/DT/SVM; parameters span pH, turbidity, temperature, conductivity, and cellular-level metrics. Its advantage is that it provides multi-algorithm comparison for potability assessment in operational settings. A04 [4] performs cloud-integrated monitoring over Wi-Fi using ESP-class MCU and employs deep learning for inference; parameters include pH, temperature, and dissolved oxygen. Its advantage is its scalable architecture with seamless device–cloud integration. A05 [18] proposes a portable, field-deployable system (Arduino Uno + LoRa) for agricultural water; parameters include pH, temperature, nitrate, and phosphate, with KNN classification. Its advantage lies in providing a long-range, low-power link enabling large-area coverage without Wi-Fi. A06 [19] provides a TD-CNN-LSTM time-series model over Arduino-class edge; parameters include pH, temperature, conductivity, and flow. Its advantage involves temporal modeling that captures dynamics beyond static thresholds. A07 [20] conducts catchment-scale analysis using zero-inflated models (ZIP/ZINB) on microbiological and optical parameters (e.g., coliforms, E. coli, color). Its advantage is its statistically principled handling of excess zeros in environmental counts. A08 [21] utilizes a Wi-Fi + Arduino Mega system for automated usage/flow monitoring with ANN-based analytics. Its advantage lies in its emphasis on consumption patterns, enabling demand-side management.
Collectively, these studies span household, agricultural, and watershed contexts. Their complementary emphases on connectivity choices, embedded platforms, and applied algorithms reveal design trade-offs across application domains. A comprehensive synthesis of these characteristics is presented in Table 8, while the frequency patterns are further detailed in Table 9, Table 10, Table 11 and Table 12 and Figure 4, Figure 5, Figure 6 and Figure 7.

3.3. Answers to the Research Questions

This section presents the answers to the defined research questions. The questions were discussed in a manner that addresses only the primary question rather than its sub-questions (e.g., QP01.1), as the central question encompasses the subjects covered in its sub-questions.
  • RQ 01: What are the main extracted water sample parameters for classifying a water body?
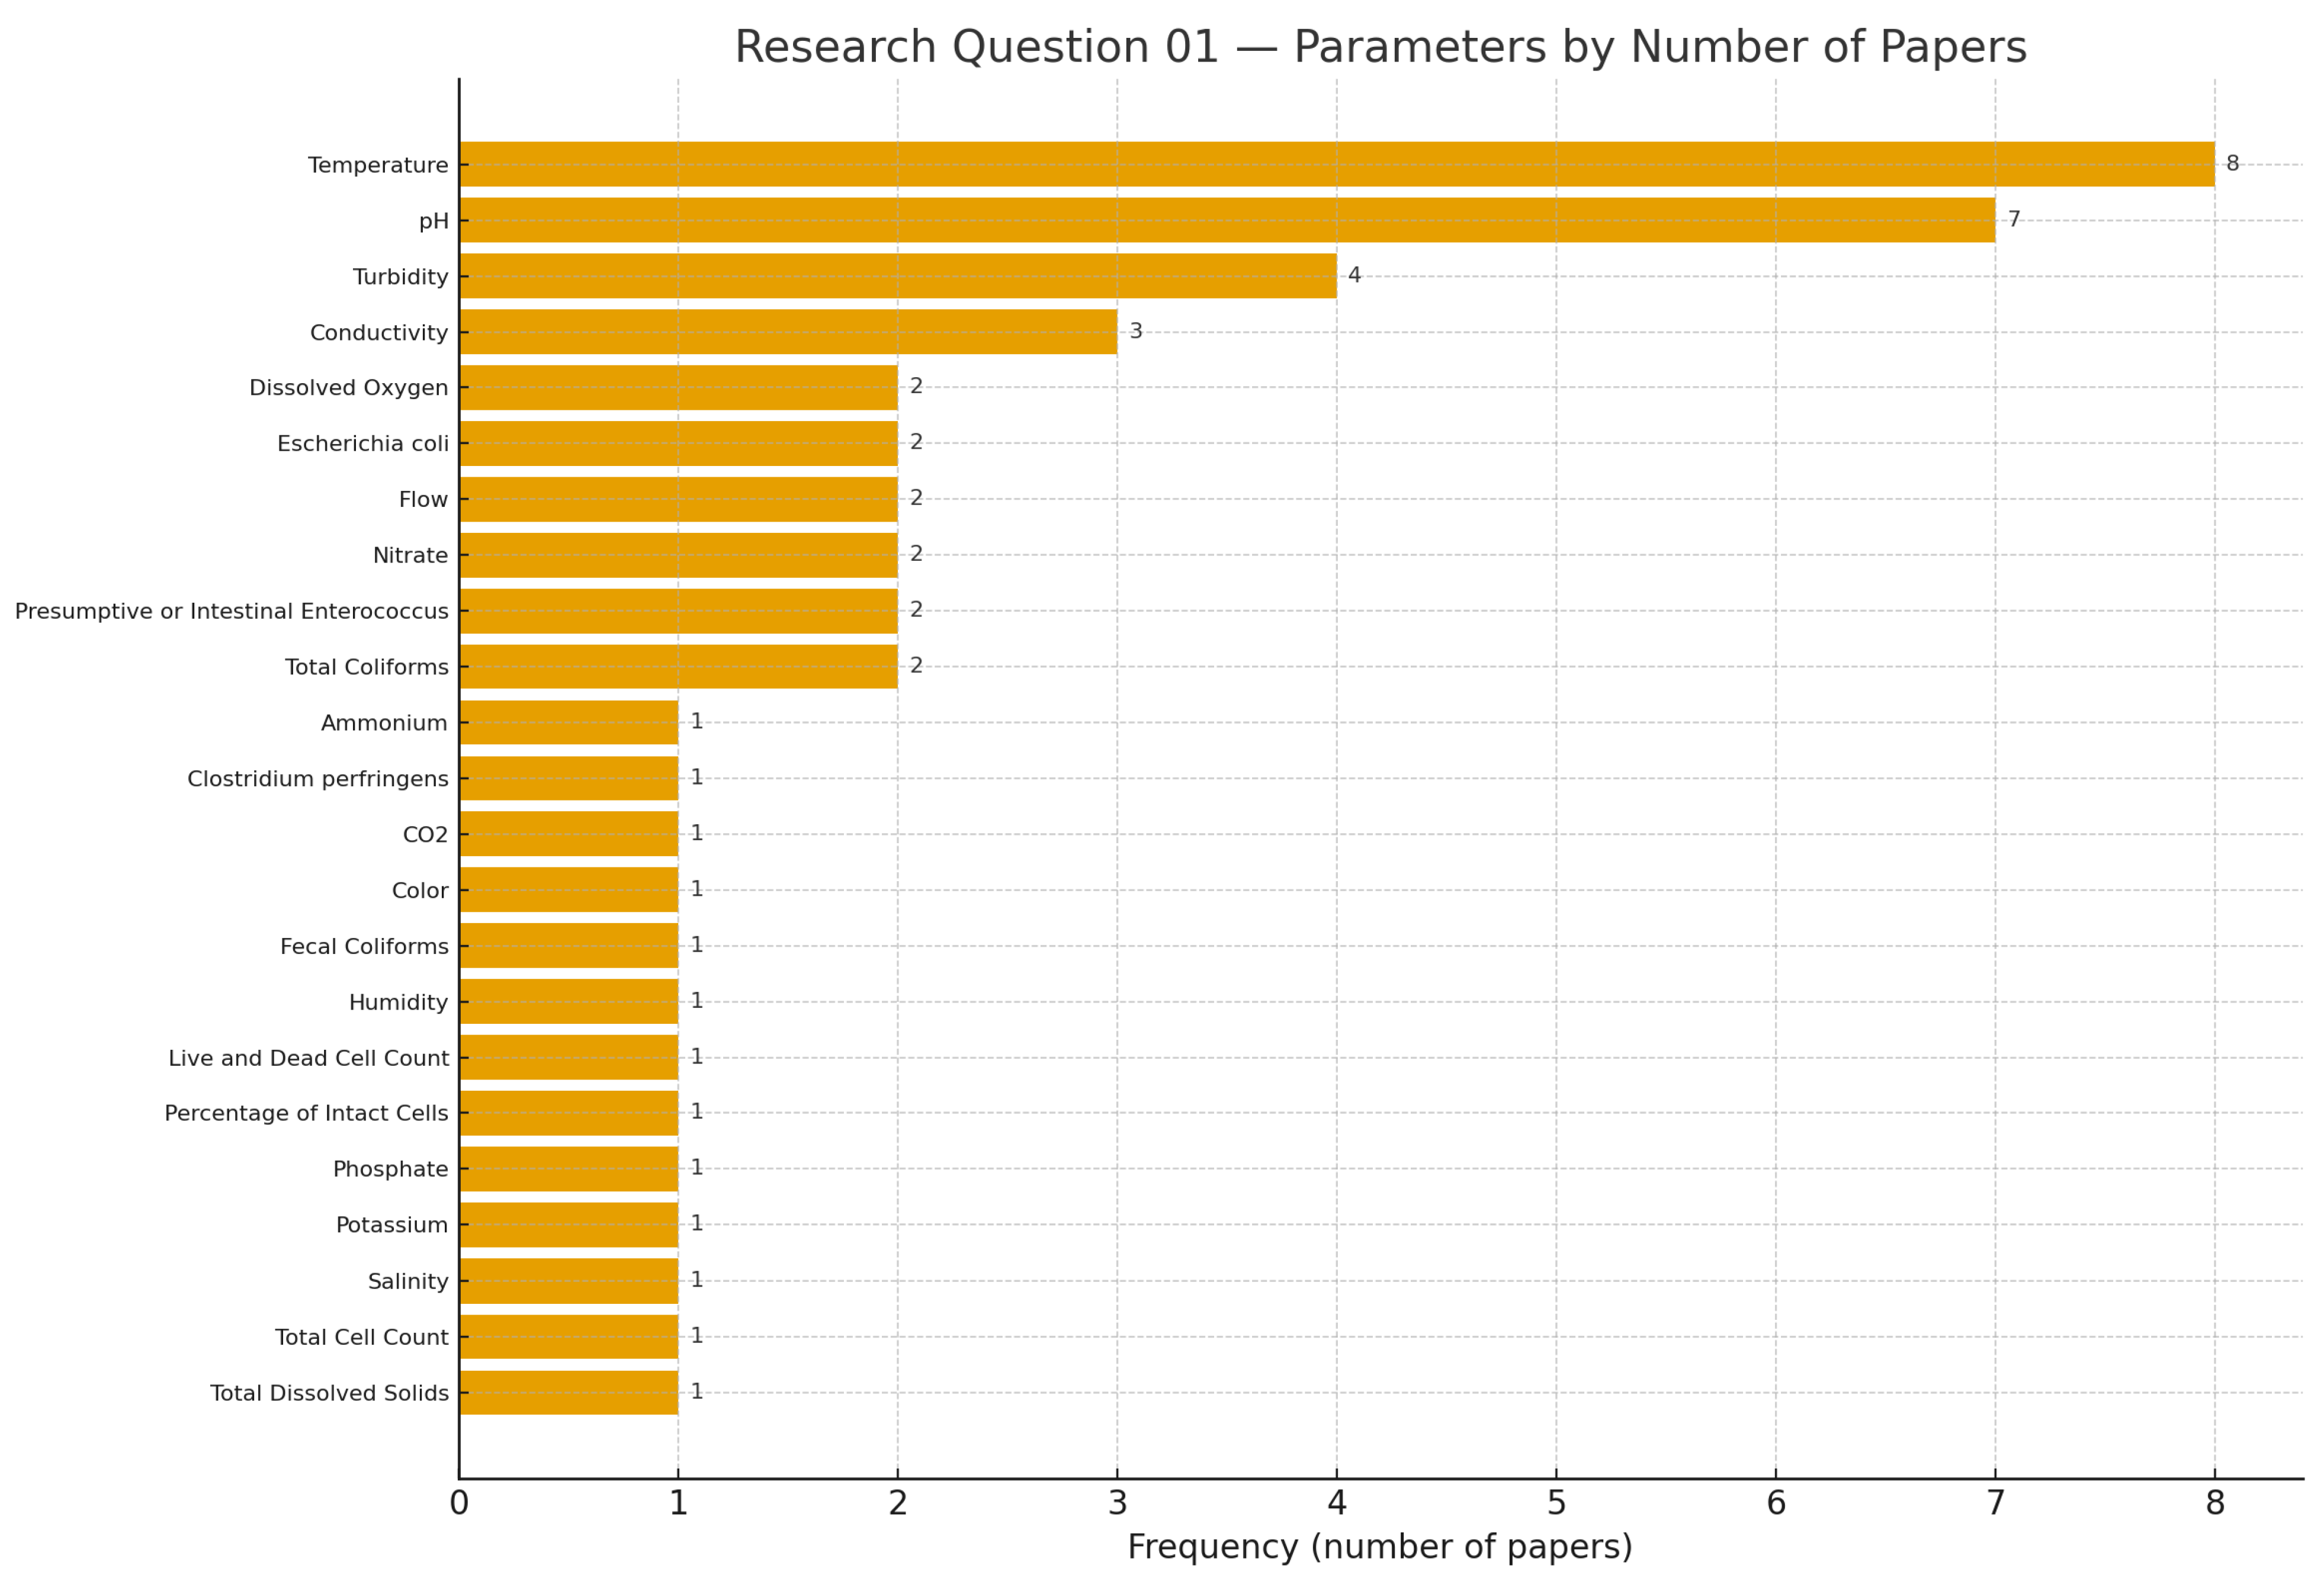
The articles presented a wide variety of parameters extracted from water samples, as shown in Table 9, with many present in only one or two articles. The parameters that stood out the most were temperature, pH, turbidity, and conductivity, representing usage of 100%, 87.5%, 50%, and 37.5%, respectively.
Table 9. Research Question 01.
ParameterPaper
pHA01, A02, A03, A04, A05, A06, A07
TurbidityA01, A02, A03, A07
Total Dissolved SolidsA02
TemperatureA01, A02, A03, A04, A05, A06, A07, A08
ConductivityA01, A03, A06
SalinityA01
Dissolved OxygenA01, A04
Fecal ColiformsA01
Total ColiformsA01, A07
Escherichia coliA01, A07
Presumptive or Intestinal EnterococcusA01, A07
AmmoniumA03
NitrateA03, A05
PotassiumA03
Live and Dead Cell CountA03
Total Cell CountA03
Percentage of Intact CellsA03
CO2A04
HumidityA04
PhosphateA05
FlowA06, A08
Clostridium perfringensA07
ColorA07
The additional parameters have also demonstrated significant importance in the monitoring process. However, the specific parameters required vary depending on the application and the intended use of the analyzed water. A comprehensive analysis is necessary to ascertain whether these parameters enhance the application. Consequently, emphasis is generally placed on the most frequently utilized parameters, encompassing a broader spectrum of applications. Figure 4 represents the frequency of appearance among the articles analyzed
Temperature, pH, turbidity, and conductivity recur across studies because they are (i) fundamental physical–chemical indicators that proxy broad classes of contamination and treatment efficacy; (ii) inexpensive to sense with mature, commercially available probes; (iii) relatively straightforward to calibrate and maintain in field conditions; and (iv) widely incorporated by regulatory indices and operational heuristics used by utilities. In addition, temperature modulates solubility and reaction kinetics; pH captures acid–base balance affecting corrosion, disinfection, and bioavailability; turbidity reflects particulate load and is an early-warning proxy for runoff and microbial risk; and conductivity tracks ionic strength and salinity, correlating with TDS and intrusion events [22,23,24,25,26]. These variables offer high signal-to-effort ratios for automated classification, which explains their prevalence in Table 9.
Figure 4. Frequency of occurrence of the parameters in the analyzed articles.
Applsci 15 11719 g004
  • RQ 02: How is the analysis of accumulated characteristics conducted to classify the current state of the water sample being analyzed?
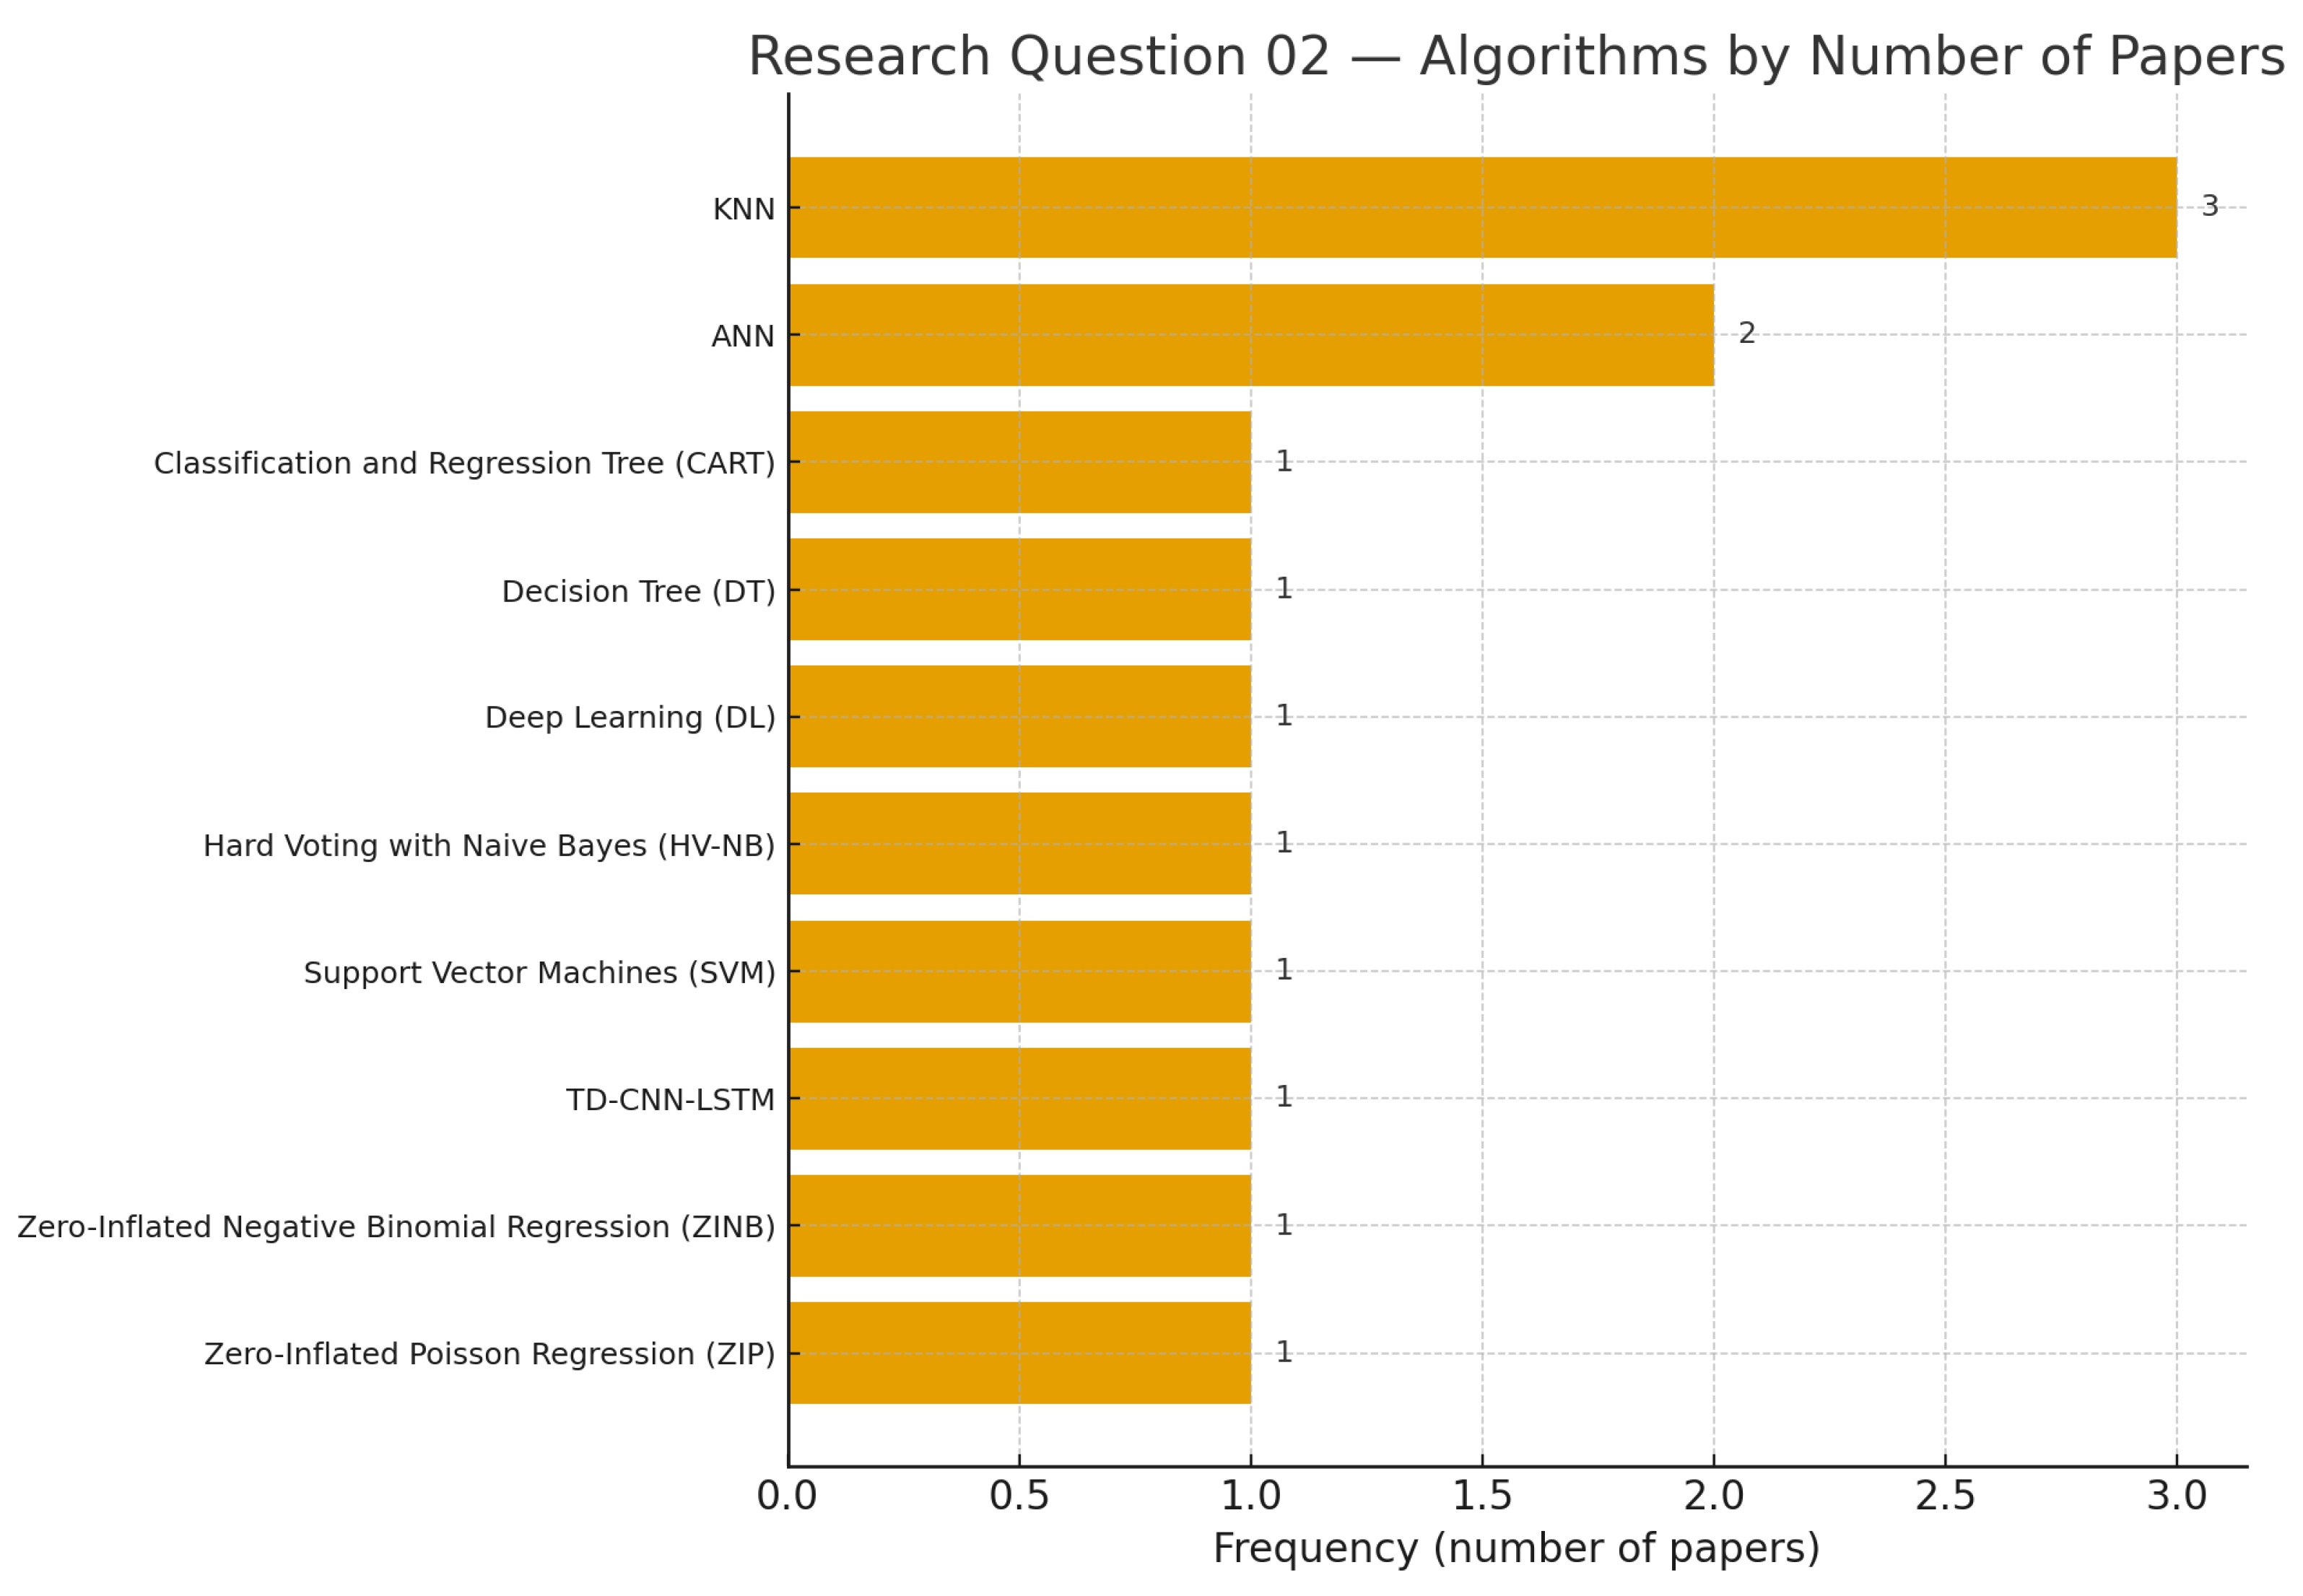
Regarding the machine learning algorithms used for data analysis, two methods stand out in terms of frequency, namely K-Nearest Neighbors (KNN) and artificial neural networks (ANNs), representing usage of 37.5% and 25%, respectively. The other articles presented various other artificial intelligence algorithms (listed in Table 10) and their respective strengths and weaknesses. However, it is noted that the most commonly used techniques (shown in order of use in Figure 5 chart) tend to be more robust and have a wider variety of applications and destinations for analyses.
Once again, it is essential to emphasize that selecting techniques is contingent upon the specific application. While certain methods may be less pervasive, they may offer heightened relevance in particular contexts. For instance, the “Classification and Regression Tree” and “Decision Tree” methods are predominantly applied in scenarios where pre-established classification rules prevail.
Table 10. Research Question 02.
AlgorithmPaper
Zero-Inflated Poisson Regression (ZIP)A07
Zero-Inflated Negative Binomial Regression (ZINB)A07
TD-CNN-LSTMA06
KNNA02, A03, A05
Deep Learning (DL)A04
Decision Tree (DT)A03
Support Vector Machines (SVsM)A03
ANNA01, A08
Classification and Regression Tree (CART)A02
Hard Voting with Naive Bayes (HV-NB)A02
Figure 5. Frequency of use of algorithms.
Applsci 15 11719 g005
  • RQ 03: What technologies are used?
Two factors were analyzed among the technologies: the form of communication and the microcontroller used.
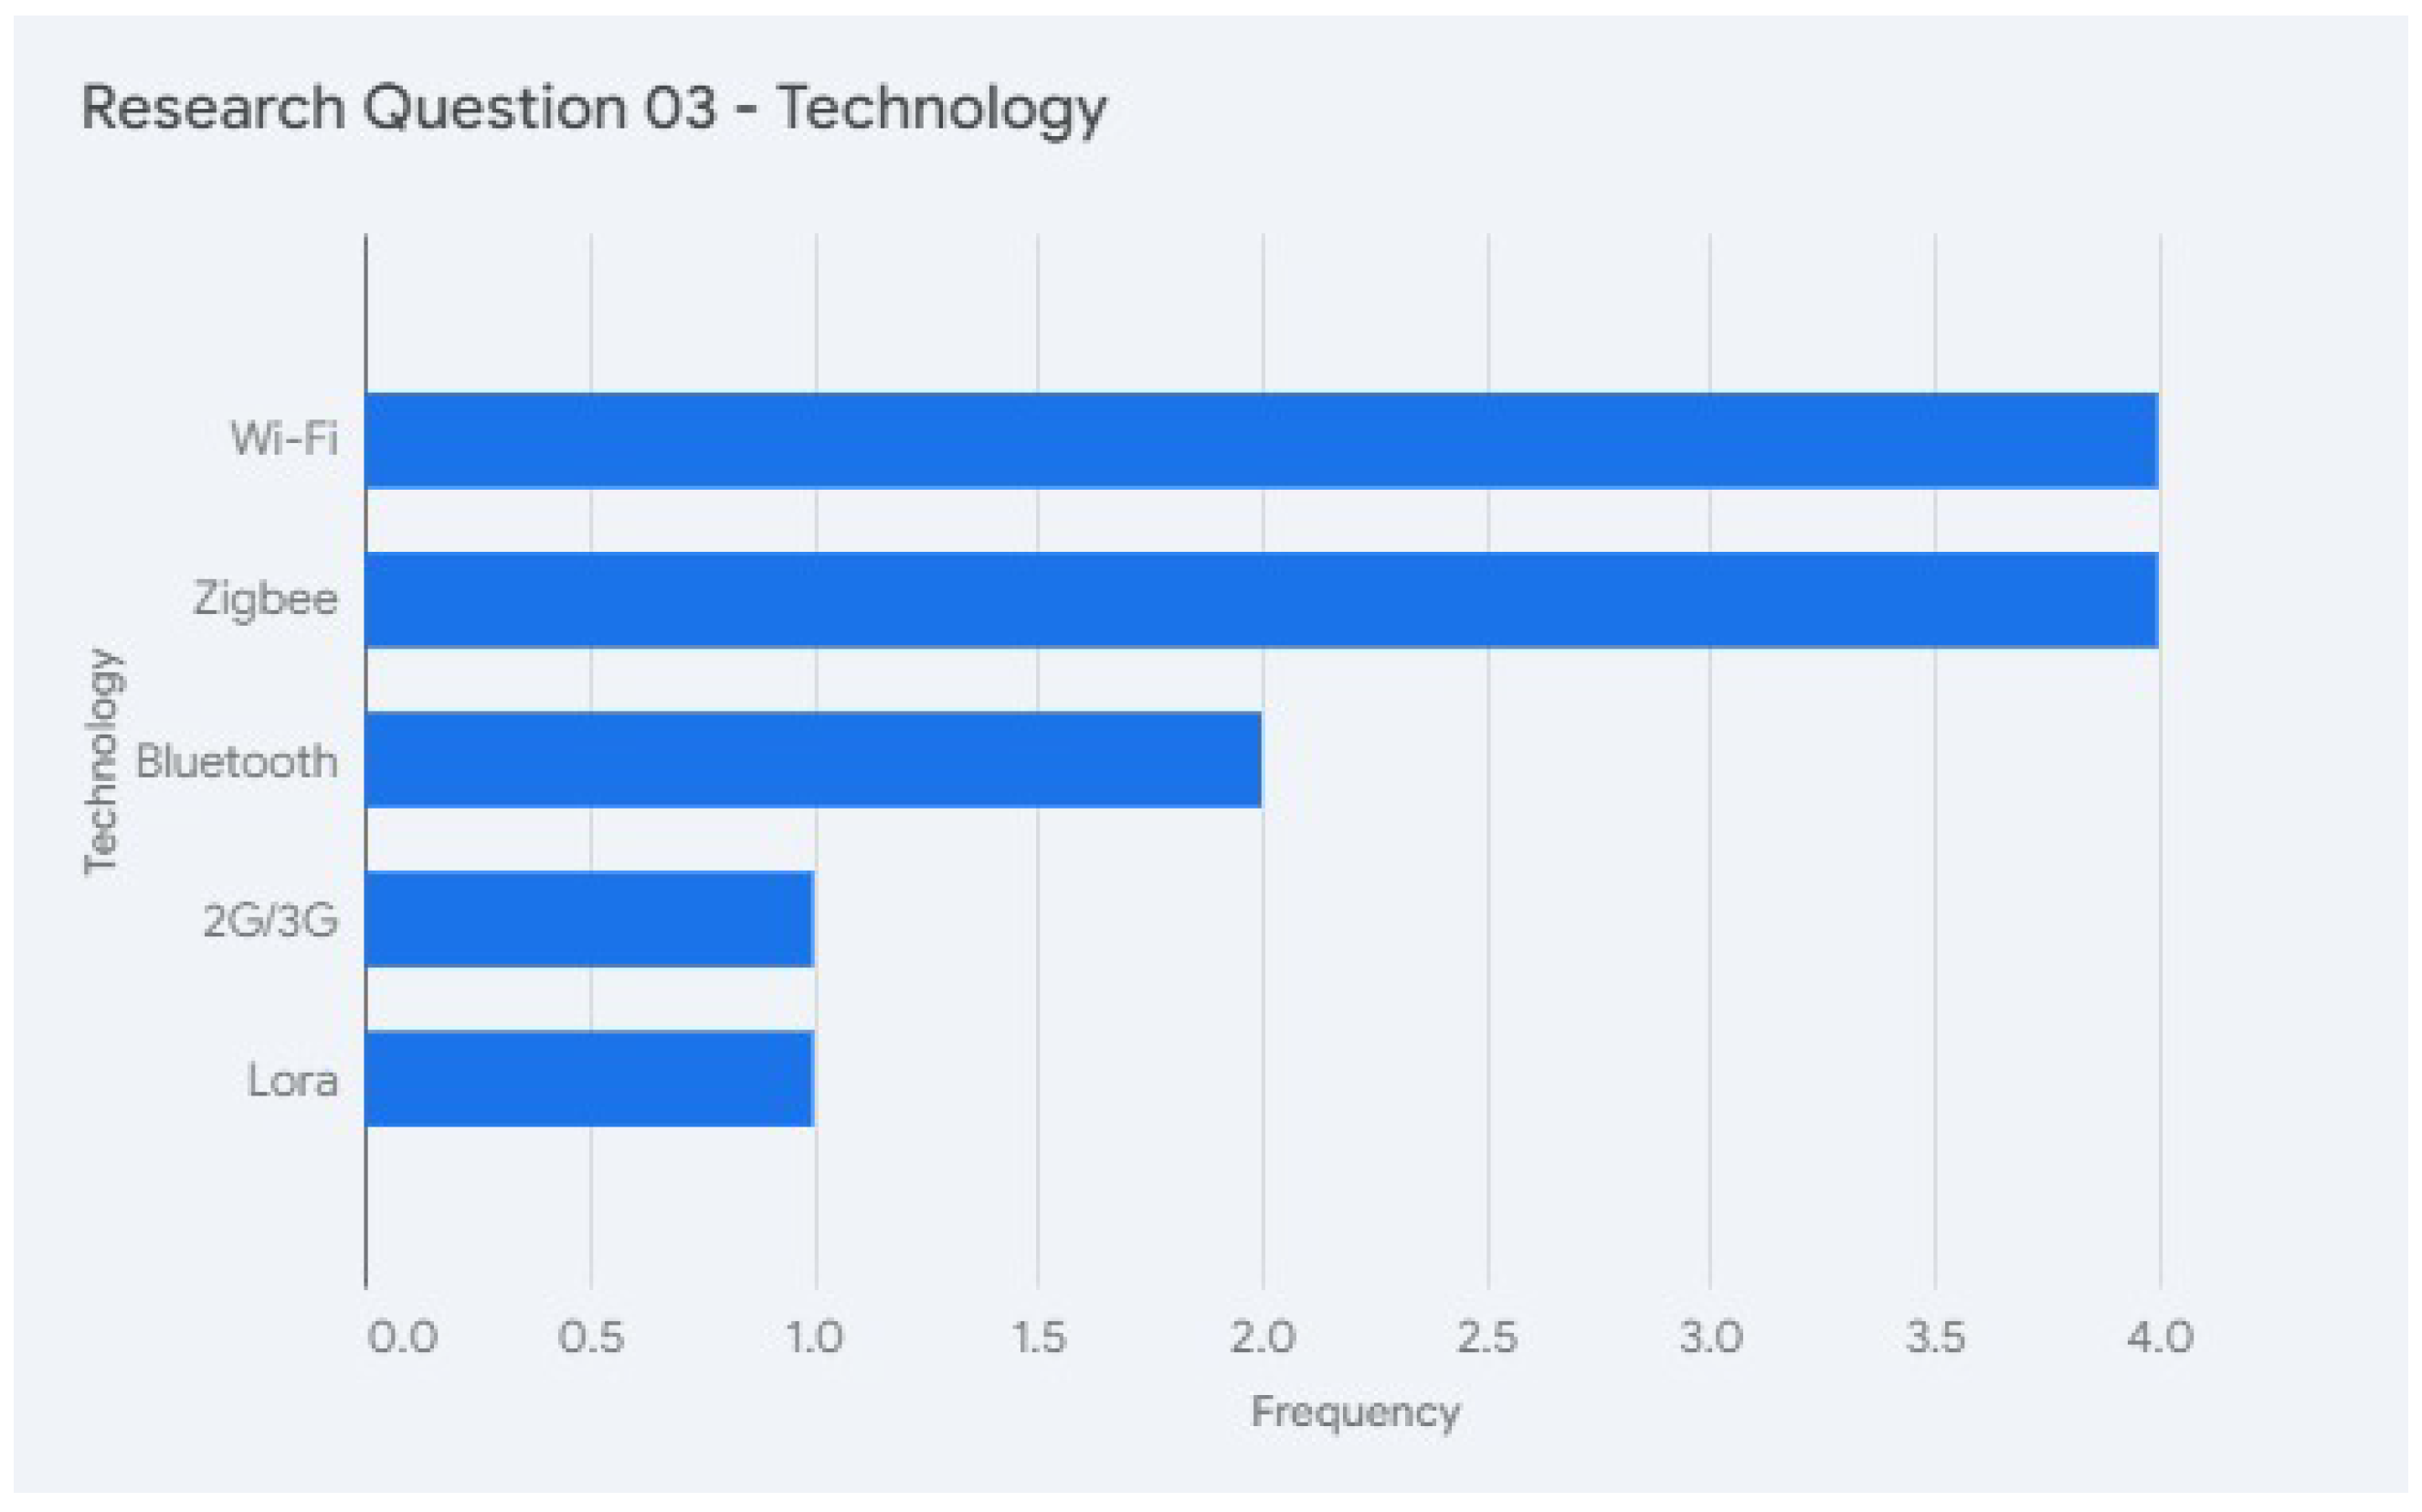
Among the types of communication demonstrated in Table 11, Wi-Fi communication represented 50% of the technologies used in the analyzed articles, with Zigbee also standing out with a usage rate of 25%. In this case, the widespread use of Wi-Fi in most of the reviewed studies is due to the high reliability of the technology, as well as its broad coverage and ease of integration with various services and applications, whether third-party or custom-developed.
Table 11. Research Question 03—technology.
TechnologyPaper
Wi-FiA01, A03, A04, A08
BluetoothA01
ZigbeeA02, A03
2G/3GA02
LoraA05
Figure 6 below presents a graph demonstrating the most commonly used data transmission technologies among the articles analyzed.
Figure 6. Frequency of technologies.
Applsci 15 11719 g006
Wi-Fi modules (notably ESP8266/ESP32-class) are cheap, integrate TCP/IP stacks, and leverage existing LAN/routers in homes, labs, and plants, reducing deployment friction and recurring costs. Their throughput supports multi-parameter payloads and over-the-air updates, and the ubiquitous development ecosystem (Arduino IDE v2.3.6, PlatformIO Core 6, MicroPython 1.26) lowers time-to-prototype. Where infrastructure is absent or energy budgets are tighter, studies resort to LoRa or cellular (as in A05 and A02), but in the analyzed works, most occurred in Wi-Fi-covered environments, explaining the dominance in Figure 6.
Regarding the microcontroller used, shown in Table 12, there was no clear preference for a single one, as some articles did not detail the processing core used in the application. However, if we consider a family of microcontrollers, the general use of Arduinos can be highlighted, present in 62.5% of the analyzed articles. The use of Arduino development boards is attributed to the ease of its development environment and the broad market presence of these boards.
Table 12. Research Question 03—microcontroller.
MicrocontrollerPaper
Arduino MegaA01, A08
ESP8266A01, A04
Arduino UnoA05, A06
Arduino (not specified)A02
ESP32A01
Raspberry Pi 3A01
The graph in Figure 7 shows the distribution of the use of microcontrollers mentioned in the articles.
Arduino Uno/Mega and ESP-based boards present a gentle learning curve, abundant libraries for common water quality probes (pH, turbidity, DO) and stable toolchains. They balance I/O richness (ADC, UART/I2C) with low cost, and their communities provide robust examples and shields. For lightweight inference, they support edge preprocessing and simple ML pipelines, while heavier models can be offloaded. This practicality drives their frequency in Table 12. We note that domain constraints (e.g., ultra-low power or industrial EMC) can motivate alternatives (e.g., STM32, TI, or PLCs), which appear less often in the selected set.
Figure 7. Frequency of microcontrollers.
Applsci 15 11719 g007

4. Discussion

4.1. Parameter Coverage and Measurement Considerations

Across the analyzed studies, a recurring pattern emerges in the selection of water quality parameters, with temperature, pH, turbidity, and electrical conductivity dominating due to their diagnostic relevance, sensor maturity, and regulatory acceptance. These indicators act as proxies for a broad range of contamination processes and treatment performance metrics, while maintaining low acquisition cost and straightforward calibration procedures. Complementary variables—such as dissolved oxygen, nitrates, phosphates, and microbial counts—appear in specialized contexts (e.g., agricultural runoff or catchment analysis), broadening diagnostic capacity but increasing sensor complexity and maintenance requirements.
However, this review also exposes a lack of standardization in measurement protocols, sampling rates, and calibration reporting, which limits reproducibility and comparability across deployments. Future designs should harmonize parameter sets and adopt self-calibrating and drift-compensated probes, particularly for long-term field operation, to ensure data integrity and continuity of monitoring.

4.2. Algorithmic Trade-Offs: From Shallow to Deep Learning

The computational layer of IoT-based water quality systems relies on machine learning to transform multivariate sensor data into actionable insights. Among the analyzed works, K-Nearest Neighbors (KNN) and artificial neural networks (ANNs) were the most common algorithms, followed by more sophisticated time-aware architectures such as TD-CNN-LSTM.
KNN remains attractive for edge-based implementations due to its simplicity, low training overhead, and interpretability in small datasets. ANNs, in turn, enable the modeling of nonlinear interactions among water parameters but demand greater processing power and can suffer from overfitting when training data are limited. TD-CNN-LSTM architectures extend capability by capturing temporal and sequential dependencies, improving sensitivity to short-term variations such as turbidity or conductivity spikes.
In practice, algorithm selection should reflect available computational resources, dataset dynamics, and interpretability needs. For embedded environments, hybrid edge–cloud architectures or TinyML optimizations (e.g., model pruning and quantization) offer promising pathways to balance energy efficiency and inference performance.

4.3. Connectivity, Energy Efficiency, and Field Robustness

Connectivity strongly influences the sustainability and scalability of IoT monitoring systems. The prevalence of Wi-Fi- and Arduino-based platforms across reviewed studies highlights their accessibility and low entry barrier, but also reveals limitations in power consumption (70–200 mA during transmission) and short-range coverage (tens to hundreds of meters). Such configurations are suitable for laboratory or urban contexts but less effective in rural or remote basins.
LoRa and LoRaWAN solutions, though characterized by lower bandwidth, provide kilometer-scale communication with milliwatt-level energy, enabling long-term deployments powered by small photovoltaic panels or hybrid energy-harvesting sources. Cellular (2G/4G/5G) alternatives bridge infrastructure gaps at the cost of higher operational expenses. Environmental resilience also requires careful attention: humidity, temperature variation, and electromagnetic interference can degrade sensor accuracy and communication stability. Designers must adopt protective housings, voltage regulation, and periodic recalibration to ensure reliable operation.
Hence, connectivity choice is not merely technical but contextual—determined by energy budget, required range, and data throughput—reinforcing the need for adaptive hybrid networks that dynamically select communication modes according to local conditions.

4.4. Interpretability and Decision Transparency

Interpretability is essential for trust and regulatory compliance in water quality decision systems. While most reviewed works prioritize accuracy, few explicitly address how models explain their predictions. Shallow models like KNN or CART inherently expose decision boundaries but have limited expressive power, whereas deep models (ANN, CNN-LSTM) achieve higher accuracy at the expense of transparency.
Emerging explainable AI (XAI) techniques—such as SHAP and LIME—allow post hoc attribution of feature importance, revealing how individual parameters (e.g., conductivity or temperature fluctuations) influence classification outcomes. Rule-based surrogates, derived from trained neural networks, can approximate black-box behavior through human-readable IF–THEN logic, facilitating regulatory review. Attention mechanisms within TD-CNN-LSTM models also provide intrinsic interpretability by highlighting the most influential temporal or spatial segments.
A promising approach lies in hybrid interpretable architectures, where rule-based or regression layers are stacked atop deep feature extractors, combining the expressive capacity of deep learning with the transparency of simpler models. Embedding explainability at each design stage—from feature selection to visualization dashboards—supports human-in-the-loop supervision and enhances public trust in automated monitoring.

4.5. Applied Technological Roadmap for System Designers

Based on the evidence synthesized, a development-oriented roadmap can guide engineers and researchers through the systematic design of IoT-based embedded systems for water quality monitoring. The roadmap integrates technological decisions across five functional layers:
i.
Sensing Layer (Parameter and Sensor Definition): Select parameters consistent with the target application and environmental conditions. Prioritize stable, low-cost probes with field calibration capability and standardized digital interfaces.
ii.
Embedded Layer (Signal Conditioning and Processing): Choose microcontrollers that balance cost and computational capacity (e.g., ESP32, STM32). Implement local preprocessing—filtering, normalization, or feature extraction—to improve noise robustness and reduce transmission load.
iii.
Communication and Power Layer (Connectivity Strategy): Tailor communication to deployment context (Wi-Fi for infrastructure, LoRa for rural, cellular for mobile) and integrate energy-efficient duty-cycling or harvesting methods.
iv.
Analytics Layer (Machine Learning Integration): Match model complexity to available resources. Use shallow models for static analysis, deep learning for temporal dynamics, and hybrid edge–cloud approaches for adaptive scalability.
v.
Interpretability and Sustainability Layer (Transparency and Lifecycle Design): Incorporate XAI tools for interpretability, fault detection mechanisms, and sustainable design practices (recyclable materials, modular architecture, and open standards such as MQTT or SensorThings API).
This structured roadmap transforms theoretical insights into practical design guidance, supporting the transition from prototype to deployable and sustainable monitoring solutions.

4.6. Limitations and Future Work

Our evidence base (n = 8) targets recent deployments with explicit ML and embedded/IoT descriptions. While our strict inclusion criteria ensured a high-quality, focused dataset, the small sample size is a limitation. This study should be viewed as a foundational analysis of a tightly defined technological niche. Publication bias and heterogeneous reporting (e.g., sensor calibration, drift, energy budgets) also limited the meta-analysis.
Future work should expand this review to include newly published research to validate and build upon these results, thereby enhancing their representativeness over time. Furthermore, future reviews should standardize reporting templates (parameters, calibration, sampling rates, energy, costs), benchmark accuracy–energy–cost trade-offs across platforms, and integrate mitigation effect sizes under real-world constraints.

5. Conclusions

In this study, we conducted an SSR to investigate the use of IoT and embedded systems in creating a sustainable technological ecosystem, focusing on water quality monitoring systems. Our analysis revealed an apparent convergence in the utilization of IoT and AI to optimize real-time data collection and automated analysis across various contexts. These technological advancements enable the identification of complex patterns in water quality, facilitating rapid and informed decision-making.
This review’s findings highlight the importance of parameters such as temperature, pH, turbidity, and conductivity, which are widely used in the analyzed studies to assess water quality. Applying machine learning techniques, particularly KNN and artificial neural networks, has proven effective in classifying and predicting water potability, providing a solid foundation for developing intelligent monitoring systems.
Despite significant advancements, challenges remain, including implementing and maintaining systems in remote areas, ensuring the quality of collected data, and making AI models interpretable. These issues are crucial for the widespread adoption of these technologies and the maximization of their benefits.
In the future, ongoing research and developing more accessible and robust solutions are essential to promote the sustainability and safety of water resources. The combination of IoT and AI will continue to play a vital role in transforming environmental monitoring, significantly contributing to public health and environmental preservation.

Author Contributions

Conceptualization, E.C.V. and A.M.d.R.F.; methodology, A.M.d.R.F. and W.D.P.; software, E.C.V. and L.A.S.; validation, L.A.S., A.M.d.R.F., and W.D.P.; formal analysis, E.C.V., L.A.S., A.M.d.R.F., and W.D.P.; investigation, E.C.V.; resources, L.A.S. and A.M.d.R.F.; data curation, E.C.V. and A.M.d.R.F.; writing—original draft preparation, E.C.V. and A.M.d.R.F.; writing—review and editing, L.A.S. and W.D.P.; visualization, E.C.V.; supervision, A.M.d.R.F., and W.D.P.; project administration, A.M.d.R.F.; funding acquisition, L.A.S. and A.M.d.R.F. All authors have read and agreed to the published version of the manuscript.

Funding

The authors acknowledge the financial support from the Foundation for Research and Innovation Support of the State of Santa Catarina (FAPESC).

Institutional Review Board Statement

Not applicable.

Informed Consent Statement

Not applicable.

Data Availability Statement

The data supporting this study’s findings are available in the article. The corresponding author can provide the articles reviewed and analyzed during the SSR upon reasonable request.

Conflicts of Interest

The authors declare no conflicts of interest.

References

  1. United Nations. The United Nations World Water Development Report 2023: Partnerships and Cooperation for Water; United Nations: New York, NY, USA, 2023. [Google Scholar]
  2. Barbieri, M.; Barberio, M.D.; Banzato, F.; Billi, A.; Boschetti, T.; Franchini, S.; Gori, F.; Petitta, M. Climate change and its effect on groundwater quality. Environ. Geochem. Health 2023, 45, 1133–1144. [Google Scholar] [CrossRef] [PubMed]
  3. Miller, M.; Kisiel, A.; Cembrowska-Lech, D.; Durlik, I.; Miller, T. IoT in water quality monitoring—Are we really here? Sensors 2023, 23, 960. [Google Scholar] [CrossRef] [PubMed]
  4. Ajith, J.B.; Manimegalai, R.; Ilayaraja, V. An IoT Based Smart Water Quality Monitoring System using Cloud. In Proceedings of the 2020 International Conference on Emerging Trends in Information Technology and Engineering (IC-ETITE), Vellore, India, 24–25 February 2020; IEEE: Piscataway, NJ, USA, 2020. [Google Scholar] [CrossRef]
  5. Alipio, M.I. Data-driven IoT-based Water Quality Monitoring and Potability Classification System in Rural Areas. In Proceedings of the 2020 International Conference on Information and Communication Technology Convergence (ICTC), Jeju, Republic of Korea, 21–23 October 2020; IEEE: Piscataway, NJ, USA, 2020. [Google Scholar] [CrossRef]
  6. Leal, G.F. WaterManna: A IoT na Gestão de Recursos Hídricos. Master’s Thesis, Universidade Estadual de Maringá, Maringá, Brazil, 2019. Available online: http://repositorio.uem.br:8080/jspui/handle/1/5751 (accessed on 18 April 2025).
  7. Maheswar, R.; Kanagachidambaresan, G.R. Sustainable development through Internet of Things. Int. J. Sustain. Eng. 2020, 13, 101–112. [Google Scholar] [CrossRef]
  8. Radwan, N.; Farouk, M. The Growth of Internet of Things (IoT) In The Management of Healthcare Issues and Healthcare Policy Development. Int. J. Technol. Innov. Manag. (IJTIM) 2021, 1, 69–84. [Google Scholar] [CrossRef]
  9. Lakhwani, K.; Gianey, H.K.; Wireko, J.K.; Hiran, K.K. Internet of Things (IoT): Principles, Paradigms and Applications of IoT; BPB Publications: New Delhi, India, 2020. [Google Scholar]
  10. Tanenbaum, A.; Austin, T. Structured Computer Organization, 6th ed.; Pearson Prentice Hall: Hoboken, NJ, USA, 2012. [Google Scholar]
  11. UNICEF. Water Quality Testing in MICS Surveys. 2025. Available online: https://mics.unicef.org/methodological-work/water-quality (accessed on 21 October 2025).
  12. Bogdan, R.; Paliuc, C.; Crișan-Vida, M.; Nimară, S.; Barmayoun, D. Low-Cost Internet-of-Things Water-Quality Monitoring System for Rural Areas. Sensors 2023, 23, 3919. [Google Scholar] [CrossRef] [PubMed]
  13. Banijamali, A.; Pakanen, O.; Kuvaja, P.; Oivo, M. Software architectures of the convergence of cloud computing and the Internet of Things: A systematic literature review. Inf. Softw. Technol. 2020, 122, 106271. [Google Scholar] [CrossRef]
  14. Kitchenham, B.; Brereton, O.P.; Budgen, D.; Turner, M.; Bailey, J.; Linkman, S. Systematic literature reviews in software engineering–a systematic literature review. Inf. Softw. Technol. 2009, 51, 7–15. [Google Scholar] [CrossRef]
  15. Tricco, A.C.; Lillie, E.; Zarin, W.; O’Brien, K.K.; Colquhoun, H.; Levac, D.; Moher, D.; Peters, M.D.; Horsley, T.; Weeks, L.; et al. PRISMA extension for scoping reviews (PRISMA-ScR): Checklist and explanation. Ann. Intern. Med. 2018, 169, 467–473. [Google Scholar] [CrossRef] [PubMed]
  16. Mustafa, H.M.; Mustapha, A.; Hayder, G.; Salisu, A. Applications of IoT and Artificial Intelligence in Water Quality Monitoring and Prediction: A review. In Proceedings of the 2021 6th International Conference on Inventive Computation Technologies (ICICT), Coimbatore, India, 20–22 January 2021; IEEE: Piscataway, NJ, USA, 2021. [Google Scholar] [CrossRef]
  17. Jalal, D.; Ezzedine, T. Toward a Smart Real Time Monitoring System for Drinking Water Based on Machine Learning. In Proceedings of the 2019 International Conference on Software, Telecommunications and Computer Networks (SoftCOM), Split, Croatia, 19–21 September 2019; IEEE: Piscataway, NJ, USA, 2019. [Google Scholar] [CrossRef]
  18. Akhter, F.; Siddiquei, H.R.; Alahi, M.E.E.; Jayasundera, K.P.; Mukhopadhyay, S.C. An IoT-Enabled Portable Water Quality Monitoring System With MWCNT/PDMS Multifunctional Sensor for Agricultural Applications. IEEE Internet Things J. 2022, 9, 14307–14316. [Google Scholar] [CrossRef]
  19. Velammal, M.; Vittam, R.; Kartheeban, K.; Qidwai, K.A.; Shyamala, G.; Thulasimani, T. Intelligent IoT-Based Water Quality Monitoring System Using TD-CNN-LSTM Approach. In Proceedings of the 2023 International Conference on Self Sustainable Artificial Intelligence Systems (ICSSAS), Erode, India, 18–20 October 2023; IEEE: Piscataway, NJ, USA, 2023. [Google Scholar] [CrossRef]
  20. Wu, D.; Mohammed, H.; Wang, H.; Seidu, R. Smart Data Analysis for Water Quality in Catchment Area Monitoring. In Proceedings of the 2018 IEEE International Conference on Internet of Things (iThings) and IEEE Green Computing and Communications (GreenCom) and IEEE Cyber, Physical and Social Computing (CPSCom) and IEEE Smart Data (SmartData), Halifax, NS, Canada, 30 July–3 August 2018. [Google Scholar] [CrossRef]
  21. Aggarwal, S.; Chauhan, S.; Prakash, R.J. An Automated System to Monitor the Usage of Water in Apartments Using IOT and Artificial Neural Network. In Proceedings of the 2019 2nd International Conference on Intelligent Computing, Instrumentation and Control Technologies (ICICICT), Kannur, India, 5–6 July 2019; IEEE: Piscataway, NJ, USA, 2019. [Google Scholar] [CrossRef]
  22. Brasil. Portaria GM/MS nº 888, de 4 de maio de 2021. Altera o Anexo XX da Portaria de Consolidação GM/MS nº 5, de 28 de setembro de 2017, para dispor sobre os procedimentos de controle e de vigilância da qualidade da água para consumo humano e seu padrão de potabilidade. In Diário Oficial da República Federativa do Brasil; Imprensa Nacional: Brasilia, Brazil, 2021. [Google Scholar]
  23. World Health Organization. Guidelines for Drinking-Water Quality; World Health Organization: Geneva, Switzerland, 2004; Volume 1. [Google Scholar]
  24. World Health Organization. pH in Drinking-Water. Revised Background Document for Development of WHO Guidelines for Drinking-Water Quality; World Health Organization: Geneva, Switzerland, 2007; Volume 1. [Google Scholar]
  25. World Health Organization. Water and Public Health, WHO Seminar Pack for Drinking-Water Quality; World Health Organization: Geneva, Switzerland, 2009; Volume 1. [Google Scholar]
  26. World Health Organization. Guidelines for Drinking-Water Quality, Fourth Edition Incorporating the First Addendum; World Health Organization: Geneva, Switzerland, 2017; Volume 1. [Google Scholar]
Figure 1. Graphic representation of the proposed SSR.
Applsci 15 11719 g001
Figure 2. Hierarchical structure of the research questions.
Applsci 15 11719 g002
Figure 3. PRISMA-ScR flow diagram illustrating identification, screening, and inclusion of studies in this structured scoping review.
Applsci 15 11719 g003
Table 1. List of search engines and access addresses.
Search EngineAccess Address
IEEE Xplorerhttps://ieeexplore.ieee.org (accessed on 26 March 2025)
Google Scholarhttps://scholar.google.com (accessed on 26 March 2025)
Science Directhttps://www.sciencedirect.com (accessed on 26 March 2025)
Table 2. Search strings by search engine.
Search EngineSearch String
IEEE Xplorer(“Document Title”: water monitoring) AND
((“Document Title”:iot) OR (“Document Title”: artificial intelligence) OR (“Document Title”: smart))
Google Scholarallintitle: “water monitoring” AND
(iot OR artificial intelligence OR smart)
Science Direct“water monitoring” AND
(“iot” OR “artificial intelligence” OR “smart”)
Table 3. Number of articles returned.
Search EngineNumber Returned
IEEE Xplorer293
Google Scholar49
Science Direct1
Total343
Table 4. Inclusion and exclusion criteria.
CriterionInclusionExclusion
TimeframePublished ≥ January 2015Published < 2015
LanguageEnglishNon-English (if no English version)
DomainWater quality monitoring with sample-based dataDomains unrelated to water quality monitoring
MethodsML/statistical models for classification/predictionNo ML/statistical analysis
IoT/EmbeddedDescribes sensors, comms, and/or MCU; meets ≥2 of 3 facetsDoes not describe hardware (sensors/MCU)
AvailabilityAccessible on the Web (IEEE, Scholar, ScienceDirect)Not accessible
Table 5. Quality questions.
IDQuestion
QQ01Do the authors describe the technologies/communication protocols used in
the solution?
QQ02Do the authors describe the hardware components (microcontroller and sensors) used in the solution?
QQ03Do the authors describe the used ML models in the solution?
QQ04Do the authors describe the characteristics of the analyzed water sample?
QQ05Are the study objectives clearly defined?
Table 6. Selected articles.
IDTitleAuthors  Score
A01Applications of IoT and artificial intelligence in water quality monitoring and prediction:
A review
[16]4.0
A02Data-driven IoT-based Water Quality Monitoring and Potability Classification System in
Rural Areas
[5]4.0
A03Toward a Smart Real Time Monitoring System for Drinking Water Based on Machine Learning[17]3.5
A04An IoT Based Smart Water Quality Monitoring System using Cloud[4]3.0
A05An IoT-Enabled Portable Water Quality Monitoring System With MWCNT/PDMS Multifunctional Sensor for Agricultural Applications[18]5.0
A06Intelligent IoT-Based Water Quality Monitoring System Using TD-CNN-LSTM Approach[19]3.0
A07Smart Data Analysis for Water Quality in Catchment Area Monitoring[20]3.0
A08An Automated System to Monitor the Usage of Water in Apartments Using IoT and Artificial Neural Network[21]2.5
Table 7. Extracted data.
IDFieldValuePurpose
PD01IDText valueArticle identification
PD02Machine learning modelText valueAddressing PQ02.03
PD03MicrocontrollerText valueAddressing PQ03
PD04IoT platformText valueAddressing PQ03
PD05SensorsText valueAddressing PQ01
Table 8. Comparative synthesis of IoT-based embedded systems for water quality monitoring. Each primary study (A01–A08) is summarized by its application context, dataset characteristics, measured parameters, sensors, embedded platform, connectivity, algorithms, and key remarks.
IDApplication ContextDataset/VolumeParametersSensors/InputsMicrocontroller/PlatformConnectivityAlgorithm(s)Key Insights/Remarks
A01Review of IoT + AI for water monitoring and predictionAggregated from literaturepH, Turbidity, Temperature, Conductivity, DO, ColiformsGeneric commercial sensorsArduino Mega, ESP8266/32, Raspberry PiWi-Fi, BluetoothANN (review scope)Broad synthesis across sensing–connectivity–analytics layers; highlights ANN as dominant model; lacks experimental validation.
A02Potability classification in rural areasField data from rural wellspH, Turbidity, TDS, TemperaturepH, turbidity, and TDS probesArduino (unspecified)Zigbee, 2G/3GKNN, CART, HV-NBLow-cost IoT solution for underserved regions; ensemble learning improves robustness under connectivity limitations.
A03Real-time monitoring for drinking-water systemsContinuous pilot monitoringpH, Turbidity, Temperature, Conductivity, Cell MetricsMulti-parameter probe setWi-Fi, ZigbeeKNN, DT, SVMMulti-algorithm comparison for potability assessment; provides operational insights but lacks quantitative performance results.
A04Cloud-based smart water monitoringCloud-linked prototypepH, Temperature, DO, CO2, HumidityMulti-parameter sensorsESP8266Wi-FiDeep LearningDemonstrates seamless device–cloud integration; scalable architecture with limited dataset and no explicit accuracy metrics.
A05Portable monitoring for agricultureField samplespH, Temperature, Nitrate, PhosphateMWCNT/PDMS multifunctional sensorArduino UnoLoRaKNNLong-range, low-power system enabling large-area coverage; suitable for agricultural use but limited feature diversity.
A06Intelligent IoT system for dynamic monitoringTime-series datapH, Temperature, Conductivity, FlowStandard probesArduino UnoTD-CNN-LSTMCaptures temporal behavior using hybrid CNN–LSTM; improved prediction at cost of higher computational demand.
A07Catchment-area water quality analysisEnvironmental datasets (micro-biological counts)pH, Turbidity, Temperature, Coliforms, ColorOptical and microbiological sensorsZIP, ZINBEmploys statistical models to handle sparse microbial data; provides interpretability but no embedded/IoT implementation.
A08Apartment water-usage monitoringFlow data from buildingsTemperature, FlowFlow and temperature sensorsArduino MegaWi-FiANNFocuses on consumption and flow behavior; supports demand-side management; limited to few parameters.
Disclaimer/Publisher’s Note: The statements, opinions and data contained in all publications are solely those of the individual author(s) and contributor(s) and not of MDPI and/or the editor(s). MDPI and/or the editor(s) disclaim responsibility for any injury to people or property resulting from any ideas, methods, instructions or products referred to in the content.