Article

Use of Sentinel-2 Images to Elaborate a VRT Sensor-Based and Map-Based Nitrogen Fertilization in Wheat and Barley Crops

by
Patricia Arizo-García
1,
Sergio Castiñeira-Ibáñez
2,*,
Daniel Tarrazó-Serrano
2,
Belén Franch
3,
Constanza Rubio
2 and
Alberto San Bautista
1
1
Centro Valenciano de Estudios Sobre el Riego, Universitat Politècnica de València, Camí de Vera s/n, 46022 Valencia, Spain
2
Centro de Tecnologías Físicas, Universitat Politècnica de València, Camí de Vera s/n, 46022 Valencia, Spain
3
Global Change Unit, Image Processing Laboratory, Universitat de València, 46980 Paterna, Spain
*
Author to whom correspondence should be addressed.
Appl. Sci. 2025, 15(21), 11646; https://doi.org/10.3390/app152111646 (registering DOI)
Submission received: 3 October 2025 / Revised: 27 October 2025 / Accepted: 29 October 2025 / Published: 31 October 2025
(This article belongs to the Special Issue Digital Technologies in Smart Agriculture)

Abstract

Precision agriculture can determine the amount of nitrogen (N) required in each area to optimize yield and nitrogen use efficiency (NUE). The use of variable rate technology (VRT) for planning N fertilization has often relied on techniques that are unfeasible for farmers with limited resources. This study aims to present a variable fertilization plan for wheat and barley, along with a protocol to determine the optimal timing for the second nitrogen (N) application, thereby minimizing the need for in situ crop monitoring. Two approaches are studied: a more straightforward sensor-based method and a map-based method. The sensor-based approach involved modeling the maximum NDVI based on the observed value at the time of application and the required N level, achieving an R2 of 0.55 ± 0.06 and 0.72 ± 0.04, an MAE of 0.025 ± 0.002 and 0.039 ± 0.002, and an RMSE of 0.049 ± 0.007 and 0.055 ± 0.004 for wheat and barley, respectively. The map-based approach relied on training models to estimate the nitrogen dose to be applied based on the target yield and reflectance data from Sentinel-2 at the time of application. Using random forest algorithms, an R2 of 0.97 ± 0.01 and 0.96 ± 0.02, an MAE of 3.33 ± 0.20 kg N ha−1 and 2.01 ± 0.13 kg N ha−1, and an RMSE of 4.79 ± 0.31 kg N ha−1 and 3.27 ± 0.58 kg N ha−1 for wheat and barley, respectively.

1. Introduction

The increase in food production is fundamental due to the exponential growth of the worldwide population. According to the UNE [1], from 1950 to 2022, the world population has increased from 2.5 to 8 billion people, and, even considering that the population growth rate is decreasing due to factors like the decrease in birth rate, by 2050, the world population could reach 9.7 billion people. Against this background, cereal production has become a key factor. This can be appreciated not only in the improvement of yield crops and the evolution of surface under production but also in market uncertainty that causes the increase in cereal prices caused by climate change and market instability [2,3]. In the case of wheat (Triticum aestivum L.), the second most produced cereal worldwide, in the last 50 years, its production has increased by 122% while cultivated area has increased only 3%. Barley (Hordeum vulgare L.), the most produced cereal in Spain, has increased its production by 11% while the cultivated area has decreased by 28% [4].
The changes in cropping systems, based on improved crop varieties, pesticides, and synthetic fertilizers [5], have made it possible to increase world production in the last 50 years. However, the future persistence of this trend is uncertain as natural resources are limited, and the crops are near achieving their maximum physiological yield [6]. Nevertheless, the excessive application of nitrogen fertilizers has severe consequences for air, soil properties, and aquatic environments, causing eutrophication, air pollution, and an increase in greenhouse gas emissions [7]. Furthermore, this nitrogen overuse provokes environmental problems and problems in cereal crops, like cereal lodging. Additionally, nitrogen overuse can reduce financial benefits due to reduced nitrogen use efficiency (NUE) [8]. This added the increase in cereal prices associated with market instability and supply chain disruptions has made it essential to improve nitrogen use efficiency (NUE). Furthermore, the recent rise in fertilizer prices has reinforced the need for optimized nitrogen management strategies, making it essential to increase NUE while yield increases or remains unchanged.
With this objective in mind, several authors started working with precision agriculture as a tool to help farmers improve their revenues using variable rate technology (VRT). In this sense, VRTs use two different methods for site-specific management, involving the first method, the collection of field data and its analysis to create a map of treatments. The other method is a sensor-based approach that analyzes real-time field conditions [9]. Scharf et al. [10] carried out a study in maize, comparing the results of a nitrogen application elaborated with Crop Circle 210 and Greenseeker sensors with a uniform nitrogen application made by farmers, appreciating that in maize crops application made with the sensors helps to reduce the use of nitrogen by 8%, increasing the NUE (6%) and reducing nitrogen loss between 24 and 28%. However, the nitrogen application made with those two sensors used internal calibrations made for unknown cultivars and climatic conditions. Similar results were obtained by Argento et al. [11] in Switzerland when using UAV (unmanned aerial vehicle) images to evaluate the nitrogen content in wheat crops with different fertilization, finding that the N variable rate applications had the potential to reduce the N input between 5 and 40% and increase the NUE by 10%, while the final grain yield and the grain quality won’t be affected. Sensor-based VRT applications are the most applied in agriculture, but those sensors never provide the actual amount of required fertilizer; rather, the actual N status of plants and potential yield are analyzed using vegetation indices [12,13]. Within the used VI, NDVI is the most commonly used one to estimate the N content in plants, showing R2 values between 0.55 and 0.60 [11,14].
The use of map-based prescription is less common, as it usually implicates the use of equipment that has a terminal that allows the upload of a prescription map and the use of sensors that know all the producers can purchase. In response to these limitations, using satellite multispectral images, such as Sentinel-2 or MODIS (Moderate Resolution Imaging Spectroradiometer) products, appears helpful. These free-access products can be used to elaborate models to prescribe variable fertilization maps easily implemented by non-specialists [15]. The use of reflectance bands data will improve the limitation that VI has presented in terms of saturation. In this sense, ML algorithms could be used to generate the prescription maps, as this type of model has been proven to give good results predicting other variables as yield [16]. However, in terms of use of N in agriculture, the application of those ML algorithms (e.g., PLSR, RFR or SVM) is limited to the modeling of N content in leaf, obtaining good results (R2 0.71–0.87) but also using VI instead of directly using multispectral or hyperspectral measurements [17,18,19].
In fact, in Spain, the study of VRT technology is very limited at the research and professional levels. Moreover, the drought situation of the last years, the rising prices of nitrogen fertilizers, and the new regulations that limit the application of nitrogen to crops to a maximum amount of 170 kg N ha−1 in non-vulnerable zones are increasingly limiting the growers’ management and their crops’ final yield. At the professional level, the farmers who are starting to use VRT to apply nitrogen fertilizers are implementing sensor-based approaches, using pre-existing calibration models made with other countries’ conditions.
Knowing this and considering the limited reach that this type of technology has in Spain, this study has three objectives: The proposal of a protocol to determine the moment of application of the second nitrogen coverage using reflectance data, minimizing field visits; elaborate models that will allow the implementation of two N VRT approaches in function of the producers’ equipment. One is a sensor-based accessible nitrogen VRT plan in wheat and barley for specific locations and environmental restrictions, so Spanish growers will be able to implement a sensor-based variable application of nitrogen adapted to their specific conditions. While the second approach is a more sophisticated map-based N VRT that uses freely available data of reflectance to create maps of fertilization using machine learning algorithms.

2. Materials and Methods

2.1. Study Area

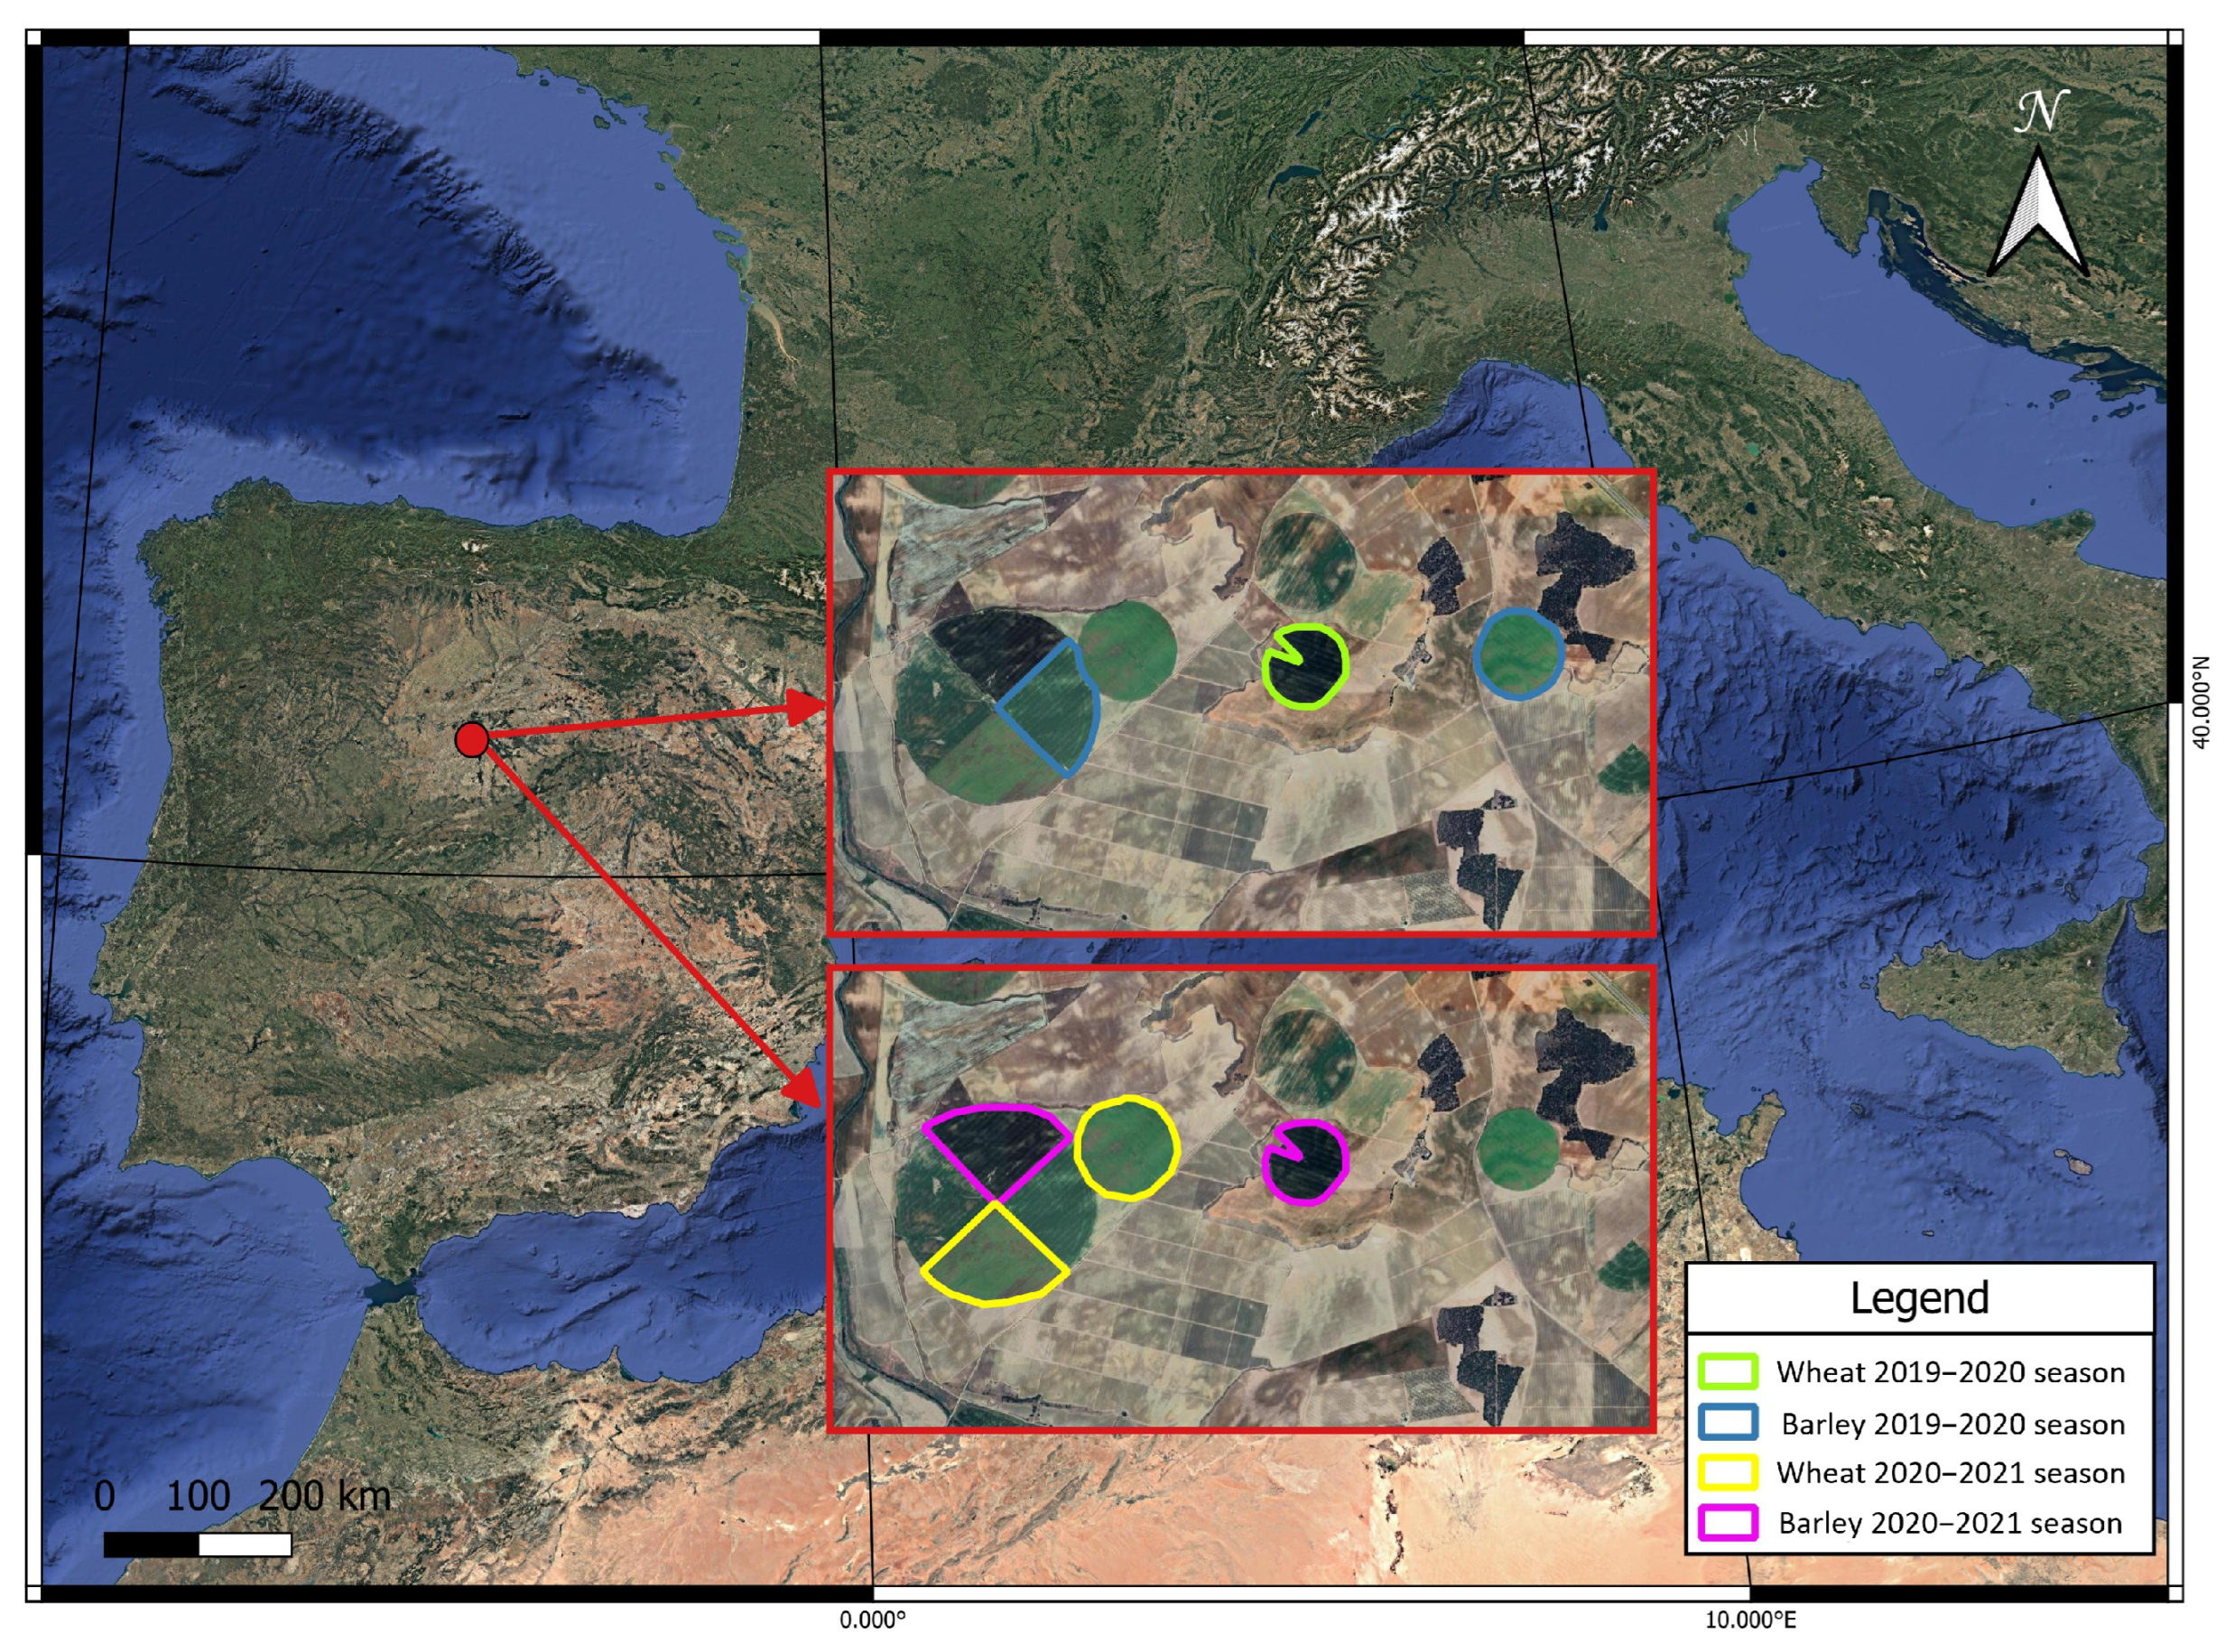
The experiments were performed during two consecutive growing seasons, 2019–2020 and 2020–2021, in Valladolid, a traditional cereal-producing area of Spain. These fields are owned only by a farmer, being separated by a maximum straight-line distance of 2.3 km and able to be included within a polygon of 394 hectares (Figure 1). According to the Köppen Climate Classification (KCC), the climate of the study area is classified as BSk (cold semi-arid), with temperatures that can reach 39 °C in summer and −9 °C in winter. Due to the low annual precipitation (<400 mm year−1) and the high reference evapotranspiration (<1000 mm year−1), a significant proportion of farmers choose to irrigate their crops. In addition, Figure 2 shows the rainfall and temperature evolution in the studied area during the 2019–2021 seasons.
The experiment was conducted on sandy loam soil with a pH ranging from 7.8 to 8.0, an electrical conductivity (EC) between 0.8 and 0.9 dS/m, and an organic matter content of 1.2% to 1.3%. This soil is classified as moderately alkaline with low organic matter content. The crop was managed according to standard agronomic practices, following the recommendations outlined by López-Bellido [20]. The farm applies a crop rotation of wheat–barley–rapessed–fallow.
Figure 2. Monthly evolution of maximum, minimum, and medium temperature (°C) and monthly rainfall (mm) in the studied area during the studied seasons (2019–2021). Source of data: MAPA [21].
Applsci 15 11646 g002

2.2. Experimental Design

The experimental crops were irrigated winter wheat (Triticum aestivum L.) and barley (Hordeum vulgare L.) sown in mid-November. Specifically, in the 2019–2020 season, a field of 13.3 ha of wheat and two fields of barley with a total cultivated area of 30.66 ha. In the following season, the cultivated surface of wheat was 42 ha, distributed in two fields, while 34 ha of barley, distributed in two fields, were cultivated (Figure 1).
All the studied fields received a total nitrogen (N) application of 150 kg N ha−1, according to the advice of López-Bellido et al. [22]. The N supply was distributed in three different applications: a background made at the beginning of November (27% of the total supplied N); and two coverages, the first one applied at the beginning of February and the second at the phenological stage 3 (stem elongation), both of 36.5% of the total N. The second N coverage was made on 24 March during the 2019–2020 season and 7 April during the 2020–21 season. The background and first coverage applications were uniform for all the surfaces (40 kg N ha−1 and 55 kg N ha−1, respectively), while the second coverage application was variable (remaining 55 kg N ha−1), using variable rate technology (VRT). Concerning VRT application, the N doses varied between 45 and 65 kg N ha−1, so the second N coverage was divided into four treatment groups of 45–50 kg N ha−1 (NC1), 50–55 kg N ha−1 (NC2), 55–60 kg N ha−1 (NC3) and 60–65 kg N ha−1 (NC4). The N variable application was designed considering the farmer’s interest; that’s the reason why only the second coverage was made using VRT, due to the farmer’s uncertainty provoked by the absence of farmers using this type of technology in Spain. For this reason, the remaining N for the second coverage was distributed in the mentioned four treatments, applying higher doses in the areas with a higher potential for grain production to increase the final yield. The potential for grain production was determined by calculating the estimated yield index (EY) at the tillering stage with the equation proposed by Raun et al. [13] (Equation (1)). Figure 3a shows an example of EY results in one of the fields studied, highlighting areas with higher values and, therefore, greater production potential. In Figure 3a, the applied second N coverage is shown. The spreader limitation at the time of application caused the differences in applied N between the different treatments, as can be seen in Figure 3b.
EY = NDVI 1 NDVI 2 GDD
The N VRA application is made using an ISOBUS spreader, managed by the Topcon Apollo control system, installed in the tractor cab. The systems allows the upload of the prescription map, applying the N dose indicated by the provided map.
The phenological stages were determined by studying the evolution of Sentinel-2 reflectance bands [23,24,25] in crops throughout their productive cycle and through onsite verifications. In this way, Figure 4 shows an approximation of the phenological cycle of crops, classified using the BBCH scale [26].

2.3. Yield Data Processing

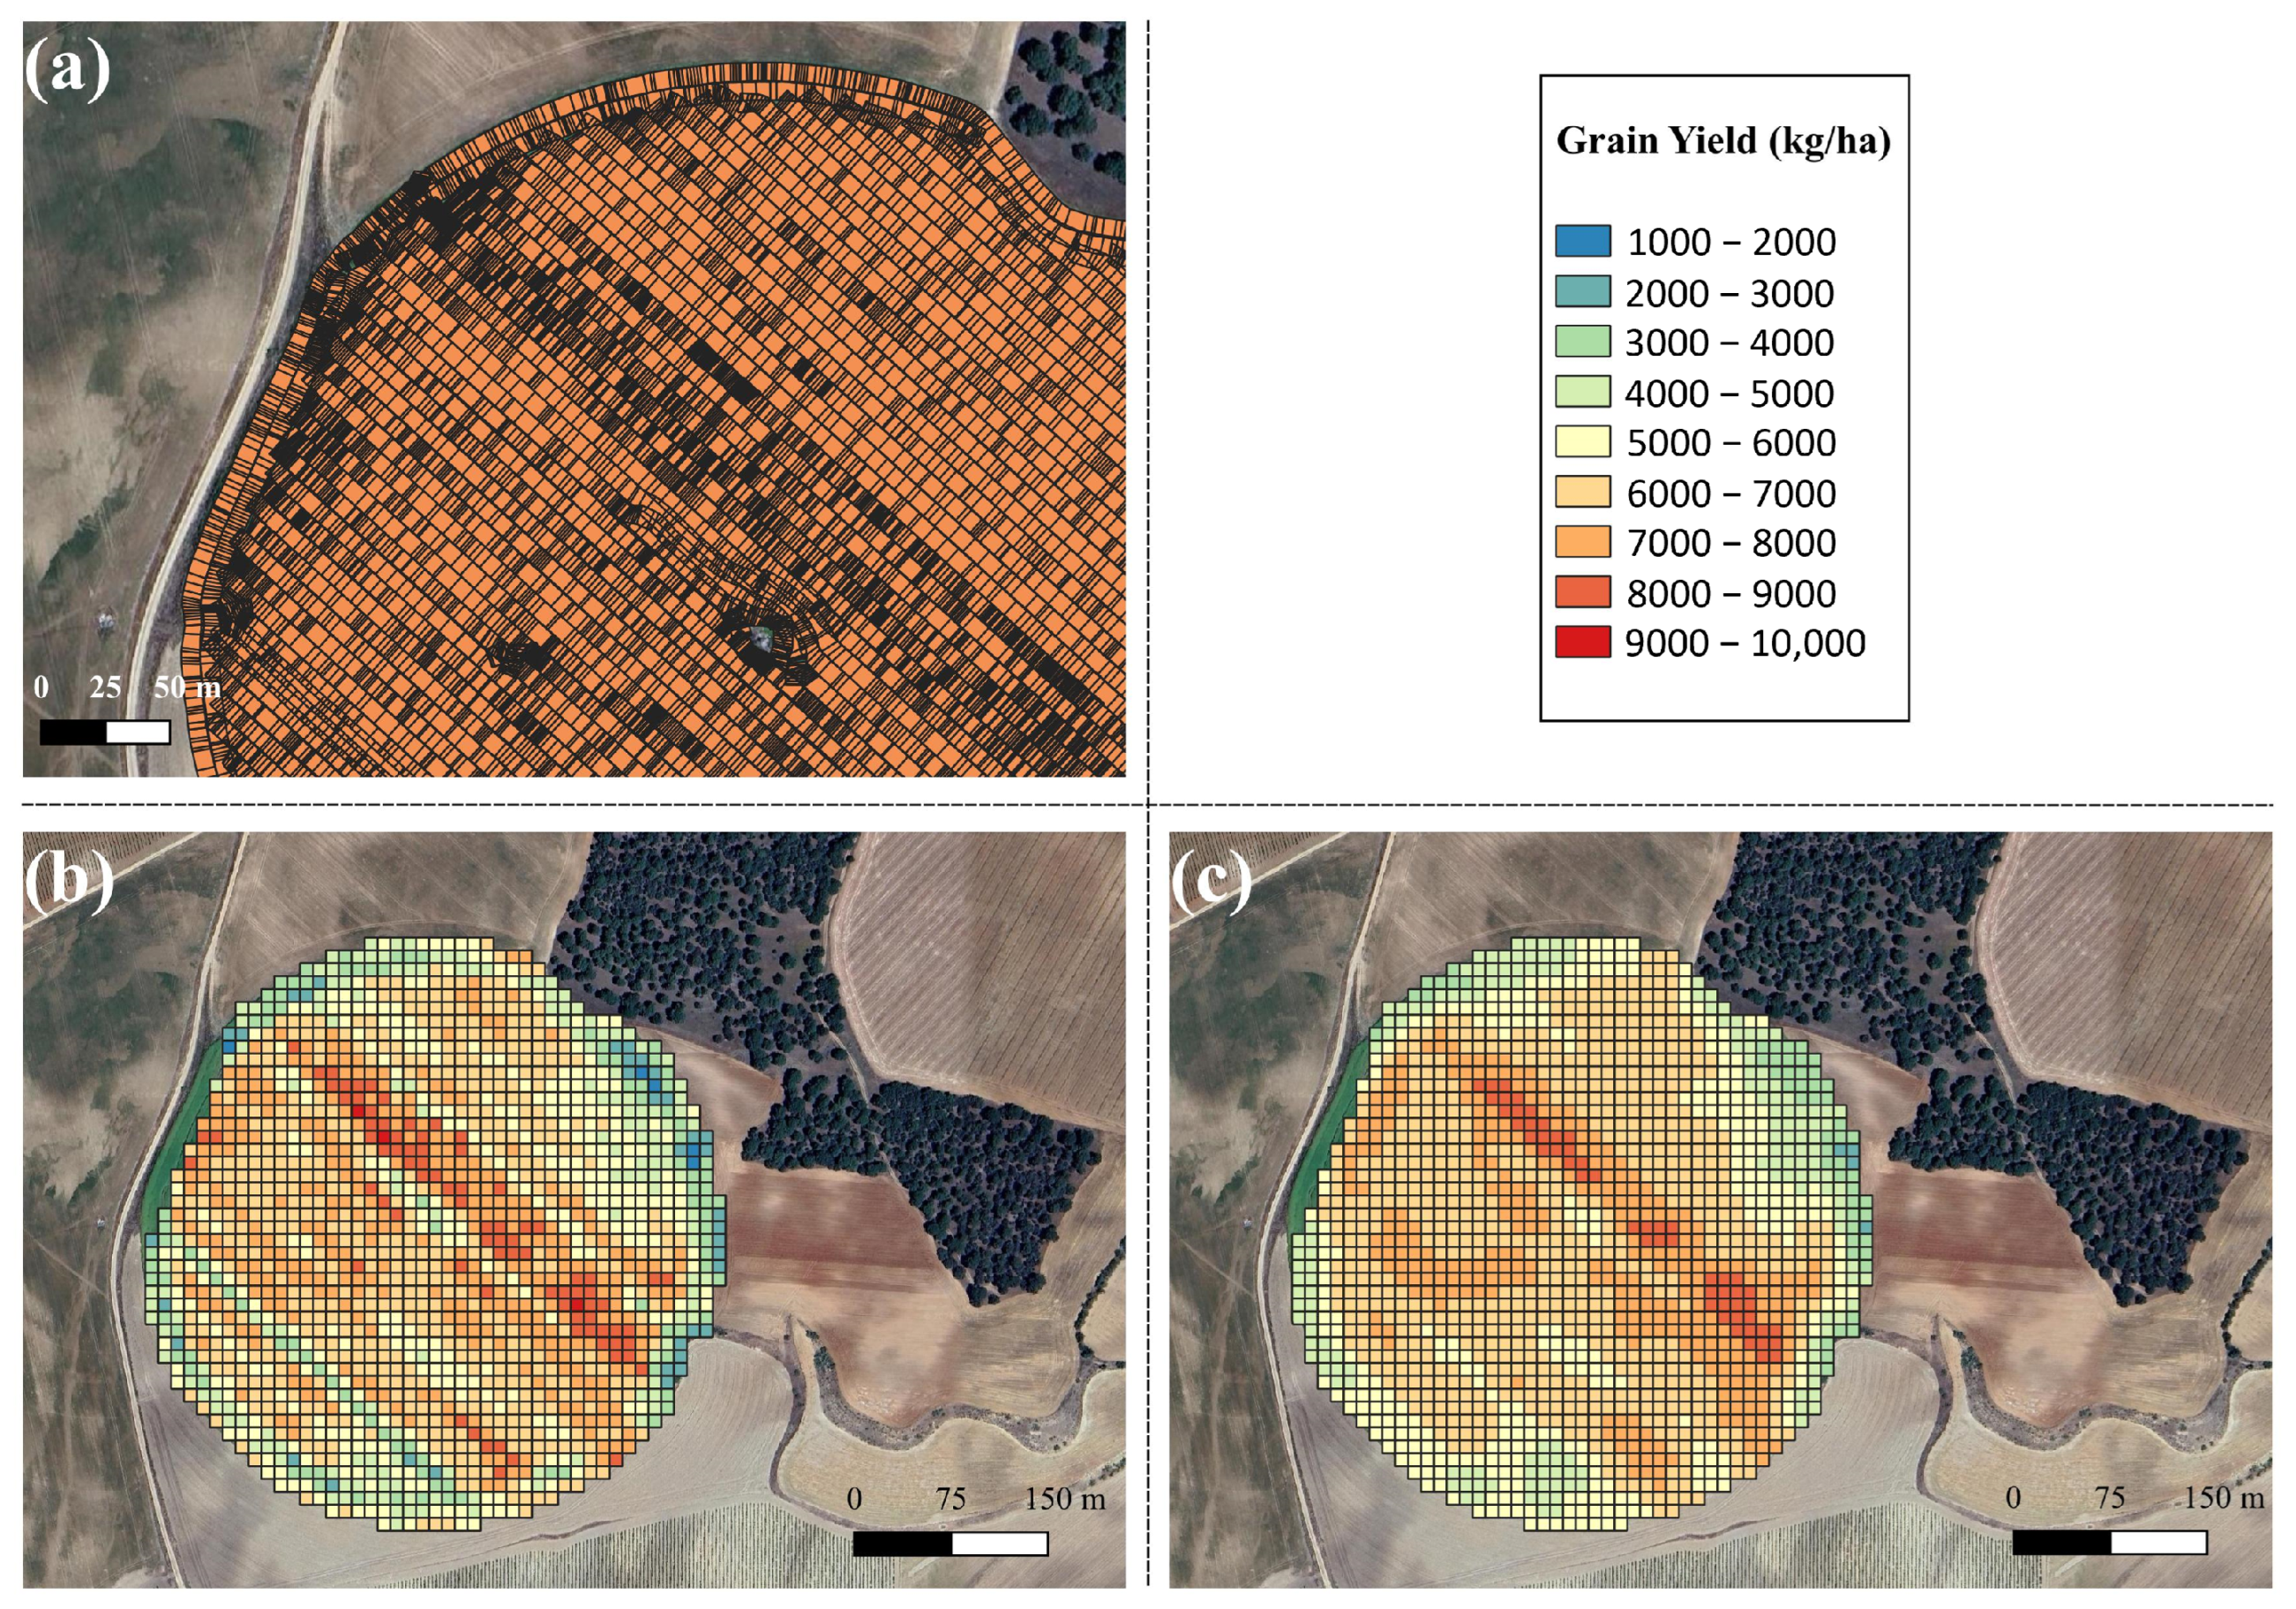
The final grain yield of the crops was determined using Yield Track software (YieldTrakk YM-1), installed by TOPCON Corporation (Tokyo, Japan) on the combine harvester Deutz-Fahr B9306 TSB (Lauingen, Germany). The measurement system of this company is based on a volumetric grain flow estimation using optical sensors, performed before the grain enters the combine harvester hopper. The obtained yield maps (Figure 5a) are composed of polygons with an irregular surface and a constant width that matches the cutting width of the combine. The software that generates yield maps includes an internal calibration based on the crop type, so combine operators select the type of grain to be harvested and calibrate the sensors before starting. However, these high spatial resolution yield measurements are prone to errors. These yield data files were carefully cleaned before their use in the present study. Firstly, the existing overlaps and the polygons with a yield value outside the biological limits of the crop (0 < yield 10,000 kg ha 1 ) were eliminated. After that, the outliers at the field level were removed, calculating the polygons with a yield value that fell outside of “field mean” ± 2.5 × “field standard deviation” [27]. In addition, a local adjustment was made to erase yield values not closely related to immediate neighbors [28]. In this sense, a research radius of 40 m was established [28], removing the polygons with a yield value that falls outside of the “search radius mean” ± 2.5 × “search radius standard deviation”. The filtered yield data was buffered inwards by 20 m from the field border [16]. In the last step, a mean filter of 3 × 3 m was applied to reduce the noise, and the data was resampled at a 10 × 10 m grid. Figure 5b,c show an example of the effect of the mean filter in the final yield map after being resampled at the higher spatial resolution of Sentinel-2.

2.4. Satellite Data

The satellite data was obtained through a Multi-Spectral Instrument (MSI) on board two twin satellites (Sentinel-2A and Sentinel-2B) that fly in the same orbit but are phased 180° apart, which allows the acquisition of wide-swath, high-resolution images with a revisit time of 5 days [29]. The optical instrument sampled 13 spectral bands; 10 of them were used (Table 1). Only cloud-free images were selected for both studied growing seasons (Table 2), downloaded from ESA’s official platform, the level 2A products that provided surface reflectance images. Each selected date was assigned a Day Of the Year (DOY), where negative DOY values indicate days prior to the study season.

2.5. Methodology

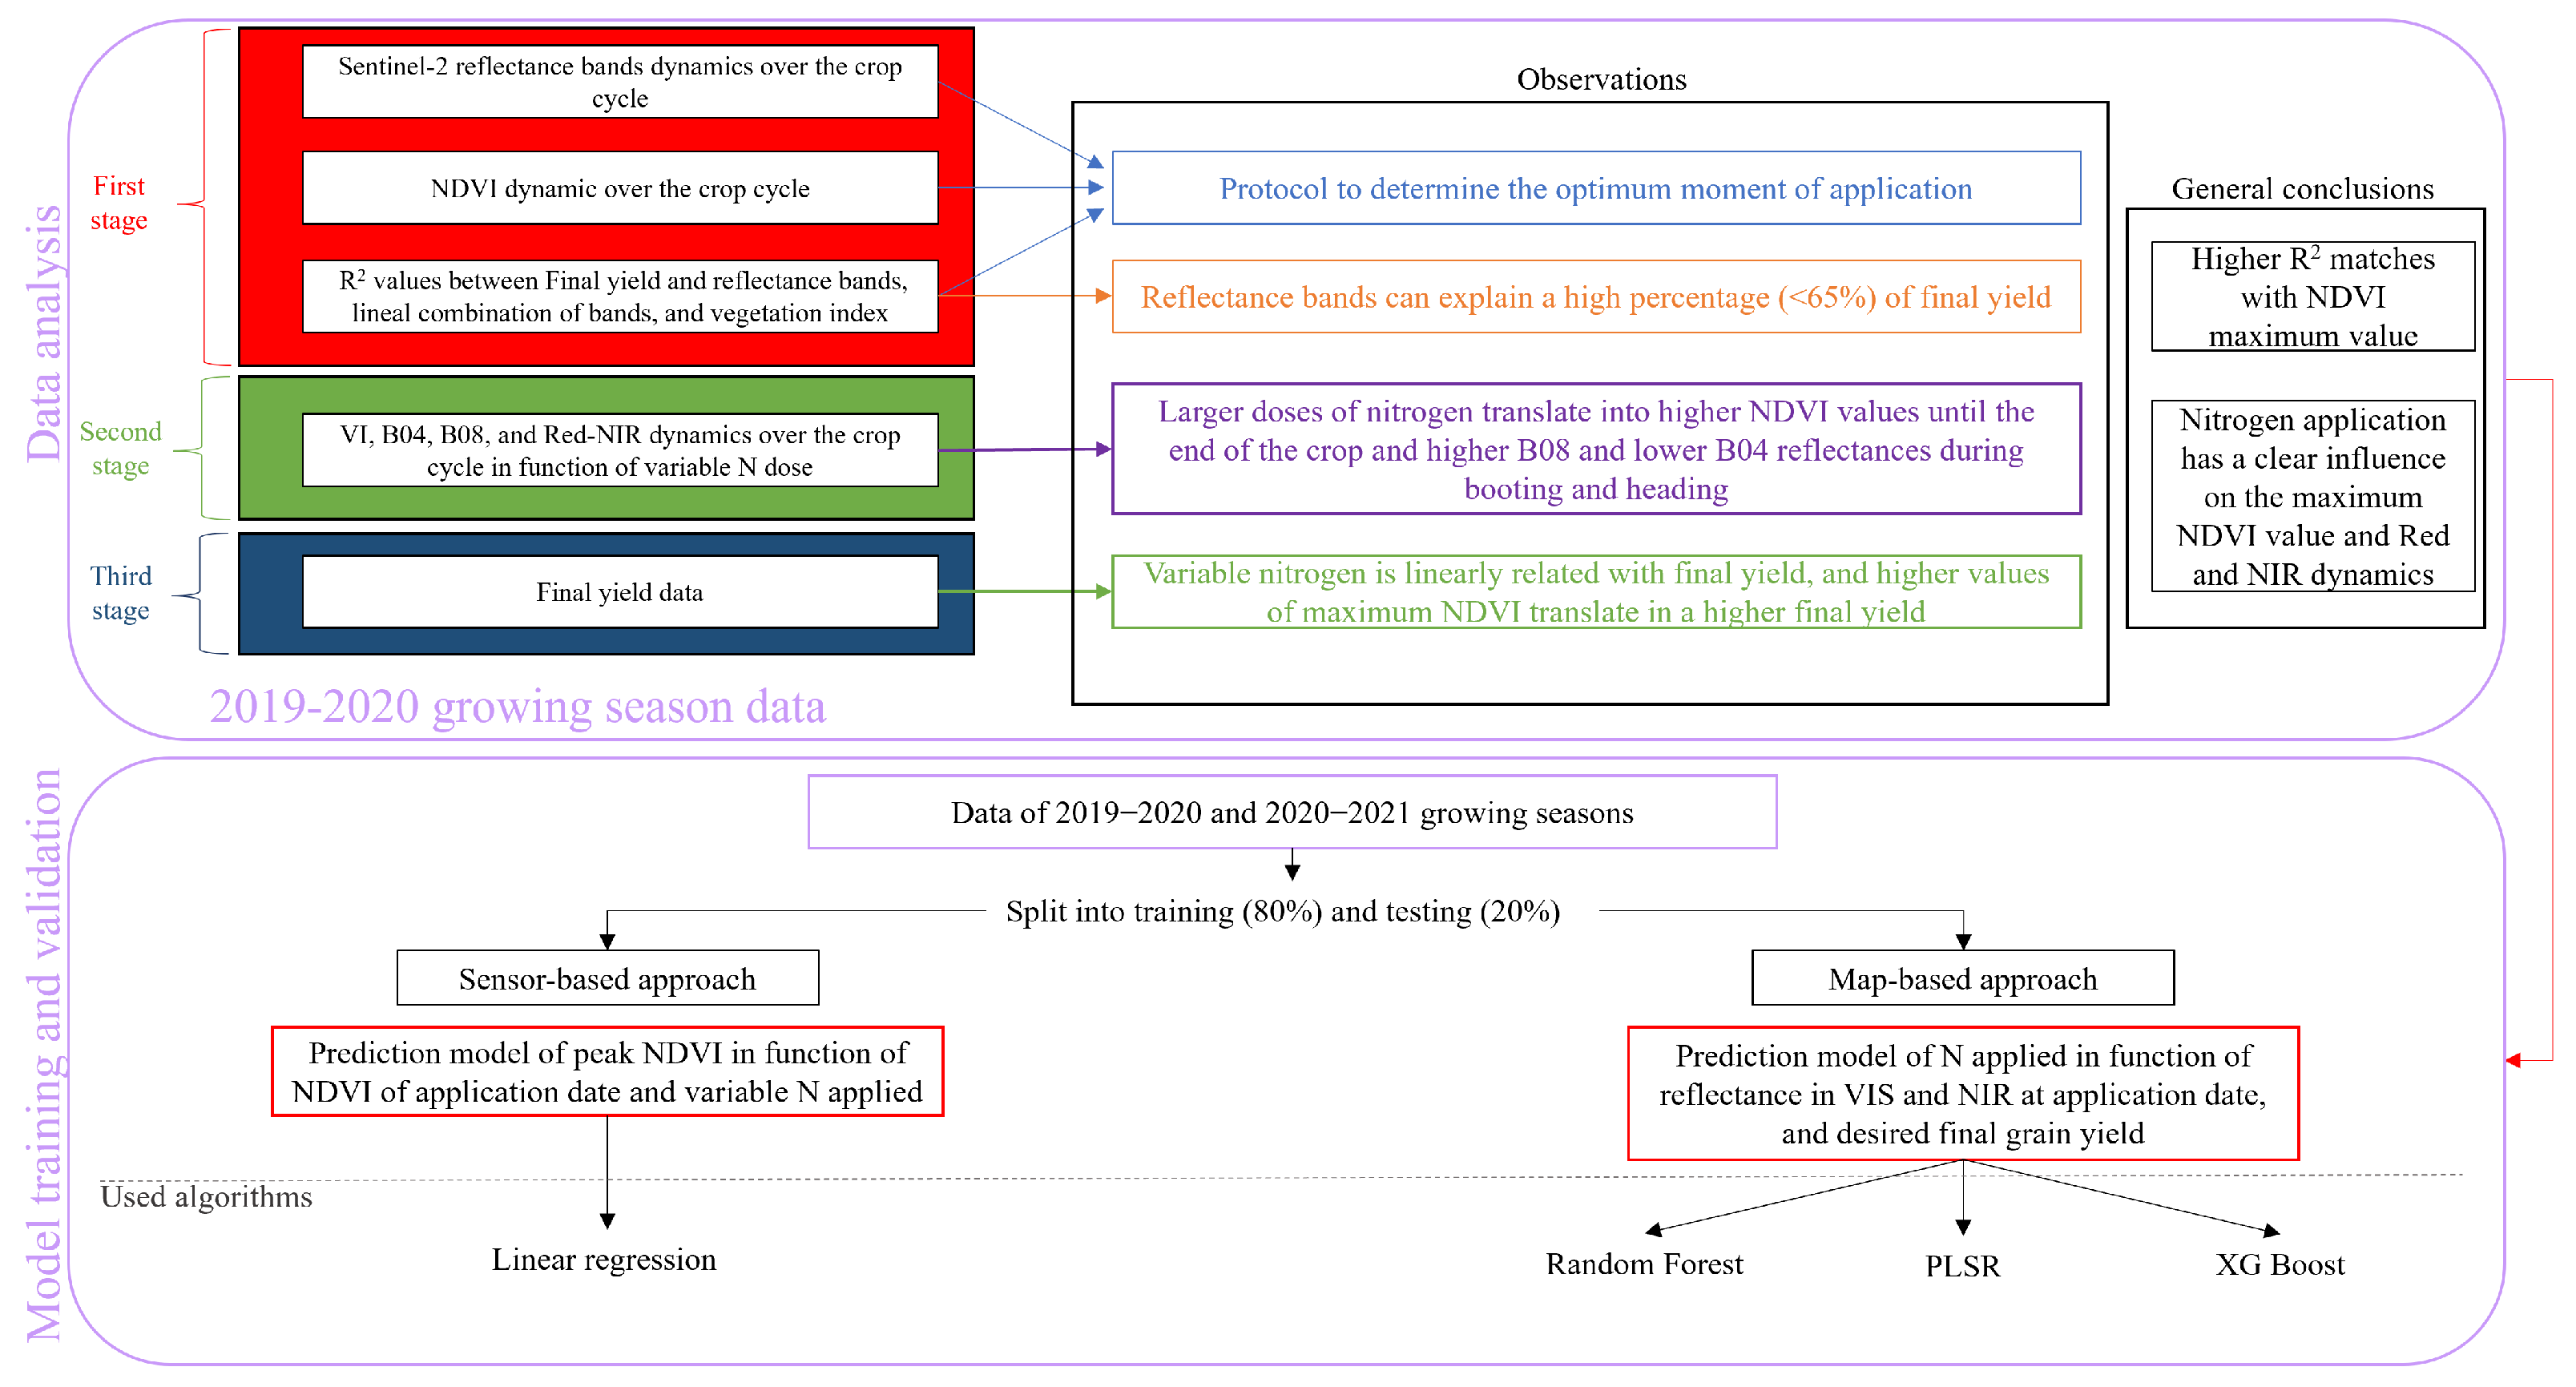
Figure 6 shows the workflow followed to determine the appropriate moment of application of a second N coverage, the effect of different N doses in the crop, and the training and validation of the models for both studied approaches of VRT N fertilization. As presented in the workflow (Figure 6), the data analysis was carried out using only the data from the 2019 to 2020 growing season, while data from both studied growing seasons (2019–2020 and 2020–2021) were used for the model training and validation.
The two proposed VRT approaches have the same final objective: to optimize the application of N in the field surface, reducing its use in the areas with a low production potential while enhancing an increase in yield in the areas with a higher production potential. The first approach is sensor-based, and it is based on the type of NVRA that is being frequently used nowadays in Spain. This approach studies the maximum NDVI as a function of the NDVI at the date of N application and the amount of applied N. After modeling this relationship at the field level, the producer will measure the NDVI of their crops, and, setting their objective maximum NDVI, they will be able to determine the amount of N that should be applied to that measured crop surface. The second approach is a map-based method. This method helps overcome the limitations of NDVI because it studies the amount of N based on the reflectance in the VIS (red, blue, and green) and NIR (near-infrared) bands at the application date, as well as the target yield. After modeling this relationship, the model will be applied to the field of interest, predicting the amount of N that should be applied to each part of the field. The result of the N model will be translated into a georeferenced application map, which will be uploaded to the used equipment.

2.5.1. Data Analysis

As the background and first N coverage are homogeneous for all the surfaces, the figures and tables will consider only the variable application treatments (NC1–NC4). In the case of wheat, the NC4 treatment was excluded from the data Analysis as only 3 pixels of 10 × 10 m were treated, and, from a statistical point of view, that information could not be considered an acceptable representation of wheat response to that N treatment.The coefficients of determination ( R 2 ) were calculated using the data at the spatial resolution of Sentinel-2 (10 × 10 m).
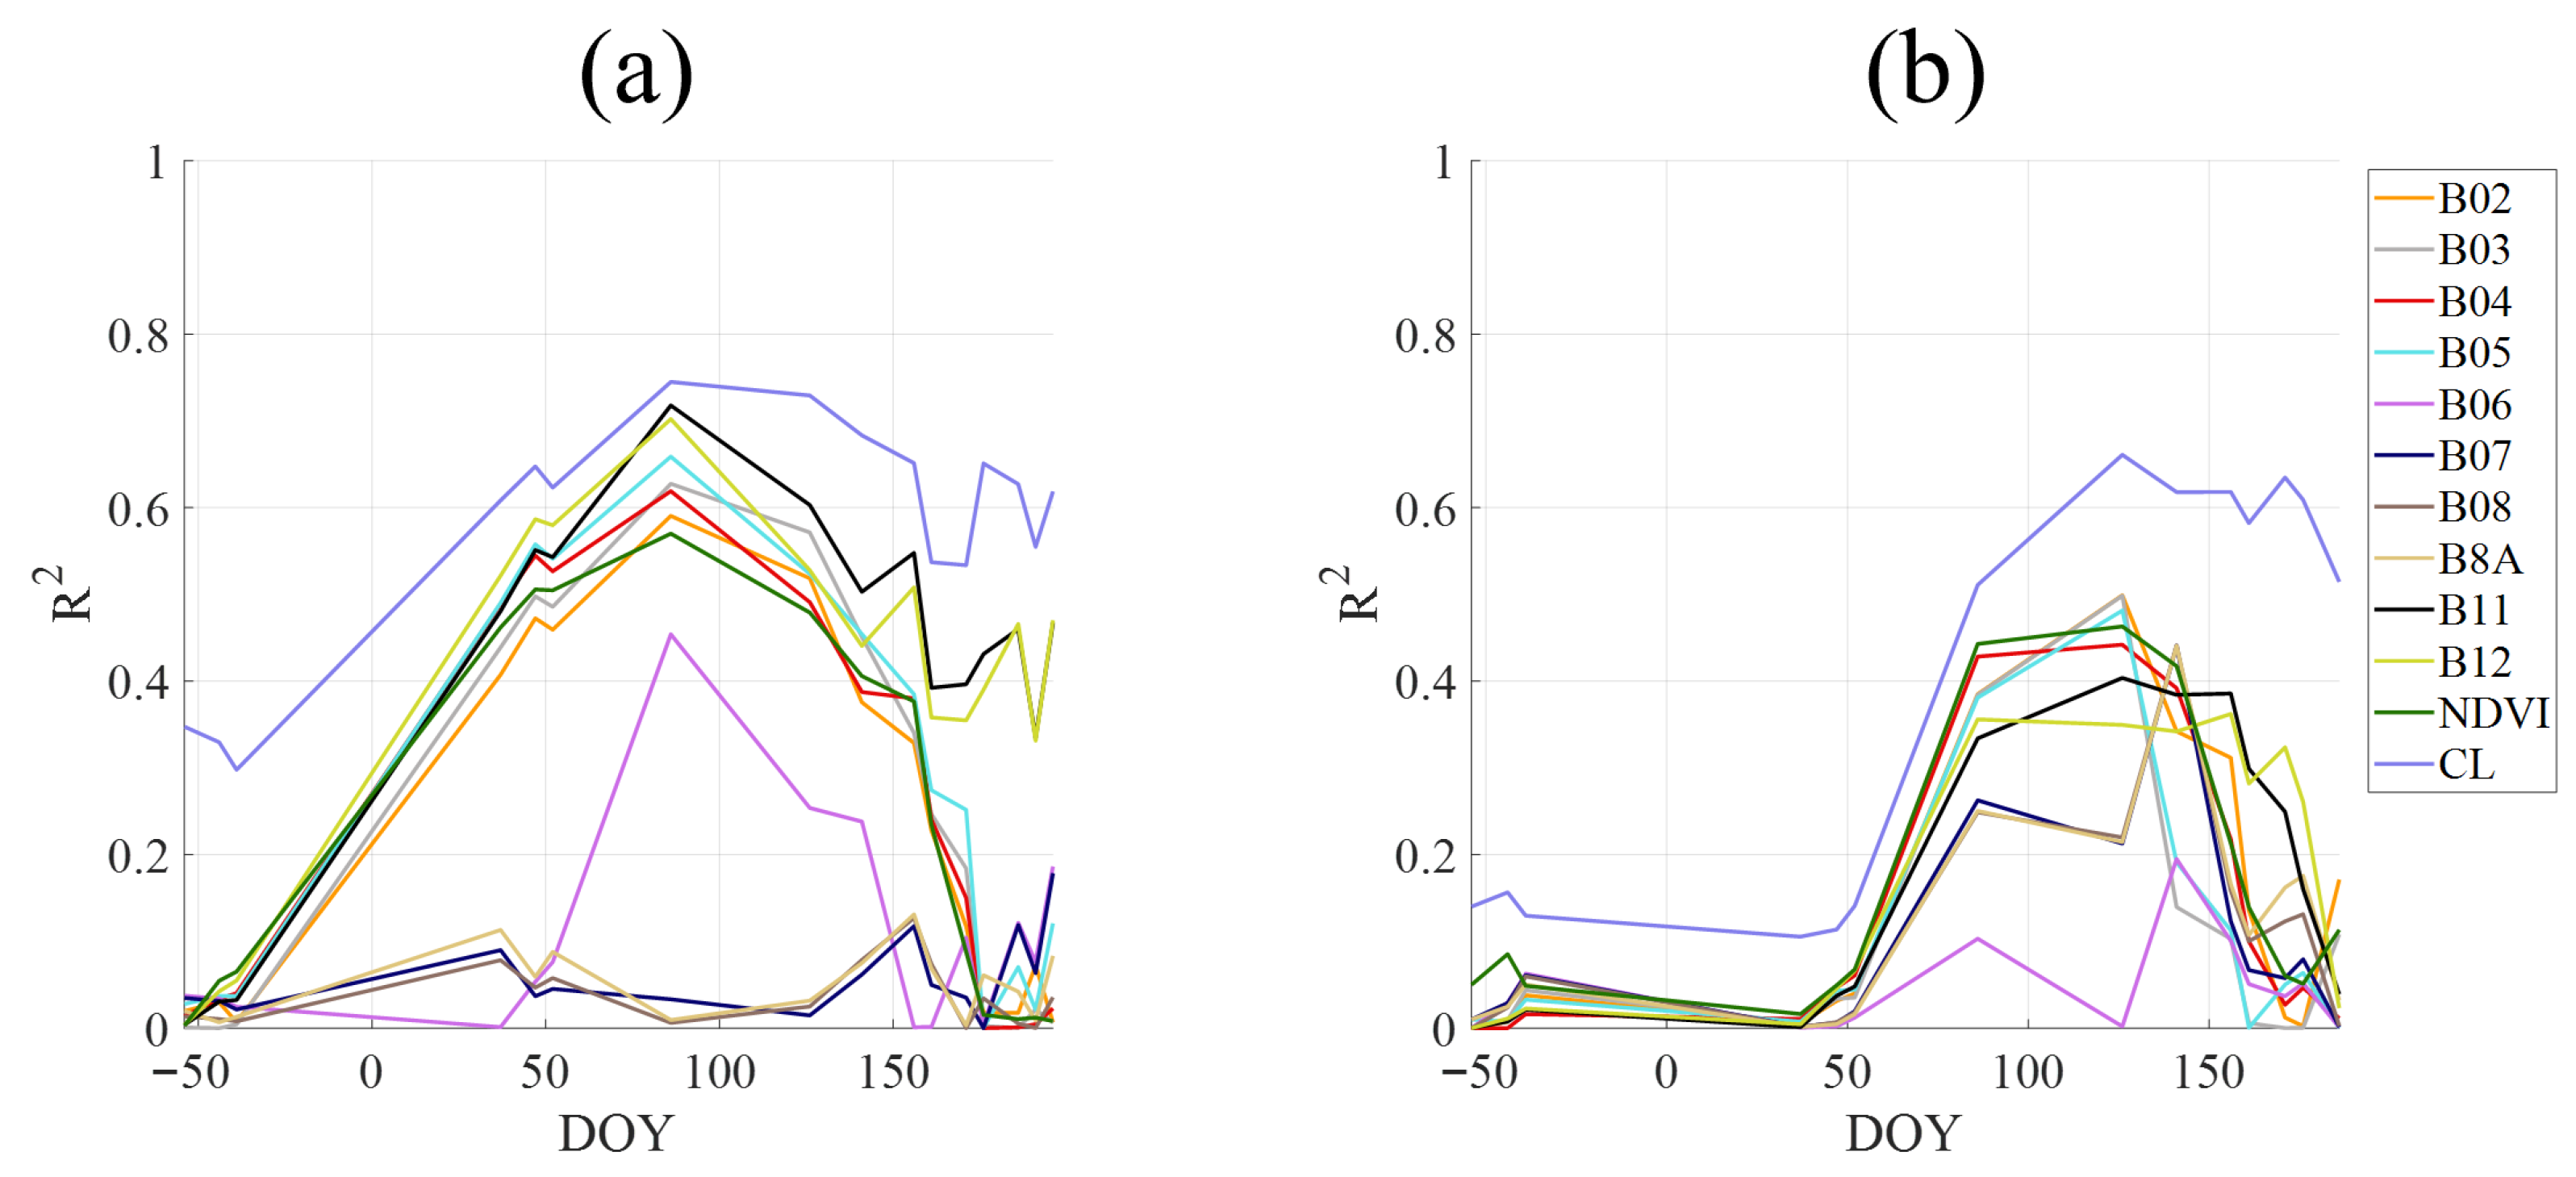
Firstly, the dynamics of the selected Sentinel-2 bands and NDVI through the crop cycle were checked so that, along with field visits, an approximation of the phenological evolution of wheat and barley crops could be made. Thus, the R 2 between the final yield and the vegetation index (VI), reflectance bands, and the linear combination of all bands (CL) was calculated to identify the time points that had the greatest influence on final production. All this is to confirm the suitability of the moment of application of the second coverage, which was applied according to the farmer criteria in the first studied season, to optimize inputs and find a scalable procedure that will help determine the optimum moment of application of the second N coverage in future years.
The next step was verifying the crops’ N influence according to the applied dose. For this purpose, the dynamics of each N dose were studied. Specifically, the post-application dynamics of NIR and red bands, NDVI (Equation (2)) and RVI (Equation (3)), and Red-NIR. In addition, the existence of statistically significant differences between the plants treated with different N doses was checked using a Fisher LSD test (p < 0.05).
NDVI = NIR Red NIR + Red
RVI = NIR Red
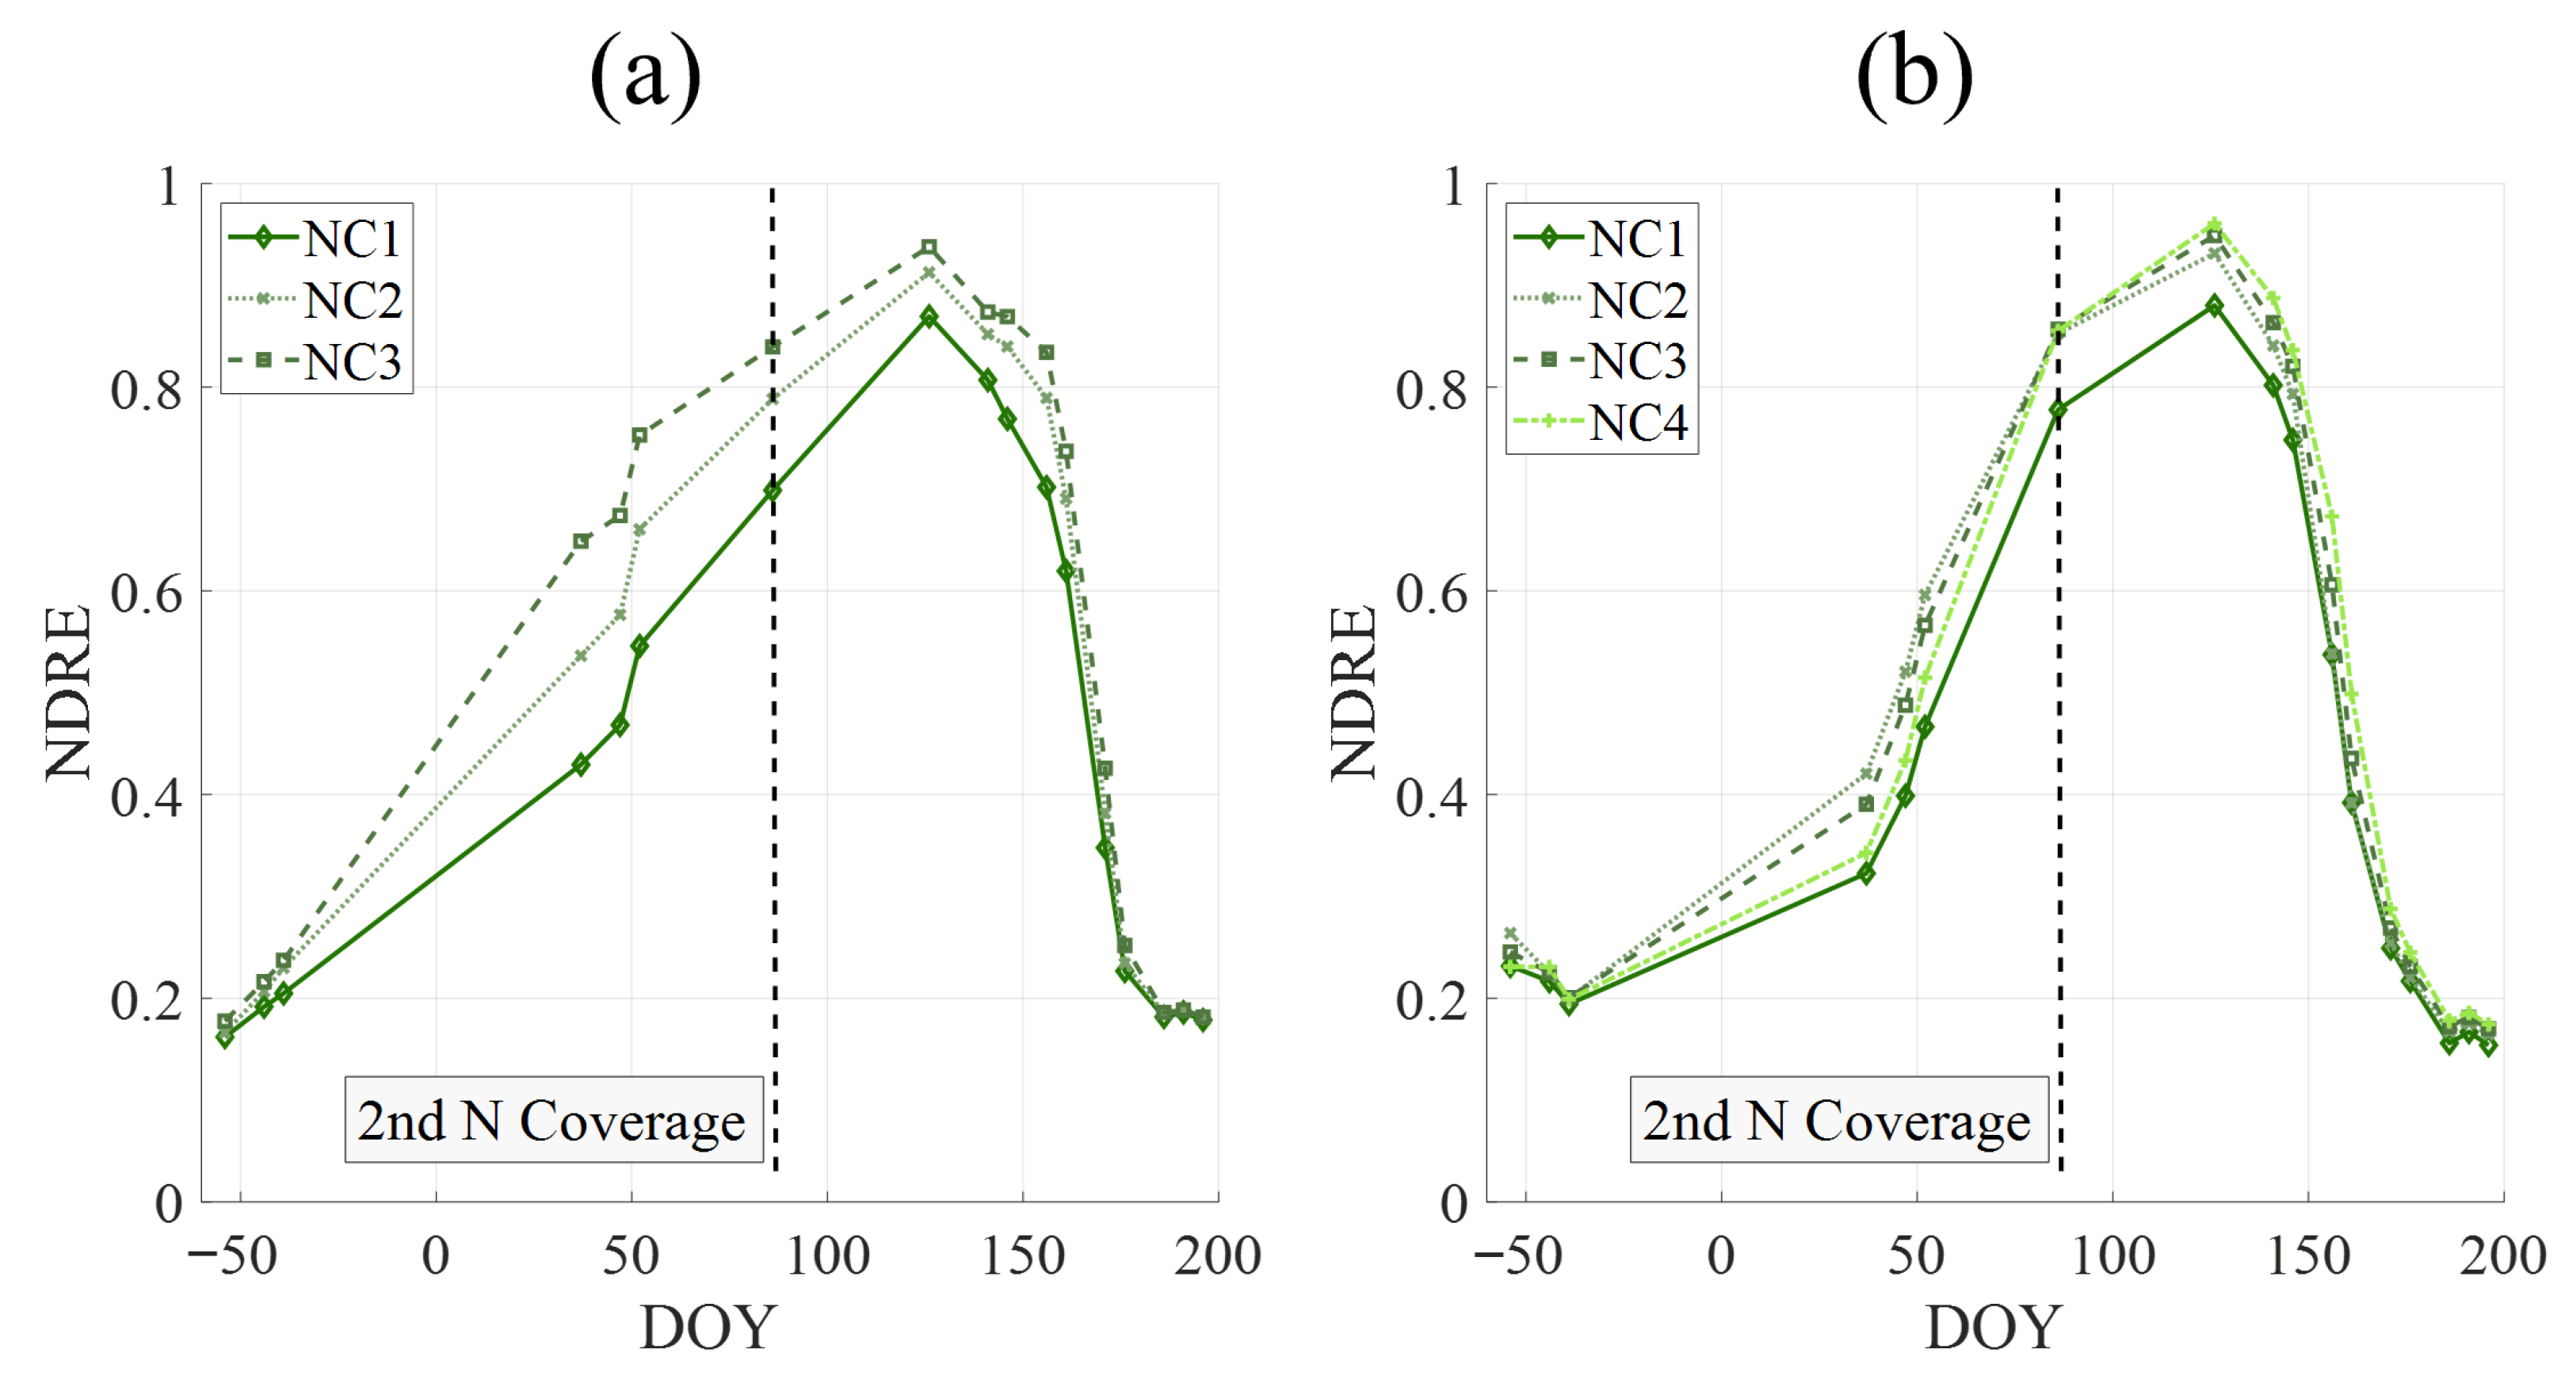
Once the N influence in plants’ reflectance response is checked, a linear adjustment between the NDVI at key moments and applied N was made to determine if a higher quantity of N will always increase the NDVI. To see the influence of the variable application on the final yield, the average yield as a function of the applied dose was studied, while at the pixel level, a plot comparing the final grain yield and the second N coverage application was represented. In parallel, an approximation of the Nitrogen Use Efficiency (NUE) was calculated using the partial balance approach by dividing the final yield ( kg ha 1 ) by the applied N (kg N ha−1) [30]. In addition, the evolution of the NDRE index (Equation (4)) was represented to compare the N content of the plants that will be treated with the different second N coverage doses throughout their entire cycle.
NDRE = NIR Red - Edge NIR + Red - Edge

2.5.2. Model Training and Validation

Two approaches of VRT N fertilization were tested: sensor-based and map-based fertilization. The first approach is centered on the use of measurements of NDVI in situ and its translation into the amount of applied fertilizer. This approach is the most applied in terms of N fertilization due to the low complexity. For this approach, a linear regression was applied to the set of training data, as it is the current type of model that the agricultural machinery is using in Spain. The linear regression was set with the maximum NDVI ( NDVI peak ) as the dependent variable and the NDVI of the application date and the second N coverage as the independent variables. The results of that model were compared with models elaborated with other VIs specifically elaborated to monitor crop N status (NDRE, NDVI g b and Vi opt ), selected based on the validated results of other authors’ studies. Specifically, NDRE has been addressed as a consistent indicator of N status and chlorophyll content, showing a consistent relationship with N uptake of the plants [11,31]; NDVI g b has been demonstrated to be more sensible to chlorophyll and N content, showing less pronounced saturation problems compared to other indices like NDVI or SAVI [17]; and Vi opt has been used for predicting N in crops, giving better results than models trained with reflectance bands and other VI [32].
The second approach is centered on the creation of a fertilization map at the intrafield level with the maximum spatial resolution of Sentinel-2 data (10 × 10 m). Different machine learning algorithms were trained to create the model that could create those maps. The algorithms used were Random Forest, Partial Least Squares Regression (PLSR), and Extreme Gradient Boosting (XGBoost). The amount of second N coverage was set as the target variable. The reflectance data in the VIS (B02, B03, and B04) and NIR (B08) at the date of application and the final grain yield (kg ha−1) were used as predictive variables. The used Sentinel-2 reflectance bands for ML models were the ones with higher spatial resolution (VIS and NIR), as the VIS spectral range is correlated with the chlorophyll and N content (especially in the blue range), and NIR is related to the biomass [17]. Furthermore, the preselection of Sentinel-2 bands was also used to simplify the models and avoid the assignment of a higher weight to repeated values.
Regarding the ML algorithms used to train the models, the selected methods have been extensively used in the literature for prediction models for several reasons. The Random Forest is an ensemble method that randomly selects the provided variables to construct multiple decision trees, avoiding model overfitting when high multicollinearity exists, as is the case of hyperspectral remote sensing data [18]. The employed hyperparameters for the RF were a number of trees of 50, a random seed of 0, and the use of an internal cross-validation procedure to avoid overfitting called out-of-bag (OOB). PLSR is a linear multivariate model that has been useful for multicollinear variables. The employed hyperparameters for PLSR training were a number of components of 5 and no scaling of the variables. XGBoost is also a tree-based ensemble method such as RF, and it enables a low generalization error rate and high accuracy while preventing the overfitting of the data [33]. The hyperparameters to train the XGBoost were a number of trees of 50, a maximum depth of each tree of 3, a learning rate of 0.05, and a random seed of value 0. In addition, the feature importance of each independent variable used to train the ML models was calculated. For the RF, the feature importance was calculated using the Mean Decrease in Impurity (MDI), where all the variables are assigned values from 0 to 1, and values higher than 0.05 indicate that the variable is important in the prediction model. For PLSR, the Variable Importance in Projection (VIP) method was used, with the variables having a VIP score higher than 1 considered important, between 0.8 and 1.0 moderately important, and lower than 0.8 considered not important. For XGBoost, the importance weight method was implemented, assigning values from 0 to 1, indicating a value higher than 0.15 an important variable, between 0.10 and 0.15 a moderately important variable, between 0.05 and 0.10 a slightly important variable, and values lower than 0.05 a non-important variable.
The dataset stratification was made independently for each crop studied (wheat and barley). In this sense, for each crop, the datasets of both studied seasons (2019–2020 and 2020–2021) were split randomly using a ratio of 80–20%. 80% of the split data was used to train the models. All the models were cross-validated using the testing data set (the remaining 20% of the data from both studied growing seasons), which was not used during the training process, applying the hold-out validation method. The performance of the models was evaluated using R2, the Mean Absolute Error (MAE), and the Root Mean Squared Error (RMSE). To increase the statistical reliability of these performance metrics, bootstrap confidence intervals for a 95% confidence were calculated for the metrics of all the trained and validated models. The bootstrap method was used, as it is to estimate a range of plausible values for a parameter by repeatedly resampling from the original sample data, without having to use classical methods that assume a normal distribution of the data. In this case, a bootstrap with 1000 resamplings (n_iterations = 1000) and a size equal to the size of the original dataset (training or test datasets) was applied (size = len(dataset)); the replace function in the bootstrap resampling was activated (replace = True).

2.5.3. Software

The processing of yield maps, nitrogen maps, and Sentinel-2 data was performed with QGIS 3.10.14, while the statistics were performed with Statgraphics Centurion 18. The training and testing of the linear regression models were performed using the library scikit-learn 1.2.2, as well as the application of the Random Forest and PLSR algorithms, and the determination of the performance metric of the models and their confidence intervals. The training and testing of the XGBoost algorithm were performed using the library xgboost 3.0.5.

3. Results

3.1. Study of the Optimum Moment of Application

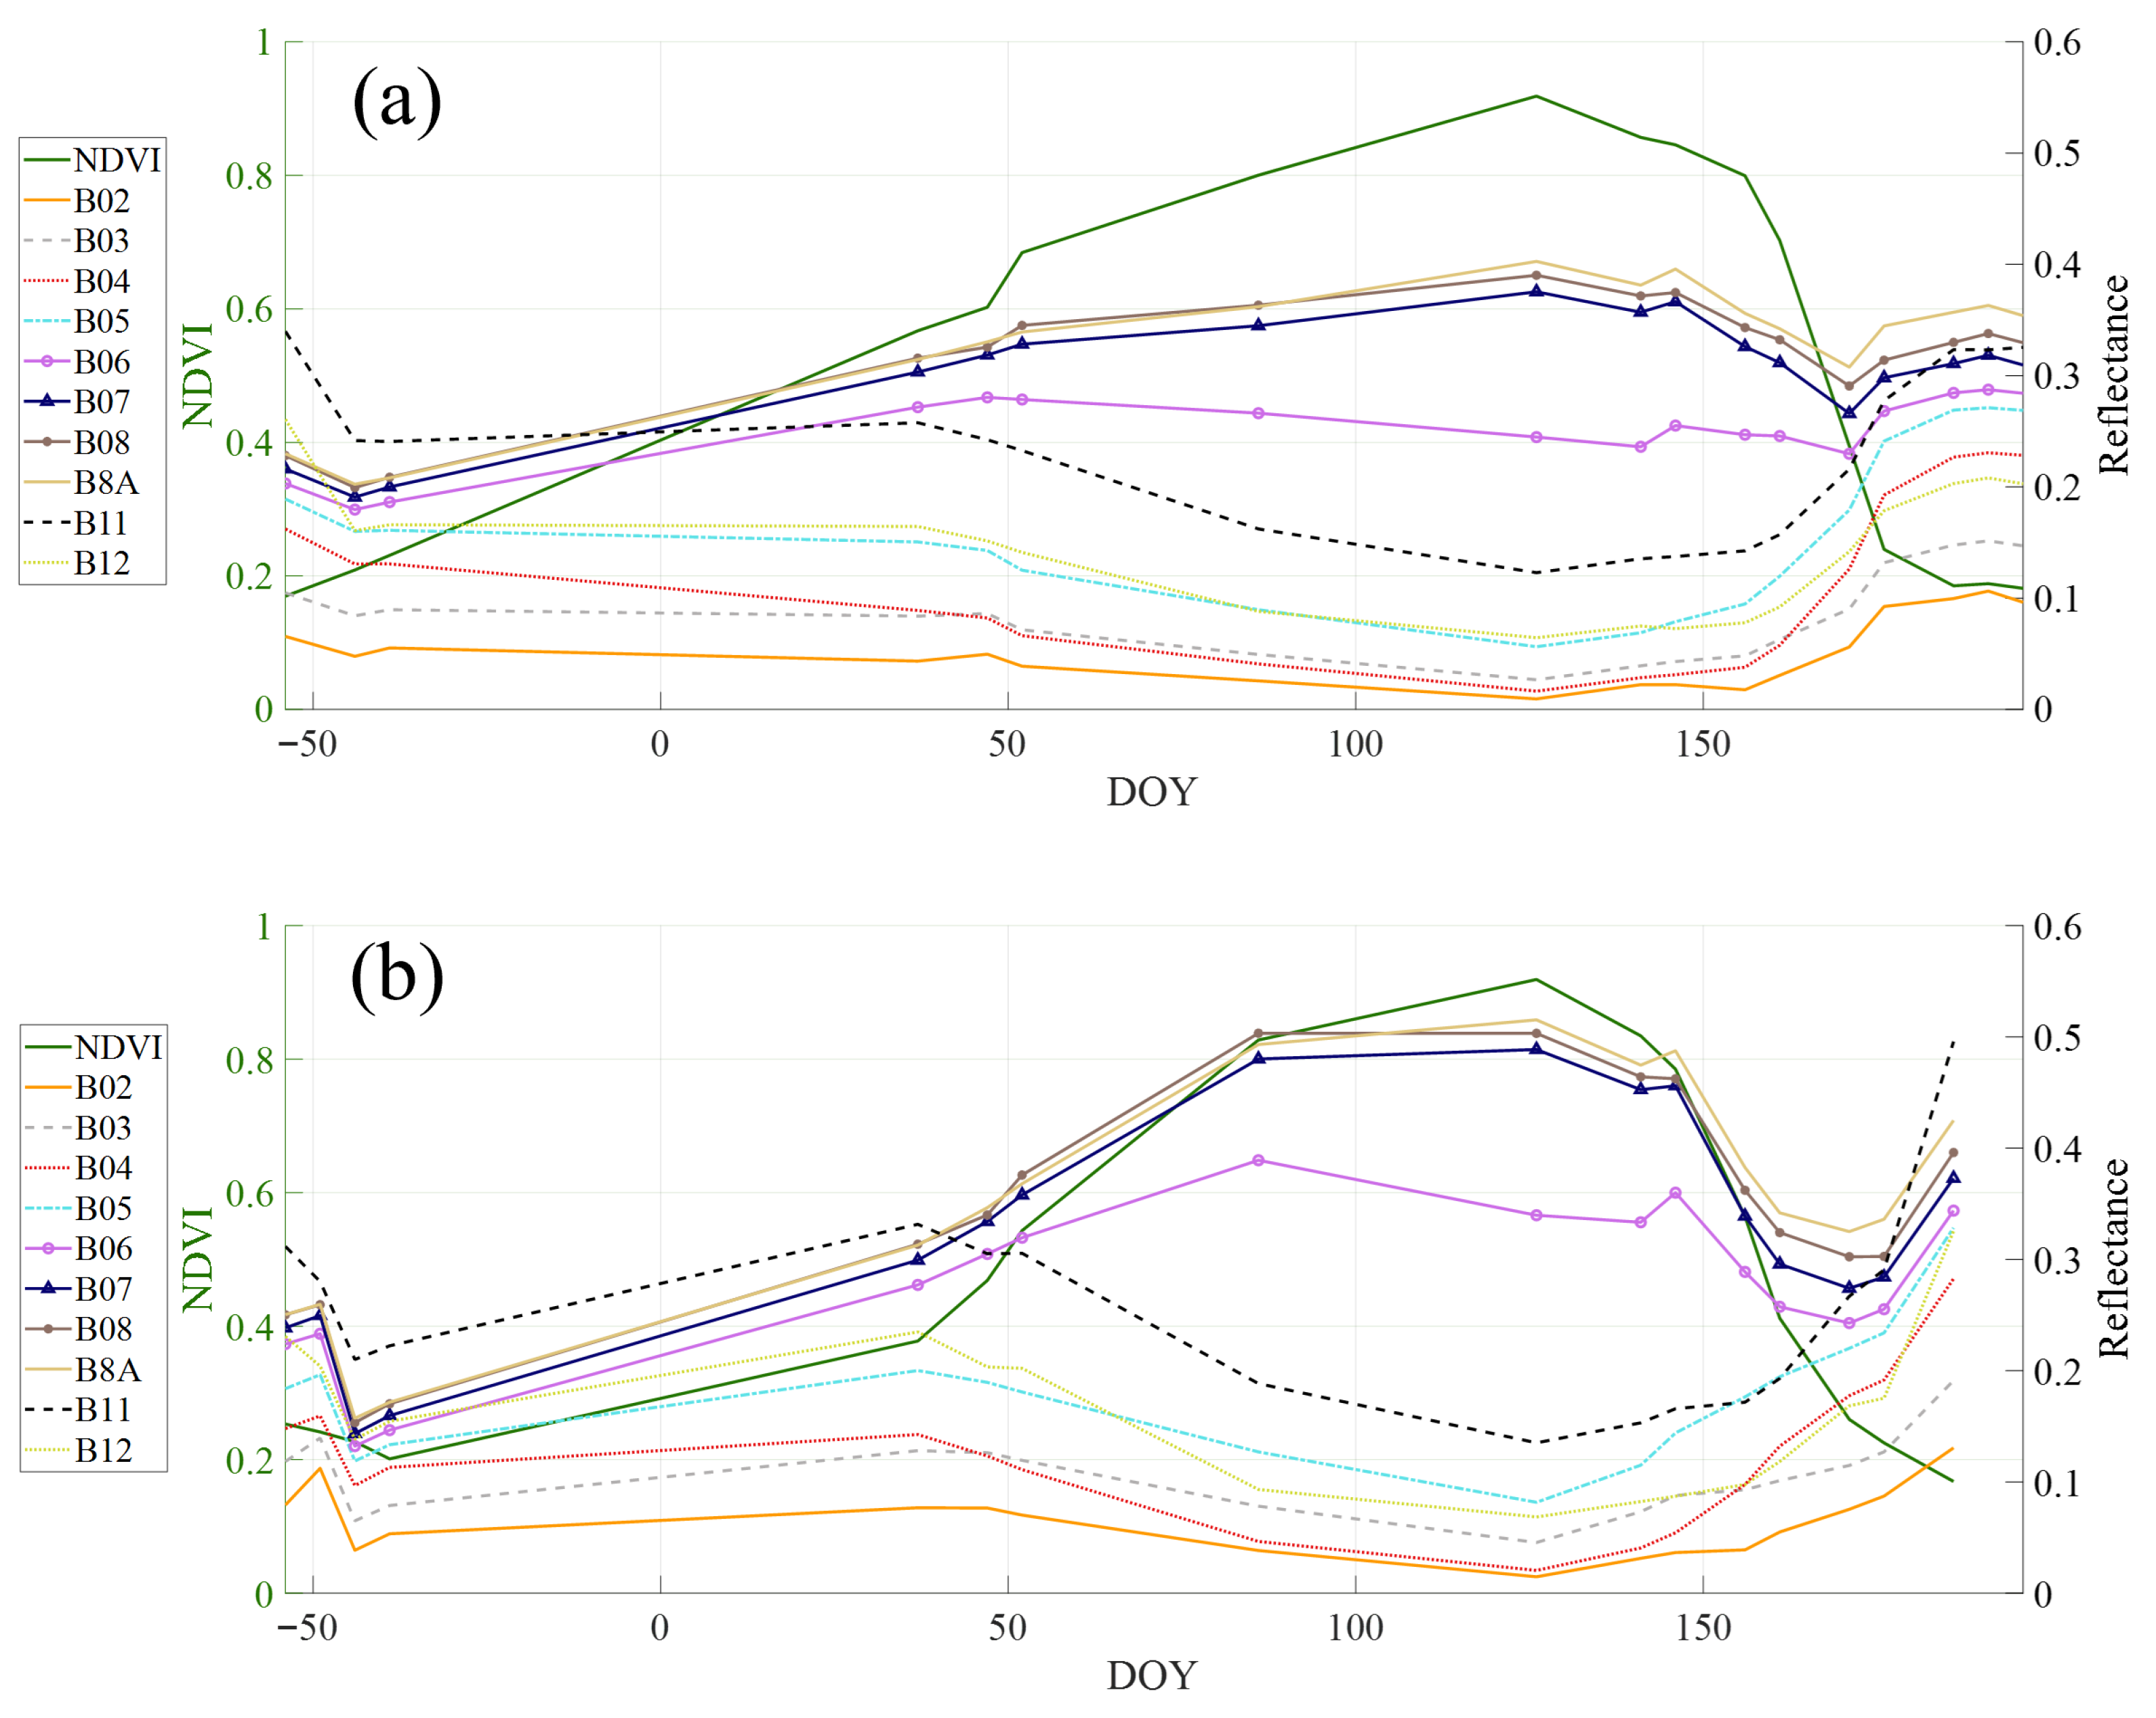
In view of Figure 7, it was seen that the spectral behavior of both crops was similar, even if the evolution of R2 differed (Figure 8). On the side of wheat, the highest values of R2 (Figure 8a) were reached between 86 and 156 DOY, indicating a determinant period for final yield in the bands of visible and red-edge (B05 and B06), and NDVI and CL, finding a peak on 86 DOY, three days after the N application. Regarding NDVI, its value increased more rapidly from 52 DOY until it reached its maximum of 126 DOY, followed by a slightly constant period until 156 DOY, followed by a decline. Two tendencies can be appreciated concerning reflectance evolution (Figure 7a): a progressive increase in the reflectance of the B08, B8A, and B07 bands (from 52 to 141 DOY) followed by a decrease in their values. Meanwhile, the visible bands, SWIR, and red-edge bands (B05 and B06) show the opposite trend: a decrease in reflectance (from 52 to 141) followed by an increase. On the side of barley, the highest values of R2 (Figure 8b) were reached between 86 and 156 DOY, finding a peak in the visible bands and NDVI at 126 DOY, and one peak in the SWIR bands at 141 DOY. Regarding NDVI and reflectance evolution (Figure 7b), it was appreciated that the tendency was equal for wheat.
Regarding the determination of the date of application of the upcoming seasons, the following protocol indicative of the moment to design the N application was established based on the evolution of NDVI and band reflectance, in which all the requirements must be fulfilled simultaneously for three consecutive satellite measurements as long as, between the first and third date, less than 20 days have passed:
1.
The NDVI value must increase or be constant (the second case with NDVI values higher than 0.7).
2.
For wheat crops, the reflectance of the B06 band should remain constant (differences between consecutive dates of less than 0.015), whereas for barley crops, the reflectance of this band should increase. The reflectance in the visible and B05 bands must decrease.
3.
The reflectance in the NIR and B07 bands must increase (in a range between 0.3 and 0.4) or be constant.
Once these conditions are met, the application of N will be made at the beginning of the stem elongation, which was observed to be marked by a simultaneous reduction in the reflection of SWIR and red bands and a decrease (in wheat crops) or an increase (in barley crops) in reflectance of the B06 band. Nevertheless, this phenomenon could take place between 15 and 30 days later, so if satellite measurements without clouds are not taken for 15 days, it would be necessary to visit the yield to check the plants’ phenological stage.
Knowing that and in view of Figure 9, the application date for wheat in 2020–2021 was made between 96 and 106 DOY after field confirmation of the phenological stage.

3.2. Crop Response to Variable N Application

3.2.1. Crop Reflectance Response

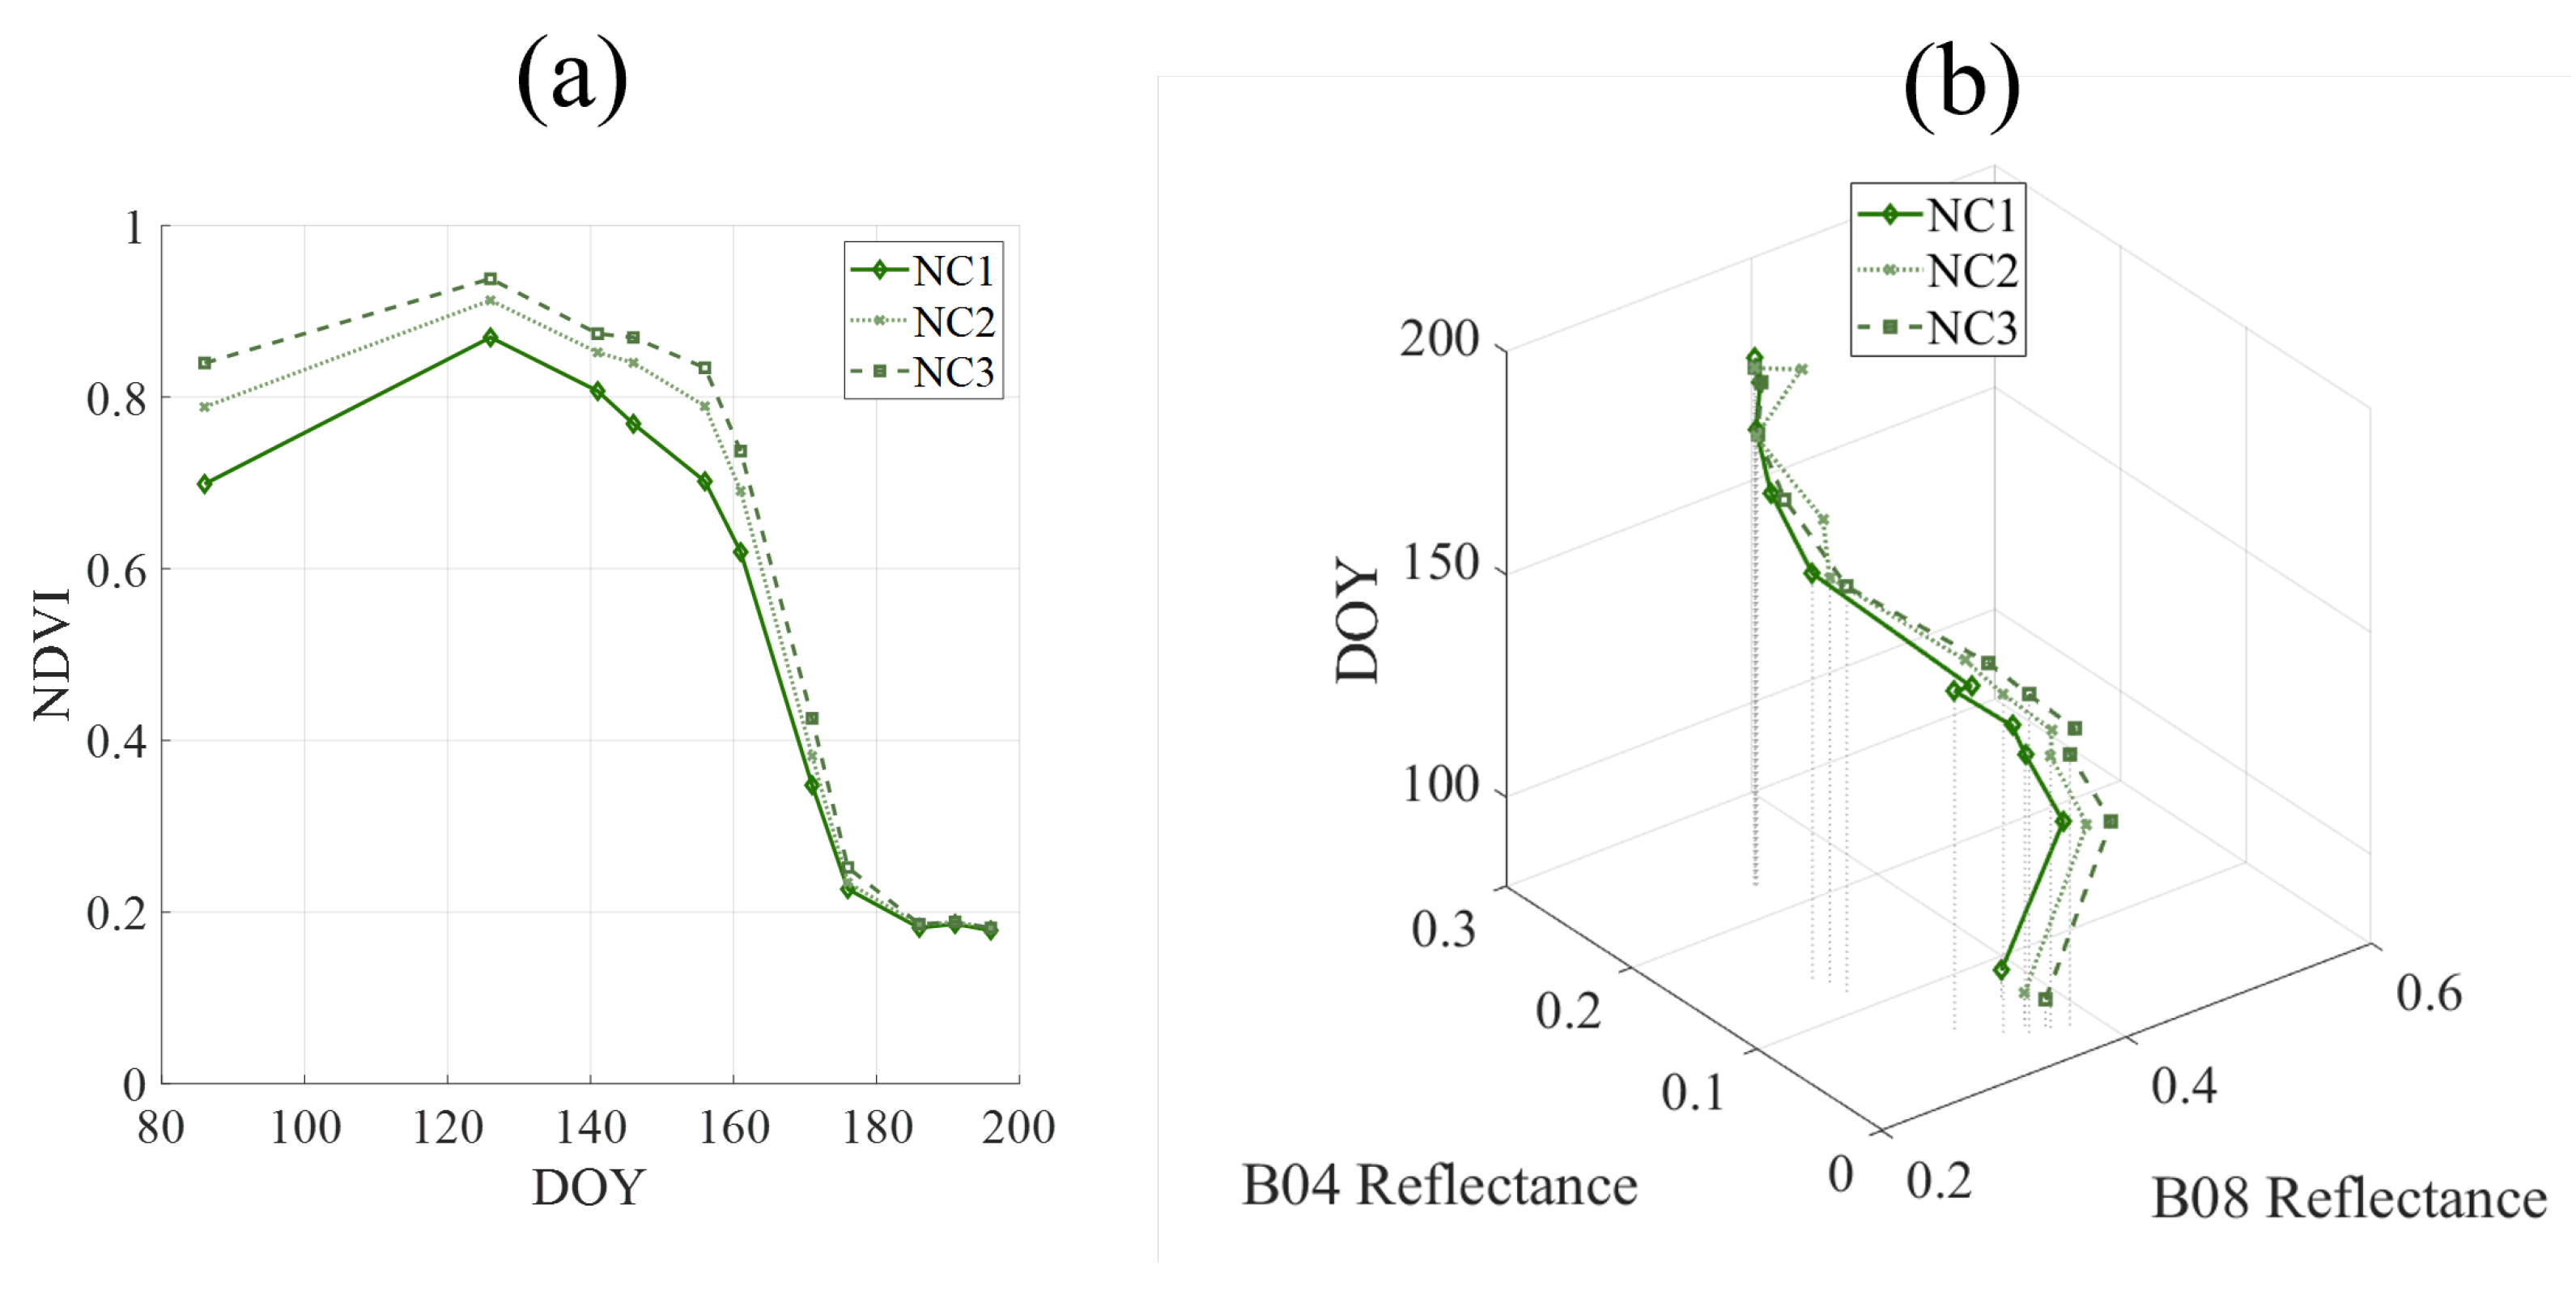
A higher dose of nitrogen results in statistically significantly higher NDVI values (DNS), which occur until the end of the wheat crop (Figure 10a). However, the initial slope after the second coverage application, between 86 and 126 DOY, was higher as the applied amount was smaller, having NC1 of 0.4%, NC2 of 0.3% and NC3 of 0.2%. Moreover, from 141 DOY, the decrease in NDVI values is faster the lower the amount of N received by plants, as can be seen after looking at the slope between 141 and 156 DOY (NC1 has a slope of −0.7%, NC2 of −0.4% and NC3 of −0.3%). On the other hand, B04 reflectance values are statistically significantly higher (DNS) the lower the amount of N received by the plant, while B08 reflectance increases statistically significantly (DNS) as received N increases. Figure 10b shows that the B04/B08 evolution dynamic follows the same tendency in all the treatments. From 86 DOY, wheat improves its NIR value until it reaches its maximum value, while the red value decreases until reaching its minimum value at 126 DOY. From that time until 171 DOY, NIR values will increase, and red values will decrease. From 171 DOY until the end, NIR values increase due to interferences with soil since the wheat plants have entered ripening and senescence stages when they progressively dry out.
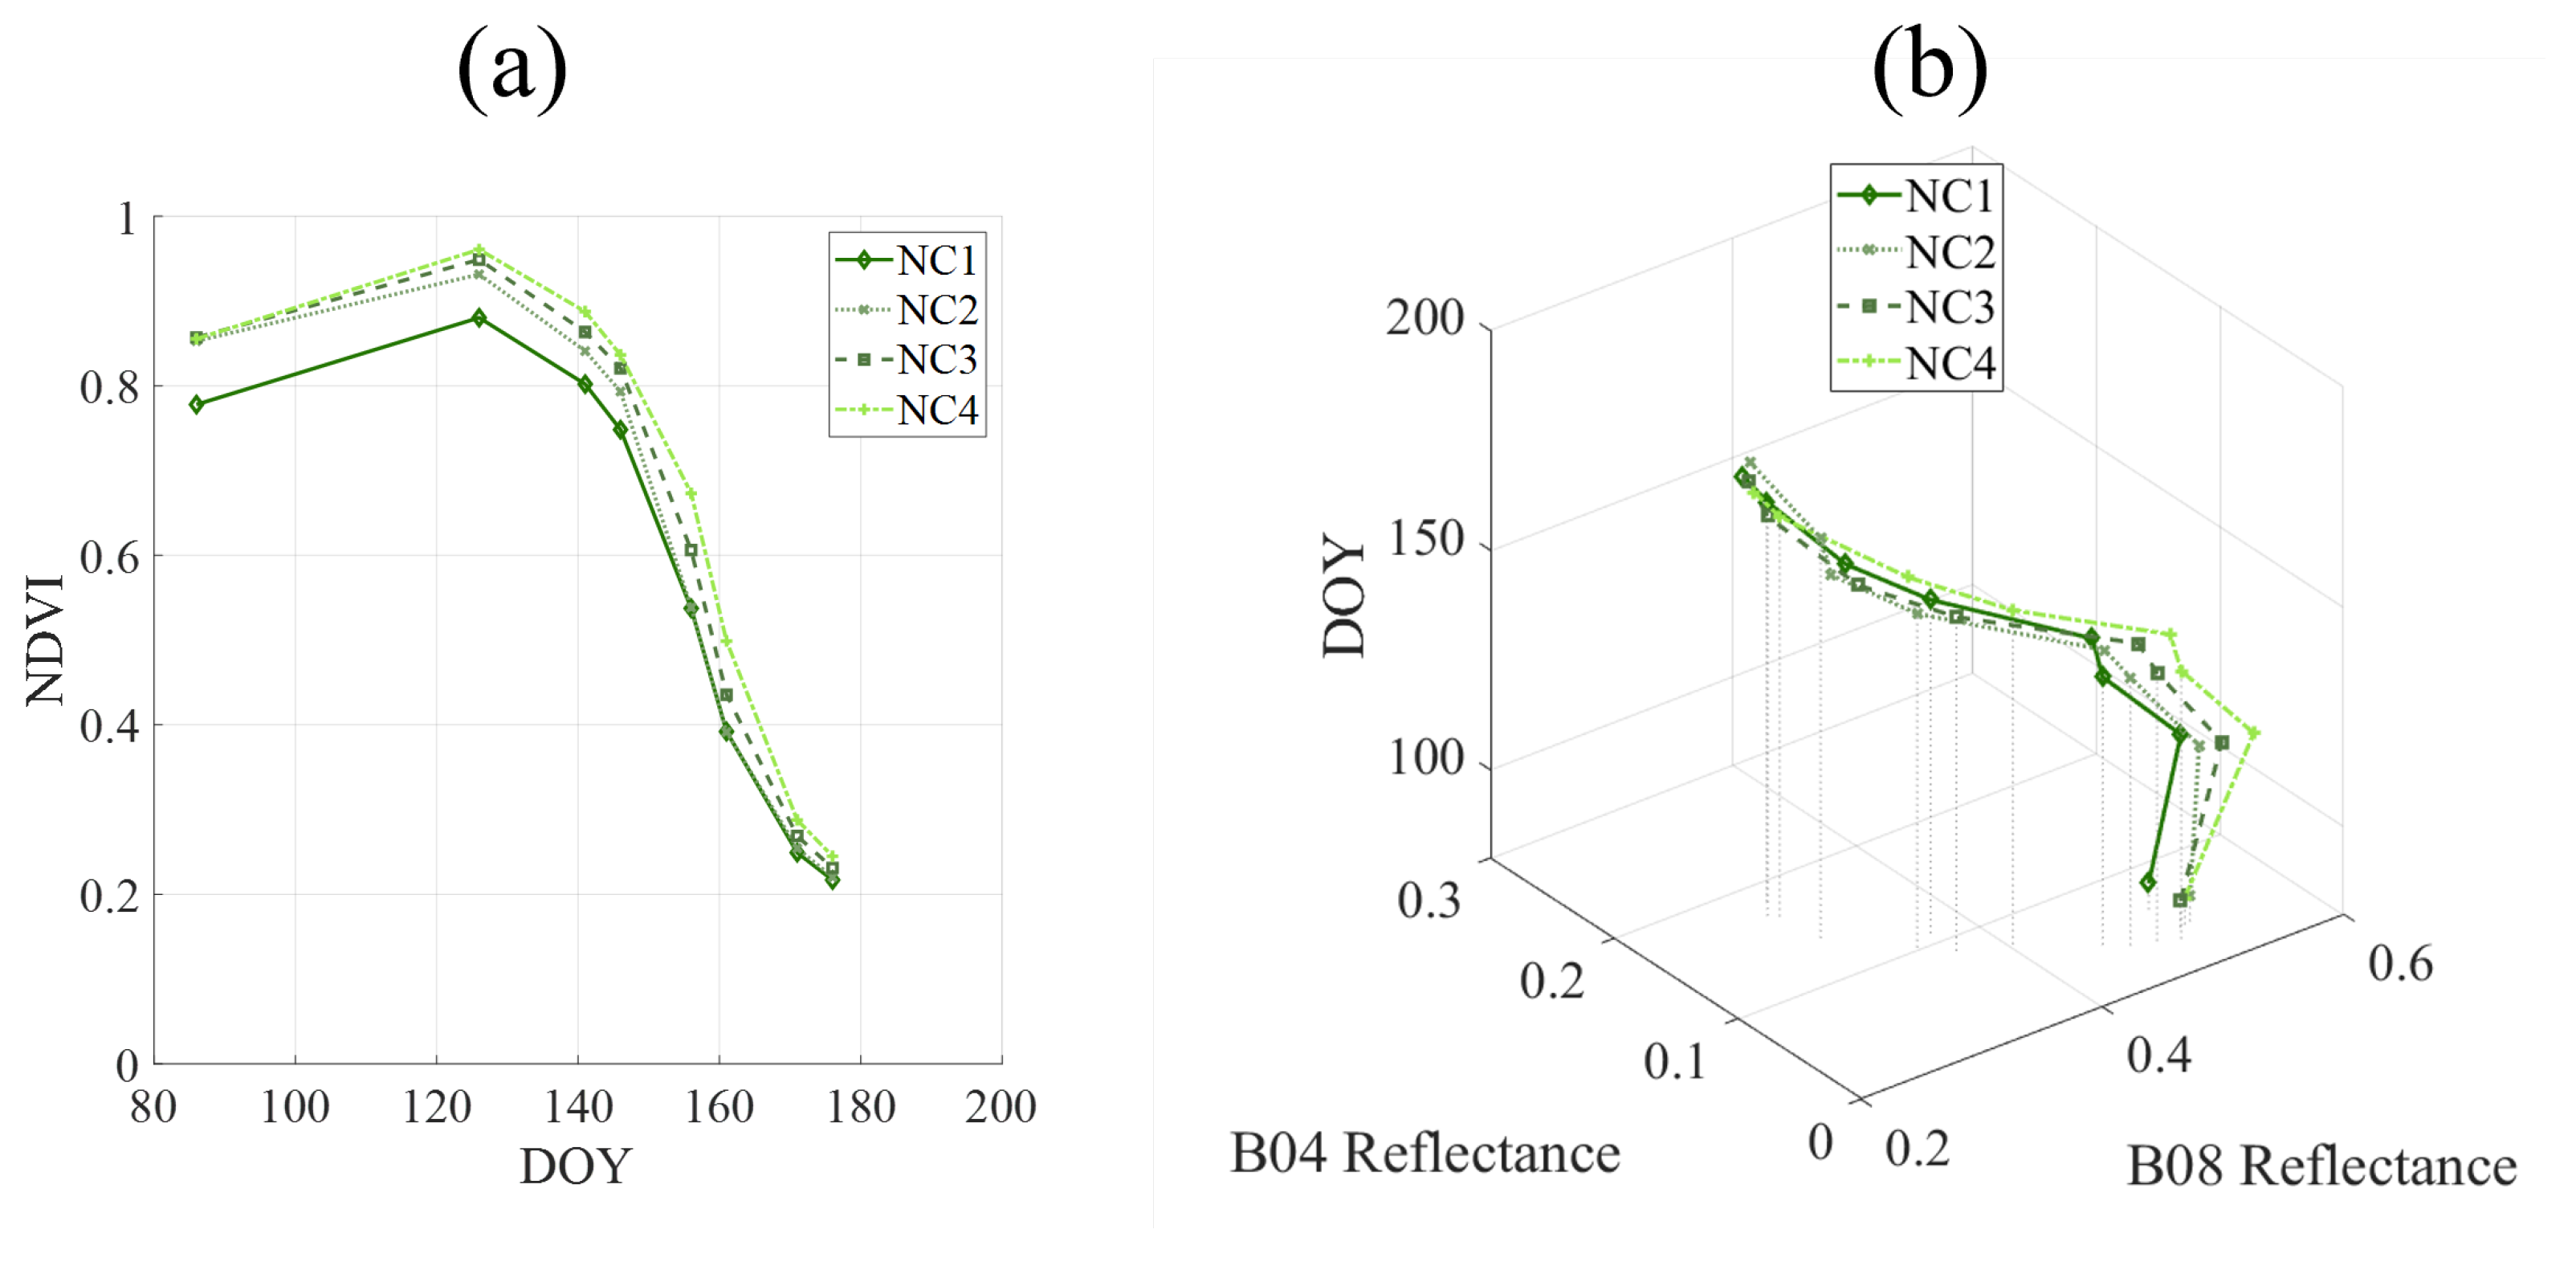
Regarding barley, it’s observed that NDVI (Figure 11a) is higher as N application increases. However, in the phenological stage of fruit development, only the areas where the highest N dose (NC4) was applied show a statistically significantly higher NDVI (NDS). Unlike wheat, in barley crops, a higher N dose did not improve the NDVI differently since the initial slope (from 86 DOY to 126 DOY) was the same for all the cases. Nevertheless, differences were found in NDVI maintenance between 141 and 156 DOY (heading and flowering stages), finding that NC4 and NC1 have slopes of −1.7% and −1.8%, respectively. NC2 and NC3 have slopes of 2% and 2.1%. In the case of B04 reflectance, as it happened in wheat, the higher the applied N was, the lower the B04 reflectance was (Figure 11b), while NC4 increased significantly with the NC4. Figure 11b shows that the evolution of B4/B8 in the areas applied with variable N application follows the same tendency. This evolution makes it readily appreciable that during the booting and heading stages (from 86 to 141 DOY), the higher the N application, the higher the maximum NIR values and the lower the minimum red value. From 141 to 171 DOY, the barley plants that received the highest N dose (NC4) lost B08 reflectance in an accelerated way, while B04 reflectance increased in the rest of the cultivated area. It should be noted that, after the heading stage, there were no significant differences in the barley behavior where intermediate N doses (NC2 and NC3) were applied (NDS).
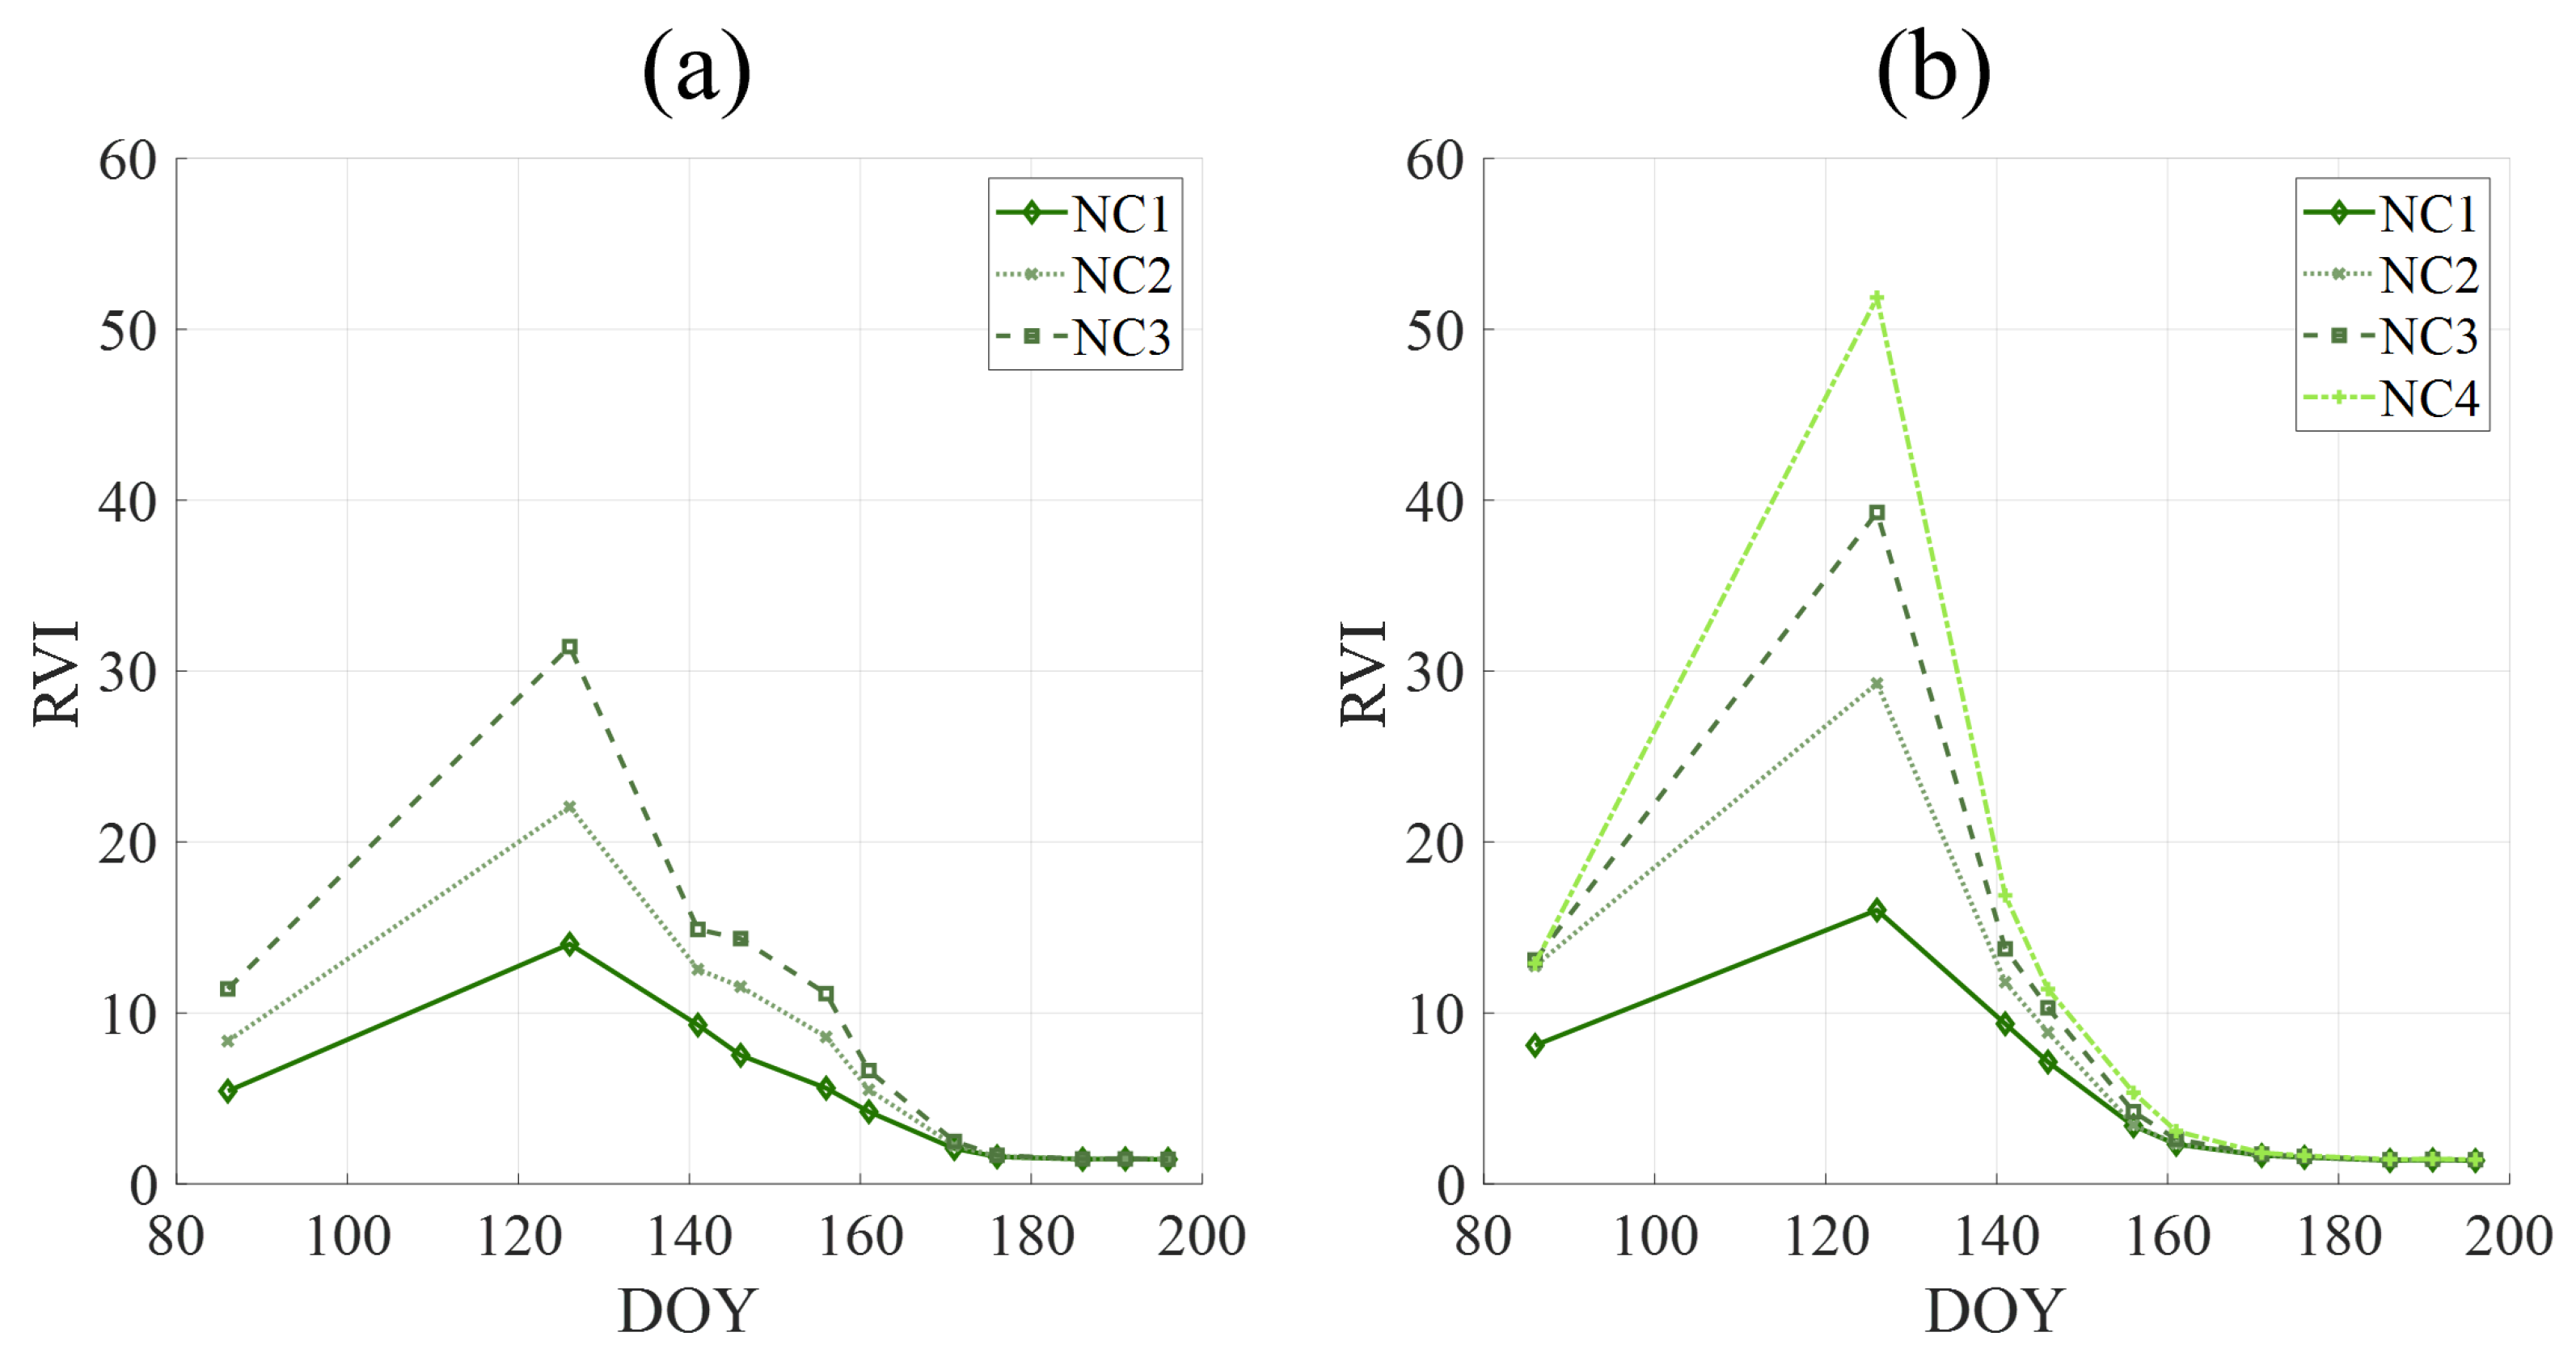
To recap, for both crops, a higher application of nitrogen was translated into better NDVI values until the moment of harvest. This also applies to NIR and red reflectance, observing higher values of B08 and lower values of B04 from the beginning of the booting stage until the end of the heading stage. Even so, the RVI index is presented as a tool that highlights the differences between vegetation, being able to appreciate in Figure 12 wide differences between treatments in both crops, with higher RVI values as applied N increases until the last phenological stages, a moment in which the final yield has already been settled. These differences are especially noticeable in barley (Figure 12b), where N treatments NC2, NC3, and NC4 had the same RVI value right after the N application, growing apart after that.

3.2.2. Final Yield

Concerning the final yield, the average values increased as the N dose increased (Table 3). Nevertheless, it can be noted that wheat’s response to N application is better than that observed in barley. Thus, for a range of N between 45 and 60 kg N ha−1, the yield increase between the highest and lowest N dose areas was 1307 (18.4% increase) and 972 (17.0% increase) kg of grain ha−1 for wheat and barley, respectively.
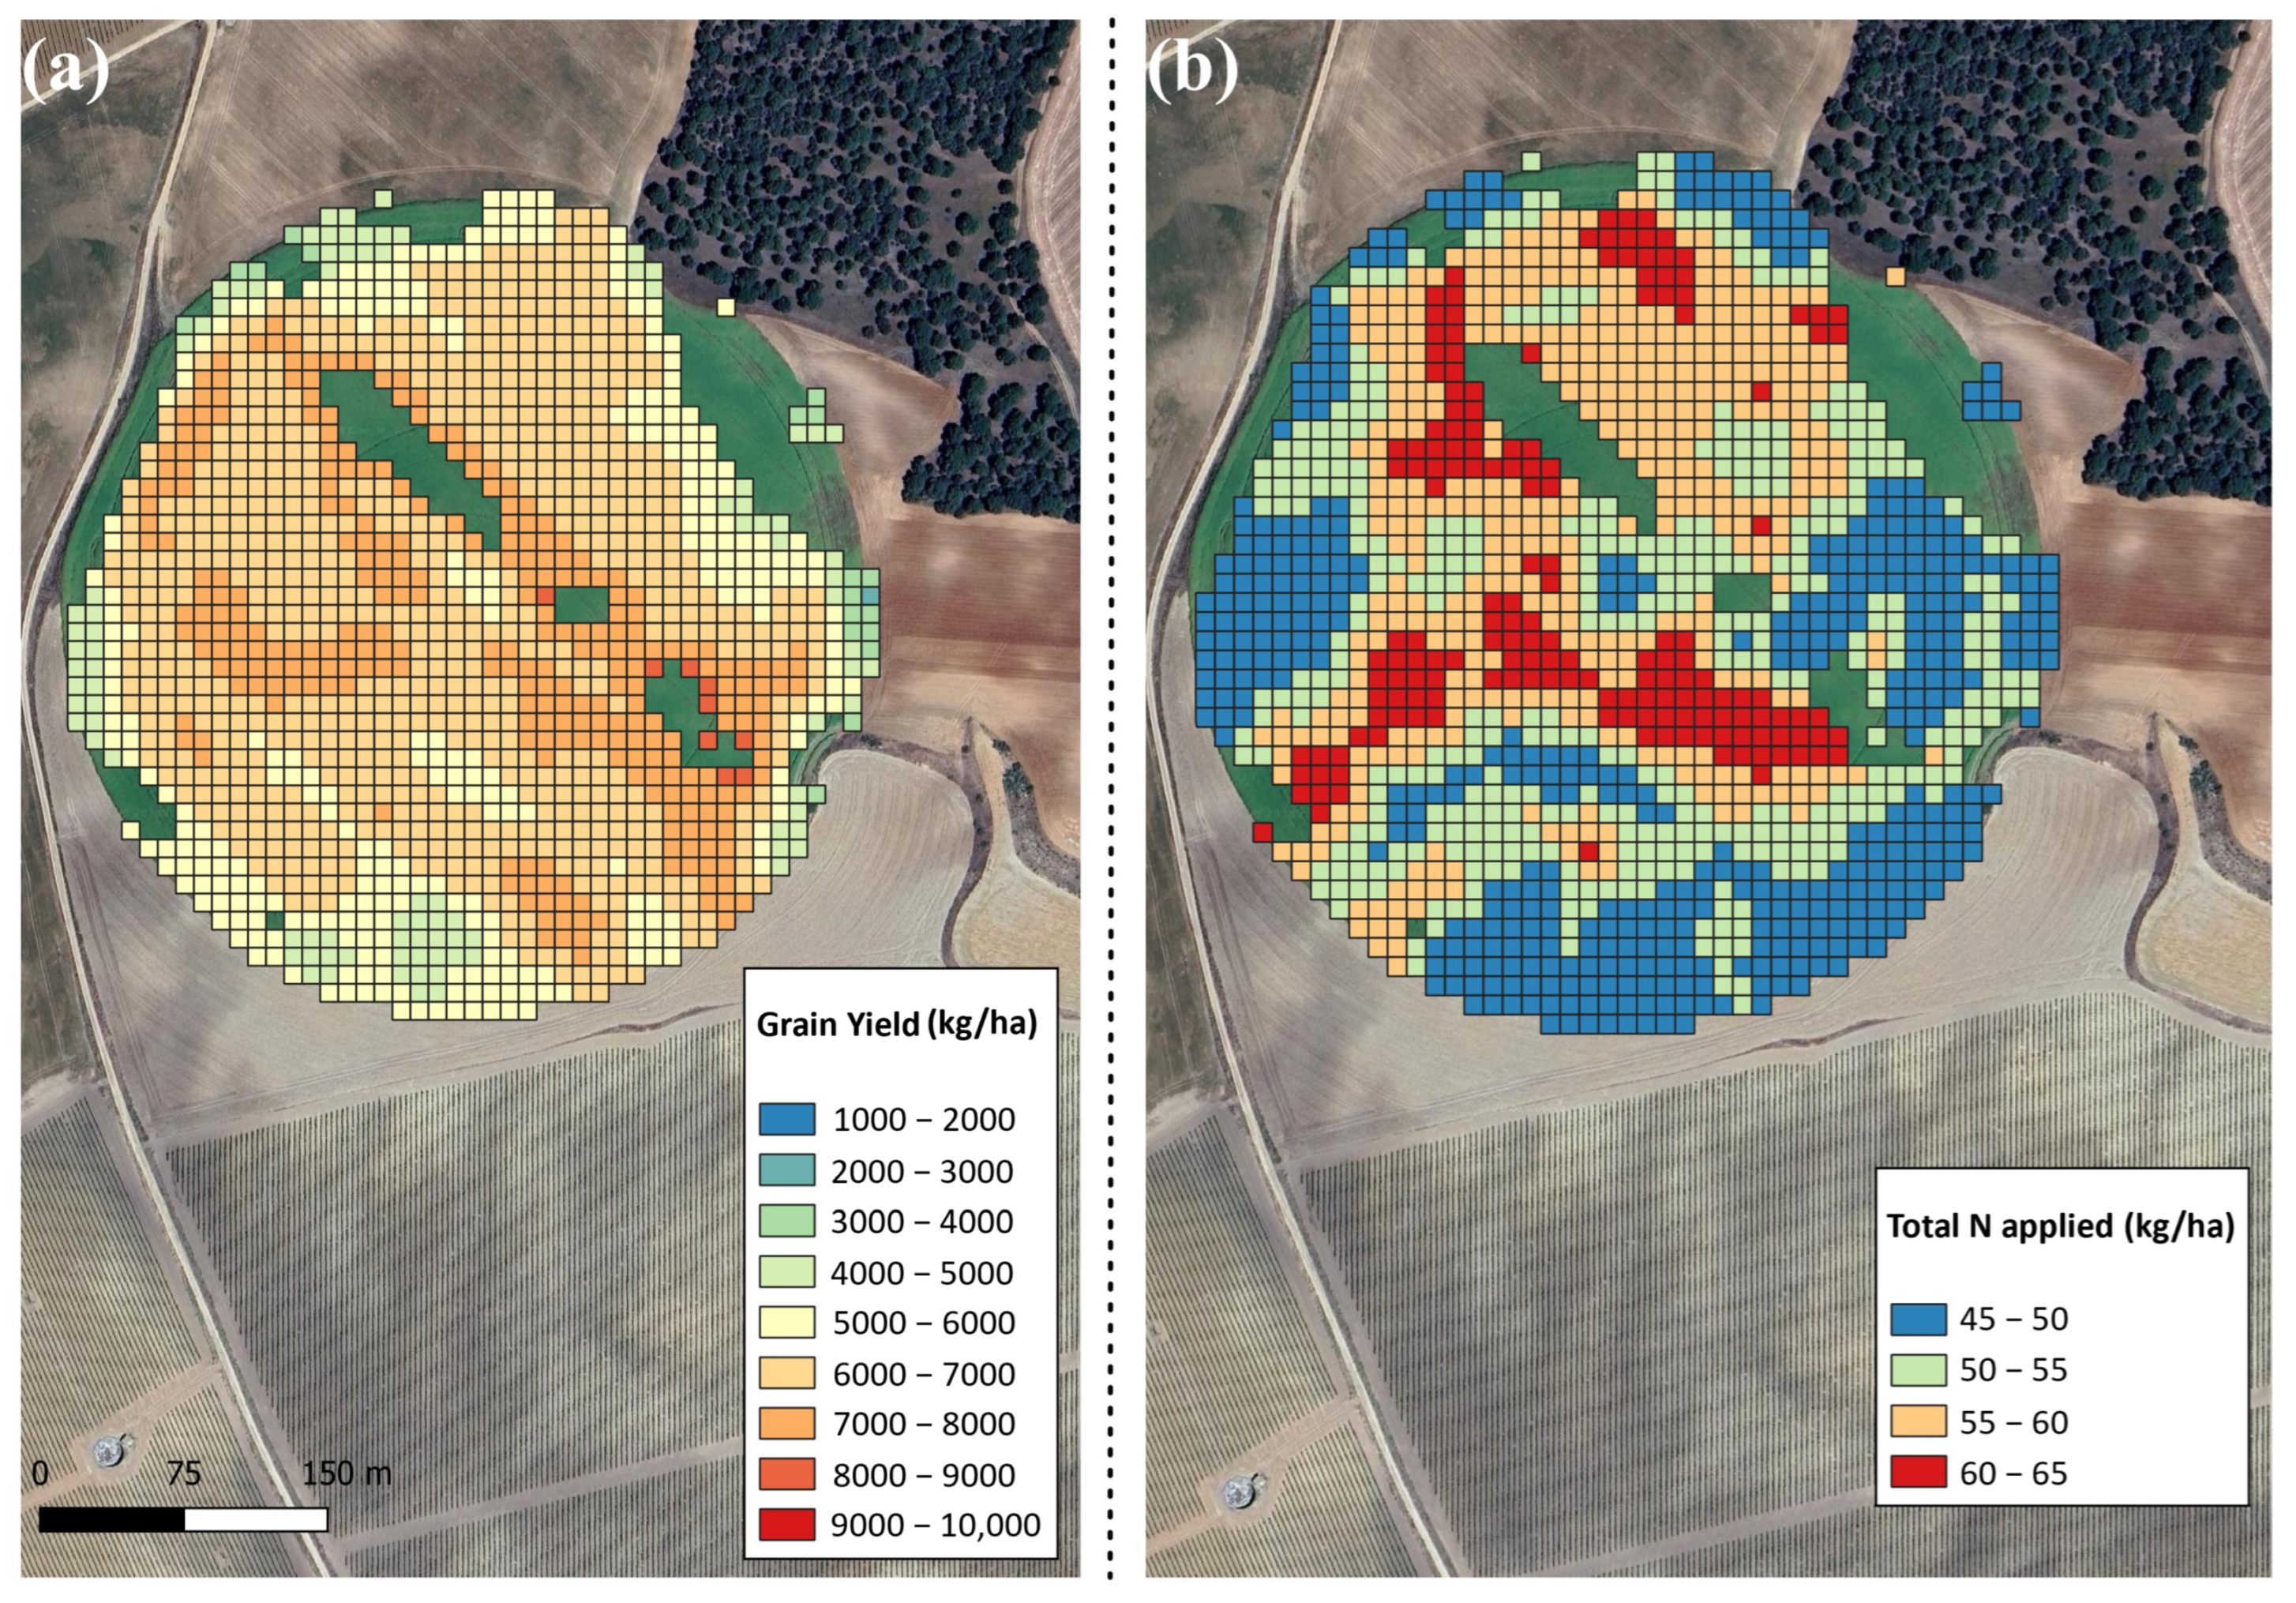
Figure 13 shows an example of the response of final grain yield (kg ha−1) to the application of the second coverage, appreciating how higher final yield areas tend to overlap with the areas that received a higher amount of N (NC3 and NC4). The contrary can be said of the pixels receiving the lowest N (NC1) dose, generally showing a lower grain yield.

3.2.3. Relation Between NDVI and Applied Second N Coverage

A linear adjustment between NDVI and applied second N coverage was made in 126 and 141 DOY, important moments when not only the NDVI value is maximum but also R2 between yield and reflectance bands and studied VI (Figure 8). In this context, Figure 14 shows that average nitrogen coverage and average NDVI can be linearly adjusted, as no saturation effect is observed in the graphs within the studied N range.

3.3. Final Nitrogen Use Efficiency (NUE) Approximation

Looking at Table 4, it can be clearly seen that this linear relationship is not maintained with NUE. In both crops, it is verified that middle N doses (NC2) are translated with higher efficiency. Although the NUE is higher in wheat crops.
The NDRE evolution was represented (Figure 15a,b). Before the second N coverage application in both crops, the plants receiving more N due to their higher productive potential had a higher NDRE value. After the treatment, the plants with higher NDRE continued to have a better NDRE. Nevertheless, the treatments with intermediate doses of N (NC2 and NC3) showed similar NDRE, indicating an increase in N presence in the plants.

3.4. Prediction Model of Maximum NDVI for Sensor-Based Fertilization

The prediction model of NDVIpeak is elaborated for each crop (Equation (5)), based on the NDVI value at the date of application of the second N coverage and the N applied in the second coverage (Table 5).
N D V I p e a k = a 0 + a 1 · N D V I a p p l i c a t i o n + a 3 · N s e c o n d c o v e r a g e
The model’s performance yielded an R2 of 0.51 ± 0.04 and 0.74 ± 0.01, an MAE of 0.024 ± 0.001 and 0.038 ± 0.001, and an RMSE of 0.048 ± 0.004 and 0.052 ± 0.002 for wheat and barley, respectively. Furthermore, the structure of this model was replicated using several indexes that were specially created to monitor N status in plants. However, the results were worse than the ones obtained with the model that used NDVI values. In particular, the indices tested were NDRE (R2 = 0.27, MAE = 0.017), NDVIg−b (R2 = 0.15, MAE = 0.05) and Viopt (R2 = 0.14, MAE = 0.23).

Validation of the NDVIpeak Prediction Models

Figure 16 shows the linear adjustment between the maximum NDVI (Reference) and the estimated maximum NDVI in the case of wheat. R2 validation was 0.55 ± 0.06, the MAE value was 0.025 ± 0.002, and the obtained RMSE was 0.049 ± 0.007.
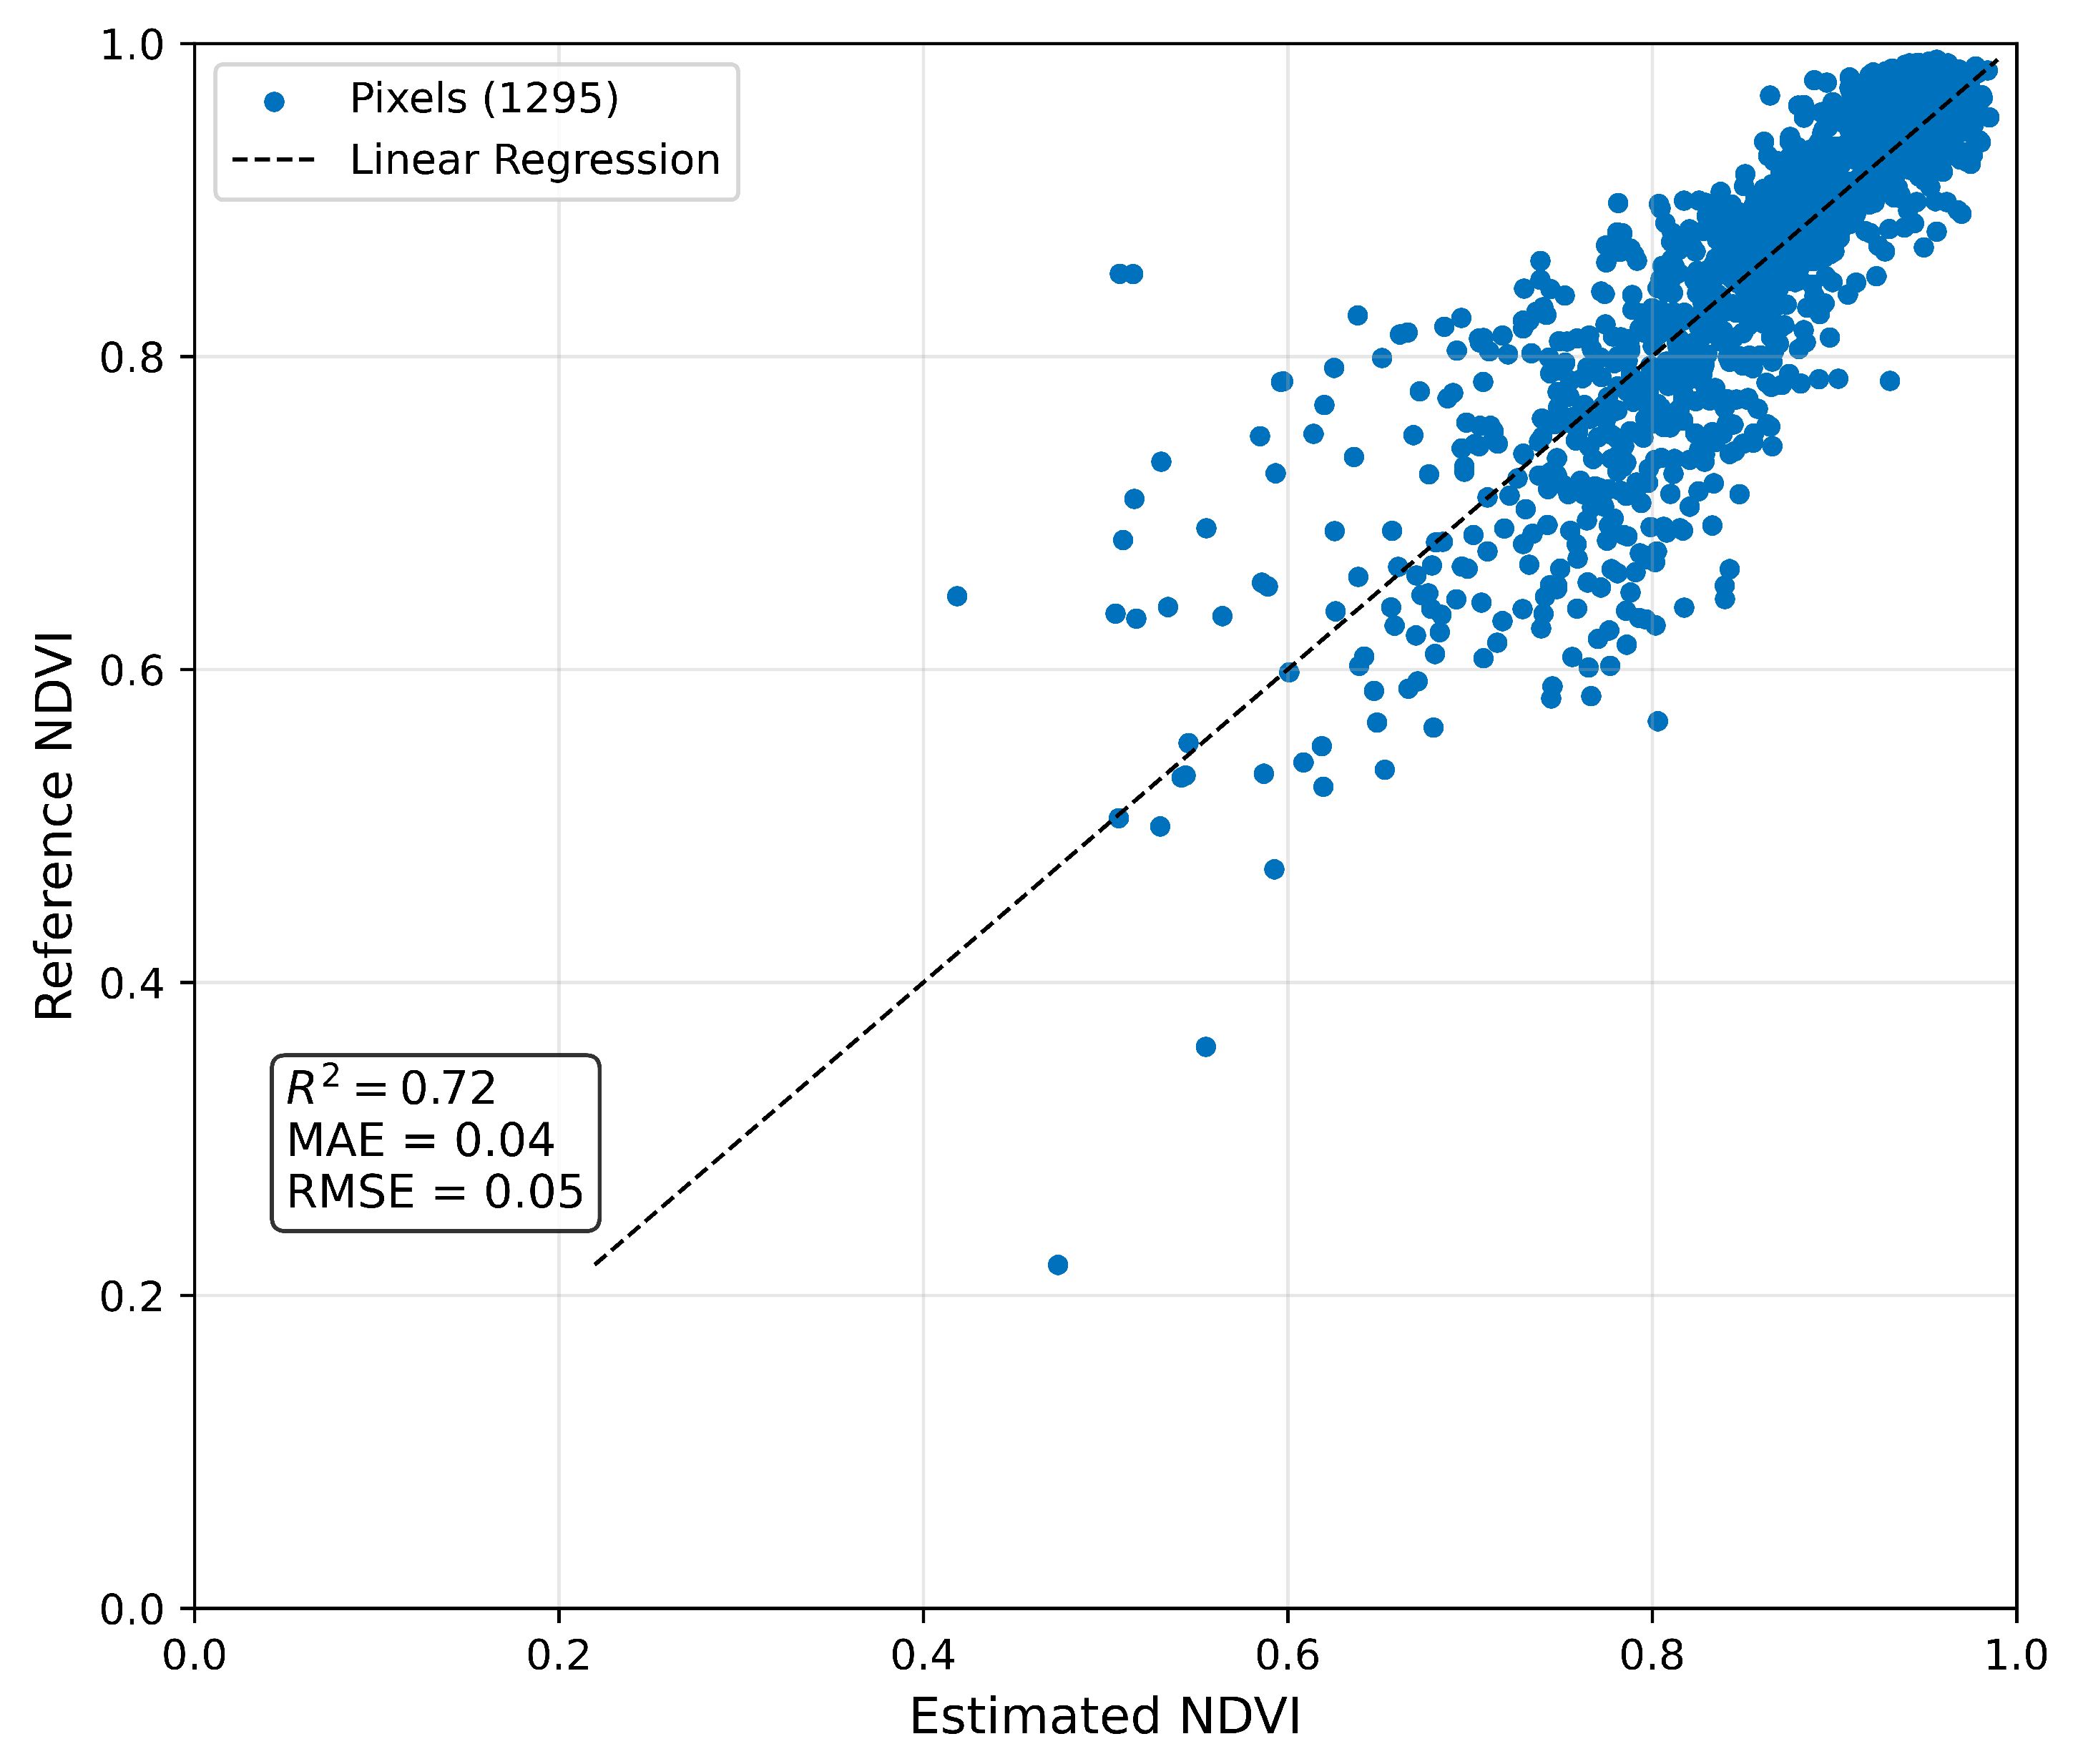
Figure 17 shows the validation results in the case of barley, resulting in an R2 of 0.72 ± 0.04, an MAE of 0.039 ± 0.002, and an RMSE of 0.055 ± 0.004.

3.5. Prediction Models Using Machine Learning Algorithms for Map-Based N Fertilization

The performance of the prediction models is presented in Table 6. It can be seen that for both crops, the best model to determine the amount of N to apply in the second coverage is the one trained using a random forest algorithm (R2 of 0.99 ± 0.01 for both crops, MAE of 1.15 ± 0.04 kg N ha−1 and 0.74 ± 0.02 kg N ha−1, and RMSE of 1.67 ± 0.06 kg N ha−1 and 1.16 ± 0.09 kg N ha−1 for wheat and barley, respectively), followed by the one trained using an XGBoost algorithm (R2 of 0.95 ± 0.01 and 0.92 ± 0.01, MAE of 5.36 ± 0.10 kg N ha−1 and 3.22 ± 0.09 kg N ha−1, and RMSE of 6.42 ± 0.12 kg N ha−1 and 4.40 ± 0.22 kg N ha−1 for wheat and barley, respectively).
The feature importance of each variable employed in the ML models to predict the N application can be seen in Table 7. Those results indicate that the importance of each variable varies across the different ML models. In RF, only the variables that present a value higher than 0.05 are considered important, leaving out the B04 band in wheat and B02 in barley. In the case of the PLSR, the variables considered important were those with a VIP value higher than 0.8, being the important B03, B04, and B98 bands in wheat and the yield and B08 band in barley. XGB importance criteria was equal to RF, also considering the unimportant B04 band in wheat and B02 in barley.

3.6. Validation of Machine Learning Prediction Models

The validation of the trained models is presented in Table 8. The model trained using a random forest algorithm continued being the one with the best performance (R2 of 0.97 ± 0.01 and 0.96 ± 0.02, MAE of 3.33 ± 0.20 kg N ha−1 and 2.01 ± 0.13 kg N ha−1, and RMSE of 4.79 ± 0.31 kg N ha−1 and 3.27 ± 0.58 kg N ha−1 for wheat and barley, respectively), followed by the one trained using a XGBoost algorithm (R2 of 0.94 ± 0.01 and 0.89 ± 0.02, MAE of 5.48 ± 0.22 kg N ha−1 and 3.56 ± 0.21 kg N ha−1, and RMSE of 6.67 ± 0.26 kg N ha−1 and 5.17 ± 0.55 kg N ha−1 for wheat and barley, respectively).

4. Discussion

Regarding the study of the optimum moment of application, using the R2, it was concluded that the key moments for grain yield were between the stem elongation and heading for both crops. This means that the optimum moment to apply the second N coverage was the phenological stage of stem elongation since, in cereals, as López-Bellido [20] pointed out, stem vigor will increase. As a result, the number of stems with spikes will also increase, and their fertility and the development of higher leaves will be better, and the grain filling will be improved. Therefore, the date of the N application fixed by the farmers on the first studied season was suitable to help the crops obtain a better grain yield.
Concerning the reflectance bands evolution through the crop cycle, other authors like Mercier et al. [34] and Ashourloo et al. [25] noted the same opposite tendency between NIR bands and B07 and the bands of visible, SWIR, and red-edge (B05, B06). The reflectance in the VIS wavelength correlated with the chlorophyll content; as chlorophylls a and b absorb radiation in that wavelength range, the reflectance in the VIS will decrease during the vegetative growth stages, increasing when the plants enter the reproductive stages until the final senescence of the crops [17]. In the case of the reflectance in the NIR wavelength, it is correlated with the plant biomass [32], not being absorbed by the vegetative structures, and having an opposite evolution to that of VIS reflectance. In addition, the evolution of the NDVI value in cereal crops has also been noted by other authors like Pan et al. [24]. On the side of R2 between yield and reflectance and NDVI values, these parameters can explain a maximum of 74% and 68% of the final grain yield in wheat and barley, respectively. Also, the higher values in the visible and the red-edge can be justified because these wavelengths are very sensitive to photosynthetic pigment content [35]. So, considering that between 86 and 156 DOY, three successive phenological stages (four in the case of barley), fundamental for final grain yield definition, are taking place, a higher concentration of photosynthetic pigments is key. In the case of SWIR, its importance in grain yield is due to the strong correlation that this wavelength range has with water content [36], so in crops that reach a large vegetation density (LAI > 3), a lower reflectance in the SWIR can result in a greater amount of biomass. Regarding R2 with NDVI values, as this VI measures vegetation vigor and greenness [37], it has been widely used in the literature to assess crop condition and yield, alone or in combination with other parameters. Some examples are the results obtained by Vicente-Serrano et al. [38] that, in combination with drought indices, obtained models with R2 of 0.88 and 0.82 in wheat and barley, respectively, and Mkhabela et al. [39], that obtained models with R2 of between 0.47 and 0.80 in wheat and 0.48 and 0.90 in barley when they considered the agro-climatic zone the fields were in.
The evolution of the mean values of NDVI and red and NIR reflectance was studied independently in the four treatments to determine the crop response to the variable second N coverage. The NDVI evolution in wheat and barley showed that the initial response of the plant to N is better in the plants that received a lower amount of N, indicating that a field area where the plants are initially less developed does not necessarily imply that the plants won’t use a larger application of N; this can be seen after calculating the slope between 86 and 126 DOY. Moreover, from DOY 141 onward, the decrease in NDVI values in wheat becomes more pronounced the lower the amount of N received by the plants, as evidenced by the slope between DOY 141 and 156. However, in barley’s case, the slopes calculated between 141 and 156 DOY indicated that a lower N application does not necessarily affect the final yield. These results were in line with the results of Sultana et al. [40] in wheat, appreciating that the NDVI values during all the crop cycles were higher as applied N increased. Going further, Vizzari et al. [15] also evidenced in wheat a better initial response and a higher slope in the crop areas that, before the application, had a lower NDVI, even if the applied N was not the highest dose (NC1 and NC2). By the side of NIR, the more nitrogen the crop receives in its second N coverage application, the higher the reflectance in the NIR will be, in addition to a subsequent slower NIR loss (from 156 to 171 DOY) as well as a slower rise in red reflectance (from 156 to 176 DOY). Therefore, the evolution of these reflectances is consistent with the findings of Ferrio et al. [41], showing that areas receiving a higher dose of N exhibit slower reflectance in the red wavelength and higher reflectance in the NIR wavelength. This suggests that increased N application during the second coverage contributes to better maintenance of the plant’s photosynthetic function over time. This tendency in red and NIR reflectances was expected, and it can be explained by the physiological activity of the plants. Nitrogen has a great influence on the pigment content and photosynthetic capacities of plant leaves [19]. N is stored in chlorophylls, so in conditions of N availability and no stress for the plant, the plant will absorb N from its surroundings, increasing the concentration of chlorophylls as the N taken by the plant increases (decrease in red reflectance). As the plant increases its concentration of chlorophyll, it will increase its photosynthetic efficiency, increasing also the amount of biomass (increase in NIR reflectance). In its phenology cycle, the wheat and barley plants have a natural tendency to senescence (increase in red reflectance and decrease in NIR reflectance), decreasing the concentration of chlorophyll as well as the photosynthetic activity because the plant is allocating the resources in the development of the reproductive parts [20]. If the amount of N in the plant is enough, the degradation of chlorophyll takes longer, causing a slower decrease in NIR reflectance and an increase in red reflectance, as was observed in the calculated slopes (156–171 DOY and 156–176 DOY) as applied N increases. In addition, as the plant remains photosynthetically active for longer, the grain filling will last more time, increasing the final yield.
Knowing that NDVI presents a saturation problem that could mask differences, the evolution of RVI was also represented, emphasizing this index of the differences between crop treatments and checking the observations already made by other authors like Li et al. [42] in summer maize. Furthermore, barley treated with NC2, NC3, and NC4 had the same RVI after application, but later evolution had the same tendency with different proportions of increase; this event indicates that in these barley cultivated areas, N was a limiting factor, and, in consequence, higher availability of the limited factor was clearly translated into a better growth rate [43]. Nevertheless, it can be noted that wheat’s response to N application is better than that observed in barley, meaning that a wheat crop has the highest yield increment (an increase of 18.4% from NC1 to NC3 compared to the 17.0% increase from NC1 to NC4 treatments in barley).
Concerning the NUE approximation, the highest approximated value of NUE was obtained at the crop area that received a medium quantity of variable N (NC2) for both crops, even when the highest yields were achieved at the area where the highest amount of N was applied (NC4). In addition, the evolution of the NDRE index throughout the crop cycle as an N status indicator [11] also showed that after the variable second N coverage, the plants that received a medium amount of N (NC2 and NC3) did not present big differences in N status compared to the ones that received the highest amount of N, emphasizing the observation achieved with NUE approximation. From an agronomic point of view, other studies have shown that wheat and barley have a similar NUE under rainfed conditions [44]. However, the results showed that NUE was higher in wheat, a phenomenon that could be related to the management conditions, as both wheat and barley were irrigated in the present study. Further study should be made in this sense.
In addition, the result of the estimation of NUE (Table 4), the evolution of final grain yield in function variable N application (Table 3) and the adjustment of a linear-plateau model between the NDVI and applied N (Figure 14) are related and agree with the remarks of Duan et al. [45] in winter wheat crops, as assessed that a higher amount of applied N is translated into a higher yield but in a lower NUE. Duan et al. [45] also concluded that the relationship between yield and N will not always be linear. Still, this yield increase will achieve saturation at values of about 240 kg total N ha−1, an event not appreciated in the present work due to the limitation of total applied N per field at 150 kg N ha−1. In other words, applied N and final grain yield are related in both crops, meaning a higher dose of nitrogen will be translated into a higher final yield. However, the environmental requirements and the need to optimize the use of production inputs lead to the question of whether an increase in NUE accompanies this yield increase. In this way, the objective maximum NDVI will depend on the socioeconomic circumstances of the growing season. So, two possible scenarios could happen. On the one hand, wheat and barley grain prices will be high. On the other hand, the price of nitrogen fertilizers will be high. Nevertheless, an economic study will be necessary for both scenarios before determining the target NDVI peak.
The first approach of NVRA is sensor-based, using the modeled NDVI peak as a function of NDVI at the application moment and the N applied. This approach will be used to create a reference source that the producers will use to determine the amount of N to apply in specific areas of their field as a function of the measured NDVI around the moment of application and the target maximum NDVI. This approach may be rudimentary and have limitations due to the well-known saturation of NDVI for LAI values higher than 2.5 [35], with the producer’s knowledge of the previous production potential being fundamental determining the target. However, this method is widely used by the producers, who can use a hand sensor or sensors installed in the equipment to determine the state of the vegetation and, using the software and/or the resource material provided by the commercial brand, to fix the N to apply. The use of this method has been proven useful to increase NUE and reduce the amount of N used [10], but the calibration has been made for unknown cultivars and climatic conditions, not being optimal for the Mediterranean area of study. In this sense, other authors have used NDVI as an indicator of the potential of production to determine the areas of treatments [13] and estimate the amount of nitrogen in the plant after different N doses [11,14], finding R2 in the range of 0.55–0.60 between NDVI and N content. So, directly modeling the NDVI to calibrate the applied N has not been performed in other studies. The obtained results after validating the training regressions (R2 of 0.55 ± 0.06 and 0.72 ± 0.04, MAE of 0.025 ± 0.002 and 0.039 ± 0.002, and RMSE of 0.049 ± 0.007 and 0.055 ± 0.004 for wheat and barley, respectively) are therefore promising, especially in the case of barley, as the obtained R2 are in line (significantly higher in the case of barley) with those obtained when relating NDVI and N content. In addition, the 95% CI error for the performance metrics is low, indicating their robustness.
The second approach of N VRA is presented as a more reliable method, as it uses the reflectance of the bands of the VIS and NIR at the moment of application, along with the target yield, to determine the N dose to apply for the second coverage. In this approach, the producers who have access to fertilizer spreader equipment that allows the upload of a premade georeferenced application map will supervise, close to the date of application, the vegetative state of the field using Sentinel-2 data and, according to the plants’ development and the knowledge of previous seasons, fix the target yield for each area of the field. That target yield will be introduced along with the VIS and NIR reflectance data in the trained and validated ML models to determine the amount of N that needs to be applied. The calculated N doses will be translated into a georeferenced application map, which the producers will upload to their fertilization equipment. The ML models presented good cross-validation results for the three tested algorithms (RF, PLSR and XGBoost), with RF the one that showed better results for both crops (R2 of 0.97 ± 0.01 and 0.96 ± 0.02, MAE of 3.32 ± 0.20 kg N ha−1 and 2.01 ± 0.13 kg N ha−1, and RMSE of 4.79 ± 0.31 kg N ha−1 and 3.27 ± 0.58 kg N ha−1 for wheat and barley, respectively). In the literature hyperspectral data and other VI have been used to train ML models, not to estimate the amount of nitrogen to be applied, but to predict the N content in the plants, also giving good results for RF (R2 of 0.78 and RMSE of 0.41 mg N kg−1 [18]; R2 of 0.811–0.874 and RMSE of 0.317–0.385% [19] and PLSR (R2 of 0.78 and RMSE of 0.41 mg N kg−1 [18]; R2 of 0.71 and RMSE of 0.38% [17]. In addition, the importance score of the variables used to train the ML models was calculated. As it was expected, each model presented different importance for each variable, but the general tendency indicated that the variables yield, green reflectance and NIR reflectance were always relevant for the predictions. Those results were not surprising, as green wavelength is more sensible to chlorophyll and nitrogen content, and NIR wavelength is correlated with the biomass [32].
In view of all these results, VRA N fertilization has the potential to optimize the use of N inputs in wheat and barley crops, allowing a better distribution of N fertilizer in the field areas with a higher production potential, enabling a higher final yield. Sentinel-2 data can be implemented to estimate the N application date and customize N fertilization. Producers in Spain will be able to use the presented sensor-based or map-based approach depending on the type of equipment that they have at their farms. Future research will be centered on applying the two presented approaches of NVRA, as well as completely traditional fertilization using fields of the same and other new locations, to test the obtained results in other conditions. As field sampling was not possible in the present study, complementary field samplings, such as the number of plants and spikes and %N in leaf and grain analysis, would greatly help to determine the NUE and compare it with the used NUE approximation and the quality of the final grain. After testing the results obtained using the proposed approach, the implementation of those approaches in a user interface will make it easier for the producers to create their own N prescription maps. In the future, as technology improves, as well as its reach for all producers, the use of equipment that will be able to use the trained ML models on the go will also optimize the time invested by the producers in their crops.

5. Conclusions

The results of this study showed that Sentinel-2 data could be implemented as a useful tool to estimate the N application data and the necessary second variable N coverage. The use of different N doses at the second coverage application showed statistically significant variations in final yield (18.4% and 17.0% increase with respect to the lower N dose in wheat and barley, respectively, and the crop’s multispectral evolution. These results also showed how a higher amount of N increases the grain yield but decreases the NUE. Two approaches of VRT models were studied, a sensor-based approach and a map-based approach, training models for both cases. On the sensor-based VRT fertilization side, two different models were developed to estimate NDVIpeak: wheat (R2 = 0.55 ± 0.06, MAE = 0.025 ± 0.002, RMSE = 0.049 ± 0.007) and barley (R2 = 0.72 ± 0.04, MAE = 0.039 ± 0.002, RMSE = 0.055 ± 0.004). In parallel, the map-based VRT fertilization was studied, training models to estimate the amount of nitrogen to apply at the date of application using the target yield and the reflectance in the VIS and NIR of Sentinel-2 of the fields at the date of application. The models trained with the Random Forest algorithm achieved the best performance for both crops, with an R2 of 0.97 ± 0.01 and 0.96 ± 0.02, MAE of 3.33 ± 0.20 kg N ha−1 and 2.01 ± 0.13 kg N ha−1, and RMSE of 4.79 ± 0.31 kg N ha−1 and 3.27 ± 0.58 kg N ha−1 for wheat and barley, respectively. These models were trained and validated with two seasons of data, concluding that the performance on both crops was good. Regarding the results obtained, a better performance in the NDVI peak models was initially expected, especially in wheat, which showed an R2 value of 0.51 in the training. Nevertheless, the results support that, even if this NVRA approach is a solution within the reach of producers without fertilizer equipment able to upload a premade prescription map, the second presented approach (map-based with ML models) is more reliable and precise. Therefore, the producers should prioritize the implementation of this second approach. Additionally, future research will be centered on applying the two presented approaches of NVRA, as well as completely traditional fertilization using fields of the same and other new locations, to test the obtained results in other conditions. After testing the results, the implementation of those approaches in a user interface will make it easier for the producers to create their own N prescription maps. Moreover, applying the proposed approaches and the expected benefits in reducing nitrogen application and improving production efficiency will encourage producers to implement these N VRT in all the planned N applications. In addition, producers will potentially improve their crop management and carry on a more sustainable agriculture, not only from an environmental perspective but also from an economic one. In summary, combining Sentinel-2 satellite data with machine learning gives farmers an accessible and cost-effective tool to optimize nitrogen supply, enhancing crop yields while minimizing inputs and environmental impacts.

Author Contributions

Conceptualization, A.S.B., S.C.-I., C.R. and P.A.-G.; methodology, A.S.B., S.C.-I., C.R. and P.A.-G.; software, P.A.-G., S.C.-I. and D.T.-S.; validation, A.S.B., P.A.-G., S.C.-I., D.T.-S., B.F. and C.R.; formal analysis, A.S.B., P.A.-G., S.C.-I., D.T.-S., B.F. and C.R.; investigation, A.S.B., P.A.-G., S.C.-I., D.T.-S. and C.R.; resources, A.S.B., B.F. and C.R.; data curation, A.S.B., P.A.-G., S.C.-I., D.T.-S. and C.R.; writing—original draft preparation, A.S.B., P.A.-G., S.C.-I. and D.T.-S.; writing—review and editing, A.S.B., P.A.-G., S.C.-I., D.T.-S., B.F. and C.R.; visualization, P.A.-G., S.C.-I. and D.T.-S.; supervision, A.S.B., P.A.-G., S.C.-I., D.T.-S. and C.R.; project administration, A.S.B.; funding acquisition, A.S.B., B.F. and C.R. All authors have read and agreed to the published version of the manuscript.

Funding

This research was funded by the PREDIC-PRO project SCPP2100C008733XV0 of the State Research Agency of the Ministry of Science, Innovation and Universities, and the ACIF Generalitat Valenciana, European Union (European Social Fund. Investing in Your Future) grant number CIACIF/2022/255.

Data Availability Statement

Data will be provided under request.

Acknowledgments

P.A.-G. acknowledges financial support from Generalitat Valenciana, European Union (European Social Fund. Investing in Your Future) through grant CIACIF/2022/255.

Conflicts of Interest

The authors declare no conflicts of interest.

References

  1. United Nations Department of Economic and Social Affairs, Population Division. World Population Prospects 2022: Summary of Results; United Nations Publications: New York, NY, USA, 2022. [Google Scholar]
  2. Neupane, D.; Adhikari, P.; Bhattarai, D.; Rana, B.; Ahmed, Z.; Sharma, U.; Adhikari, D. Does Climate Change Affect the Yield of the Top Three Cereals and Food Security in the World? Earth 2022, 3, 45–71. [Google Scholar] [CrossRef]
  3. Rabbi, M.F.; Ben Hassen, T.; El Bilali, H.; Raheem, D.; Raposo, A. Food Security Challenges in Europe in the Context of the Prolonged Russian–Ukrainian Conflict. Sustainability 2023, 15, 4745. [Google Scholar] [CrossRef]
  4. FAOSTAT. Food and Agriculture Organization of the United Nations Statistical Data. 2023. Available online: https://www.fao.org/faostat/en/#data/QCL (accessed on 26 September 2025).
  5. Lassaletta, L.; Billen, G.; Grizzetti, B.; Anglade, J.; Garnier, J. 50 year trends in nitrogen use efficiency of world cropping systems: The relationship between yield and nitrogen input to cropland. Environ. Res. Lett. 2014, 9, 105011. [Google Scholar] [CrossRef]
  6. Bruinsma, J. World Agriculture: Towards 2015/2030; Routledge: London, UK, 2017. [Google Scholar] [CrossRef]
  7. Billen, G.; Lassaletta, L.; Garnier, J. A biogeochemical view of the global agro-food system: Nitrogen flows associated with protein production, consumption and trade. Glob. Food Secur. 2014, 3, 209–219. [Google Scholar] [CrossRef]
  8. Cao, Q.; Miao, Y.; Li, F.; Gao, X.; Liu, B.; Lu, D.; Chen, X. Developing a new Crop Circle active canopy sensor-based precision nitrogen management strategy for winter wheat in North China Plain. Precis. Agric. 2016, 18, 2–18. [Google Scholar] [CrossRef]
  9. Saleem, S.R.; Zaman, Q.U.; Schumann, A.W.; Abbas Naqvi, S.M.Z. Variable rate technologies. In Precision Agriculture; Elsevier: Amsterdam, The Netherlands, 2023; pp. 103–122. [Google Scholar] [CrossRef]
  10. Scharf, P.C.; Shannon, D.K.; Palm, H.L.; Sudduth, K.A.; Drummond, S.T.; Kitchen, N.R.; Mueller, L.J.; Hubbard, V.C.; Oliveira, L.F. Sensor-Based Nitrogen Applications Out-Performed Producer-Chosen Rates for Corn in On-Farm Demonstrations. Agron. J. 2011, 103, 1683–1691. [Google Scholar] [CrossRef]
  11. Argento, F.; Anken, T.; Abt, F.; Vogelsanger, E.; Walter, A.; Liebisch, F. Site-specific nitrogen management in winter wheat supported by low-altitude remote sensing and soil data. Precis. Agric. 2020, 22, 364–386. [Google Scholar] [CrossRef]
  12. Farid, H.U.; Khan, Z.M.; Anjum, M.N.; Shakoor, A.; Qureshi, H.S. Precision Nitrogen Management for Cotton Using (GreenSeeker) Handheld Crop Sensors. Environ. Sci. Proc. 2022, 23, 12. [Google Scholar] [CrossRef]
  13. Raun, W.R.; Solie, J.B.; Johnson, G.V.; Stone, M.L.; Lukina, E.V.; Thomason, W.E.; Schepers, J.S. In-Season Prediction of Potential Grain Yield in Winter Wheat Using Canopy Reflectance. Agron. J. 2001, 93, 131–138. [Google Scholar] [CrossRef]
  14. Maresma, Á.; Ariza, M.; Martínez, E.; Lloveras, J.; Martínez-Casasnovas, J. Analysis of Vegetation Indices to Determine Nitrogen Application and Yield Prediction in Maize (Zea mays L.) from a Standard UAV Service. Remote Sens. 2016, 8, 973. [Google Scholar] [CrossRef]
  15. Vizzari, M.; Santaga, F.; Benincasa, P. Sentinel 2-Based Nitrogen VRT Fertilization in Wheat: Comparison between Traditional and Simple Precision Practices. Agronomy 2019, 9, 278. [Google Scholar] [CrossRef]
  16. Perich, G.; Turkoglu, M.O.; Graf, L.V.; Wegner, J.D.; Aasen, H.; Walter, A.; Liebisch, F. Pixel-based yield mapping and prediction from Sentinel-2 using spectral indices and neural networks. Field Crops Res. 2023, 292, 108824. [Google Scholar] [CrossRef]
  17. Hansen, P.; Schjoerring, J. Reflectance measurement of canopy biomass and nitrogen status in wheat crops using normalized difference vegetation indices and partial least squares regression. Remote Sens. Environ. 2003, 86, 542–553. [Google Scholar] [CrossRef]
  18. Pullanagari, R.; Kereszturi, G.; Yule, I. Mapping of macro and micro nutrients of mixed pastures using airborne AisaFENIX hyperspectral imagery. ISPRS J. Photogramm. Remote Sens. 2016, 117, 1–10. [Google Scholar] [CrossRef]
  19. Liang, L.; Di, L.; Huang, T.; Wang, J.; Lin, L.; Wang, L.; Yang, M. Estimation of Leaf Nitrogen Content in Wheat Using New Hyperspectral Indices and a Random Forest Regression Algorithm. Remote Sens. 2018, 10, 1940. [Google Scholar] [CrossRef]
  20. López-Bellido, L. Cultivos Herbáceos. Vol. I: Cereales; Ediciones Mundi-Prensa: Madrid, Spain, 1990. [Google Scholar]
  21. Ministerio de Agricultura, Pesca y Alimentación (MAPA). 2024. Available online: https://servicio.mapa.gob.es/websiar/SeleccionParametrosMap.aspx?dst=1 (accessed on 26 September 2025).
  22. López-Bellido, L.; López-Bellido, R.J.; Redondo, R. Nitrogen efficiency in wheat under rainfed Mediterranean conditions as affected by split nitrogen application. Field Crops Res. 2005, 94, 86–97. [Google Scholar] [CrossRef]
  23. Fieuzal, R.; Baup, F.; Marais-Sicre, C. Monitoring Wheat and Rapeseed by Using Synchronous Optical and Radar Satellite Data—From Temporal Signatures to Crop Parameters Estimation. Adv. Remote Sens. 2013, 02, 162–180. [Google Scholar] [CrossRef]
  24. Pan, Z.; Huang, J.; Zhou, Q.; Wang, L.; Cheng, Y.; Zhang, H.; Blackburn, G.A.; Yan, J.; Liu, J. Mapping crop phenology using NDVI time-series derived from HJ-1 A/B data. Int. J. Appl. Earth Obs. Geoinf. 2015, 34, 188–197. [Google Scholar] [CrossRef]
  25. Ashourloo, D.; Nematollahi, H.; Huete, A.; Aghighi, H.; Azadbakht, M.; Shahrabi, H.S.; Goodarzdashti, S. A new phenology-based method for mapping wheat and barley using time-series of Sentinel-2 images. Remote Sens. Environ. 2022, 280, 113206. [Google Scholar] [CrossRef]
  26. Lancashire, P.D.; Bleiholder, H.; van den Boom, T.; Langelüddeke, P.; Stauss, R.; Weber, E.; Witzenberger, A. A uniform decimal code for growth stages of crops and weeds. Ann. Appl. Biol. 1991, 119, 561–601. [Google Scholar] [CrossRef]
  27. Sun, W.; Whelan, B.; McBratney, A.B.; Minasny, B. An integrated framework for software to provide yield data cleaning and estimation of an opportunity index for site-specific crop management. Precis. Agric. 2012, 14, 376–391. [Google Scholar] [CrossRef]
  28. Vega, A.; Córdoba, M.; Castro-Franco, M.; Balzarini, M. Protocol for automating error removal from yield maps. Precis. Agric. 2019, 20, 1030–1044. [Google Scholar] [CrossRef]
  29. European Space Agency (ESA). Sentinel-2 User Handbook; Technical Report; ESA Standard Document; ESA: Paris, France, 2015. [Google Scholar]
  30. Basso, B.; Fiorentino, C.; Cammarano, D.; Schulthess, U. Variable rate nitrogen fertilizer response in wheat using remote sensing. Precis. Agric. 2015, 17, 168–182. [Google Scholar] [CrossRef]
  31. Fitzgerald, G.J.; Rodriguez, D.; Christensen, L.K.; Belford, R.; Sadras, V.O.; Clarke, T.R. Spectral and thermal sensing for nitrogen and water status in rainfed and irrigated wheat environments. Precis. Agric. 2006, 7, 233–248. [Google Scholar] [CrossRef]
  32. Reyniers, M.; Walvoort, D.J.J.; De Baardemaaker, J. A linear model to predict with a multi-spectral radiometer the amount of nitrogen in winter wheat. Int. J. Remote Sens. 2006, 27, 4159–4179. [Google Scholar] [CrossRef]
  33. Han, L.; Jiang, X.; Zhou, S.; Tian, J.; Hu, X.; Huang, D.; Luo, H. Hyperspectral Imaging Technology Combined with the Extreme Gradient Boosting Algorithm (XGBoost) for the Rapid Analysis of the Moisture and Acidity Contents in Fermented Grains. J. Am. Soc. Brew. Chem. 2023, 82, 281–293. [Google Scholar] [CrossRef]
  34. Mercier, A.; Betbeder, J.; Baudry, J.; Le Roux, V.; Spicher, F.; Lacoux, J.; Roger, D.; Hubert-Moy, L. Evaluation of Sentinel-1 & 2 time series for predicting wheat and rapeseed phenological stages. ISPRS J. Photogramm. Remote Sens. 2020, 163, 231–256. [Google Scholar] [CrossRef]
  35. Gitelson, A.A.; Viña, A.; Arkebauer, T.J.; Rundquist, D.C.; Keydan, G.; Leavitt, B. Remote estimation of leaf area index and green leaf biomass in maize canopies. Geophys. Res. Lett. 2003, 30, 1248. [Google Scholar] [CrossRef]
  36. Ullah, S.; Skidmore, A.K.; Ramoelo, A.; Groen, T.A.; Naeem, M.; Ali, A. Retrieval of leaf water content spanning the visible to thermal infrared spectra. ISPRS J. Photogramm. Remote Sens. 2014, 93, 56–64. [Google Scholar] [CrossRef]
  37. Tarpley, J.D.; Schneider, S.R.; Money, R.L. Global Vegetation Indices from the NOAA-7 Meteorological Satellite. J. Clim. Appl. Meteorol. 1984, 23, 491–494. [Google Scholar] [CrossRef]
  38. Vicente-Serrano, S.M.; Cuadrat-Prats, J.M.; Romo, A. Early prediction of crop production using drought indices at different time-scales and remote sensing data: Application in the Ebro Valley (north-east Spain). Int. J. Remote Sens. 2006, 27, 511–518. [Google Scholar] [CrossRef]
  39. Mkhabela, M.; Bullock, P.; Raj, S.; Wang, S.; Yang, Y. Crop yield forecasting on the Canadian Prairies using MODIS NDVI data. Agric. For. Meteorol. 2011, 151, 385–393. [Google Scholar] [CrossRef]
  40. Sultana, S.R.; Ali, A.; Ahmad, A.; Mubeen, M.; Zia-Ul-Haq, M.; Ahmad, S.; Ercisli, S.; Jaafar, H.Z.E. Normalized Difference Vegetation Index as a Tool for Wheat Yield Estimation: A Case Study from Faisalabad, Pakistan. Sci. World J. 2014, 2014, 725326. [Google Scholar] [CrossRef] [PubMed]
  41. Ferrio, J.; Villegas, D.; Zarco, J.; Aparicio, N.; Araus, J.; Royo, C. Assessment of durum wheat yield using visible and near-infrared reflectance spectra of canopies. Field Crops Res. 2005, 94, 126–148. [Google Scholar] [CrossRef]
  42. Li, F.; Miao, Y.; Feng, G.; Yuan, F.; Yue, S.; Gao, X.; Liu, Y.; Liu, B.; Ustin, S.L.; Chen, X. Improving estimation of summer maize nitrogen status with red edge-based spectral vegetation indices. Field Crops Res. 2014, 157, 111–123. [Google Scholar] [CrossRef]
  43. Connor, D.J.; Loomis, R.S.; Cassman, K.G. Crop Ecology: Productivity and Management in Agricultural Systems; Cambridge University Press: Cambridge, UK, 2011. [Google Scholar] [CrossRef]
  44. Delogu, G.; Cattivelli, L.; Pecchioni, N.; De Falcis, D.; Maggiore, T.; Stanca, A. Uptake and agronomic efficiency of nitrogen in winter barley and winter wheat. Eur. J. Agron. 1998, 9, 11–20. [Google Scholar] [CrossRef]
  45. Duan, J.; Shao, Y.; He, L.; Li, X.; Hou, G.; Li, S.; Feng, W.; Zhu, Y.; Wang, Y.; Xie, Y. Optimizing nitrogen management to achieve high yield, high nitrogen efficiency and low nitrogen emission in winter wheat. Sci. Total Environ. 2019, 697, 134088. [Google Scholar] [CrossRef]
Figure 1. Location of the studied fields in Valladolid (Spain). The studied wheat and barley fields in the 2019–2020 season are highlighted with a green and blue contour, respectively. The studied wheat and barley fields in the 2020–2021 season are highlighted with a yellow and pink contour, respectively.
Applsci 15 11646 g001
Figure 3. (a) Potential grain yield index (EY index) and (b) applied second N coverage ( kg ha 1 ) of the wheat field studied in the 2019–2020 season.
Applsci 15 11646 g003
Figure 4. Approximation of wheat and barley phenological stages.
Applsci 15 11646 g004
Figure 5. (a) Yield map generated by the combine, (b) yield map after applying the global and local adjustment with the spatial resolution of Sentinel-2 data ( 10 × 10 m), and (c) final yield map after applying the global and local adjustment and the mean filter resampled to the higher spatial resolution of Sentinel-2 data ( 10 × 10 m).
Applsci 15 11646 g005
Figure 6. Workflow followed in this paper and achieved general conclusions.
Applsci 15 11646 g006
Figure 7. Temporal evolution of NDVI and reflectance across Sentinel-2 spectral bands for (a) wheat and (b) barley during the 2019–2020 growing season. DOY stands for Day of Year, with negative DOY values indicating days prior to the start of the 2019–2020 season.
Applsci 15 11646 g007
Figure 8. Temporal evolution of R2 between yield and Sentinel-2 reflectance bands, the lineal combination of all bands (CL) and NDVI in (a) wheat and (b) barley for the 2019–2020 season. DOY stands for Day of Year, with negative DOY values indicating days prior to the start of the 2019–2020 season.
Applsci 15 11646 g008
Figure 9. Temporal evolution of NDVI and reflectance across Sentinel-2 spectral bands for (a) wheat and (b) barley during the 2020–2021 growing season. DOY stands for Day of Year, with negative DOY values indicating days prior to the start of the 2020–2021 season.
Applsci 15 11646 g009
Figure 10. Temporal evolution of NDVI (a) and the relationship between B4 and B8 reflectance (b) for wheat crops during the 2019–2020 season. DOY refers to Day Of the Year.
Applsci 15 11646 g010
Figure 11. Temporal evolution of NDVI (a) and the relationship between B4 and B8 reflectance (b) for barley crops during the 2019–2020 season. DOY refers to Day Of the Year.
Applsci 15 11646 g011
Figure 12. Post-application RVI temporal evolution in (a) wheat and (b) barley crops during the 2019–2020 season. DOY refers to Day Of the Year.
Applsci 15 11646 g012
Figure 13. Comparison between (a) final grain yield at the pixel level (10 × 10 m) and (b) applied nitrogen in the second coverage at the pixel level (10 × 10 m) in a field of barley in the 2019–2020 season.
Applsci 15 11646 g013
Figure 14. Linear adjustment between the average nitrogen applied in the second coverage and the average NDVI value when it reaches its maximum value in (a) wheat and (b) barley crops. DOY refers to Day Of the Year.
Applsci 15 11646 g014
Figure 15. Temporal evolution of each treatment group’s NDRE index for (a) wheat and (b) barley crops in the 2019–2020 season. The pointed line represents the date of application of the variable treatment of N; before that moment, the plants had received the same amount of N. DOY stands for Day of Year, with negative DOY values indicating days prior to the start of the 2019–2020 season.
Applsci 15 11646 g015
Figure 16. Validation results of model A in wheat. Performance parameters of the validation and representation of reference NDVI peak vs. estimated NDVI peak .
Applsci 15 11646 g016
Figure 17. Validation results of model B in barley crops. Performance parameters of the validation and representation of reference NDVI peak vs. estimated NDVI peak .
Applsci 15 11646 g017
Table 1. Characteristics of the Sentinel-2 used bands.
Sentinel-2 BandCentral Wavelength (nm)Spatial Resolution (m)
B02—Blue45010
B03—Green56010
B04—Red66510
B05—Vegetation Red-Edge70520
B06—Vegetation Red-Edge74020
B07—Vegetation Red-Edge78320
B08—NIR84210
B8A—Narrow NIR86520
B11—SWIR161020
B11—SWIR219020
Table 2. Selected cloud-free dates for both studied seasons and their DOY identifier.
2019–2020 Growing Season2020–2021 Growing Season
Selected Dates DOY Identifier Selected Dates DOY Identifier
8 November 2019−5412 November 2020−50
18 November 2019−4422 November 2020−40
23 November 2019−391 January 20211
6 February 2020377 March 202166
16 February 20204717 March 202176
21 February 20205222 March 202181
27 March 2020866 April 202196
6 May 202012616 April 2021106
21 May 202014121 May 2021141
26 May 202014631 May 2021151
1 June 202015610 June 2021161
10 June 202016125 June 2021176
20 June 20201715 July 2021186
25 June 202017610 July 2021191
5 July 202018615 July 2021196
10 July 2020191--
15 July 2020196--
Table 3. Average final yield as a function of received N variable (NV) dose.
NV DoseWheatBarley
(kg N ha−1) Yield (kg ha−1)
45–507086.6 a5714.6 a
50–557999.7 b6437.4 b
55–608393.7 c6536.5 c
60–65-6686.8 d
In the same column, different letters for each parameter indicated statistically significant differences using an LSD test (p < 0.05).
Table 4. Nitrogen Use Efficiency (NUE) approximation for wheat and barley.
N DoseNUE Approximation
Wheat Barley
kg N ha−1 kg of Grain per kg of N
45–50145.64 b120.03 b
50–55151.00 a122.11 a
55–60148.29 b114.08 c
60–65-111.23 d
In the same column, different letters for each parameter indicated statistically significant differences using an LSD test (p < 0.05).
Table 5. Estimation models of the maximum NDVI and the execution parameters (R2, MAE, and RMSE) and their error margins, being A the model elaborated for wheat, and B the model elaborated for barley.
ModelR2MAERMSEN° Pixels
A0.51 ± 0.040.024 ± 0.0010.048 ± 0.0044422
B0.74 ± 0.010.038 ± 0.0010.052 ± 0.0025179
Table 6. Performance of the prediction models of second coverage N fertilization. Being A the models trained for wheat and B for barley crops.
ModelR2MAERMSEN° Pixels
(kg N ha−1) (kg N ha−1)
ARandom Forest0.99 ± 0.011.15 ± 0.041.67 ± 0.064422
PLSR0.84 ± 0.019.02 ± 0.1911.09 ± 0.214422
XGBoost0.95 ± 0.015.36 ± 0.106.42 ± 0.124422
BRandom Forest0.99 ± 0.010.74 ± 0.021.16 ± 0.095179
PLSR0.74 ± 0.016.34 ± 0.137.87 ± 0.155179
XGBoost0.92 ± 0.013.22 ± 0.094.40 ± 0.225179
Table 7. Feature importance scores of the variable used for the training of ML models in wheat and barley crops.
WheatBarley
Band RF PLSR XGB RF PLSR XGB
Yield0.2480.3200.2460.6241.9270.557
B020.0550.6750.0700.0200.2490.014
B030.6081.0910.5970.0670.4070.048
B040.0281.1350.0280.0820.5920.054
B080.0611.4010.0590.2060.8420.326
Table 8. Validation of the prediction models of second coverage N fertilization. Being A the models trained for wheat and B for barley crops.
ModelR2MAERMSEN° Pixels
(kg N ha−1) (kg N ha−1)
ARandom Forest0.97 ± 0.013.33 ± 0.204.79 ± 0.311106
PLSR0.84 ± 0.029.08 ± 0.3711.15 ± 0.391106
XGBoost0.94 ± 0.015.48 ± 0.226.67 ± 0.261106
BRandom Forest0.96 ± 0.022.01 ± 0.133.27 ± 0.581295
PLSR0.72 ± 0.026.65 ± 0.268.28 ± 0.321295
XGBoost0.89 ± 0.023.56 ± 0.215.17 ± 0.551295
Disclaimer/Publisher’s Note: The statements, opinions and data contained in all publications are solely those of the individual author(s) and contributor(s) and not of MDPI and/or the editor(s). MDPI and/or the editor(s) disclaim responsibility for any injury to people or property resulting from any ideas, methods, instructions or products referred to in the content.