Abstract
Brassica napus L. is one of the world’s most important oilseed crops. Blackleg disease is a serious, yield-limiting factor in the cultivation of oilseed rape. Genetic resistance is primarily conferred by major resistance (R) genes. In this study, we analyzed the expression of the blackleg resistance genes Rlm3, Rlm4, and Rlm7 following inoculation with the Leptosphaeria maculans isolate using the RT-qPCR method. Additionally, we demonstrated and assessed their interactions. The results showed that, while Rlm3 was weakly induced, Rlm4 and Rlm7 displayed variable expression post-inoculation. The correlation between phenotypic and genotypic similarity was low. This suggests that transcriptional responses do not fully explain resistance patterns. Furthermore, significant main effects of the analyzed genes, as well as two- and three-way interactions, were indicated. These results support current knowledge of gene-mediated resistance to blackleg in oilseed rape.
1. Introduction
Oilseed rape (Brassica napus L.) is one of the most important oilseed crops cultivated worldwide. It serves as a major source of vegetable oil for the food industry, biofuel production, and high-protein animal feed. Due to its considerable economic importance, maintaining yield stability and crop health has become a key focus of breeding and agronomic research [1]. One of the most serious yield-limiting factors in oilseed rape cultivation is phoma stem canker (blackleg), a disease of global significance caused by a complex of fungal pathogens from the genus Leptosphaeria ssp. [2,3,4]. Among them, Leptosphaeria maculans is considered the most aggressive and destructive species [5,6].
There are several strategies to mitigate blackleg disease, such as crop rotation, soil tillage, and the use of biological or chemical fungicides. However, the most effective and environmentally sustainable approach to protecting rapeseed crops is resistance breeding, which relies on the plant’s genetic immunity [7]. Resistance of oilseed rape to blackleg can be mediated by single, major genes (R-genes) or multiple genes with minor effect (QTLs) and relies on a complex network of interactions between host resistance genes and pathogen virulence factors [8].
R-genes have been a cornerstone of genetic crop protection against this pathogen. These genes typically follow Flor’s gene-for-gene model, in which recognition of a pathogen avirulence (Avr) gene by a corresponding host R-gene triggers a strong defense response and, under ideal conditions, complete resistance [9]. However, the durability of such resistance is often limited. The widespread deployment of single R-gene cultivars imposes strong selection pressure on L. maculans populations, leading to rapid adaptation and the emergence of virulent isolates capable of overcoming deployed R-genes [10,11].
To date, 22 major resistance (R) genes conferring race-specific resistance to L. maculans have been identified in Brassica species, although only five have been successfully cloned [12]. These cloned genes encode receptor-like proteins (RLPs) or wall-associated kinase-like proteins (WAKLs), both functioning as membrane-bound receptors that perceive pathogen signals and activate immune responses [13,14]. Plant immunity operates through two interconnected layers: pattern-triggered immunity (PTI) and effector-triggered immunity (ETI). PTI is initiated by cell-surface receptors such as RLPs and WAKLs that recognize conserved pathogen-associated molecular patterns (PAMPs), resulting in broad-spectrum, basal resistance. In contrast, ETI typically involves intracellular nucleotide-binding leucine-rich repeat (NLR) receptors that detect specific pathogen effectors, leading to a rapid and often localized hypersensitive response. Interestingly, none of the cloned blackleg R-genes belong to the NLR-type ETI class, indicating that B. napus primarily relies on cell-surface immune receptors and PTI-like signaling for race-specific resistance to L. maculans [15,16]. This may reflect an evolutionary adaptation of the Brassica–Leptosphaeria interaction toward surface-receptor-mediated recognition and could help explain the partial or variable nature of some R-gene-mediated responses.
Recent studies have shown that certain R-genes previously considered to confer complete race-specific resistance can also exhibit partial or quantitative effects, particularly in adult plants. For instance, allelic variants of Rlm9 have been found to recognize the AvrLm5-9 effector only partially, leading to reduced lesion size rather than full immunity [15]. The LepR1 gene, derived from B. rapa, has been reported to confer partial adult-plant resistance, supporting the idea that some major genes contribute to a continuum between qualitative and quantitative defense [16].
Understanding the molecular mechanisms underlying these interactions is essential for the effective use of resistance in breeding programs. One of the key approaches for studying gene activity in plant–pathogen interactions is reverse transcription quantitative polymerase chain reaction (RT-qPCR). This method is highly sensitive and precise, allowing for the quantification of expression levels of individual genes as well as the analysis of their co-regulation under biotic stress conditions. RT-qPCR offers several advantages, including high sensitivity, broad dynamic range, and the ability to detect low-abundance transcripts with relatively small amounts of RNA. Moreover, when combined with proper normalization strategies, it provides reliable and reproducible results suitable for comparative gene expression studies [17,18,19].
Using double haploid (DH) lines of rapeseed in gene expression studies enable consistent, reproducible phenotypes across individual plants. DH lines are completely homozygous at all loci, eliminating confounding effects of heterozygosity and genetic segregation [20,21]. This genetic uniformity allows for a more precise assessment of alle-specific R-gene expression and phenotypic resistance, and clearer interpretation of potential gene–gene interactions. Furthermore, DH populations are widely used for association studies, genetic mapping, QTL analysis, and breeding applications [22].
Analyzing the expression and interactions of Rlm3, Rlm4, and Rlm7 can provide valuable guidance for rapeseed breeding. Insights into allelic variants and gene interactions support strategic pyramiding and integration with quantitative resistance loci, enhancing durability and broad-spectrum blackleg resistance.
In this study, we aimed to (i) analyze the expression of selected resistance-related genes in 25 double haploid (DH) oilseed rape lines response to L. maculans infection, (ii) assess the similarity of 25 DH lines at the phenotypic and genetic level with hierarchical clustering and (iii) assess the effect of expression of selected resistance genes and their interactions on blackleg.
2. Materials and Methods
2.1. Plant Material
Seeds of 25 DH oilseed rape lines were sown in a sterilized garden soil mixture. These lines were developed from crosses between elite rapeseed cultivars showing variable resistance to blackleg. The study conditions were established as follows: the temperature was maintained at 22 °C, and the photoperiod was set to 16 h of light and 8 h of darkness. The plants were cultivated in two groups: a mock-inoculated (water) group and a test group that was inoculated with an isolate of the L. maculans pathogen. Inoculations were performed 14 days after sowing. The present study utilized an L. maculans isolate from the Institute of Plant Genetics, Polish Academy of Sciences, Poznań collection.
2.2. Inoculation and Disease Severity Assesment
The inoculations were performed in accordance with the methodology described by Kaczmarek et al. [23]. The test was performed using 14-day-old seedlings grown in a controlled environment chamber under a 12 h photoperiod, with 22 °C at the light phase and 16 °C in darkness. To ensure high humidity before inoculation, the plants were watered thoroughly. Each half of a cotyledon was pricked with a needle and then inoculated with a 10 μL droplet of a spore suspension containing 1 × 10⁷ conidia per milliliter. One droplet was applied to each half of both cotyledons, resulting in four inoculation sites per plant.
Each fungal isolate was tested on all 25 doubled haploid (DH) Brassica lines, with five plants used per line. After inoculation, the trays containing the plants were covered with a plastic propagator lid and kept in darkness for 60 h. Afterwards, the plants were returned to the original temperature and light conditions (12 h photoperiod with alternating 20 °C/16 °C). The humidity in the chamber was raised to 70% using a HumiDisk humidifier (Carel Deutschland GmbH, Gelnhausen, Germany).
Fourteen days after inoculations, the cotyledons were assessed for disease severity using 0–6 scoring method developed by Balesdent et al. [24].
2.3. RNA Isolation and Quality Control
Fourteen days after inoculation, cotyledons from the analyzed DH lines were collected. The total RNA was isolated from the collected plant material using a commercial RNA isolation kit, RNeasy Plant Kit (Qiagen, Hilden, Germany) per manufacturer’s instructions. The concentration and purity of the isolated RNA were measured using a NanoDrop spectrophotometer (ThermoFisher Scientific, Waltham, MA, USA). Furthermore, the integrity of the isolated RNA was examined through electrophoresis, utilizing a 1% agarose gel.
2.4. RT-qPCR
The isolated total RNA was subjected to reverse transcription using the Maxima H Minus Reverse Transcriptase kit (ThermoFisher Scientific, Waltham, MA, USA), which included the oilgodT primers. Subsequently, the resulting cDNA was utilized as a template for quantitative real-time PCR (qPCR) procedure.
qPCR analyses were performed using SsoAdvanced Universal SYBR Green Supermix (Bio-Rad, Hercules, CA, USA) reagents utilizing a Bio-Rad CFX 96 thermocycler. The subsequent reaction profile was implemented: denaturation at 95 °C for a duration of 10 min, 44 cycles at 95 °C for 10 s, 60 °C for 30 s, and concluding with 50 °C for 30 s.
Primer sequences were designed for all analyzed blackleg resistance genes in accordance with criteria that are widely accepted as essential for their effectiveness. These criteria include the following: primer length of 18–25 nucleotides, melting temperature of 50–60 °C, GC pair content of 40–60%, and the presence or absence of undesirable interactions between primers during the PCR reaction (Table 1).

Table 1.
Primer sequences of analyzed blackleg resistance genes and reference genes.
The SAND (SAND family protein) and PPR (postysynaptic protein-related) genes were utilized as reference genes, due to their demonstrated stability in Brassica species. SAND has been validated as stable reference under abiotic stress conditions, while PPR was shown to have consistent expression across tissues and stress conditions in B. napus. [25,26,27]. Based on these, the relative expression of the analyzed resistance genes (Rlm3, Rlm4, and Rlm7) was determined using the ∆∆Cq method (Bio-Rad CFX Maestro v2.3). All analyses were performed in three biological replicates and at least two technical replicates.
2.5. Statisitcal Modelling
The phenotypic similarity (SP) between 25 DH lines in terms of infection was calculated based on the proposed formula [28]:
where denotes the similarity between line i and line j, denotes the mean value of blackleg (Leptosphaeria spp.) resistance of the i-th line, denotes the mean value of infection of the j-th line, and denotes the highest mean value of infection among the lines tested. The genetic diversity (DG) of 25 DH lines was calculated using the Euclidean distance of the expression of three genes. Then the diversity was converted into genetic similarity (SG) using the formula: SG = 1 − DG. The calculated similarity coefficients were used to group lines using the unweighted pairwise grouping method using the arithmetic mean method (UPGMA), independently for phenotypic and genetic similarity. The clustering results were presented as dendrograms using the DDENDROGRAM procedure in Genstat 23.1.
The effect of the expression of the three genes and their interactions on infection (resistance) was analyzed using multiple regression using FIT directive in Genstat 23.1:
where —mean value of the observed trait, —the general mean, —the main effect of gene, —the gene×gene interaction effects of and genes, —the effect of interaction of , and genes, , and , e—the residual effect. The coefficient of determination was used to measure the fit of the model to the data, and in this study, it was the value of the phenotypic variance explained by the total number of genes with main effects, gene pairs with epistatic interaction effects, and gene triplets with triple interaction effects. All analyses were performed using Genstat v. 23.1 statistical software [29].
3. Results
No correlation was observed between Rlm genes. In this study, the expression levels of the oilseed rape genes Rlm3, Rlm4, and Rlm7 after inoculation with the pathogen L. maculans were compared to the expression levels in plants treated with sterile water. The results of the analysis suggest a differentiated main expression pattern of the examined resistance genes against L. maculans among the 25 tested doubled haploid lines of oilseed rape. However, these differences proved to be small and statistically insignificant.
The highest relative expression level of the Rlm3 was observed with the oilseed rape DH line 5 (2.49 ± 0.43). In most of the cases, the fold change of the expressed gene did not exceed 0.5. A diversified change in the expression level of the genes Rlm4 and Rlm7 was observed. In the context of the Rlm4 gene, the lowest observed value for the gene expression fold change was 0.39 ± 0.04 in the DH line 29, while the highest value was recorded in DH line 60, with a fold change of 3.13 ± 1.15. With respect to the expression fold change of the Rlm7 gene, the lowest and highest values were recorded as 0.49 ± 0.04 and 1.53 ± 0.24, respectively, in DH lines 3 and 30 (Figure 1). Nevertheless, expression patterns of Rlm3, Rlm4 and Rlm7 across 25 DH lines were consistent (Figure 1D).
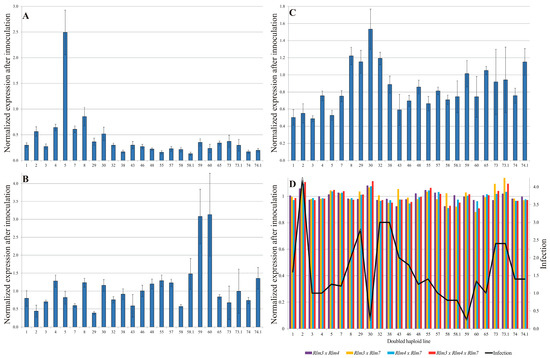
Figure 1.
Relative normalized expression of Rlm3 (A), Rlm4 (B), and Rlm7 (C) as well as their interactions (D) blackleg resistance genes in oilseed rape cotyledons. Bars represent fold-change in transcript levels in tissues inoculated with L. maculans compared to mock-inoculated controls (water-treated). Expression values were normalized to SAND and PPR reference genes, and fold changes are shown relative to the mock treatment baseline. Error bars indicate SE.
The phenotypic similarity of DH lines in terms of blackleg (Leptosphaeria spp.) resistance ranged from 0 (for 13 pairs of lines) to 1 (for two pairs of lines: DH2 0/21DH6747—no. 30 and DH2 0/21DH6732—no. 2 as well as DH2 0/21DH9450—no. 59 and DH2 0/21DH6732) (Table 2). A dendrogram showing phenotypic similarity among the 25 DH lines analyzed was constructed from phenotypic similarity coefficients using the UPGMA method of blackleg (Leptosphaeria spp.) resistance observations (Figure 2A). The dendrogram distinguished five similarity groups (Figure 2A). One group consisted of line no. 2. The second group consisted of eight lines numbered 43, 8, 46, 73.1, 73, 29, 38, and 32; the third group consisted of two lines: 59 and 30; the fourth group consisted of six lines (65, 57, 4, 3, 58.1, and 58); and the fifth group consisted of the remaining eight lines: 1, 48, 5, 7, 60, 55, 74.1, and 74 (Figure 2A).
Table 2.
Phenotypic (below the diagonal) and genetic (above the diagonal) similarity of 25 doubled haploid lines.
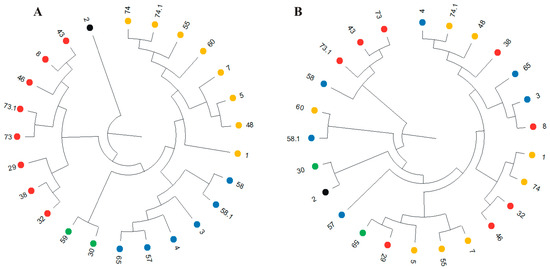
Figure 2.
Dendrogram showing phenotypic (A) and genotypic (B) similarity of blackleg (Leptosphaeria spp.) resistance of 25 doubled haploid (DH) lines, constructed from the UPGMA method based on phenotypic and genotypic, respectively, similarity coefficients. Colored dots indicate DH lines forming similarity groups in the dendrogram constructed based on phenotypic observations (A). The numbers represent the DH lines number (see Table 2).
The genetic similarity of DH lines based of expression of three genes ranged from 0.253 (for 60 and 73.1 lines) to 0.999 (for lines number 3 and 8) (Table 2). Seven groups of similarity were distinguished on the dendrogram (Figure 2B). The grouping of DH lines at the genetic level did not coincide with the grouping at the phenotypic level. The correlation coefficient between these two similarities was 0.0946 and was not statistically significant (p-value is 0.1020).
The results of the regression analysis indicate a significant main effect of the Rlm3 and Rlm7 genes on the blackleg (Leptosphaeria spp.) resistance. The effect of the Rlm7 gene was directly proportional (with an effect of 14.5), while the effect of the Rlm3 gene was inversely proportional (with an effect of −13.9). A statistically significant effects of the Rlm3 × Rlm4 and Rlm4 × Rlm7 gene interactions were also observed (Table 3). The three-way interaction of the Rlm3 × Rlm4 × Rlm7 genes also statistically significantly influenced the blackleg (Leptosphaeria spp.) resistance (Table 3). The final model (significant at the 0.001 level) explained 41.73% of the percentage of variation in blackleg (Leptosphaeria spp.) resistance (Figure 3).
Table 3.
Main and interactive effects of three gene expression on blackleg (Leptosphaeria spp.) resistance of 25 doubled haploid (DH) lines.
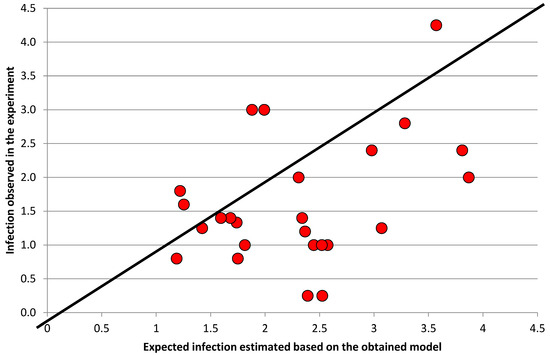
Figure 3.
Expected infection estimated based on the obtained mathematical model taking into account statistically significant parameters.
4. Discussion
The interaction between Brassica napus and L. maculans, the causal agent of blackleg disease, is a well-established example of the classical gene-for-gene model of plant–pathogen relationships first described by Flor [9]. According to this model, resistance in the host is triggered when a plant resistance (R) gene product recognizes a specific pathogen avirulence (Avr) effector.
Several significant resistance genes have been identified and utilized in commercial varieties of rapeseed, including Rlm3, Rlm4, and Rlm7. For instance, the Polish variety Umberto KWS F1 hybrid is reported to carry a combination of genes, Rlm3 and Rlm7, which are known to provide robust resistance to blackleg, and also other varieties like: Austin Limagrain (Rlm3 + Rlm7), Aurelia Limagrain (Rlm7), Topas-Rlm4 (Rlm4), BASF3000TR (Rlm4). However, the durability of R gene-mediated resistance is often dependent on pathogen population structure and effector polymorphisms [30,31].
In the present study, we analyzed expression profiles of Rlm3, Rlm4, and Rlm7 blackleg resistance genes and their interactions after inoculation with L. maculans using a two-step RT-qPCR method. The results showed that expression patterns were heterogeneous across doubled haploid oilseed rape lines. Although a fold change of ≥2 is often used to define biologically significant gene expression in studies of blackleg resistance, the relatively modest changes observed here were consistent across all genotypes, indicating a reproducible transcriptional response rather than random variation. In this context, such steady regulation may represent fine-tuning of R-gene expression, forming part of a regulatory mechanism that contributes to partial or quantitative resistance [32,33]. Rlm3 expressed weak induction, while Rlm4 displayed variable response and Rlm7 exhibited relatively stronger and more consistent induction. These findings are in agreement with earlier studies [34,35,36].
Rlm3 is among the earliest identified R genes in B. napus, facilitating the recognition of the effector AvrLm3 [30,37]. However, due to the pathogen population dynamics, the Avr allele can mutate, resulting in the erosion of Rlm3-based resistance. Furthermore, Rlm3 tends to show low induction levels after L. maculans infection [34]. Rlm4 and Rlm7 have been shown to recognize the dual effector AvrLm4-7 of L. maculans [38]. It has been observed that the expression of Rlm4 is only transiently induced after pathogen recognition and can be limited when AvrLm4-7 alleles undergo sequence changes. Conversely, Rlm7 is regarded as one of the most durable major resistance genes against L. maculans [31,39]. Moreover, Rlm7 shows strong early induction in resistant cultivars [35,36]. Although differences in relative expression fold change were small and statistically insignificant, the observed trends support the notion that transcriptional dynamics contribute to the durability of Rlm7-mediated resistance, while Rlm3-based resistance is more prone to erosion.
Phenotypic similarity evaluation of resistance in the 25 analyzed oilseed rape DH lines revealed five distinct groups. Expression-based genetic similarity distinguished seven groups. Interestingly, no coincidence at genotypic and phenotypic level was observed. Similar results were obtained by Kozak et al. [40] examining eighteen parental lines of F1 winter oilseed rape hybrids produced in the CMS ogura crossing system. This finding may suggest that the expression of individual resistance genes can explain only a part of resistant phenotype. Additional genetic or epigenetic factors and quantitative resistance loci may contribute to the resistance variability [41,42]. Several mechanisms could contribute to this decoupling: post-transcriptional regulation (e.g., mRNA stability, translation efficiency), epigenetic modifications affecting R-gene accessibility, or variation in pathogen effector alleles that escape recognition. In addition, allelic diversity at resistance loci can significantly influence phenotypic outcomes, as different alleles may encode proteins with altered recognition specificities, binding affinities, or signaling capacities, thereby modulating resistance without necessarily changing transcript levels. For instance, certain variants of Rlm9, as well as allelic forms of Rlm4 and Rlm7, have been reported to exhibit partial or incomplete recognition of their corresponding effectors, producing reduced lesion sizes or delayed disease progression rather than complete immunity [10,15,16,35]. Such partial recognition imposes weaker selection pressure on the pathogen population, slowing the evolution of virulent L. maculans isolates and thereby enhancing the durability of resistance compared to fully effective R-gene alleles. Conversely, strong, race-specific alleles can be rapidly overcome in the field due to intense selective pressure on corresponding Avr genes [43]. The interplay between allelic variants of Rlm3, Rlm4, and Rlm7 may therefore shape both the effectiveness and longevity of resistance, particularly when multiple alleles are combined or pyramided in a single cultivar.
Beyond the sequence variation within major R-genes, partial and quantitative resistance in B. napus can also be influenced by additional genetic and epigenetic factors. Quantitative resistance loci (QTL) distributed across the genome can modulate the host defense response by regulating basal immune pathways, cell wall fortification, and secondary metabolite production, effectively reducing disease severity even in the absence of complete R–Avr recognition [41,44]. Epigenetic mechanisms, including DNA methylation and chromatin remodeling, may further adjust the expression levels of R-genes or downstream defense genes in response to pathogen attack, contributing to variable resistance phenotypes [45,46]. Collectively, these layers of genetic and epigenetic regulation, together with allelic variation in Rlm3, Rlm4, and Rlm7, likely determine the spectrum of partial or quantitative resistance observed in oilseed rape, highlighting the complex and multilayered nature of host–pathogen interactions in this system.
Regression analysis further highlighted the contrasting contributions of the tested genes. While Rlm7 showed a strong positive effect on resistance (β = +14.5), Rlm3 had an inverse effect (β = −13.9), consistent with the hypothesis that low expression or pathogen-driven adaptation may limit its protective role. Moreover, significant two-way (Rlm3 × Rlm4, Rlm4 × Rlm7) and three-way (Rlm3 × Rlm4 × Rlm7) interactions were detected, indicating that epistatic effects strongly influence the expression of resistance phenotypes. The positive effect of two-way interaction of Rlm4 × Rlm7 may be interpreted as synergistic, enhancing the overall resistance beyond the sum of individual effects. Conversely, interactions involving Rlm3 show negative contributions suggesting and antagonistic effect, where Rlm3 can suppress or modulate the effect of other R-genes. The final model explained 41.73% of the observed variation in blackleg resistance, underscoring the importance of considering gene interactions rather than focusing solely on individual loci.
Interactions among Rlm genes can modify expression patterns. Pyramiding Rlm7 with Rlm3 or Rlm4 can lead to additive or synergistic effects, where the expression of one gene enhances or stabilizes the transcriptional response of the other [41,47,48]. Conversely, epistatic interactions can occur when the presence of one Rlm gene suppresses or masks the effect of another, as observed in some combinations involving Rlm4 and Rlm7 [36]. These correlations between gene expression kinetics and resistance phenotypes highlight that field performance is not solely determined by gene presence, but also by the magnitude, timing, and coordination of their transcriptional activation.
This study provides valuable insights into the expression dynamics of Rlm3, Rlm4, and Rlm7 and their contributions to resistance phenotypes in B. napus. While focused on a subset of major R-genes and specific developmental stages, the results highlight key trends in gene expression and interactions that can inform broader resistance mechanisms. Future research could build on these findings by exploring additional R-genes, allelic variants, and quantitative resistance loci, as well as by assessing expression across multiple tissues and growth stages. Integrating host expression data with pathogen population genomics would further enhance our understanding of the molecular basis of resistance durability and adaptation. These insights have direct applications for breeding strategies, supporting the design of cultivars that combine complementary R-gene alleles with quantitative resistance for durable, field-relevant protection against blackleg disease.
Knowledge of additive, synergistic, or antagonistic interactions can guide strategic pyramiding of complementary R-genes in new cultivars to maximize durability and broaden resistance spectra. The reproducible transcriptional patterns observed across genotypes suggest that expression-based screening could be incorporated into early-stage cultivar evaluation, enabling breeders to identify lines with optimal R-gene activity even before full pathogen exposure. Furthermore, the use of double haploid populations and validated reference genes provides a platform for high-throughput assessment, supporting large-scale selection and accelerating cultivar development.
5. Conclusions
Expression profiling showed distinctly diverse transcriptional patterns of Rlm3, Rlm4, and Rlm7 blackleg resistance genes. The lack of concordance between gene expression-based groupings and those based on field resistance suggests that gene transcription levels alone cannot fully predict resistance outcomes. Regression models highlighted the significant role of two-way and three-way interactions between the Rlm genes. These findings indicate that durable blackleg resistance requires not only the deployment of major R genes but also the strategic pyramiding of multiple resistance sources, to enhance durability and effectiveness. Considering the influence of gene interactions on the expression of observed traits is therefore essential when making selection decisions. Failure to consider these interactions may lead to different (erroneous) conclusions.
Author Contributions
Conceptualization, J.B., J.N. and E.S.; methodology, J.B., E.S., J.K. and J.N.; software, J.B. and E.S.; validation, J.B. and E.S.; formal analysis, J.B. and E.S.; investigation, J.B., E.S., I.P. and J.K.; resources, J.B., E.S. and J.N.; data curation, J.B. and E.S.; writing—original draft preparation, J.B., E.S. and J.N.; writing—review and editing, J.N., E.S. and J.B., visualization, J.B. and E.S.; supervision, J.N.; project administration, J.N.; funding acquisition, J.N. All authors have read and agreed to the published version of the manuscript.
Funding
This work was funded by the Polish Ministry of Science and Higher Education, project titled: Integrated strategy for assessing the resilience of oilseed plants to environmental stresses: digital phenotyping and spatial transcriptomics.
Institutional Review Board Statement
Not applicable.
Informed Consent Statement
Not applicable.
Data Availability Statement
The raw data supporting the conclusions of this article will be made available by the authors on request.
Conflicts of Interest
The authors declare no conflicts of interest.
References
- Friedt, W.; Tu, J.; Fu, T. Academic and Economic Importance of Brassica napus Rapeseed. In The Brassica napus Genome; Springer: Berlin/Heidelberg, Germany, 2018; pp. 1–20. [Google Scholar] [CrossRef]
- Dilantha Fernando, W.G.; Zhang, X.; Amarasinghe, C.C. Detection of Leptosphaeria maculans and Leptosphaeria biglobosa Causing Blackleg Disease in Canola from Canadian Canola Seed Lots and Dockage. Plants 2016, 5, 12. [Google Scholar] [CrossRef]
- Rashid, M.H.; Liban, S.; Zhang, X.; Parks, P.; Borhan, H.; Dilantha Fernando, W.G. Impact of Brassica napus–Leptosphaeria maculans Interaction on the Emergence of Virulent Isolates of L. maculans, Causal Agent of Blackleg Disease in Canola. Plant Pathol. 2020, 70, 459–474. [Google Scholar] [CrossRef]
- Kutcher, H.R.; Yu, F.; Brun, H. Improving Blackleg Disease Management of Brassica napus from Knowledge of Genetic Interactions with Leptosphaeria maculans. Can. J. Plant Pathol. 2010, 32, 29–34. [Google Scholar] [CrossRef]
- Hwang, S.F.; Strelkov, S.E.; Peng, G.; Ahmed, H.; Zhou, Q.; Turnbull, G. Blackleg (Leptosphaeria maculans) Severity and Yield Loss in Canola in Alberta, Canada. Plants 2016, 5, 31. [Google Scholar] [CrossRef]
- Huang, Y.J.; Pirie, E.J.; Evans, N.; Delourme, R.; King, G.J.; Fitt, B.D.L. Quantitative Resistance to Symptomless Growth of Leptosphaeria maculans (Phoma Stem Canker) in Brassica napus (Oilseed Rape). Plant Pathol. 2009, 58, 314–323. [Google Scholar] [CrossRef]
- Vasquez-Teuber, P.; Rouxel, T.; Mason, A.S.; Soyer, J.L. Breeding and Management of Major Resistance Genes to Stem Canker/Blackleg in Brassica Crops. Theor. Appl. Genet. 2024, 137, 192. [Google Scholar] [CrossRef]
- Amas, J.; Anderson, R.; Edwards, D.; Cowling, W.; Batley, J. Status and Advances in Mining for Blackleg (Leptosphaeria maculans) Quantitative Resistance (QR) in Oilseed Rape (Brassica napus). Theor. Appl. Genet. 2021, 134, 3123–3145. [Google Scholar] [CrossRef]
- Flor, H.H. Current Status of the Gene-For-Gene Concept. Annu. Rev. Phytopathol. 1971, 9, 275–296. [Google Scholar] [CrossRef]
- Delourme, R.; Pilet-Nayel, M.L.; Archipiano, M.; Horvais, R.; Tanguy, X.; Rouxel, T.; Brun, H.; Renard, M.; Balesdent, M.H. A Cluster of Major Specific Resistance Genes to Leptosphaeria maculans in Brassica napus. Phytopathology 2004, 94, 578–583. [Google Scholar] [CrossRef]
- Rouxel, T.; Balesdent, M.H. Life, Death and Rebirth of Avirulence Effectors in a Fungal Pathogen of Brassica Crops, Leptosphaeria maculans. New Phytol. 2017, 214, 526–532. [Google Scholar] [CrossRef]
- Schreuder, H.M.; van Coller, G.J.; Coetzee, B.; Mostert, D. Fungicides for the Management of Blackleg Disease of Canola Caused by Leptosphaeria maculans in the Western Cape Province of South Africa. Crop Prot. 2025, 199, 107404. [Google Scholar] [CrossRef]
- Cantila, A.Y.; Thomas, W.J.W.; Saad, N.S.M.; Severn-Ellis, A.A.; Anderson, R.; Bayer, P.E.; Edwards, D.; Van de Wouw, A.P.; Batley, J. Identification of Candidate Genes for LepR1 Resistance against Leptosphaeria maculans in Brassica napus. Front. Plant Sci. 2023, 14, 1051994. [Google Scholar] [CrossRef] [PubMed]
- Haddadi, P.; Ma, L.; Wang, H.; Borhan, M.H. Genome-Wide Transcriptomic Analyses Provide Insights into the Lifestyle Transition and Effector Repertoire Of Leptosphaeria maculans during the Colonization Of Brassica Napus seedlings. Mol. Plant Pathol. 2016, 17, 1196–1210. [Google Scholar] [CrossRef]
- Larkan, N.J.; Ma, L.; Haddadi, P.; Buchwaldt, M.; Parkin, I.A.P.; Djavaheri, M.; Borhan, M.H. The Brassica Napus Wall-Associated Kinase-like (WAKL) Gene Rlm9 Provides Race-Specific Blackleg Resistance. Plant J. 2020, 104, 892–900. [Google Scholar] [CrossRef]
- Vollrath, P.; Chawla, H.S.; Alnajar, D.; Gabur, I.; Lee, H.T.; Weber, S.; Ehrig, L.; Koopmann, B.; Snowdon, R.J.; Obermeier, C. Dissection of Quantitative Blackleg Resistance Reveals Novel Variants of Resistance Gene Rlm9 in Elite Brassica napus. Front. Plant Sci. 2021, 12, 749491. [Google Scholar] [CrossRef]
- Harshitha, R.; Arunraj, D.R. Real-Time Quantitative PCR: A Tool for Absolute and Relative Quantification. Biochem. Mol. Biol. Educ. 2021, 49, 800–812. [Google Scholar] [CrossRef] [PubMed]
- Venbrux, M.; Crauwels, S.; Rediers, H. Current and Emerging Trends in Techniques for Plant Pathogen Detection. Front. Plant Sci. 2023, 14, 1120968. [Google Scholar] [CrossRef]
- Mirmajlessi, S.M.; Loit, E.; Mänd, M.; Mansouripour, S.M. Real-Time PCR Applied to Study on Plant Pathogens: Potential Applications in Diagnosis—A Review. Plant Prot. Sci. 2015, 51, 177–190. [Google Scholar] [CrossRef]
- Szała, L.; Kaczmarek, Z.; Matuszczak, M.; Cegielska-Taras, T. Genetic Variability in a Population of Oilseed Rape DH Lines Developed from F1 Hybrids of a Cross between Black-and Yellow-Seeded DH Lines. II. Seed Quality. Agriculture 2022, 12, 340. [Google Scholar] [CrossRef]
- Bocianowski, J.; Nowosad, K.; Dobrzycka, A.; Wolko, J. Estimation of Additive and Epistatic Gene Effects of Doubled Haploid Lines of Winter Oilseed Rape (Brassica napus L.). Euphytica 2017, 213, 122. [Google Scholar] [CrossRef]
- Raman, H.; Raman, R.; Kilian, A.; Detering, F.; Long, Y.; Edwards, D.; Parkin, I.A.P.; Sharpe, A.G.; Nelson, M.N.; Larkan, N.; et al. A Consensus Map of Rapeseed (Brassica napus L.) Based on Diversity Array Technology Markers: Applications in Genetic Dissection of Qualitative and Quantitative Traits. BMC Genom. 2013, 14, 277. [Google Scholar] [CrossRef]
- Kaczmarek, J.; Latunde-Dada, A.O.; Irzykowski, W.; Cools, H.J.; Stonard, J.F.; Brachaczek, A.; Jedryczka, M. Molecular screening for avirulence alleles AvrLm1 and AvrLm6 in airborne inoculum of Leptosphaeria maculans and winter oilseed rape (Brassica napus) plants from Poland and the UK. J. Appl. Genet. 2014, 55, 529–539. [Google Scholar] [CrossRef]
- Balesdent, M.H.; Attard, A.; Ansan-Melayah, D.; Delourme, M.; Renard, M.; Rouxel, T. Genetic control and host range of avirulence towards Brassica napus cultivars Quinta and Jet neuf in Leptosphaeria maculans. Phytopathology 2001, 91, 70–76. [Google Scholar] [CrossRef]
- Ma, L.; Wu, J.; Qi, W.; Coulter, J.A.; Fang, Y.; Li, X.; Liu, L.; Jin, J.; Niu, Z.; Yue, J.; et al. Screening and Verification of Reference Genes for Analysis of Gene Expression in Winter Rapeseed (Brassica rapa L.) under Abiotic Stress. PLoS ONE 2020, 15, e0236577. [Google Scholar] [CrossRef]
- Yang, H.; Liu, J.; Huang, S.; Guo, T.; Deng, L.; Hua, W. Selection and Evaluation of Novel Reference Genes for Quantitative Reverse Transcription PCR (QRT-PCR) Based on Genome and Transcriptome Data in Brassica napus L. Gene 2014, 538, 113–122. [Google Scholar] [CrossRef]
- Wang, Z.; Chen, Y.; Fang, H.; Shi, H.; Chen, K.; Zhang, Z.; Tan, X. Selection of Reference Genes for Quantitative Reverse-Transcription Polymerase Chain Reaction Normalization in Brassica napus under Various Stress Conditions. Mol. Genet. Genom. 2014, 289, 1023–1035. [Google Scholar] [CrossRef]
- Bocianowski, J.; Starosta, E.; Jamruszka, T.; Szwarc, J.; Jędryczka, M.; Grynia, M.; Niemann, J. Quantifying Genetic Parameters for Blackleg Resistance in Rapeseed: A Comparative Study. Plants 2024, 13, 2710. [Google Scholar] [CrossRef]
- VSN International. Genstat for Windows, 23rd ed.; VSN International: Hemel Hempstead, UK, 2023. [Google Scholar]
- Balesdent, M.-H.; Laval, V.; Noah, J.M.; Bagot, P.; Mousseau, A.; Rouxel, T. Large-Scale Population Survey of Leptosphaeria maculans in France Highlights Both on-Going Breakdowns and Potentially Effective Resistance Genes in Oilseed Rape. Pest Manag. Sci. 2023, 80, 2426–2434. [Google Scholar] [CrossRef] [PubMed]
- Plissonneau, C.; Daverdin, G.; Ollivier, B.; Blaise, F.; Degrave, A.; Fudal, I.; Rouxel, T.; Balesdent, M. A Game of Hide and Seek between Avirulence Gene AvrLm4-7 and AvrLm3 in Leptosphaeria maculans. New Phytol. 2015, 209, 1613–1624. [Google Scholar] [CrossRef] [PubMed]
- Macqueen, A.; Bergelson, J. Modulation of R-Gene Expression across Environments. J. Exp. Bot. 2016, 67, 2093. [Google Scholar] [CrossRef] [PubMed]
- Dang, P.M.; Lamb, M.C.; Chen, C.Y. Association of Differentially Expressed R-Gene Candidates with Leaf Spot Resistance in Peanut (Arachis hypogaea L.). Mol. Biol. Rep. 2021, 48, 323–334. [Google Scholar] [CrossRef] [PubMed]
- Zhang, X.; Peng, G.; Kutcher, H.R.; Balesdent, M.H.; Delourme, R.; Dilantha Fernando, W.G. Breakdown of Rlm3 Resistance in the Brassica napus–Leptosphaeria maculans Pathosystem in Western Canada. Eur. J. Plant Pathol. 2015, 145, 659–674. [Google Scholar] [CrossRef]
- Zhang, X.; Dilantha Fernando, W.G. Insights into Fighting against Blackleg Disease of Brassica napus in Canada. Crop Pasture Sci. 2018, 69, 40–47. [Google Scholar] [CrossRef]
- Haddadi, P.; Larkan, N.J.; Van deWouw, A.; Zhang, Y.; Xiang Neik, T.; Beynon, E.; Bayer, P.; Edwards, D.; Batley, J.; Borhan, M.H. Brassica napus Genes Rlm4 and Rlm7, Conferring Resistance to Leptosphaeria maculans, Are Alleles of the Rlm9 Wall-associated Kinase-like Resistance Locus. Plant Biotechnol. J. 2022, 20, 1229. [Google Scholar] [CrossRef]
- Borhan, M.H.; Van De Wouw, A.P.; Larkan, N.J. Molecular Interactions Between Leptosphaeria maculans and Brassica Species. Annu. Rev. Phytopathol. 2022, 60, 237–257. [Google Scholar] [CrossRef] [PubMed]
- Dilantha Fernando, W.G.; Zhang, X.; Selin, C.; Zou, Z.; Liban, S.H.; McLaren, D.L.; Parks, P.S.; Harunur Rashid, M.; Rasanie Padmathilake, K.E.; Rong, L.; et al. A Six-Year Investigation of the Dynamics of Avirulence Allele Profiles, Blackleg Incidence, and Mating Type Alleles of Leptosphaeria maculans Populations Associated with Canola Crops in Manitoba, Canada. Plant Dis. 2018, 102, 790–798. [Google Scholar] [CrossRef]
- Mitrousia, G.K.; Huang, Y.J.; Qi, A.; Sidique, S.N.M.; Fitt, B.D.L. Effectiveness of Rlm7 Resistance against Leptosphaeria maculans (Phoma Stem Canker) in UK Winter Oilseed Rape Cultivars. Plant Pathol. 2018, 67, 1339–1353. [Google Scholar] [CrossRef]
- Kozak, M.; Bocianowski, J.; Liersch, A.; Tartanus, M.; Bartkowiak-Broda, I.; Piotto, F.A.; Azevedo, R.A. Genetic divergence is not the same as phenotypic divergence. Mol. Breed. 2011, 28, 277–280. [Google Scholar] [CrossRef][Green Version]
- Raman, H.; Raman, R.; Diffey, S.; Qiu, Y.; McVittie, B.; Barbulescu, D.M.; Salisbury, P.A.; Marcroft, S.; Delourme, R. Stable Quantitative Resistance Loci to Blackleg Disease in Canola (Brassica napus L.) over Continents. Front. Plant Sci. 2018, 871, 412957. [Google Scholar] [CrossRef]
- Huang, Y.J.; Mitrousia, G.K.; Sidique, S.N.M.; Qi, A.; Fitt, B.D.L. Combining R Gene and Quantitative Resistance Increases Effectiveness of Cultivar Resistance against Leptosphaeria maculans in Brassica napus in Different Environments. PLoS ONE 2018, 13, e0197752. [Google Scholar] [CrossRef]
- Sprague, S.J.; Balesdent, M.H.; Brun, H.; Hayden, H.L.; Marcroft, S.J.; Pinochet, X.; Rouxel, T.; Howlett, B.J. Major Gene Resistance in Brassica Napus (Oilseed Rape) Is Overcome by Changes in Virulence of Populations of Leptosphaeria maculans in France and Australia. Eur. J. Plant Pathol. 2006, 114, 33–40. [Google Scholar] [CrossRef]
- Larkan, N.J.; Raman, H.; Lydiate, D.J.; Robinson, S.J.; Yu, F.; Barbulescu, D.M.; Raman, R.; Luckett, D.J.; Burton, W.; Wratten, N.; et al. Multi-Environment QTL Studies Suggest a Role for Cysteine-Rich Protein Kinase Genes in Quantitative Resistance to Blackleg Disease in Brassica napus. BMC Plant Biol. 2016, 16, 183. [Google Scholar] [CrossRef]
- Xiao, Y.; Li, M.; Wang, J. Epigenetic Modification Brings New Opportunities for Gene Capture by Transposable Elements in Allopolyploid Brassica napus. Hortic. Res. 2025, 12, uhaf028. [Google Scholar] [CrossRef] [PubMed]
- Abdulraheem, M.I.; Xiong, Y.; Moshood, A.Y.; Cadenas-Pliego, G.; Zhang, H.; Hu, J. Mechanisms of Plant Epigenetic Regulation in Response to Plant Stress: Recent Discoveries and Implications. Plants 2024, 13, 163. [Google Scholar] [CrossRef] [PubMed]
- Cyplik, A.; Piaskowska, D.; Czembor, P.; Bocianowski, J. The Use of Weighted Multiple Linear Regression to Estimate QTL × QTL × QTL Interaction Effects of Winter Wheat (Triticum Aestivum L.) Doubled-Haploid Lines. J. Appl. Genet. 2023, 64, 679–693. [Google Scholar] [CrossRef] [PubMed]
- Cyplik, A.; Bocianowski, J. Analytical and Numerical Comparisons of Two Methods of Estimation of Additive × Additive × Additive Interaction of QTL Effects. J. Appl. Genet. 2022, 63, 213–221. [Google Scholar] [CrossRef]
Disclaimer/Publisher’s Note: The statements, opinions and data contained in all publications are solely those of the individual author(s) and contributor(s) and not of MDPI and/or the editor(s). MDPI and/or the editor(s) disclaim responsibility for any injury to people or property resulting from any ideas, methods, instructions or products referred to in the content. |
© 2025 by the authors. Licensee MDPI, Basel, Switzerland. This article is an open access article distributed under the terms and conditions of the Creative Commons Attribution (CC BY) license (https://creativecommons.org/licenses/by/4.0/).