Abstract
Concentrated solar power technology offers an effective pathway for large-scale renewable electricity generation in areas with abundant solar resources. This study develops and evaluates a cascaded multigeneration system that integrates a solar power tower with a subcritical-CO2 Brayton cycle, a bottoming Rankine cycle, and a multi-effect distillation unit designed for Mediterranean conditions. The system achieves a maximum net power output of 23.48 MW and a freshwater production rate of 14.25 kg/s during peak summer conditions. The analysis reveals that high solar availability enables CO2 mitigation of up to 27,434.55 kg-CO2/h, thereby emphasizing the strong environmental benefits of the proposed system. The integrated Sb-CO2–Rankine–Desalination configuration attains overall thermal efficiencies of 0.39–0.43, while exergy efficiencies reach 0.58 and 0.73 for the Sb-CO2 and Rankine subsystems, respectively. Sensitivity analysis further confirms the strong pressure dependence of the Sb-CO2 cycle, with an optimum operation condition around 10 bar and 1100 °C, whereas the Rankine cycle exhibits a steady efficiency enhancement with increasing pressure. The proposed system achieves a simple payback period of 15.3 years, demonstrating its economic feasibility under Mediterranean climatic conditions.
1. Introduction
The rising global energy demand, together with the adverse environmental and climate consequences of continued reliance on fossil fuels, has become increasingly critical. Therefore, the transition toward sustainable and cleaner energy generation technologies is now an unavoidable imperative for both the industry and scientific community [1]. The inherent inefficiency of conventional energy systems, along with their considerable carbon emissions, has driven the advancement of alternative system configurations [2,3]. In this regard, solar energy stands out for its substantial potential, ecologically friendly attributes, and capacity to provide long-term sustainability [4,5]. Therefore, CSP technologies play a crucial role in sustainable energy conversion, particularly owing to their capability of operating at high temperatures and compatibility with thermal energy storage integration. Among these technologies, solar power tower (SPT) systems are of particular significance, as they concentrate high-intensity solar radiation onto a central receiver, thereby providing the temperature levels required for the operation of thermodynamic cycles [6,7]. Despite their potential in high-temperature applications, SPT technologies are still under development, and the integration of highly efficient multigeneration systems is required to minimize the efficiency losses and enhance the overall performance of the plants [8,9].
Recent investigations on SPT systems have highlighted the promising potential of integrating CO2-based thermodynamic cycles [10]. The SPT technologies can achieve turbine inlet temperatures above 1000 °C [11]. Thus, when combined with the unique behavior of carbon dioxide (CO2) as a working fluid near its critical point (exhibits both supercritical and subcritical properties), this provides noticeable thermodynamic benefits, including improved cycle efficiency and enhanced system flexibility [12].
CSP technologies have gained increasing importance over the past decade, not only due to their high potential in energy conversion but also the growing commercialization efforts in hot regions that are unsuitable for agricultural activities [13]. Among these technologies, the SPT stands out with its high efficiency and large-scale power generation capability, while other configurations such as parabolic troughs [14,15], parabolic dishes [16,17], and linear Fresnel reflectors [18] have also been developed and extensively investigated in the literature to adapt to diverse application conditions.
In recent years, several studies have increasingly emphasized the role of thermal energy storage (TES) in SPT systems [19,20,21]. Since the termination of direct solar irradiation at sunset results in an immediate interruption of power generation, molten salt tanks are widely adopted as TES units. These tanks store molten salts at elevated temperatures using heat collected during the day and subsequently release it in the evening hours. This extends electricity production beyond daylight hours and enhances the overall flexibility and reliability of SPT plants [22].
Accordingly, several studies have increasingly focused on the integration of SPT with sCO2-based thermodynamic cycles, motivated by both performance and economic considerations. For instance, it has been reported that the integration of the sCO2 reheat recompression Brayton cycle with SPT systems offers significant advantages in terms of efficiency and fuel savings. The study achieved a thermal efficiency of up to 55.45% and demonstrated approximately 14.58% fuel reduction, thereby suggesting that this integrated configuration could serve as a strong alternative for electricity generation [23]. Some studies have focused on the integration of SPT systems with multigeneration units, which has gained increasing attention as it enables the simultaneous production of multiple outputs such as electricity, cooling, freshwater, and hydrogen from a single energy input. For instance, Nedaei et al. [24] comprehensively conducted energy, exergy and exergoeconomics analyses of an SPT system integrated with LiBr–H2O absorption cooling, desalination (DS), a PEM electrolyzer, and a domestic water heating unit in Dubai. Their results showed outputs of 8.32 MW of electricity, 8.37 MW of cooling capacity, 3.16 kg/s of freshwater, and 0.22 kg/h of hydrogen. Moreover, it should be noted that the exergy efficiency of the system reached 39.15% with a payback period of 2.93 years.
In addition to pure CO2, several studies have investigated the use of CO2-based mixtures or alternative working fluids to evaluate and enhance the performance of Brayton cycle (BC) systems, showing that employing a CO2–H2S mixture could enhance power density by approximately 7.8% [25]. Another study demonstrated that a CO2–SF6 mixture BC achieved a thermal efficiency of 46.22% and an exergy efficiency of 31.59% [26]. Moreover, by accounting for irreversibilities, the regenerative concentrated BC achieved overall efficiencies of 28.8% with CO2, 26.6% with air, and 20.2% with helium as working fluids. Furthermore, under maximum solar irradiance, the energy contribution of the solar concentration system was determined to be 0.209 with air and 0.189 with CO2 [27]. It has also been demonstrated that helium can serve as an alternative working fluid to CO2, with an Organic Rankine Cycle (ORC) integrated as a bottoming cycle. Thermodynamic analyses performed using the EES software revealed that R1233zd(E) is the most efficient working fluid for the ORC. The proposed hybrid power configuration had an exergy efficiency of 39.74%, an energy efficiency of 37.11%, and a net power output of 19,135 kW. Overall, the study emphasized that the proposed system exhibits higher efficiency compared to sCO2-based cycles [28]. The supercritical carbon dioxide (s-CO2) cycle operates above the critical point of CO2 (Tcr = 304.14 K, Pcr = 7.38 MPa). Under these conditions, the fluid exhibits liquid-like density, which reduces the compression work [29]. However, in s-CO2 cycles, the high inlet pressure of the compressor imposes mechanical stress limitations on the system components, thereby restricting the pressure ratio and preventing further increases in net power output [30]. In contrast, operating CO2 under subcritical conditions enhances the heat transfer coefficient, improves thermal exchange processes, and consequently contributes to a reduction in fuel consumption [27,31,32,33]. In this context, while existing studies have predominantly focused on s-CO2, subcritical-CO2 Brayton cycle (Sb-CO2) configurations have been relatively overlooked. To address this gap, this novel study proposes a subcritical CO2-based solar power multigeneration system, specifically designed for the Mediterranean region, aiming to provide valuable insights into lower-pressure applicability, simpler and more cost-effective equipment design, and alternative pathways where supercritical operation possesses technical or economic challenges. Moreover, whereas earlier studies primarily focused on electricity production, the recent literature has highlighted multigeneration systems that utilize waste heat for heating, cooling, and desalination. These strategies are expected to help reduce greenhouse gas emissions and enhance overall system efficiency [34]. As regards this, the present study integrates a simple Rankine cycle (sRC) and a DS unit driven by the waste heat recovered from the Sb-CO2, with the objective of simultaneously producing clean water and electricity.
When compared with previously reported solar-assisted multigeneration systems, the present study introduces several key novelties: Firstly, a subcritical-CO2 Brayton cycle is employed instead of the conventional supercritical configuration, integrated with a solar power tower (SPT) to achieve effective high-temperature operation. The thermodynamic performance of the subcritical-CO2 cycle is comprehensively evaluated over a turbine inlet pressure range of 5–40 bar and a temperature range of 825–1100 °C, incorporating a regenerator for efficiency enhancement. Secondly, the waste heat recovered from the Brayton cycle is successively utilized in a bottoming Rankine sub-cycle and a multi-effect desalination unit, thereby maximizing the utilization of available thermal energy and enabling the simultaneous generation of electricity and freshwater. Thirdly, detailed energy, exergy, and environmental analyses are performed on a monthly basis throughout one year, using real meteorological data corresponding to the Mediterranean climate. Finally, the economic feasibility of the proposed SPT–Sb–CO2–sRC–DS multigeneration configuration is evaluated through a net present value (NPV)-based assessment, ensuring a comprehensive understanding of its techno-economic performance.
2. Materials and Methods
2.1. System Description
A review of the existing literature reveals that the integration of the Sb-CO2 with SPT systems offers remarkable potential for sustainable energy conversion. Owing to its environmentally friendly and long-term applicability, this approach not only stands out as a green alternative but also enables multigeneration opportunities while improving overall cycle efficiency. The schematic configuration of the proposed integrated system is presented in Figure 1. The proposed SPT-assisted Sb-CO2-based integrated energy system was modeled using the Ebsilon® Professional software 16. The system comprises the Sb-CO2, a bottoming sRC sub-cycle, and DS, with each component defined individually within the software environment. The thermodynamic properties of the working fluids were calculated through the built-in database of the program, and the overall system was simulated on a monthly basis over the course of an entire year for the Mediterranean region (MR). Energy balances were applied according to the boundary conditions at the nodal points, while pressure and heat losses, as well as component efficiencies, were taken into account to ensure a realistic evaluation of system performance. In addition, the MR has been identified as a suitable location for the implementation of the Sb-CO2, primarily due to its remarkable solar radiation potential. During the summer season, solar irradiation exceeds 27.46 MJ/m2 in July [35,36], providing the high-temperature and energy input required for efficient operation of the cycle. From a thermodynamic perspective, such an intense solar flux not only enhances the quality of the supplied energy but also improves both the energy efficiency and exergetic performance of the system, thereby strengthening its overall feasibility.
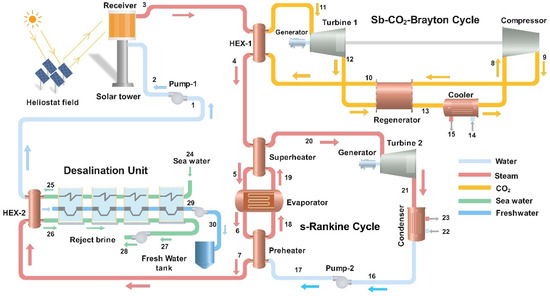
Figure 1.
Schematic of the SPT-assisted multigeneration system integrating Sb-CO2, sRC, and DS.
The innovative advanced integrated energy system proposed in this study consists of a SPT-assisted Sb-CO2, a bottoming sRC, and a multi-stage thermal seawater DS unit. This hybrid configuration is designed to maximize the utilization of solar energy while simultaneously producing electricity and freshwater, thereby enhancing the overall cycle efficiency and improving the sustainability of the system. The system begins with a heliostat field that concentrates solar radiation onto a central receiver located at the solar tower. The concentrated solar flux is converted into heat at the receiver surface, which is then transferred to the cycle through a heat transfer fluid (HTF). This fluid is circulated by Pump-1 (stream 2–3), and the collected thermal energy is delivered to the CO2 via the primary heat exchanger (HEX-1) (stream 3–4). This section represents the starting point of the Sb-CO2. There, CO2 is initially compressed by the compressor (stream 8–9) and subsequently preheated in the regenerator (stream 10). The CO2, further heated to high temperatures through HEX-1, is then directed to Turbine-1 (stream 11–12), where it expands and generates electricity via the coupled generator. The exhaust CO2 flow passes through the regenerator to recover the remaining heat and is then cooled in a cooler before being recirculated back into the cycle (stream 14–15). Following the Sb-CO2 cycle, the recovered heat is transferred to a bottoming sRC through a preheater, evaporator, and superheater. In this subsystem, water is employed as the working fluid. The fluid pressurized by Pump-2 (stream 16–17) is initially heated in the preheater (stream 17–18) using thermal energy from the solar field. The evaporator (stream 18–19) supplies the thermal energy required for the fluid’s complete transition to a saturated vapor state. Finally, the vapor is further heated in the superheater (stream 19–20) to reach a superheated condition before being expanded in Turbine-2 for electricity generation. The exhaust steam from the turbine is condensed in the condenser (stream 22–23), returning to the liquid phase and thereby completing the cycle. After the sRC, the remaining low-grade heat is directed to the DS unit to fulfill a third function within the system. In this unit, the heat transferred through HEX-2 enables the seawater to undergo successive stages of evaporation and condensation, resulting in the production of distilled water (stream 30). At the end of the process, the concentrated brine (stream 28) is discharged, while the produced freshwater is collected in a storage tank.
2.2. System Modeling
This section presents the detailed modeling strategies for the integrated system comprising SPT-Sb-CO2-sRC-DS components. This integrated system was modeled with Ebsilon® Professional software using component-based modeling approach. The thermophysical properties of the working fluids were sourced from the software library, whereas the basic design parameters such as mass flow rates, pressures, and temperature limits were determined from the literature and site-based meteorological data. The main aim of this modeling approach is to replicate the realistic subsystem operation state and enable validated energy and exergy analyses.
In this study, the reference location was selected as the eastern Mediterranean zone of Türkiye, which exhibits typical Mediterranean climatic characteristics. Meteorological data corresponding to the Hatay–Iskenderun region, known for its high solar irradiation potential, were obtained from the database of Ebsilon® Professional software and utilized as input parameters in the model. The monthly variation in direct normal irradiance, ambient temperature, and wind speed corresponding to the Hatay–Iskenderun region is illustrated in Figure 2.
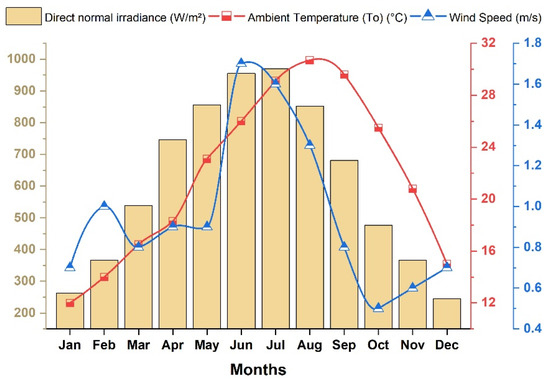
Figure 2.
Monthly variation in direct normal irradiance (DNI), ambient temperature, and wind speed for the Hatay–Iskenderun region (eastern Mediterranean region).
DNI exhibits a pronounced seasonal variation on a monthly basis over the year. It reaches a maximum of 970.28 W/m2 in July and declines to 244.88 W/m2 in December. During the April–August period, DNI remains above 700 W/m2, providing the most suitable period for solar energy production. Although 680.64 W/m2 was recorded in September, the value dropped to 477.04 W/m2 in October, indicating a reduction of more than 30%. The ambient temperature peaks at 30.7 °C in August and falls to 12 °C in January, remaining above 20 °C from April through November. Wind speed varies between 0.5 and 1.7 m/s, with the highest monthly average of 1.7 m/s in June and the lowest values of 0.5 m/s between October and December. From April to September, the combined levels of DNI, ambient temperature, and wind speed stay within the optimal range for system performance. For instance, April recorded a DNI of 746.3 W/m2, temperature of 18.3 °C, and wind speed of 0.9 m/s, while September showed 680.64 W/m2, 29.6 °C, and 0.8 m/s. Therefore, this period represents the key operating window, while the system potential noticeably decreases during the remaining months. Overall, solar irradiance and ambient temperature rise steadily from late winter toward midsummer, reaching their maximum in mid-summer and then gradually decreasing, while wind speed displays a slight increase through spring and summer followed by a gradual decline during autumn and winter. These input parameters were defined within the Ebsilon® Professional software based on the technical specifications established in this study.
The modeling and analysis of the proposed multigeneration system were performed considering the following overarching assumptions and boundary conditions [37,38,39]:
- All system components were modeled under steady-state flow assumptions.
- Kinetic and potential energies were neglected.
- Heat losses within the system are considered negligible, with the exception of the SPT system.
- A pressure drop of 0.1 bar was assumed for each heat exchanger in the Sb-CO2, sRC, and DS.
- In the receiver of the SPT, the pressure drop was accepted as 15 bar.
- Ambient temperature changes between 12 and 30.7 °C according to the months during a year.
- The cooling water inlet temperature is 20 °C
- For the heat exchangers, the minimum pinch-point temperature difference is taken as 10 °C.
- The pump and compressor are modeled with isentropic efficiencies of 80% and 85%, respectively.
- Isentropic efficiencies of 85% for the Sb-CO2 turbine and 86% for the sRC turbine are adopted in the model.
The evaluation of the SPT-Sb-CO2-sRC-DS multigeneration system was carried out by applying the first and second laws of thermodynamics individually to each component and sub-cycle. The thermodynamic model was developed under steady-state operating conditions, and the principal input parameters are presented in Table 1.

Table 1.
Assumptions and main input data of the proposed system [37,38,39].
DNI, ambient temperature, and wind speed values correspond to meteorological data of the selected MR using Ebsilon® Professional software. The heliostat field and receiver efficiencies were adopted from values widely reported in the literature on CSP systems. The apparent temperature of the sun was assumed to be 5570 K [39]. The inlet and outlet temperatures of the regenerator for the hot and cold streams were defined based on preliminary cycle simulations to ensure optimal thermal matching. Efficiency values of the compressor, heat exchangers, and other major components were selected according to typical assumptions used in previous s-CO2 Brayton cycle studies and are given in Table 1. These assumptions enable a realistic representation of system behavior and ensure consistency with findings reported in the literature.
2.3. Thermodynamic Model
In the performance assessment of the Sb-CO2 multigeneration system, the first and second laws of thermodynamics were applied to each component. Within this framework, the conservation of mass and energy balance relations were taken into account. Accordingly, the overall system performance was evaluated on the basis of thermodynamic principles [40,41].
The mass conservation principle requires that the total mass entering a control volume equals the total mass leaving it. In this notation, indicates mass flow rate, while subscripts and correspond to the inlet and outlet, respectively. The corresponding energy balance equation is given below [40,41]:
where is heat transfer, is the work interaction, and is the specific enthalpy. According to the first law of thermodynamics, the total energy entering a control volume in the form of heat and the enthalpy of the inlet streams must equal the work output and the enthalpy carried by the outlet streams.
The exergy balance equations used in the present analysis are summarized below [42,43].
where is the total exergy carried into the control volume by mass streams, while corresponds to the exergy leaving the system. Indeed, indicates the exergy transfer associated with heat interactions, represents the exergy linked to work output, and quantifies the exergy destruction due to irreversibilities. Given that the present formulation neglects fluctuations in chemical composition of the working streams, the chemical exergy component was not considered in the performance evaluation.
At state j, the specific physical exergy can be formulated as [44]
where and denote the specific enthalpy and entropy, respectively, and the subscript “0” refers to the environmental reference state.
In the solar subsystem, hundreds of heliostats intercept solar radiation in the form of DNI and redirect it to the receiver. The cumulative solar energy available to the field can be determined through the product of the total heliostat area and the corresponding solar beam flux density [45]:
According to the formulation, the rate of heat entering the receiver is calculated as [45]
However, a portion of this energy is inevitably lost through different heat transfer mechanisms. Hence, the net heat gain by the receiver is defined as [45]
is defined as the exergy rate of solar radiation, expressing the part of the incident solar energy that can be theoretically converted into useful work under environmental conditions. This is given as the following equation [46]:
Here, is the ambient temperature and is the effective sun temperature. is given with the following equations for the Sb-CO2 and sRC [44]:
To evaluate the thermal performance, the efficiencies of the Sb-CO2, sRC, and the integrated plant are expressed using the equations below [44]:
The overall and cycle-specific exergetic efficiencies, including those of the Sb-CO2 and sRC, are obtained using the governing equations given below. These relations are derived from the second law of thermodynamics and quantify the useful work potential relative to the exergy supplied. In other words, the exergetic efficiency can be interpreted as the ratio of the net useful work output to the total exergy input [47].
The fundamental balance equations for each component of the proposed integrated system are summarized, as provided in Table 2. For each unit, both the first law energy balance and the second law exergy balance are included, allowing combined evaluation of component performance from energy and exergy perspectives. In addition, exergetic efficiency expressions are defined for each component, with exergy destruction terms explicitly incorporated into the formulations. The equations are specified separately for pumps, turbines, heat exchangers (regenerator, preheater, evaporator, and superheater), compressors, coolers, condensers, and solar receivers. These mathematical representations form the thermodynamic foundation of the system model and enable a detailed performance assessment of both the subsystems and the overall plant.
Table 2.
Energy and exergy balance equations, together with exergy efficiency expressions of the main components in the integrated Sb-CO2, sRC, and DS system [41,48,49].
2.4. Environmental Analysis
Conventional power generation cycles lack complete efficiency in converting thermal energy into electricity due to their inherent reliance on fossil fuels, emitting considerable quantities of CO2 into the atmosphere. From this perspective, the present study introduces a novel renewable energy-based configuration designed to maximize the utilization of a single energy input to obtain multiple outputs while minimizing overall CO2 emissions. From a thermodynamic perspective, the analyses assume that the entire power output is provided by the gas turbine (GT). In addition, the heat required for the desalination process was determined under the assumption of a natural-gas-fired combustion chamber coupled with a single heat exchanger for thermal transfer, and the associated CO2 reduction was calculated accordingly. The efficiencies of the combustion chamber (CC) and the heat exchanger were assumed to be 0.90 and 0.85, respectively [38,50].
Here, represents the total heat input required by the GT to generate the same amount of power as that produced by the subsystems. The terms and denote the net power output of the subsystems together with the thermal efficiency of the GT. In addition, and represent, respectively, the net heat input to the desalination system and the efficiency of the . Then, the overall mass of fuel required to supply the necessary total heat is determined using the following relation:
Here, and denote the required molar flow rate of the fuel and the molecular weight of the natural gas, respectively.
The molar fractions of the natural gas components employed in the combustion equilibrium are listed in Table 3. Based on the chemical combustion equilibrium, the combustion of 1 kmol of natural gas yields n kmol of CO2. Accordingly, the reduction in CO2 emissions can be calculated as follows:
Table 3.
Molar fractions of natural gas components used in the combustion equilibrium [38].
Here, and , respectively, represent the amount of CO2 emission avoided through the use of the subsystem and the molecular weight of carbon dioxide.
2.5. Economic Evaluation
In addition to thermodynamic evaluations, conducting comprehensive economic assessments of SPT–Sb-CO2–sRC–DS systems is of significant importance. Determining the investment costs, levelized energy costs, and payback periods of such integrated configurations play a crucial role in assessing their overall feasibility and sustainability from both manufacturing and investment perspectives. Therefore, cost and payback analyses constitute an essential stage in evaluating the economic viability and practical applicability of the proposed multigeneration systems. In this section, the total investment cost (TIC) is calculated, encompassing the estimated purchased equipment costs (PECs) together with other associated capital expenditures. Furthermore, the investment feasibility of the proposed system is analyzed based on the net present value (NPV) and the net present value ratio (NPVR). In addition, the simple and discounted payback periods of the proposed system, along with the specific cost of freshwater production, are also evaluated.
In order to estimate the purchased equipment costs (PECs) of the heat exchangers, the heat transfer surface area must first be determined. The calculation procedure is expressed as follows [51]:
For the SPT-Sb-CO2-sRC-DS system, the equipment cost formulas for each component are reported in Table 4.
Table 4.
PEC for each component used in the proposed system. [24,38,39,52,53,54,55].
Here, represents the amount of heat transferred within the heat exchangers, while denotes the overall heat transfer coefficient, which can vary depending on the type of the heat exchanger employed. The overall heat transfer coefficient for the heat exchangers and associated equipment is considered to be 0.6 kW/m2·K [56].
LMTD (logarithmic mean temperature difference) is obtained as follows [57].
While represents the maximum temperature difference between the inlet and outlet of each component, corresponds to the minimum temperature difference. The initial economic parameters adopted for the SPT–Sb–CO2–sRC–DS system are summarized in Table 5.
Table 5.
The initial economic parameters [38,58].
represents the ratio of the overall capital investment cost, given with the following equation [59]:
and represent the operation and maintenance factor and the annual operating time, respectively, whereas denotes the capital recovery factor, which is expressed by the following equation [60]:
In this expression, and denote the interest rate and the operational lifetime of the system, respectively. The term refers to the total additional fixed investment cost, which is determined using the following formula:
The net present value (NPV) and net present value ratio (NPVR) are essential indicators used to assess the economic feasibility of the proposed power systems. When both the NPV and NPVR values are positive, the system can be considered economically viable. These parameters are calculated using the following expressions [61]:
Here, denotes the total yearly benefit obtained from the system. The payback period can be evaluated with both simple and discounted approaches. The simple payback period is not affected by the discount rate. The calculation for payback periods is given below [39,62]:
The unit sales price of freshwater is denoted as and is assumed to be 1.0567 $/m3, while the electricity price is taken as 0.19 $/kWh [55,56,57,58,59,60,61,62,63].
3. Results and Discussion
In this section, the input parameters of the multigeneration power system planned to be located in the Mediterranean region were integrated into the Ebsilon® Professional software using technical data, and comprehensive thermodynamic analyses were carried out. Initially, in order to determine the optimum operating conditions of the system, the thermal efficiency values of the Sb-CO2 cycle and the sRC were comparatively examined under different turbine inlet pressures and temperatures. Subsequently, the monthly variations in mass flow rates for each cycle (SPT, Sb-CO2, and sRC) were evaluated, and both the gross and net power generation of each system were analyzed on a monthly basis. In addition to power generation performance, the monthly energy consumption of each cycle was also calculated, allowing for a comparative assessment among the systems. In the final stage, detailed energy and exergy analyses were conducted for each component of the integrated power system. Within this scope, the net power output, freshwater production capacity, overall energy efficiency, and exergy efficiency of the system were examined on a monthly basis and comparatively illustrated in a single graph. Furthermore, CO2 emission levels and fuel mass demand analyses were also performed on monthly bases. The variations in the thermal efficiency of the Sb-CO2 and sRC under different turbine inlet pressure and temperature conditions are illustrated in Figure 3.
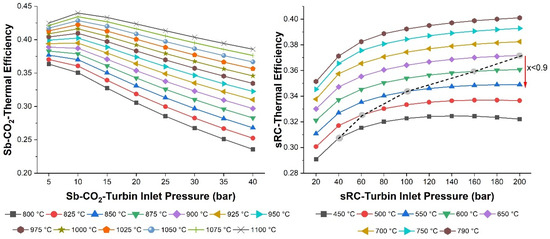
Figure 3.
Comparison of the thermal efficiencies of the Sb-CO2 and the sRC as a function of turbine inlet pressure and turbine inlet temperature.
In order to determine the most suitable operating conditions of the system, the Sb-CO2 and the sRC were analyzed in detail under various turbine inlet temperatures and pressures to evaluate their thermal efficiency values. As a result of this analysis, the optimum operating points corresponding to the maximum thermal efficiency for both cycles were identified. These optimum operating points were subsequently adopted as the reference conditions for the remainder of the study, and based on them, the monthly performance variations in the cycles throughout the year were evaluated. In this way, annual analyses were carried out under these optimum conditions, thereby revealing the influence of seasonal variations and monthly climatic factors on thermodynamic efficiency. In Figure 3, it is observed that in the Sb-CO2 cycle, thermal efficiency reaches a maximum value when the turbine inlet pressure is 10 bar, and then gradually decreases along with the rising compressor work requirement. This effect is performed at especially high turbine inlet temperatures (after 900 °C). The maximum efficiency of the Sb-CO2 cycle is observed at 1100 °C and 10 bar (optimum), reaching approximately 44%. Then, at turbine inlet temperatures of 1000 °C, the Sb-CO2 reaches thermal efficiencies exceeding 40%. The main reason for this is the variation in mass flow rate under constant heat input and the influence of the regenerator. Therefore, although the gross power increases with rising temperature at each pressure level, the net power at a turbine inlet pressure of 10 bar is found to be higher than at other pressures within the turbine inlet temperature range of 925 °C to 1100 °C. Therefore, it is observed that the thermal efficiency of the Sb-CO2 cycle is higher at a turbine inlet pressure of 10 bar when the temperature exceeds 925 °C. However, between 800 and 900 °C, an increase in turbine inlet pressure raises the back work ratio and reduces the influence of the regenerator. Therefore, a continuous decline in thermal efficiency is observed with increasing pressure. On the other hand, the sRC exhibits a continuous increase in thermal efficiency with rising turbine inlet pressure at all temperature levels (except for 450 °C). At constant turbine inlet pressure, the thermal efficiency of the sRC also increases steadily as the temperature rises. It is evident that the rate of increase in thermal efficiency is higher between 20 and 80 bar, while it decreases after 80 bar. The sRC achieves its maximum thermal efficiency at 200 bar and 790 °C, whereas the minimum thermal efficiency is observed at 20 bar and 450 °C. The minimum and maximum thermal efficiencies of the sRC are calculated as 0.29 and 0.40, respectively. In addition, the black dashed line in Figure 3 indicates the region where the steam quality falls below x < 0.9, representing unfavorable turbine conditions. Therefore, it should be forgotten that the sRC must not operate at a dryness fraction lower than 0.9. Based on these results, the analysis of the SPT–Sb-CO2–sRC–DS multigeneration system will be carried out under the optimal thermal efficiency conditions, namely 10 bar and 1100 °C for the Sb-CO2, and 200 bar and 790 °C for the sRC. Figure 4 presents the monthly mass flow variations in the Sb-CO2, sRC, and SPT in a comparative manner, clearly illustrating the influence of seasonal conditions on overall system performance. In a similar study [42], it was reported that for a s-CO2 Brayton cycle integrated with a solar power tower, an increase in turbine inlet temperature enhances the cycle efficiency, whereas operating the system at pressures beyond a certain threshold leads to higher exergy destruction, thereby reducing the overall performance. The study further indicated that the efficiency of the s-CO2 lies within the range of 44–48% (923.15 K and 19,980 kPa optimum for turbine inlet), while the bottoming sRC achieves values between 43% and 44.5% (388.66 K and 12,000 kPa optimum for turbine inlet). In another investigation [20], the thermal efficiency of the s-CO2 was determined to be 35.53% (550 °C and 25 MPa optimum for turbine inlet), and this result was found to be consistent with the efficiency values reported in previous studies. Finally, the optimum operating conditions of the system were determined from thermal efficiency analyses and subsequently adopted for all further evaluations. Based on these results, the analysis of the SPT–Sb-CO2–sRC–DS multigeneration system will be carried out under the optimal thermal efficiency conditions, namely 10 bar and 1100 °C for the Sb-CO2, and 200 bar and 790 °C for the sRC. The monthly mass flow variations in the Sb-CO2, the sRC, and the SPT are presented in a comparative manner over the entire year, clearly demonstrating the influence of seasonal conditions on overall system performance, as shown in Figure 4.
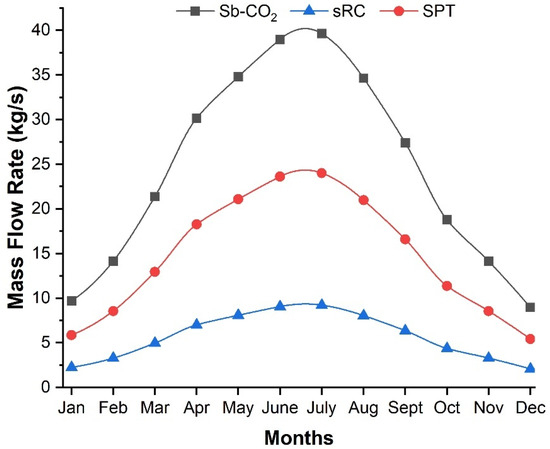
Figure 4.
Monthly variation in mass flow rates for the Sb-CO2, sRC, and SPT.
In Figure 4, the mass flow rate alternation of three different systems was observed for each month throughout the year. As can be seen, the mass flow rates of the fluids used in each system vary due to their thermophysical state. This is directly related to thermal energy, operating pressure, and temperature. When examining the mass flow rate throughout the year, the mass flow rates of SPT-Sb-CO2-sRC systems are increased from spring to summer and decreased towards autumn and winter. The maximum mass flow rates of the SPT-Sb-CO2-sRC are founded in July, while the minimum values are observed in December. The Sb-CO2 reaches the highest value (39.64 kg/s) in July, followed by the solar tower line (24 kg/s), while the sRC remains lower at around 9.20 kg/s. The monthly gross power production of the Sb-CO2 and sRC is comparatively presented across the entire year, highlighting the seasonal influence on overall electricity generation, as shown in Figure 5.
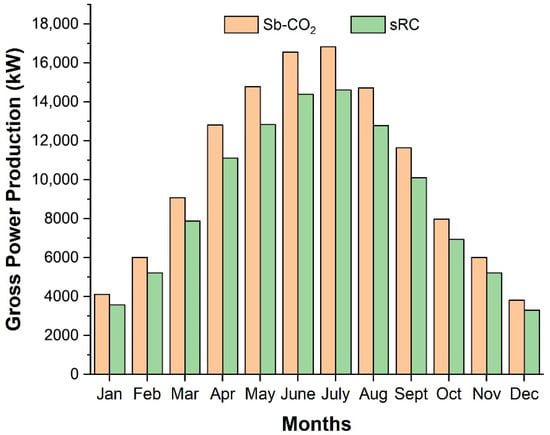
Figure 5.
Monthly gross power production of the Sb-CO2 and the sRC.
Throughout the year, both cycles exhibit a steady rise in gross power output from winter into the summer months, followed by a pronounced decline toward the end of the year. This trend reflects the seasonal variation in DNI, characteristic of the Mediterranean climate. The gross power difference between the Sb-CO2 and sRC remains at the lowest level in winter, reaching 543.8 kW in January. During summer, however, the solar irradiance increases the heat input and, therefore, mechanical power obtained from the turbines in both cycles, allowing the gross power difference between the Sb-CO2 and sRC to reach 2205.05 kW (highest difference) in July. The Sb-CO2 consistently delivered higher gross power output than the sRC throughout the year and reached its peak value of 16,835 kW in July. Further, it is observed that the Sb-CO2 has higher power production than the sRC during May (14,782 kW), June (16,562 kW), and August (14,718 kW). In the sRC, a maximum gross output of 14,614.5 kW is attained in July, with a remarkable performance in May (12,832 kW), June (14,377 kW), and August (12,776 kW). This comparison clearly highlights the seasonal performance influence of solar energy and demonstrates the superior power generation capability of the Sb-CO2 configuration under peak summer conditions. During the winter, the Sb-CO2 cycle recorded its lowest gross power output in December at 3809 kW, remained at a close level in January with 4117 kW, and increased to 6007 kW in February as solar irradiation intensified. Similarly, the sRC achieved its minimum gross output in December at 3505 kW, rose slightly to 3753 kW in January, and reached 5214 kW in February in proportion to higher solar radiation. The monthly net power production of the Sb-CO2 and the sRC is comparatively presented for the entire year, clearly illustrating the seasonal variation in overall system output, as shown in Figure 6.
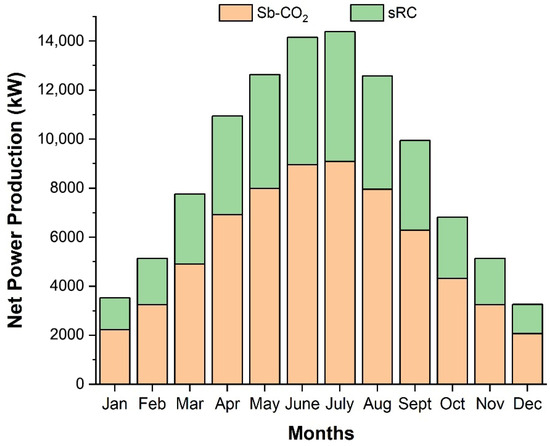
Figure 6.
Monthly net power production of the Sb-CO2 and the sRC.
The Sb-CO2 exhibits the lowest net power production during the winter season, with 2057 kW in December, 2224 kW in January, and 3245 kW in February. With the onset of spring and the resulting increase in sunlight, net production increases rapidly, reaching approximately 6919 kW by April. The sRC follows a similar seasonal pattern. While net production remains around 3253 kW in December, 3517 kW in January, and 5131 kW in February; in winter, it increases with the increasing availability of solar energy, reaching approximately 10,943 kW in April. In contrast to the low-production pattern observed during winter, the summer period represents the stage of maximum energy conversion for both cycles. The Sb-CO2 cycle attains its highest net power output in July, reaching 9093 kW, whereas the bottoming sRC achieves a markedly greater value of about 14,382 kW in the same month. Throughout the summer, sustained high solar irradiation and favorable operating conditions enable both cycles to maintain stable and reliable power generation. This pronounced growth indicates that both cycles are strongly influenced by seasonal solar energy, while the sRC benefits more directly from the enhanced quantity and quality of waste heat recovered from the Brayton exhaust. An important observation is that although the gross electrical output is consistently higher for the Sb-CO2 cycle, the net power delivered throughout the year is greater for the sRC once auxiliary consumption and compressor work are considered. This outcome reflects the Rankine subsystem’s lower specific work requirement and relatively small back-work ratio, which allow more efficient conversion of the available thermal energy into net electricity. The analysis reveals that the sRC consistently generates approximately 58% more power than the Sb-CO2 throughout the year, including the winter months. This difference is mainly attributed to the high compressor work in the Sb-CO2, which reduces its net output, while the sRC functions as the dominant power generation unit. Moreover, the Sb-CO2 enhances the reliability of the integrated system, owing to its operational flexibility at high temperatures and compact design features. The monthly electricity consumption of the supporting components, namely the sRC pump, the SPT pump, and the compressor, was evaluated to show the seasonal variation in their power demand, and the corresponding data are presented in Figure 7.
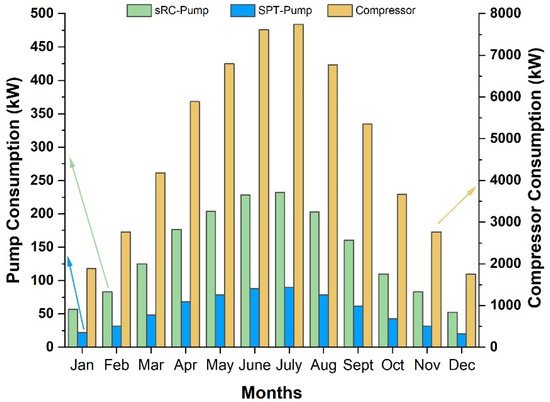
Figure 7.
Monthly electricity consumption of the sRC pump, SPT-pump, and the compressor.
The electricity consumption of all components reaches its highest levels in the summer months and declines markedly during the winter. Comparing monthly electricity consumption clearly shows that compressor demand (orange bars) remains significantly higher than other components throughout the year. In July, the maximum power demand was measured as 7742 kW for the compressor, 90 kW for the SPT-pump, and 232 kW for the sRC pump. Conversely, in December, all devices reached their minimum consumption, with values of 1752 kW for the compressor, 20 kW for the SPT-pump, and 52 kW for the sRC pump. On a monthly basis, the compressor consumption of the Sb-CO2 is on average 33 times higher than that of the sRC. The relatively low pump consumptions (green and blue bars) indicate that the additional energy requirements of the sRC and SPT subsystems are comparatively limited. In the sRC, the pump consumption accounts for approximately 1.6% of the gross turbine output. By contrast, the back-work ratio calculated for the Sb-CO2 reaches 45.99%, highlighting the substantial impact of compressor work on overall cycle performance. Recently, Di Marcoberardino [64] reported that in the s-CO2, pump work represents around 3% of the turbine power, while compressor consumption is nearly an order of magnitude higher, reaching up to 34%. Although the present analysis considers subcritical conditions, the results follow a similar trend to those reported under supercritical operation, reaffirming the critical role of the compressor in determining the performance of CO2 power cycles. Monthly exergy efficiencies of the Sb-CO2, sRC, and overall system are summarized in Figure 8.
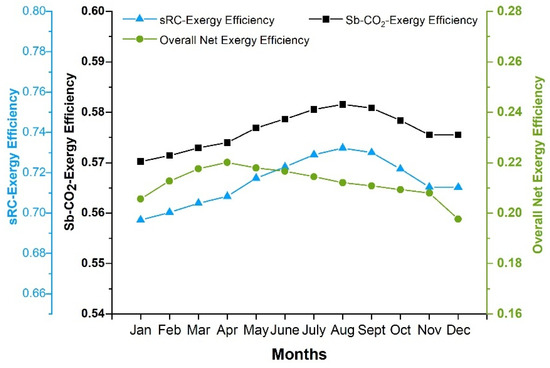
Figure 8.
Monthly exergy efficiencies of the Sb-CO2, the sRC, and the overall system.
An examination of the monthly data reveals that the Sb-CO2 cycle consistently exhibits the highest exergy efficiency among the subsystems. Its minimum value occurs in January at 0.57, while the maximum is recorded in July and August at 0.58. The sRC reflects a similar yearly variation, reaching its minimum efficiency of 0.70 in January and a maximum of 0.73 in August. For the overall net exergy efficiency, the minimum value of 0.20 is observed during the winter months, whereas the maximum of 0.22 appears in April. All three exergy–efficiency time-series exhibit a marked increase in summer and a decrease in winter, highlighting the system’s sensitivity to solar irradiance. The monthly exergy efficiencies show that the sRC maintains the values (0.69–0.73) throughout the year, while the Sb-CO2 exhibits stable but efficiencies (0.57–0.58). The overall system efficiency remains in the range of 0.20–0.22. This is because the solar irradiation was directly taken as the solar input exergy, and thus, the relatively lower values reflect the selected reference basis rather than an actual performance limitation of the integrated system. These results confirm that the integrated system operates in a stable and consistent operation, as reflected by the consistent exergy efficiency profiles throughout the year. A previous study [65] reported that for the s-CO2 at a turbine inlet temperature of 900 °C, the thermal efficiency reached 56.67%, while the exergetic efficiency was 24.92%. In another investigation [66], the thermal efficiency of the s-CO2 was presented as approximately 40%, with an exergetic efficiency of about 61%. In another study [41] focusing on a simple CO2 Brayton cycle integrated with bottoming Rankine cycle, the exergetic efficiency of the Rankine subsystem was reported to be 52%. These findings indicate that the results obtained in the present work are consistent with those reported in the existing literature. The monthly overall net thermal efficiencies of the Sb-CO2-sRC-DS and Sb-CO2-sRC configurations as shown in Figure 9.
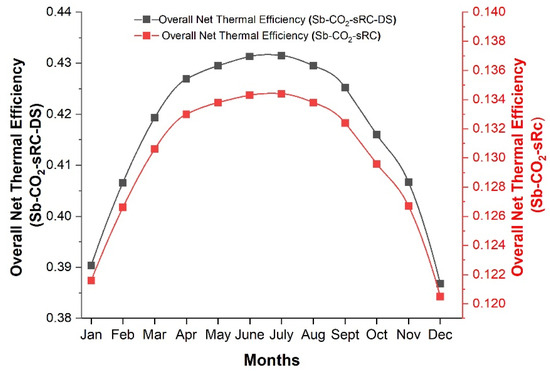
Figure 9.
Monthly overall net thermal efficiencies of the Sb-CO2-sRC-DS configuration and the Sb-CO2-sRC.
The Sb-CO2-sRC-DS configuration achieved its highest monthly overall net thermal efficiency in July (0.43), while the lowest value occurred in December (0.39) during the winter period. Likewise, the Sb-CO2-sRC system recorded a maximum thermal efficiency of 0.13 in July and a minimum of 0.12 in December. The monthly overall net thermal efficiencies indicate that the Sb-CO2-sRC-DS configuration achieves significantly higher values (0.39–0.43) compared to the Sb-CO2-sRC (0.122–0.135). This improvement highlights the positive impact of waste heat utilization through desalination, particularly during the summer months, while maintaining stable performance throughout the year. The monthly variations in net thermal efficiency for the Sb-CO2, the sRC, and the integrated Sb-CO2-sRC-DS system are shown in Figure 10.
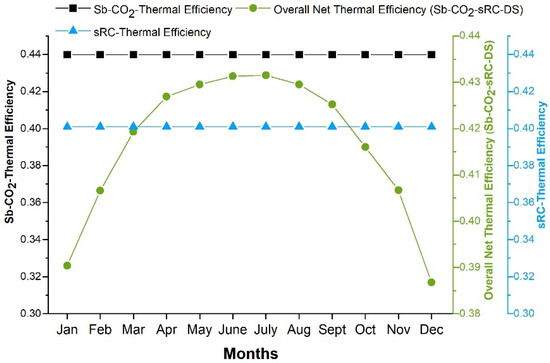
Figure 10.
Monthly net thermal efficiencies of the Sb-CO2, the sRC, and the integrated Sb-CO2-sRC-DS.
The Sb-CO2 and sRC demonstrate consistent thermal efficiencies throughout the year, at approximately 0.44 and 0.40, respectively. It is also observed that the integrated system exhibits more variable efficiency due to the additional energy demand of the desalination unit, which rises during the summer months to the range of 0.386–0.431. Moreover, the inclusion of desalination enhances the multi-product generation capability of the system and enables the effective utilization of waste heat for different purposes. It ultimately strengthens the overall benefits of the integrated configuration. In system design, component-based exergy analysis plays a vital role in identifying improvement potentials, and the input and output exergies, exergy destructions, and efficiencies of each component are presented in Figure 11.
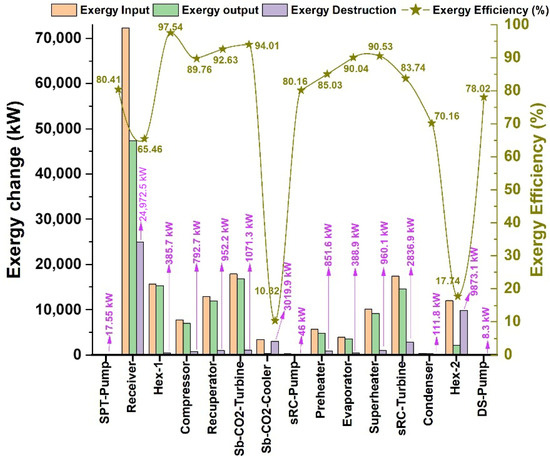
Figure 11.
Exergy inputs, exergy outputs, exergy destructions, and exergy efficiencies of the system components.
The analysis results indicate that the highest exergy destruction occurs in the solar receiver, with approximately 24,971.5 kW of losses and an exergy efficiency of 65.5%. Subsequently, HEX-2 shows nearly 9873.15 kW of exergy destruction with an efficiency of 17.7%, while the Sb-CO2 cooler records 3019.9 kW of destruction and an efficiency of 10.3%. These three components constitute the primary sources of irreversibility in the system. The heat exchangers and turbine in the sRC exhibit relatively high exergy efficiencies in the range of 80–91%, with exergy destruction values of about 388–690 kW for the heat exchangers and approximately 2837 kW for the sRC turbine, indicating moderate irreversibility levels. Pumps and auxiliary units cause only negligible exergy destruction; however, the sRC condenser operates with a relatively low efficiency of 70%, compared to the other components. Finally, improving the high-temperature heat exchangers and the Sb-CO2 cooler is of critical importance for enhancing the overall exergy performance of the system. The overall performance comparison of the proposed SPT multigeneration system is presented, including net power production, freshwater generation, thermal efficiency, and exergy efficiency, as illustrated in Figure 12.
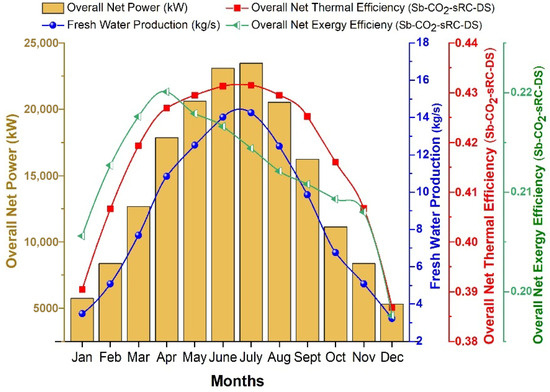
Figure 12.
Monthly overall net power production, freshwater production rate, net thermal efficiency, and net exergy efficiency of the integrated system.
The overall net power production, represented by the yellow bars, starts at 5740.4 kW in January and reaches its maximum of 23,475.1 kW in July. Similarly, the production of freshwater increases from 3.48 kg/s in January to 14.25 kg/s in July due to the increase in solar irradiance. The thermal efficiency follows a similar pattern of variation, attaining its peak value of 0.43 in July. In addition, the exergy efficiency is about 20.1% in January, rises to 22.1% during the summer months, and remains within the range of 20–22% throughout the year, reflecting stable system performance. The relatively low values mainly result from the methodological assumption that solar irradiation is directly treated as the input exergy. Overall, the findings demonstrate that the proposed system maintains reliable and consistent operation while simultaneously producing electricity and fresh water. To highlight the advantages and distinctive performance characteristics of the proposed SPT–Sb-CO2–sRC–DS configuration, a comparative evaluation was conducted with other solar tower-based Brayton systems reported in the literature, and the results are presented in Table 6.
Table 6.
Comparison of the proposed SPT–Sb-CO2–sRC–DS system with other solar tower-based Brayton configurations.
The table summarizes the main performance indicators, including net power output, working fluid type, overall thermal efficiency, exergy efficiency, and CO2 emission reduction potential, and additional outputs, such as freshwater production. As observed, the proposed system achieves comparable or even higher total thermal efficiency (0.39–0.43) compared to conventional s-CO2 or CO2 mixture cycles, while demonstrating a remarkable advantage in terms of multigeneration capability. These results indicate that despite the inclusion of multiple production processes, there is no significant loss in energy or exergy efficiency, confirming that the system maintains thermodynamically balanced and sustainable operation. Furthermore, the subcritical-CO2 Brayton cycle employed in the proposed configuration operates within relatively lower pressure ranges (5–40 bar), which contributes to improved system reliability and operational safety. In addition, the reduced mechanical and thermal stresses on the equipment lead to lower material and maintenance requirements, thereby enhancing the overall economic feasibility compared to supercritical CO2-based systems. These findings validate the potential of the proposed configuration to enhance energy utilization and environmental sustainability under Mediterranean climatic conditions. The thermodynamic state points of the working fluids employed in the integrated power system are summarized in Table 7.
Table 7.
Thermodynamic state points of the working fluids used in the integrated power system.
The thermodynamic state points of the working fluids in the integrated power system include the operating conditions adopted for the analyses, with a turbine inlet temperature of 1100 °C and pressure of 10 bar for the Sb-CO2 Brayton cycle and a turbine inlet temperature of 790 °C and pressure of 200 bar for the sRC. The thermodynamic state points (1–30) of the integrated Sb-CO2 multigeneration system, including pressure, temperature, enthalpy, entropy, and specific exergy values, were obtained through simulations carried out in Ebsilon® Professional software. It was observed that the Sb-CO2 achieves specific exergy levels of up to 862 kJ/kg, which remain comparatively lower but consistent throughout the operation. In contrast, the sRC provides the dominant exergy input, starting from nearly 20.2 kJ/kg at the pump outlet and rising to about 1923.5 kJ/kg at the turbine inlet. These findings highlight the sRC’s capability to supply high-grade energy to the system, while the Sb-CO2 contributes by delivering a stable baseline output that enhances operational flexibility. Overall, these state points establish the thermodynamic groundwork required for detailed energy and exergy analyses of individual components. The total monthly variation of CO2 emission reduction and the corresponding fuel mass demand for system operation, calculated from a full-year Ebsilon® Professional software simulation under Mediterranean climatic conditions, is presented in Figure 13.
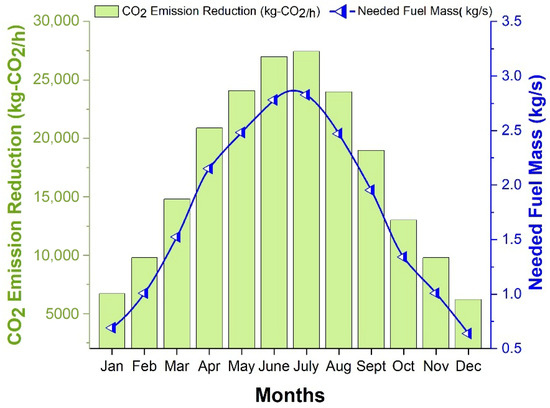
Figure 13.
Monthly variation of CO2 emission reduction and the corresponding required fuel mass for system operations.
Renewable and sustainable energy technologies such as the proposed multigeneration configuration play a crucial role in mitigating greenhouse gas emissions and reducing dependence on fossil fuels. By harnessing abundant solar resources, these integrated systems enhance overall energy efficiency while contributing to long-term climate change mitigation. These findings highlight the system’s capability to convert seasonal solar variability into measurable ecological benefits; therefore, this performance evaluation has been a central focus of the present study. The green columns represent the monthly CO2 emission reduction rate, while the blue line with triangular markers indicates the required fuel mass (kg/s). CO2 emission reduction increases in parallel with the rise in solar energy availability, reaching a maximum of 27,434.55 kg-CO2/h in July and a minimum of 6206 kg-CO2/h in December. The required fuel mass follows a similar seasonal trend, increasing during summer and declining in winter as solar irradiance decreases. Comparative economic performance indicators of the proposed SPT–Sb-CO2–sRC–DS multigeneration system are summarized, and the overall techno-economic evaluation is presented in Figure 14.
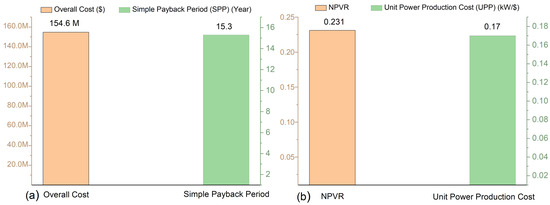
Figure 14.
Comparative economic performance indicators of the proposed SPT–Sb-CO2–sRC–DS multigeneration system. (a) Overall investment cost and simple payback period (SPP). (b) Net present value ratio (NPVR) and unit power production cost (UPP).
According to the techno-economic assessment, the proposed system achieves an overall investment cost of USD 154.6 million, a simple payback period of 15.3 years, a net present value ratio (NPVR) of 0.231 and a unit power production cost (UPP) of 0.17 USD/kW. These results clearly confirm the economic and operational feasibility of the configuration under Mediterranean climatic conditions. A distinctive feature of the proposed plant is its exclusive reliance on solar energy as the primary and sole driving source, with no auxiliary fuel consumption or external heating input required during operation. While this renewable-only strategy naturally leads to a slightly longer payback period compared with hybrid or fossil-assisted systems, it substantially enhances the system’s environmental sustainability and eliminates both fuel costs and carbon emissions. Furthermore, the integration of a subcritical-CO2 Brayton cycle with a bottoming sRC subsystem ensures efficient recovery and utilization of available thermal energy, contributing to stable performance and reduced exergy losses. Overall, the results validate that the proposed configuration provides a cost-effective, fuel-independent, and environmentally benign solution for large-scale power and freshwater generation, making it a highly promising candidate for future solar-driven multigeneration applications in regions with abundant direct normal irradiance.
4. Conclusions
In this study, an integrated multigeneration configuration comprising a SPT-assisted Sb-CO2, a bottoming sRC, and DS unit was assessed for the Mediterranean region on a monthly basis using energy and exergy methodologies. The main findings of this comprehensive study could be summarized as follows:
- The integrated system delivered electricity and freshwater concurrently throughout the year. Total net power increased from 5.74 MW in January to 23.48 MW in July, while the freshwater production rate rose from 3.48 kg/s to 14.25 kg/s. The monthly net thermal efficiency of the integrated configuration (Sb-CO2-sRC-DS) ranged from 0.39 to 0.43. At the subcycle level, the Sb-CO2 and sRC maintained thermal efficiencies of approximately 0.12 and 0.13, respectively.
- A component-based analysis indicates that the largest irreversibilities occur in the solar receiver (24.97 MW exergy destruction; = 65.46%) and the Sb-CO2 cooler (3.02 MW; = 10.3%). In contrast, the Rankine-side heat exchangers and the turbine achieve higher exergetic efficiencies (83.74–90.53%), reflecting comparatively lower exergy destruction. Consequently, the receiver, HEX-2, and the Sb-CO2 cooler are identified as the primary targets for performance improvement.
- In the Sb-CO2, thermal efficiency improves with higher turbine inlet temperature but is highly sensitive to pressure (10 bar and 1100 °C optimum); beyond 10 bar, further pressurization causes efficiency losses due to increased compressor work. By contrast, in the sRC, efficiency increases steadily with rising pressure (200 bar and 790 °C optimum).
- The analysis confirms that higher solar availability directly enhances the system’s capacity for CO2 mitigation, enabling a seasonal reduction of up to 27,434.55 kg-CO2/h, which underscores the significant environmental benefit of the proposed configuration.
- In addition, the conducted economic evaluation clearly demonstrates the investment feasibility of the proposed system. The analysis revealed that the total investment cost of the configuration is approximately 154.6 million USD, while the simple payback period is estimated to be 15.3 years. Although the payback period is slightly longer compared to hybrid or fossil-assisted systems, the complete reliance on solar energy eliminates both fuel costs and carbon emissions, thereby ensuring long-term economic and environmental sustainability. Furthermore, the positive NPVR value indicates that the system is economically profitable and investment-worthy. These findings confirm that the proposed SPT–Sb-CO2–sRC–DS integrated system offers not only strong energy and exergy performance but also a financially viable and sustainable solution for large-scale multigeneration applications.
In general, this study presents an innovative and sustainable energy-oriented approach by proposing a SPT-assisted Sb-CO2 multigeneration system and demonstrates its significant contributions. The Sb-CO2–sRC–DS integration was analyzed under Mediterranean climate conditions on a monthly basis. Overall, the configuration delivers high summer performance, maintains stable exergy efficiencies throughout the year, and enables efficient freshwater production from recovered waste heat, offering a scalable and sustainable solution for integrated energy water cogeneration. The outcome of this study will guide future researchers and industry experts to develop various scales of the plants on the SPT-integrated Sb-CO2–sRC–DS multigeneration system in the Mediterranean region. As a suggestion, during the winter months, the reduction in solar irradiance leads to a decrease in the thermal energy absorbed by the system, which consequently results in lower overall performance. To mitigate this limitation, the integration of an external hybrid energy support can be technically recommended. A natural gas-fired heater, biomass boiler, or TES (thermal energy storage) unit can be incorporated into the SPT–Sb–CO2-sRC configuration to operate during periods of low solar availability. Among these options, molten salt-based thermal storage and biomass-assisted supplementary heating units are particularly suitable, as they can provide a stable thermal supply while maintaining the renewable nature and operational stability of the system.
Author Contributions
Conceptualization, İ.Ü., C.K. and Ö.K.; Methodology, C.K. and Ö.K.; Software, Ö.K.; Validation, İ.Ü., C.K. and Ö.K.; Formal analysis, İ.Ü. and Ö.K.; Investigation, İ.Ü., C.K. and Ö.K.; Resources, İ.Ü.; Data curation, İ.Ü. and Ö.K.; Writing—original draft, İ.Ü.; Writing—review & editing, İ.Ü. and Ö.K.; Visualization, İ.Ü.; Supervision, C.K. and Ö.K.; Project administration, İ.Ü. and C.K.; Funding acquisition, İ.Ü. All authors have read and agreed to the published version of the manuscript.
Funding
This research received no external funding.
Institutional Review Board Statement
Not applicable.
Informed Consent Statement
Not applicable.
Data Availability Statement
The original contributions presented in this study are included in the article. Further inquiries can be directed to the corresponding author.
Conflicts of Interest
The authors declare no conflict of interest.
Nomenclature
| area () | Subscripts | ||
| direct normal radiation (W/m2) | condenser | ||
| exergy flow () | critic | ||
| specific exergy () | cooling water | ||
| heat loss factor | destruction | ||
| enthalpy (kJ/kg) | det | deterioration | |
| HeX | heat exchanger | p | evaporator |
| mass flow rate () | inlet | ||
| RC | Rankine cycle | isen | isentropic |
| P | pressure () | opt | optical |
| heat flow () | outlet | ||
| s-CO2 | supercritical CO2 Brayton cycle | regen | regenerator |
| molar universal gas constant | ph | physical | |
| entropy (); saturation | preheater | ||
| Sb-CO2 | subcritical-CO2 Brayton cycle | rec | receiver |
| temperature () | recev | solar receiver | |
| atmosphere temperature () | heat transfer surface | ||
| TIC | total investment cost | superheater | |
| heat transfer coefficient () | Ts | thermal storage | |
| V | volume (m3) | turbine | |
| power () | Ap | aperture | |
| HTF | heat transfer fluid | br | brine |
| SPT | solar power tower | fr | freshwater |
| GT | gas turbine | Tsun | Sun apparent temperature |
| f | fuel | ||
| req | required | ||
| mw | molecular weight | ||
| dec | decreased | ||
| Greek letters | |||
| energy efficiency () | |||
| effectiveness () |
References
- Santhosh, M.; Venkaiah, C.; Kumar, D.M.V. Current advances and approaches in wind speed and wind power forecasting for improved renewable energy integration: A review. Eng. Rep. 2020, 2, e12178. [Google Scholar] [CrossRef]
- Kaushik, S.; Reddy, V.S.; Tyagi, S. Energy and exergy analyses of thermal power plants: A review. Renew. Sustain. Energy Rev. 2011, 15, 1857–1872. [Google Scholar] [CrossRef]
- Zhang, J.; Wang, J.; Liu, W.; Hu, B.; Lou, J.; Zhao, P. Multi-objective optimization design of a solar-powered integrated multi-generation system based on combined SCO2 Brayton cycle and ORC using machine learning approach. Appl. Therm. Eng. 2024, 252, 123684. [Google Scholar] [CrossRef]
- Singh, U.P.; Chandra, S. Optimal cleaning schedule in solar PV using the biography-based helianthus optimization enabled coupled deep network. Sol. Energy 2023, 266, 112138. [Google Scholar] [CrossRef]
- González-Barredo, S.; Reyes-Belmonte, M.Á. Renewable Energy Curtailment Storage in Molten Salt and Solid Particle Solar Thermal Power Plants: A Comparative Analysis in Spain. Appl. Sci. 2025, 15, 6162. [Google Scholar] [CrossRef]
- Linares, J.I.; Martín-Colino, A.; Arenas, E.; Montes, M.J.; Cantizano, A.; Pérez-Domínguez, J.R. A Novel Hybrid CSP-PV Power Plant Based on Brayton Supercritical CO2 Thermal Machines. Appl. Sci. 2023, 13, 9532. [Google Scholar] [CrossRef]
- Zhang, X.; Ge, Y. Power Generation with Renewable Energy and Advanced Supercritical CO2 Thermodynamic Power Cycles: A Review. Energies 2023, 16, 7781. [Google Scholar] [CrossRef]
- Praveenkumar, S.; Agyekum, E.B.; Kumar, A.; Ampah, J.D.; Afrane, S.; Amjad, F.; Velkin, V.I. Techno-Economics and the Identification of Environmental Barriers to the Development of Concentrated Solar Thermal Power Plants in India. Appl. Sci. 2022, 12, 10400. [Google Scholar] [CrossRef]
- Li, Q.; Erqi, E.; Qiu, Y.; Wang, J.; Zhang, Y. Conceptual design of novel He-SCO2 Brayton cycles for ultra-high-temperature concentrating solar power. Energy Convers. Manag. 2022, 260. [Google Scholar] [CrossRef]
- Deng, Q.; Liu, A.; Li, J.; Feng, Z. A review on supercritical CO2 and CO2-based mixture in power cycle. Energy Convers. Manag. 2025, 324, 119295. [Google Scholar] [CrossRef]
- Awan, A.B.; Mouli, K.V.C.; Zubair, M. Performance enhancement of solar tower power plant: A multi-objective optimization approach. Energy Convers. Manag. 2020, 225, 113378. [Google Scholar] [CrossRef]
- Cagnoli, M.; de la Calle, A.; Pye, J.; Savoldi, L.; Zanino, R. A CFD-supported dynamic system-level model of a sodium-cooled billboard-type receiver for central tower CSP applications. Sol. Energy 2019, 177, 576–594. [Google Scholar] [CrossRef]
- Yang, Y.; Ma, L.; Ma, W.; Yu, Z.; Fu, L.; Li, M.; Mao, D. Life cycle assessment of typical tower solar thermal power station in China. Energy 2024, 309, 133154. [Google Scholar] [CrossRef]
- Russo, V.; Napoli, G.; Rovense, F.; Di Ascenzi, P.; Giorgi, G.; Mongibello, L.; Cancro, C.; Ciniglio, G.; Gaggioli, W. Investigations on Solidification and Melting Processes of the Solar Salt Mixture in Evacuated and Non-Evacuated Receiver Tubes. Energies 2025, 18, 4492. [Google Scholar] [CrossRef]
- Xia, G.; Egerer, U.; Letizia, S.; Debnath, M.; Jager, D.; Dana, S.; Yellapantula, S. Characterization of wind conditions and impact on wind loading at an operational parabolic trough concentrating solar power plant using LiDAR observations. Sol. Energy 2025, 300, 113844. [Google Scholar] [CrossRef]
- Brano, V.L.; Guarino, S.; Buscemi, A.; Bonomolo, M. Development of Neural Network Prediction Models for the Energy Producibility of a Parabolic Dish: A Comparison with the Analytical Approach. Energies 2022, 15, 9298. [Google Scholar] [CrossRef]
- Parveh, A.; Baneshi, M. Transient Modelling and Economic Viability of Parabolic Dish Concentrating Photovoltaic-Thermal (PD-CPVT) Systems Across Diverse Climatic Zones. Case Stud. Therm. Eng. 2025, 74, 106949. [Google Scholar] [CrossRef]
- Wang, G.; Zhang, S.; Zou, T. Design and comparison study of a novel linear Fresnel reflector solar ORC-driven hydrogen production system using different working fluids. Case Stud. Therm. Eng. 2025, 71, 106187. [Google Scholar] [CrossRef]
- Ellingwood, K.; Safdarnejad, S.M.; Rashid, K.; Powell, K. Leveraging Energy Storage in a Solar-Tower and Combined Cycle Hybrid Power Plant. Energies 2019, 12, 40. [Google Scholar] [CrossRef]
- Yang, J.; Yang, Z.; Duan, Y. Off-design performance of a supercritical CO2 Brayton cycle integrated with a solar power tower system. Energy 2020, 201, 117676. [Google Scholar] [CrossRef]
- Liang, Y.; Lin, X.; Su, W.; Xing, L.; Zhou, N. Thermal-economic analysis of a novel solar power tower system with CO2-based mixtures at typical days of four seasons. Energy 2023, 276, 127602. [Google Scholar] [CrossRef]
- Mohan, G.; Venkataraman, M.B.; Coventry, J. Sensible energy storage options for concentrating solar power plants operating above 600 °C. Renew. Sustain. Energy Rev. 2019, 107, 319–337. [Google Scholar] [CrossRef]
- Ahmad, F.; Mahatab, F.; Mahmud, S.; Ehsan, M.M. Comprehensive Analysis of a Hybrid Solar Assisted Supercritical CO2 Reheat Recompression Brayton Cycle for Enhanced Performance. Int. J. Thermofluids 2024, 24, 100926. [Google Scholar] [CrossRef]
- Nedaei, N.; Azizi, S.; Farshi, L.G. Performance assessment and multi-objective optimization of a multi-generation system based on solar tower power: A case study in Dubai, UAE. Process. Saf. Environ. Prot. 2022, 161, 295–315. [Google Scholar] [CrossRef]
- Yang, Y.; Shi, L.; Yao, Y.; Zhang, Y.; He, J.; Tian, H.; Pei, G.; Shu, G. Supercritical CO2 Brayton cycle for space exploration: New perspectives base on power density analysis. Energy 2024, 313, 133772. [Google Scholar] [CrossRef]
- Bai, W.; Li, H.; Zhang, X.; Qiao, Y.; Zhang, C.; Gao, W.; Yao, M. Thermodynamic analysis of CO2–SF6 mixture working fluid supercritical Brayton cycle used for solar power plants. Energy 2022, 261, 124780. [Google Scholar] [CrossRef]
- Moreno-Gamboa, F.; Nieto-Londoño, C.; Sanin-Villa, D. Thermoeconomic analysis for hybrid solar Brayton cycles operating with different working fluids. Int. J. Thermofluids 2024, 22, 100693. [Google Scholar] [CrossRef]
- Khan, Y.; Apparao, D.; Gawande, S.; Singh, N.; Bisht, Y.S.; Singh, P. Performance assessment and working fluid selection of the novel combined helium Brayton cycle and organic rankine cycle based on solar power tower for sustainable generation. Iran. J. Sci. Technol. Trans. Mech. Eng. 2024, 48, 1901–1916. [Google Scholar] [CrossRef]
- Wang, J.; Wang, J.; Lund, P.D.; Zhu, H. Thermal Performance Analysis of a Direct-Heated Recompression Supercritical Carbon Dioxide Brayton Cycle Using Solar Concentrators. Energies 2019, 12, 4358. [Google Scholar] [CrossRef]
- Kowalski, R.; Kuczyński, S.; Łaciak, M.; Szurlej, A.; Włodek, T. A Case Study of the Supercritical CO2-Brayton Cycle at a Natural Gas Compression Station. Energies 2020, 13, 2447. [Google Scholar] [CrossRef]
- Sánchez, D.; Patiño, J.; Sanz-Kock, C.; Llopis, R.; Cabello, R.; Torrella, E. Energetic evaluation of a CO2 refrigeration plant working in supercritical and subcritical conditions. Appl. Therm. Eng. 2014, 66, 227–238. [Google Scholar] [CrossRef]
- Lei, X.; Peng, R.; Guo, Z.; Li, H.; Ali, K.; Zhou, X. Experimental comparison of the heat transfer of carbon dioxide under subcritical and supercritical pressures. Int. J. Heat Mass Transf. 2020, 152, 119562. [Google Scholar] [CrossRef]
- Santos, M.; Miguel-Barbero, C.; Merchán, R.; Medina, A.; Hernández, A.C. Roads to improve the performance of hybrid thermosolar gas turbine power plants: Working fluids and multi-stage configurations. Energy Convers. Manag. 2018, 165, 578–592. [Google Scholar] [CrossRef]
- Dincer, I.; Bicer, Y. Integrated Energy Systems for Multigeneration; Elsevier: Amsterdam, The Netherlands, 2019. [Google Scholar]
- Ustun, I.; Karakus, C.; Yagli, H. Empirical models for estimating the daily and monthly global solar radiation for Mediterranean and Central Anatolia region of Turkey. Int. J. Glob. Warm. 2020, 20, 249. [Google Scholar] [CrossRef][Green Version]
- Üstün, I.; Üneş, F.; Mert, I.; Karakuş, C. A comparative study of estimating solar radiation using machine learning approaches: DL, SMGRT, and ANFIS. Energy Sources Part A Recover. Util. Environ. Eff. 2022, 44, 10322–10345. [Google Scholar] [CrossRef]
- Yağlı, H.; Karakuş, C.; Koç, Y.; Çevik, M.; Uğurlu, R.; Koç, A. Designing and exergetic analysis of a solar power tower system for Iskenderun region. Int. J. Exergy 2019, 28, 96–112. [Google Scholar] [CrossRef]
- Köse, Ö.; Koç, Y.; Yağlı, H. Energy, exergy, economy and environmental (4E) analysis and optimization of single, dual and triple configurations of the power systems: Rankine Cycle/Kalina Cycle, driven by a gas turbine. Energy Convers. Manag. 2021, 227, 113604. [Google Scholar] [CrossRef]
- Köse, Ö. Solar energy storage assisted green hydrogen production: A thermo-economic assessment. Int. J. Hydrogen Energy 2025, 170, 151192. [Google Scholar] [CrossRef]
- Dincer, I. Thermodynamics: A Smart Approach; John Wiley & Sons: Hoboken, NJ, USA, 2020. [Google Scholar]
- Yilmaz, F. Thermodynamic performance evaluation of a novel solar energy based multigeneration system. Appl. Therm. Eng. 2018, 143, 429–437. [Google Scholar] [CrossRef]
- Khatoon, S.; Kim, M.H. Performance analysis of carbon dioxide based combined power cycle for concentrating solar power. Energy Convers. Manag. 2020, 205, 112416. [Google Scholar] [CrossRef]
- Yağli, H. Examining the receiver heat loss, parametric optimization and exergy analysis of a solar power tower (SPT) system. Energy Sources Part A Recover. Util. Environ. Eff. 2020, 42, 2155–2180. [Google Scholar] [CrossRef]
- Cengel, Y.A.; Boles, M.A. Thermodynamics: An engineering approach. Sea 2002, 1000, 287–293. [Google Scholar]
- Cao, Y.; Habibi, H.; Zoghi, M.; Raise, A. Waste heat recovery of a combined regenerative gas turbine—Recompression supercritical CO2 Brayton cycle driven by a hybrid solar-biomass heat source for multi-generation purpose: 4E analysis and parametric study. Energy 2021, 236, 121432. [Google Scholar] [CrossRef]
- Zoghi, M.; Habibi, H.; Choubari, A.Y.; Ehyaei, M. Exergoeconomic and environmental analyses of a novel multi-generation system including five subsystems for efficient waste heat recovery of a regenerative gas turbine cycle with hybridization of solar power tower and biomass gasifier. Energy Convers. Manag. 2021, 228, 113702. [Google Scholar] [CrossRef]
- Temiz, M.; Dincer, I. Design and analysis of a concentrated solar power-based system with hydrogen production for a resilient community. Energy 2024, 307, 132628. [Google Scholar] [CrossRef]
- Ma, N.; Meng, F.; Hong, W.; Li, H.; Niu, X. Thermodynamic assessment of the dry-cooling supercritical Brayton cycle in a direct-heated solar power tower plant enabled by CO2-propane mixture. Renew. Energy 2023, 203, 649–663. [Google Scholar] [CrossRef]
- Yuksel, Y.E.; Ozturk, M.; Dincer, I. Development of a novel combined energy plant for multigeneration with hydrogen and ammonia production. Int. J. Hydrogen Energy 2021, 46, 28980–28994. [Google Scholar] [CrossRef]
- Koç, Y.; Yağlı, H.; Görgülü, A.; Koç, A. Analysing the performance, fuel cost and emission parameters of the 50 MW simple and recuperative gas turbine cycles using natural gas and hydrogen as fuel. Int. J. Hydrogen Energy 2020, 45, 22138–22147. [Google Scholar] [CrossRef]
- Ashwni; Sherwani, A.F.; Tiwari, D. Exergy, economic and environmental analysis of organic Rankine cycle based vapor compression refrigeration system. Int. J. Refrig. 2021, 126, 259–271. [Google Scholar] [CrossRef]
- Wang, X.; Dai, Y. Exergoeconomic analysis of utilizing the transcritical CO2 cycle and the ORC for a recompression supercritical CO2 cycle waste heat recovery: A comparative study. Appl. Energy 2016, 170, 193–207. [Google Scholar] [CrossRef]
- Mamaghani, A.H.; Najafi, B.; Shirazi, A.; Rinaldi, F. 4E analysis and multi-objective optimization of an integrated MCFC (molten carbonate fuel cell) and ORC (organic Rankine cycle) system. Energy 2015, 82, 650–663. [Google Scholar] [CrossRef]
- Jamil, M.A.; Shahzad, M.W.; Zubair, S.M. A comprehensive framework for thermoeconomic analysis of desalination systems. Energy Convers. Manag. 2020, 222, 113188. [Google Scholar] [CrossRef] [PubMed]
- Colakoglu, M.; Durmayaz, A. Energy, exergy, economic and emission saving analysis and multiobjective optimization of a new multi-generation system based on a solar tower with triple combined power cycle. Sustain. Energy Technol. Assess. 2022, 52, 102289. [Google Scholar] [CrossRef]
- Özahi, E.; Tozlu, A.; Abuşoğlu, A. Thermoeconomic multi-objective optimization of an organic Rankine cycle (ORC) adapted to an existing solid waste power plant. Energy Convers. Manag. 2018, 168, 308–319. [Google Scholar] [CrossRef]
- Tiwari, D.; Sherwani, A.F.; Kumar, N. Optimization and thermo-economic performance analysis of organic Rankine cycles using mixture working fluids driven by solar energy. Energy Sources Part A Recover. Util. Environ. Eff. 2019, 41, 1890–1907. [Google Scholar] [CrossRef]
- Behar, O.; Sbarbaro, D.; Morán, L. A Practical Methodology for the Design and Cost Estimation of Solar Tower Power Plants. Sustainability 2020, 12, 8708. [Google Scholar] [CrossRef]
- Nondy, J.; Gogoi, T.K. Performance comparison of multi-objective evolutionary algorithms for exergetic and exergoenvironomic optimization of a benchmark combined heat and power system. Energy 2021, 233, 121135. [Google Scholar] [CrossRef]
- Baydar, C.; Koç, Y.; Yağlı, H.; Koç, A.; Depci, T.; Aygün, M.K. Experimental detection of inadequacies and improvements for a geothermal power plant using single shaft double turbine binary Organic Rankine cycle as power system. Energy 2023, 283, 128370. [Google Scholar] [CrossRef]
- Lu, X.; Du, B.; Zhu, W.; Yang, Y.; Xie, C.; Tu, Z.; Zhao, B.; Zhang, L.; Wang, J.; Yang, Z. Multi-criteria assessment of an auxiliary energy system for desalination plant based on PEMFC-ORC combined heat and power. Energy 2024, 290, 130163. [Google Scholar] [CrossRef]
- Goyal, N.; Aggarwal, A.; Kumar, A. Financial feasibility of concentrated solar power with and without sensible heat storage in hot and dry Indian climate. J. Energy Storage 2022, 52, 105002. [Google Scholar] [CrossRef]
- Federal Reserve Bank of St. Louis (FRED). Average Price: Electricity per Kilowatt-Hour in U.S. City Average (APU000072610). Available online: https://fred.stlouisfed.org/series/APU000072610 (accessed on 19 October 2025).
- Di Marcoberardino, G.; Morosini, E.; Manzolini, G. Preliminary investigation of the influence of equations of state on the performance of CO2 + C6F6 as innovative working fluid in transcritical cycles. Energy 2022, 238, 121815. [Google Scholar] [CrossRef]
- Córdoba, J.; Valencia, G.; Molina, B. Energy, Exergy, and Exergo-Sustainability Analysis of a Brayton S-CO2/Kalina Operating in Araçuaí, Brazil, Using Solar Energy as a Thermal Source. Resources 2025, 14, 31. [Google Scholar] [CrossRef]
- Wang, C.; Zhu, M.; Li, Z.; Xu, H.; Zheng, K.; Han, M.; Ni, M. Performance analysis and optimization of a zero-emission solar-driven hydrogen production system based on solar power tower plant and protonic ceramic electrolysis cells. Int. J. Hydrogen Energy 2024, 83, 1415–1428. [Google Scholar] [CrossRef]
- Siddiqui, M.A.; Alsaduni, I. Performance assessment of solar tower collector based integrated system for the cogeneration of power and cooling. Heliyon 2024, 10, e39993. [Google Scholar] [CrossRef] [PubMed]
- Battisti, F.G.; Klein, C.F.; Escobar, R.A.; Cardemil, J.M. Exergy Analysis and Off-Design Modeling of a Solar-Driven Supercritical CO2 Recompression Brayton Cycle. Energies 2023, 16, 4755. [Google Scholar] [CrossRef]
Disclaimer/Publisher’s Note: The statements, opinions and data contained in all publications are solely those of the individual author(s) and contributor(s) and not of MDPI and/or the editor(s). MDPI and/or the editor(s) disclaim responsibility for any injury to people or property resulting from any ideas, methods, instructions or products referred to in the content. |
© 2025 by the authors. Licensee MDPI, Basel, Switzerland. This article is an open access article distributed under the terms and conditions of the Creative Commons Attribution (CC BY) license (https://creativecommons.org/licenses/by/4.0/).