Article

Spatial-Temporal Evolution and Driving Force Analysis of Wetland Landscape Pattern in Northern Guangxi

College of Earth Sciences, Guilin University of Technology, Guilin 541000, China
*
Author to whom correspondence should be addressed.
Appl. Sci. 2025, 15(21), 11485; https://doi.org/10.3390/app152111485
Submission received: 21 September 2025 / Revised: 21 October 2025 / Accepted: 22 October 2025 / Published: 27 October 2025
(This article belongs to the Special Issue Effects of Climate Change on Hydrology)

Abstract

The karst ecologically fragile region of northern Guangxi faces dual pressures from wetland shrinkage and landscape functional degradation driven by rapid urbanisation. The mechanisms governing its multi-scale landscape pattern evolution and the dominance of disturbances require urgent clarification. This study integrates land use data from 1980 to 2020, employing ArcGIS 10.8 analysis, Fragstats landscape indices, and optimal parameter geographic detectors to construct a ‘pattern-process-driver’ interpretative framework in northern Guangxi. It quantitatively reveals the evolution characteristics and driving mechanisms of wetland landscape patterns in northern Guangxi, thereby optimising wetland ecological conservation pathways. Results indicate the following: (1) Between 1980 and 2020, total wetland area decreased by 65.58 km2, exhibiting a ‘structural substitution’ trend characterised by natural wetland decline and artificial wetland expansion. (2) Wetland landscape patterns exhibited intensified fragmentation and increased structural complexity. (3) Wetland evolution was primarily driven by annual mean temperature, GDP, and annual mean precipitation, reflecting a composite mechanism characterised by climate dominance, economic pressure, and policy failure. Specifically, the increase in temperature is the main reason for the decrease in natural wetlands, while economic growth dominates the expansion of artificial wetlands. This study provides scientific basis for karst wetland ecological restoration and differentiated territorial spatial planning, offering reference for ecological and environmental governance in karst watersheds.

1. Introduction

Wetlands, often referred to as the ‘kidneys of the Earth’, serve as vital transitional zones between terrestrial and aquatic ecosystems. They rank among the world’s most biodiverse ecosystems, with their landscape evolution directly influencing core ecological services such as carbon sequestration, hydrological regulation, and habitat quality for wildlife [1]. Particularly in karst regions, wetland systems are more susceptible to human disturbance due to the unique characteristics of karst hydrology [2]. Over the past four decades, the combined effects of global climate change and human disturbance have led to a sharp decline in natural wetland areas [3] and the continuous expansion of artificial wetlands. This ‘hidden ecological loss’ has prompted significant academic concern regarding issues such as wetland landscape fragmentation and reduced connectivity [4].
Landscape patterns constitute the core concept of landscape ecology [5], representing the spatial arrangement of diverse landscape elements and their heterogeneous characteristics. Essentially, they embody the spatial manifestation of the integrated effects of multi-scale ecological processes, revealing the fundamental basis of pattern-process feedback mechanisms [6]. This framework provides a systematic interpretation of the ecological mechanisms underlying dynamic landscape evolution. Landscape patterns are intrinsically linked to and mutually influence ecological processes, with both collectively determining the health of wetland ecosystems. Consequently, wetland conservation and restoration centred on landscape pattern optimisation and regulation has emerged as a current research priority, aligning with the national wetland conservation framework [7].
Recent research into driving mechanisms has progressively shifted from single-factor analysis towards exploring multi-scale interactions [8]. However, the coupling mechanisms between ‘pattern-process-drivers’ in karst landscape wetlands remain unclear, particularly regarding the quantification and verification of nonlinear interactions and the spatial differentiation effects of policy regulation. Traditional driver analyses predominantly rely on linear models [9], which struggle to capture the complex nonlinear responses of karst systems. Furthermore, research on the interactive effects between natural and anthropogenic factors remains weak, with a particular lack of quantification regarding the coupling mechanisms between policy regulation and climate change [10] presenting a dual limitation.
This study examines wetlands in northern Guangxi, a region characterised by typical karst topography. Integrating five phases of land use data, natural environment data, and socio-economic data spanning 1980–2020, it employs landscape pattern indices to analyse the evolution of landscape configurations within the study area. It quantitatively identifies the nonlinear interaction mechanisms between natural and anthropogenic factors using an optimal parameterised geographic detector. This approach reveals the patterns and mechanisms underlying wetland landscape pattern changes, aiming to provide scientific evidence for regional ecological conservation and management decisions. Consequently, it seeks to advance the sustainable development of ecosystems in similar fragile regions and at the national scale.

2. Materials and Methods

2.1. Study Area

The northern Guangxi region (23°39′ N–26°23′ N, 109°04′ E–112°03′ E) lies at the transition zone between the Nanling Mountains and the Yungui Plateau, forming the core ecological barrier of the upper Pearl River basin (Figure 1). This area exhibits contiguous geography, similar ecological characteristics, and complementary economic functions. As the ecological security core zone of the Pearl River-Xijiang Economic Belt and a China-ASEAN green product supply base, its composite ‘mountain-water-forest-field-city’ ecosystem plays an irreplaceable role in maintaining the water balance of the Pearl River Basin and regulating the regional climate. Consequently, it has been designated as a key ecological functional area under the National Master Plan for the Protection and Restoration of Major Ecosystems (2021–2035). As a region bearing the dual pressures of karst topography and rapid urbanisation, its wetland hydrological processes exhibit distinct peculiarities.

2.2. Data Sources

The data utilised in this study encompass administrative division data, land use data, natural environment data, and socio-economic data and statistical data are listed in Table 1. The land use data were extracted from the multi-period land use/land cover remote sensing monitoring database (resolution of 30 m) developed by the Chinese Academy of Sciences (CAS), and five types of land types, urban land use data and agricultural land data were extracted based on its secondary classification system. The database has been cross-validated by multi-period remote sensing images, and the accuracy is not less than 85%. With reference to relevant research results [11,12], ArcGIS Desktop 10.8 (Esri, Redlands, CA, USA, https://www.esri.com/en-us/arcgis/products/arcgis-desktop/overview (accessed on 20 November 2024)) was used to resample data with a resolution of non-30 m, so that it was consistent with the spatial reference of 30 m land use data, and all raster data were finally converted into the Krasovsky_1940_Albers projection coordinate system.

2.3. Establishing a Wetland Classification System

The scientific construction of wetland classification systems serves as the theoretical foundation for landscape pattern evolution studies, with its classification precision directly determining the ecological explanatory power of the research area. In accordance with wetland classification provisions stipulated in the Ramsar Convention and Chinese national standards (GB/T24708-2009 Wetland Classification Standard [13]), and drawing upon literature [14] alongside field observations within the study area, this research categorises land types into two broad groups: wetland types and non-wetland types (Table 2).

2.4. Research Methodology

2.4.1. Land Use Transfer Matrix

The land use transition matrix serves to reflect the mutual conversion between different land use types within the study area from the initial to the final period [15]. It quantitatively describes the conversion quantities between different land types and reveals the conversion rates of various land use types. Its expression is as follows:
S i j = S 11 S 12 S 1 n S 21 S 22 S 2 n S n 1 S n 2 S n n
In the equation, S denotes area; n represents the number of land use types before and after conversion; i and j (where i, j = 1, 2, …, n), respectively, denote the land type before and after conversion; Sij indicates the area of land type i converted to land use type j prior to conversion.

2.4.2. Landscape Pattern Index

This study, grounded in the heterogeneous characteristics of wetland ecosystems in northern Guangxi and its research objectives, employs a comprehensive analysis integrating key indices selected at both the typological and landscape levels (see Table 3 and Table 4). A multi-scale parameter coupling approach was employed to construct a diagnostic model for wetland landscape evolution, thereby elucidating the reciprocal mechanisms between natural processes and human interventions. This hierarchical quantification strategy captures both the dynamic responses of micro-units and the evolutionary trends of macro-patterns, providing spatial decision-making support for the sustainable management of wetland ecosystems.

2.4.3. Optimal Parameters-Based Geographical Detector (OPGD) Model

Addressing the shortcomings of traditional geographical detectors, which exhibit strong reliance on empirical knowledge and lack quantitative evaluation mechanisms, this study employs the optimal parameters-based geographical detector (OPGD) model. Comprising five parts—factor detector, parameter optimisation, interaction detector, risk detector, and ecological detector [16]—OPGD serves as a vital tool for analysing the spatial differentiation of geographical elements and their driving factors. By calculating and comparing the maximum q-values for each continuous variable under different classification methods and numbers of partitions, the spatial variation of ecosystem services is detected, alongside the explanatory power of various influencing factors on this spatial variation [17].
  • Parameters optimisation
Given that geographical features may exhibit significant variations across different spatial scales, the optimisation of parameters for geographical data constitutes a prerequisite for conducting spatial variation studies. At the optimal spatial scale, it is possible to most effectively reveal the spatial differentiation patterns of geographical elements and the intensity of their driving factors. Based on the study area’s scope and incorporating scholarly research on spatial scale effects, six scales (5 km, 6 km, 7 km, 8 km, 9 km, and 10 km) were established to systematically examine the impact of spatial scale effects on analytical outcomes. Classification methods included equal, natural, quantile, geometric, and sd, with the number of categories set between 4 and 6. The OPGD model in R was employed to calculate the highest q-value for each scale of driving factors across different combinations of classification methods and numbers of categories. The 90th percentile of q-values for the six different scale driving factors was computed, with the spatial scale yielding the highest 90th percentile selected as the optimal spatial scale to mitigate the influence of outliers.
2.
Geographical detector model methods
The factor detector and interaction detector within the OPGD model can be used to jointly analyse driving forces. Factor detector quantifies the intensity of a driving factor’s influence on wetland change, with higher values indicating greater explanatory power. Interaction detector assesses whether dual-factor interactions amplify, attenuate, or independently affect wetland coverage, evaluating the combined explanatory power of two factors on landscape pattern shifts [17].
3.
Driving Factor Selection
From three dimensions—natural factors, human factors, and policy factors—appropriate driving factors for the study area were selected to analyse their correlation with wetland dynamics in northern Guangxi. Wetland area change served as the dependent variable, while the independent variables comprised average annual temperature, average annual precipitation, normalised difference vegetation index, population, gross domestic product, change rate of urban land, change rate of agricultural land, and proportion of nature reserves (see Table 5).

3. Results

3.1. Analysis of Wetland Landscape Structure

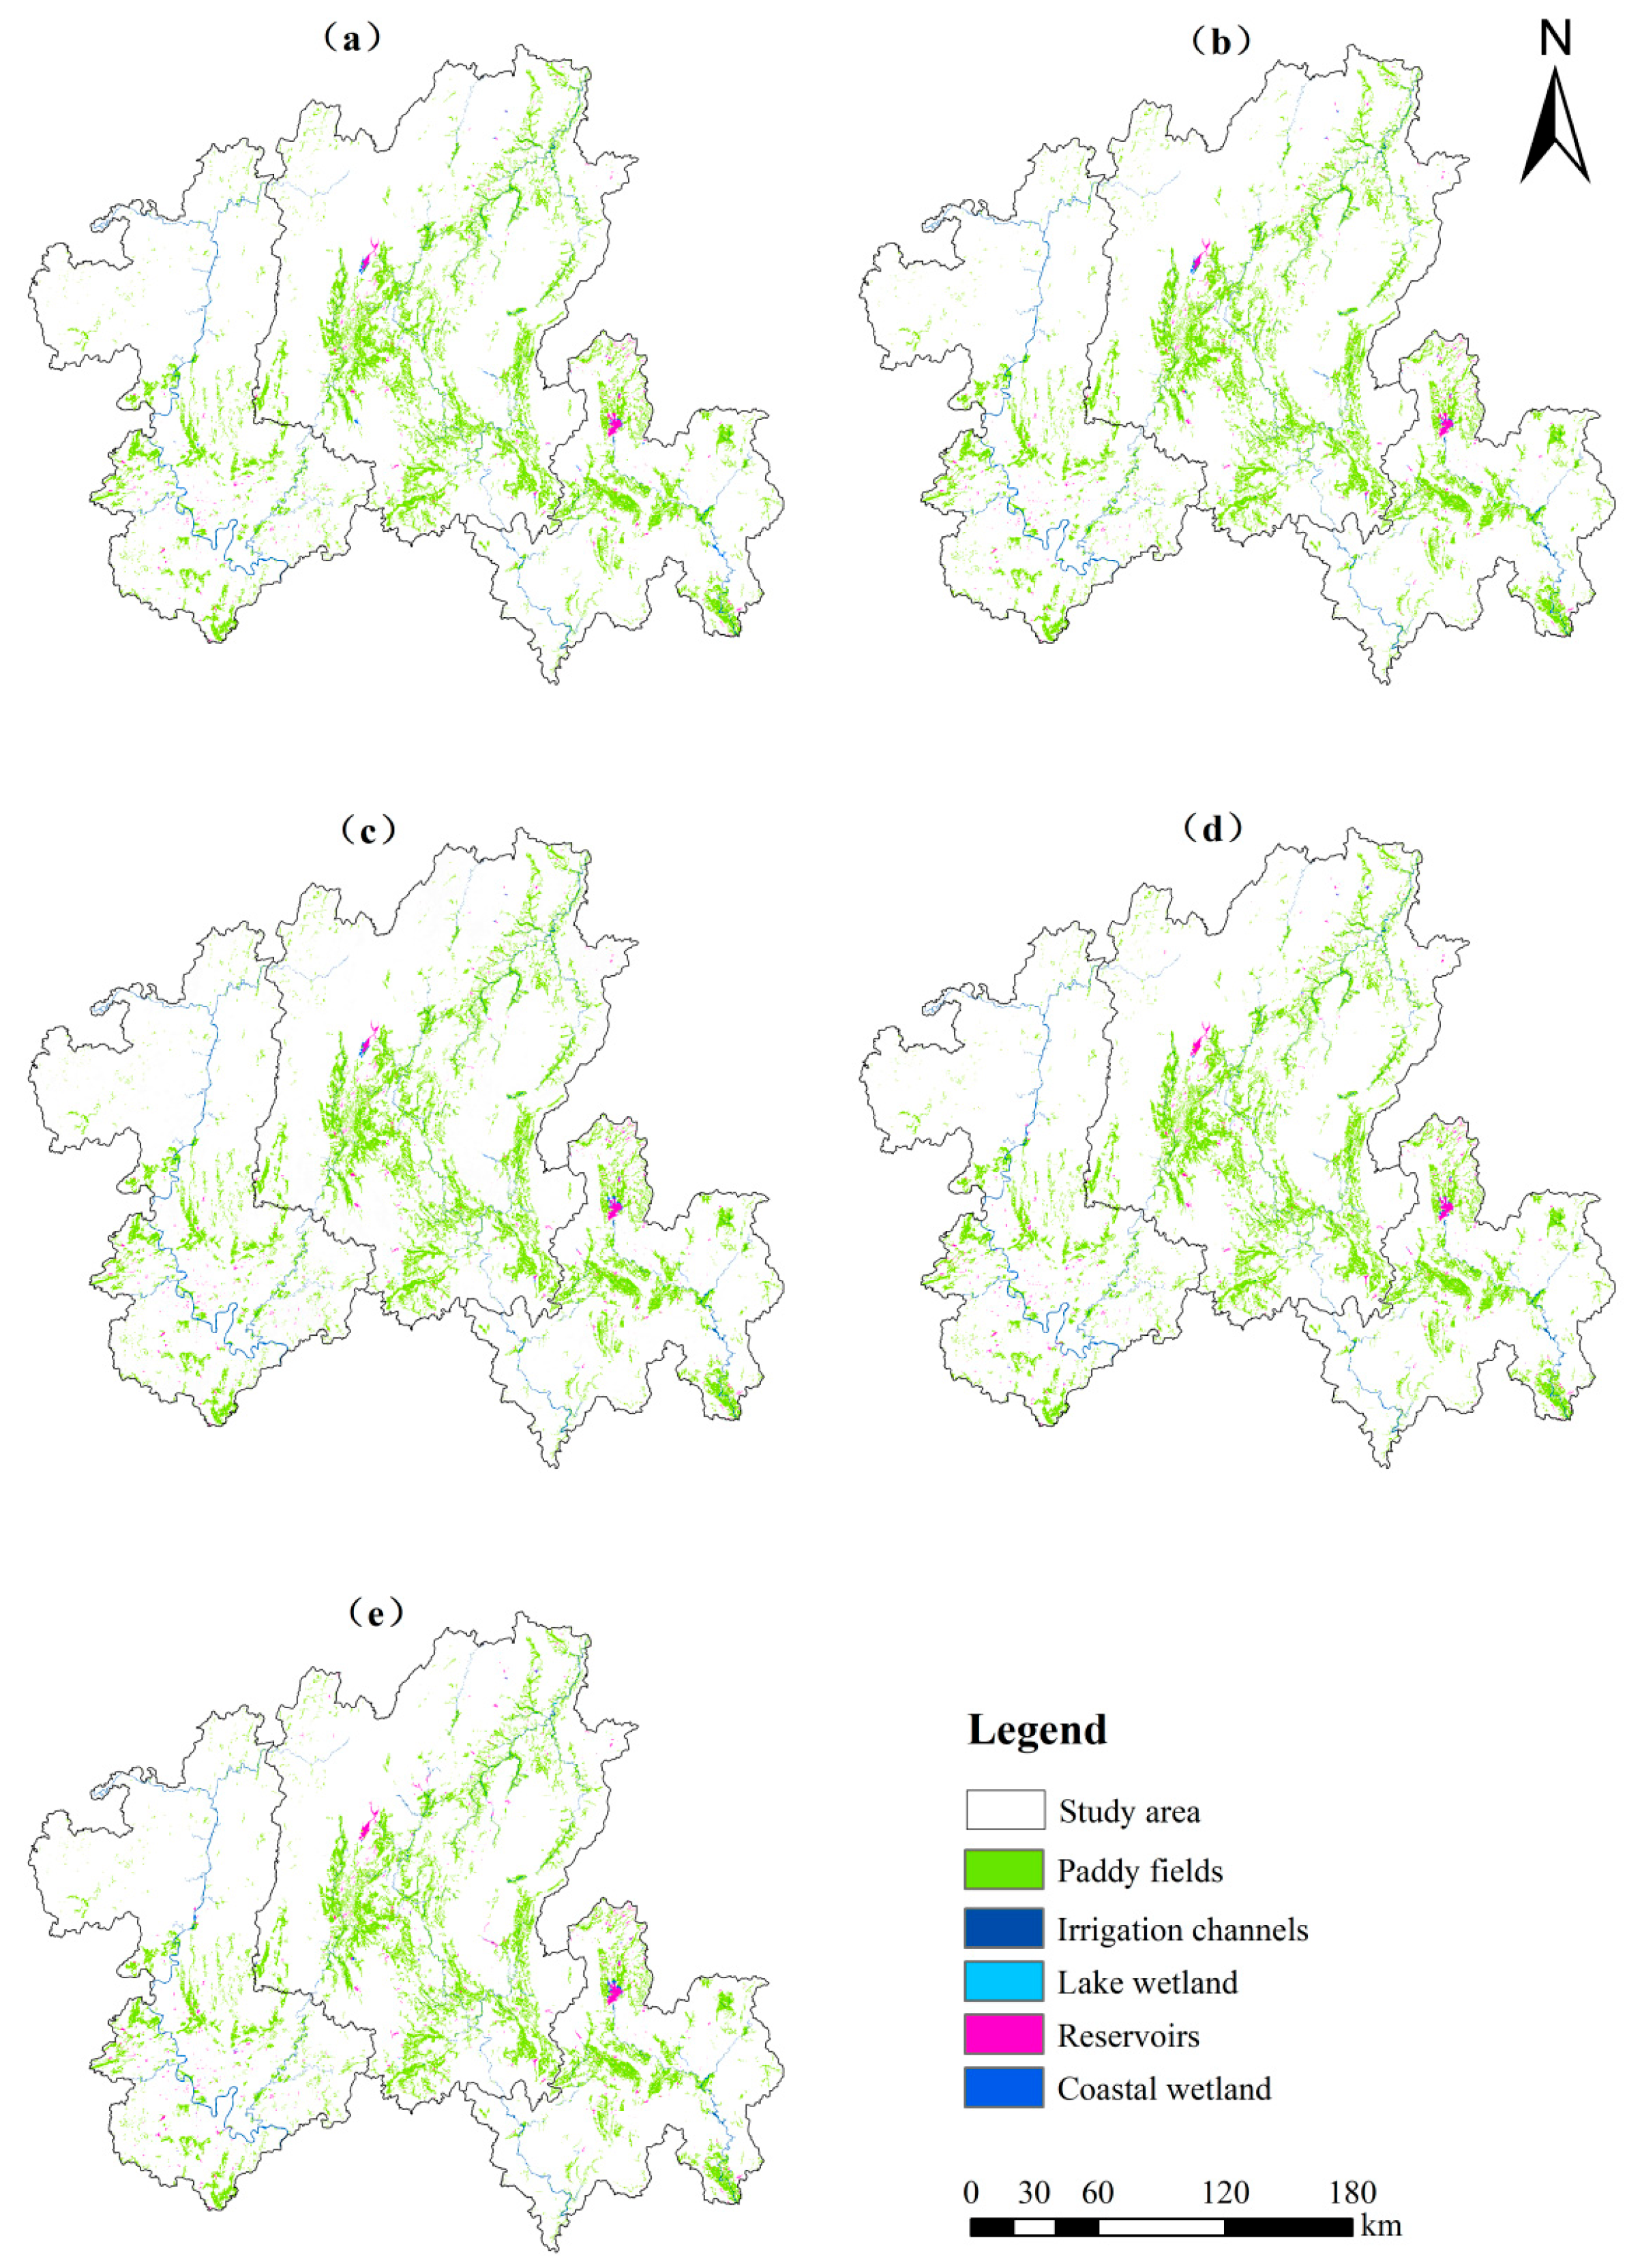
Figure 2 and Figure 3 reveal that the total wetland area in northern Guangxi exhibited a fluctuating decline between 1980 and 2020, decreasing by 65.58 km2 in total. Specifically, between 1980 and 2000, wetland area decreased annually by 13.26 km2, primarily due to the appropriation of natural environmental resources to meet socio-economic development demands over this two-decade period [18], coupled with the absence of dedicated legislation for wetland protection. Subsequently, wetland area rebounded between 2000 and 2010, reaching a peak of 6141.44 km2. This may be linked to the Action Plans of China Wetland Protection (2000), the National Wetland Conservation Engineering Plan (2002–2030), the National Wetland Conservation Programme (NWCP) implemented every five years, and the short-term Wetland Conservation Programme [19], which collectively drove a temporary rebound in wetland area between 2000 and 2010. However, constrained by the limited intensity of early policies and the fragility of natural conditions, this trend could not be sustained long-term. Between 2010 and 2020, the total wetland area again declined in a linear fashion, falling to 6075.8 km2.

3.1.1. Natural Wetlands

Table 6 indicates that fluctuations in the proportion of natural wetland areas across northern Guangxi over four decades reflect the dynamic interplay of multiple factors. Between 1980 and 2020, lake wetland areas expanded by 0.89 km2, whilst costal wetland areas contracted by 15.55 km2, revealing significant conservation pressures on costal wetland in northern Guangxi.

3.1.2. Artificial Wetlands

Although the proportion of artificial wetlands has long remained at a high level of 98.9–99.25%, their total area has shown a declining trend. Specifically, paddy field areas decreased by 133.18 km2, reservoir areas increased by 21.20 km2, and irrigation channel areas expanded by 61.06 km2. Over four decades, Guangxi’s water conservancy development has progressed through distinct phases, encompassing four major domains: flood control, irrigation, water supply, and ecological conservation [20]. However, this development has also partially disrupted natural wetland water replenishment, with hydrological regulation failing to replicate the biodiversity support functions of natural wetlands. This phenomenon is closely linked to intensive human intervention in the region, attributable to the combined effects of policy direction, climate adaptation requirements, and economic model transformation.
As shown in Figure 4 and Table 7, the transfer areas in northern Guangxi from 1980 to 2020, ranked from largest to smallest, were coastal wetlands > irrigation channels > paddy fields > reservoirs > lake wetlands. Coastal wetlands constituted the largest transfer source, relinquishing 42.82 km2 primarily to irrigation channels and reservoirs. This was followed by irrigation channels and paddy fields, which transferred 21.72 km2 and 19.78 km2 respectively. The transferred areas are ranked in descending order: irrigation channels > coastal wetlands > reservoirs > paddy fields > lake wetlands. Irrigation channels represent the largest transferred land category, totalling 41.45 km2, primarily derived from riparian wetlands and paddy fields. This is followed by riparian wetlands and reservoirs, which transferred approximately 20.92 km2 and 22.72 km2 respectively.
In summary, over the past four decades, the wetlands of northern Guangxi have exhibited an overall trend of ‘declining natural wetlands and expanding artificial water conservancy infrastructure’. This is primarily manifested in the conversion between coastal wetlands and irrigation channels, with this mutual transformation driving regional wetland land use changes.

3.2. Landscape Pattern Change Analysis

3.2.1. Type Level Analysis

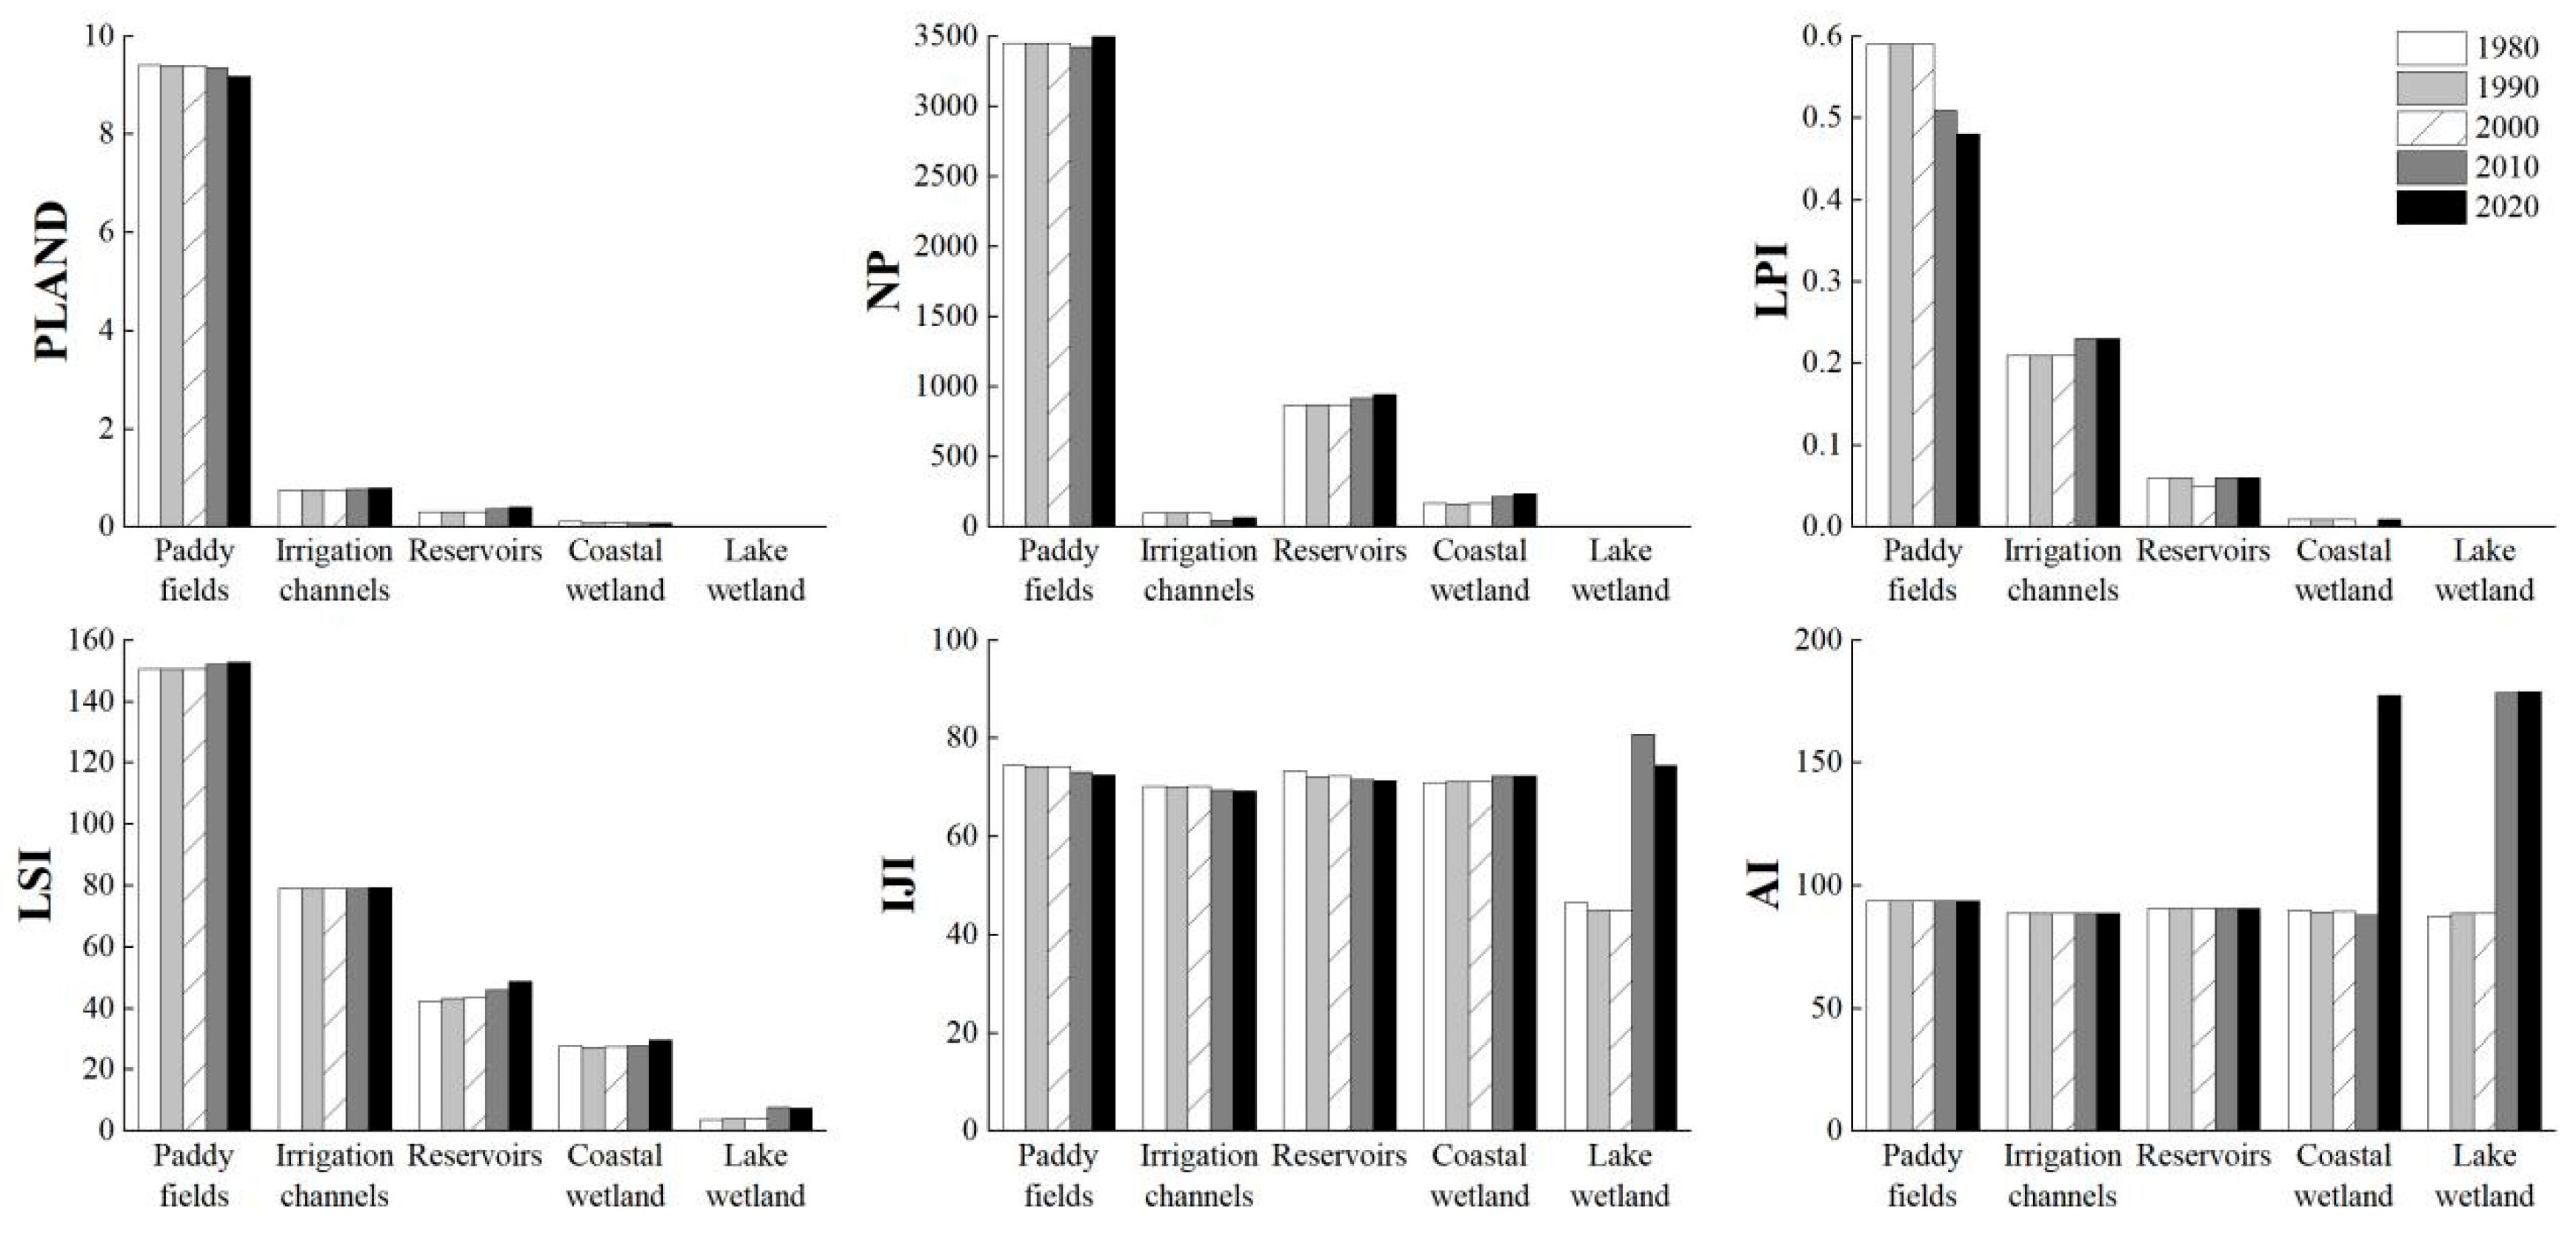
This study analysed the pattern characteristics of landscape types within the study area based on three aspects: patch area, patch shape, and aggregation and separation (Figure 5).
  • Patch area analysis
The Percent landscape (PLAND) value for paddy fields was the highest in the northern Guangxi region, constituting the predominant landscape type in the study area, followed by irrigation channels and reservoirs. Over the 40-year period, both coastal wetlands and paddy fields exhibited gradual annual declines, with paddy fields experiencing the most significant reduction in area. Conversely, lake wetlands, irrigation channels, and reservoirs showed annual increases in area, with reservoirs demonstrating a notably larger expansion.
The Number of Patches (NP) for coastal wetlands, lake wetlands, paddy fields, and reservoirs in northern Guangxi has been steadily increasing, while the number of patches for irrigation channels shows a decreasing trend. This change is primarily attributable to human activities, indicating that the landscape is becoming increasingly complex and fragmented.
In terms of area, paddy fields exhibited the Largest Patch Index (LPI), which were 0.59%, 0.59%, 0.59%, 0.51% and 0.48% respectively, from 1980 to 2020. Irrigation channels followed, with LPI values consistently around 0.21%. From the perspective of trend analysis, the LPI values for lakes wetlands and irrigation channels within the study area exhibited an increasing trend over the 40-year period. Among these, irrigation channels demonstrated the most significant increase, rising by 0.02%. Conversely, the LPI values for riparian wetlands, paddy fields, and reservoirs exhibited a decreasing trend, with paddy fields experiencing the most pronounced reduction of nearly 10%. This indicates that over the 40-year period, the areas of lakes wetlands and irrigation channels within the study area have steadily expanded, while the areas of coastal wetlands, paddy fields, and reservoirs have shown a diminishing trend. This reflects an intensification of spatial fragmentation and a pronounced pattern of human disturbance.
  • Patch shape analysis
Between 1980 and 2020, wetland Landscape Shape Index (LSI) across northern Guangxi exhibited an increasing trend, indicating that wetland landscapes have undergone a gradient intensification of disturbance from human activities. This has led to heightened irregularity in patch morphology, alongside a significant rise in spatial fragmentation indices and complexity. The most pronounced increase was observed in reservoirs, whose proportion rose from 42.38% in 1980 to 48.97% in 2020, reflecting significantly heightened human disturbance. Subsequently, lake wetlands, paddy fields, coastal wetlands, and irrigation channels followed. Irrigation channels exhibited the lowest increase in LSI values (merely 0.3%), indicating weaker human disturbance and a more gradual spatial morphological evolution trend.
  • Aggregation and separation analysis
The overall Interspersion Juxtaposition Index (IJI) within the study area’s paddy fields was the highest, indicating that the adjacent landscape types were more diverse and their spatial distribution more complex. From the perspective of trend changes, the IJI values for paddy fields, reservoirs, and irrigation channels exhibit a persistent downward trajectory, indicating heightened spatial dispersion of their patches. Conversely, the IJI values for lake wetlands fluctuate in an ‘increase-decrease’ pattern, while coastal wetlands demonstrate an ‘decrease-increase’ reversal. This reveals that relevant landscape types exhibit dynamic fluctuations during processes of spatial aggregation and dispersion.
From 1980 to 2000, paddy fields exhibited the highest Aggregation Index (AI) with significant clustering and relatively high proximity, maintaining stable AI values around 93%. Reservoirs and coastal wetlands followed, while irrigation channels showed the lowest clustering with AI values around 88%. During 2010–2020, lake wetlands exhibited the highest aggregation, with AI values surging from 88.83% to 179.16% and maintaining high proximity. Paddy fields, reservoirs, irrigation channels, and coastal wetlands followed, with AI values of 93.84%, 90.89%, 88.93%, and 87.91%, respectively.
In summary, at the Type level, wetland landscapes in northern Guangxi exhibited overall dynamic fluctuations between aggregation and dispersion between 1980 and 2020, alongside an intensifying degree of fragmentation. Paddy fields, though the dominant landscape feature, continue to shrink and fragment, while artificial water bodies such as reservoirs and irrigation channels have expanded significantly. Concurrently, wetland landscapes exhibit increasingly irregular shapes and heightened spatial complexity, suffering from intense human disturbance.

3.2.2. Landscape Level Analysis

This study constructed a three-dimensional assessment framework comprising landscape fragmentation indices, landscape shape indices, and landscape diversity indices to systematically analyse the spatial pattern characteristics at the regional landscape level (Table 8).
  • Landscape fragmentation indices analysis
Between 1980 and 2020, the Patch Density (PD) within the study area exhibited an overall upward trend, increasing from 0.67 in 1980 to 0.70 in 2020. This indicates a rise in the number of landscape patches and a trend towards greater landscape complexity, primarily attributable to high-intensity human disturbance. The Landscape Division Index (DIVISION) show little variation, exhibiting a trend of initial decrease followed by increase. This reveals that landscape fragmentation in northern Guangsxi wetlands is gradually increasing, with the structure of landscape types tending towards greater complexity.
  • Landscape shape indices analysis
Over the past four decades, the Edge Density (ED) of wetlands in northern Guangxi has exhibited a fluctuating yet gradually increasing trend (with an approximate increment of 1%), indicating a persistent intensification of spatial fragmentation characteristics. This evolutionary process has been accompanied by periodic fluctuations between increases and decreases, resulting in increasingly complex and diverse patch configurations.
The Contagion (CONTAG) gradually increased from 65.64 in 1980 to 66.60 in 2020, exhibiting intermittent growth. This reflects a progressive strengthening of connectivity among dominant patch types within the wetland landscapes of northern Guangxi, suggesting a potential reduction in landscape fragmentation.
Between 2010 and 2020, the CONTAG value rose from 66.47 to 66.60, reaching its peak. This increase may have benefited from the strengthening of national wetland conservation policies after 2016, such as the implementation of the Wetland Protection and Restoration System Plan issued by the General Office of the State Council of the People’s Republic of China [21].
Fragmentation indices (PD, DIVISION, ED) and connectivity indices (CONTAG) increased synchronously, revealing that human activities both fragment natural wetlands and reconfigure novel connectivity patterns through artificial wetland networks.
  • Landscape diversity indices analysis
Between 1980 and 2020, the Shannon’s Diversity Index (SHDI) fluctuated around 1.76, exhibiting minimal variation. The diversity of landscape types within the study area remained relatively stable.
The Shannon’s Evenness Index (SHEI) values exhibit a declining trend over the years, decreasing from 0.61 in 1980 to 0.59 in 2020. This reflects the increasing concentration of dominant landscape types, with the area of artificial wetland patches expanding annually to form dominant patches. Although the total area of paddy fields has decreased, the remaining patches display a clustering pattern, exhibiting enhanced dominance and reduced evenness.
In summary, at the landscape level, wetlands in northern Guangxi exhibited coexisting fragmentation and connectivity between 1980 and 2020. Increased patch density and boundary density indicate heightened landscape fragmentation due to human disturbance, while the rise in the spread index reflects enhanced connectivity within the artificial wetland network. Concurrently, Shannon diversity remained stable but evenness declined, revealing the increasingly dominant influence of prevailing landscape types.

3.3. Analysis of Drivers of Landscape Pattern Evolution

3.3.1. Parameters Optimisation Identification

Using the GD package [22,23] in R, wetland data spatial scales were divided into 5 km, 6 km, 7 km, 8 km, 9 km, and 10 km. Analysis revealed that the 90th percentile of the explanatory variable q reached its peak value of 0.53 at the 10 km scale. Consequently, among the six scales, the 10 km scale better reflects the influence of latent variables on wetland changes (Table 9).
The explanatory variable was categorised into 4 to 6 levels, employing five discrete partitioning methods—equal, natural, quantile, geometric, and sd—to detect optimal partitions (Figure 6). Results indicate that the optimal discrete parameter combinations for average annual temperature (X1), population (X4), GDP (X5), and proportion of nature reserves (X8) are six quantile breakpoints. Average annual precipitation (X2) employs four quantile breakpoints. NDVI (X3) utilises five natural breakpoints, and the change rate of agricultural land (X7) employs six natural breakpoints, while the change rate of urban land (X6) exhibited a 6-level standard deviation breakpoint. This demonstrates that the appropriate discrete methods and number of segments may vary significantly across different explanatory variables.

3.3.2. Single-Factor Analysis of Driving Factors

Based on the single-factor detection results (Table 10), natural environmental factors exert a far greater single-factor explanatory power over wetland changes than socio-economic factors and policy conditions. Among these, the average annual temperature (X1) is the primary driver of wetland spatiotemporal distribution, with a q-value of 0.53. Its influence intensity is far more than other factors, and it is the core natural driving factor of wetland degradation. The driving force of average annual precipitation (X2) on wetland changes was 0.19, indicating that precipitation is a significant natural factor, though its explanatory power is lower than that of temperature. Reduced precipitation directly diminishes wetland water replenishment, synergistically forming a dual-pillar climate driver with temperature. This is particularly evident in the karst terrain of northern Guangxi, where sensitivity to groundwater levels makes precipitation a key natural trigger for wetland shrinkage [24].
The q value of GDP (X5) is 0.24, which is still the core humanistic driving factor. GDP growth accompanied by infrastructure expansion and predatory use of water resources are the main economic drivers of wetland encroachment [25]. In South China, the explanatory power of GDP to EVI (0.14) is second only to landform types, which further confirms the strong suppression of economic activities on wetlands [26].
The change rate of urban land use (X6), NDVI (X3) and population (X4) were all weak drivers, with coefficients of 0.08, 0.06 and 0.03, respectively. Urbanisation represents a significant manifestation of anthropogenic disturbance, suggesting that urban land expansion may not directly encroach upon wetland core zones but instead exerts indirect influence through peripheral hydrological diversion. NDVI is frequently influenced by climatic and anthropogenic factors, yet exhibits limited explanatory power in driving analyses. Wetlands in northern Guangxi demonstrate reduced sensitivity to NDVI and agricultural activities compared to other regions, reflecting the hydrological peculiarities of karst topography or monsoon climates [27]. Population growth exerts pressure on wetlands, albeit to a limited extent. This demographic pressure is likely to manifest indirectly through agricultural or consumption activities rather than as a direct driving force.
The q-values for the change rate of agricultural land (X7) and proportion of nature reserves (X8) were 0.03 and 0.02, respectively, indicating no significant correlation. The contribution of agricultural expansion to wetland change was not statistically significant, with low impact suggesting agricultural expansion is not a primary driver. Conservation measures within nature reserves have not significantly impacted wetland changes, failing to markedly curb wetland degradation. This reflects either inadequate management effectiveness within the reserves or a failure to encompass critical wetland areas.

3.3.3. Dual-Factor Analysis of Driving Factors

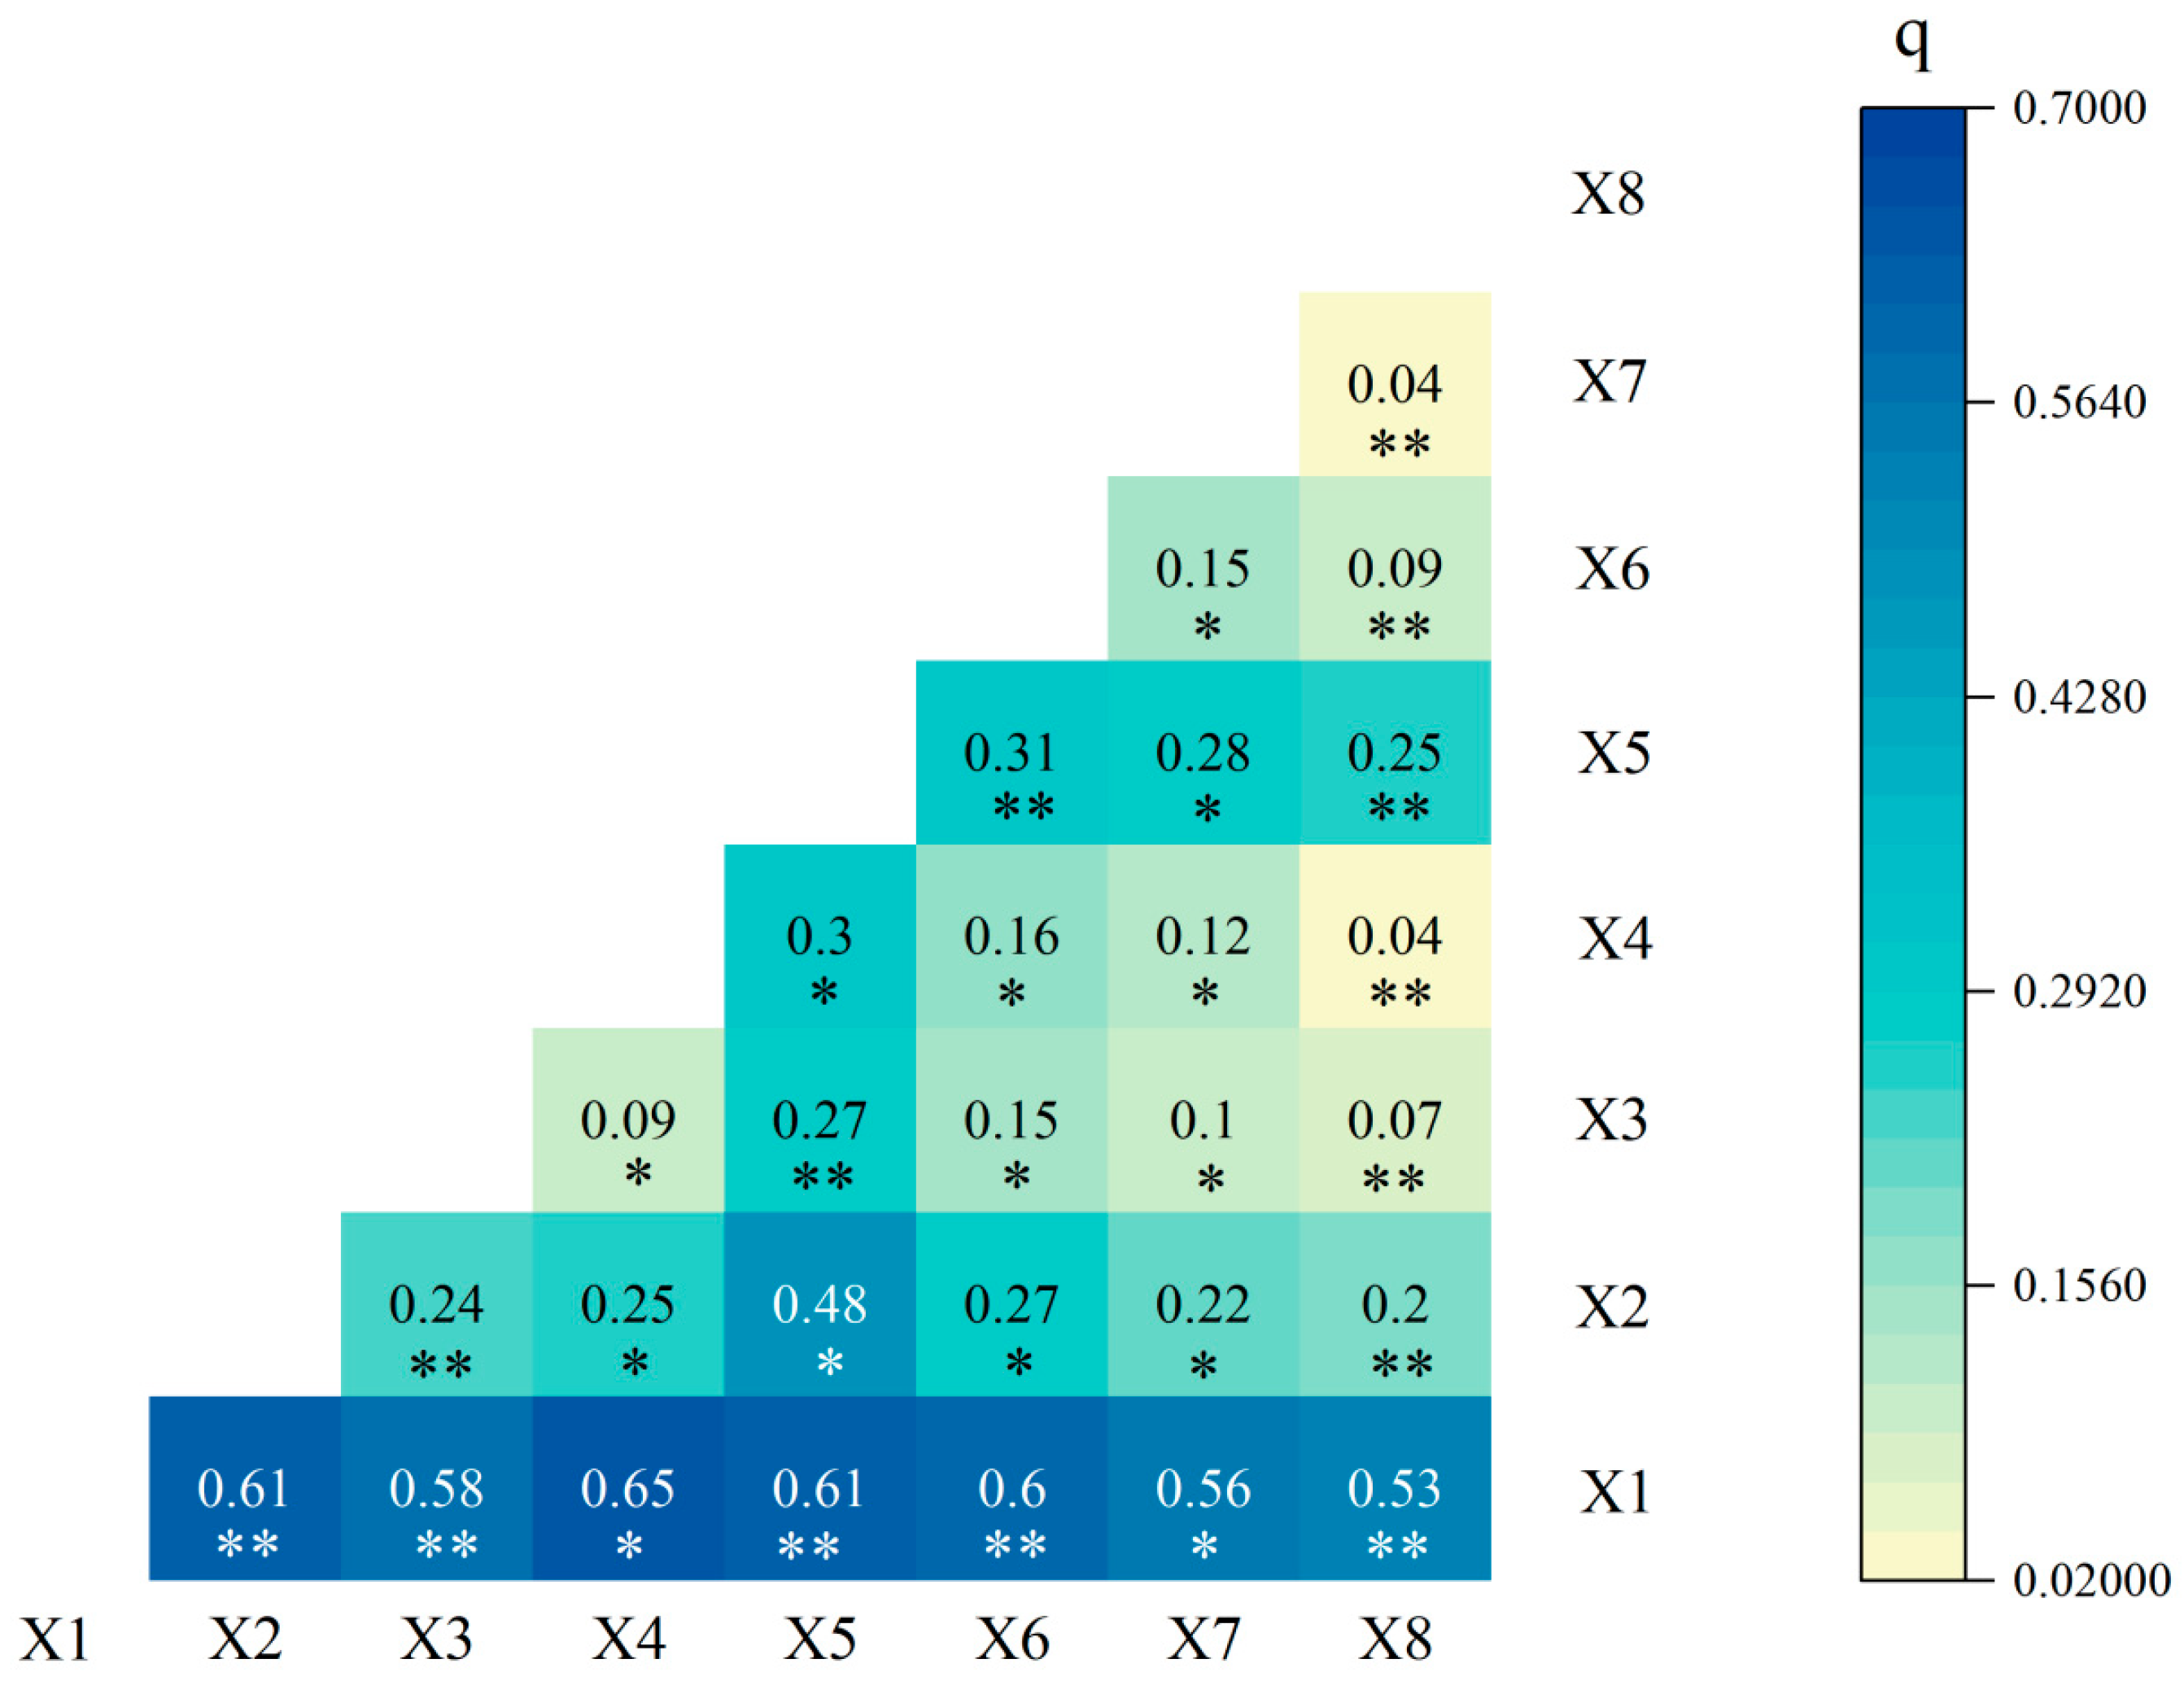
Analysis of the results from dual-factor interaction detection reveals (Figure 7) that among the factors influencing wetland area changes in northern Guangxi, the q-values for most interactions exceed those of individual factors. This aligns with the general principle that ‘any dual-factor interaction is stronger than a single factor,’ with interaction types including nonlinear enhancement * and dual-factor enhancement **.
The interaction values between average annual temperature (X1) and population (X4) and GDP (X5) (0.65, 0.61) were significantly higher than those with average annual precipitation (X2). Rising temperature not only directly increases evapotranspiration, but also amplifies the encroachment effect on wetlands through water demand in densely populated areas and GDP-driven infrastructure construction. Wei [28] noted that the rate of landscape fragmentation in the northern Guangxi karst area is twice that of non-karst regions. Moreover, warming and drying trends have diminished the ecological carrying capacity of wetlands, further inducing human development towards wetland margins. Other regions are typically dominated by precipitation as the primary natural driver, whereas in northern Guangxi, the shallow soils and percolation characteristics of karst terrain mean that rising temperatures are more likely to trigger hydrological imbalances, amplifying the negative effects of human activities.
The interaction values between NDVI (X3) and all factors were below 0.27. Vegetation restoration in karst regions is constrained by karst aridity and soil infertility, resulting in its weak capacity to regulate hydrology and mitigate development impacts.
The interaction between the proportion of nature reserves (X8) and all other factors exhibited the weakest influence, reflecting the fragmentation of the existing protected area system. Karst wetlands in northern Guangxi are predominantly scattered, whereas protected areas tend to be contiguous, resulting in the disruption of ecological corridors.
In summary, the drivers of wetland change in northern Guangxi exhibit distinct natural and anthropogenic differentiation, forming a composite mechanism characterised by ‘climate dominance, economic pressure, and policy failure’. Among these, temperature serves as the key natural driver, GDP as the core anthropogenic driver, and the current lack of effectiveness in conservation policies demands urgent attention.

4. Discussion

The northern part of Guangxi is a typical karst landscape. The widespread karst ditches, funnels, sinkholes and developed underground below river systems in the karst area lead to the easy leakage of surface water. The hydrological process has a typical ‘surface-underground’ binary structure [29], making the wetland ecosystem, especially the natural wetland that needs stable water supply, more vulnerable in the face of climate change and human activities. The results showed that the wetland landscape in northern Guangxi showed a ‘structural substitution’ trend from 1980 to 2020, that is, the coexistence of natural wetland shrinkage and artificial wetland expansion. The shrinkage of natural wetlands was concentrated on the significant reduction in coastal wetlands, which not only directly led to the loss of biodiversity, but also weakened the ecological regulation function of wetlands. The expansion of constructed wetlands focuses on the increase in irrigation ditches, which reflects the intensification of human demand for water resources regulation. This structural change not only changes the essential attributes of wetlands, but also has a profound impact on the regional ecological security pattern. The research conclusions of similar patterns in Guangxi other regional scales [30], national scales [31], and even global scales [32] tend to be consistent, reflecting that the rapid expansion of constructed wetlands has become a common phenomenon under the background of rapid economic development. This structural change reveals the profound contradiction between economic development needs and ecological protection.
The wetland landscape pattern in northern Guangxi showed the characteristics of ‘deepening fragmentation and complicated structure’ in the past 40 years. Landscape fragmentation leads to the obstruction of species migration and energy flow in ecological processes, which in turn weakens the connectivity and resilience of ecosystems. The increase in patch density and edge density reflects the continuous disturbance of human activities on landscape structure, while the increase in contagion shows the positive effect of artificial wetland network driven by policy. The relative stability of Shannon’s diversity index indicates that the overall landscape type has not been greatly lost, but the decline in Shannon’s evenness index warns that the dominant trend of dominant patches may weaken the ecological function of natural wetlands. Although the constructed wetland may partially compensate for the loss of natural wetland in quantity, its ecological substitution function is obviously insufficient [33]. This feature has also been observed in Sanjiang Plain Wetland [34], Songnen Plain Research [35] and Tarim River Basin Research [36]. Therefore, it can be concluded that in wetland management, it is necessary to simultaneously suppress fragmentation, strengthen ecological connectivity, and pay attention to the dynamic changes in landscape evenness to achieve sustainable restoration and protection of wetland ecosystems.
The analysis of the driving mechanism of wetland change in northern Guangxi shows that its evolution is affected by the multiple interweaving of natural and human factors, showing the composite characteristics of ‘climate dominance, economic stress and policy failure’. Among the natural factors, the annual average temperature is the core driving force of wetland distribution and degradation, which is significantly higher than the explanatory power of precipitation factors. This phenomenon is particularly prominent in karst areas [37]. The increase in temperature will directly aggravate the evapotranspiration of wetland water body [38], and promote the infiltration and consumption of groundwater in karst process, resulting in the decrease in wetland water storage capacity and accelerating wetland shrinkage [28]. It is worth noting that climate warming and precipitation anomalies often have a synergistic effect. The decrease in precipitation will weaken the direct water supply of wetlands, while the increase in temperature will further amplify the drought effect by accelerating soil moisture evaporation and vegetation transpiration [39]. Especially in karst areas with developed underground river systems and sensitive hydrological structure, such as northern Guangxi, it is easy to cause the risk of wetland shrinkage and rocky desertification.
In terms of being human-driven, GDP growth is the main economic stress factor. Economic activities are usually accompanied by the expansion of urbanisation, the predatory use of water resources and the intensification of infrastructure construction. These activities will directly encroach on wetland space or change its hydrological cycle path. As a core human driving force, GDP has been verified in China’s three major coastal urban agglomeration wetlands [40], typical wetlands in the northwest plateau of Yunnan [41] and other Chinese regions [42]. In contrast, the direct driving force of population growth and urban land use change on wetlands is weak, indicating that human interference is more reflected in indirect ways, such as through water resources redistribution, rather than directly encroaching on the core wetland area. The evolution of karst landscape wetlands in northern Guangxi is more prominent in the inherent hydrological vulnerability of karst topography and the superposition effect of human activities. This ‘dual-drive’ model is the root cause of the difference in the evolution of wetlands in non-karst areas, which is significantly different from the evolution model of wetlands in non-karst areas [35,43].
The driving sub-analysis also reveals that the effectiveness of current protection policies is not obvious. The proportion of nature reserves (X8) has very low explanatory power for wetland changes, and its interaction with other factors is weak, reflecting that the protected area system may have problems such as unreasonable layout, decentralised management or ecological corridor fracture. In karst areas, wetlands are often sporadically distributed, and protected areas are mostly concentrated in contiguous areas, resulting in the failure of key wetland patches to be effectively covered and insufficient landscape connectivity, which weakens the actual effect of protection policies.
In summary, the change in wetland in northern Guangxi is the result of nonlinear superposition of natural and human factors. Future governance should focus on the collaborative management of natural-social systems: (1) Strengthen the protection of the core area of natural wetlands: Based on the analysis of patch connectivity, ecological corridors and core protected areas are delineated to prevent further fragmentation, and landscape connectivity indicators are used for dynamic monitoring. (2) Optimise the layout of constructed wetlands: Conduct ecological assessment of new reservoirs and irrigation canals, encourage eco-friendly constructed wetlands, and take into account agricultural production and ecological services. (3) Strengthening climate adaptive management: Based on the trend of temperature rise, a flexible scheme for wetland water level regulation is formulated to ensure that natural wetlands can still maintain basic hydrological conditions in extreme climates. Combined with the climate prediction model, high-risk areas are identified in advance and preventive restoration projects are implemented. (4) Promote ecological compensation and public participation: implement ecological compensation mechanisms for wetland losses caused by economic activities, and encourage farmers to switch to eco-friendly planting or breeding.
This study provides an empirical foundation for elucidating the distinctive patterns of wetland evolution in karst regions, thereby deepening our understanding of the complexities of human–land interactions in northern Guangxi. Against the backdrop of ecological civilization development and territorial spatial governance, the research findings constitute both a scientific response to the need for optimising regional ecological security patterns and provide theoretical underpinnings for wetland conservation and restoration in similar regions. However, this study does possess certain limitations. Due to constraints imposed by the resolution of the original data, the accuracy of identifying wetland subtypes within the land use classification may be inadequate. Future research may incorporate high-resolution remote sensing imagery and multi-source data fusion techniques to depict landscape dynamics at finer scales with greater precision, thereby deepening our understanding of micro-processes and mechanisms within complex terrain. Secondly, the natural and anthropogenic indicators incorporated into the driving factor analysis remain relatively limited. Subsequent research may integrate multi-source data to construct a more comprehensive set of driving factors and develop dynamic coupling models, thereby enhancing capabilities for dynamic monitoring and driving force analysis. By enhancing policy support, technical methodologies and public engagement, robust technical guidance and evidence can be provided for environmental protection and management decision-making within complex human–land systems research.

5. Conclusions

In summary, this study selected land use data from five periods—1980, 1990, 2000, 2010, and 2020—as its data source. It analysed the distribution and changes in wetlands in northern Guangxi over a 40-year span, conducting a multi-faceted quantitative analysis of the driving factors behind the wetland landscape in this region. The principal conclusions of this study are as follows:
Analysis of wetland landscape structure reveals that between 1980 and 2020, wetlands in northern Guangxi exhibited a pattern of ‘structural substitution’ characterised by the contraction of natural wetlands and the expansion of artificial wetlands. The total wetland area decreased by 65.58 km2, with reservoir and irrigation channels within artificial wetlands increasing by 61.06 km2 and 21.20 km2 respectively, while paddy fields decreased by 133.18 km2. The total area of natural wetlands continued to shrink, with coastal wetlands experiencing the most significant reduction, decreasing by 15.55 km2.
Analysis of wetland landscape patterns reveals that between 1980 and 2020, wetland landscape evolution in northern Guangxi exhibited characteristics of ‘increasing fragmentation and structural complexity’. Fragmentation of vulnerable natural wetland patches intensified, while connectivity among dominant artificial wetland patches strengthened. Wetland fragmentation and complexity escalated, wetland types and distributions fluctuated, and landscape heterogeneity manifested in phased patterns.
From the analysis of the driving force of wetland landscape evolution, the average annual temperature is the core natural driving force of wetland change in northern Guangxi, GDP is the core human driving force, and the driving force is further enhanced after the interaction between the two. The impact of other factors such as average annual precipitation and population is weak, and the protection policy has not shown significant results. As a whole, it presents a composite driving mechanism of ‘climate dominance, economic stress and policy failure’.

Supplementary Materials

The following supporting information can be downloaded at: https://www.mdpi.com/article/10.3390/app152111485/s1. Actual GeoJSON data files.

Author Contributions

T.T. contributed to conceptualization and methodology, software, and writing. X.T. contributed to review, editing, validation and funding acquisition. W.L., Y.B., Y.H. and S.H. responsible for the polishing of the article. All authors have read and agreed to the published version of the manuscript.

Funding

This research was funded by Key Research and Development Projects of Guilin Science and Technology Bureau, Guangxi, China, in 2023 (Project No. 20230111-1).

Institutional Review Board Statement

Not applicable.

Informed Consent Statement

Not applicable.

Data Availability Statement

The data presented in this study are available in the article. National Platform for Common GeoSpatial Information Services: https://www.tianditu.gov.cn/ (accessed on 20 November 2024) (see Supplementary Materials). GeoSpatial Data Cloud: https://www.gscloud.cn/ (accessed on 25 November 2024). Resource and Environmental Science Data Platform: https://www.resdc.cn (accessed on 22 November 2024). National Catalogue Service For Geographic Information: https://www.webmap.cn/main.do?method=index (accessed on 22 November 2024). Ministry of Ecology and Environment of the People’s Republic of China: https://www.mee.gov.cn (accessed on 3 December 2024). National Bureau of Statistics: https://www.stats.gov.cn/sj/ndsj/ (accessed on 3 December 2024).

Acknowledgments

The authors gratefully acknowledge funding for this research and would like to thanks. At the same time, the authors are grateful to the anonymous reviewers and editors for their input and constructive comments.

Conflicts of Interest

The authors declare no conflicts of interest.

Abbreviations

The following abbreviations are used in this manuscript:
GDPGross Domestic Product
NDVINormalised Difference Vegetation Index
CNLUCCChina National Land Use/Cover
CASChinese Academy of Sciences
AIAggregation Index
NPNumber of Patches
LPILargest Patch Index
PLANDPercent of Landscape
LJIInterspersion Juxtaposition Index
LSILandscape shape Index
PDPatch Density
EDEdge Density
DIVISIONLandscape Division Index
CONTAGContagion
SHDIShannon’s Diversity Index
SHEIShannon’s Evenness Index
OPGDOptimal Parameters-based Geographical Detector
EVIEnhanced Vegetation Index

References

  1. Liu, H.; Lu, X.; Zhang, S. Progress on the Study of Process of Wetland Landscape Changes and Cumulative Environmental Effects. Prog. Geogr. 2003, 22, 60–70. [Google Scholar] [CrossRef]
  2. Bai, J.H.; O, H.; Yang, Z.F.; Cui, B.S.; Cui, L.J.; Wang, Q.G. Changes in wetland landscape patterns: A review. Prog. Geogr. 2005, 24, 36–45. [Google Scholar] [CrossRef]
  3. Hu, S.; Niu, Z.; Chen, Y.; Li, L.; Zhang, H. Global wetlands: Potential distribution, wetland loss, and status. Sci. Total Environ. 2017, 586, 319–327. [Google Scholar] [CrossRef]
  4. Mao, D.; Wang, M.; Wang, Y.; Jiang, M.; Yuan, W.; Luo, L.; Feng, K.; Wang, D.; Xiang, H.; Ren, Y.; et al. The trajectory of wetland change in China between 1980 and 2020: Hidden losses and restoration effects. Sci. Bull. 2025, 70, 587–596. [Google Scholar] [CrossRef] [PubMed]
  5. Xiao, D.; Li, X.; Gao, J.; Chang, Y.; Li, T. Landscape Ecology; Science Press: Beijing, China, 2003; pp. 1–10. [Google Scholar]
  6. Zhou, Y.; Xiao, W.; Fan, W. The utilities of “3S” technique in landscape ecology study. World For. Res. 2007, 20, 38–44. [Google Scholar] [CrossRef]
  7. Cai, J.; Wang, X.; Li, C.; Liu, Q.; Cai, Y. Frontier hotspots and development trend of wetland landscape pattern research. J. Southwest Univ. Nat. Sci. Ed. 2022, 44, 127–139. [Google Scholar] [CrossRef]
  8. Han, H.; Su, Z. Research progress and prospects of karst ecosystem services. Carsologica Sin. 2017, 36, 352–358. [Google Scholar] [CrossRef]
  9. Gao, C.; Zhou, D.; Luan, Z.; Zhang, H. Review on researches of wetland landscape pattern change. Resour. Environ. Yangtze Basin 2010, 19, 460–464. Available online: https://api.semanticscholar.org/CorpusID:132747569 (accessed on 24 March 2025).
  10. Ou, D.; Xia, J.; Zhang, L.; Zhao, Z. Research progress on regional ecological security pattern planning and discussion of planning techniqueflow. Ecol. Environ. Sci. 2015, 24, 163–173. [Google Scholar] [CrossRef]
  11. Han, H.; Wang, X.; Niu, L.; Liang, X.; Jiang, X.; Tan, Z. The land-use and land-cover change characteristies and driving forces of cultivated land in Central Asian countries fom 1992 to 2015. Chin. J. Eco-Agric. 2021, 29, 325–339. [Google Scholar] [CrossRef]
  12. Liang, X.; Guan, Q.F.; Clarke, K.C.; Liu, S.S.; Wang, B.Y.; Yao, Y. Understanding the drivers of sustainable land expansion using a patch-generating land use simulation (PLUS) model: A case study in Wuhan, China. Comput. Environ. Urban Syst. 2021, 85, 101569. [Google Scholar] [CrossRef]
  13. GB/T 24708-2009; Wetland Classification. General Administration of Quality Supervision, Inspection and Quarantine of the People’s Republic of China, Standardization Administration of the People’s Republic of China: Beijing, China, 2009.
  14. Zhong, Y.; Wu, H.; Liu, Y. Research status and prospects of remote sensing for wetland mapping. Bull. Natl. Nat. Sci. Found. China 2022, 36, 420–431. [Google Scholar] [CrossRef]
  15. He, Q.; Xie, D.; Wang, S.; Yan, J.; Chen, L. Land use transformation and its eco-environmental effects in beibei district, chongqing. Res. Soil Water Conserv. 2019, 26, 290–296. [Google Scholar] [CrossRef]
  16. Song, Y.; Wang, J.; Ge, Y.; Xu, C. An optimal parameters-based geographical detector model enhances geographic characteristics of explanatory variables for spatial heterogeneity analysis: Cases with different types of spatial data. Gisci. Remote Sens. 2020, 57, 593–610. [Google Scholar] [CrossRef]
  17. Wang, J.; Xu, C. Geodetector: Principle and prospective. Acta Geogr. Sin. 2017, 72, 116–134. [Google Scholar] [CrossRef]
  18. Zhang, Q. Data from the Chinese Academy of Sciences’ Remote Sensing Monitoring Indicates that China’s Wetland Area Has Decreased by One-Third over the Past 30 Years. Available online: https://news.sciencenet.cn/sbhtmlnews/2011/3/242709.html (accessed on 24 March 2025).
  19. Xu, W.; Fan, X.; Ma, J.; Pimm, S.L.; Kong, L.; Zeng, Y.; Li, X.; Xiao, Y.; Zheng, H.; Liu, J.; et al. Hidden Loss of Wetlands in China. Curr. Biol. 2019, 29, 3065–3071. [Google Scholar] [CrossRef] [PubMed]
  20. National Water Network (N.H.I.). Guangxi Water Resources. Available online: http://xxfb.mwr.cn/slbk/dfsl/gxsl/202004/t20200409_1466143.html (accessed on 9 April 2020).
  21. Gao, C.J.; Zhou, D.M.; Luan, Z.Q.; Zhang, H.Y. Notice of the general office of the state council on issuing the plan for the wetland protection and restoration system. Resour. Environ. Yangtze Basin 2016, 19, 460–464. [Google Scholar]
  22. Wang, J.; Li, X.; Christakos, G.; Liao, Y.; Zhang, T.; Gu, X.; Zheng, X. Geographical Detectors-Based Health Risk Assessment and its Application in the Neural Tube Defects Study of the Heshun Region, China. Int. J. Geogr. Inf. Sci. 2010, 24, 107–127. [Google Scholar] [CrossRef]
  23. Wang, J.; Zhang, T.; Fu, B. A measure of spatial stratified heterogeneity. Ecol. Indic. 2016, 67, 250–256. [Google Scholar] [CrossRef]
  24. Yu, X. Spatial responses of wetland change to climate in 32 years in Qinghai-Tibet Plateau. Remote Sens. Nat. Resour. 2015, 27, 99–107. [Google Scholar] [CrossRef]
  25. Xiao, Q.C.; Wei, Y.S.; Wang, Y.W.; Zhong, J.; Yu, M.; Yang, Y.; Yu, D.W.; Zeng, F.G.; Zheng, X.; Sun, Y.C.; et al. Driving factors of coastal wetland degradation in Binhai New Area of Tianjin. Acta Sci. Circumstantiae 2012, 32, 480–488. [Google Scholar] [CrossRef]
  26. Chen, L.; Mo, T. Study of temporal and spatial variation and influencing factors of fractional vegetation covered in Guangxi province from 2000 to 2020. J. Anhui Agric. Sci. 2023, 51, 55–59. [Google Scholar] [CrossRef]
  27. Wu, Y.; Yang, J.; Li, S.; Guo, C.; Yang, X.; Xu, Y.; Yue, F.; Peng, H.; Chen, Y.; Gu, L.; et al. NDVI-based vegetation dynamics and their responses to climate change and human activities from 2000 to 2020 in Miaoling Karst Mountain Area, SW China. Land 2023, 12, 1267. [Google Scholar] [CrossRef]
  28. Wei, Q.; He, W.; Wang, J.; Zhou, X.; Yao, Y. Spatial and temporal evolutionary characteristics of landscape pattern of a typical karst watershed based on GEE platform. J. Resour. Ecol. 2023, 14, 928–939. [Google Scholar] [CrossRef]
  29. Institute of Subtropical Agriculture, Chinese Academy of Sciences. Karst Landscape in Karst Process. Available online: https://www.cas.cn/kxcb/kpwz/201210/t20121026_3667444.shtml (accessed on 26 October 2012).
  30. He, D.Y.; Lu, Y.; Li, N. Spatial and temporal changes in coastal wetlands in Guangxi Beibu Gulf in recent 20 Years. Wetl. Sci. Manag. 2014, 10, 37–41. [Google Scholar] [CrossRef]
  31. Peng, G. The spatiotemporal changes of China’s wetlands from 1980 to 2020. Chin. Sci. Bull. 2025, 70, 466–467. [Google Scholar]
  32. Fluet-Chouinard, E.; Stocker, B.D.; Zhang, Z.; Malhotra, A.; Melton, J.R.; Poulter, B.; Kaplan, J.O.; Goldewijk, K.K.; Siebert, S.; Minayeva, T. Extensive global wetland loss over the past three centuries. Nature 2023, 614, 281–286. [Google Scholar] [CrossRef]
  33. Niu, Z.; Zhang, H.; Wang, X.; Yao, W.; Zhou, D.; Zhao, K.; Zhao, H.; Li, N.; Huang, H.B.; Li, C.; et al. Changes in China’s wetland types from 1978 to 2008. Chin. Sci. Bull. 2012, 57, 1400–1411. [Google Scholar] [CrossRef]
  34. Li, Z.; Liu, M.; Hu, Y.; Xue, Z.; Sui, J. The spatiotemporal changes of marshland and the driving forces in the Sanjiang Plain, Northeast China from 1980 to 2016. Ecol. Process. 2020, 9, 24. [Google Scholar] [CrossRef]
  35. Wang, Z.; Huang, N.; Luo, L.; Li, X.; Ren, C.; Song, K.; Chen, J. Shrinkage and fragmentation of marshes in the West Songnen Plain, China, from 1954 to 2008 and its possible causes. Int. J. Appl. Earth Obs. Geoinf. 2011, 13, 477–486. [Google Scholar] [CrossRef]
  36. Zhao, R.; Chen, Y.; Zhou, H.; Li, Y.; Qian, Y.; Zhang, L. Assessment of wetland fragmentation in the Tarim River basin, western China. Environ. Geol. 2009, 57, 455–464. [Google Scholar] [CrossRef]
  37. Ford, D.; Williams, P.W. Karst Hydrogeology and Geomorphology; Wiley: Hoboken, NJ, USA, 2015. [Google Scholar]
  38. Wu, L.P.; Chen, H.S.; Lian, J.J.; Fu, Z.Y.; Wang, S. Spatio-temporal variation in reference evapotranspiration in recent 50 years in karst and non-karst areas in Guangxi Zhuang Autonomous Region. Chin. J. Eco-Agric. 2017, 25, 1508–1517. [Google Scholar] [CrossRef]
  39. Qiao, Y.; Jiang, Y.; Zhang, C. Contribution of karst ecological restoration engineering to vegetation greening in southwest China during recent decade. Ecol. Indic. 2020, 121, 107081. [Google Scholar] [CrossRef]
  40. Yuan, L.; Jun, W. A Comparative Study on Spatial-Temporal Dynamics and Associated Driving Factors of Wetlands in the Three Coastal Urban Agglomerations of China. Wetl. Sci. 2024, 22, 617–629. [Google Scholar] [CrossRef]
  41. Wang, Q.; Wang, H.; Zhang, W.; Wang, Z.; Xiao, D. The correlations between wetland landscape and social-natural factors on Northwestern Yunnan Plateau. Acta Ecol. Sin. 2019, 39, 726–738. [Google Scholar] [CrossRef]
  42. Gong, N.; Niu, Z.; Qi, W.; Zhang, H. Driving forces of wetland change in China. J. Remote Sens. 2016, 20, 172–183. [Google Scholar] [CrossRef]
  43. Niu, Z.; Zhang, H.; Wang, X.; Yao, W.; Zhou, D.; Zhao, K.; Zhao, H.; Li, N.; Huang, H.; Li, C.; et al. Mapping wetland changes in China between 1978 and 2008. Chin. Sci. Bull. 2012, 57, 2813–2823. [Google Scholar] [CrossRef]
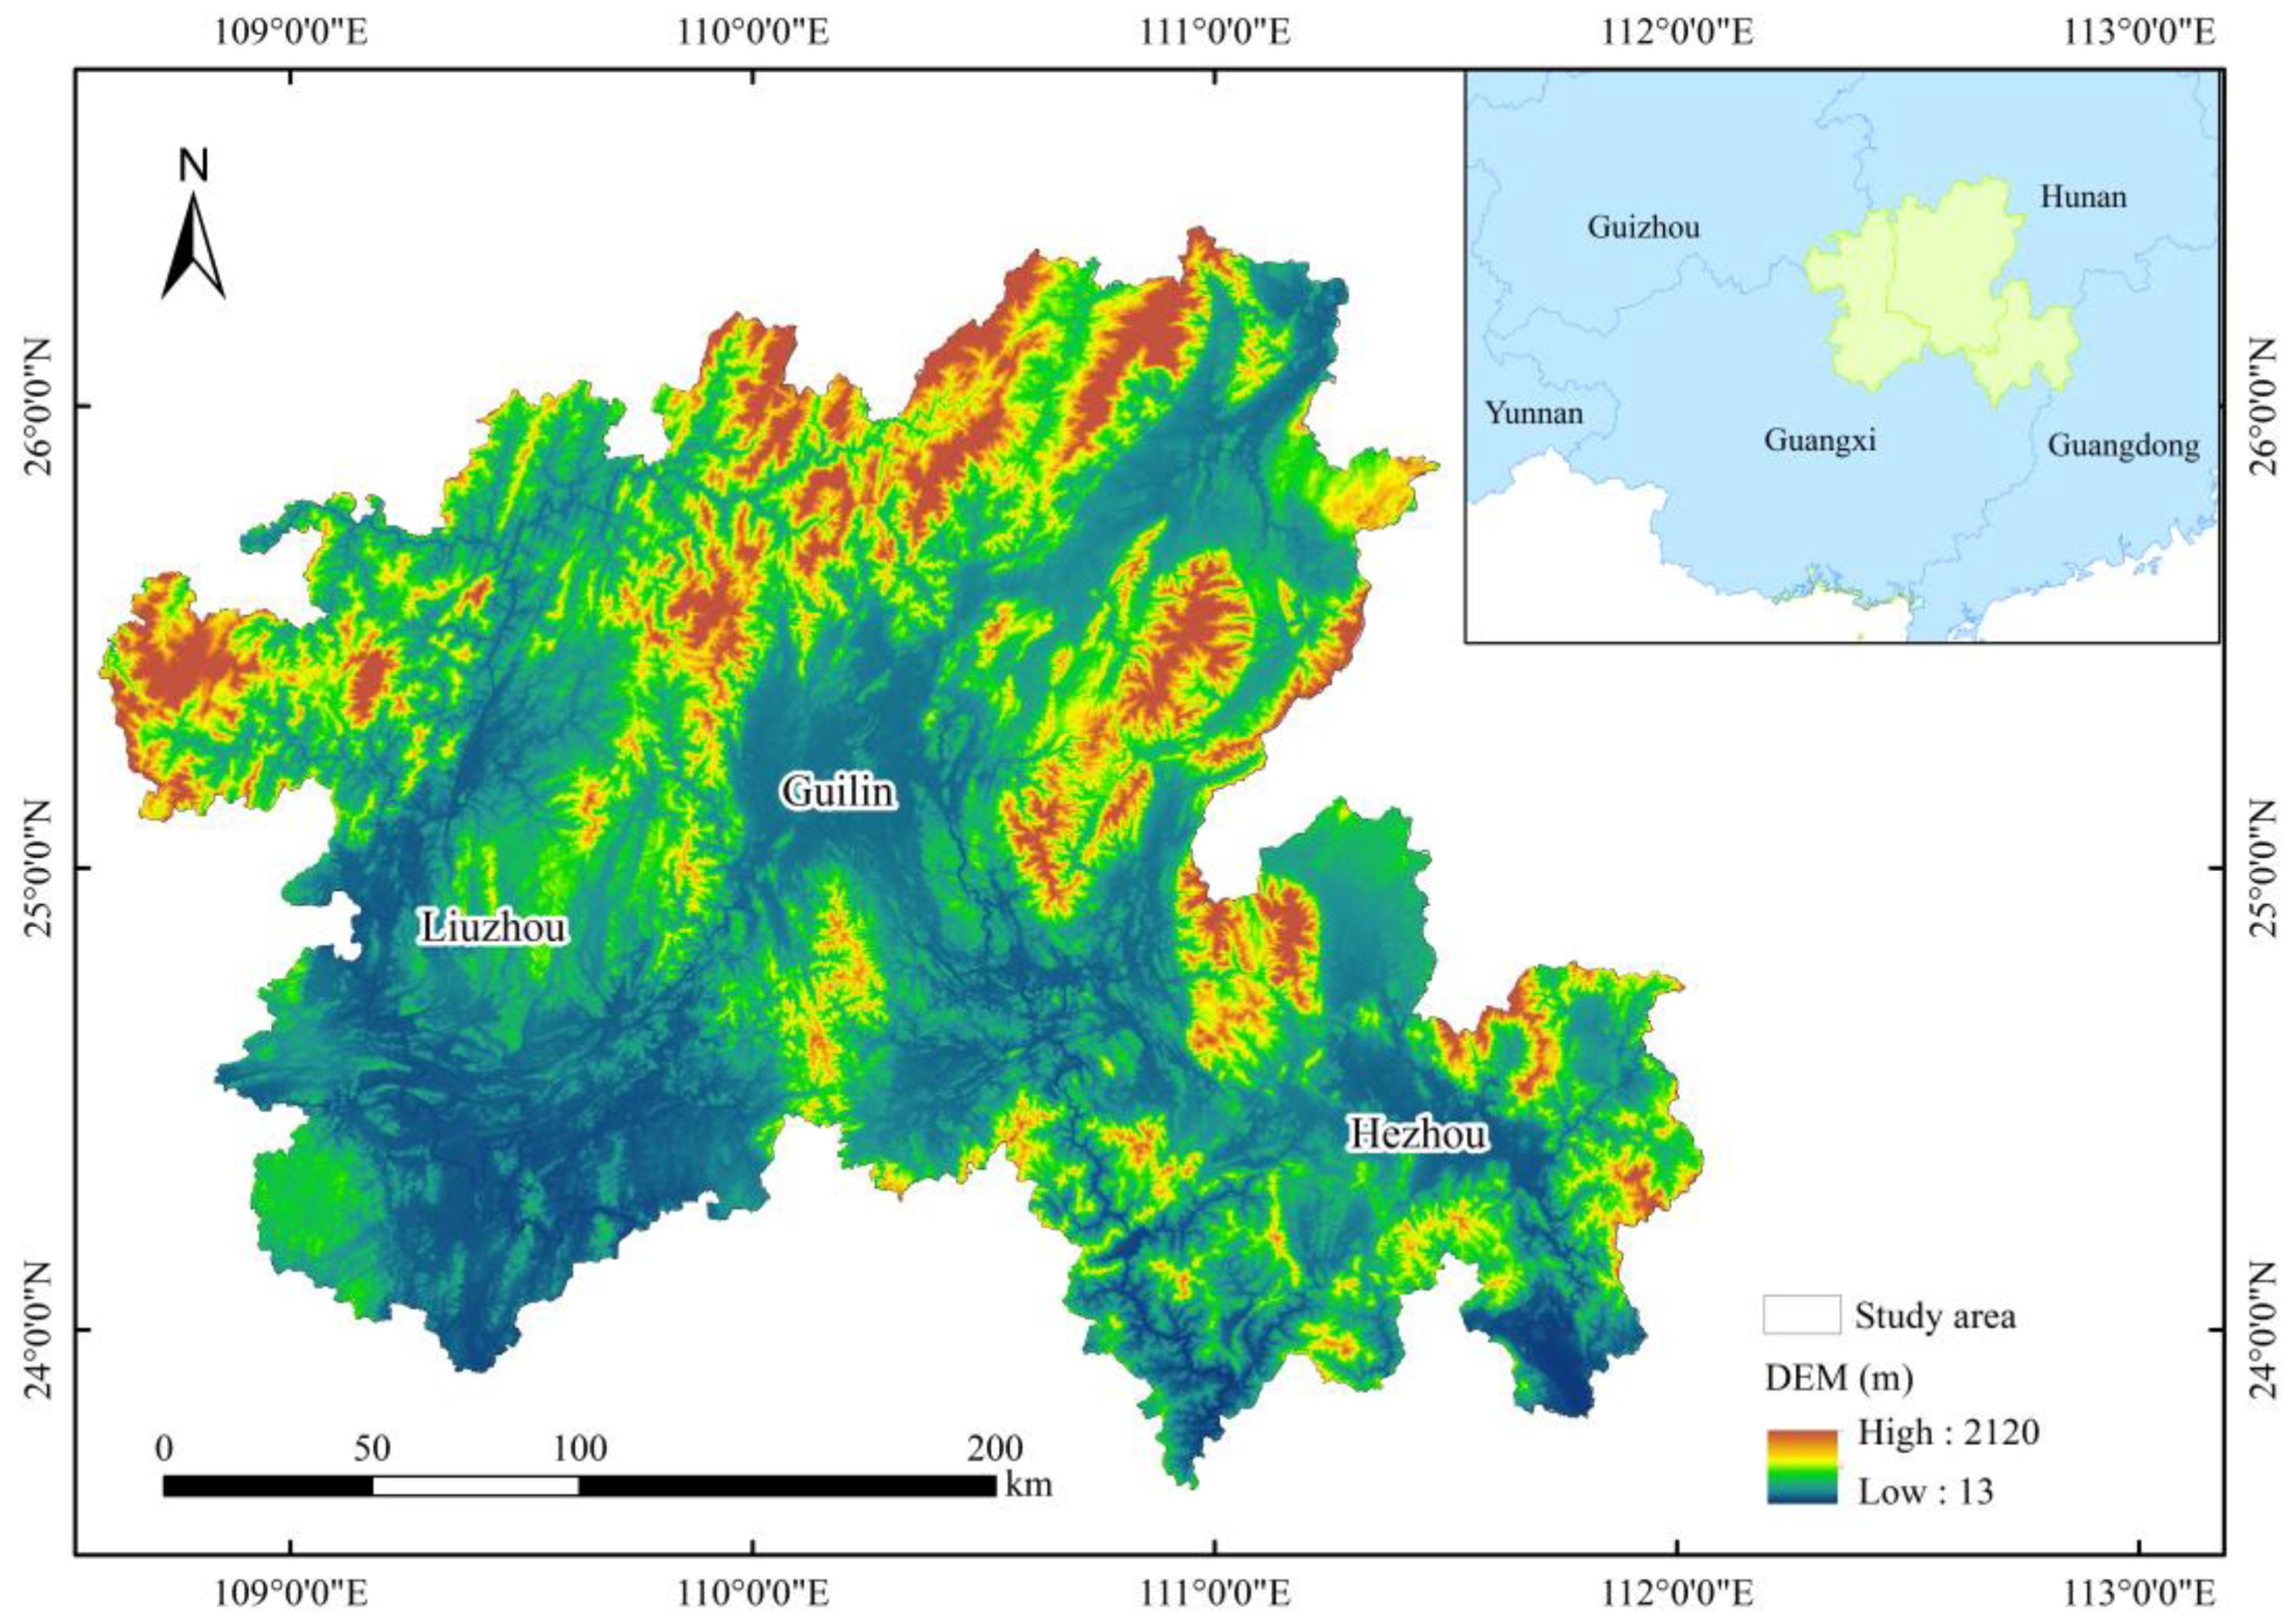
Figure 1. Location map of the study area. This map was created based on the standard map downloaded from the National Platform for Common GeoSpatial Information Services website (https://www.tianditu.gov.cn/ (accessed on 20 November 2024), see Supplementary Materials) with the review number GS (2024) 0650. The base map has not been modified. The same applies below.
Applsci 15 11485 g001
Figure 2. Changes in wetland area in different periods.
Applsci 15 11485 g002
Figure 3. Distribution of wetland landscape pattern in northern Guangxi from 1980 to 2020. (a) 1980. (b) 1990. (c) 2000. (d) 2010. (e) 2020.
Applsci 15 11485 g003
Figure 4. Dynamic map of wetland type area transfer in northern Guangxi from 1980 to 2020.
Applsci 15 11485 g004
Figure 5. Landscape pattern indices for the level of wetland types in northern Guangxi from 1980 to 2020.
Applsci 15 11485 g005
Figure 6. 10 km optimal spatial discretization.
Applsci 15 11485 g006
Figure 7. Results of two-factor interactive detection of wetland area change in northern Guangxi. Interaction types: * non-linear enhancement, ** dual-factor enhancement.
Applsci 15 11485 g007
Table 1. Data classification and sources.
ClassificationDataData Sources
Administrative division dataGuangxi provincial datasetNational Platform for Common Geospatial Information Services
https://www.tianditu.gov.cn (accessed on 20 November 2024) (see Supplementary Materials)
Land use dataLand use classification data in Northern Guangxi from 1980 to 2020 (30 m)Multi-period land use/land cover remote sensing monitoring database (CNLUCC) developed by Chinese Academy of Sciences (CAS)
https://www.resdc.cn (accessed on 22 November 2024)
Urban land use data (30 m)Extracted from land use data
Agricultural land data (30 m)
Natural environment dataElevation (90 m)Geospatial Data Cloud
https://www.gscloud.cn (accessed on 25 November 2024)
Slope (90 m)Generated by elevation
Normalised Difference Vegetation Index (90 m)Resource and Environmental Science Data Platform
https://www.resdc.cn (accessed on 22 November 2024)
The average annual temperature (1 km)
Vector boundary of national nature reserves (1 km)
Annual average precipitation (1 km)
Socio-economic dataPopulation (1 km)
GDP (1 km)
statistical dataList of National Nature ReservesMinistry of Ecology and Environment of the People’s Republic of China
https://www.mee.gov.cn (accessed on 3 December 2024)
Table 2. Table of wetland landscape types in northern Guangxi.
Primary TypeSecondary TypeBasic Characteristics
Natural wetlandsCoastal wetlandWetlands formed and replenished by open water bodies such as rivers, lakes and oceans. These include riparian wetlands and floodplain wetlands.
Lake wetlandLow-lying areas within enclosed water bodies such as lakes and reservoirs, temporarily or permanently covered by water no deeper than 2 m.
Constructed wetlandsReservoirsAn artificial wetland constructed primarily for water storage and power generation, with an area exceeding 8 hectares.
Irrigation channelsGullies and channels constructed primarily for irrigation purposes.
Paddy fieldsFarmland suitable for rice cultivation or for retaining water or remaining waterlogged during winter.
Table 3. Landscape type level index indicators and ecological significance.
Serial NumberIndicatorAbbreviationEcological SignificanceScope
1Aggregation indexAICalculate the clustering of individual plaque types at the type level.0 < AI ≤ 100
2Number of patchesNPThe total number of instances of a particular patch type within the landscape.NP ≥ 1
3Largest patch indexLPIThe dominant patches within the landscape extent; the magnitude of this index value can assist in determining the predominant patch types within the landscape.0 < LPI ≤ 100
4Percent of landscapePLANDPercentage of land cover area, also referred to as the proportion of land cover area, denotes the ratio of various land types to the total area, with the largest area constituting the primary landscape.0 < PLAND ≤ 100
5Interspersion juxtaposition indexLJICalculate the overall distribution of each plaque type at the typological level.0 < IJI ≤ 100
6Landscape shape indexLSIReflecting the variability of patches within the landscape.LSI > 1
Table 4. Landscape level index indicators and ecological significance.
Serial NumberIndicatorAbbreviationEcological SignificanceScope
1Patch densityPDThe fragmentation of patch types reflects the overall heterogeneity and fragmentation of the landscape, indicating the degree of heterogeneity per unit area within the landscape.PD > 1
2Edge densityEDThe total length of all patch boundaries within a landscape divided by the total area of that landscape reflects the complexity of boundary shapes.ED ≥ 0
3Landscape division indexDIVISIONMeasuring landscape separability, where a higher value indicates a greater degree of landscape separation.0 < DIVISION ≤ 100
4ContagionCONTAGThis describes the degree of aggregation or tendency towards extension among different patch types within a landscape, reflecting the spatial configuration characteristics of landscape components.0 < CONTAG ≤ 100
5Shannon’s diversity indexSHDIThis indicator reflects landscape heterogeneity, being particularly sensitive to the uneven distribution of patch types within a landscape, thereby emphasising the contribution of rare patch types to the information content.SHDI > 0
6Shannon’s evenness indexSHEIReflects the degree of spatial uniformity in the distribution of various patch types within a landscape type.0 ≤ SHEI ≤ 1
Table 5. Driving factors of spatial evolution in northern Guangxi.
Influencing FactorsImpact FactorData Source
Natural factors(X1) Average annual temperatureResource and Environmental Science Data Platform
https://www.resdc.cn (accessed on 22 November 2024)
(X2) Average annual precipitation
(X3) NDVI
Human factors(X4) Population
(X5) GDP
(X6) Change rate of urban land
(X7) Change rate of agricultural land
Policy factors(X8) Proportion of nature reservesMinistry of Ecology and Environment of the People’s Republic of China
https://www.mee.gov.cn (accessed on 3 December 2024)
Table 6. Structure of wetland landscape types in northern Guangxi from 1980 to 2020.
YearCostal WetlandLake WetlandPaddy FieldsReservoirsIrrigation Fields
Area/km2Proportion/%Area/km2Proportion/%Area/km2Proportion/%Area/km2Proportion/%Area/km2Proportion/%
198067.271.10.5405461.6188.93434.157.07177.812.9
199054.540.890.730.015454.3688.91441.397.19183.843
200057.520.940.730.015444.4588.84441.47.2184.023
201044.470.721.520.025424.1788.32449.997.33221.273.6
202051.720.851.430.025328.4387.7455.357.49238.873.93
1980–1990−12.73−0.210.190.01−7.25−0.027.240.126.030.1
1990–20002.980.0500−9.91−0.070.010.010.180
2000–2010−13.05−0.220.790.01−20.28−0.528.590.1337.250.6
2010–20207.250.13−0.090−95.74−0.625.360.1617.60.33
1980–2020−15.55−0.250.890.02−133.18−1.2321.20.4261.061.03
Table 7. Area transfer matrix of various land use types in northern Guangxi from 1980 to 2020.
19802020
Paddy FieldsReservoirsLake WetlandIrrigation FieldsCostal WetlandRoll-Out
Paddy fields/6.180.1811.671.7419.78
Reservoirs4.42/0.021.570.566.57
Lake wetland0.010.01/0.44/0.46
Irrigation fields0.900.070.33/20.4221.72
Costal wetland0.3914.67/27.76/42.82
Roll in5.7220.920.5341.4522.72/
Table 8. Landscape pattern index of wetland landscape levels in northern Guangxi from 1980 to 2020.
YearPDEDCONTAGDIVISIONSHDISHEI
19800.6726.1365.640.971.760.61
19900.6726.1666.220.961.720.60
20000.6726.1566.190.961.720.60
20100.6826.7366.470.961.740.59
20200.7027.1766.600.971.760.59
Table 9. Comparison of size effects of spatial units for q values and 90% quantile of driving factors.
Driving Factors5 km6 km7 km8 km9 km10 km
X10.480.480.460.510.510.50
X20.130.180.140.240.240.20
X30.030.020.050.030.030.04
X40.030.020.020.020.020.04
X50.220.230.220.250.250.24
X60.050.050.070.070.070.08
X70.020.020.020.040.040.01
X80.020.010.010.020.020.02
90th percentile of the q-value0.480.480.460.510.510.50
Table 10. Detection results of wetland area change factors in northern Guangxi.
Driving FactorsQ Statisticp ValueRank
(X1) Average annual temperature0.530.001
(X2) Average annual precipitation0.190.003
(X3) NDVI0.060.005
(X4) Population0.030.006
(X5) GDP0.240.002
(X6) Change rate of urban land0.080.004
(X7) Change rate of agricultural land0.030.017
(X8) Proportion of nature reserves0.020.988
Disclaimer/Publisher’s Note: The statements, opinions and data contained in all publications are solely those of the individual author(s) and contributor(s) and not of MDPI and/or the editor(s). MDPI and/or the editor(s) disclaim responsibility for any injury to people or property resulting from any ideas, methods, instructions or products referred to in the content.