Article

Evaluation of Railway Bridge Responses to Blast Vibrations and Earthquake Ground Motions Based on Numerical Simulation

1
Department of Civil Engineering, Kumoh National Institute of Technology, 61 Daehak-ro, Gumi 39177, Republic of Korea
2
Department of Civil and Environmental Engineering, Gachon University, 1342 Seongnam-daero, Sujeong-gu, Seongnam-si 13120, Republic of Korea
3
Department of Fire Safety Engineering and Disaster Management, University of Seoul, 163 Seoulsiripdae-ro, Dongdaemun-gu, Seoul 02504, Republic of Korea
*
Authors to whom correspondence should be addressed.
Appl. Sci. 2025, 15(21), 11479; https://doi.org/10.3390/app152111479
Submission received: 29 September 2025 / Revised: 21 October 2025 / Accepted: 24 October 2025 / Published: 27 October 2025
(This article belongs to the Special Issue Soil Dynamics and Earthquake Engineering)

Abstract

In this study, the dynamic responses of railway bridges generated by both blast motions and earthquakes are comparatively studied. A numerical model of a three-span continuous prestressed concrete (PSC) box girder bridge, a representative type of railway structure, was developed to investigate its dynamic performance. Dynamic analyses were conducted under two blast-induced ground motions and four earthquake ground motions, and the structural responses at the girder top were employed to evaluate the dynamic behavior of the railway bridge. The results indicate that the blast-induced bridge responses are relatively small compared to the earthquake-induced bridge responses (2–3% of the bridge response). This implies that the blast vibration limit provided in the Korean standard manual could be excessively conservative when applied to the railway bridges. Also, the results show that the blast vibration limit should be revisited, with a consideration of different structures and conditions.

1. Introduction

The two most well-known ground motions that provide dynamic loads to civil structures are blast-induced ground motions and earthquake ground motions. With the rapid expansion of underground space development, blasting has become an indispensable construction method for tunnels and deep excavations. Consequently, concerns have been raised regarding the impact of blast-induced vibrations on surface structures located near excavation sites. To address this issue, several international guidelines have been established. The U.S. Bureau of Mines (USBM) recommended a maximum allowable particle velocity of 50 mm/s and an air-blast overpressure limit of 0.5 psi based on extensive field studies [1]). Similarly, the German standard DIN 4150 [2] and other European codes provide vibration thresholds to prevent structural damage and human. In South Korea, the Underground Safety Impact Assessment Standard Manual stipulates an allowable vibration limit of 1 kine for general structures, while for operating high-speed railway lines, the threshold is even stricter, at 0.3 kine [3].
Most of the criteria for these guidelines were derived from empirical observations rather than from numerical structural response analysis. Furthermore, the response from the blast-induced vibration did not directly compare to responses from other ground motions, such as earthquakes. A growing body of literature has evaluated the effects of blast vibration on infrastructures. For instance, Che and Chi [4] investigated cyclic tunnel blasting near the Zhanma Tian bridge in Guizhou, China, using both field measurements and FLAC3D simulations. They reported deck vibration velocities of only 0.235 cm/s, indicating negligible structural impact. Likewise, Zhang et al. [5] highlighted that excessive blast vibration may cause geohazards such as landslides or deformation, though such cases typically involve exceedance of the threshold. Zhao et al. [6] examined subway tunnel blasting effects on railway ballast layers and concluded that while vibrations are detectable, they are considerably smaller compared to seismic excitations. Liu et al. [7] has conducted studied on the dynamic modeling of external vibration on railway vehicles and suggested a control strategy for vehicles. More recently, Guo et al. [8] emphasized that the frequency content of blast vibrations plays a critical role: high-frequency short-duration impulses differ fundamentally from low-frequency components of earthquake ground motions, which are more likely to resonate with large-scale structures.
By contrast, seismic fragility assessment and probabilistic performance evaluation of bridges have been extensively studied [9,10,11]. Recent papers have covered the seismic performance of bridges with pre-existing ground displacement [12], curved bridges [13], and arch bridges [14]. Also, the fragility assessment of bridges has been performed using technologies such as neural network [15] and machine learning [16]. Furthermore, the change in seismic performance due to the aging of structures has been studied [17,18]. These studies consistently show that long-period ground motions, such as those observed during the 1995 Kobe earthquake, tend to induce larger structural displacements compared with short-period events, such as the 2017 Pohang earthquake. However, direct comparisons between blast-induced and earthquake-induced ground motions of similar peak intensity are limited. This knowledge gap limits rational calibration of vibration thresholds, particularly for high-speed railway bridges, where overly conservative blast vibration limits may impose unnecessary constraints on construction/maintenance activities. Also, the direct calibration among vibration thresholds of different ground motions is required for structural engineers to understand the effect of different vibrations.
The objective of this study is to address this gap by conducting dynamic numerical simulations of a three-span continuous PSC box girder railway bridge subjected to both measured blast vibration records from tunnel construction in Seoul and representative earthquake ground motions (Kobe and Pohang). By scaling input motions to equivalent levels and systematically comparing the resulting displacement and velocity responses at multiple bridge locations, this research quantitatively clarifies the differences in structural responses between blasts and earthquakes. The findings provide not only a better scientific understanding of vibration characteristics but also practical implications for reassessing blast vibration criteria in the context of railway bridge safety.

2. Numerical Analysis Model

2.1. Determination of Analysis Model

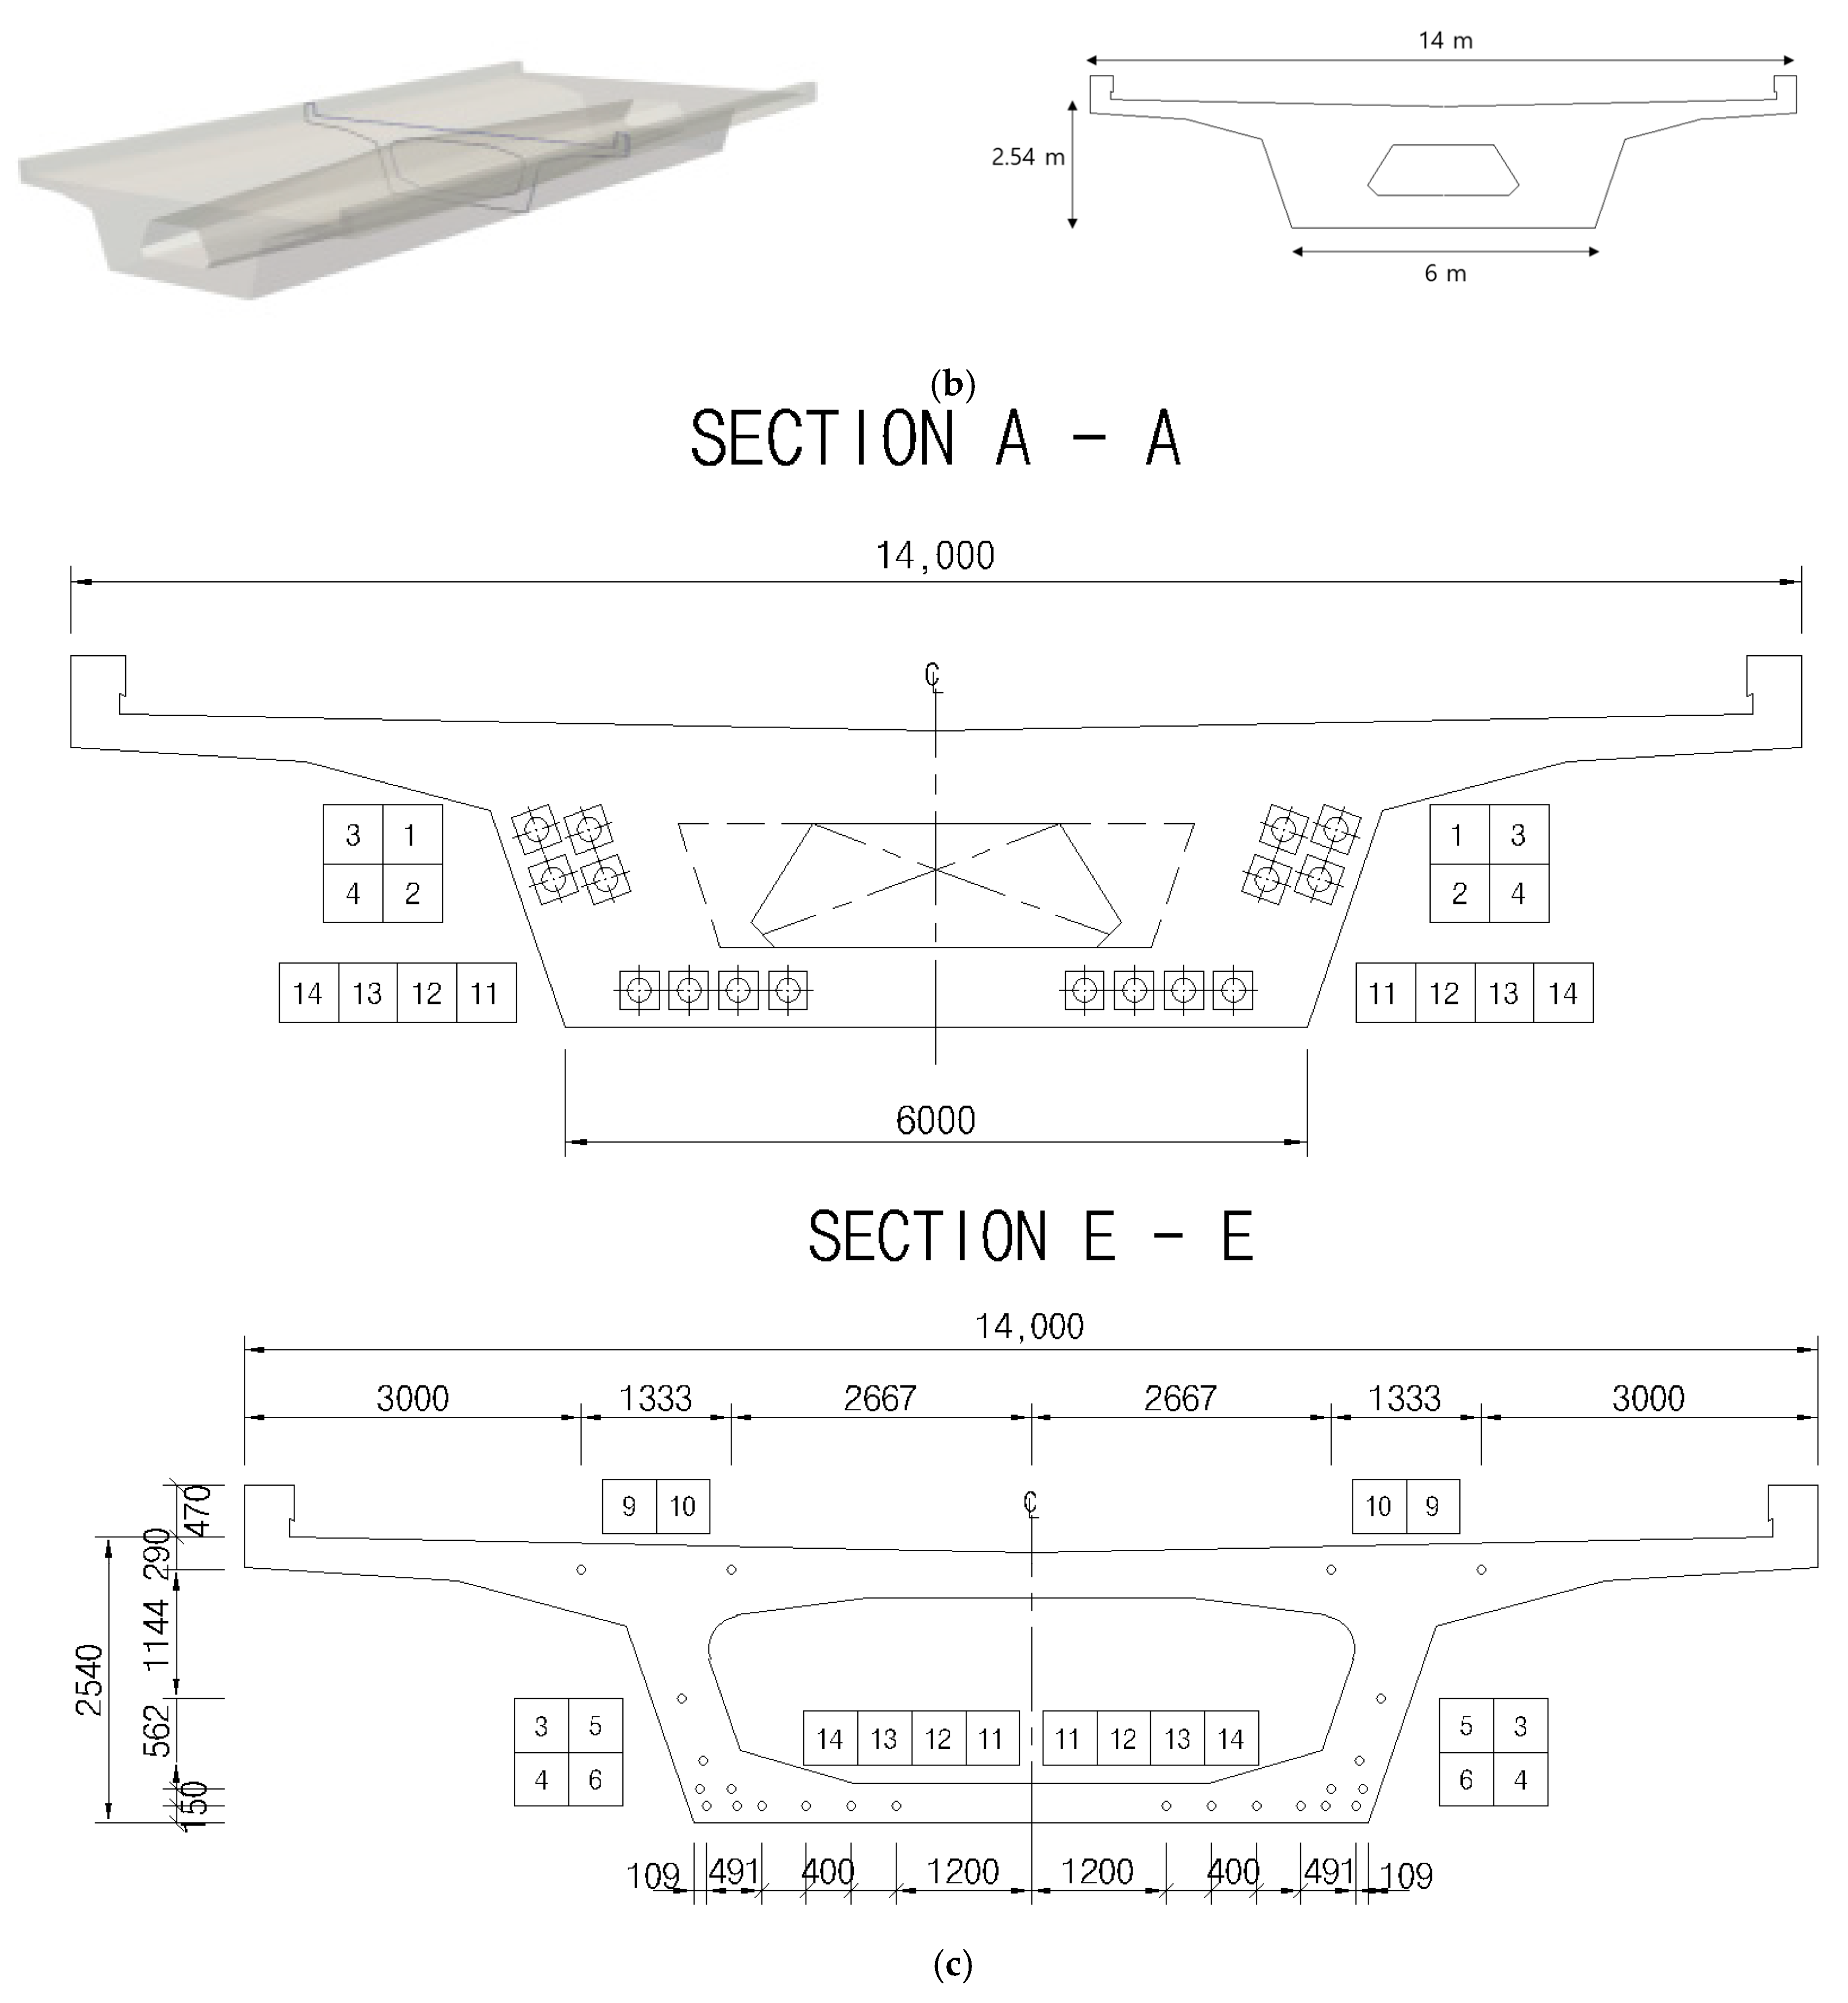
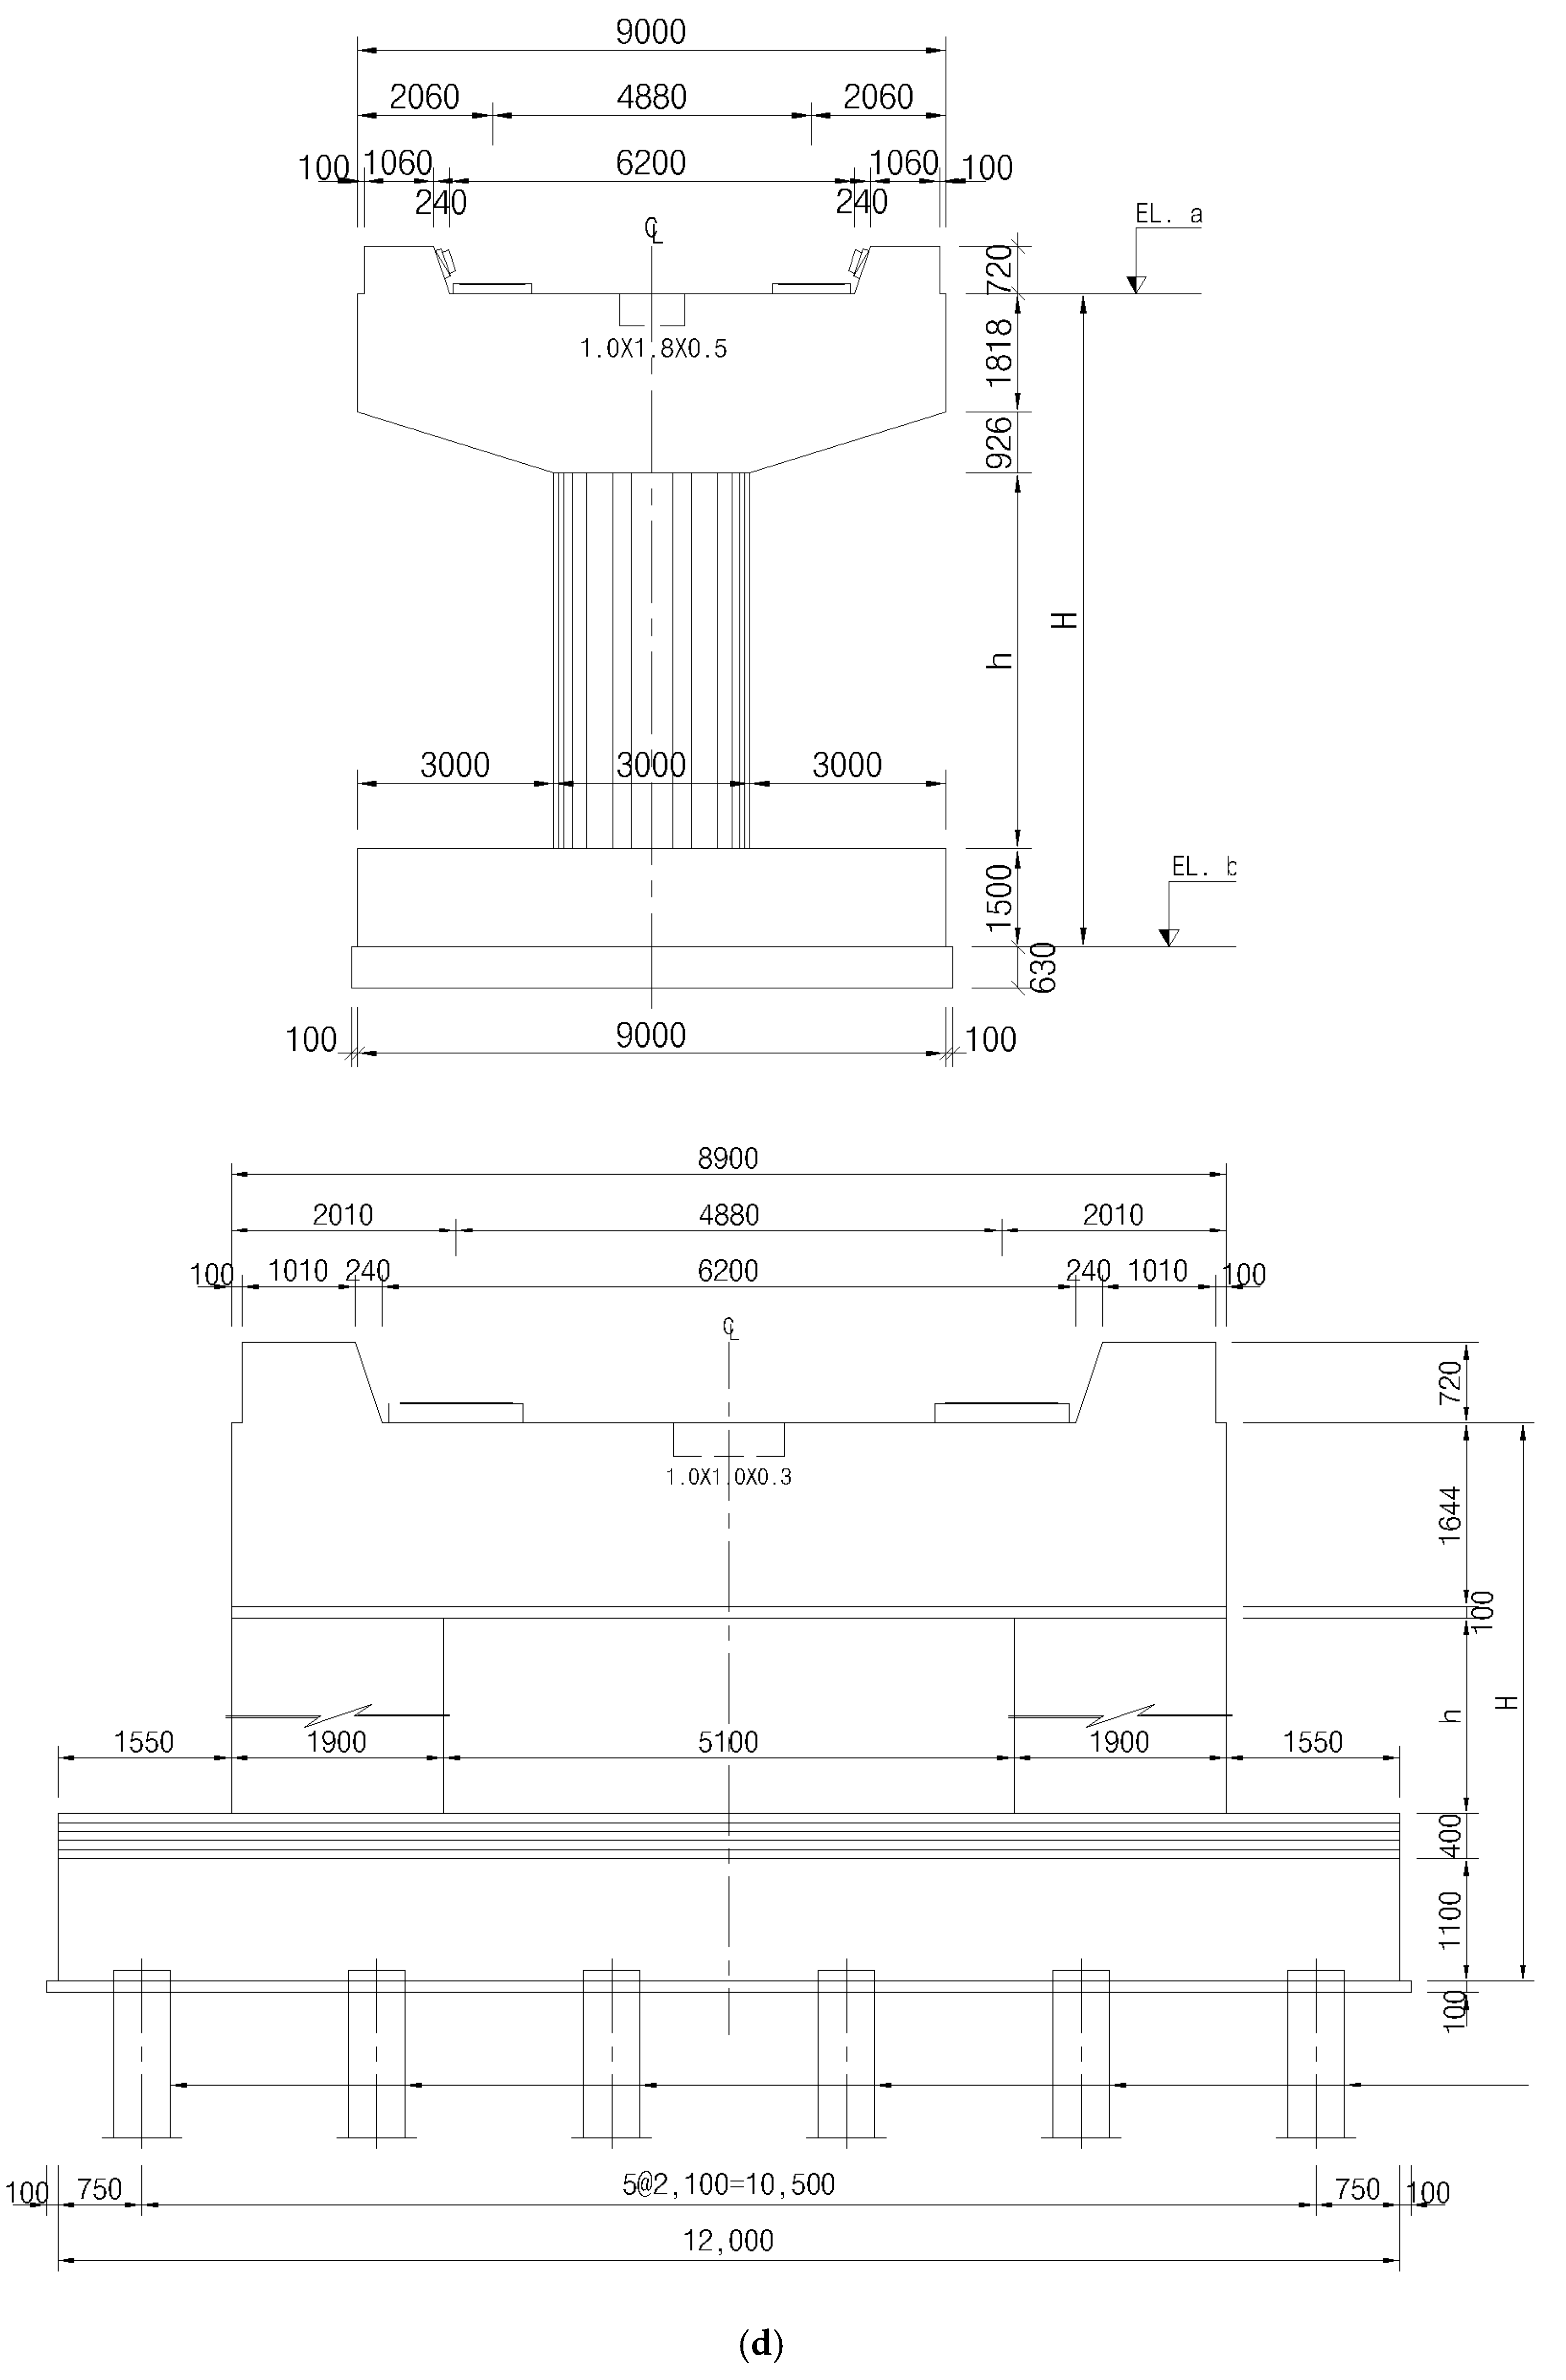
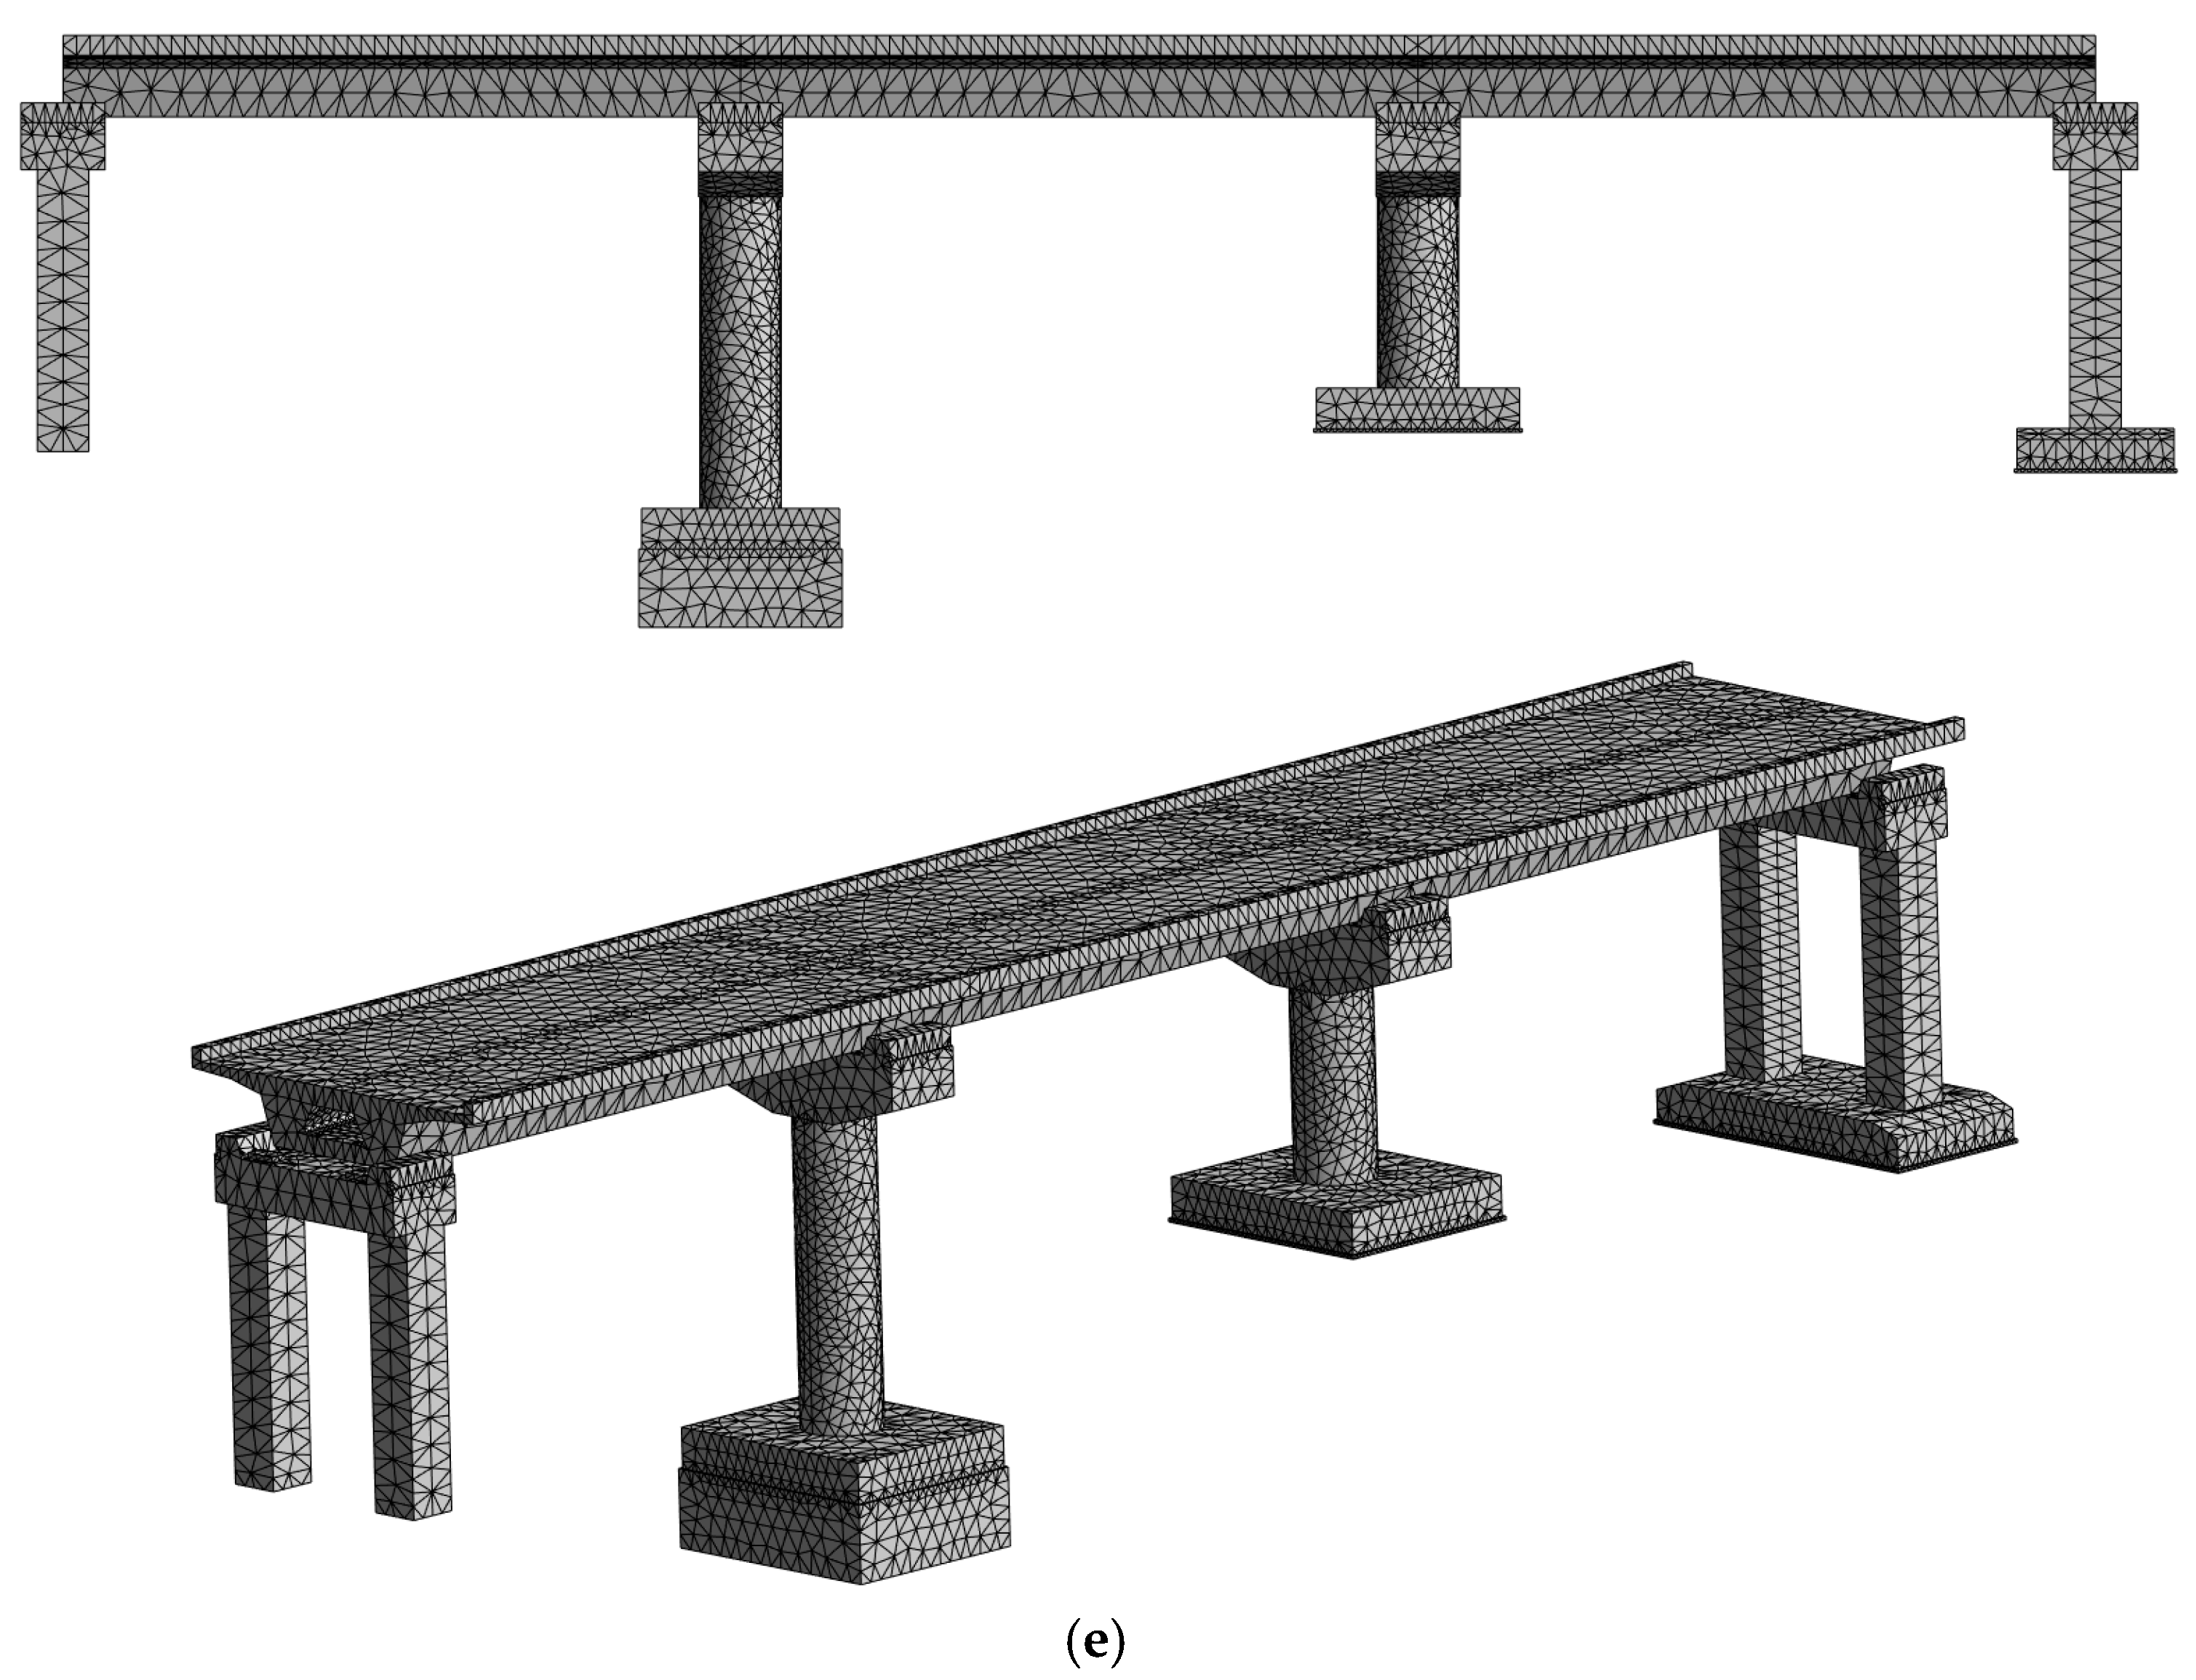
The dynamic responses of bridges from ground motions induced by either the blast or the earthquake were analyzed to study the compatibility of the guide on railway bridges. This study modeled a three-span continuous PSC box girder bridge (Figure 1a), which is frequently used in high-speed railway design in Korea. The superstructure is a non-prismatic box girder with a span arrangement of 25 m + 25 m + 25 m. The web thickness of the girder is larger at the sections near the support (Figure 1b,c). The width and height of the girder section are 14 m and 2.54 m, respectively. Piers are the prismatic concrete columns. The heights of piers #1-#4 are 12.14, 14.14, 9.80, and 11.29 m, respectively. Piers #1 and #4 are two rectangular columns connected to pile foundations, while piers #2 and #3 are circular columns connected to the spread foundations (Figure 1d). To consider the interaction between ground motions and structures only, the bottoms of all the piers are fixed (neglected soil–structure interaction). At the top of the girder, a distributed mass of 1 ton/m2 is added to consider the weight of the railway tracks (rails, plates, and blasts). In addition, half the weight of one span girder is loaded at both pier caps to demonstrate the mass properties of the continuous bridge. In this study, the bridge material is assumed to be linearly elastic. Although the tensile and compressive strengths of concrete are different, the prestressed system would improve the tensile strength capacity of the concrete. Furthermore, the study focuses on the difference in structural responses between the blast and the earthquake. The linear elasticity would be sufficient to see the difference. The material properties of the bridge model are in Table 1, which are the material properties of concrete with a compressive strength of 40 MPa, estimated based on the Korean concrete design standards. For the dynamic response simulation, the damping ratio of the structure is set to 5%, which is commonly used in domestic bridge design standards [19]. The mesh of the model is generated with a maximum size of 0.5 m (Figure 1e). The mesh is generated in ANSYS Mechanical with element order of the quadratic and target element quality of 0.05. The number of nodes, solid elements, and contact elements are 106,855, 58,308, and 2942, respectively. The volume and mass of the whole model are 2149 m3 and 5372 tons, respectively.

2.2. Numerical Analysis Condition

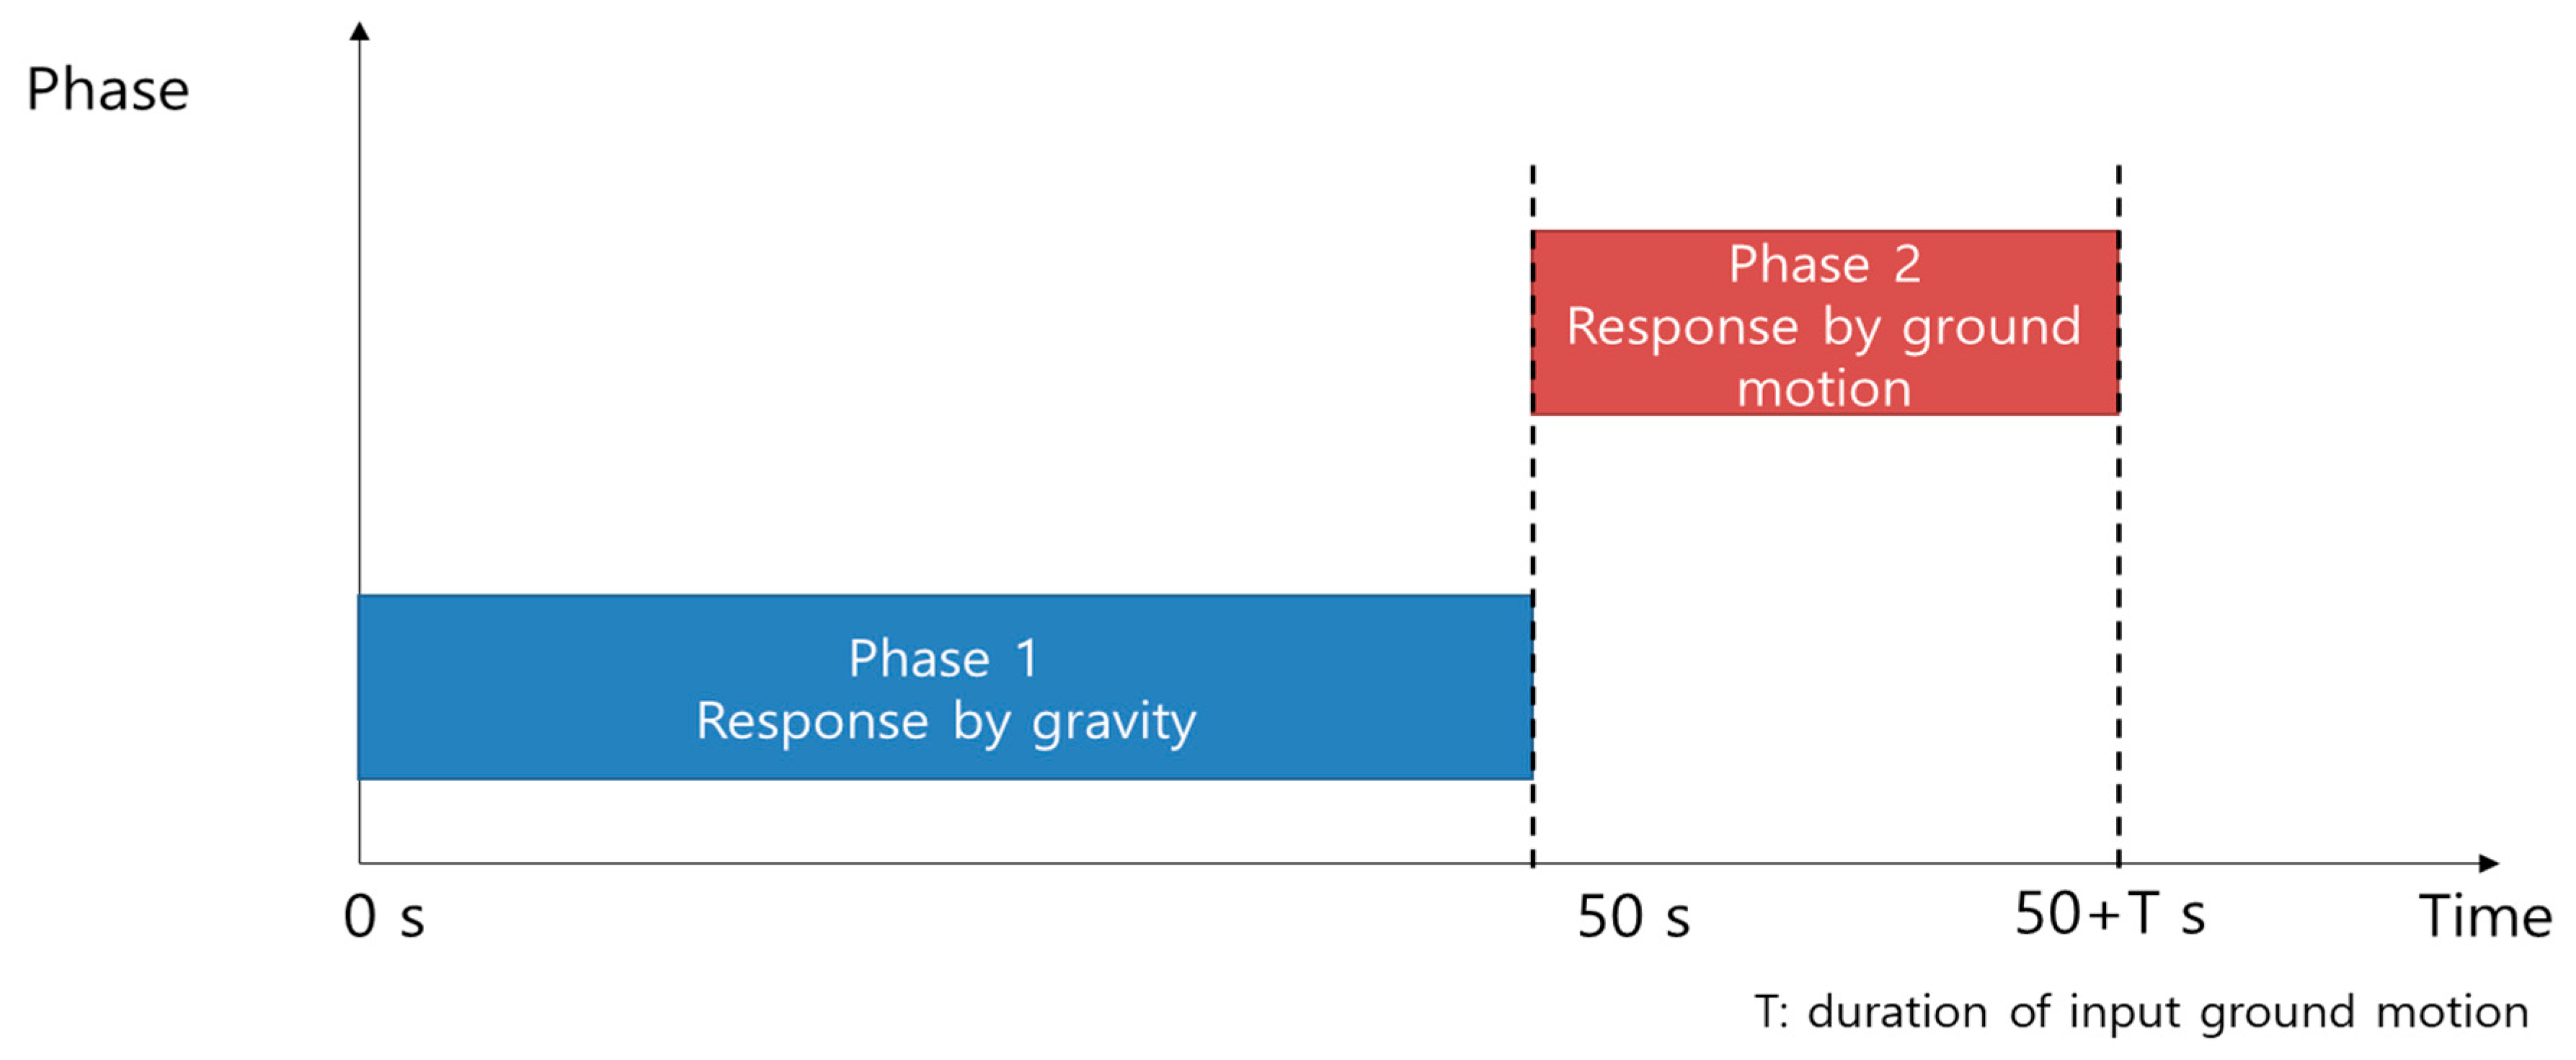
For the evaluation of dynamic responses, a two-phase analytical procedure was employed (Figure 2). At phase 1, a gravity-induced structural analysis of the bridge was first conducted to establish the baseline condition in the absence of seismic excitation. Transient vibrations were observed during the initial 10 s due to the application of gravitational loading; however, the system stabilized at around 50 s, at which point only the static response to gravity remained. A time step of 1 s was adopted in this phase, balancing computational efficiency and analysis accuracy. At phase 2, the dynamic response of the bridge’s underground motion was subsequently analyzed while the gravitational force remained as in phase 1. This configuration ensured that the bridge, which was already deformed under gravity, experienced the ground motion. This would provide a more realistic representation of the field conditions. The total analysis duration and the time increment varied according to the input ground motion. The analysis time increment was set to 0.01 s for earthquakes, while the time increment was set to 0.00025 s for blast-induced ground motion. Time increment values were fixed for each phase. The dynamic analysis was performed using the HHT (Hilber–Hughes–Taylor) time integration algorithm.
All analyses were performed using ANSYS Mechanical 2025 R1, a finite element platform extensively utilized in structural [20,21], thermal [22,23], and acoustic studies [24,25]. The software has also been widely applied in time-history [26,27] and nonlinear analyses [8,28]. In the present study, the transient structural analysis solver within ANSYS was adopted.
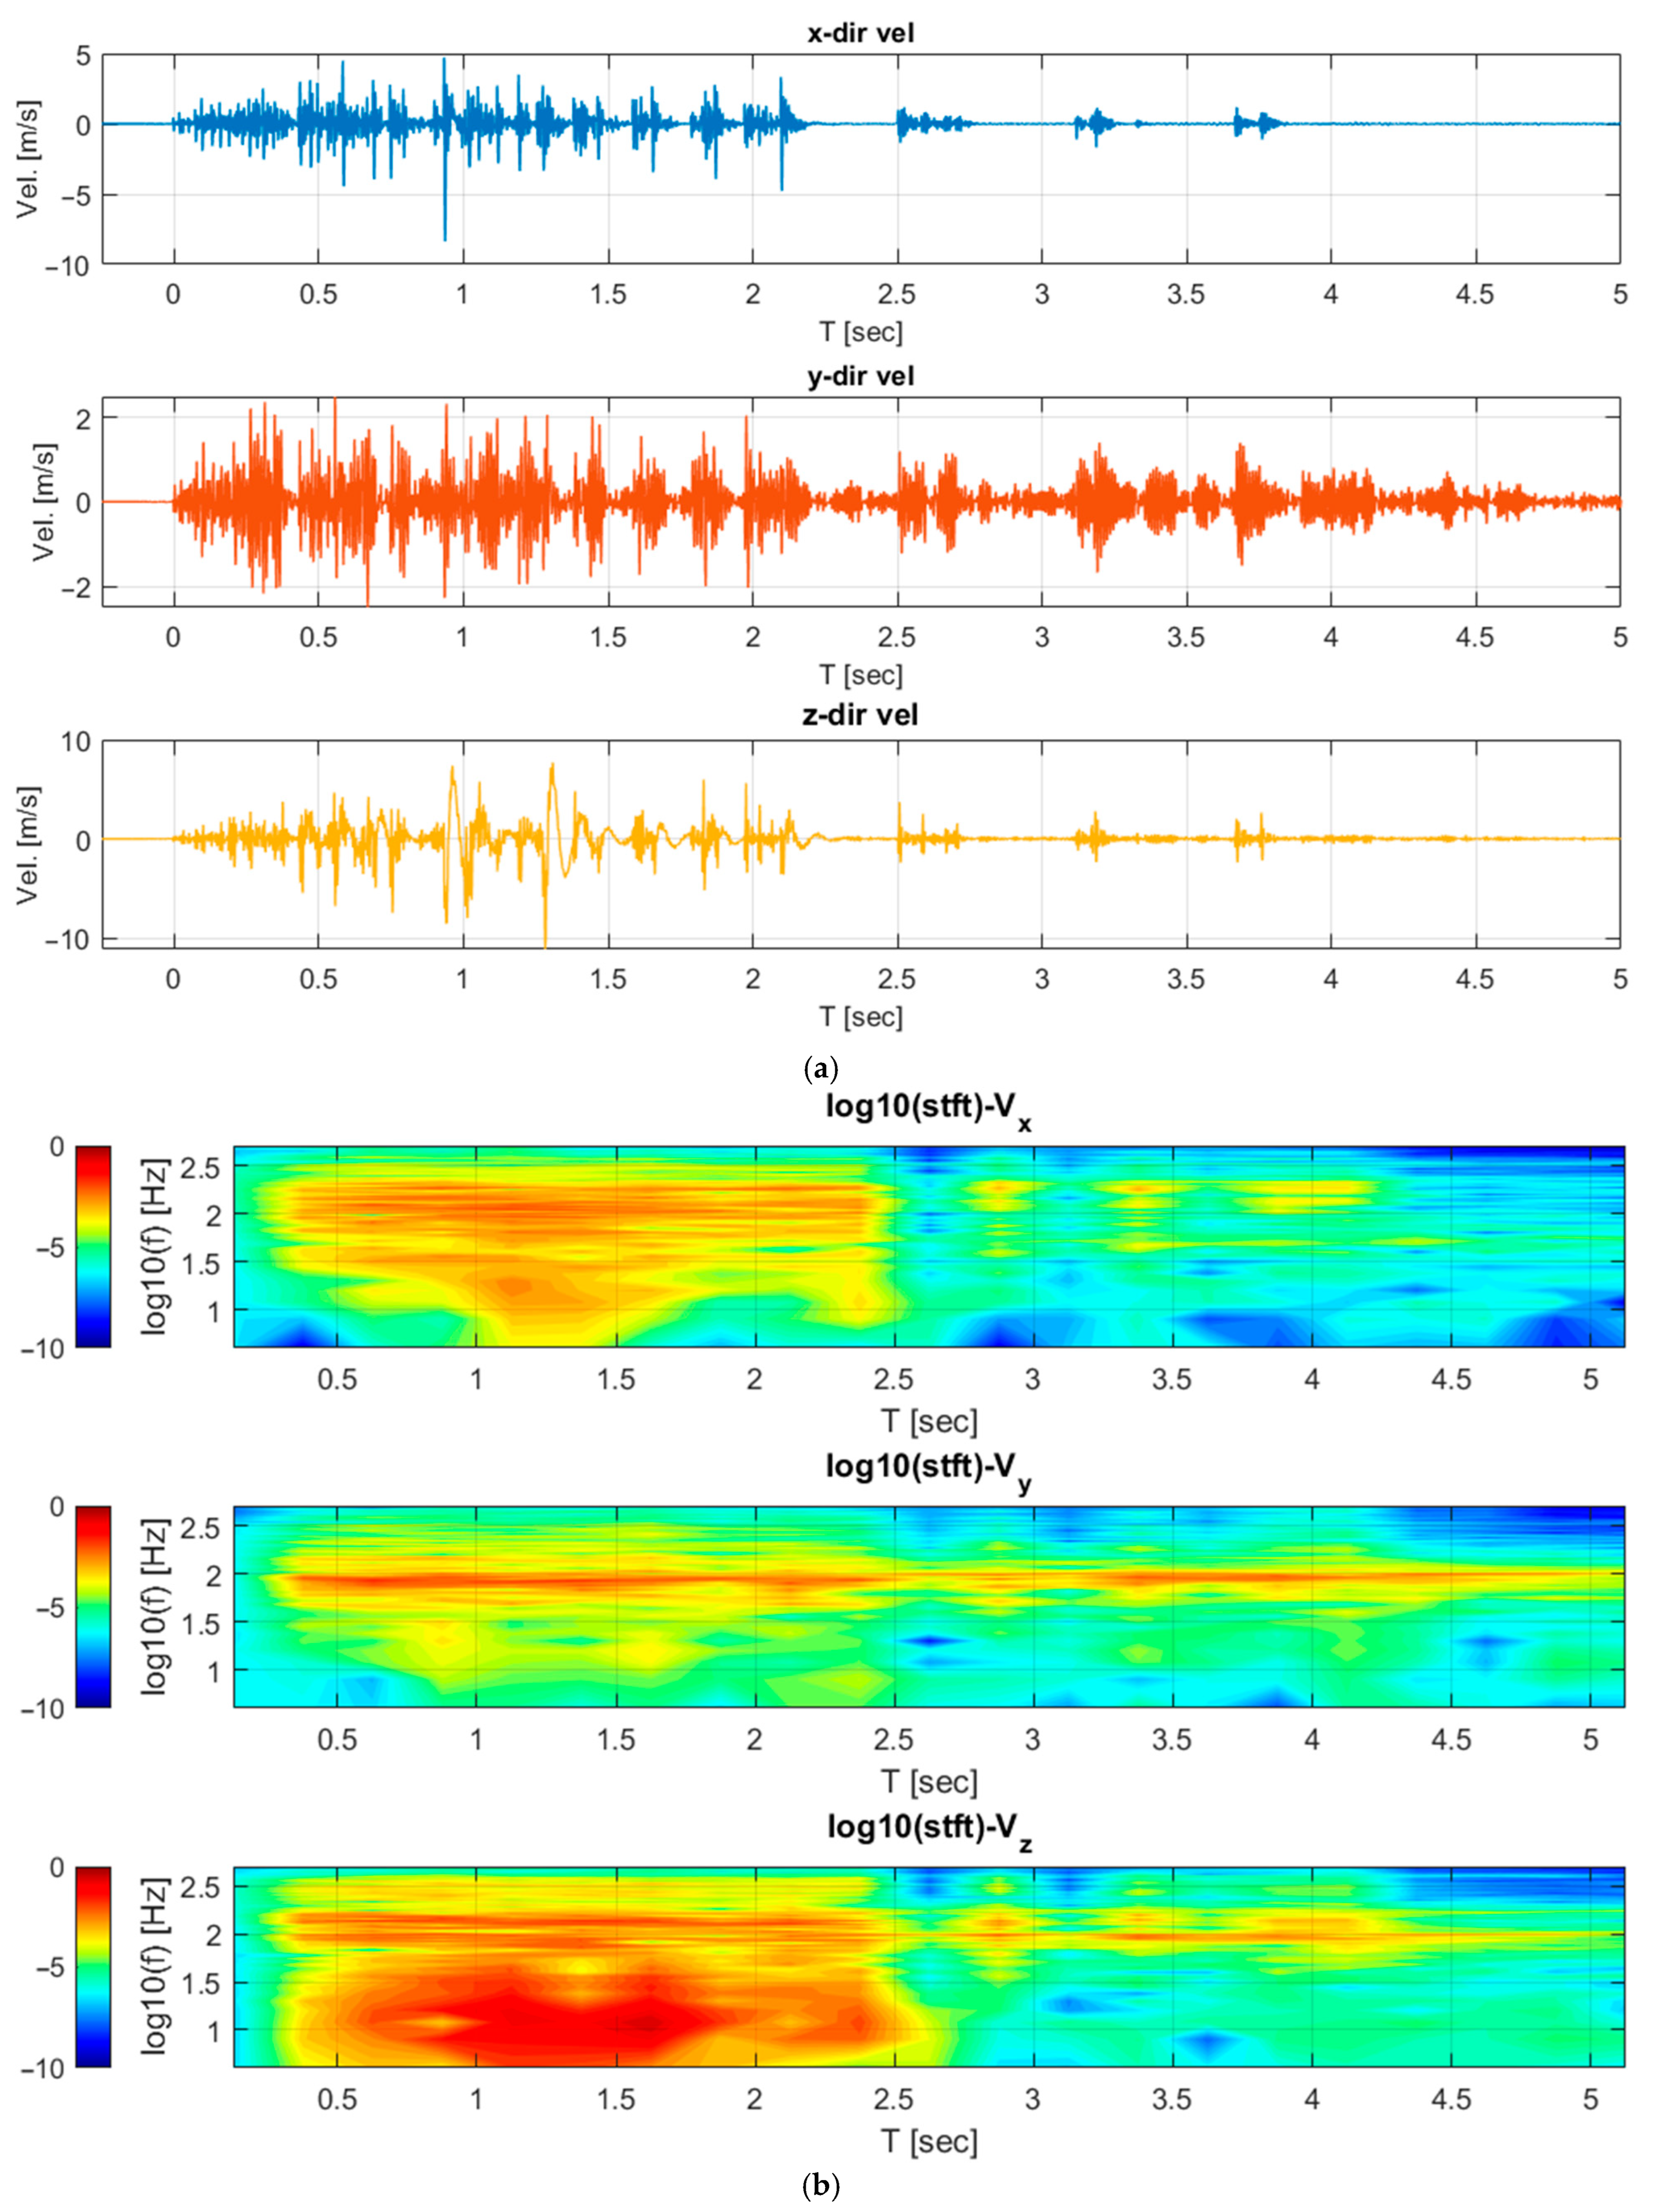
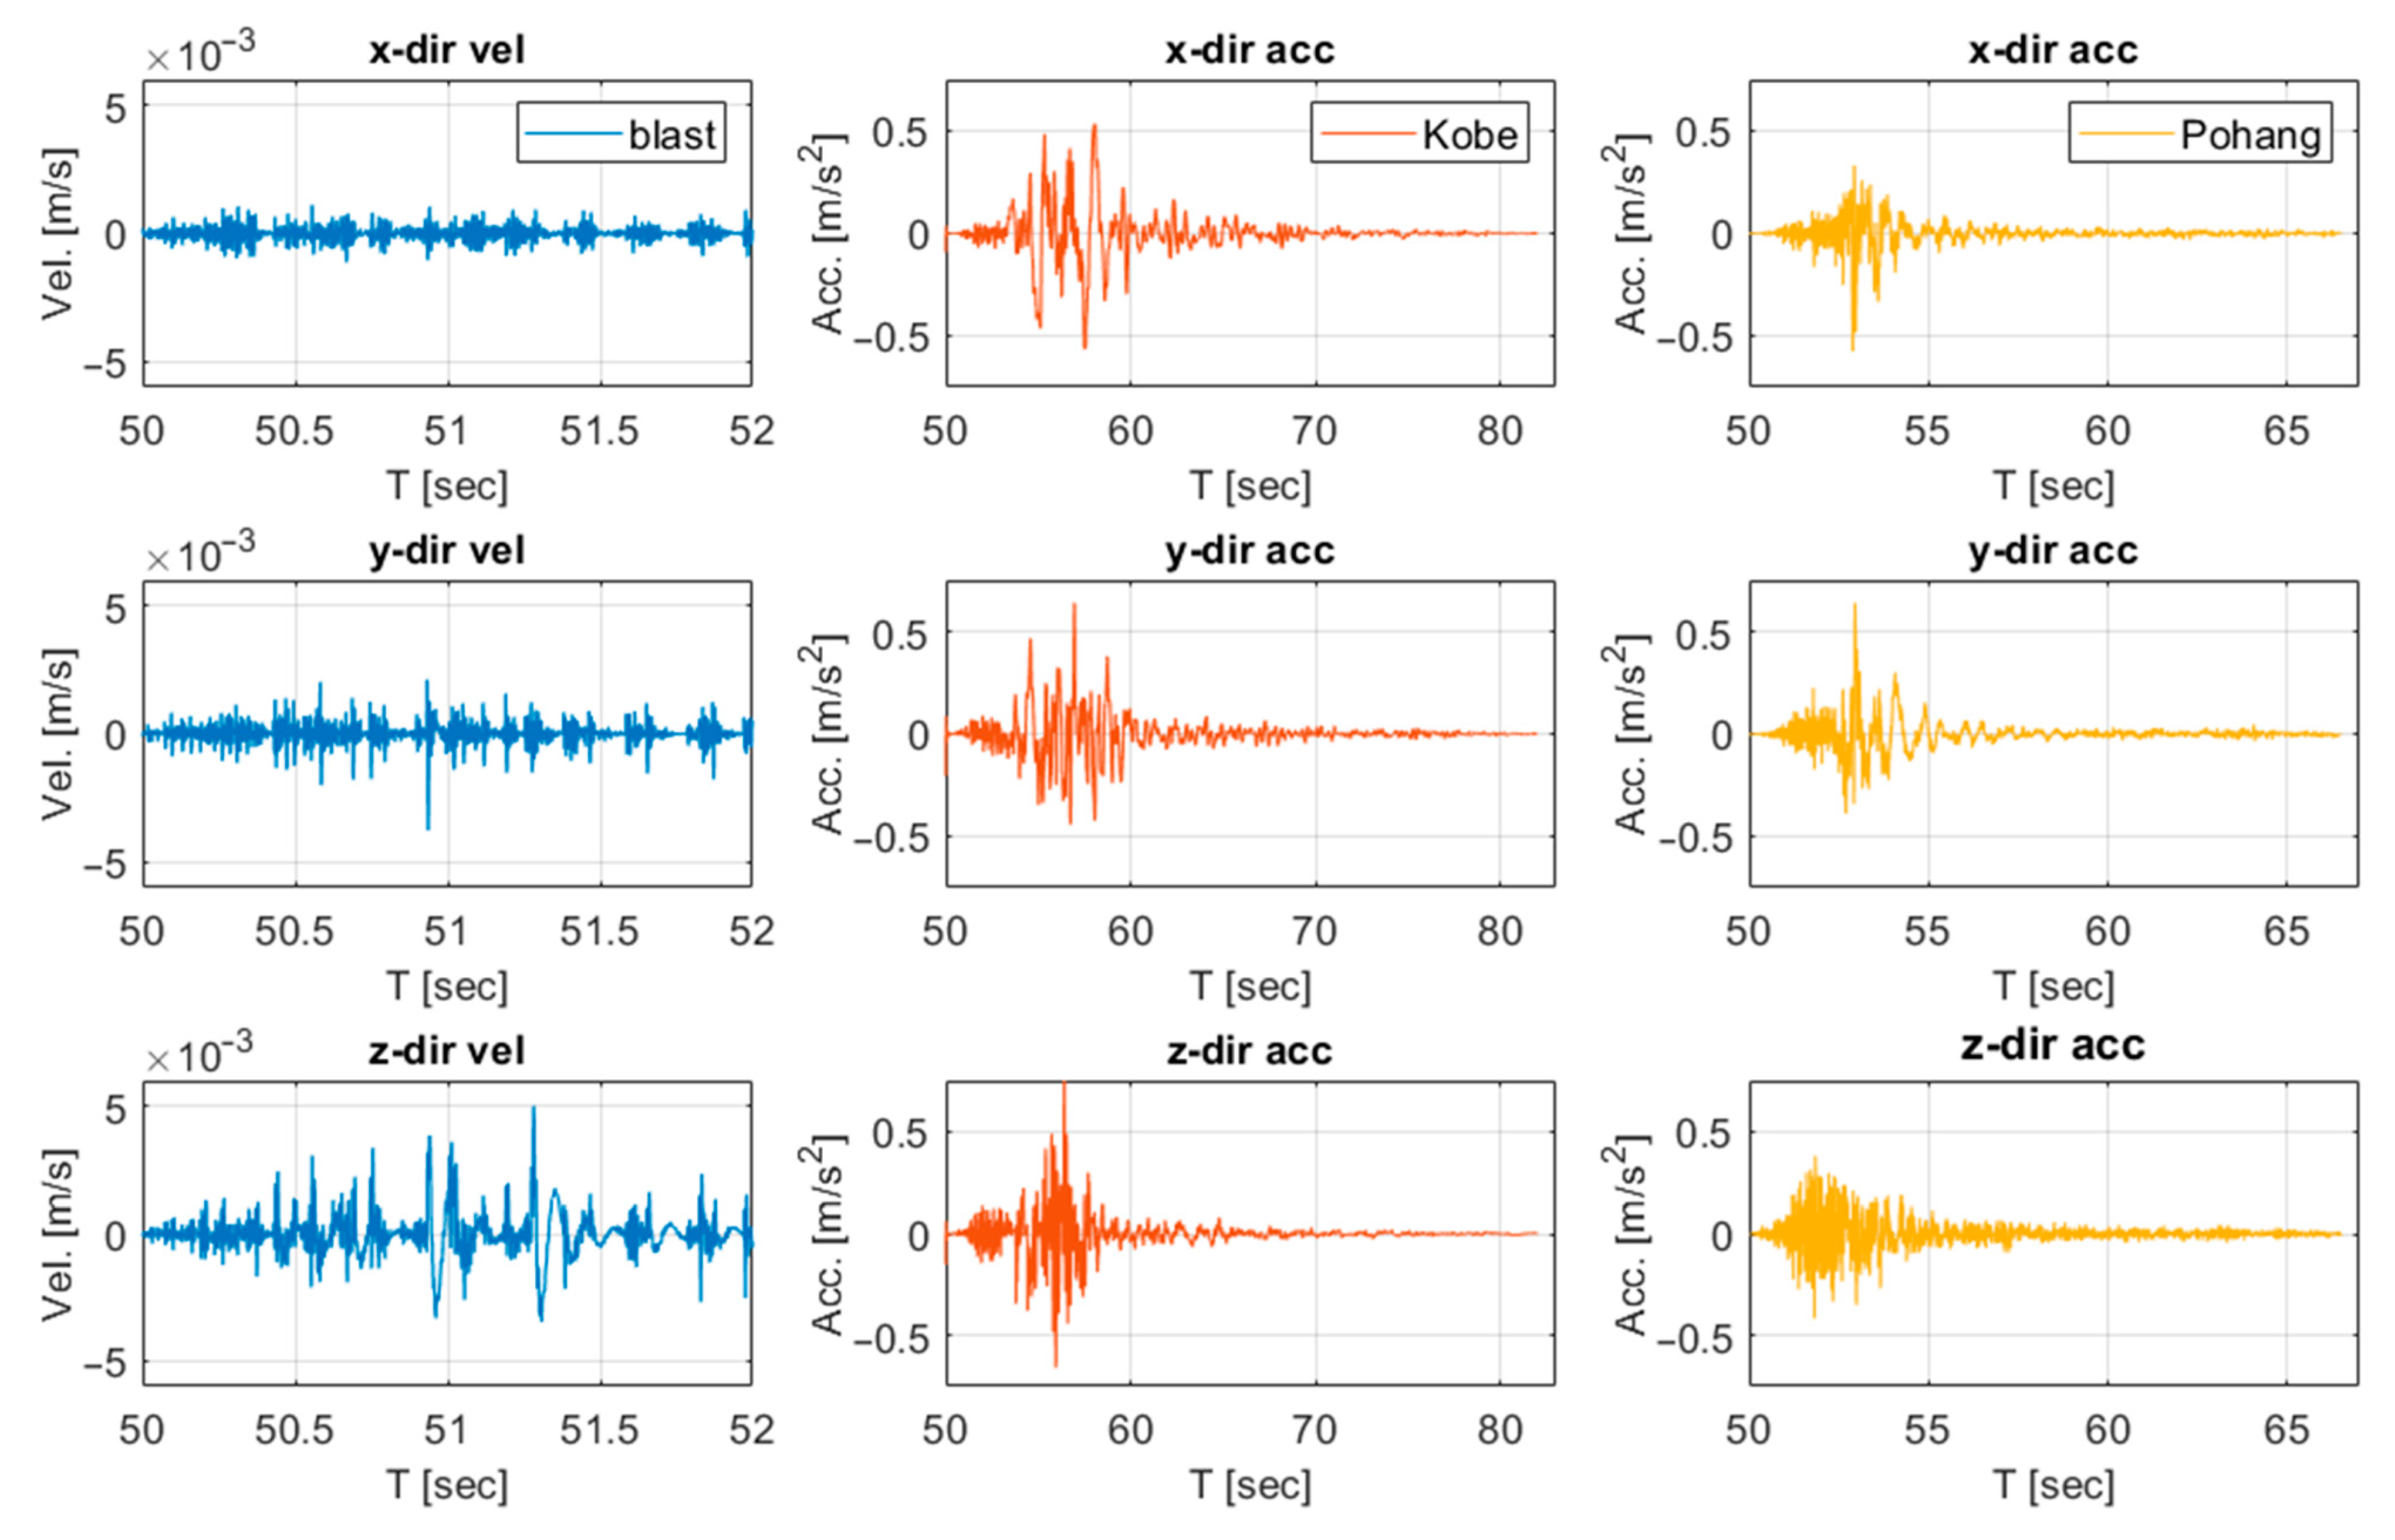
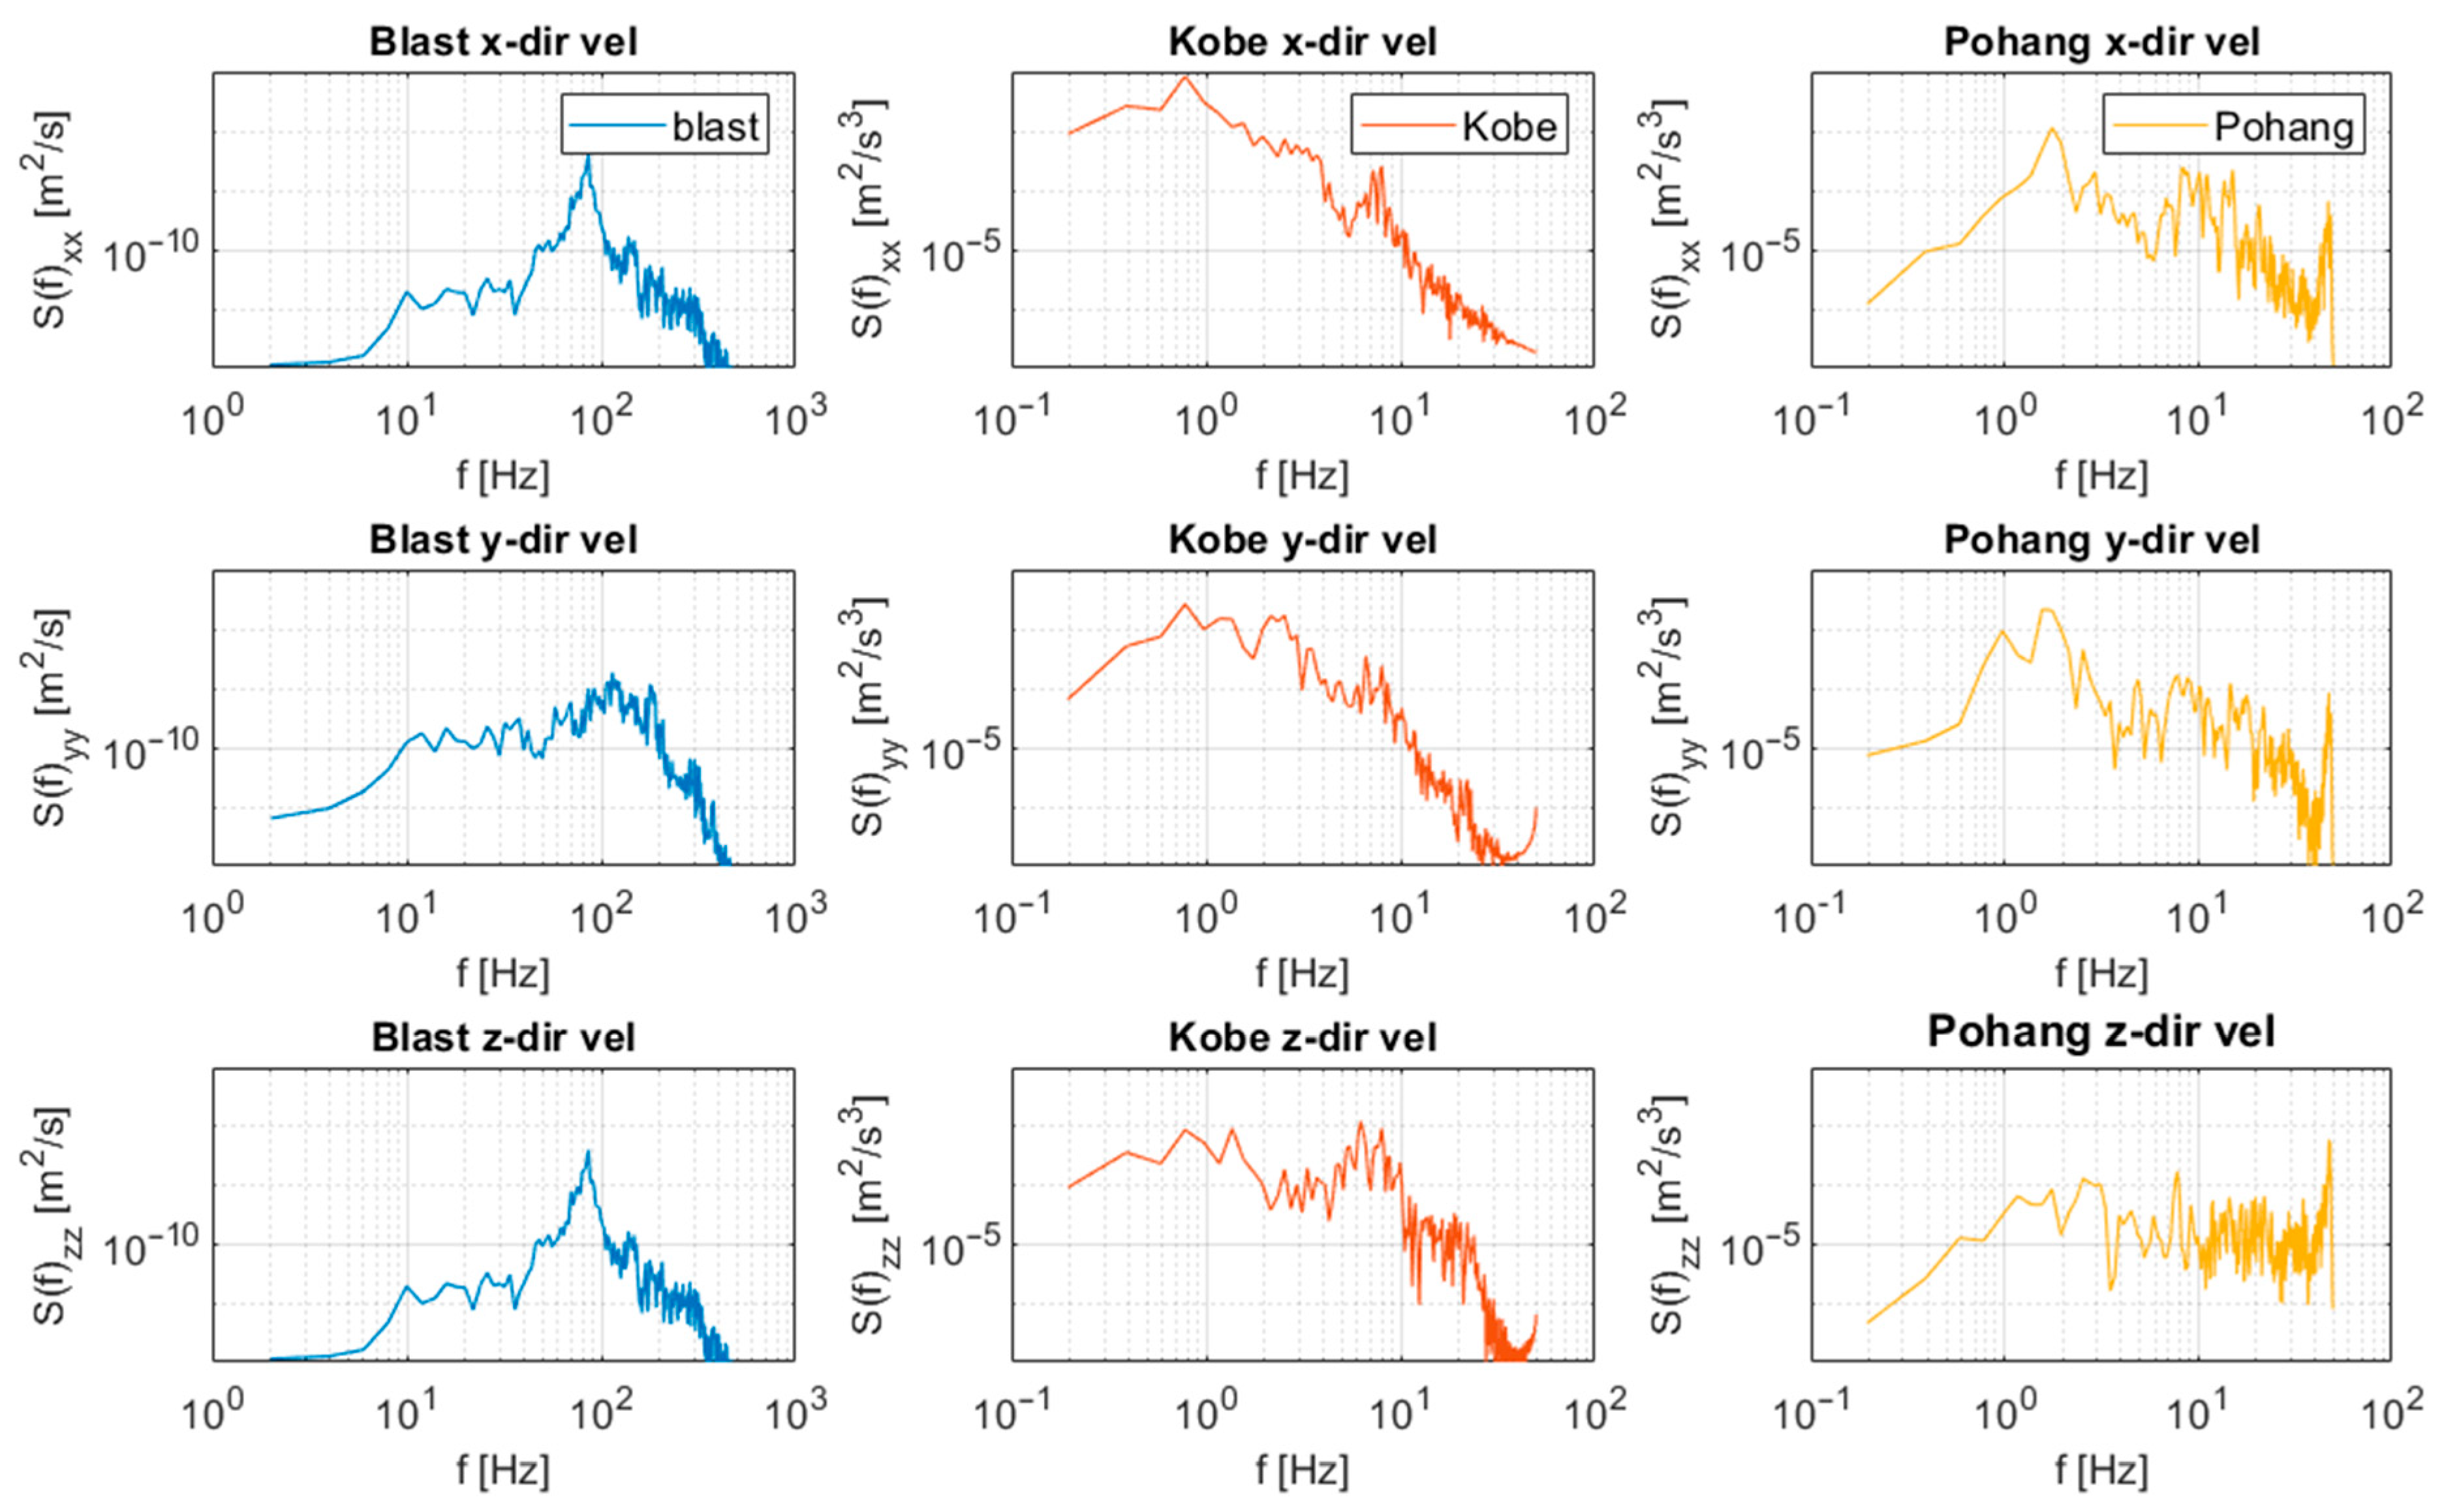
For the blast vibration, the blast velocity time series was measured from the test blasting (Figure 3). The test blasting was performed at 50 m under the ground. The measurement campaign was conducted at around 15 m laterally away from the blast point. Both the blast and the measurement were performed at weathered rock layers. For earthquake ground motions, the Kobe and Pohang earthquakes were used. The Kobe earthquake is a long-period seismic wave, while the Pohang earthquake is a short-period seismic wave. Previous studies have reported that recent major Korean earthquakes, such as the Gyeongju and Pohang events, are generally dominated by short-period components [29,30]. From these datasets, structural responses to both long- and short-period earthquake ground motion could be evaluated. To properly compare the structural responses from blasts and earthquakes, all the time series must be appropriately scaled. Based on the report [31], which presents equivalent peak ground acceleration values of earthquakes for different peak velocity values of blast, blast ground motions with maximum velocities of 0.5 and 1 kine are equivalent to earthquake ground motions with peak ground acceleration of 0.064 g and 0.128 g, respectively. Since the vertical component of the blast-induced ground motions shows the highest energy and peak values, the velocity time series of the vertical component is scaled to show the value, and the same scale factors are applied to the other velocity time series. The earthquake ground motions are scaled to see the previous peak ground acceleration values (Table 2). In the table, the time series in same group (A or B) are the equivalent motions mentioned above. The lateral components of the earthquake ground motions are scaled to show the acceleration, and the same scale factors are applied to other components of the ground motion. Figure 4 shows the scaled time series for the ground motions. Figure 5 presents the power spectral densities (PSDs) of the input motions. The peak values of the x- and z-direction blast ground motions are around 84 Hz. For the y-direction, the relatively high energy level is seen around frequency bands of 80 to 150 Hz. Compared to the blast, the earthquake ground motions show different frequency domain characteristics. Both earthquake motions show relatively high energy levels at around 1 Hz. At frequency bands of 2 to 5 Hz, the Kobe earthquake shows relatively smaller energy differences from the peak, while the Pohang earthquake shows relatively larger differences. At the frequency range below 1 Hz, the Kobe earthquake contains high energy levels, while Pohang earthquake does not. This is due to the relatively short period of the Pohang earthquake.
After scaling the earthquake acceleration time series, these time series are converted to the velocity time series. This is carried out in order to apply the same boundary conditions (velocity support conditions) to all cases. First, the acceleration time series is integrated at each time step. After the integration, the resultant velocity time series were checked. Compared to the velocity time series of the Pohang earthquake, the velocity time series of the Kobe earthquake had an offset issue. The velocity time series after the main vibrations show the constant positive/negative values (not zero), and they were relatively larger. This behavior indicates that the displacement after the main vibration continuously increased/decreased, which is not realistic. To solve the issue, the offsets of the velocity time series are adjusted, and a bandpass filter is applied to the time series. The filter is applied to exclude energy below 1 Hz and energy above 100 Hz, which is not critical for the structural response of the bridges. Finally, the velocity time series are applied at the bottom of the bridge. The x, y, z-direction time series are applied in the longitudinal, lateral, and vertical directions, respectively.

3. Numerical Analysis Results

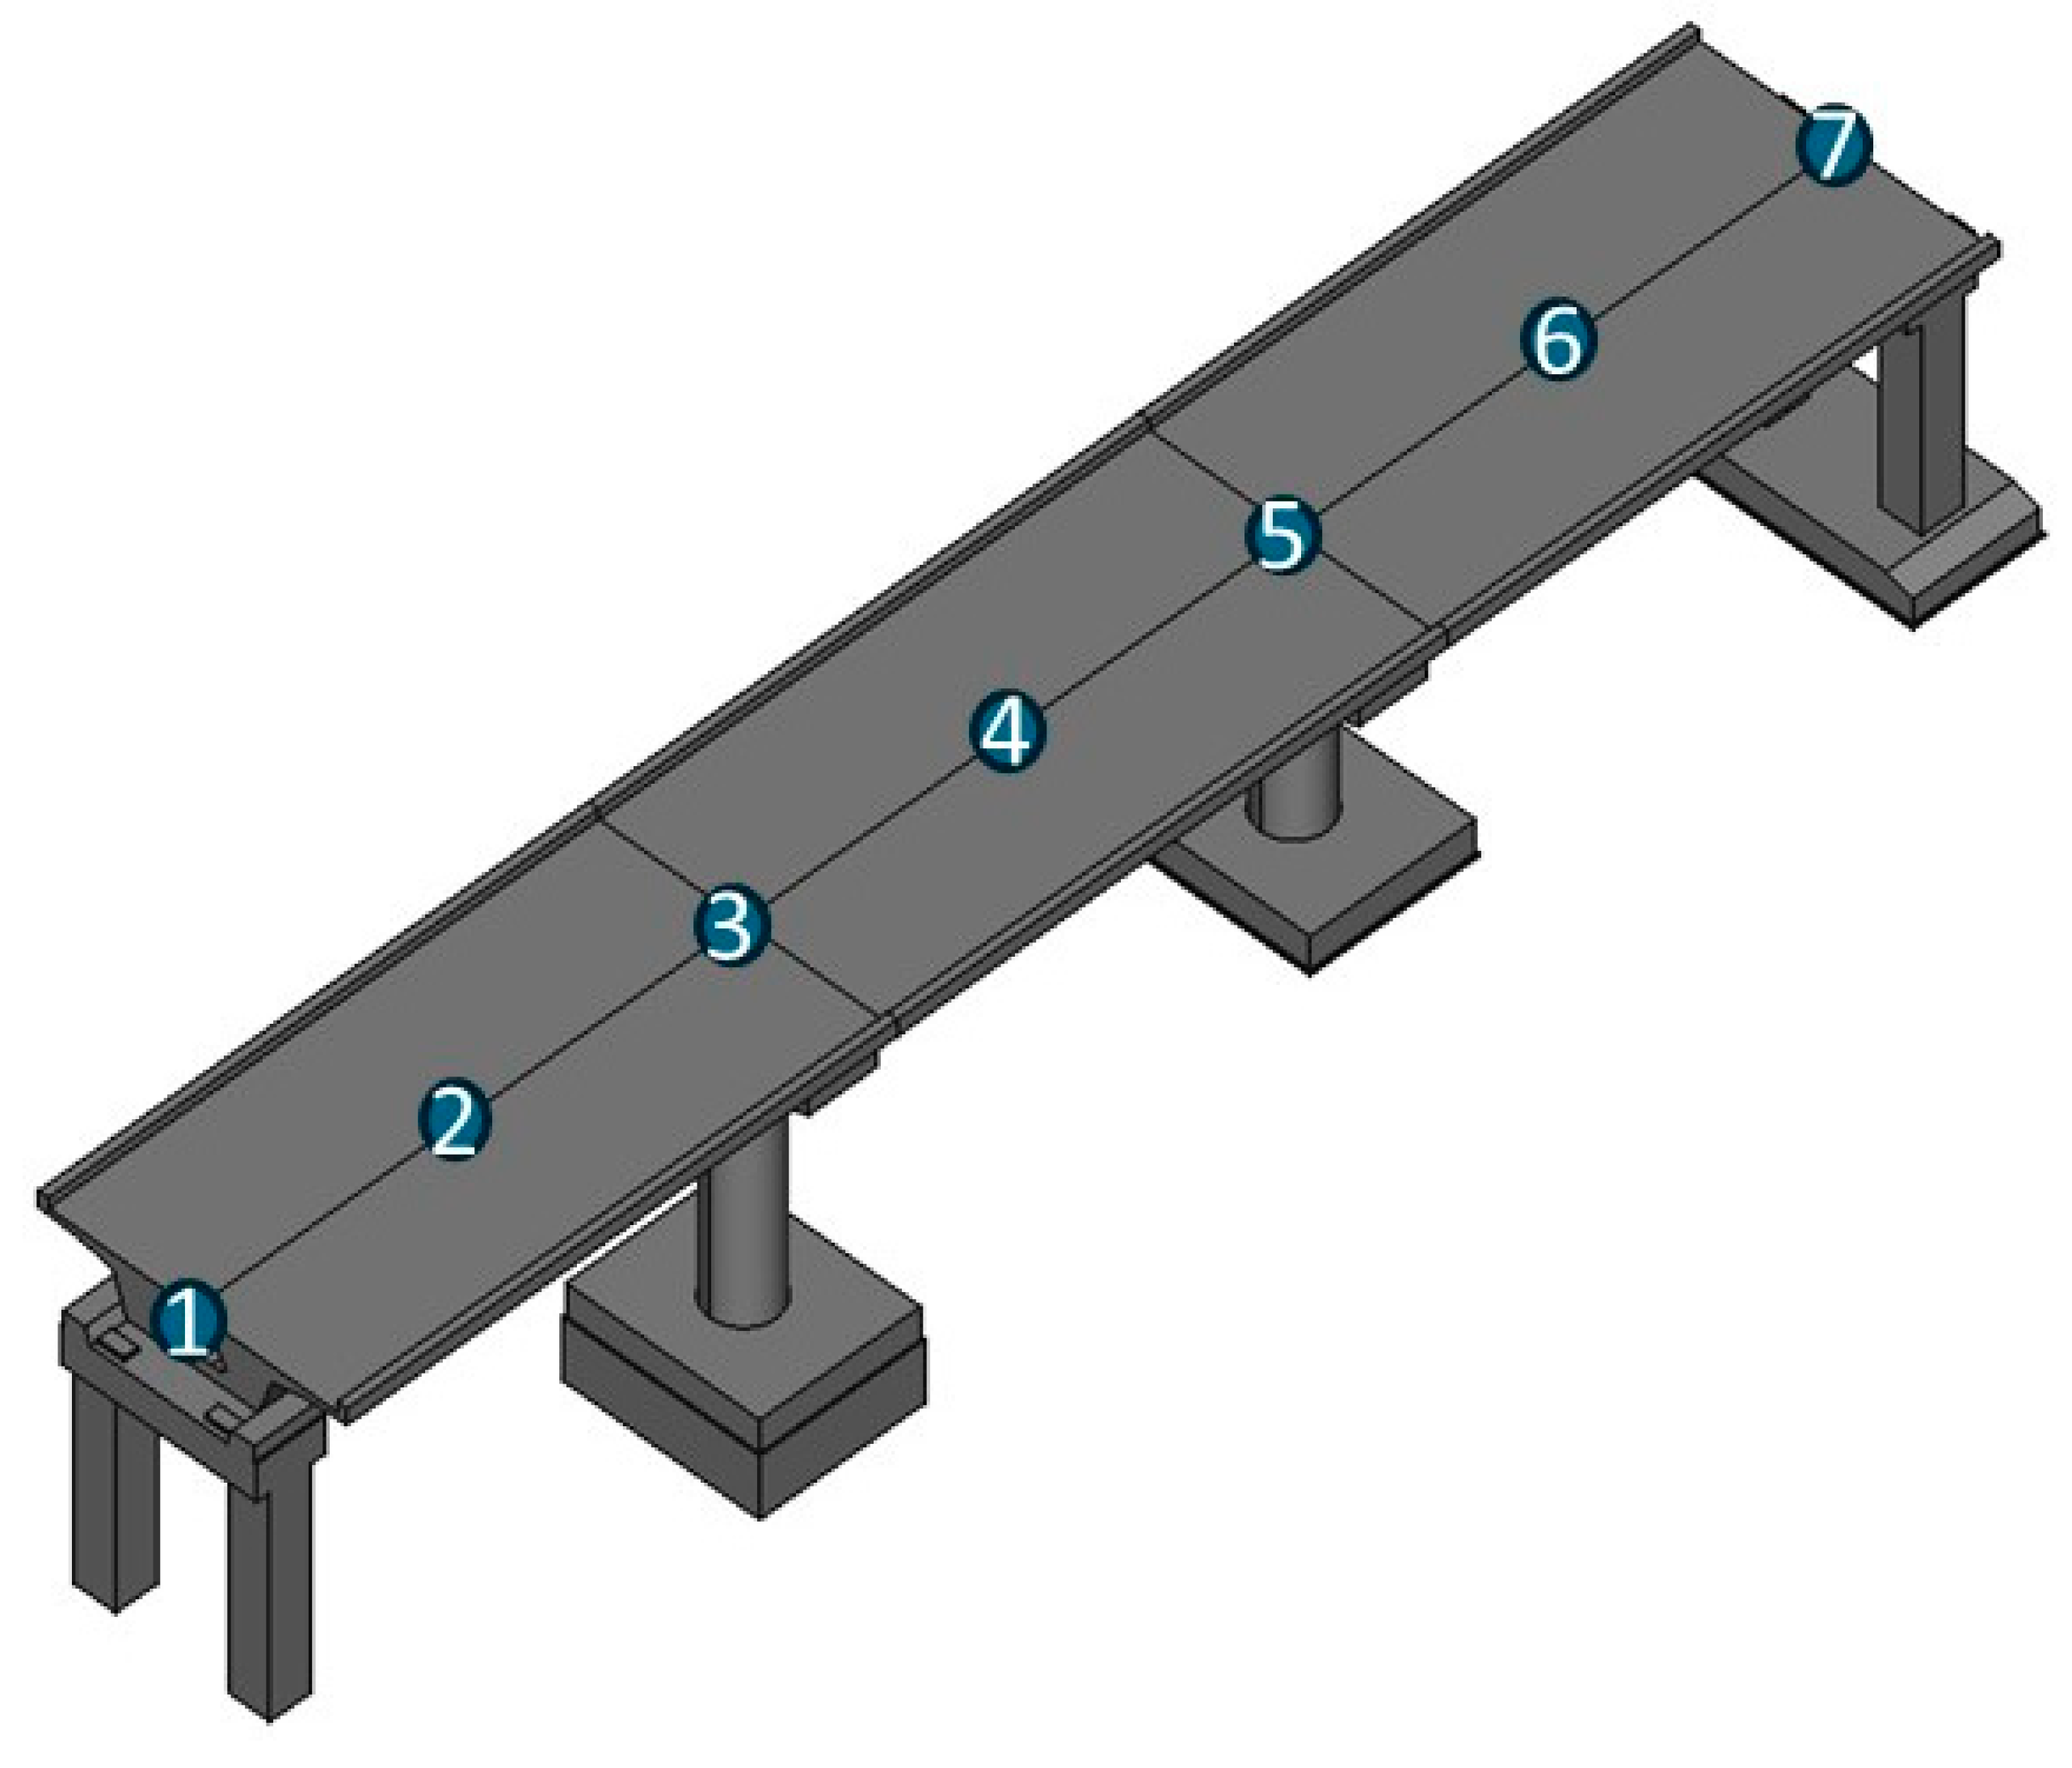
Figure 6 illustrates the monitoring points defined on the railway bridge model for recording dynamic responses under blast and earthquake excitations. A total of seven points were selected along the superstructure to capture representative responses. These locations include the mid-span regions, pier tops, and deck sections, where significant displacement, velocity, and acceleration responses are expected due to ground motion input. By distributing the monitoring points across both symmetrical and asymmetrical parts of the bridge, the spatial variation in dynamic behavior can be systematically evaluated. This configuration enables a direct comparison of structural responses induced by blast-induced high-frequency motions and earthquake-induced long-period motions, thereby providing a comprehensive understanding of the vibration characteristics affecting railway bridges.
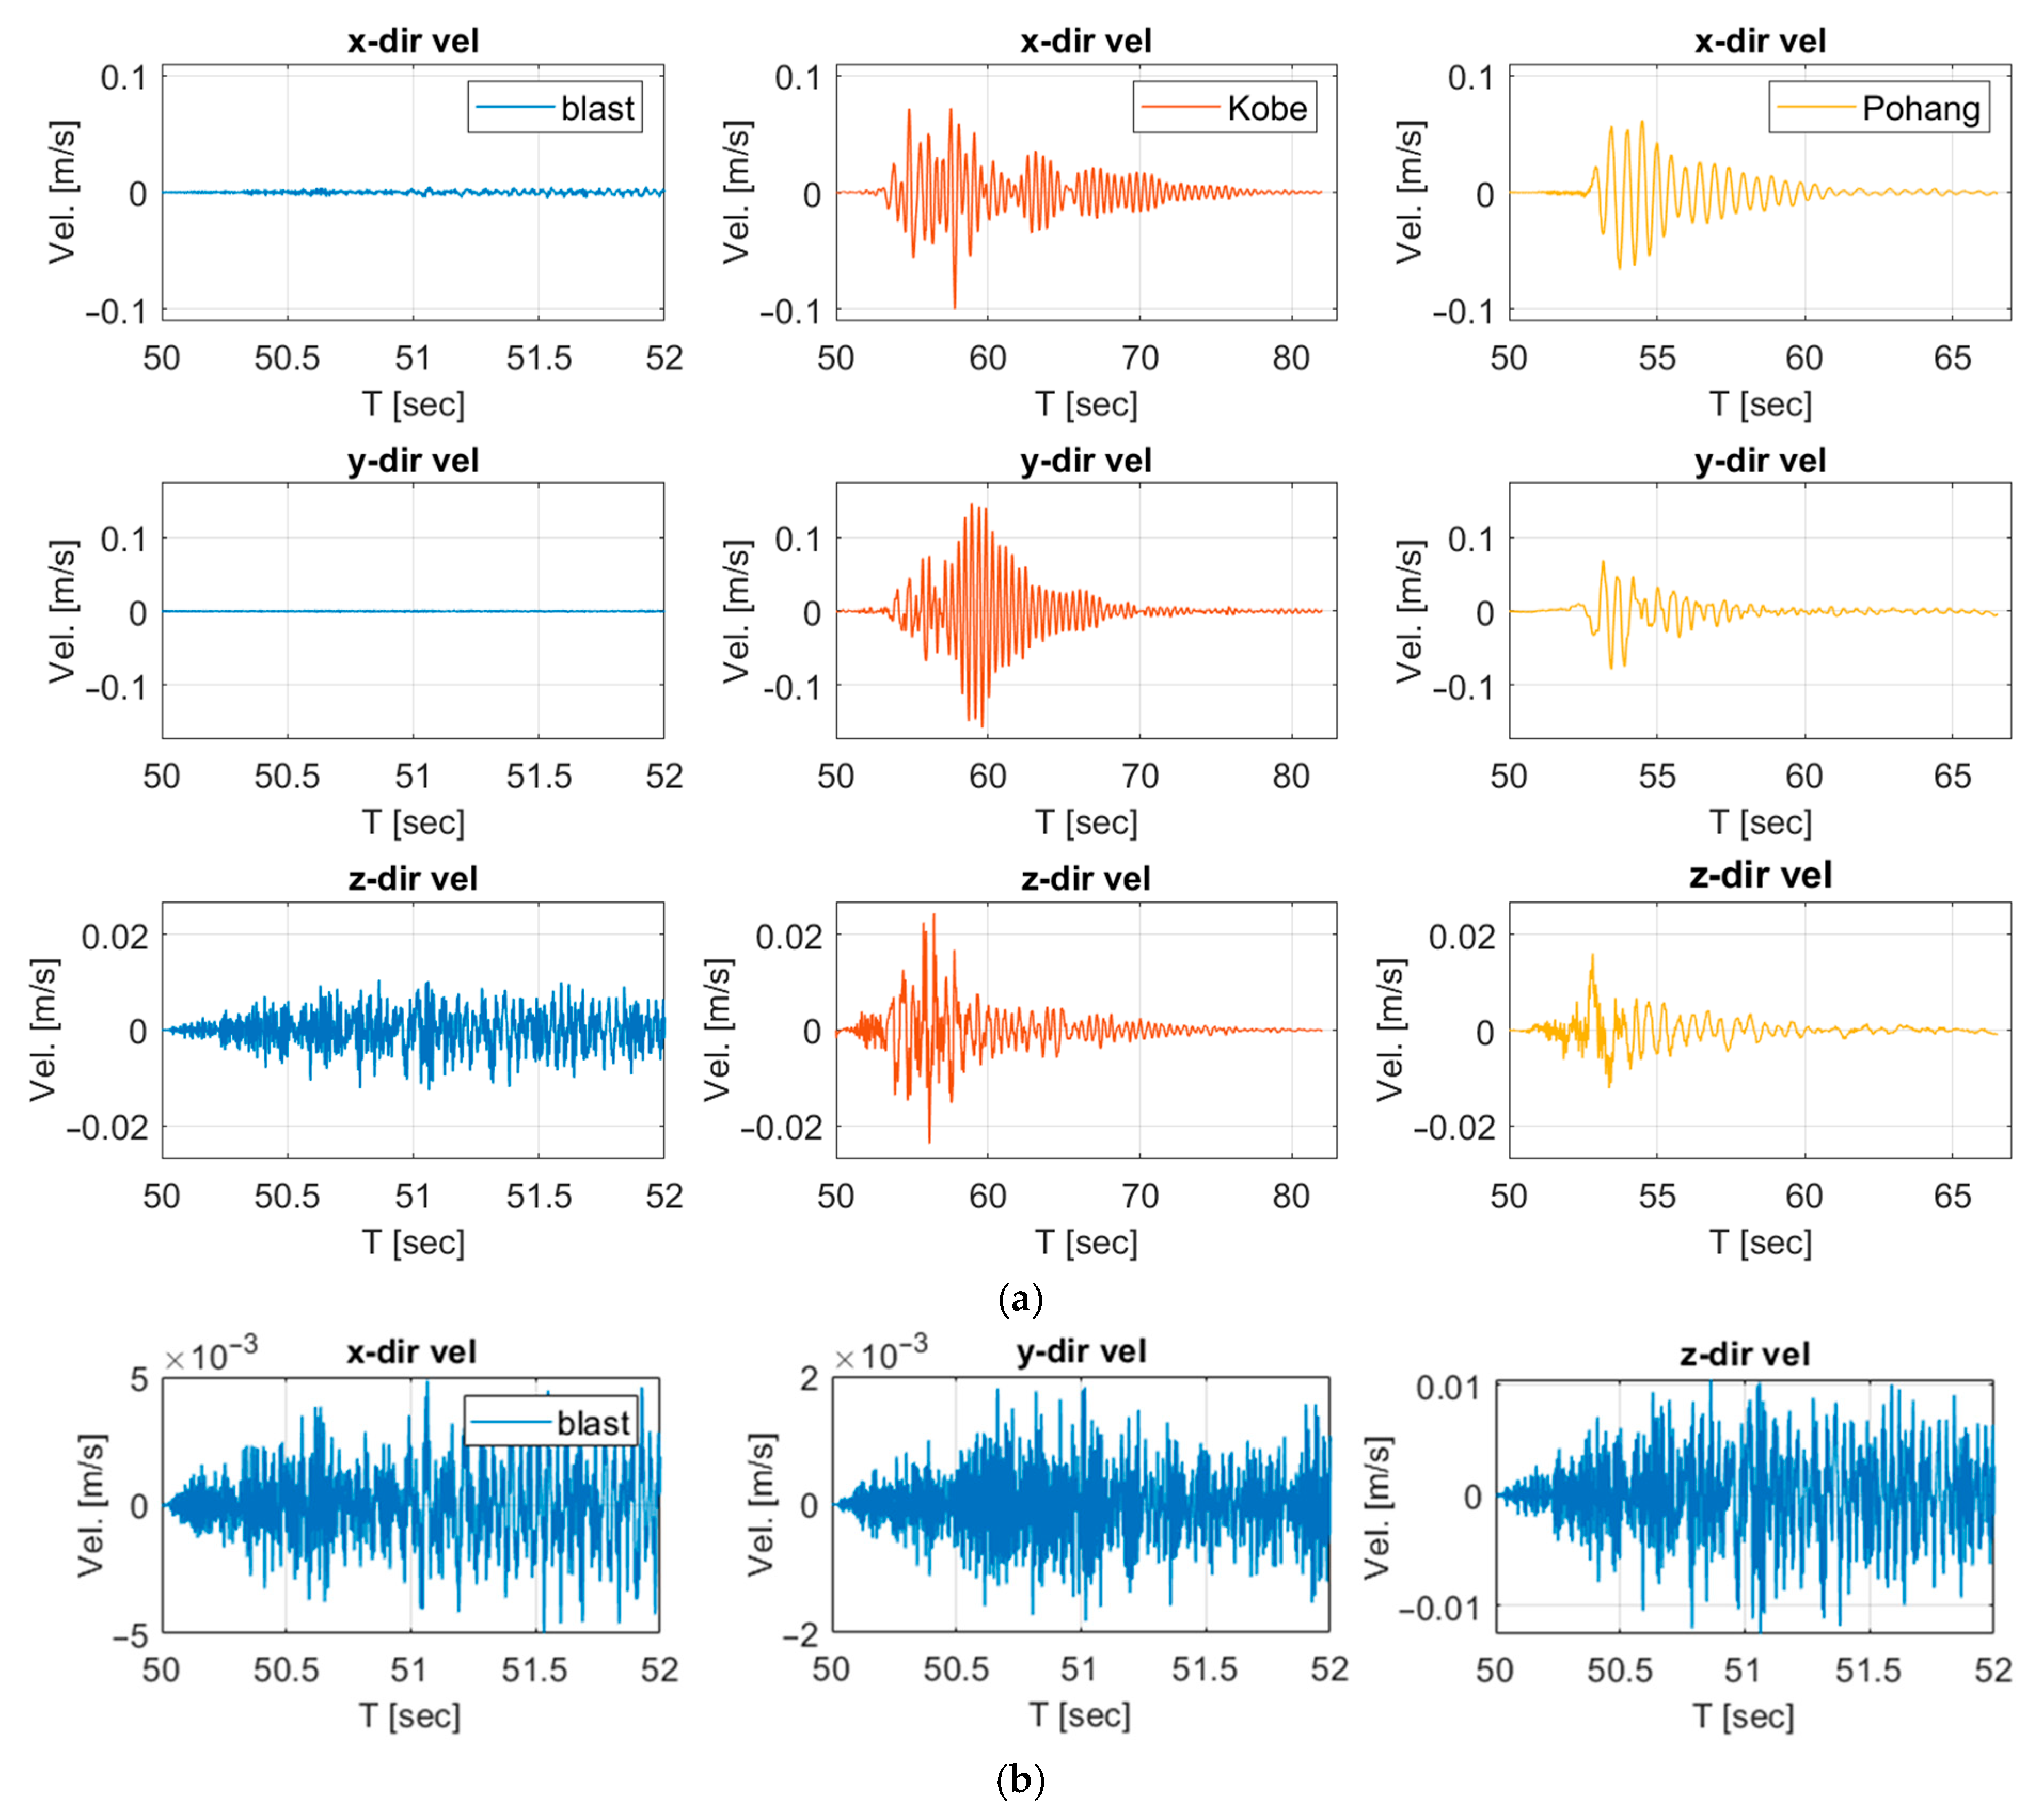
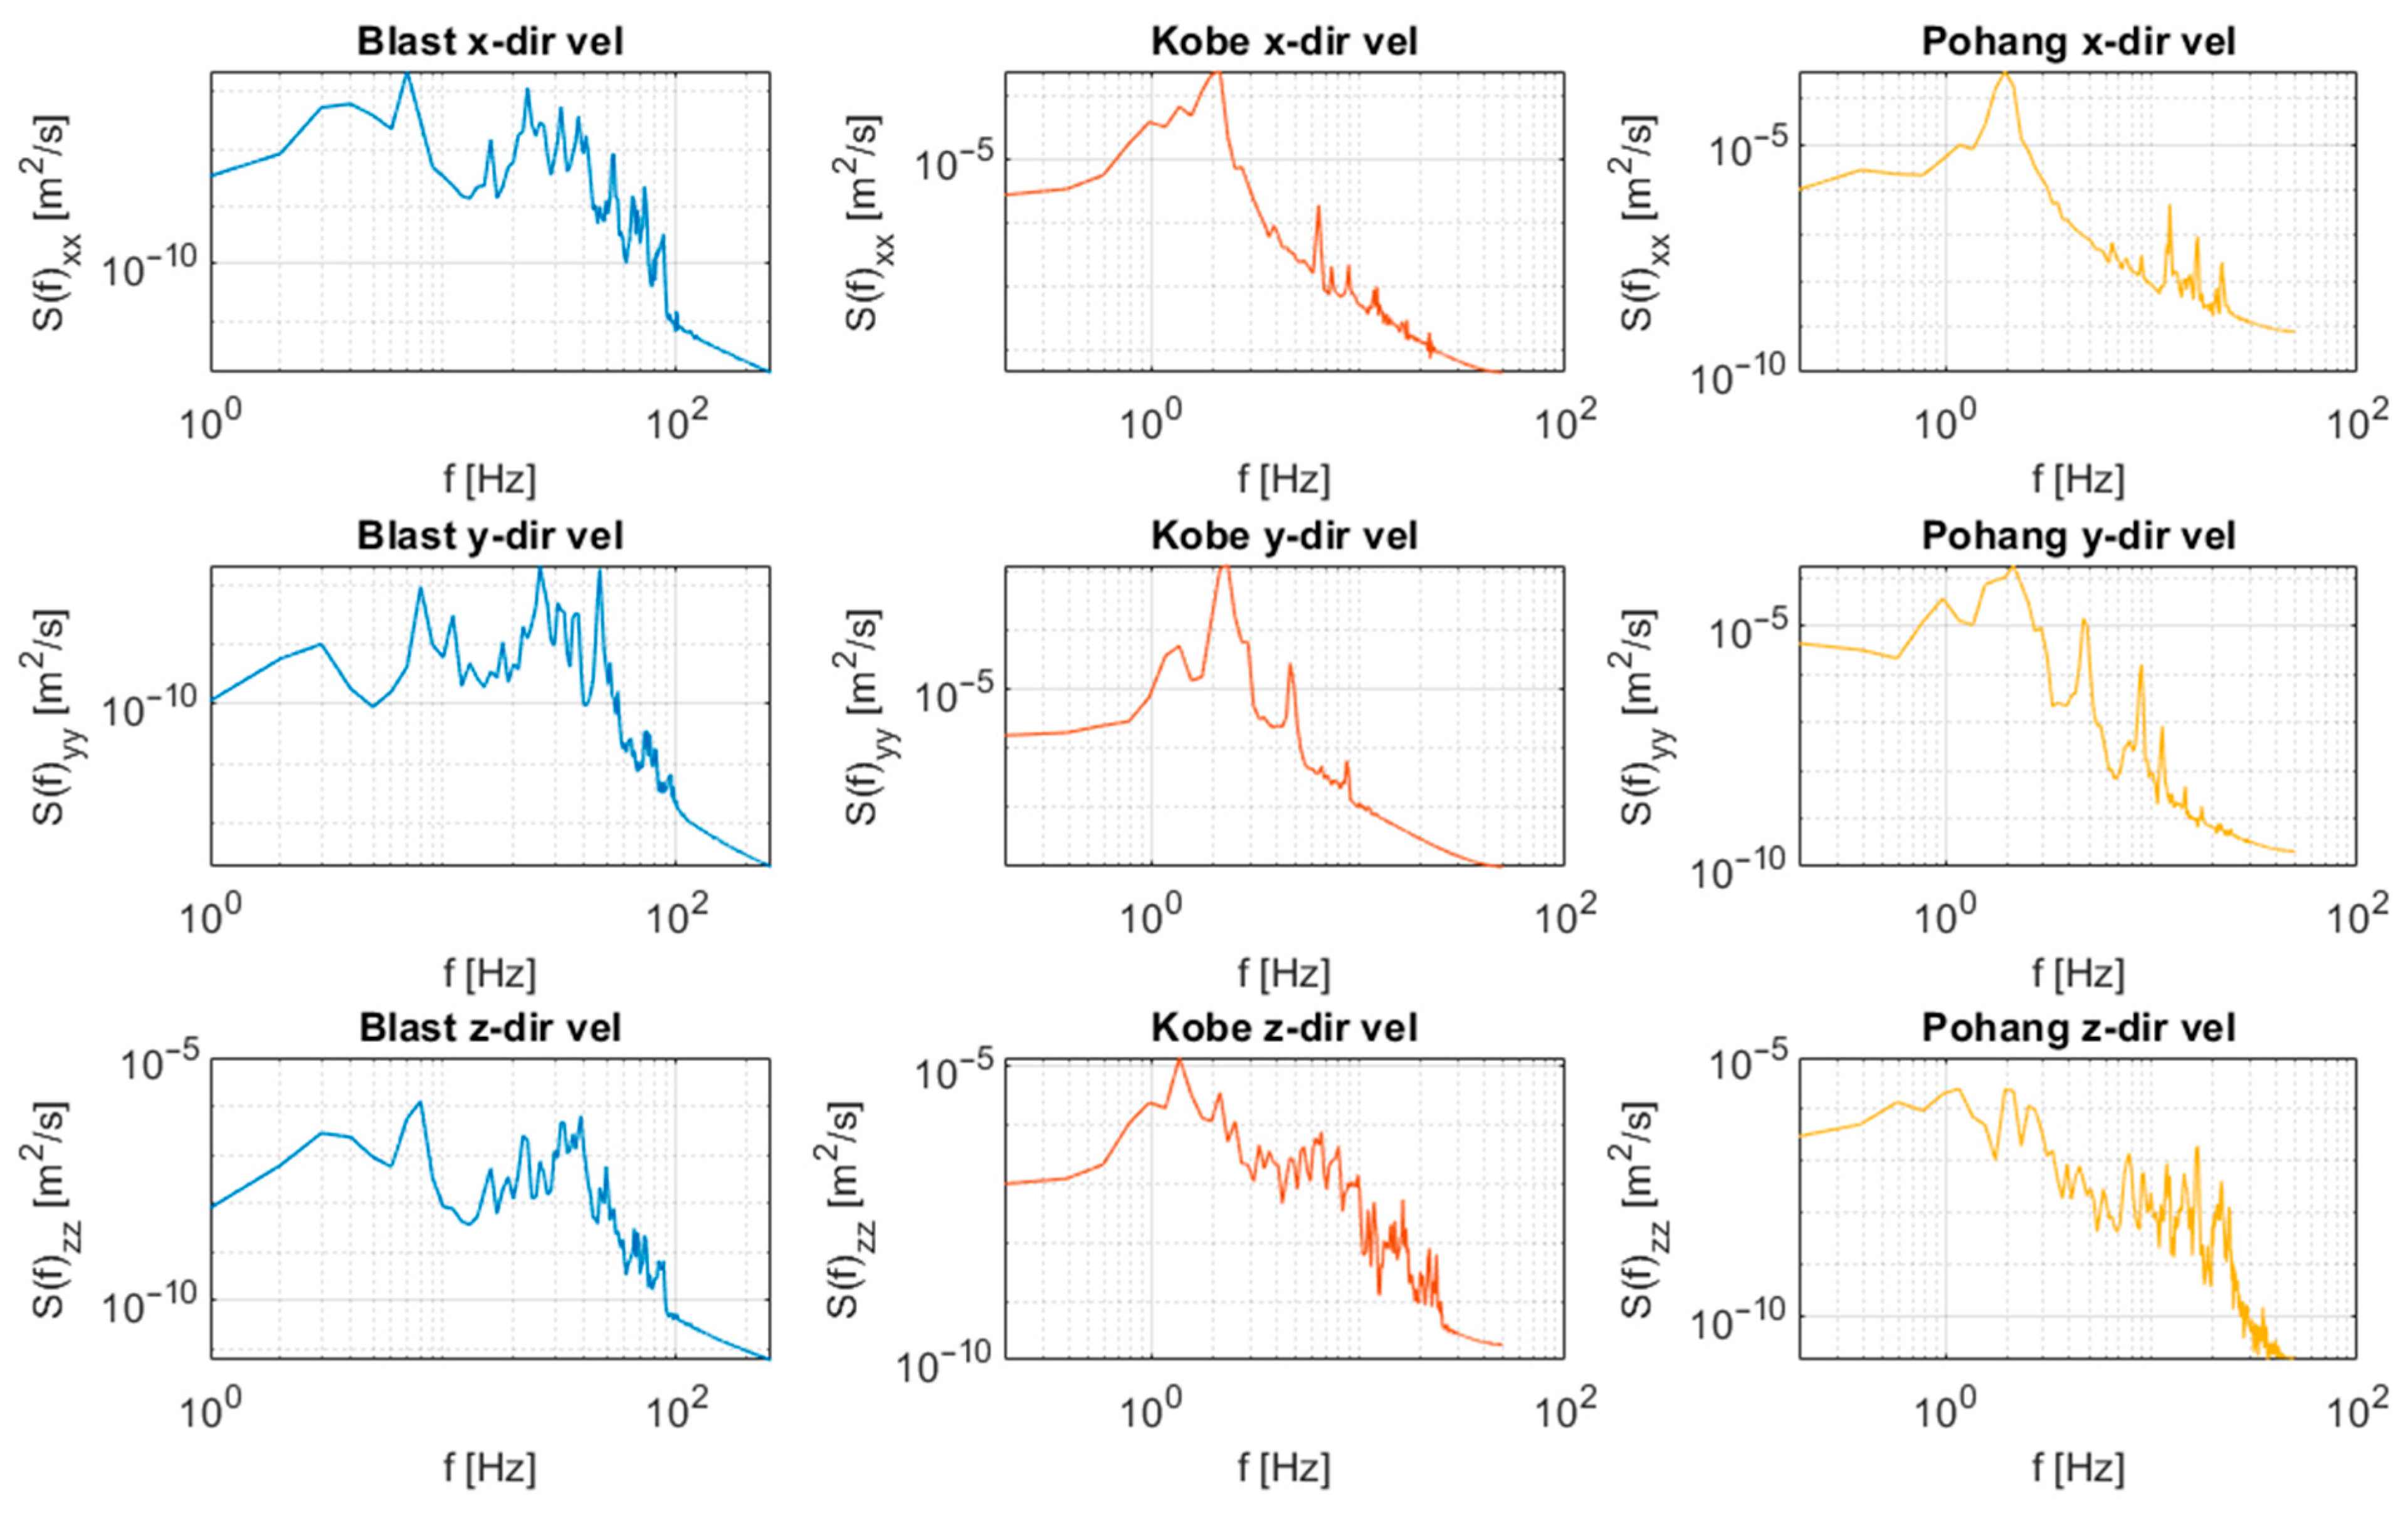
Figure 7 and Figure 8 present the velocity time histories and their PSD values at monitoring point 1 under blast- and earthquake-induced ground motions, with a peak input level of 0.5 kine. The results clearly demonstrate the contrasting vibration characteristics of the two loading types. For the blast-induced motion, the vertical (z-direction) velocity dominates the response, reaching a peak of approximately 0.0126 m/s, while the horizontal components remain below 0.005 m/s, indicating limited structural influence. In contrast, the earthquake inputs generate significantly larger responses. The Kobe earthquake, characterized by long-period components, produces the largest velocity amplitudes, with peak values of about 0.157 m/s in the y-direction and 0.024 m/s in the z-direction. The Pohang earthquake also induced notable responses, although with lower magnitudes compared to Kobe, with maximum values of around 0.079 m/s in the y-direction and 0.016 m/s in the z-direction. These results highlight that, while blast vibrations tend to excite short-duration, high-frequency motions with minimal impact on the bridge structure, earthquake motions—especially those with dominant long-period content—govern the overall structural response and produce substantially higher velocity demands. Also, the z-direction component of the bridge is relatively small compared to the other two components from the long-period vibrations. The mass of the bridge, combined with the gravity, would diminish the vertical response of the bridge. In Figure 8, the local peaks at a frequency higher than 40 Hz are seen. However, the energy at high-frequency contents is diminished. For the most part, the blast-induced velocity PSDs show lower levels of energy compared to PSDs from earthquakes, resulting in lower maximum velocity values. Compared to PSDs from other directions, the PSD of blast in the z-direction shows relatively smaller energy differences to the PSDs of earthquakes.
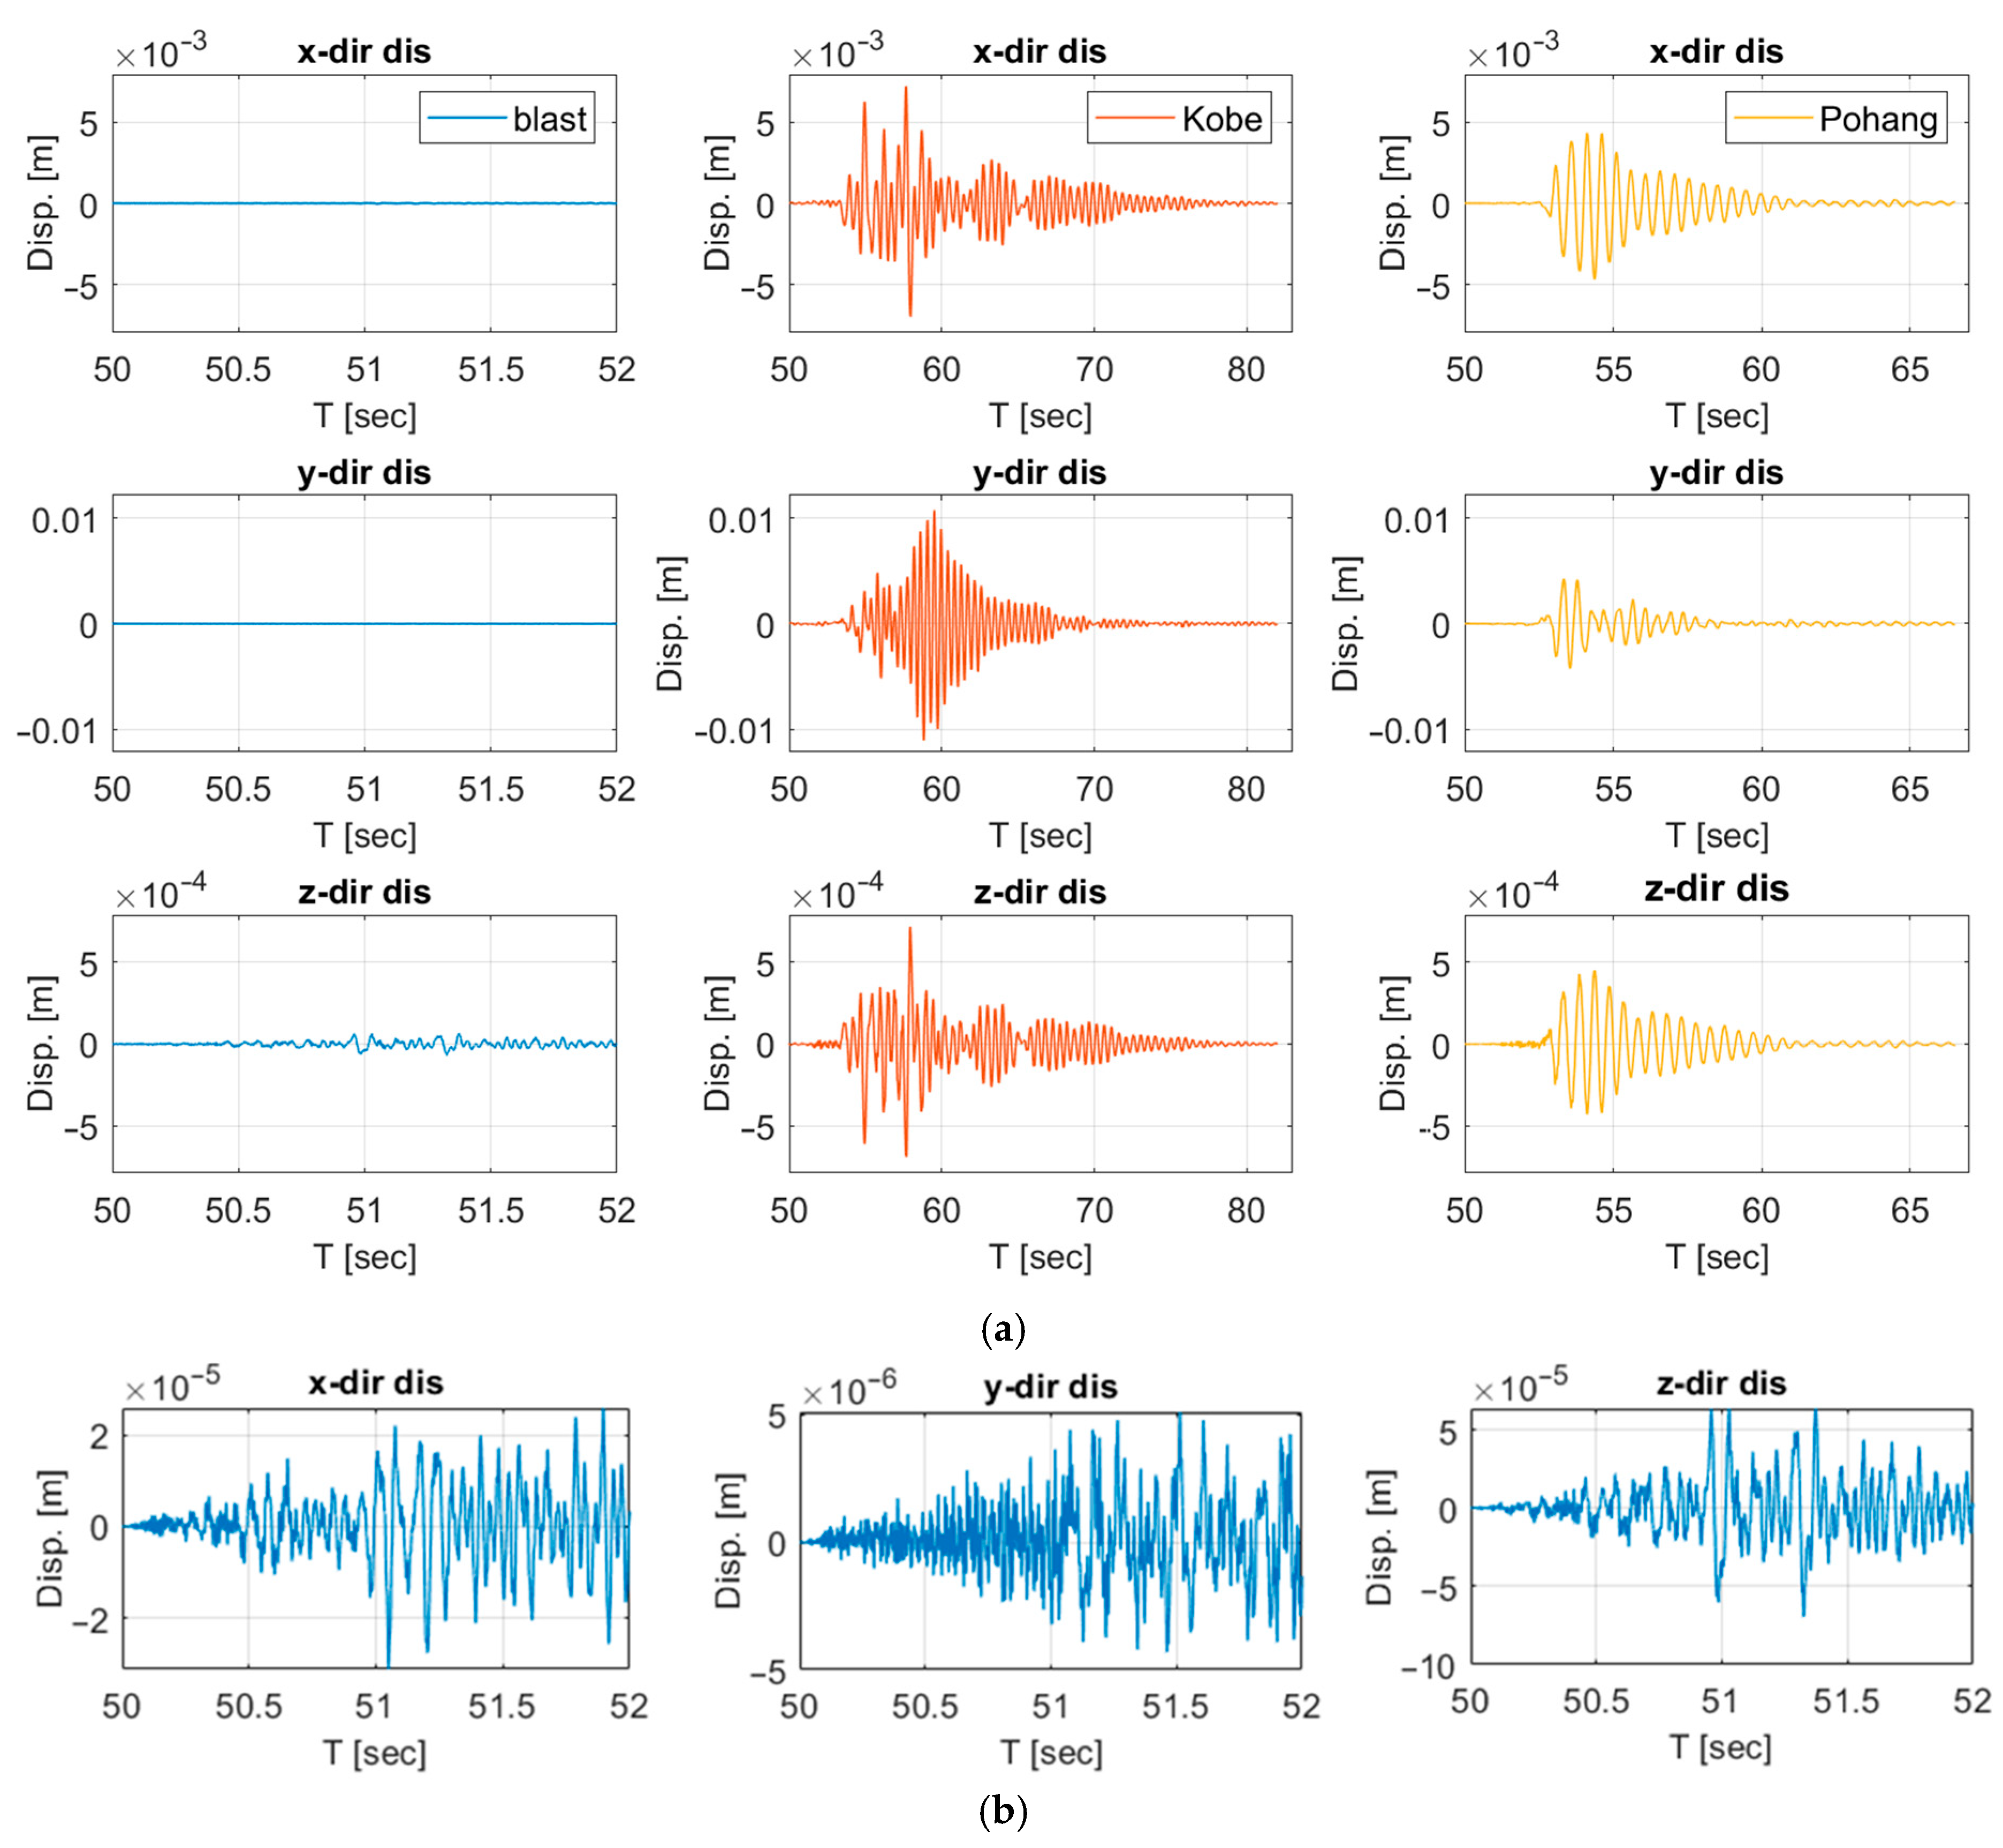
Figure 9 and Figure 10 show the displacement time histories and their PSD values at monitoring point 1 under blast and earthquake excitations scaled to 0.5 kine. Similarly to the above figure, the displacement responses confirm that blast-induced vibrations provide a negligible structural impact compared to earthquake ground motions. For the blast case, the peak displacements remain extremely small, with a maximum of only 0.00007 m in the vertical (z) direction and less than 0.00003 m in the horizontal directions, indicating almost zero structural deformation. In contrast, the earthquake inputs generate much larger displacements. The Kobe earthquake produces the highest response, with peak values of approximately 0.012 m in the y-direction and 0.0088 m in the x-direction, reflecting the influence of its long-period characteristics. The Pohang earthquake also induces notable displacements, though smaller than those of Kobe, with maxima of about 0.009 m in the y-direction and 0.0074 m in the x-direction. These results highlight that, whereas blast vibrations cause imperceptible deformations, earthquake motions—particularly long-period waves such as Kobe—dominate the displacement demand on railway bridges. In Figure 10, the blast-induced displacement PSDs show lower levels of energy compared to PSDs from earthquakes, resulting in lower maximum displacement values. Similarly to Figure 8, the PSD of blast in the z-direction shows relatively smaller energy differences to the PSDs of earthquakes.
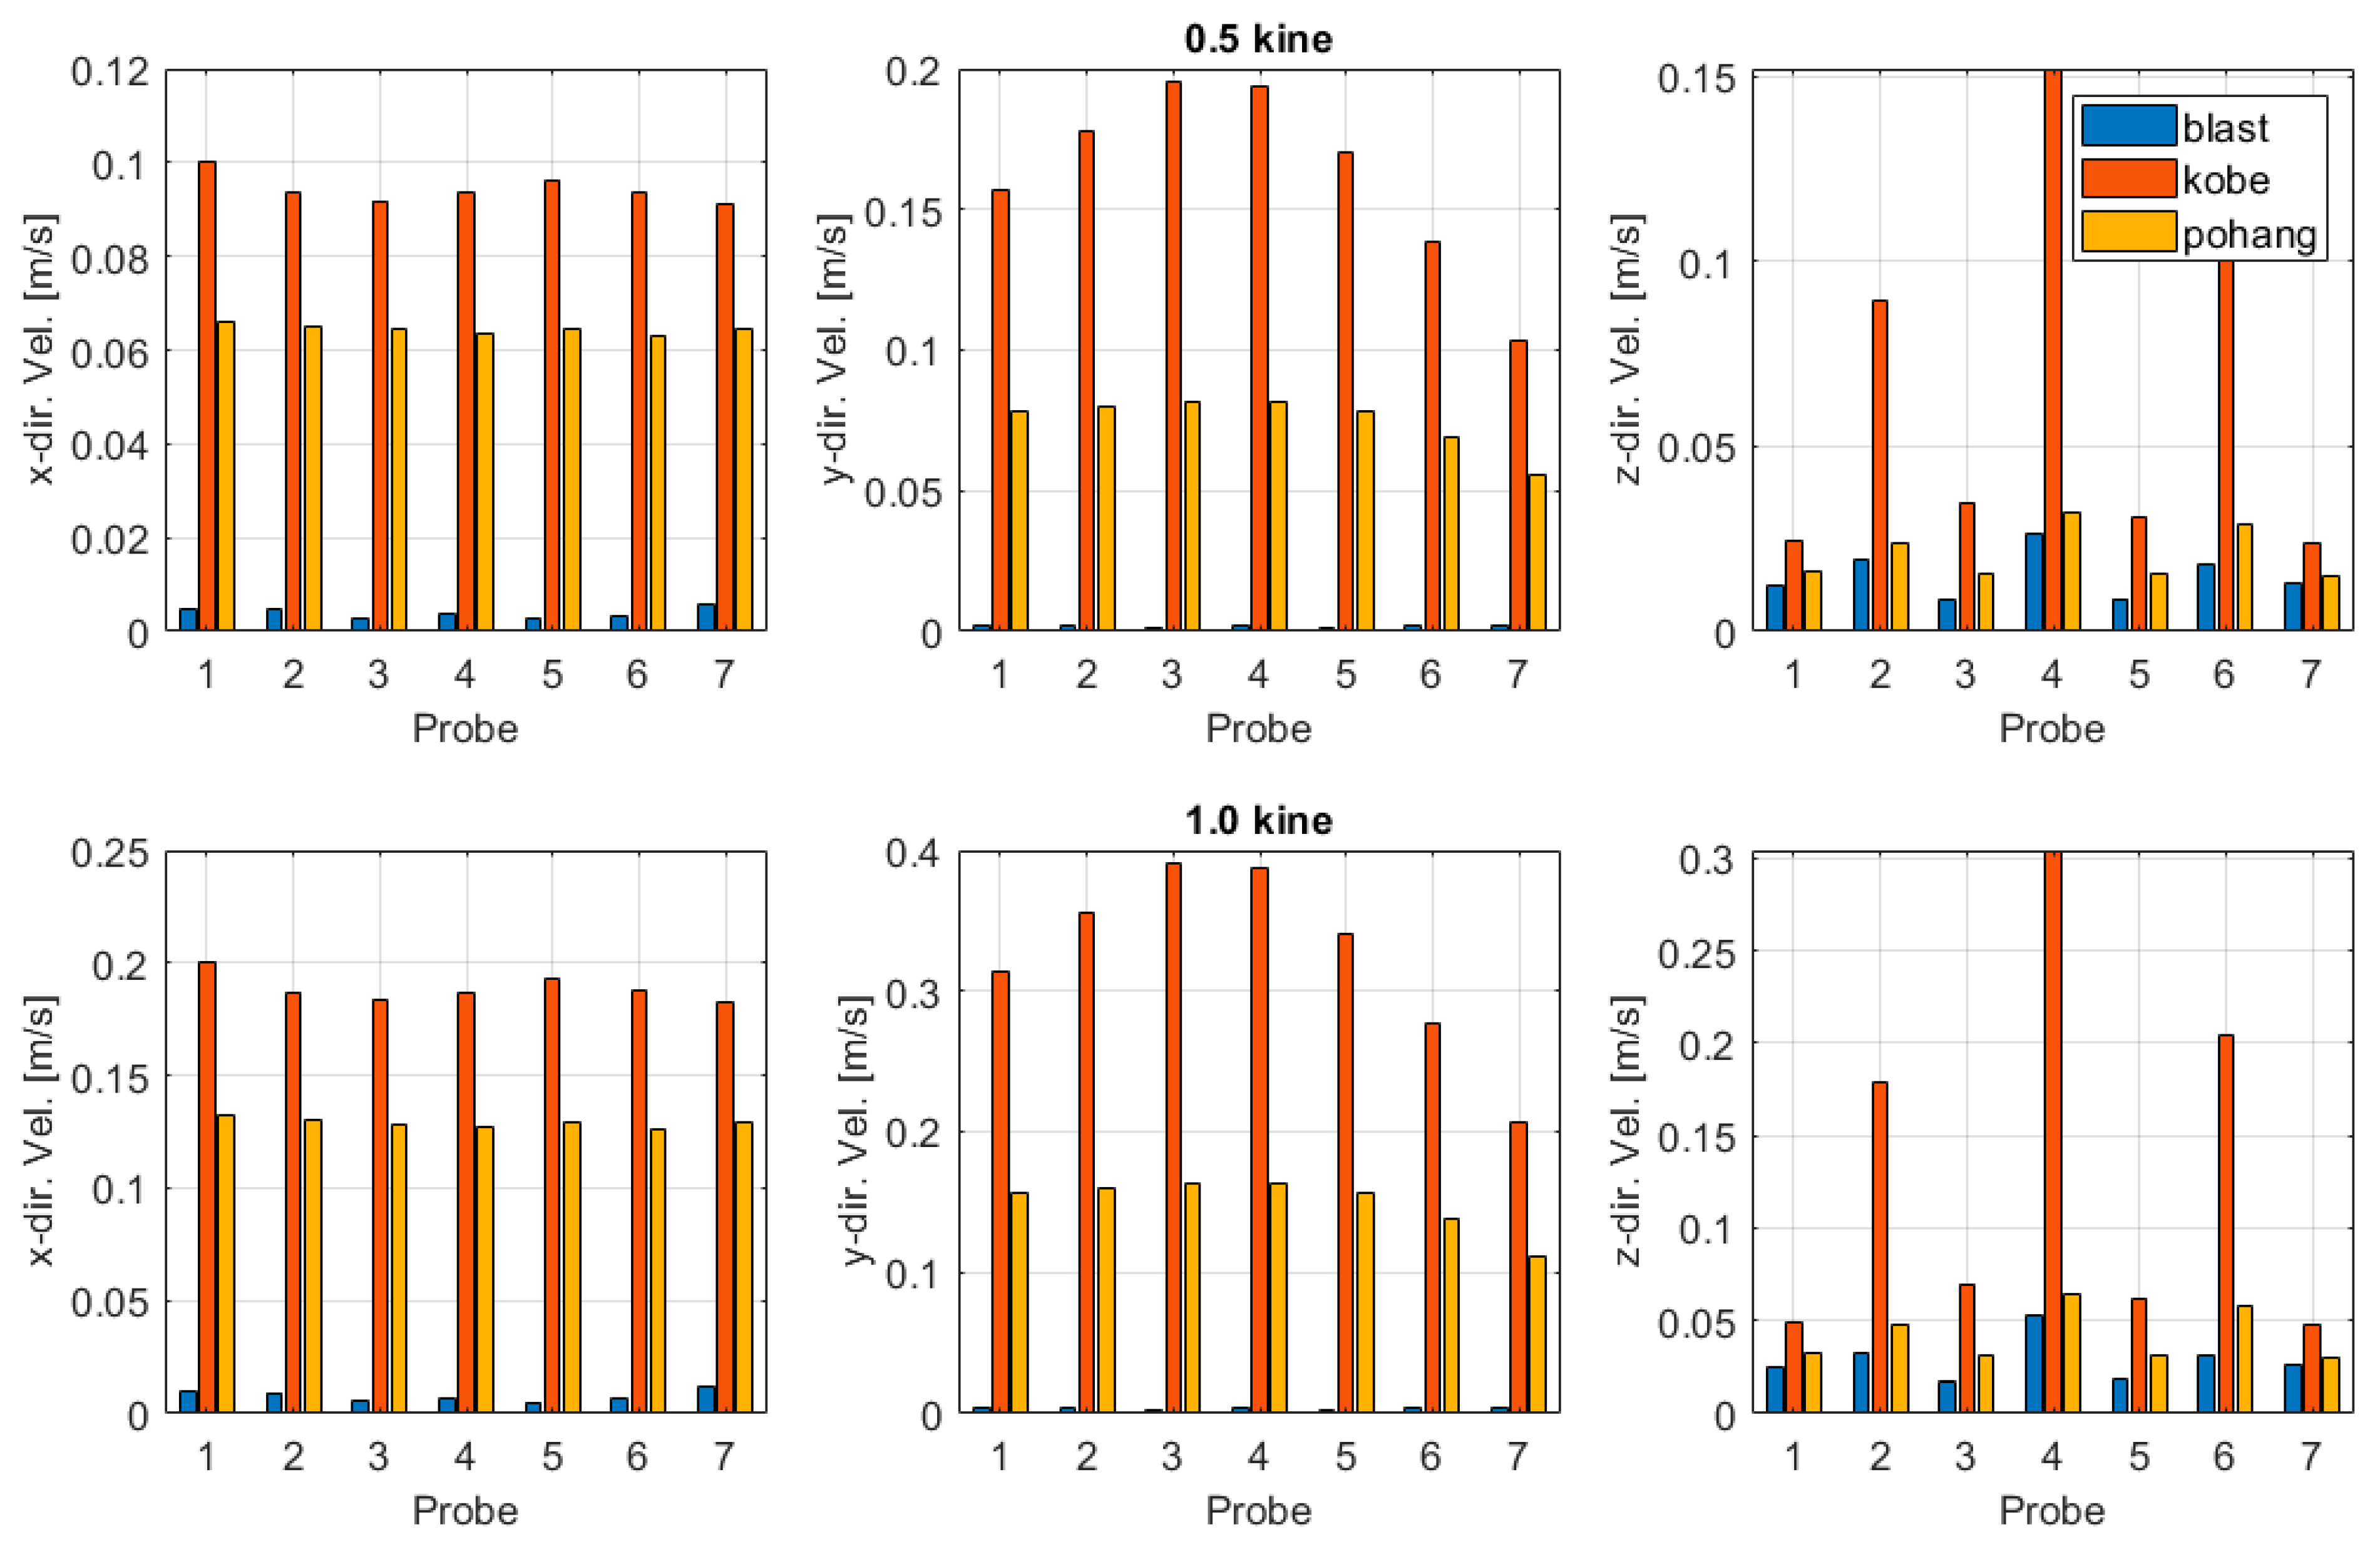
Table 3 and Table 4 and Figure 11 summarize the maximum velocity responses recorded at all seven monitoring points of the bridge under blast-induced ground motion and earthquake-induced ground motions scaled to 0.5 and 1.0 kine, respectively. The results clearly show that the velocity response induced by blast loading is very limited compared to earthquake excitations. Under the 0.5 kine condition (Table 3), the maximum velocity from the blast case is approximately 0.0126 m/s in the vertical (z) direction at point 1, while the horizontal components remain below 0.005 m/s across all monitoring points. In contrast, the Kobe earthquake produces substantially higher velocities, with peak values reaching 0.157 m/s in the y-direction and 0.024 m/s in the z-direction, indicating a strong long-period influence. The Pohang earthquake also resulted in notable responses, with maxima of about 0.079 m/s in the y-direction and 0.016 m/s in the z-direction, although consistently smaller than those of Kobe.
When the input motions are scaled to 1.0 kine (Table 4), the same trend is observed with amplified magnitudes. The blast-induced velocities roughly double but remain minor, with the largest response of about 0.025 m/s in the z-direction. On the other hand, the Kobe earthquake produces maximum velocities exceeding 0.39 m/s in the y-direction and 0.30 m/s in the z-direction, while the Pohang earthquake shows peak values of 0.16 m/s in the y-direction and 0.064 m/s in the z-direction. These findings emphasize that blast vibrations are characterized by short-duration, high-frequency pulses that generate small structural velocities, whereas earthquake motions, particularly long-period waves such as Kobe, govern the dynamic demand on the bridge with significantly larger velocity responses. Also, the vertical responses of the bridge from earthquakes are relatively small compared to the other two responses of bridges, which is due to the gravity.
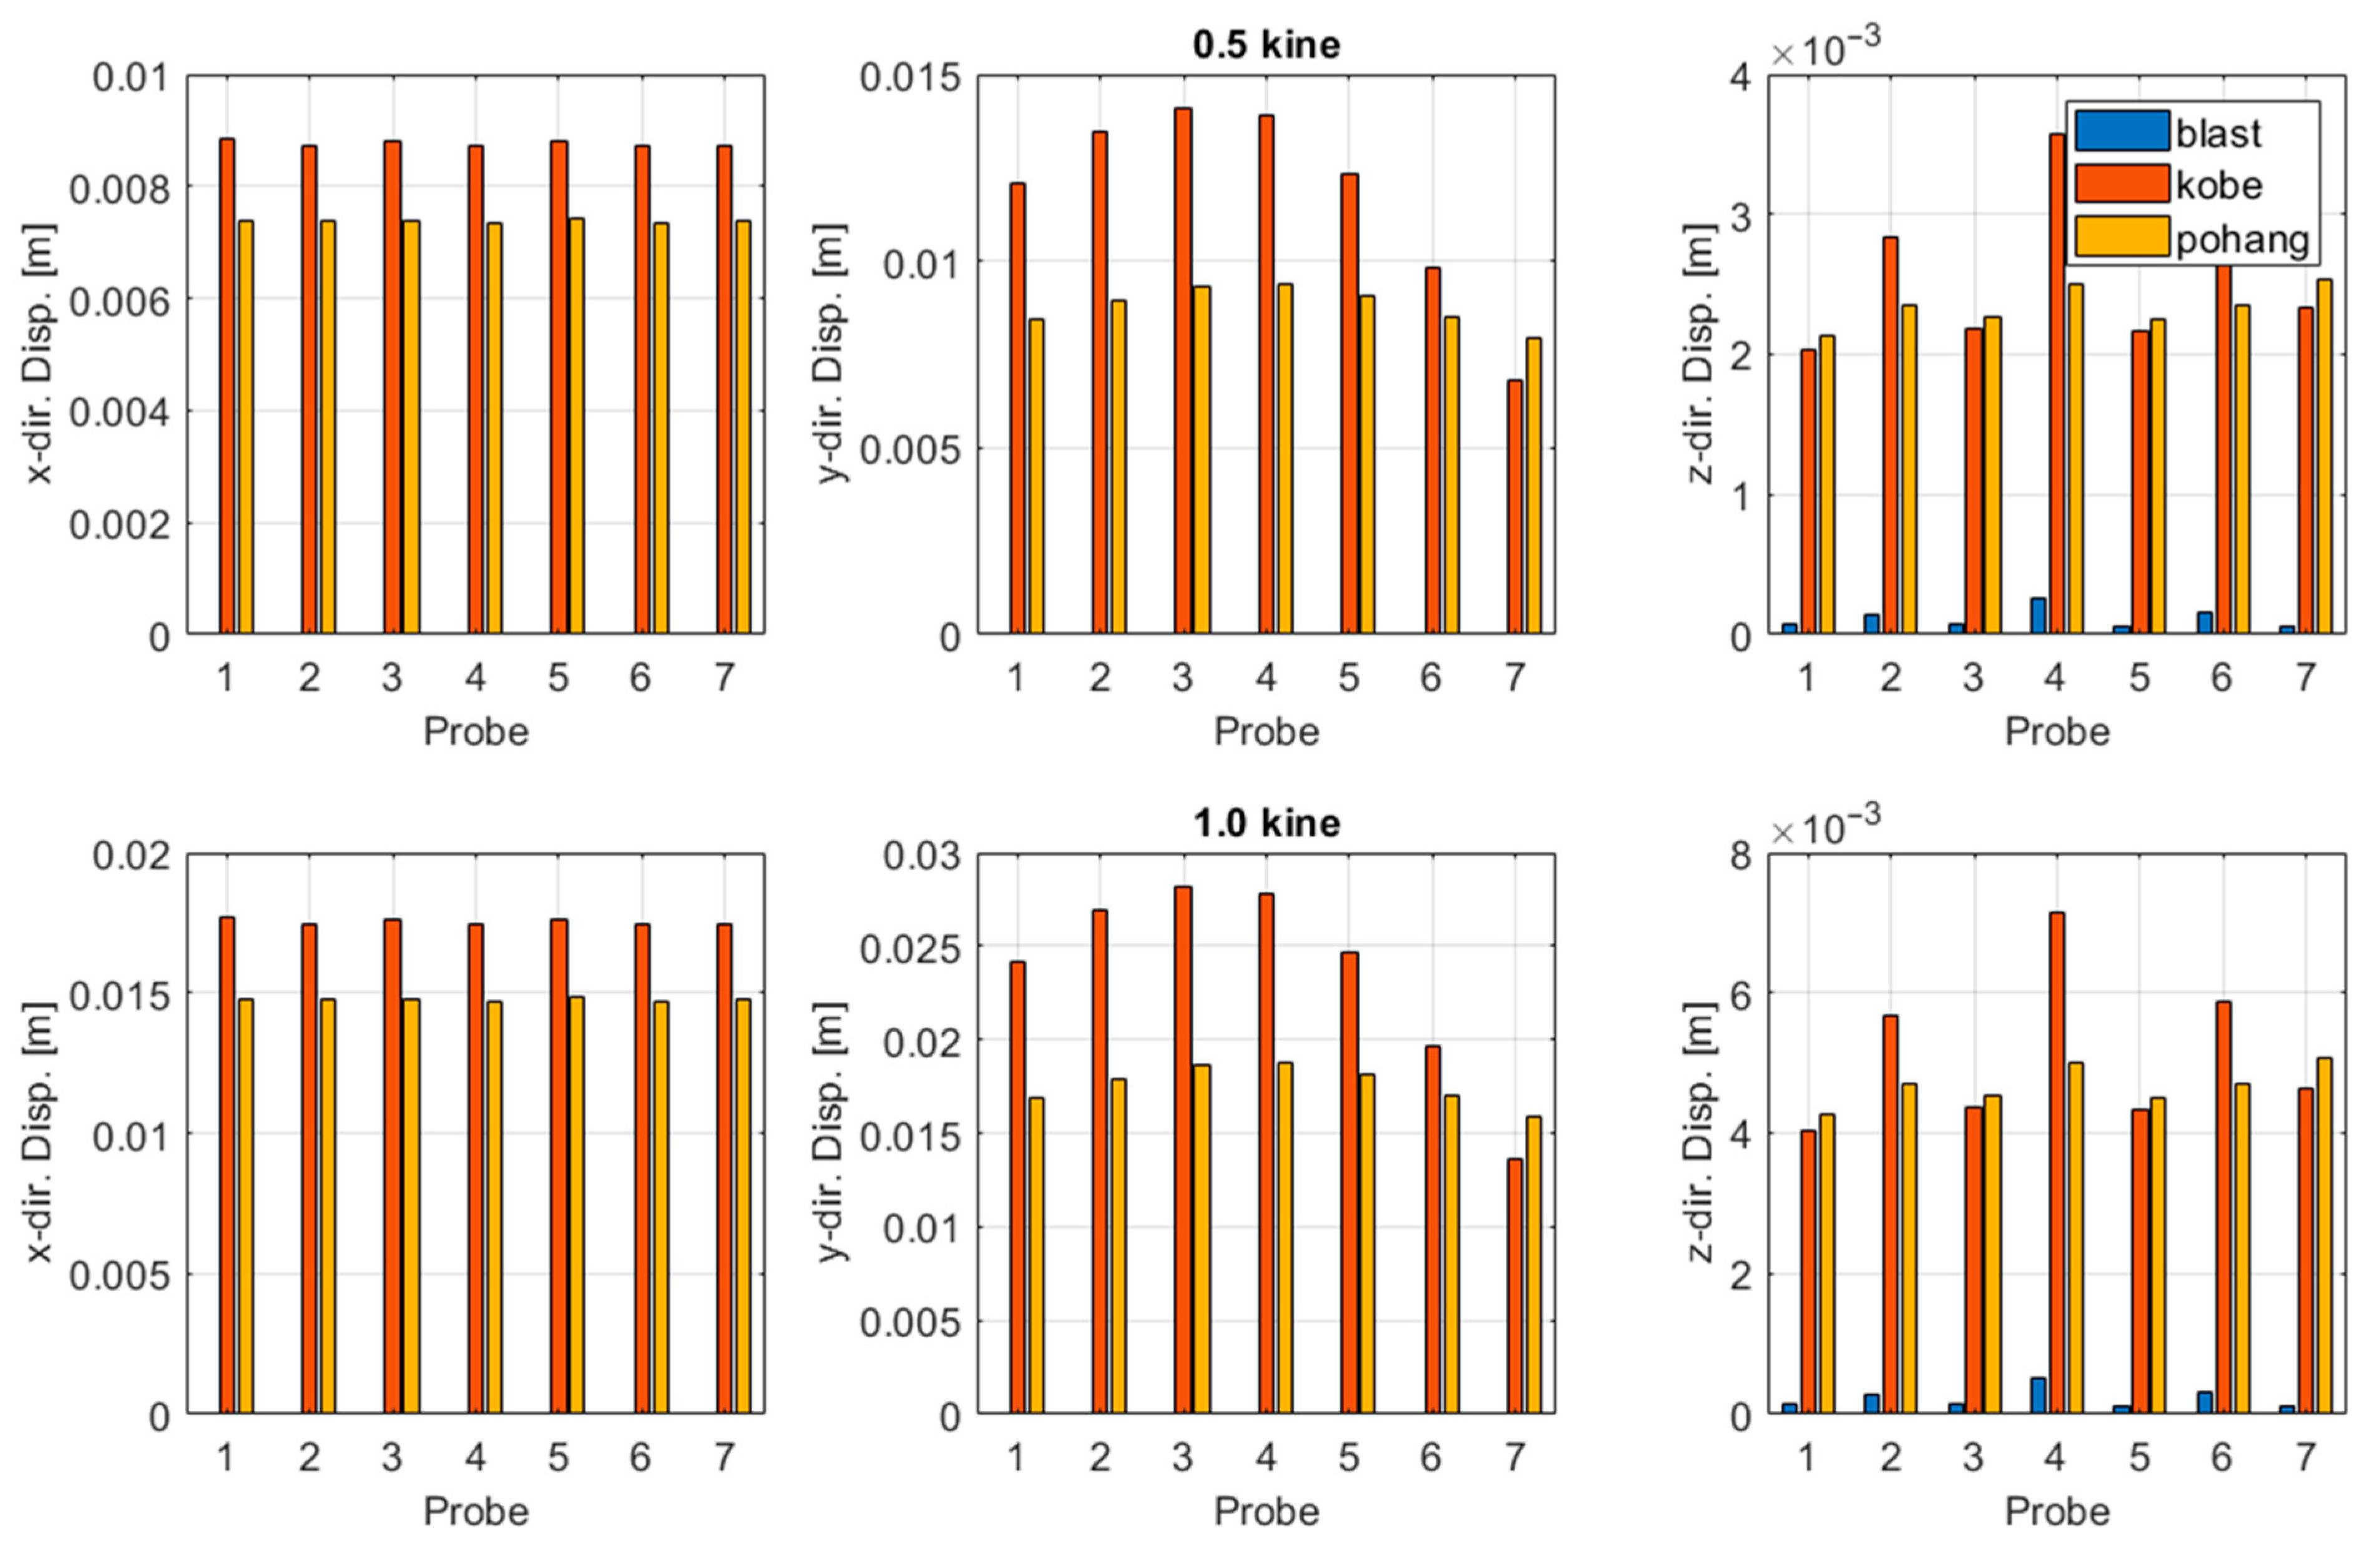
Table 5 and Table 6 and Figure 12 present the maximum displacement responses of the railway bridge subjected to blast-induced ground motion and earthquake-induced ground motions scaled to 0.5 and 1.0 kine. Under blast loading, the structural responses remained extremely small. Vertical displacements did not exceed 0.0005 m, while horizontal responses were generally below 0.00005 m, even at the 1.0 kine input level. These values indicate that blasting vibrations, even at the upper regulatory thresholds, do not cause measurable deformation of the bridge and can be regarded as negligible in terms of structural demand. In contrast, earthquake ground motions generated substantially larger demands. The Kobe record consistently produced the highest displacements, reaching approximately 0.028 m in the y-direction and 0.017 m in the x-direction under the 1.0 kine condition. The Pohang record, although dominated by shorter-period components, still resulted in maximum displacements of about 0.019 m in the y-direction and 0.015 m in the x-direction. Even at the 0.5 kine input level, both earthquakes produced displacements more than two orders of magnitude greater than those from blasting. These results demonstrate that seismic excitations generate the relatively larger deformation of PSC box girder railway bridges, whereas blast vibrations impose only imperceptible effects on the deformation of the structure.
The results reveal a fundamental contrast in the way blast-induced ground motion and earthquake-induced ground motions interact with large-scale bridge structures. Blast vibrations are dominated by high-frequency, short-duration impulses that dissipate rapidly in both soil and structural systems. These types of vibrations do not align with the fundamental modes of a PSC box girder bridge, meaning that little energy is transferred into sustained structural motion. As a result, the overall displacement and velocity demands remain negligible, even when blast motions are scaled to regulatory thresholds. Quantitatively, the maximum displacements induced by blasting correspond to less than 2–3% of those generated by the Kobe and Pohang earthquakes, clearly demonstrating the limited influence of blasting on global bridge behavior. In contrast, earthquake ground motions contain significant low-frequency and long-period components, which are capable of resonating with the natural vibration modes of the bridge. The longer shaking duration further allows for repeated cycles of energy input, amplifying structural responses far beyond what blast impulses can generate. Even when scaled to the same nominal input level, earthquakes induced displacements that were more than 40 times greater than those observed under blasting. This fundamental difference in frequency content and duration, rather than input amplitude alone, governs the disparity in structural response. Thus, while blasts may create localized ground-level vibrations, their impact on system-level bridge performance is practically negligible compared to earthquakes.
These findings carry critical regulatory implications. Current Korean blast vibration thresholds of 0.3–0.5 kine (depending on the structures) were established to prevent localized cracking or cosmetic damage, but when applied to high-speed railway bridges, they appear overly conservative. The numerical evidence presented here demonstrates that bridges remain essentially unaffected by blasting at these limits, while seismic demands of comparable nominal intensity impose structurally significant deformations. Treating the two loading conditions as equivalent in regulatory practice risks overstating the hazards of blasting and imposing unnecessary restrictions on construction activities. A revised framework, distinguishing between localized material effects and system-level demands, would better balance safety assurance with the efficient execution of underground construction projects.

4. Conclusions

In this study, dynamic numerical analyses were conducted to compare the structural responses of a three-span continuous PSC box girder railway bridge subjected to blast-induced and earthquake-induced ground motions. Based on the results, the following conclusions can be drawn.
  • Blast-induced ground motions produced extremely small structural responses. Maximum displacements remained below the millimeter scale and velocities below 0.03 m/s, indicating negligible influence on the railway bridge.
  • Earthquake ground motions generated substantially larger displacements and velocities. The Kobe earthquake, with dominant long-period components, produced the highest responses, while the Pohang earthquake induced smaller but still significant demands.
  • The fundamental difference between blast and earthquake responses arises from their frequency content. High-frequency, short-duration blast pulses dissipate rapidly, whereas low-frequency earthquake energy excites the natural modes of the bridge, leading to amplified displacements.
  • The comparison indicates that the blast vibration limits of 0.3–0.5 kine, provided in the Korean manual, are excessively conservative. Even at these threshold levels, blast-induced responses were negligible compared to earthquake-induced demands.
  • The findings suggest the need for a rational reassessment of blast vibration standards for railway infrastructure. A revised framework that accounts for the actual dynamic response of bridges would ensure both structural safety and the efficient execution of underground construction projects.
Although the above conclusions, this study has following limitations. First, the improvement of the bridge model is required. The real bridge would behave inelastically when exposed to severe vibration. The change in stiffness and natural frequency would diminish the high-frequency contents. Also, the bearing between the superstructure and the pier would increase the lateral response of the bridge. These limits would change the numbers in this study. Second, the reassessment of the blast vibration standard must be performed with various railway structures and blast vibration cases. The blast time series used was from the test blasting, which has a smaller number of explosions compared to the tunnel excavation. Also, the soil conditions and the types of structures could change the blast vibration and associated structural responses [32]
Future study should include the improvement of the bridge models and the parametric study of the blast-induced vibrations of structures. First, the realistic bridge model, including nonlinear elasticity and connection components, are to be developed and applied to the study. Second, the various types of blast vibration data and structures are to be studied. Since the vibration data is from the test blasting, the number of explosions from the test is smaller than those from the real tunnel excavation. The vibration would be different for different explosion plans. Also, the conditions of the soil and the construction site would change the speed and the attenuation of the measured vibration. Furthermore, the type of structure, including structural types and target vehicles, must be considered. To reassess the blast vibration standard carefully, the effect of the parameters affecting the blast-induced vibrations and their effects on structures will be studied.

Author Contributions

J.S.M.: writing—original draft preparation, methodology. M.Y.: writing—review and editing, methodology, supervision. S.H.: writing—review and editing, project administration, supervision. Y.S.L.: visualization, methodology. The authors confirm that this work has not been published before, and its publication has been approved by all co-authors. All authors have read and agreed to the published version of the manuscript.

Funding

This work is supported by the Korea Agency for Infrastructure Technology Advancement (KAIA) grant funded by the Ministry of Land, Infrastructure and Transport (Development of Fire Spread Prevention and Evacuation Response Technologies, RS-2025-02653713).

Data Availability Statement

Data are contained within the article.

Conflicts of Interest

The authors declare no conflicts of interest.

References

  1. Nicholls, H.R.; Johnson, C.F.; Duvall, W.I. Blasting Vibrations and Their Effects on Structures (No. 656-660); US Department of the Interior, Bureau of Mines: Denver, CO, USA, 1971.
  2. Deutsches Institut für Normung. Vibrations in Buildings—Part 3: Effects on Structures (DIN 4150-3:2016-12); German Institute for Standardization: Berlin, Germany, 2016; p. 5940. [Google Scholar]
  3. The Ministry of Land, Infrastructure and Transport. Underground Safety Impact Assessment Standard Manual; The Ministry of Land, Infrastructure and Transport: Sejong, Republic of Korea, 2021; p. 171. (In Korean)
  4. Che, Y.; Chi, E. Study on the Vibration Effects of Cyclic Blasting on Bridge Structures under Construction. Appl. Sci. 2024, 14, 5940. [Google Scholar] [CrossRef]
  5. Zhang, G.; Wang, M.; Yang, R.; Si, K. Blasting vibration hazard classification and prediction research. Adv. Mech. Eng. 2023, 15, 16878132231181068. [Google Scholar] [CrossRef]
  6. Zhao, B.; Jiang, N.; Zhou, C.; Yao, Y.; Zhou, W.; Cai, Z. Safety assessment for a ballast railway induced by underground subway tunnel blasting: A case study. Int. J. Prot. Struct. 2024, 15, 166–191. [Google Scholar] [CrossRef]
  7. Liu, C.; Lai, S.K.; Ni, Y.Q.; Chen, L. Dynamic modelling and analysis of a physics-driven strategy for vibration control of railway vehicles. Veh. Syst. Dyn. 2024, 63, 1080–1110. [Google Scholar] [CrossRef]
  8. Guo, J.; Fei, H.; Yan, Y. Research and Advances in the Characteristics of Blast-Induced Vibration Frequencies. Buildings 2025, 15, 892. [Google Scholar] [CrossRef]
  9. Argyroudis, S.A.; Pitilakis, K.D. Seismic fragility curves of shallow tunnels in alluvial deposits. Soil Dyn. Earthq. Eng. 2012, 35, 1–12. [Google Scholar] [CrossRef]
  10. Argyroudis, S.; Kaynia, A.M. Analytical seismic fragility functions for highway and railway embankments and cuts. Earthq. Eng. Struct. Dyn. 2015, 44, 1863–1879. [Google Scholar] [CrossRef]
  11. Ghosh, S.; Ghosh, S.; Chakraborty, S. Seismic fragility analysis in the probabilistic performance-based earthquake engineering framework: An overview. Int. J. Adv. Eng. Sci. Appl. Math. 2021, 13, 122–135. [Google Scholar] [CrossRef]
  12. Nettis, A.; Di Mucci, V.M.; Ruggieri, S.; Uva, G. Seismic fragility and risk assessment of isolated bridges subjected to pre-existing ground displacements. Soil Dyn. Earthq. Eng. 2025, 194, 109335. [Google Scholar] [CrossRef]
  13. Diao, Y.C.; Li, C.; Li, H.N. Seismic Fragility Analysis of Curved Bridges with Precast Segmental Pier Columns Considering Directionality of Multisupport Earthquake Motions. J. Struct. Eng. 2025, 151, 04025198. [Google Scholar] [CrossRef]
  14. Yan, B.; Lai, J.; Wu, S.; Feng, S.; Meng, X. Seismic fragility assessment of UHPC ribbed arch bridges. Soil Dyn. Earthq. Eng. 2025, 190, 109199. [Google Scholar] [CrossRef]
  15. Satyanarayana, A.; Dushyanth, V.B.R.; Riyan, K.A.; Geetha, L.; Kumar, R. Assessing the seismic sensitivity of bridge structures by developing fragility curves with ANN and LSTM integration. Asian J. Civ. Eng. 2024, 25, 5865–5888. [Google Scholar] [CrossRef]
  16. Luo, Q.; Wang, X.; Pang, Y.; Ye, A. Machine learning-aided parameterized seismic fragility models of bridges for network-level functionality assessment. Eng. Struct. 2025, 340, 120771. [Google Scholar] [CrossRef]
  17. Wu, D.; Li, Z.X.; Ding, Y.; Su, J. Time-dependent seismic fragility and resilience assessment of a sea-crossing cable-stayed bridge under combined effects of corrosion and scour. Eng. Struct. 2025, 340, 120702. [Google Scholar] [CrossRef]
  18. Afsar Dizaj, E.; Salami, M.R.; Kashani, M.M. Impact of asymmetrical corrosion of piers on seismic fragility of ageing irregular concrete bridges. Struct. Infrastruct. Eng. 2025, 21, 1465–1484. [Google Scholar] [CrossRef]
  19. The Ministry of Land, Infrastructure and Transport. Seismic Design Standards of Bridges (KDS 24 17 10); The Ministry of Land, Infrastructure and Transport: Sejong, Republic of Korea, 2018; p. 28. (In Korean)
  20. Al-Khafaji, M.S.; Mohammed, A.S.; Salman, M.A. ANSYS-based structural analysis study of elevated spherical tank exposed to earthquake. Eng. Technol. J. 2021, 39, 870–883. [Google Scholar] [CrossRef]
  21. Yan, Y.; Yang, Y.; Bashir, M.; Li, C.; Wang, J. Dynamic analysis of 10 MW offshore wind turbines with different support structures subjected to earthquake loadings. Renew. Energy 2022, 193, 758–777. [Google Scholar] [CrossRef]
  22. Qiu, H.; Wu, K.; Ayasrah, M.M.; Huang, W. Study on Sunlight Temperature Field of Steel Box Arch Ribs in Irregular Arch Bridges. Symmetry 2024, 16, 413. [Google Scholar] [CrossRef]
  23. Raj, A.; Paul, G. A simulation based analysis for enhancement of performances of turbine blades in turbo jet engines with thermal barrier coatings (TBCs). Numer. Heat Transf. Part A Appl. 2024, 1–15. [Google Scholar] [CrossRef]
  24. Yan, X.; Wu, S.; Xue, M.; Leung, C.K.B.; Beetner, D.; Zhang, J. A practical simulation flow for singing capacitor based acoustic noise analysis. In Proceedings of the 2022 IEEE International Symposium on Electromagnetic Compatibility & Signal/Power Integrity (EMCSI), Spokane, WA, USA, 1–5 August 2022; IEEE: Piscataway, NJ, USA, 2022; pp. 29–33. [Google Scholar]
  25. Sagar, S. Modelling and CFD Acoustic Analysis of Different Chevron Nozzles using Ansys for Jet Noise Reduction. Ph.D. Thesis, National Institute of Technology Patna, Bihar, India, 2022. [Google Scholar]
  26. Bagheri, M.; Arjomand, M.A.; Mostafaei, Y. Performance enhancement of Tuned Liquid Dampers in Fixed Offshore Platforms: A Coupled ANSYS Aqwa-Transient Structural Approach. Civ. Eng. Appl. Solut. 2025, 1, 78–88. [Google Scholar]
  27. Trad, A.; Amoura, N.; Abdellah Elhadj, A.; Kebir, H. Optimizing plastic shredder rotor design through structural finite element analysis: A comprehensive approach using experimental design and response surface methodology. Mech. Based Des. Struct. Mach. 2024, 52, 10682–10701. [Google Scholar] [CrossRef]
  28. Kaya, N.; Anil, Ö. Prediction of load capacity of one way reinforced concrete slabs with openings using nonlinear finite element analysis. J. Build. Eng. 2021, 44, 102945. [Google Scholar] [CrossRef]
  29. Kim, K.H.; Ree, J.H.; Kim, Y.; Kim, S.; Kang, S.Y.; Seo, W. Assessing whether the 2017 M w 5.4 Pohang earthquake in South Korea was an induced event. Science 2018, 360, 1007–1009. [Google Scholar] [CrossRef] [PubMed]
  30. Kim, Y.; Rhie, J.; Kang, T.S.; Kim, K.H.; Kim, M.; Lee, S.J. The 12 September 2016 Gyeongju earthquakes: 1. Observation and remaining questions. Geosci. J. 2016, 20, 747–752. [Google Scholar] [CrossRef]
  31. Korea Society of Civil Engineering. Investigation and Analysis of Vibration Effects According to Ground Conditions; Korea Society of Civil Engineering: Seoul, Republic of Korea, 2025; p. 33. (In Korean) [Google Scholar]
  32. Khalil, A.; Khan, Z.; Attom, M.; Fattah, K.; Ali, T.; Mortula, M. Continuous Evaluation of Shear Wave Velocity from Bender Elements during Monotonic Triaxial Loading. Materials 2023, 16, 766. [Google Scholar] [CrossRef]
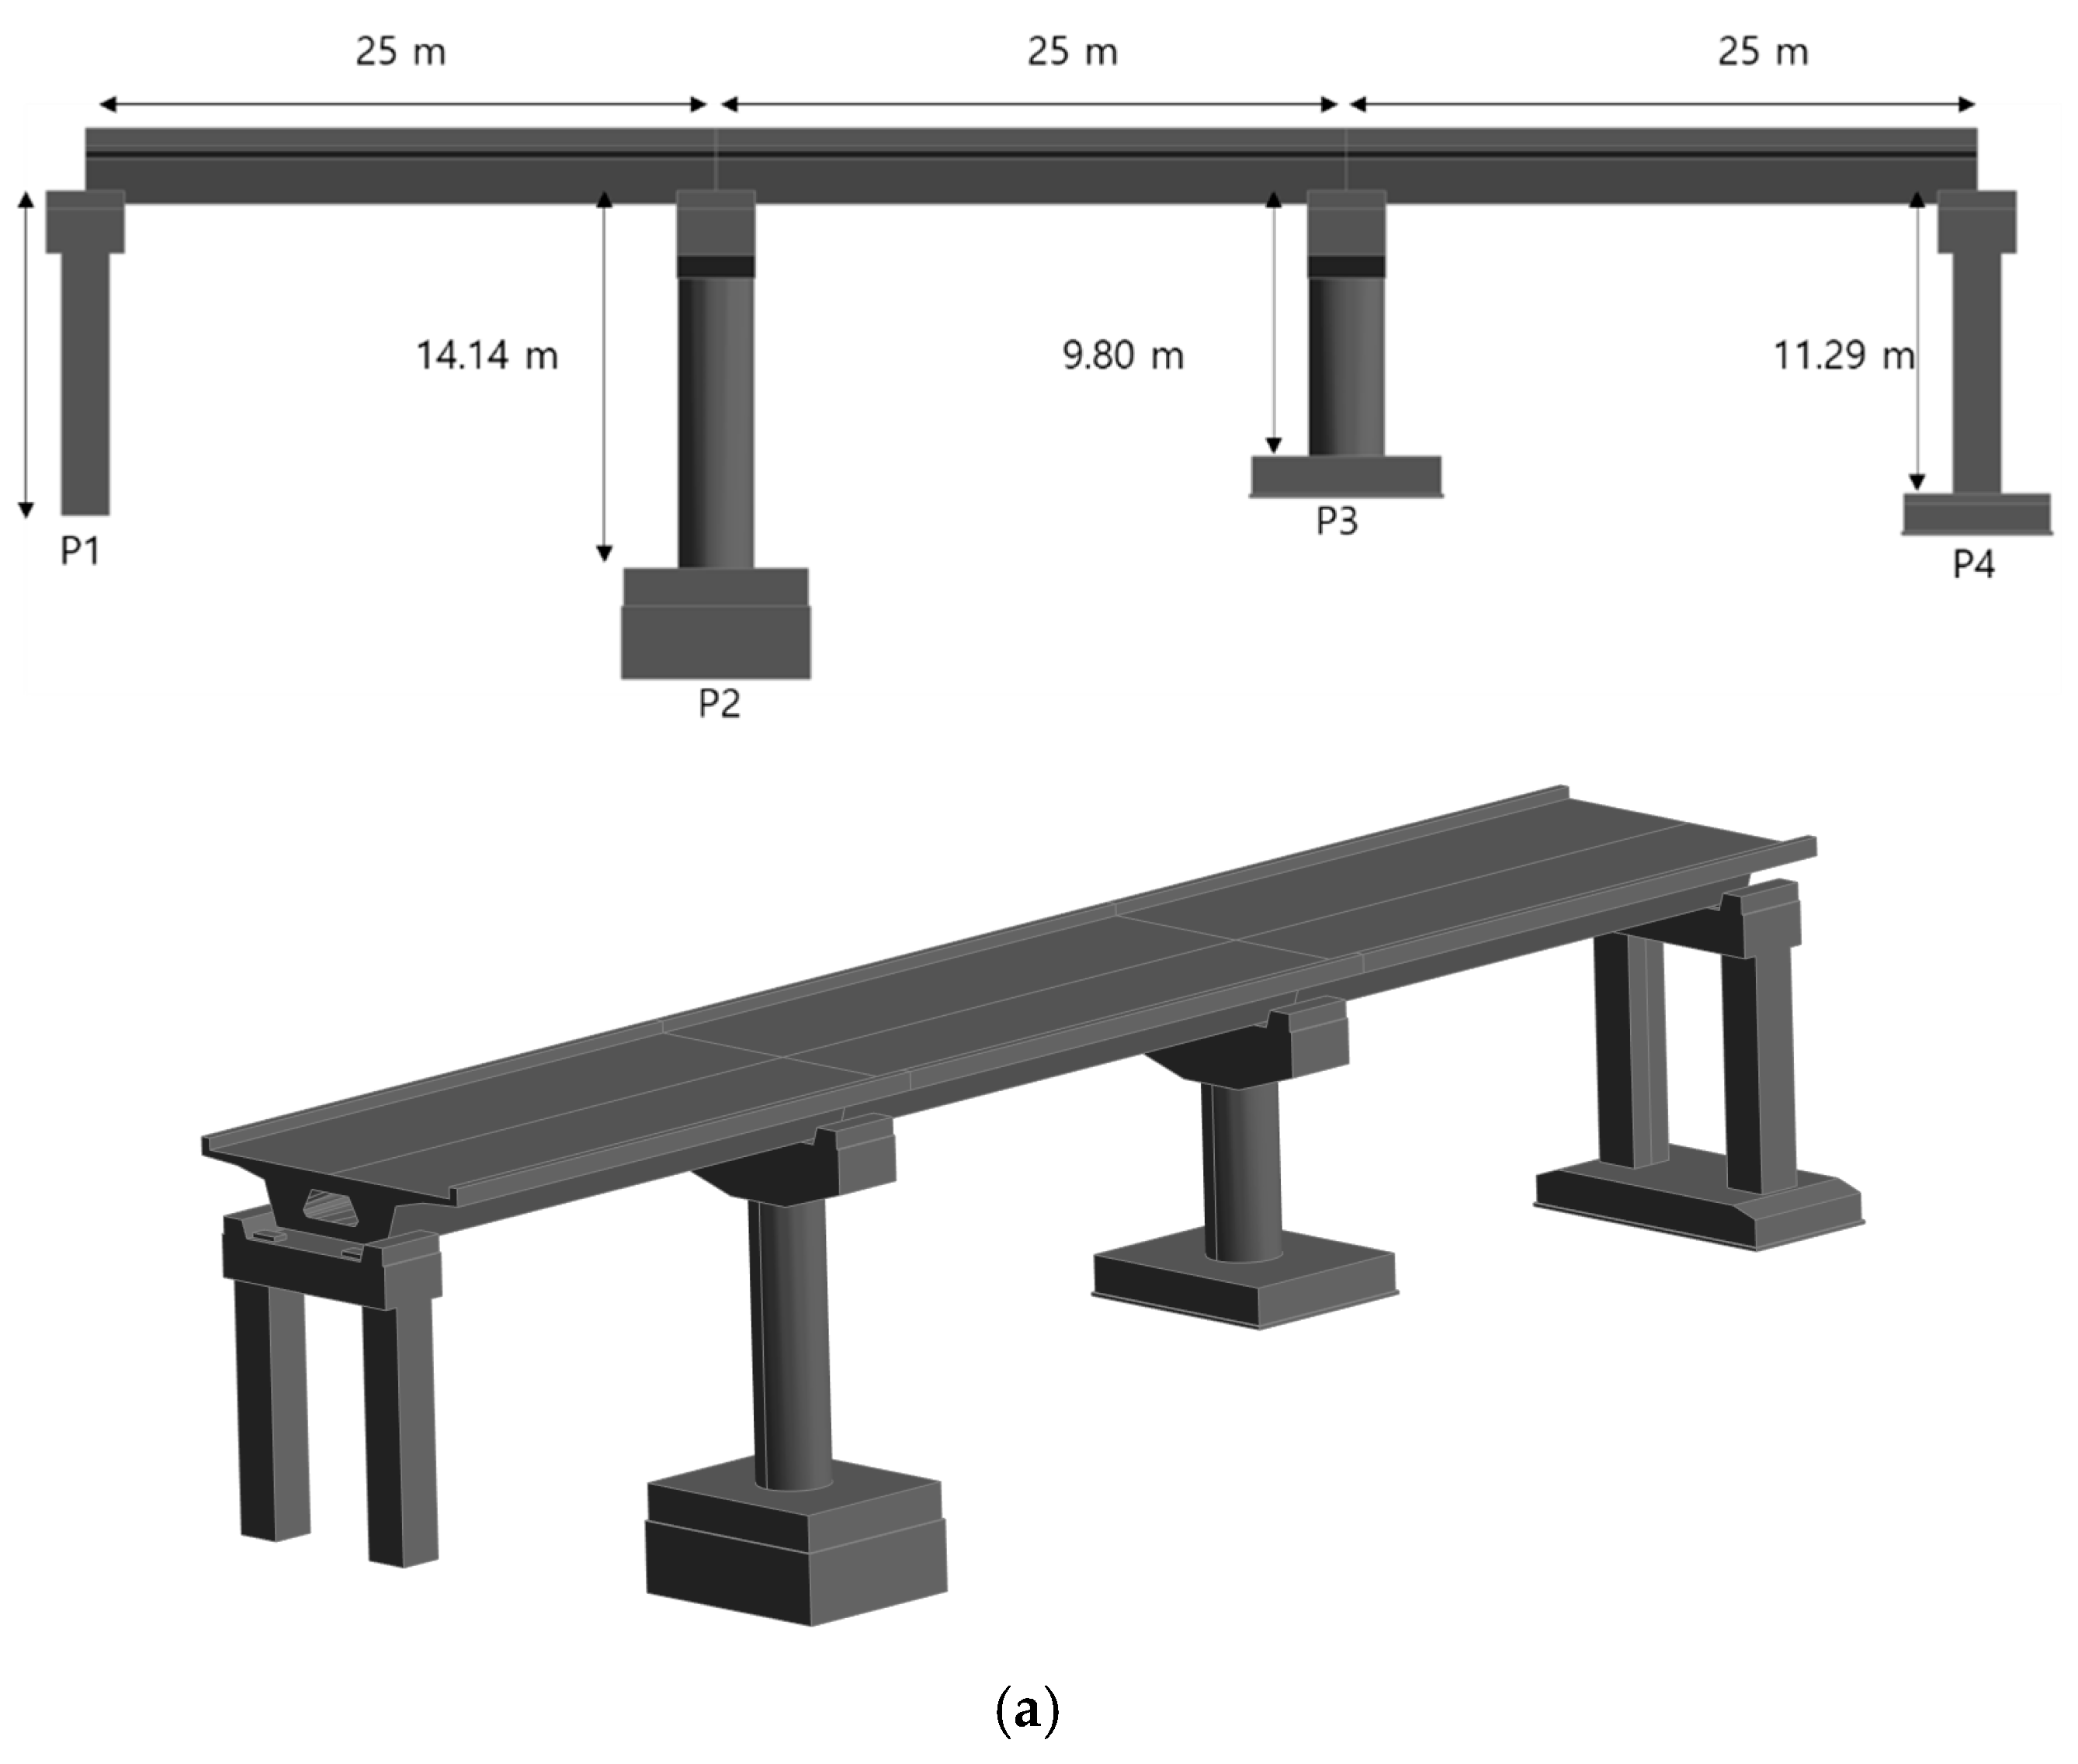
Figure 1. Numerical analysis model for railway bridge: (a) full bridge model, (b) girder model, (c) drawing of girder sections, (d) drawing of piers, and (e) Meshing.
Applsci 15 11479 g001aApplsci 15 11479 g001bApplsci 15 11479 g001cApplsci 15 11479 g001d
Figure 2. Framework of dynamic analysis.
Applsci 15 11479 g002
Figure 3. Measured blast ground motion velocity time series: (a) time series, (b) short-time Fourier transform.
Applsci 15 11479 g003
Figure 4. Input time series for ground motions (0.5 kine and 0.064 g).
Applsci 15 11479 g004
Figure 5. PSD for input ground motions.
Applsci 15 11479 g005
Figure 6. Monitoring points in the bridge.
Applsci 15 11479 g006
Figure 7. Velocity time series at point 1, 0.5 kine: (a) same range, (b) zoom-in of blast-induced time series.
Applsci 15 11479 g007
Figure 8. PSD of velocity time series at point 1, 0.5 kine.
Applsci 15 11479 g008
Figure 9. Displacement time series at point 1, 0.5 kine: (a) same range, (b) zoom-in of blast-induced time series.
Applsci 15 11479 g009
Figure 10. PSDs of displacement time series at point 1, 0.5 kine.
Applsci 15 11479 g010
Figure 11. Maximum velocity of measuring points (0.5 kine and 1.0 kine).
Applsci 15 11479 g011
Figure 12. Maximum displacement of measuring points (0.5 kine and 1.0 kine).
Applsci 15 11479 g012
Table 1. Material properties for railway bridge analysis.
ParametersDensity (kg/m3)Modulus of Elasticity (MPa)Poisson’s RatioDamping Ratio
Properties250032,0000.180.05
Table 2. Summary of the input ground motions.
GroupCase #Input Ground MotionScale
A1BlastMax. velocity of 0.5 kine
2Kobe EarthquakeMax. acceleration of 0.064 g
3Pohang EarthquakeMax. acceleration of 0.064 g
B4BlastMax. velocity of 1.0 kine
5Kobe EarthquakeMax. acceleration of 0.128 g
6Pohang EarthquakeMax. acceleration of 0.128 g
Table 3. Maximum velocity of measuring points (0.5 kine).
(unit: m/s)
DirectionMotionProbe 01Probe 02Probe 03Probe 04Probe 05Probe 06Probe 07
x-
direction
blast0.004980.004630.003010.003600.002610.003470.00595
Kobe0.100160.093440.091850.093490.096340.093610.09104
Pohang0.065950.065140.064270.063430.064520.063250.06464
y-
direction
blast0.001830.001930.001500.002220.001280.001800.00198
Kobe0.157170.177790.195140.193360.170180.138500.10346
Pohang0.078550.080220.082000.081760.078110.068810.05574
z-
direction
blast0.012570.019280.008850.026590.008910.017970.01319
Kobe0.024400.089350.034870.152140.031010.101920.02379
Pohang0.016000.023790.015750.032060.015510.028690.01492
Table 4. Maximum velocity of measuring points (1.0 kine).
(unit: m/s)
DirectionMotionProbe 01Probe 02Probe 03Probe 04Probe 05Probe 06Probe 07
x-
direction
blast0.009970.009260.006020.007190.005220.006930.01190
Kobe0.200330.186920.183730.187000.192680.187240.18206
Pohang0.131890.130270.128530.126850.129040.126500.12927
y-
direction
blast0.003660.003860.003000.004450.002570.003610.00397
Kobe0.314280.355560.390320.386740.340290.277010.20692
Pohang0.157100.160450.164000.163510.156220.137620.11148
z-
direction
blast0.025140.032530.017690.053190.017820.031710.02637
Kobe0.048770.178690.069730.304210.062040.203800.04762
Pohang0.032010.047580.031510.064070.031020.057380.02984
Table 5. Maximum displacement of measuring points (0.5 kine).
(unit: m)
DirectionMotionProbe 01Probe 02Probe 03Probe 04Probe 05Probe 06Probe 07
x-
direction
blast0.000030.000020.000010.000010.000020.000020.00003
Kobe0.008830.008740.008810.008740.008810.008720.00873
Pohang0.007380.007370.007390.007360.007410.007330.00738
y-
direction
blast0.000010.000000.000000.000000.000000.000000.00000
Kobe0.012060.013450.014070.013890.012360.009820.00681
Pohang0.008440.008960.009300.009360.009040.008480.00796
z-
direction
blast0.000070.000150.000070.000260.000060.000150.00007
Kobe0.002030.002840.002180.003570.002170.002930.00233
Pohang0.002130.002360.002270.002500.002260.002350.00253
Table 6. Maximum displacement of measuring points (1.0 kine).
(unit: m)
DirectionMotionProbe 01Probe 02Probe 03Probe 04Probe 05Probe 06Probe 07
x-
direction
blast0.000060.000050.000030.000020.000030.000050.00006
Kobe0.017670.017480.017630.017480.017630.017450.01747
Pohang0.014750.014730.014770.014720.014810.014660.01476
y-
direction
blast0.000010.000010.000010.000010.000010.000010.00001
Kobe0.024110.026900.028140.027770.024720.019640.01362
Pohang0.016870.017910.018600.018730.018080.016960.01592
z-
direction
blast0.000140.000290.000130.000530.000120.000310.00013
Kobe0.004050.005690.004370.007150.004340.005860.00465
Pohang0.004260.004720.004540.005000.004510.004700.00507
Disclaimer/Publisher’s Note: The statements, opinions and data contained in all publications are solely those of the individual author(s) and contributor(s) and not of MDPI and/or the editor(s). MDPI and/or the editor(s) disclaim responsibility for any injury to people or property resulting from any ideas, methods, instructions or products referred to in the content.