Abstract
Under severe reactor accident conditions, the solidified crust of a relocated corium pool may undergo contact melting of internal metallic structures. This process, significantly influenced by complex intermetallic interactions, deviates markedly from conventional analysis. This study provides the first experimental investigation into the influence of the eutectic reaction on the horizontal contact melting process between a crusted melt and a metal plate. Tin is used as a simulant material to replicate intra-reactor mechanisms via its eutectic reaction with copper. Analysis of temperature response and melting velocity revealed that the eutectic reaction drastically enhances heat transfer efficiency during contact conduction, increasing the temperature change rate by up to a factor of 5.36 and substantially accelerating melting initiation. Furthermore, the three-dimensional heat conduction effect of the heat source caused an initial increase in melting rate, while melt relocation subsequently reduced the contact melting speed. Based on experimental data, this work provides an in-depth analysis of melt migration and relocation during contact melting, offering a valuable experimental basis for developing severe accident models.
1. Introduction
Owing to the complex irradiation conditions and the high-temperature, high-humidity environment within reactors, the safety performance of internal components has garnered significant attention in recent years [1]. Core meltdown, as the initiating event and critical phase of a reactor severe accident [2,3], significantly influences the progression of the severe accident. Numerous high-temperature experimental studies on in-core melting progression have been conducted internationally, providing reasonable explanations for fuel failure mechanisms and phenomena of significance within the core [4]. Related models have been incorporated into severe accident codes [5]. In addition to studies on high-temperature prototypic materials, simulant materials have been employed in recent years as analytical subjects for core fuel assembly melting [6,7,8,9], aiming to achieve visualization of experimental phenomena and to uncover fuel failure mechanisms and molten material relocation behavior. Current visualization studies have predominantly focused on the early-stage failure of fuel assemblies and the melting-relocation process of molten materials. However, as evidenced by the core meltdown progression in the Three Mile Island accident [10], relocated molten material may solidify to form a molten pool. As this pool expands, the solid crust on its surface may mechanically interact with internal structures (such as support plates, core shrouds, baffles, and other supporting components), potentially leading to contact melting [11]. As a primary source of metal for the lower head molten pool, the melting progression of supporting components influences the thickness of the metallic layer. This metallic layer induces a heat concentration effect on the lower head wall, posing a threat to the integrity of the reactor pressure vessel [12]. Furthermore, unlike UO2 fuel with its high melting point, dispersion fuel elements have a relatively low melting temperature. Consequently, a high-temperature solidified crust may undergo contact melting with the dispersion fuel elements supporting it from below, thereby affecting the severe accident progression [13]. Currently, there is limited research on this specific type of melting process, and a lack of relevant experimental data, which introduces significant uncertainty into the analysis of this phenomenon within severe accident codes.
Contact melting refers to the phenomenon that occurs when a solid phase change material is subjected to mechanical contact with a heat source whose temperature exceeds the material’s melting point. It has been widely applied in various fields such as thermal energy storage, welding, geological exploration, and nuclear technology [14]. Based on the relative motion mode between the heat source and the solid, research on contact melting is primarily categorized into two types [15,16]: one where the phase change material (PCM) moves relative to a stationary heat source, and the other where the heat source moves relative to stationary PCM. The analytical methods and results differ for these two categories. Current experimental studies on contact melting mainly focus on the process driven by PCM motion, which differs from the heat-source-driven contact melting scenario involving a solidified crust interacting with internal structures or dispersion fuel elements. Current experimental investigations on heat-source-driven contact melting remain limited, and most existing studies focus on the melting process of heat sources against semi-infinite non-metallic materials [17]. During severe reactor accidents, the metallic internal structures undergo complex intermetallic reactions during the melting process [18]. However, the influence of such reactions, particularly eutectic interactions, on the contact melting process has not been addressed in existing experimental studies. Furthermore, the dimensions of these structures are considerably smaller than those of the molten pool, which differs significantly from existing experimental studies on contact melting. Therefore, the in-core contact melting process and melt relocation behavior require further experimental investigation.
To analyze the contact melting process of a molten pool’s solidified crust against stainless steel components within a pressurized water reactor core, a Contact Melting Process Apparatus (CMPA) was developed in this study. The visual image data obtained from the CMPA experimental system, combined with the temperature data acquired by the data acquisition system, can be utilized to provide essential support and validation for theoretical models, numerical simulation codes, and key models used in severe accident analysis. Referencing the core melting phenomenon observed in the Three Mile Island accident, where the corium crust exhibited a bowl-shaped structure [19], the crust in the central region of the core appears relatively flat. Its contact with underlying components can be approximated as horizontal. Building on our prior theoretical model for this contact configuration [20], the present study focuses specifically on the horizontal contact melting process at the core center. Using tin as a suitable simulant phase change material, we conducted experiments with a horizontal heat source melting against a flat plate. The experimental results, including temperature response, melt relocation, and melting velocity, are discussed in detail.
2. Experimental System and Procedure
2.1. CMPA Experimental System and Setup
As shown in Figure 1a, the CMPA experimental apparatus consists of four main components: a visualization chamber, an instrument control console, imaging equipment, and a data processing terminal. Figure 1b shows an internal view of the visualization chamber. The chamber is equipped with a removable drawer to facilitate experimental setup and cleanup. An elevated platform is mounted on the drawer to provide a stable base for camera recording. Since the heater moves downward along the direction of gravity during the contact melting process, guide columns and positioning pins are installed on the platform to ensure stable movement of the heat source and the phase change material below it.
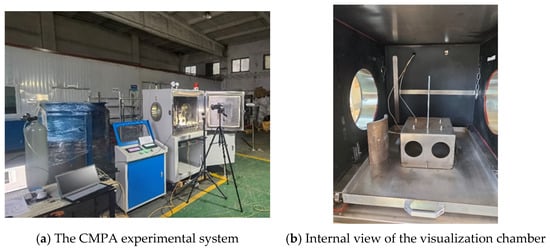
Figure 1.
The CMPA experimental setup.
The heat source consists of a copper heater block measuring 20 cm × 12 cm × 1.5 cm. The melting block measures 3 cm × 2 cm × 10 cm, with four temperature measurement points installed on its side surface at a depth of 1.5 cm to monitor temperatures at mid-height cross-sections. The plate-shaped melting block, serving as the phase change material, is fixed on the working platform. The heater block is placed in tight contact with the melting block, with their centerlines aligned. The geometric relationship between the heater block (red) and phase change material block (blue), along with the locations of measurement points, is shown in Figure 2.
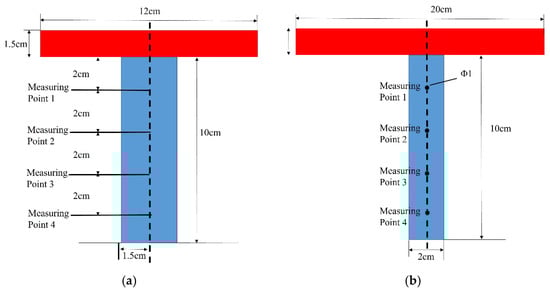
Figure 2.
Schematic of the CM01 experimental installation and measurement points layout. (a) Front view schematic of the measurement point arrangement. (b) Left view schematic of the measurement point arrangement.
Five temperature measurement points are arranged on the upper part of the heater block to monitor temperature variations during the experiment. Due to the large volume of data, this study selectively records three thermocouple points adjacent to the contact area. The arrangement and numbering of these measurement points are shown in Figure 3. Specifically, point 5 corresponds to the central thermocouple of the heating assembly, point 6 to the right-side thermocouple, and point 7 to the left-side thermocouple.
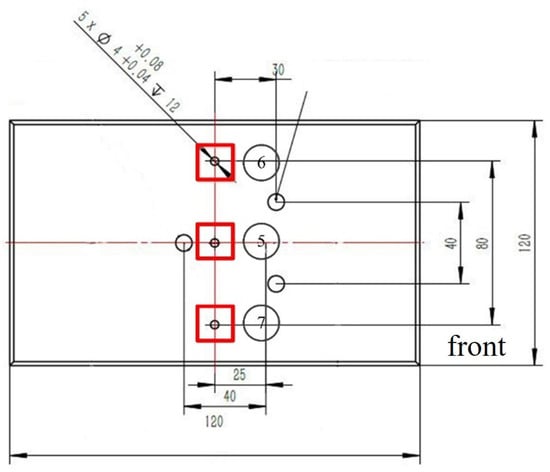
Figure 3.
Schematic of the heater block showing the arrangement of thermocouple points.
To facilitate heat loss analysis, two patch-type thermocouples are attached to the surface of the melting platform and the guide column to calculate heat dissipation to the environment during the melting experiment. The arrangement of measurement points and their corresponding numbering are shown in Figure 4.
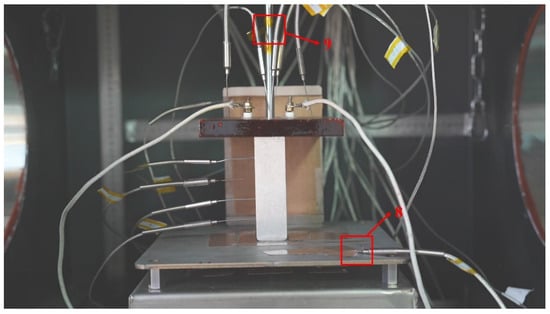
Figure 4.
Arrangement of thermocouple points on the working platform.
For clarity in subsequent descriptions, all thermocouples used in the experiment and their respective locations are summarized in Table 1.

Table 1.
Thermocouple numbers and corresponding positions.
To monitor ambient temperature for heat loss analysis, an infrared camera was employed. Figure 5 shows the camera in use during an experiment. This technique effectively maps the temperature distribution of the air inside the experimental chamber throughout the melting process. Since heat is primarily dissipated via natural convection within the chamber, the data from the infrared camera, combined with an empirical correlation for natural convection heat transfer, were used to calculate the heat loss. This calculated value was subsequently applied to correct the effective heating power.
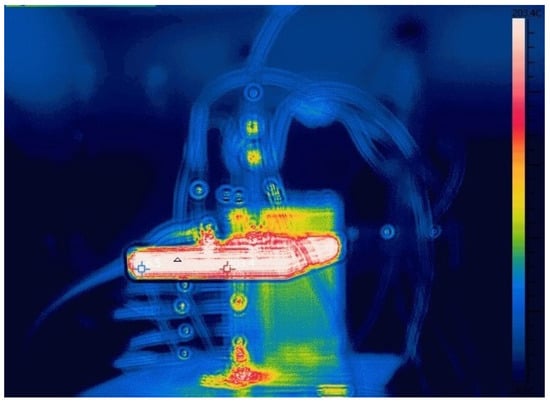
Figure 5.
Experimental process images captured by infrared camera.
2.2. Selection of Simulant Materials
Given the high melting point of actual stainless steel, surrogate materials are commonly employed in experimental studies. To effectively compare the behavior of these surrogates during contact melting, particular attention must be paid to their thermophysical properties and transport characteristics. Key thermophysical aspects include the relative importance of convective heat transfer versus thermal conduction within the liquid film. Regarding transport behavior, the focus lies on the potential for solidification and relocation of the liquid film as it drains downward along the wall of the phase change material.
This study selects the Prandtl number () as the key thermophysical parameter for comparison, where is the dynamic viscosity of the melt, is the specific heat capacity of the molten metal, and is its thermal conductivity. It represents the ratio of momentum diffusivity to thermal diffusivity and serves as a crucial dimensionless number linking fluid flow and heat transfer.
Furthermore, the Stefan number is selected as the comparative parameter for transport behavior. It is defined as , where Tm is the initial temperature (melting point) of the melt, and Te is the external ambient temperature. For the core materials, the ambient temperature is set to 1473 K, based on the reactor temperature data associated with core melt pool formation as calculated in reference [21]. For the simulant materials, the ambient temperature is the experimental environment temperature of 293 K. As the melt migrates and is cooled by the environment, the Stefan number reflects its tendency to solidify. A smaller Stefan number signifies greater resistance to solidification.
Table 2 summarizes the comparison of dimensionless parameters for the various simulant materials, derived from their physical properties [22,23].
Table 2.
Comparison of dimensionless parameters for different materials.
Based on the comparative analysis above, it can be concluded that organic compounds commonly used in contact melting experiments show limited compatibility in key physical properties with actual reactor core materials, making them inadequate for effectively simulating the contact melting process under severe accident conditions.
In contrast, metallic tin demonstrates close agreement with stainless steel in terms of the Prandtl number, which characterizes the heat transfer behavior of the liquid film. However, when it comes to solidification behavior during melt relocation, all commonly used simulant materials deviate from stainless steel to some extent. The Stefan number of tin differs from that of stainless steel by approximately 33%. Although tin has limitations in simulating relocation behavior—tending to result in higher relocation positions and a larger solidified fraction compared to actual in-core melt behavior—it still offers valuable insights for analysis.
During reactor core melting processes, complex intermetallic interactions occur, such as Zr-UO2 dissolution and Fe-Zr reactions, which significantly influence core melting progression [24,25]. The eutectic reaction, though it does not capture the full complexity of in-reactor metal dissolution and chemical oxidation, nevertheless serves as a valuable simplification for reactor core studies [7]. Therefore, metallic tin was selected as the simulant material for internal structures in this study.
Figure 6 shows the binary phase diagram of the Sn-Cu system [26]. When the tin content exceeds 60.9 wt%, η-phase and θ-phase solid alloys form upon heating to 459 K. Upon reaching 500 K, copper and tin react to form a liquid eutectic structure with a tin-matrix phase and a solid η-phase Cu6Sn5 alloy. The Cu6Sn5 phase has a melting point of 913 K and a thermal conductivity of 34 W/(m·K), which is significantly lower than that of pure copper and tin. Thus, this study utilizes the Sn-Cu eutectic reaction to simulate the effects of intermetallic interactions on contact melting behavior in reactor scenarios.
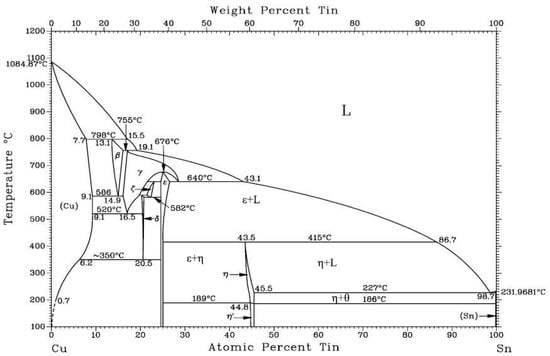
Figure 6.
Sn-Cu binary phase diagram [26].
2.3. Experimental Data Acquisition
The spatiotemporal characteristics of melting were primarily recorded through the downward migration process of the heater block. The melting velocity, as a key physical parameter requiring focused attention, is crucial for validating theoretical relationships. The entire melting process was recorded by a camera. To obtain complete visual documentation, a batch processing program was used to capture images from the experimental video at 1 s intervals. The melting distance was extracted using a self-developed post-processing program, following these specific steps: First, all captured images underwent standardized cropping to ensure consistent perspective, establishing a unified benchmark for subsequent pixel coordinate analysis. Subsequently, targeting the vertex of the heating assembly as the reference point, its pixel coordinates in each second-by-second image were acquired. The y-coordinate value of this point represents the pixel-based melting distance (hpixel) at each time point. Finally, utilizing the known actual thickness (l) of the heater block and its corresponding pixel distance (lpixel) in the images, the conversion ratio (scale factor) between pixels and physical distance was calculated. This ratio was then applied to convert the measured pixel distance (hpixel) into the actual melting distance (h). The complete workflow for obtaining the melting distance is illustrated in Figure 7. To reduce computational load and optimize measurement accuracy, this study set the acquisition frequency of melting distance at 10 s intervals. This approach is primarily based on two considerations: first, the extended experimental duration and large volume of image data would impose significant computational burden if processed on a per-second basis; second, the melting process itself progresses relatively slowly, and excessively high sampling frequencies (such as per-second) may amplify measurement noise and image processing errors in the data sequence, thereby obscuring the true melting trend.
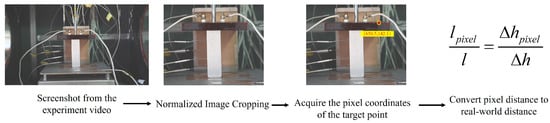
Figure 7.
Flowchart of the melting distance acquisition procedure.
For temperature measurement, thermocouples were fixed using a drill-hole insertion method. However, during the experiment, thermal expansion of the heater block material caused an increase in the diameter of the installation holes. As the heater block moved downward under gravity following the melting of the phase change material, loosening occurred at the thermocouple insertion points on its upper surface. This was primarily manifested as a reduction in the insertion depth of the thermocouple measurement points.
To meet the research requirements for investigating transient melting processes, it is necessary to simultaneously calculate the temperature change rate and the melting velocity. Temperature data were acquired by a high-frequency data acquisition unit, resulting in dense data points. Therefore, this study employs the central difference method to differentiate the original temperature data T(t) to obtain the temperature change rate dT/dt (see Equation (1)). For boundary points (initial and final points), backward difference and forward difference schemes are applied, respectively (see Equation (1)). To effectively suppress noise and reveal data trends, the Savitzky–Golay filter method was used to smooth the raw differential data (dT/dt).
2.4. Uncertainty Analysis
The directly measured data in the experiment include spatiotemporal characteristics of melting and temperature variations from thermocouples. All measuring instruments used in the experiment underwent strict calibration prior to measurement. Table 3 shows the main measuring instruments employed in the experiment along with their uncertainties. The maximum measurement error originates from manufacturing tolerances, with uncertainty defined by the formula B = ∆/, where Δ represents the maximum error.
Table 3.
Experimental measurement uncertainty.
The primary data analyzed in this study included both the melting velocity (U) and the temperature change rate, in addition to direct measurements. The uncertainties associated with these two derived parameters, as determined by the propagation of uncertainty formula BdT/dt = BT/, were calculated to be 2 × 10⁻⁵ m/s and 0.04 K/s, respectively.
2.5. Experimental Procedure
This study conducted two sets of contact melting experiments involving a flat heater block and a narrow rectangular block, designated as CM01_1 and CM01_2, with a heating power of 300 W for both experiments. After melting commenced and before the heater block melted down to the uppermost thermocouple, the distance from the top surface to the base platform was measured using a vernier caliper at that specific moment, and the topmost thermocouple was removed. After all thermocouples on the melting block had been removed, the heating power was switched off. The time and vernier caliper measurement at this moment were recorded, and the measuring equipment was then shut down.
3. Results and Discussion
3.1. Analysis of Temperature Response
Figure 8 shows the temperature variation plot for Experiment CM01_1. Under constant power conditions, the temperature of the heater block increased monotonically before phase change occurred. Temperature measurement points 6 and 7 on the right and left sides of the heating assembly were significantly higher than the central point 5, with the temperature difference between them gradually widening. The temperature difference between points 6 and 7 remained within 2 K, while the maximum temperature difference between point 5 and the side points reached 16.21 K. This is because during the heating phase, the central contact area of the heater block conducted heat through contact with the tin block, while other non-contact areas exchanged heat with air. Since heat transfer to air is significantly less efficient than conduction to the tin block, the central region exhibited noticeably lower temperatures.
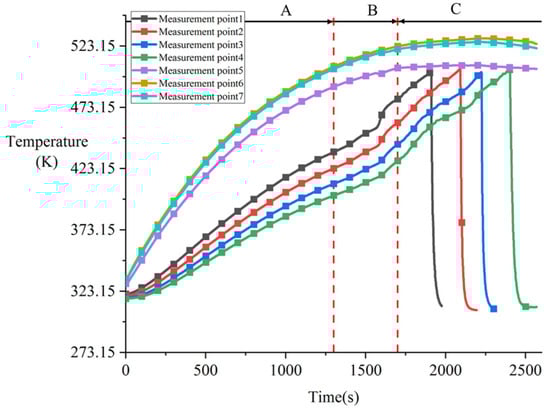
Figure 8.
Variation in temperature during contact melting of the Cu-Sn pair under a heating power of 300 W (Experiment CM01_1).
Due to the extended duration of the experiment and significant temperature increase, certain details in the overall temperature variation curve are difficult to distinguish. To more clearly analyze the temperature response characteristics and their physical mechanisms at different stages, this study divides the temperature variation process into three phases: Phase A, where all measurement points began to heat up under the heating power and the temperature change rate gradually decreased due to enhanced convective heat transfer with the surrounding environment (corresponding to 0–1300 s in Figure 8); Phase B, where the melting block’s temperature change rate increased significantly while the heater block’s contact surface exhibited decreased temperature change rate or even negative growth, with no noticeable downward displacement observed (corresponding to 1300–1700 s); and Phase C, where the heater block began moving downward steadily and the melting process stabilized (after 1700 s). This study focuses primarily on analyzing Phases B and C.
Figure 9 shows the temperature variation during Phase B (as detailed in Figure 8). During the continuous heating process, the temperature at measurement point 5 exhibited an anomalous decrease at 1563 s, which persisted until 1588 s. The temperature dropped from 501 K to 500 K. During this period, a significantly increased temperature change rate can be clearly observed in the melting block in Figure 9, corresponding to the eutectic reaction between tin and copper.
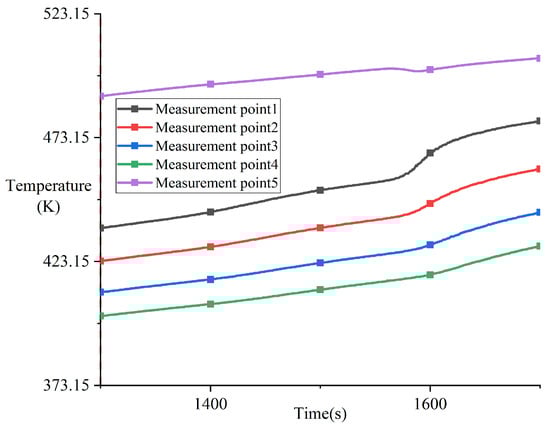
Figure 9.
Variation in temperature during phase B from 1300 s to 1700 s in experiment CM01_1.
Figure 10 shows the temperature change rate obtained by differentiating the temperature data from Figure 9 with respect to time, presenting the variation curve of the temperature change rate during Phase B. As can be observed from Figure 10, the temperature change rate of the thermocouple in the melting block exhibited two significant increases during this phase.
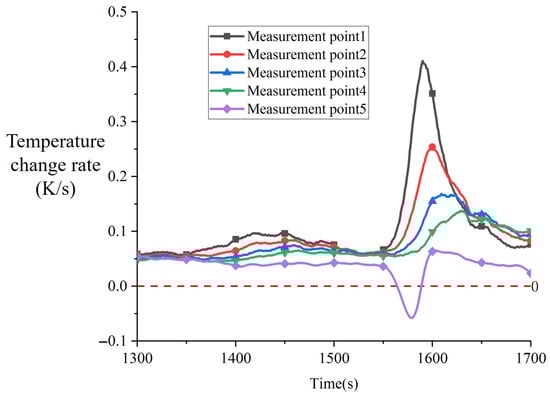
Figure 10.
Variation in temperature change rate during phase B from 1300 s to 1700 s in experiment CM01_1.
The first increase occurred from 1350 s to 1456 s, when the temperature at measurement point 1 reached 492.36 K. The temperature change rate increased from 0.059 K/s to 0.093 K/s, representing a 57% enhancement, before gradually decreasing to 0.06 K/s at 1530 s. The measurement points below the melting block also showed corresponding increases, with the magnitude of increase diminishing with increasing distance from the contact surface. At 1535 s, the temperature change rate of the melting block thermocouple began a second increase, which was more substantial and had a faster response time compared to the first one. Taking measurement point 1 as an example, the temperature change rate increased rapidly from 0.06 K/s at 1535 s to 0.382 K/s at 1591 s, representing an increase by a factor of 5.36. After reaching the peak, the temperature change rate decreased rapidly to 0.07 at 1690 s. The temperature change rate of the heater block decreased from 1300 s to 1577 s, with a rapid decline occurring between 1535 s and 1577 s, dropping below zero at 1564 s. After 1577 s, the temperature change rate of the heater block recovered rapidly between 1577 s and 1611 s, then began to decrease slowly.
The variation in temperature change rates between the heater block and the melting block is at-tributed to the metallic eutectic reaction between copper and tin. During the period from 1350 s to 1456 s, the first increase in the temperature change rate of the melting block originated from the formation of alloys via solid-state diffusion between copper and tin at 459 K. These alloys grew at the interface, gradually filling the air gaps between the contact surfaces, thereby effectively reducing the contact thermal resistance. The decrease in contact thermal resistance promoted a temperature rise at the contact surface of the melting block, with the rate of increase correlated to the extent of reduction in contact thermal resistance. The sudden temperature rise at the contact surface disrupted the existing thermal equilibrium, leading to an enhancement in the temperature change rate. As the reduction in contact thermal resistance stabilized, the temperature at the contact surface no longer changed significantly, and the heat transfer process gradually returned to being dominated by heat conduction from the upper heat source and convective heat exchange with the surroundings. Consequently, the temperature change rate decreased to normal levels.
However, during the solid-state diffusion stage, the rate of atomic diffusion through crystal lattices is relatively low, and the diffusion distance is short, making it impossible to form a macroscale alloy layer. At this stage, uneven gaps remained at the heating contact surface, and the thermal conductivity of the formed η-phase alloy was relatively low. Thus, the reduction in contact thermal resistance was limited. This resulted in a relatively small increase in the temperature change rate during the first phase and a longer response time.
When the heating time reached 1535 s and the local temperature at the contact surface attained 500 K, the eutectic composition tin-copper alloy in localized regions began to liquefy. The resulting microscopic liquid zones, under the influence of surface tension, filled the gaps at the contact interface, displacing the low-thermal-conductivity air and causing a rapid decrease in contact thermal resistance. This led to a swift temperature rise at the contact surface of the melting block. Once the liquid metal fully occupied the gaps, the reduction in contact thermal resistance slowed, and the temperature change rate at the contact surface subsequently decelerated, allowing the heat transfer process to stabilize again. Consequently, during this stage, the temperature change rate experienced a rapid increase followed by a gradual decline.
Since the reduction in contact thermal resistance during the second phase was achieved through the diffusion of liquid molten material, the response speed was significantly faster than the solid-state diffusion of the first phase, resulting in more pronounced changes in the temperature change rate. It can be concluded that the temperature variation at the contact surface during the metallic eutectic process is primarily influenced by the reduction in contact thermal resistance. As the contact thermal resistance continued to decrease, the temperature difference between the heating surface and the melting block surface gradually diminished, eventually allowing the temperature at the contact surface of the melting block to reach the melting point of tin at 505 K. At this point, large-scale melting of the melting block commenced, marking the transition of the process into the next phase.
Figure 11 shows the temperature response curve at the onset of melting phase (Phase C in Figure 8). Starting from 1700 s, the temperature change rate of the melting block decreased significantly. Combined with the temperature at the contact surface of the heater assembly at this time, it indicates that the surface temperature of the melting block had reached the melting point, and melting began to occur. As can be observed from measurement points 1–4 in Figure 11a, the overall curvature of the temperature curve of the melting block remained stable, but fluctuations occurred in localized regions. Comparing the overall experimental phases, the temperature change rate in Phase C was lower than that in Phase B but higher than in Phase A. This is because during the melting phase, the heater block moved downward as melting progressed, bringing the contact surface closer to the various measurement points. Figure 11b more clearly shows the fluctuations in the temperature change rate of the melting block. These fluctuations are caused by the solidification and heat release of the molten material during flow. The amplitude of oscillation in the thermocouple at the bottom of the melting block was significantly greater than that at the top, as solidification of the molten material occurred mostly at the bottom.
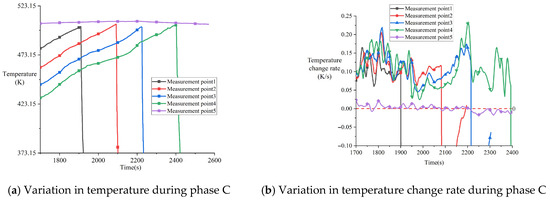
Figure 11.
Temperature response during phase C after 1700 s in experiment CM01_1.
Experiment CM01_2 was conducted as a replicate of CM01_1. Figure 11 shows the temperature variation in the thermocouples before melting in the CM01_2 experiment. As observed in the red box region of Figure 12, eutectic reaction similarly occurred around 1700 s in the CM01_2 experiment, characterized by a temperature decrease at measurement point 5 of the heater assembly and a sudden rapid temperature increase in the melting block during this phase.
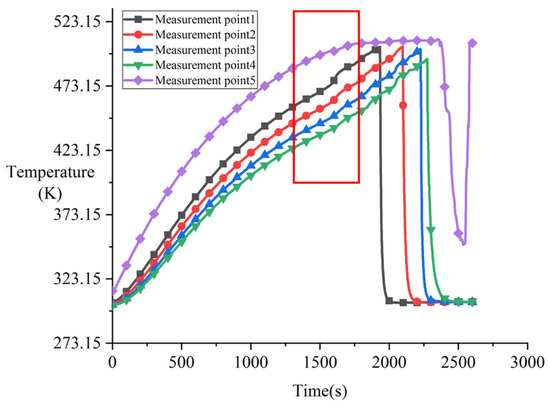
Figure 12.
Variation in temperature for experiment CM01_2 (Repeat of CM01_1).
By differentiating the temperature curve within the red box region of Figure 12, the localized temperature change rate variation curve shown in Figure 13 was obtained. Compared with CM01_1, the CM01_2 experiment exhibited only one distinct temperature change rate increase. In terms of the magnitude of this increase, the temperature change rate enhancement in CM01_2 was only 52% of that observed in CM01_1. This reduction is primarily attributed to residual eutectic material remaining on the contact surface after the first experiment, which was not thoroughly removed. These residues hindered the lattice diffusion process during the first phase, resulting in reduced eutectic liquefaction and consequently limiting the decrease in contact thermal resistance.
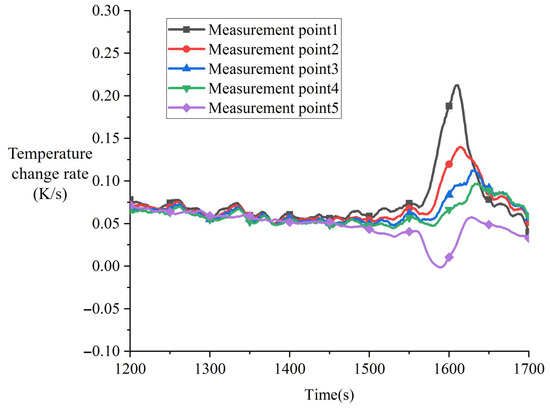
Figure 13.
Variation in temperature change rate during the eutectic phase for experiment CM01_2 (Repeat of CM01_1).
In actual reactor scenarios, the solidified crust is typically a porous medium with an irregular surface, leading to a thermal contact resistance with the underlying support material that is significantly higher than under the experimental conditions of this study. Consequently, a greater degree of superheat exists between the heater and the phase change material. Should eutectic liquefaction occur, the subsequent reduction in contact resistance would be substantially more pronounced. This would cause the temperature change rate in the bottom support material to rise by a factor considerably greater than the 5.36 observed in this work.
Furthermore, a key difference exists in material behavior. The eutectic temperature of the simulant material used here is only 5 K below its melting point, resulting in an almost immediate transition to full melting after the eutectic reaction. In contrast, in a real reactor, the eutectic reaction between stainless steel and zirconium occurs at 1573 K, while the melting point of stainless steel is as high as 1700 K, representing a much larger temperature interval.
This discrepancy implies that theoretical models which neglect the drop in contact resistance due to eutectic liquefaction would predict the onset of contact melting with significantly greater error. Consequently, this oversight would severely compromise the accuracy of predictions regarding the progression of core meltdown.
3.2. Melt Migration and Relocation Phenomena
Prior to the initiation of melting, a downward displacement of the heater was observed in experiment CM01_1, as shown in Figure 14. The displacement distance d was approximately 4.2 mm. At 1688 s, the temperature at measurement point 5 on the heater was 503 K, which had not yet reached the melting point of tin. Therefore, this phenomenon is attributed to the occurrence of a eutectic reaction. Since the eutectic reaction produces a liquid eutectic structure with a Sn-matrix phase and solid η-Cu6Sn5 intermetallic compounds, the amount of liquid phase generated is less than that during full melting. Consequently, as can be seen from the figure, although the heater moved downward, no significant outflow of molten material from the contact interface was observed.
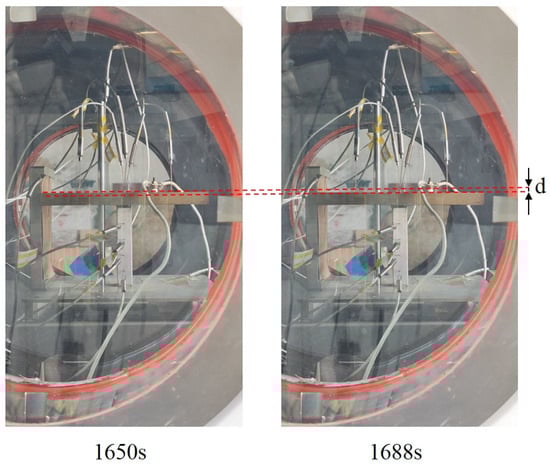
Figure 14.
Movement of the heater during the early melting phase in experiment CM01_1.
As shown in Figure 15, a schematic diagram illustrates the melt migration during the initial melting phase. Neglecting the non-uniformity of thermal resistance at the contact surface, the development of the liquid film in the early melting stage can be divided into three phases (Figure 15a).
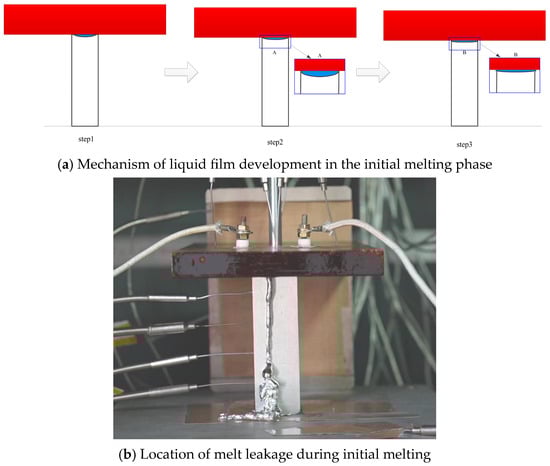
Figure 15.
Schematic diagram of melt migration during the initial melting phase.
In the first phase, melting initiates preferentially in the central region due to heat dissipation from the peripheral surfaces of the tin block to the surrounding air. Consequently, the temperature of the heater assembly decreases as heat is absorbed by the melting process. Since the outer regions of the tin block remain solid and continue to provide support, the heater maintains its position, and a small molten pool gradually forms at the contact interface.
Upon entering the second phase, the heater assembly melts the tin at the contact surface and begins to move downward. The molten tin accumulates in the molten pool; however, the weight of the heater assembly is significantly greater than the pressure exerted by the liquid tin, confining the melt within the contact interface and preventing immediate leakage. As melting continues, the melt accumulates further, and a liquid film gradually develops.
The third phase commences with the formation of this liquid film. At this stage, melt is continuously generated and begins to leak outward through the liquid film. Due to the faster melting rate in the central region, leakage occurs primarily from the center rather than as a overall collapse-type flow, as detailed in Figure 15b.
After the onset of melting, the molten material seeped out along the short edge of the contact surface in the form of candle dripping. Figure 16 shows the formation process of molten droplets at the beginning of contact melting. As can be observed in the timeline, the droplets took a relatively long time to form during the initial melting stage. The development from droplet formation to detachment took 14 s and 17 s, respectively. At this stage, the contact melting was in the liquid film formation phase, and the gap within the liquid film at the contact interface was narrow. Due to the high viscosity and surface tension of the liquid metal, the initial leakage had to overcome both surface tension and flow resistance, resulting in a prolonged droplet seepage time.
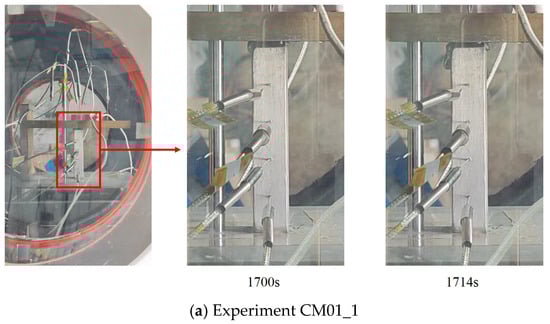
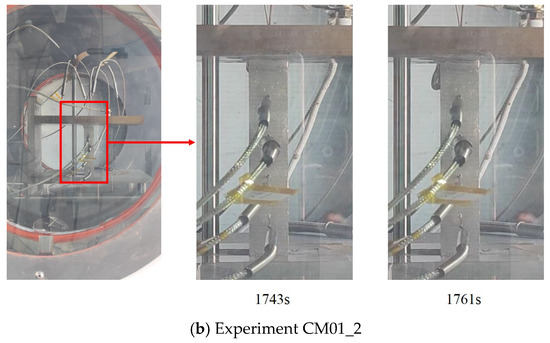
Figure 16.
Droplet detachment during initial melting in CM01 experiments.
Following the initial formation of the liquid film, the molten material began to rapidly exude and detach along the short-edge direction. Figure 17 shows continuous candle dripping during melting in experiment CM01, with two instances marked as ① (CM01_1) and ② (CM01_2). Comparison with Figure 16 reveals that after liquid film development, the process from the formation of molten droplets to their detachment was significantly faster, taking only approximately 2 s. The droplets exhibited smaller dimensions both laterally and vertically, consistent with the accelerated release mechanism.
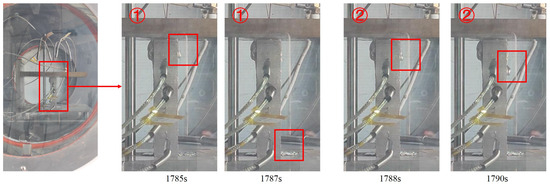
Figure 17.
Continuous candle dripping phenomenon of molten material during melting.
After the liquid film between the contact surfaces became fully developed, the molten material began to flow out of the contact melting zone along the short-edge direction—following the spreading direction of the liquid film—and moved downward along the wall of the melting assembly. Part of the melt wetted the surrounding wall surfaces, while the rest continued to migrate downward. As the temperature decreased due to heat exchange with the environment, the migrating melt accumulated and solidified on the wall, forming a solidified layer. Subsequently, newly generated molten material, upon reaching the mid-lower part of the assembly, partially detached from the wall in fragment form during solidification, as shown in Figure 18. The figure shows the results for experiments CM01_1 (marked ①) and CM01_2 (marked ②).
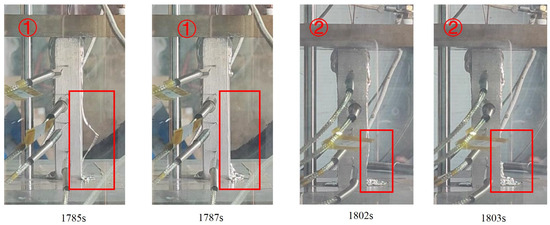
Figure 18.
Process of solidified fragment detachment.
Figure 19 illustrates the process of solidified fragment detachment. In the initial stage, when the molten material encounters the cooler wall surface at a relatively low flow rate, it achieves sufficient contact with the upper wall region of the melting assembly. This promotes solidification and the formation of an adherent solidified layer on the wall surface.
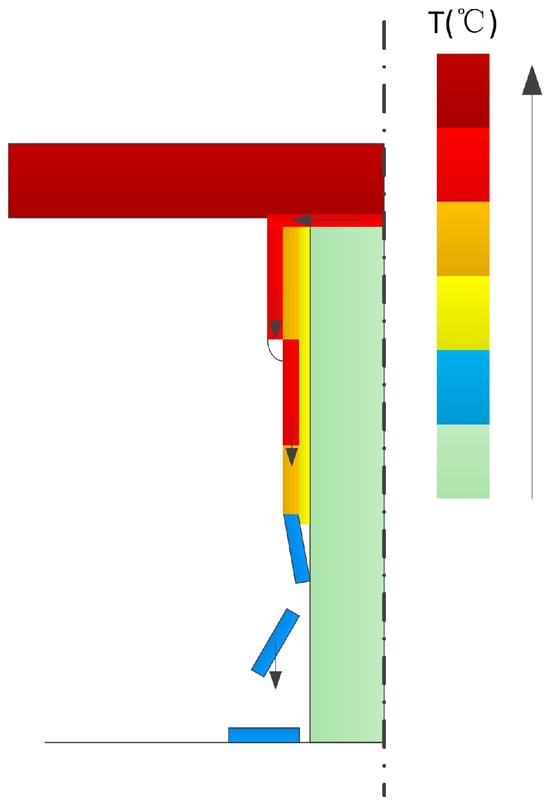
Figure 19.
Schematic diagram of the solidified fragment detachment model.
As melting progresses, molten material continuously flows out of the contact melting zone and initially comes into contact with the pre-existing solidified layer. Since the temperature of the solidified layer is higher than that of the melting assembly wall, the melt flows downward along its surface under gravity with gradually increasing velocity. Owing to the favorable wettability between the melt and the solidified layer, the migration primarily manifests as a rivulet flow. During this process, a portion of the molten material solidifies, thereby thickening the solidified layer.
When the melt flows onto colder wall regions not yet covered by the solidified layer, it rapidly solidifies and may detach in the form of fragments. The underlying mechanism is as follows: during solidification, the melt undergoes volumetric contraction. If the bonding with the wall is weak, the resulting tensile stresses induce void formation, causing the solidified layer to lose support and detach. This effect is particularly pronounced when the melt, accelerating downward from the top, reaches the transition zone between the solidified layer and the cold wall. The high flow velocity and insufficient bonding strength in this region make fragment detachment more likely.
As melting proceeds, the accumulated solidified material in the upper part of the melting assembly continues to increase. Once a critical mass is reached, the adhesive force can no longer support the weight under gravity, leading to spallation as shown in Figure 20. Based on the above analysis, a fundamental reason for fragment generation is the relatively low temperature of the wall surface.
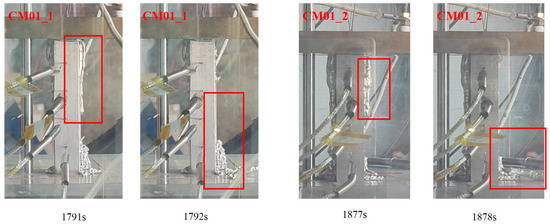
Figure 20.
Detachment process of a large solidified fragment.
After a solidified layer gradually forms and adheres to the wall of the melting assembly, subsequent molten material migrates over this layer in the form of rivulet flow, as illustrated in Figure 21. Since the temperature of the solidified layer is higher than that of the melting assembly wall, most of the molten material remains liquid, flows onto the work platform, and accumulates there through further migration.
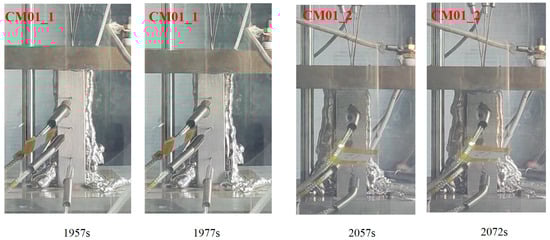
Figure 21.
Image of rivulet flow phenomenon during melting.
3.3. Melting Velocity Analysis
Figure 22 presents the variation in melting velocity with time for both CM01 experiments. As shown in the figure, the melting velocity initially increases and then gradually decreases as melting progresses. During the melting process, the melting velocity exhibits small-amplitude fluctuations over time, which are associated with data oscillations caused by errors during data reading. The two experiments demonstrate good reproducibility, and therefore, the CM01_1 experiment is selected for subsequent analysis.
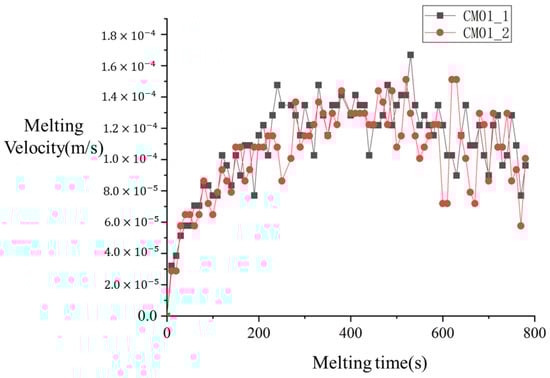
Figure 22.
Variation in melting velocity with time for both CM01.
The heater block is divided into contact and non-contact zones based on thermal conduction contact with tin. Neglecting convective heat exchange with air, the temperature change rate () in the contact zone during melting is expressed by the following equation:
In the equation, represents the heat transfer from other regions of the heater block to the contact surface area, and denotes the volumetric heat flux generated by the heater itself. is the heat absorbed by melting, expressed as , where is the density of the melting block, is the latent heat of fusion of the melting block, and U is the melting velocity. In this study, the heating power, material properties, and geometric shape of the heater block remain unchanged.
Figure 23a shows the variation in the temperature change rate at measurement point 5 with time after the onset of melting in CM01_1. During the melting process, the temperature in the contact area fluctuates slightly around zero, indicating that it remains near the melting point throughout melting. The heat transfer from non-contact regions of the heater block to the contact area, , can be solved using the heat conduction differential equation for non-contact regions.
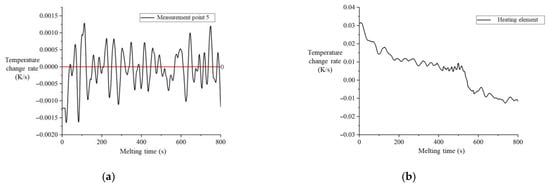
Figure 23.
Temperature response in CM01_1 experiment after melting initiation. (a) Variation in temperature change rate at measurement point 5 versus time. (b) Variation in temperature change rate of the heater block versus time.
Neglecting convective heat transfer with air, the heat conduction differential equation for the non-contact regions of the heater block is given by:
Under constant heating power , the temperature change rate in the non-contact regions exhibits a negative correlation with the heat transfer to the contact area. As shown in Figure 23b, during the first 500 s of melting, the average temperature change rate of the heater block initially decreases and then stabilizes. This occurs because the temperature in the non-contact regions is higher than that in the contact region. During melting, heat is transferred from the non-contact regions to the contact region. As the temperature difference increases, the heat transfer intensifies until thermal equilibrium is approached.
By combining Equations (2) and (3), it is evident that heat transfer from non-contact regions to the contact area increases . Consequently, the variation in melting velocity during the initial 500 s of melting is inversely correlated with the overall temperature change in the heater block.
At 532 s into the melting process, the temperature change rate of the melting block exhibited a significant decrease, accompanied by a minor reduction in melting velocity of approximately 16%. This phenomenon occurred when the heater block reached the solidified region of accumulated molten material at the bottom (indicated by the red box in Figure 24). The increased mass of the melting block at this height level resulted in greater heat absorption required for melting, consequently leading to the observed decrease in subsequent melting velocity.
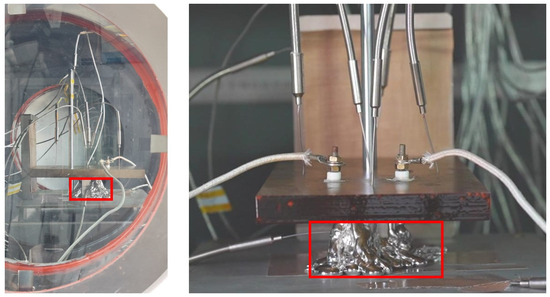
Figure 24.
The heater block contacts with the solidified layer of molten material.
4. Conclusions
This study investigated the contact melting process between a heater plate and a flat-plate component, focusing on the eutectic reaction of tin and copper to simulate metallic material interactions under reactor severe accident conditions. The temperature response characteristics and melting velocity variations during contact melting were systematically examined, and underlying mechanisms were analyzed. The main conclusions are as follows:
1. This study provides the first experimental evidence of the impact of eutectic liquefaction on the contact melting process. Due to intermetallic interactions, the heat transfer rate from the heater block to the melting block during the contact conduction phase undergoes two distinct enhancements. Eutectic liquefaction rapidly reduces contact thermal resistance, resulting in a maximum temperature change rate increase of 5.36 times in the experiments, significantly accelerating the initiation of melting.
2. During the stable melting phase, the temperature in the contact region fluctuates slightly near the melting point of the phase change material, indicating a quasi-steady state. Driven by temperature differences, the non-contact region compensates for heat loss in the contact zone, causing the melting velocity to increase continuously until reaching equilibrium. This phenomenon reflects the three-dimensional heat conduction effects of the heater block with finite-sized phase change materials. Without considering molten material relocation, the melting velocity is inversely proportional to the average temperature change in the heater block.
3. The molten material primarily flows out of the contact zone along the short-edge direction in the form of droplet seepage, fragment detachment, and rapid rivulet flow. Its migration and relocation behavior depend on the wall temperature, ambient temperature, and contact surface temperature. Melt migration and relocation influence the melting rate, which in this experiment decreased by 16% primarily due to the effect of melt relocation.
Author Contributions
Conceptualization, W.C. and Y.C.; methodology, J.M.; validation, H.X. and J.M.; formal analysis, J.M.; investigation, Yuqing Chen; resources, W.C.; data curation, J.M.; writing—original draft preparation, J.M.; writing—review and editing, W.C.; visualization, J.M.; supervision, H.X.; project administration, W.C.; funding acquisition, W.C. All authors have read and agreed to the published version of the manuscript.
Funding
This research was financially supported by the National Natural Science Foundation of China (project number 12175311).
Data Availability Statement
The original contributions presented in this study are included in the article. Further inquiries can be directed to the corresponding author.
Conflicts of Interest
The authors declare no conflicts of interest.
References
- Tuček, K.; Tsige-Tamirat, H.; Ammirabile, L.; Lázaro, A.; Grah, A.; Carlsson, J.; Döderlein, C.; Oettingen, M.; Fütterer, M.; D’aGata, E.; et al. Generation IV reactor safety and materials research by the Institute for Energy and Transport at the European Commission’s Joint Research Centre. Nucl. Eng. Des. 2013, 265, 1181–1193. [Google Scholar] [CrossRef]
- Yan, Y.; Burtseva, T.A.; Billone, M.C. High-temperature steam-oxidation behavior of Zr-1Nb cladding alloy E110. J. Nucl. Mater. 2009, 393, 433–448. [Google Scholar] [CrossRef]
- Zhang, Y.P.; Niu, S.P.; Zhang, L.T.; Qiu, S.Z.; Su, G.H.; Tian, W.X. A review on analysis of LWR severe accident. ASME J. Nucl. Eng. Radiat. Sci. 2015, 1, 041018. [Google Scholar] [CrossRef]
- Haste, T.; Steinbrück, M.; Barrachin, M.; de Luze, O.; Grosse, M.; Stuckert, J. A comparison of core degradation phenomena in the CORA, QUENCH, Phébus SFD and Phébus FP experiments. Nucl. Eng. Des. 2015, 283, 8–20. [Google Scholar] [CrossRef]
- Amidu, M.A.; Addad, Y. The influence of the water ingression and melt eruption model on the MELCOR code prediction of molten corium-concrete interaction in the APR-1400 reactor cavity. Nucl. Eng. Technol. 2022, 54, 1508–1515. [Google Scholar] [CrossRef]
- Wang, S.; Peng, C.; Guo, Y. Experimental study on paraffin melting in a cylindrical cavity. Nucl. Tech. 2016, 39, 090201. [Google Scholar]
- Li, Y.; Tian, W.; Chen, R.; Feng, T.; Qiu, S.; Su, G. Research on the nuclear fuel rods melting behaviors by alternative material experiments. J. Nucl. Mater. 2022, 559, 153415. [Google Scholar] [CrossRef]
- Wu, Z.; Zhang, K.; Feng, T.; Li, Y.; Chen, R.; Tian, W.; Su, G.; Qiu, S. Experimental study on fuel rod melting based on alternative materials. Ann. Nucl. Energy 2022, 176, 109286. [Google Scholar] [CrossRef]
- Wu, Z.; Li, K.; Zhang, K.; Chen, R.; Tian, W.; Qiu, S. Experimental study on the plate-type fuel melting behavior based on alternative materials. Ann. Nucl. Energy 2025, 211, 110941. [Google Scholar] [CrossRef]
- Müller, W.C. Review of debris bed cooling in the TMI-2. Nucl. Eng. Des. 2006, 236, 1965–1975. [Google Scholar] [CrossRef]
- Chen, W.Z. Analysis of Contact Melting; Chinese Atomic Energy Press: Beijing, China, 2022. (In Chinese) [Google Scholar]
- Shams, A.; Dovizio, D.; Zwijsen, K.; Le Guennic, C.; Saas, L.; Le Tellier, R.; Peybernes, M.; Bigot, B.; Skrzypek, E.; Skrzypek, M.; et al. Status of computational fluid dynamics for in-vessel retention: Challenges and achievements. Ann. Nucl. Energy 2020, 135, 106966. [Google Scholar] [CrossRef]
- Ma, J.J.; Chen, W.Z.; Xiao, H.G. Study of contact melting of plate bundles by molten material in severe reactor accident. Nucl. Eng. Technol. 2023, 55, 4266–4273. [Google Scholar] [CrossRef]
- Chen, W.Z.; Ma, J.J. Analysis of heat threshold in contact melting process. Ann. Nucl. Energy 2026, 226, 111851. [Google Scholar] [CrossRef]
- Wang, G.; Tang, Z.; Gao, Y.; Liu, P.; Li, Y.; Li, A.; Chen, X. Phase change thermal storage materials for interdisciplinary applications. Chem. Rev. 2023, 123, 6953–7024. [Google Scholar] [CrossRef]
- Mayer, P.; Moaveni, S. Close-contact melting as a subtractive machining process. Int. J. Adv. Manuf. Technol. 2008, 37, 980–995. [Google Scholar] [CrossRef]
- Moallemi, M.K.; Viskanta, R. Experiments on fluid flow induced by melting around a migrating heat source. J. Fluid Mech. 1985, 157, 35–51. [Google Scholar] [CrossRef]
- Pshenichnikov, A.; Shibata, H.; Yamashita, T.; Nagae, Y.; Kurata, M. Ten years of Fukushima Dai-Ichi post-accident research on the degradation phenomenology of the BWR core components. J. Nucl. Sci. Technol. 2021, 58, 1150–1174. [Google Scholar] [CrossRef]
- OECD Nuclear Energy Agency. Progress Made in the Last Fifteen Years Through Analyses of the TMI-2 Accident Performed in Member Countries; OECD/CSNI Report NEA/CSNI/R(2005)1; OECD: Paris, France, 2005. [Google Scholar]
- Ma, J.; Chen, Y.; Chen, W.; Xiao, H. Three-Dimensional study of contact melting of a molten material crust against a stainless steel plate during a severe reactor accident. Processes 2025, 13, 3310. [Google Scholar] [CrossRef]
- Zhang, X.; Chen, H.; Liu, F.; Zhan, D. Transient 3D simulation for heating and melting process of PWR core after SBO. Ann. Nucl. Energy 2018, 115, 256–267. [Google Scholar] [CrossRef]
- Mills, K.C. Recommended Values of Thermophysical Properties for Selected Commercial Alloys; Woodhead Publishing: Delhi, India, 2002. [Google Scholar]
- Roger, C.R.; Yen, S.H.; Ramanathan, K.G. Temperature variation of total hemispherical emissivity of stainless steel AISI 304. J. Opt. Soc. Am. 1979, 69, 1384–1390. [Google Scholar] [CrossRef]
- Hofmann, P. Current knowledge on core degradation phenomena, a review. J. Nucl. Mater. 1999, 270, 194–211. [Google Scholar] [CrossRef]
- Hofmann, P.; Kerwin-Peck, D. UO2/Zircaloy-4 chemical interactions from 1000 to 1700 °C under isothermal and transient temperature conditions. J. Nucl. Mater. 1984, 124, 80–105. [Google Scholar] [CrossRef]
- Li, D.; Franke, P.; Fürtauer, S.; Cupid, D.; Flandorfer, H. The Cu–Sn phase diagram part II: New thermodynamic assessment. Intermetallics 2013, 34, 148–158. [Google Scholar] [CrossRef]
Disclaimer/Publisher’s Note: The statements, opinions and data contained in all publications are solely those of the individual author(s) and contributor(s) and not of MDPI and/or the editor(s). MDPI and/or the editor(s) disclaim responsibility for any injury to people or property resulting from any ideas, methods, instructions or products referred to in the content. |
© 2025 by the authors. Licensee MDPI, Basel, Switzerland. This article is an open access article distributed under the terms and conditions of the Creative Commons Attribution (CC BY) license (https://creativecommons.org/licenses/by/4.0/).