Abstract
The mesh size significantly affects the accuracy and computational efficiency of finite-element analysis (FEA) simulations. This study investigates mesh regularization to mitigate mesh dependency, align numerical results with experimental data, and optimize the computational time for carbon/epoxy composites. Mesh regularization was implemented using the ∗MAT_ADD_GENERALIZED_DAMAGE (MAGD) model in LS-DYNA, which incorporates a scaling factor based on the ply orientation and stress triaxiality to adjust the material failure criterion. To address the limitations of trial-and-error methods for determining scaling factors, four analytical models were developed to predict these factors as functions of element size. These predictions were validated against experimentally derived scaling factors for unidirectional carbon/epoxy composites across three ply orientations (0°, 45°, and 90°) and three stress triaxiality conditions (tension, compression, and shear) using mesh sizes ranging from 0.5 mm to 1.5 mm. The scaling factor effectively reduced the mesh dependency in the tested configurations. A clear relationship between ply orientation and mesh regularization was established; however, no definitive correlation was observed with stress triaxiality. Among the theoretical approaches, the stress degradation model yielded the most consistent predictions, although discrepancies with the experimental results indicate the need for further refinement. This study proposes integrating scaling factors into a material model as a practical approach to mesh regularization for orthotropic materials and evaluates existing theoretical models for predicting these factors.
1. Introduction
Finite element analysis (FEA) is often sensitive to mesh configurations employed in computational models. Although this sensitivity generally decreases with mesh refinement, exceptions to this trend persist. As Belytschko [1] noted, mesh-induced influences on the results are undesirable because they stem from numerical artifacts rather than physical behavior. Although finer meshes tend to improve the accuracy, particularly in regions with steep gradients or complex geometries, they also lead to increased computational costs [2,3,4,5,6]. In contrast, coarser meshes reduce the computational demands but compromise the precision of the results. This trade-off is especially critical in dynamic simulations, where phenomena such as impact, wave propagation, and crashworthiness require an accurate resolution of high-frequency stress responses [7,8,9,10,11,12]. Optimal outcomes require a balanced meshing strategy, often supported by adaptive meshing techniques [13,14,15,16,17]. Experimental evidence confirms that the fracture behavior in materials is influenced by element size [10,18,19,20,21,22]. Belytschko et al. [1,23] showed that even fine, uniform meshes can yield non-convergent results. Others demonstrated mesh sensitivity in simulations involving impact and penetration [18,24,25]. The process of eliminating the mesh-size dependency is referred to as mesh regularization. Studies in this area aim to identify optimal mesh sizes that balance response accuracy with computational efficiency [26,27]. Forquin and Lukic emphasized that excessively fine, unregularized elements can distort the results and inflate the calculated energy dissipation, underscoring the need for a careful balance between resolution and fidelity [28,29]. A common and effective approach to mesh regularization employed in this study involves modifying the element failure criterion based on mesh size. This method, known as material-based mesh regularization, is particularly crucial for simulating fracture initiation and propagation in crashworthiness and impact scenarios. Several researchers [30,31,32] have developed fracture propagation models within the finite element method (FEM) framework to characterize ductile failure. Numerous studies [32,33,34,35,36,37,38,39] have proposed Continuum Damage Mechanics (CDM)-based models to predict failure in isotropic and orthotropic materials. For example, Huafe et al. [38,40] developed the Generalized Incremental Stress-State Dependent Damage Model (GISSMO) to simulate ductile fractures in isotropic materials. According to this model, ductile failure occurs when instability-induced energy dissipation interacts with material damage. GISSMO has been widely adopted for ductile fracture prediction in LS-DYNA. In such models, crack initiation is governed by a damage variable that is independent of material strength parameters. Several constitutive models have been proposed [41,42,43,44,45,46], among which the Johnson–Cook material model is considered an industry standard for large deformation and high strain rate applications in government, military, and industrial settings. Haight et al. [47] further refined the Johnson–Cook model by incorporating mesh-size-based regularization, as well as triaxiality, temperature scaling, and strain-rate effects. Empirical studies [1,23,48,49] reinforce the observation that the fracture behavior is element-size-dependent. Belytschko et al. [1] reported non-convergent results even with fine, uniform meshes. Liu et al. [24] examined mesh sensitivity in projectile penetration simulations, while other researchers developed failure models explicitly accounting for element size. For instance, Woelke et al. [50] observed that the ratio of gauge length to element size significantly affects the post-necking strain energy, and Walter et al. [39] found that both mesh size and stress triaxiality influence ductile fracture strain. Korgesaar et al. [36,37] proposed a regularizing fracture strain based on the failure model, whereas Kwak et al. [51,52] established relationships between mesh dimensions and local fracture energy. However, in the context of composite materials [30,31,53,54,55,56,57,58], fracture behavior is governed by both stress triaxiality and ply orientation. Traditionally, mesh regularization in FEA involves an analytical trial-and-error process to determine the appropriate scaling factors for the material models. This method is computationally expensive and time intensive, and requires repeated simulations to identify the optimal scaling parameters [26,27]. To overcome this limitation, this study introduces a mathematical framework for predicting mesh-size-dependent scaling factors, thereby enhancing both accuracy and computational efficiency. The influence of ply orientation and stress triaxiality on mesh regularization was investigated for a carbon/epoxy composite using commercial LS-DYNA R14.1.0 software and the MAT_ADD_GENERALIZED_DAMAGE (MAGD) material model [38,40]. This model enables the integration of scaling factors adjusted for both ply orientation and stress triaxiality, thereby facilitating the accurate simulation of fracture initiation and propagation.
In Section 3, theoretical models are developed to predict the scaling factors as functions of mesh size. The analysis was conducted for three ply orientations (0°, 45°, and 90°) under tensile (triaxiality = 0.33), shear (triaxiality = 0.00), and compressive (triaxiality = ) loading conditions following methodologies from prior work [30,31,53]. These loading conditions were selected to capture the combined influence of the stress state and fiber orientation on composite failure, in line with the findings of Korgesaar et al. [36,37].
To validate the proposed framework, scaling factors were obtained by comparing displacement curves from simulations of carbon/epoxy composite specimens with varying mesh sizes (from 0.5 mm to 1.5 mm) against the corresponding experimental data. Additional mesh sizes were used to verify the robustness of the scaling-factor predictions. The experimentally derived scaling factors were then compared with theoretical estimates, and the effectiveness of the different prediction models was assessed through a comparative analysis.
This study aims to achieve several key objectives: first, to develop and validate predictive analytical models that can determine mesh-size-dependent scaling factors directly from material properties, eliminating the need for iterative trial-and-error calibration; second, to systematically investigate and quantify the influence of ply orientation and stress triaxiality on mesh regularization behavior in carbon/epoxy composites; third, to establish a practical framework for implementing mesh regularization in the MAGD material model for orthotropic materials; and fourth, to assess the accuracy and limitations of existing theoretical approaches for predicting scaling factors across different loading conditions. The findings from this work are expected to provide guidance for future development of more robust mesh regularization techniques for anisotropic materials under complex loading scenarios, including strain-rate effects, temperature dependency, and mixed-mode failure conditions.
2. Methodology
This section outlines the mesh regularization procedure employed in the finite element analysis (FEA) of composite materials using the LS-DYNA code. The primary objective of this study is to establish a systematic approach for determining the scaling factors to mitigate mesh dependency in FEA simulations. The methodology consisted of the following steps:
- Definition of the material damage model for mesh regularization. The composite damage behavior was modeled using the MAT_ADD_GENERALIZED_DAMAGE (MAGD) framework in LS-DYNA, superimposed on an orthotropic elastic base model representative of the unidirectional carbon/epoxy laminate. MAGD was selected because it introduces anisotropic tensor-based damage variables (, , ) corresponding to fiber, transverse, and shear directions, respectively. Unlike conventional MAT_54/55 models, MAGD accounts for stress-state dependency, strain-rate effects, and mesh-size scaling, thereby allowing consistent representation of energy dissipation across different discretizations. The formulation employs a damage tensor that modifies the stress response progressively, with nonlinear stress fading applied after a critical damage threshold is reached.
- Development of theoretical models for scaling factor prediction. A predictive framework was developed to estimate mesh-scaling factors required for regularization of impact simulations. These scaling factors, denoted , depend on both the characteristic element length and the applied stress triaxiality . Building on fracture mechanics principles, the model establishes a relationship between fracture energy, critical strain energy release rates, and the element size to ensure consistent energy dissipation irrespective of mesh density. Analytical expressions were derived for tensile, shear, and mixed-mode loading conditions. These theoretical models allow scaling factors to be computed directly from intrinsic material properties, thus reducing reliance on empirical calibration.
- Specification of material properties. The composite material considered in this study was a unidirectional carbon fiber/epoxy laminate, a system widely employed in aerospace and automotive applications due to its high stiffness-to-weight ratio and anisotropic strength characteristics. The orthotropic elastic constants (longitudinal modulus , transverse modulus , in-plane shear modulus , and Poisson’s ratios ) were extracted from experimental characterizations. Strength values in the longitudinal, transverse, and shear directions () were specified along with fracture toughness parameters to define the initiation and propagation of damage. These inputs provided the foundation for both the failure initiation criteria (Chang–Chang) and the subsequent MAGD-based damage evolution.
- Execution of numerical simulations under different stress states. Finite element models of composite specimens were developed and subjected to distinct stress triaxiality conditions, including uniaxial tension, in-plane compression, and pure shear loading. Each configuration was simulated with multiple mesh sizes to investigate the sensitivity of failure predictions to discretization. The evolution of the damage parameters (, , ) was monitored, and the effective fracture energies were calculated for each mesh density. This enabled the extraction of scaling factors corresponding to different failure modes. At present, the procedure involves a trial-and-error calibration of scaling factors to match experimental load–displacement responses, but the goal of this study is to move toward predictive regularization based on intrinsic material properties.
- Validation through comparison of analytical and experimental scaling factors. Finally, the analytically predicted scaling factors were compared against those obtained from experimental impact and coupon-level tests. This comparison served to validate the proposed theoretical framework, highlighting its accuracy in predicting mesh-independent behavior. Discrepancies between analytical and experimental values were discussed in terms of potential microstructural effects, strain-rate sensitivity, and the limitations of shell-based modeling assumptions. This step provided critical insight into the robustness and applicability of the proposed regularization methodology for unidirectional carbon/epoxy composites under a wide range of stress states.
3. Modeling Progressive Damage and Failure with Mesh Regularization in Composites and Composite Material Used in the Study
To model damage evolution and failure, the MAT_ADD_GENERALIZED_DAMAGE (MAGD) framework was employed. MAGD, also known as eGISSMO (extended Generalized Incremental Stress-State Dependent Damage Model), is a modular add-on keyword in LS-DYNA introduced in version R9 as an advancement over the isotropic GISSMO model (MAT_ADD_EROSION with IDAM = 1). It enables the superposition of anisotropic damage and fracture onto base material models, addressing limitations in capturing direction-dependent failure in orthotropic materials, such as fiber-reinforced composites. By supporting up to three independent damage variables and a fully anisotropic damage tensor, MAGD provides a versatile tool for simulating complex degradation mechanisms under multiaxial and dynamic loading conditions, including those encountered in impact, crash, and blast scenarios. This extension of GISSMO incorporates orthotropic damage accumulation evaluated in the material coordinate system, featuring stress-state dependency, strain-rate effects, and element erosion upon reaching critical damage thresholds.
MAGD introduces a second-order anisotropic damage tensor, D, which facilitates the evolution of user-defined or predefined scalar damage variables as functions of strain, stress triaxiality, ply orientation, and element size. The tensor relates nominal (damaged) stresses to effective (undamaged) stresses through a 6 × 6 damage-effect matrix in Voigt notation, allowing for up to 12 nonzero components in orthotropic cases to capture directional degradation. This formulation is particularly advantageous for composites, where damage modes (e.g., fiber breakage, matrix cracking, and fiber-matrix shearing) are inherently anisotropic and require independent control over the principal directions.
This tensor formulation allows for the following:
- Mesh-size-based regularization to mitigate non-physical localization and ensure mesh-independent results;
- Triaxiality-dependent failure, where failure strains are scaled based on the stress state (e.g., via load curves LCSDG for triaxiality vs. failure strain);
- Ply orientation dependence, aligning damage variables with material axes (e.g., 0°, 45°, 90° for fiber, shear, and matrix directions);
- Independent control over in-plane and out-of-plane damage, with options for volumetric-deviatoric splitting;
- Strain-rate sensitivity and nonlinear stress fading for realistic post-peak softening.
In MAGD, the damage is represented by a second-order damage tensor, D, embedded within a 6 × 6 matrix. The general form of the damage relation for anisotropic materials is given by Equation (1):
Each component is defined as a function of up to three scalar damage variables (e.g., ) via *DEFINE_FUNCTION, enabling customizable degradation laws. For orthotropic materials, these variables can represent the damage in principal directions, such as longitudinal (fiber), transverse (matrix), and shear modes.
Because shell elements were employed to model the composite, the out-of-plane stresses and their associated damage components were assumed negligible. Consequently, the damage tensor was reduced to represent only the in-plane behavior, thereby simplifying the constitutive relation (Equation (2)) as follows:
In this formulation, corresponds to the damage accumulation along the 0° (axial) fiber direction, represents the damage in the 90° (transverse) direction, and denotes the damage associated with the 45° (shear) ply orientation. These components are aligned with the principal axes of the material using flags such as IFLG2 = 1 for the evaluation of the material coordinate system.
In this study, the Chang–Chang failure criterion was employed to model composite failure onset, integrated within the MAGD framework to define the initiation of damage accumulation. For fiber-dominated laminated composites under tensile loading, in-plane failure is the dominant mechanism, occurring in three distinct modes [59,60,61]:
- Matrix cracking;
- Fiber breakage;
- Fiber–matrix shear failure.
For predicting matrix cracking failure, a matrix failure criterion is proposed which has the form Equation (3):
where:
- is the transverse tensile stress in each layer;
- is the shear stress in each layer;
- is the transverse tensile strength;
- is the ultimate shear strain.
The matrix failure criterion states that when, in any one of the plies in a laminate, the stresses and satisfy one of the above equations , cracking occurs in a laminate layer.
Both fiber-matrix shearing and fiber breakage are predicted by the modified Yamada-Sun failure criterion, previously utilized by the author, F. K. Chang [62].
The criterion can be expressed as Equation (5):
where and are the longitudinal tensile stress and strength of each ply, respectively. For linear elastic laminates, Equation (5) can be reduced similarly to Equation (6):
The fiber failure criterion states that when, in any one of the plies in a laminate, the combined stresses and satisfy the criterion , that layer fails by either fiber breakage or fiber-matrix shearing.
Once failure onset is detected via the Chang-Chang criterion (e.g., when or ), progressive damage evolution in MAGD is governed by strain-based criteria, where history variables (HIS1, HIS2, HIS3) drive accumulation using previously defined functions of strain components. The failure strain, , which represents the strain at which complete failure occurs in each mode, is defined as a function of the stress triaxiality (), Lode angle parameter (), and mesh regularization scaling factor (). It is expressed as Equation (7):
Triaxiality is defined by Equation (8):
where p denotes the pressure and denotes the von Mises stress. Function is typically input via load curves (LCSDG) for each damage variable, allowing triaxiality- and Lode-dependent failure strains that can vary by ply orientation and failure mode (e.g., matrix cracking aligned in the transverse direction).
After defining the failure strain, the instantaneous damage parameter corresponding to the different triaxiality conditions and failure modes (i.e., fiber breakage, matrix cracking, or fiber-matrix shearing) is expressed as follows in Equation (9):
where corresponds to the fiber orientation (representing , , ) and is the strain in the load direction.
Accordingly, three distinct damage components were introduced, each associated with the strain response in its respective fiber direction and tied to the relevant Chang-Chang failure mode (e.g., for fiber breakage in 0° direction, for matrix cracking in 90° direction, for shear-dominated fiber-matrix failure in 45° direction). The evolution of these cumulative damage parameters follows a GISSMO-like nonlinear accumulation law governed by the following expressions:
where:
- n is the damage exponent (DMGEXP, controlling nonlinearity; e.g., for linear, for delayed onset);
- are the instantaneous damage rates;
- are orientation-specific functions accounting for triaxiality and lode angle effects, ensuring consistency with the stress-state dependency in the Chang-Chang criterion.
3.1. Mesh Regularization Parameter Through MAGD
When the simulation results are transferred between models with different mesh sizes (e.g., mapping from forming to crash analyses), the damage variables must be adjusted accordingly. MAGD introduces a mesh-size scaling function to modify the failure strain, where is the characteristic element length (computed automatically in LS-DYNA) and is stress triaxiality. This factor is input via the regularization curve LCREG (element size vs. scaling factor) with optional shear (SHRF) and biaxial (BIAXF) reduction factors for specific triaxialities (0 and 2/3). A reference element size (REFSZ > 0) can be specified to normalize the damage output, ensuring consistent energy dissipation across discretizations. The scaling integrates seamlessly with the Chang-Chang criterion by adjusting mode-specific failure strains to maintain physical fracture energy independence from mesh refinement.
In this study, a predictive formulation for is proposed based solely on intrinsic material properties, eliminating the need for empirical tuning. This is achieved by developing analytical models (e.g., fracture energy and stress degradation) that correlate scaling factors with mesh size, validated against experimental data for carbon/epoxy composites.
In the context of composite material damage evolution, it is essential to distinguish between the two damage parameters, d and D. The parameter d quantifies instantaneous damage accumulation as a function of the current load triaxiality and mesh size, as defined within the MAGD framework [38,40]. By contrast, the scalar damage parameters , , represent the cumulative damage along specific fiber orientations—0°, 90°, and 45°, respectively. These parameters evolve over time through the integration of damage rate expressions, which are influenced by stress triaxiality, the Lode angle parameter, and orientation-dependent failure criteria, as defined by the composite damage evolution model [36,37]. This distinction is critical for accurately capturing the anisotropic damage behavior of fiber-reinforced composites under dynamic loading conditions.
3.2. Composite Material Properties Used
The material used in this study was a unidirectional carbon fiber/epoxy composite with a fiber volume fraction of 65%. The volume fraction of the material was 65%. The mechanical and failure properties were determined using a Carbon/Graphite fiber reinforced Epoxy matrix composite (Gr/Ep) coupon test with Ala Tabiei. These Properties are defined in the Table 1. Furthermore, Figure 1 shows failure strain vs triaxiality for different ply orientations.

Table 1.
Mechanical properties of unidirectional carbon-fiber/epoxy composite material used in the study.
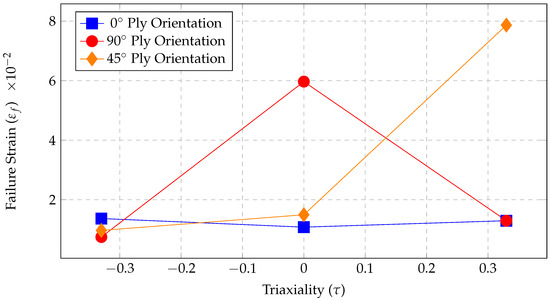
Figure 1.
Failure strain vs. triaxiality at different ply orientations for unidirectional carbon fiber/epoxy composite used in this study.
4. Theoretical Models for Mesh-Size-Based Failure Propagation
4.1. Fracture Energy Equation Approach
Kwak et al. investigated the influence of finite element mesh size on the behavior of reinforced concrete structures subjected to monotonically increasing loads [52]. Their approach to mesh regularization was based on the distribution of microcracks and fracture energy of the material. In their formulation, the stress–strain relationship incorporates the fracture energy as follows:
where:
- is the tensile strength of the material;
- is the strain at the end of the strain-softening, at which the microcracks coalesce into a continuous crack;
- is the fracture energy consumed in formulating and opening a crack of unit length per unit thickness;
- is the function to predict the propagation of microcracks.
Microcrack development within an element is described using a general exponential function, which captures the characteristic behavior of microcrack concentration near the crack tip, particularly when the gauge length is relatively large:
where ∝ and are constants to be determined.
By substituting the boundary conditions, that is, and , into Equation (14), the following expression is obtained:
where b denotes the element width.
By combining the fracture energy expression (Equation (13)) with the microcrack propagation function (Equation (15)), the failure strain () can be calculated as follows:
To determine the scaling factor, the failure strain () for each mesh size was calculated using Equation (16). Then the scaling factor can be determined as follows:
where is the failure strain for different mesh sizes and is the failure strain for the base mesh size.
The base mesh size was identified by aligning the numerical results from the tensile simulations with the experimental tensile test data. Once the base mesh is established, the scaling factor can be calculated using the equations above.
4.2. Continuum Damage Energy and Local Fracture Energy Based Approach
Kwak et al. addressed the problem of mesh sensitivity through finite element (FE) mesh size and local fracture energy, which can convert the effect into the difference of failure strain used to propose a criterion [51].
The fracture energy is divided into continuum and local fracture energies. The continuum damage energy represents the strain-hardening portion, which varies with the size of the specimen, and the local fracture energy represents the strain-softening portion, which has a constant value regardless of the specimen size. A function is added to control the size effect of the mesh. Therefore, the fracture energy can be described as follows:
where:
- is the failure strain;
- is the critical strain;
- is the critical stress for the material;
- is the size effect function dependent on the length of the mesh.
The size-effect function is composed of two components: , which is a function of the specimen width and characterizes the crack pattern of the material, and , which is a function of the specimen length.
The crack pattern was modeled using an exponential function of the form . When b is the width of the specimen and the center of the specimen is , the boundary conditions are and . Using these two boundary conditions, and are calculated. can be calculated by integrating with b and inserting the maximum length:
where b is the mesh width size, and is the coefficient to modify the fracture energy.
Through the experimental data of failure strain value, was determined according to the specimen size. Subsequently, is set to the constant value of :
where defines the base mesh width size, and h is the mesh height.
By substituting Equations (9) and (10) into the failure energy equation (Equation (8)), the failure strain can be obtained:
However, Equation (11) introduces a critical issue: when the mesh size of an element is smaller than the base mesh size, the resulting failure strain becomes negative, which is physically unrealistic. To resolve this, the absolute value of the microcrack function should be incorporated into Equation (11), leading to the following modified expression:
To determine the scaling factor for each mesh size, the failure strain is first computed using Equation (20), and the following ratio is then applied:
The base mesh size was established by comparing the experimental data from the tensile tests with corresponding numerical simulation results. Once the base mesh is identified, the scaling factor for the other mesh sizes can be computed using the previously defined equations.
4.3. Modified Elastic Modulus Approach
Feng et al. investigated mesh dependency issues in reinforced concrete [63]. Their model defines mesh regularization based on post-yield material failure, characterized through the total strain energy, expressed as follows:
where A is the cross-sectional area, L is the characteristic length, and is the fracture energy density.
For finite element modeling, the numerical strain energy is modified as follows:
where N is the number of elements and is the characteristic element length ().
However, to eliminate mesh regularization, a regularization parameter is introduced to the strain energy equation (i.e., Equation (21)):
where is the regularization strain energy and is the regularization factor.
For the base mesh size, the scaling factor . Theoretically, the strain energy should remain constant across the different mesh sizes:
From Equation (23), the scaling factor for mesh regularization can be obtained:
where is the characteristic element length for the base mesh size.
4.4. Stress Degradation Approach
Shyamsunder et al. investigated the effect of mesh size on material failure in composite materials [64]. They addressed the mesh regularization problem by relating the failure strain to the stress degradation resulting from the fracture strain energy. The failure strain can be expressed as follows:
where is the failure strain in the direction, is the yield strain in the direction, G is the fracture energy, and L is the characteristic length of the finite element.
For the base mesh size, the above Equation (25) can be rewritten as follows:
To eliminate mesh dependency, a scaling factor was introduced into the failure strain. This scaling parameter is incorporated into Equation (30) as follows:
Because the experimental failure strain of the material is constant, the finite element failure strain expressions in Equations (26) and (27) are equal. Therefore, the following is true:
From Equation (28), the scaling factor can be derived:
5. Mesh Regularization Scaling Factor for Orthotropic Materials Based on Various Stress Triaxiality
It is important to consider material orientation when applying mesh regularization to orthotropic materials. In this study, three ply orientations were analyzed for the carbon/epoxy composite material (described in the previous section): 0°, 90°, and 45°.
5.1. Finite Element Modeling Approach
Finite element models of composite specimens were developed using shell elements in LS-DYNA to simulate the behavior under different loading conditions. Each specimen was modeled as an 8-layered laminate with appropriate ply thicknesses corresponding to the specific orientation being analyzed. The mesh was generated using a combination of quadrilateral and triangular shell elements to accommodate the specimen geometry and boundary conditions.
Six different mesh sizes (0.5 mm, 0.7 mm, 0.9 mm, 1.1 mm, 1.3 mm, and 1.5 mm) were employed across all ply orientations to investigate the mesh dependency of the failure predictions and to determine appropriate scaling factors for mesh regularization. For each configuration, the base mesh size was identified by comparing the numerical simulation results with experimental data, ensuring that the simulation without scaling factors provided the closest match to the experimentally observed behavior. To validate the robustness and accuracy of the derived scaling factor curves, three additional intermediate mesh sizes (0.6 mm, 1.0 mm, and 1.4 mm) were tested using the scaling factors predicted from the established mesh-size-dependent curves.
The specimens were divided into three distinct regions to facilitate proper boundary condition application and load transfer: the deformable region (blue), where material failure and damage evolution were monitored; the displacement or force application region (red), where loading was applied; and the fixed constraint region (green), where all degrees of freedom were constrained to prevent rigid body motion. This regional approach ensured accurate representation of experimental test conditions while minimizing artificial stress concentrations at the boundaries.
5.2. Tensile Test Specimen ( = 0.33)
An 8-layered tensile test specimen was used, as shown in Figure 2. The specimen was 300 mm in length and 38.5 mm in width. It is divided into three regions: the blue region represents the deformable section (140 mm long), the red region denotes the tab where displacement or force is applied, and the green region corresponds to the fixed tab where no deformation or displacement occurs. The individual composite layer thicknesses are 0.316 mm, 0.314 mm, and 0.311 mm for the 0°, 90°, and 45° plies, respectively. Figure 3 shows an isometric view of the tensile test specimen with the eight layers used in this study. Further details on this tensile test specimen are available in ASTM standard D3039 [65] and Littell [66].

Figure 2.
Specifications of the tensile test specimen used in this study. The three regions in the specimen: Blue—the deformable region, Red—displacement/force application tab, and Green—fixed tab.
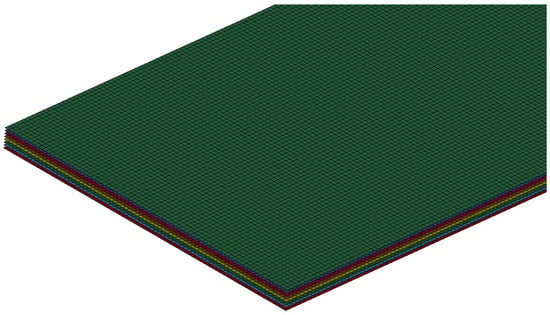
Figure 3.
Isometric view of the tensile test specimen with its eight layers used in this study.
For the 0° ply, the simulation results without scaling factors showed that the 0.5 mm mesh size best matched the experimental data. Consequently, a 0.5 mm was chosen as the base mesh size was chosen for this orientation. Figure 4 shows the stress–strain curves for all the mesh sizes without regularization.
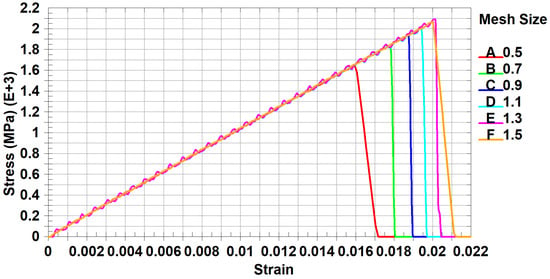
Figure 4.
Tensile test stress–strain curve for 0° ply orientation for all mesh sizes without scaling factors.
Figure 4 reveals a significant deviation in the failure strains for different mesh sizes compared with the base mesh size (0.5 mm). To correct for this, scaling factors were introduced into the material model.
Figure 5 shows the scaling factors determined for each mesh size.
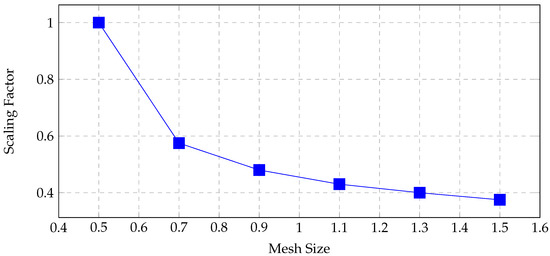
Figure 5.
Scaling factors for different mesh sizes for tensile test of 0° ply orientation.
Figure 6 shows the stress–strain curves for all mesh sizes with the applied scaling factor.
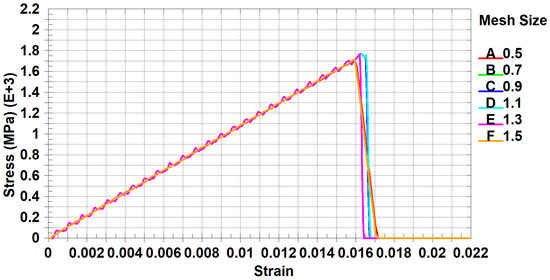
Figure 6.
Tensile test stress–strain curve for 0° ply orientation for all mesh sizes with scaling factor.
Figure 7 and Figure 8 compare the stress–strain results for the validation cases with and without scaling factors, respectively.
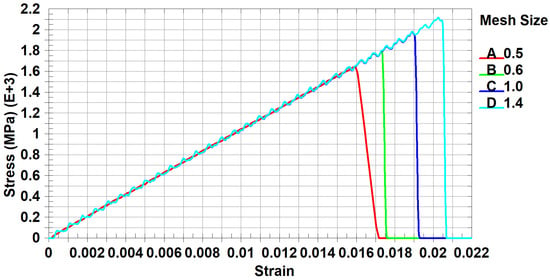
Figure 7.
Tensile test stress–strain curve for 0° ply orientation for validation cases without scaling factor.
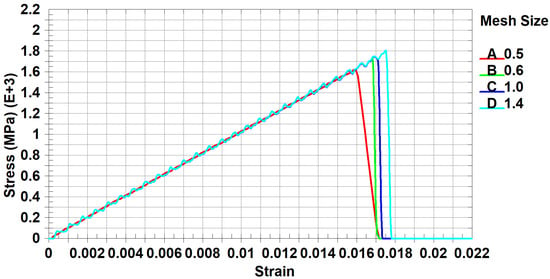
Figure 8.
Tensile test stress–strain curve for 0° ply orientation for validation cases with scaling factor.
For the 45° and 90° ply orientations, a 0.5 mm mesh size without scaling also provided the closest match to the experimental data, establishing it as the base mesh size for these plies. The scaling factors for the various mesh sizes were determined using a similar approach. Figure 9 compares the scaling factors and stress–strain behavior for all the mesh sizes and ply orientations.
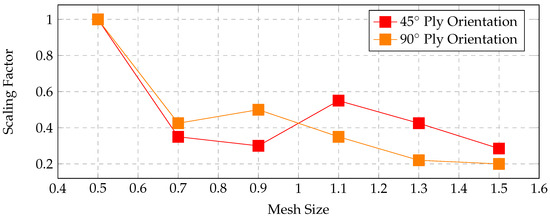
Figure 9.
Scaling factor comparison for tensile test in all ply orientation.
A validation study was conducted for these orientations using mesh sizes of 0.6 mm, 1.0 mm, and 1.4 mm, similar to the 0° ply validation.
5.3. Compression Test Specimen ( = )
An 8-layered compression test specimen was used, as shown in Figure 10. The specimen was 150 mm in length and 38.5 mm in width. It was similarly divided into three regions: the deformable region (30 mm long, blue), displacement/force application tab (red), and fixed tab (green). The individual layer thicknesses were 0.322 mm, 0.308 mm, and 0.318 mm for the 0°, 90°, and 45° plies, respectively. Further details are provided in ASTM standards D3410 [67] and Littell [66].

Figure 10.
Specifications of compression test specimen used in this study. The three regions in the specimen: Blue—the deformable region, Red—displacement/force application tab, and Green—fixed tab.
Figure 11 shows compression test stress–strain curve for 0° ply orientation for all mesh sizes without scaling factors.
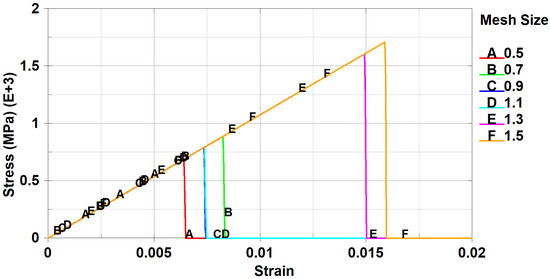
Figure 11.
Compression test stress–strain curve for 0° ply orientation for all mesh sizes without scaling factors.
Figure 12 shows the scaling factors for the 0°, 45°, and 90° ply orientations obtained from the optimization process.
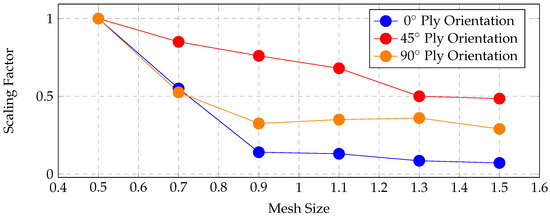
Figure 12.
Scaling factor comparison for compression test in all ply orientation.
5.4. Shear Test Specimen ( = 0.0)
An eight-layered v-notched shear test specimen, as shown in Figure 13, was used. The specimen measured 76 and 19 mm in length and width, respectively. The specimen was divided into three parts: the deformable region (blue), displacement/force application tab (red), and fixed tab (green). The layer thicknesses were 0.308 mm, 0.311 mm, and 0.318 mm for the 0°, 90°, and 45° plies, respectively. Additional details are available in the ASTM standard D5379 [68].
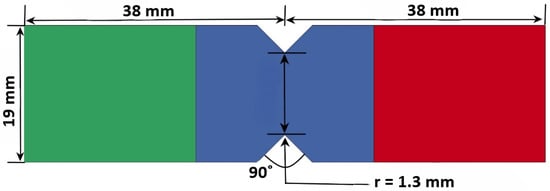
Figure 13.
Specifications of shear test specimen used in this study. The three regions in the specimen: Blue—the deformable region, Red—displacement/force application tab, and Green—fixed tab.
Figure 14 shows shear test stress–strain curve for 0° ply orientation for all mesh sizes without scaling factors.
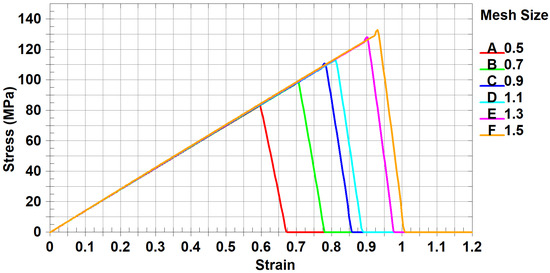
Figure 14.
Shear test stress–strain curve for 0° ply orientation for all mesh sizes without scaling factors.
A comparable method was employed to determine and optimize the scaling factors for various mesh sizes. The resulting scaling factors for the 0°, 45°, and 90° ply orientations are shown in Figure 15.
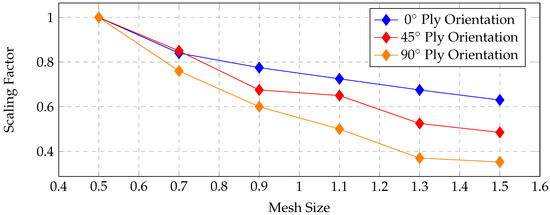
Figure 15.
Scaling factor comparison for shear test in all ply orientations.
6. Discussion
It was observed that a mesh size of 0.5 mm consistently served as the base mesh across all ply orientations and triaxiality conditions considered in this study. The derived scaling factors demonstrated an inverse relationship with mesh size, that is, the scaling factor decreased as the mesh size increased. This dependency may be attributed to several factors, including the element formulation, mesh discretization strategy, interpolation (approximation) functions, and integration scheme employed in the finite element analysis. While the element type itself does not induce mesh dependency, it contributes to mesh sensitivity. This distinction becomes particularly important when using energy-based regularization methods, which fail to fully mitigate mesh-dependent damage localization. Element formulations can also influence how damage localizes within the mesh, potentially affecting the global force–displacement response of the structure. In addition, the mesh discretization approach introduces inconsistencies. In this study, a combination of quadrilateral (quad) and triangular (tri) shell elements was used, which may have contributed to irregularities in damage propagation and mesh sensitivity. When the scaling factors were compared across ply orientations, a general decreasing trend was observed with increasing mesh size for all cases. The only notable exception was observed in the compression test for the 0° ply orientation, where the trend deviated slightly. Figure 16, Figure 17 and Figure 18 illustrate these comparisons across tensile, compression, and shear tests, respectively.
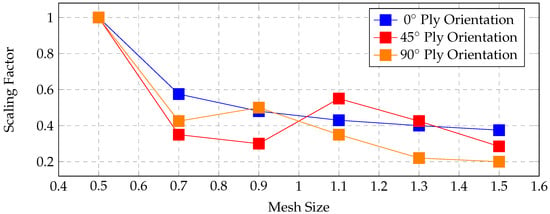
Figure 16.
Scaling factor comparison for tensile test in all ply orientations.
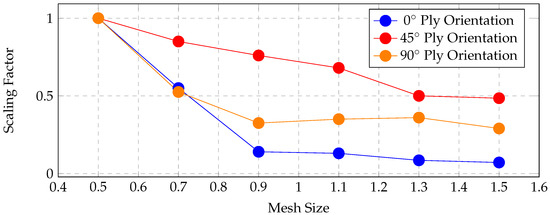
Figure 17.
Scaling factor comparison for compression test in all ply orientations.
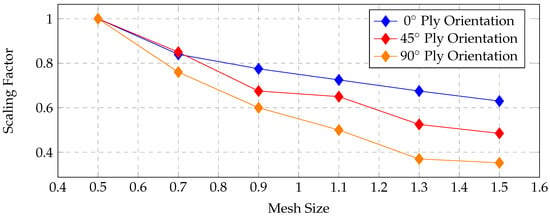
Figure 18.
Scaling factor comparison for shear test in all ply orientations.
Figure 19, Figure 20 and Figure 21 present comparisons of the scaling factors across all test types and ply orientations. However, no clear or consistent trend could be identified from these results, indicating the complex nature of mesh sensitivity in composite failure modeling.
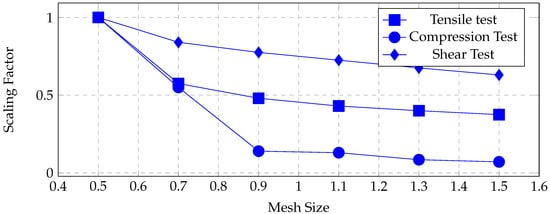
Figure 19.
Scaling factor comparison for all tests in 0° ply orientation.
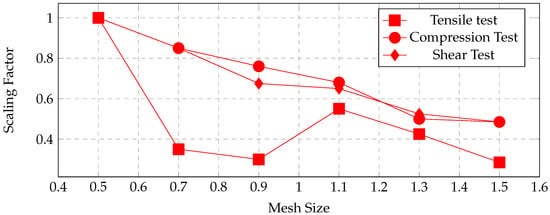
Figure 20.
Scaling factor comparison for all tests in 45° ply orientation.
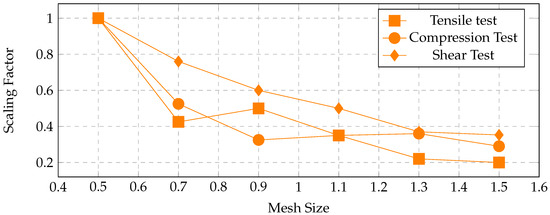
Figure 21.
Scaling factor comparison for all tests in 90° ply orientation.
Among the theoretical predictive models evaluated for estimating the scaling factors, the stress degradation model yielded the most consistent correlation with the experimental results. However, it failed to fully capture the irregularities observed in the experimental data. This discrepancy is likely due to the inability of the model to incorporate the influence of mesh discretization techniques, such as element shape, orientation, and transition effects, on failure strain predictions. Figure 22 illustrates the comparison between the experimentally determined and theoretically predicted scaling factors.
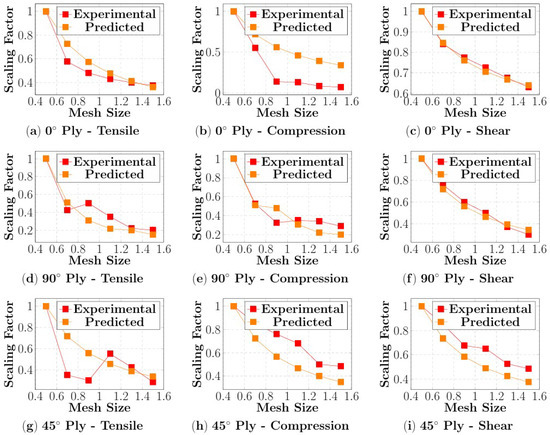
Figure 22.
Comparison of experimental and predicted scaling factors using the stress degradation method.
To quantify the comparison between experimental and predicted scaling factor, the Relative Error of Prediction () was used, which was calculated as follows:
where is the scaling factor found experimentally and is the analytically predicted scaling factor.
The analysis revealed that the Relative Error Percentage (REP) values for the scaling factor comparisons spanned a wide range, from a minimum of 1.53% to a maximum of 54.10%—highlighting considerable variability in predictive accuracy depending on the test type and ply orientation. Notably, the REP values for the tensile and shear tests were consistently lower than those for the compression tests across all ply orientations (0°, 45°, and 90°). For example, in the 0° ply orientation, the tensile and shear tests demonstrated significantly lower REP values than those of the corresponding compression tests. This suggests that the stress degradation model employed in the numerical simulations captured the material behavior more accurately under tensile and shear loading conditions than under compressive loading.
The discrepancies in the REP can be attributed to several factors. Although the stress degradation model has shown consistency across various loading cases, it struggles to fully account for the complex failure mechanisms prevalent in compression, such as localized buckling, matrix microcracking, and fiber kinking. These phenomena introduce significant nonlinearity and heterogeneity into the failure process, which is difficult to replicate accurately with standard constitutive models.
Additionally, one major source of deviation between the experimental and simulated results is the attenuation of vibrational energy. In explicit dynamic simulations, residual kinetic energy can persist owing to inadequate damping or coarse temporal resolution, which affects the fidelity of the post-yield deformation and failure predictions [69,70]. Moreover, simplified representations of frictional contact between composite plies can further compromise the accuracy of failure modeling [71,72,73]. These simplifications limit the ability of the model to capture transient, localized contact phenomena, which play a key role in energy dissipation and damage evolution.
To address these uncertainties, it is often advisable to interpret numerical results within a probabilistic or parametric framework that incorporates variability in input parameters, such as interfacial friction, strain rate sensitivity, and material heterogeneity, to assess the robustness and confidence intervals in simulation predictions [74,75,76]. For instance, the global discing failure mode observed experimentally, characterized by radial fracture patterns, results from the stress waves generated upon loading. These waves propagate through the material, creating transient triaxial stress states that trigger failures along the radial and circumferential planes [77]. Accurate modeling of such phenomena necessitates fine spatial and temporal resolution in addition to sophisticated failure criteria and material models capable of capturing anisotropic dynamic damage mechanisms.
An alternative to fixed-mesh regularization strategies is adaptive meshing or remeshing, which enables localized refinement based on evolving solution fields. Adaptive meshing dynamically modifies the mesh configuration in response to a posteriori error estimates, often derived from energy-based criteria, to concentrate the computational effort in regions of high stress gradients or damage evolution, such as crack tips, notches, or impact zones [78,79,80]. The core principle of energy-based adaptive refinement is to equidistribute the discretization error (measured in the energy norm) across all elements, thereby minimizing the global error in the strain energy between the numerical and exact solutions.
Several robust energy-based a posteriori error estimators have been developed to guide this refinement process, including the Zienkiewicz–Zhu (ZZ) error estimator, residual-based estimators, goal-oriented estimators, equilibrated flux estimators, and element energy-dissipation-based methods [81,82,83,84,85,86,87,88,89,90]. These estimators provide rigorous and localized indicators of where and how the mesh should be adapted to satisfy the prescribed accuracy goals.
Despite its advantages, adaptive remeshing introduces its own challenges. This often incurs a significant computational overhead owing to repeated mesh updates and reanalysis. The effectiveness of the method is highly dependent on the precision of the error estimators. In problems involving large deformations, the mesh may become distorted or require frequent remeshing, which can adversely affect numerical stability and convergence. Furthermore, adaptive techniques may face limitations in multiphysics simulations or in cases with complex contact conditions and highly anisotropic material behavior, where the formulation of reliable error indicators becomes significantly more difficult [90,91,92,93].
7. Conslusions
A comprehensive investigation of the influence of ply orientation and stress triaxiality on mesh regularization in orthotropic composite materials was conducted in this study. Mesh regularization was implemented by introducing a scaling factor into the failure strain definition within the ∗MAT_ADD_GENERALIZED_DAMAGE (MAGD) framework in LS-DYNA. A carbon/epoxy laminate was analyzed across three ply orientations (0°, 45°, and 90°) and three loading conditions representing distinct triaxialities: tension, compression, and shear. The results showed a generally inverse relationship between the scaling factor and mesh size, with the scaling factors decreasing as the element size increased. Four theoretical models were evaluated for their ability to predict scaling factors based on the mesh size. The stress degradation model produced the most consistent results across different ply orientations and test configurations. However, although a strong correlation between ply orientation and mesh regularization was identified, no conclusive trend could be established for the influence of stress triaxiality on the mesh regularization behavior. The findings indicate that the existing theoretical models remain inadequate for fully capturing the mesh regularization effects in orthotropic composites, particularly under varied triaxial loading conditions. Therefore, the further development of predictive models that account for material anisotropy, mesh discretization effects, and multiaxial failure mechanisms is necessary. Nevertheless, the approach presented—introducing mesh-dependent scaling factors into the material model—offers a practical and effective strategy for mitigating the mesh sensitivity in finite element simulations of orthotropic materials.
Author Contributions
Conceptualization, A.P. and A.T.; methodology, A.P. and A.T.; software, A.T.; validation, A.P. and A.T.; formal analysis, A.P.; investigation, A.P.; resources, A.T.; data curation, A.P.; writing—original draft preparation, A.P.; writing—review and editing, A.P. and A.T.; visualization, A.P.; supervision, A.T.; project administration, A.T. All authors have read and agreed to the published version of the manuscript.
Funding
This research received no external funding.
Data Availability Statement
The original contributions presented in this study are included in the article. Further inquiries can be directed to the corresponding author.
Conflicts of Interest
The authors declare no conflicts of interest.
References
- Belytschko, T.; Chiang, H.Y.; Plaskacz, E. High resolution two-dimensional shear band computations: Imperfections and mesh dependence. Comput. Methods Appl. Mech. Eng. 1994, 119, 1–15. [Google Scholar] [CrossRef]
- Bracamonte, A.J.; Mercado-Puche, V.; Martínez-Arguelles, G.; Pumarejo, L.F.; Ortiz, A.R.; Herazo, L.C.S. Effect of Finite Element Method (FEM) Mesh Size on the Estimation of Concrete Stress–Strain Parameters. Appl. Sci. 2023, 13, 2352. [Google Scholar] [CrossRef]
- Benvenuti, E.; Orlando, N. A mesh-independent framework for crack tracking in elastodamaging materials through the regularized extended finite element method. Comput. Mech. 2021, 68, 25–49. [Google Scholar] [CrossRef]
- Kahla, N.B.; AlQadhi, S.; Ahmed, M. Mesh-Free MLS-Based Error-Recovery Technique for Finite Element Incompressible Elastic Computations. Appl. Sci. 2023, 13, 6890. [Google Scholar] [CrossRef]
- Prime, M.B.; Merson, J.S.; Chen, S.R. Physical Regime Sensitivity. J. Dyn. Behav. Mater. 2023, 9, 248–261. [Google Scholar] [CrossRef]
- Chen, W.; Zheng, X.; Liu, S. Finite-Element-Mesh Based Method for Modeling and Optimization of Lattice Structures for Additive Manufacturing. Materials 2018, 11, 2073. [Google Scholar] [CrossRef]
- Peng, Y.; Liu, Y.; Zhang, W. Analysis of Dynamic Response Behavior of Crack under Impact Stress Wave. Metals 2021, 11, 1920. [Google Scholar] [CrossRef]
- Manesh, M.G.; Kazemian, A.H.; Rahmani, H. Investigation of the Collapse Behavior of Aluminum Burr-Filled Cylindrical Energy Absorber Under Low-Velocity Impact. J. Dyn. Behav. Mater. 2024, 10, 338–347. [Google Scholar] [CrossRef]
- Naveen Kumar, S.; Balasubramanian, V.; Malarvizhi, S.; Rahman, A.H.; Balaguru, V.; Sonar, T. Experimental and Numerical Investigation on Ballistic Performance of Ultra High Hard Armour Steel Joints Welded Using Shielded Metal Arc Welding Process and Austenitic Stainless Steel Electrode. J. Dyn. Behav. Mater. 2025, 11, 22–33. [Google Scholar] [CrossRef]
- Bendarma, A.; Jankowiak, T.; Rusinek, A.; Lodygowski, T.; Czarnota, C.; Bernier, R.; Khalfaoui, M. Experimental and Numerical Analysis of Aluminum-Polyethylene Composite Structure Subjected to Tension and Perforation Under Dynamic Loading for a Wide Range of Temperatures. J. Dyn. Behav. Mater. 2024, 10, 51–74. [Google Scholar] [CrossRef]
- Meyer, C.S.; Haque, B.Z.; Gillespie, J.W. Impact-Induced Through-Thickness Stress Wave Propagation and Damage in Woven Composites. J. Dyn. Behav. Mater. 2023, 9, 2–23. [Google Scholar] [CrossRef]
- Liu, P.; Xing, Q.; Wang, D.; Oeser, M. Application of Dynamic Analysis in Semi-Analytical Finite Element Method. Materials 2017, 10, 1010. [Google Scholar] [CrossRef] [PubMed]
- Fantuzzi, N. Special Issue “Mesh-Free and Finite Element-Based Methods for Structural Mechanics Applications”. Math. Comput. Appl. 2020, 25, 75. [Google Scholar] [CrossRef]
- Ahmed, M.; Singh, D.; AlQadhi, S.; Alrefae, M.A. Mesh Free Radial Point Interpolation Based Displacement Recovery Techniques for Elastic Finite Element Analysis. Mathematics 2021, 9, 1900. [Google Scholar] [CrossRef]
- Zhang, C.; An, S.; Wang, W.; Lin, D. A Novel Meshing Method Based on Adaptive Size Function and Moving Mesh for Electromagnetic Finite Element Analysis. Symmetry 2021, 13, 254. [Google Scholar] [CrossRef]
- Takabi, B.; Tai, B.L. Finite Element Modeling of Orthogonal Machining of Brittle Materials Using an Embedded Cohesive Element Mesh. J. Manuf. Mater. Process. 2019, 3, 36. [Google Scholar] [CrossRef]
- Chan, T.C.; Ullah, A.; Roy, B.; Chang, S.L. Finite element analysis and structure optimization of a gantry-type high-precision machine tool. Sci. Rep. 2023, 13, 13006. [Google Scholar] [CrossRef]
- Nirmal, R.R.; Patnaik, B.S.V.; Jayaganthan, R. FEM Simulation of High Speed Impact Behaviour of Additively Manufactured AlSi10Mg Alloy. J. Dyn. Behav. Mater. 2021, 7, 469–484. [Google Scholar] [CrossRef]
- Rueda, F.; Rull, N.; Quintana, C.; Torres, J.P.; Messiha, M.; Frank, A.; Arbeiter, F.; Frontini, P.M.; Pinter, G. Modelling Failure of Polymers: An Optimization Strategy Based on Genetic Algorithms and Instrumented Impact Tests. J. Dyn. Behav. Mater. 2021, 7, 538–552. [Google Scholar] [CrossRef]
- Sathananthan, P.; Singh, D.; Sirois, A.; Cronin, D. Soda-Lime Glass Constitutive Parameters and Finite Element Model for Simulating Ballistic Impact. J. Dyn. Behav. Mater. 2021, 7, 591–609. [Google Scholar] [CrossRef]
- Carpenter, A.J.; Chocron, S.; Scott, N.L.; Anderson, C.E. Characterization, Modeling, and Ballistic Impact of Kevlar/Phenolic PVB Composite. J. Dyn. Behav. Mater. 2023, 9, 225–239. [Google Scholar] [CrossRef]
- Picart, D.; Tchikladze, N.; Camus, S. Mechanical Behaviour of Pressed HMX and TATB-Based PBXs During Low-Velocity Impact. J. Dyn. Behav. Mater. 2023, 9, 345–364. [Google Scholar] [CrossRef]
- Belytschko, T.; Bažant, Z.P.; Yul-Woong, H.; Ta-Peng, C. Strain-softening materials and finite-element solutions. Comput. Struct. 1986, 23, 163–180. [Google Scholar] [CrossRef]
- Liu, J.T.; Fan, Q.B.; Cai, H.N.; Li, G.J. Investigation of Mesh Dependency of Materials Fracture in the Finite Element Simulation of a Projectile Penetrating into a Target. Appl. Mech. Mater. 2015, 782, 302–308. [Google Scholar] [CrossRef]
- Amirrahmat, S.; Alshibli, K.A.; Melton, J.L. 3D Finite Element Modelling of Fracture of Sand Particles Subjected to High Strain Loading Rate. J. Dyn. Behav. Mater. 2019, 5, 444–462. [Google Scholar] [CrossRef]
- Bustamante, M.C.; Bruneau, D.; Barker, J.B.; Gierczycka, D.; Coralles, M.A.; Cronin, D.S. Component-Level Finite Element Model and Validation for a Modern American Football Helmet. J. Dyn. Behav. Mater. 2019, 5, 117–131. [Google Scholar] [CrossRef]
- Provchy, Z.A.; Palazotto, A.N.; Flater, P.J. Topology Optimization for Projectile Design. J. Dyn. Behav. Mater. 2018, 4, 129–137. [Google Scholar] [CrossRef]
- Forquin, P.; Lukić, B. On the Processing of Spalling Experiments. Part I: Identification of the Dynamic Tensile Strength of Concrete. J. Dyn. Behav. Mater. 2018, 4, 34–55. [Google Scholar] [CrossRef]
- Lukić, B.B.; Saletti, D.; Forquin, P. On the Processing of Spalling Experiments. Part II: Identification of Concrete Fracture Energy in Dynamic Tension. J. Dyn. Behav. Mater. 2018, 4, 56–73. [Google Scholar] [CrossRef]
- Bai, Y.; Wierzbicki, T. Application of extended Mohr–Coulomb criterion to ductile fracture. Int. J. Fract. 2010, 161, 1–20. [Google Scholar] [CrossRef]
- Lou, Y.; Huh, H.; Lim, S.; Pack, K. New ductile fracture criterion for prediction of fracture forming limit diagrams of sheet metals. Int. J. Solids Struct. 2012, 49, 3605–3615. [Google Scholar] [CrossRef]
- Mohr, D.; Marcadet, S.J. Micromechanically-motivated phenomenological Hosford-Coulomb model for predicting ductile fracture initiation at low stress triaxialities. Int. J. Solids Struct. 2015, 67–68, 40–55. [Google Scholar] [CrossRef]
- Woelke, P.B. Simplification of the Gurson model for large-scale plane stress problems. Int. J. Plast. 2020, 125, 331–347. [Google Scholar] [CrossRef]
- Beese, A.M.; Luo, M.; Li, Y.; Bai, Y.; Wierzbicki, T. Partially coupled anisotropic fracture model for aluminum sheets. Eng. Fract. Mech. 2010, 77, 1128–1152. [Google Scholar] [CrossRef]
- Li, Y.; Wierzbicki, T. Prediction of plane strain fracture of AHSS sheets with post-initiation softening. Int. J. Solids Struct. 2010, 47, 2316–2327. [Google Scholar] [CrossRef]
- Kõrgesaar, M. The effect of low stress triaxialities and deformation paths on ductile fracture simulations of large shell structures. Mar. Struct. 2019, 63, 45–64. [Google Scholar] [CrossRef]
- Kõrgesaar, M.; Romanoff, J. Influence of softening on fracture propagation in large-scale shell structures. Int. J. Solids Struct. 2013, 50, 3911–3921. [Google Scholar] [CrossRef][Green Version]
- Andrade, F.X.; Feucht, M.; Haufe, A.; Neukamm, F. An incremental stress state dependent damage model for ductile failure prediction. Int. J. Fract. 2016, 200, 127–150. [Google Scholar] [CrossRef]
- Walters, C.L. Framework for adjusting for both stress triaxiality and mesh size effect for failure of metals in shell structures. Int. J. Crashworthiness 2014, 19, 1–12. [Google Scholar] [CrossRef]
- Andrade, F.D.A.; Feucht, M.D.A.; Haufe, A.D.G. On the Prediction of Material Failure in LS-DYNA®: A Comparison Between GISSMO and DIEM. In Proceedings of the 13th International LS-DYNA Users Conference, Detroit, MI, USA, 8–10 June 2014; pp. 1–12. [Google Scholar]
- Johnson, G.R.; Cook, W.H. A constitutive model and data from metals subjected to large strains, high strain rates and high temperatures. In Proceedings of the 7th International Symposium on Ballistics, The Hague, The Netherlands, 19–21 April 1983. [Google Scholar]
- Johnson, G.R.; Holmquist, T.J. Evaluation of cylinder-impact test data for constitutive model constants. J. Appl. Phys. 1988, 64, 3901–3910. [Google Scholar] [CrossRef]
- Johnson, G.R.; Cook, W.H. Fracture characteristics of three metals subjected to various strains, strain rates, temperatures and pressures. Eng. Fract. Mech. 1985, 21, 31–48. [Google Scholar] [CrossRef]
- Zerilli, F.J.; Armstrong, R.W. Dislocation-mechanics-based constitutive relations for material dynamics calculations. J. Appl. Phys. 1987, 61, 1816–1825. [Google Scholar] [CrossRef]
- Zerilli, F.J.; Armstrong, R.W. The effect of dislocation drag on the stress-strain behavior of F.C.C. metals. Acta Metall. Mater. 1992, 40, 1803–1808. [Google Scholar] [CrossRef]
- Steinberg, D.J.; Cochran, S.G.; Guinan, M.W. A constitutive model for metals applicable at high-strain rate. J. Appl. Phys. 1980, 51, 1498–1504. [Google Scholar] [CrossRef]
- Haight, S.; Wang, L.; Bois, D.P.; Carney, K.; Kan, C.D. Development of a Titanium Alloy Ti-6Al-4V Material Model Used in LS-DYNA. DOT/FAA/TC-15/23. 2016. Available online: https://rosap.ntl.bts.gov/view/dot/57630 (accessed on 1 October 2025).
- Yatnalkar, R.S. Experimental Investigation of Plastic Deformation of Ti-6Al-4V Under Various Loading Conditions. Ph.D. Thesis, Ohio State University, Columbus, OH, USA, 2010. [Google Scholar]
- Wang, L.; Dicecca, F.; Haight, S.; Carney, K.; Dubois, P.; Emmerling, W.; Kan, C.D. Test and Simulation Comparison using Titanium Material Models based on MAT224. In Proceedings of the 14th International LS-DYNA Users Conference, Detroit, MI, USA, 12–14 June 2016; pp. 1–17. [Google Scholar]
- Woelke, P.B.; Abboud, N.N. Modeling fracture in large scale shell structures. J. Mech. Phys. Solids 2012, 60, 2044–2063. [Google Scholar] [CrossRef]
- Kwak, H.G.; Gang, H. An improved criterion to minimize FE mesh-dependency in concrete structures under high strain rate conditions. Int. J. Impact Eng. 2015, 86, 84–95. [Google Scholar] [CrossRef]
- Choi, C.K.; Kwak, H.G. The effect of finite element mesh size in nonlinear analysis of reinforced concrete structures. Comput. Struct. 1990, 36, 807–815. [Google Scholar] [CrossRef]
- Cao, T.S.; Gachet, J.M.; Montmitonnet, P.; Bouchard, P.O. A Lode-dependent enhanced Lemaitre model for ductile fracture prediction at low stress triaxiality. Eng. Fract. Mech. 2014, 124–125, 80–96. [Google Scholar] [CrossRef]
- Bao, Y.; Wierzbicki, T. On fracture locus in the equivalent strain and stress triaxiality space. Int. J. Mech. Sci. 2004, 46, 81–98. [Google Scholar] [CrossRef]
- Yu, F.; Hendry, M.T.; Jar, P.Y.B.; Li, S.; Li, Z. A coupled stress-triaxiality-dependent damage viscoplasticity model on crack initiation and propagation in high-strength rail steel. Theor. Appl. Fract. Mech. 2020, 109, 102769. [Google Scholar] [CrossRef]
- Jia, Y.; Bai, Y. Ductile fracture prediction for metal sheets using all-strain-based anisotropic eMMC model. Int. J. Mech. Sci. 2016, 115–116, 516–531. [Google Scholar] [CrossRef]
- Algarni, M.; Bai, Y.; Choi, Y. A study of Inconel 718 dependency on stress triaxiality and Lode angle in plastic deformation and ductile fracture. Eng. Fract. Mech. 2015, 147, 140–157. [Google Scholar] [CrossRef]
- Zhao, Y.; Yang, X.; Lu, Y.; Duan, X. Electrical discharge-mechanical hybrid drilling of micro-holes in carbon fibre-reinforced polymers. Int. J. Mach. Tools Manuf. 2025, 205, 104243. [Google Scholar] [CrossRef]
- Chang, F.K.; Chang, K.Y. A Progressive Damage Model for Laminated Composites Containing Stress Concentrations. J. Compos. Mater. 1987, 21, 834–855. [Google Scholar] [CrossRef]
- Shao, J.R.; Liu, N.; Zheng, Z.J. Numerical comparison between Hashin and Chang-Chang failure criteria in terms of inter-laminar damage behavior of laminated composite. Mater. Res. Express 2021, 8, 085602. [Google Scholar] [CrossRef]
- Padhi, G.; Shenoi, R.; Moy, S.; Hawkins, G. Progressive failure and ultimate collapse of laminated composite plates in bending. Compos. Struct. 1997, 40, 277–291. [Google Scholar] [CrossRef]
- Chang, F.K.; Scott, R.A.; Springer, G.S. Failure Strength of Nonlinearly Elastic Composite Laminates Containing a Pin Loaded Hole. J. Compos. Mater. 1984, 18, 464–477. [Google Scholar] [CrossRef]
- Feng, D.C.; Ren, X. Analytical examination of mesh-dependency issue for uniaxial RC elements and new fracture energy-based regularization technique. Int. J. Damage Mech. 2023, 32, 321–339. [Google Scholar] [CrossRef]
- Shyamsunder, L.; Khaled, B.; Rajan, S.D.; Goldberg, R.K.; Carney, K.S.; Dubois, P.; Blankenhorn, G. Implementing deformation, damage, and failure in an orthotropic plastic material model. J. Compos. Mater. 2020, 54, 463–484. [Google Scholar] [CrossRef]
- ASTM D3039/D3039M-08; Standard Test Method for Tensile Properties of Polymer Matrix Composite Materials. ASTM International: West Conshohocken, PA, USA, 2008. [CrossRef]
- Littell, J. The Experimental and Analytical Characterization of the Macromechanical Response for Triaxial Braided Composite Materials. Ph.D. Thesis, University of Akron, Akron, OH, USA, 2008. Available online: http://rave.ohiolink.edu/etdc/view?acc_num=akron1224164770 (accessed on 1 October 2025).
- ASTM D3410/D3410M-16e1; Standard Test Method for Compressive Properties of Polymer Matrix Composite Materials with Unsupported Gage Section by Shear Loading. ASTM International: West Conshohocken, PA, USA, 2016. [CrossRef]
- ASTM D5379/D5379M-19e1; Standard Test Method for Shear Properties of Composite Materials by the V-Notched Beam Method. ASTM International: West Conshohocken, PA, USA, 2019. [CrossRef]
- Liu, B.; Yang, L.; Li, D.; Ouyang, K. Analysis of axial vibration frequency for projectile structure in penetration. Explos. Shock Waves 2018, 38, 677–682. [Google Scholar] [CrossRef]
- Belytschko, T.; Liu, W.; Moran, B.; Elkhodary, K. Nonlinear Finite Elements for Continua and Structures; No Longer used; Wiley: Hoboken, NJ, USA, 2013. [Google Scholar]
- Jiang, N.; Wu, S.; Hu, Y.; Mu, Z.; Wu, X.; Zhang, W. Investigations into the Role of Friction for Rigid Penetration into Concrete-like Material Targets. Materials 2020, 13, 4733. [Google Scholar] [CrossRef] [PubMed]
- Chai, C.; Pi, A.; Li, Q.; Huang, F. On the friction effects on rigid-body penetration in concrete and aluminium-alloy targets. Def. Technol. 2019, 15, 576–581. [Google Scholar] [CrossRef]
- Wriggers, P. Constitutive Equations for Contact Interfaces. In Computational Contact Mechanics; Springer: Berlin/Heidelberg, Germany, 2006; pp. 69–108. [Google Scholar] [CrossRef]
- Riedmaier, S.; Danquah, B.; Schick, B.; Diermeyer, F. Unified Framework and Survey for Model Verification, Validation and Uncertainty Quantification. Arch. Comput. Methods Eng. 2021, 28, 2655–2688. [Google Scholar] [CrossRef]
- Zhan, W.; Baise, L.G.; Moaveni, B. An uncertainty quantification framework for logistic regression based geospatial natural hazard modeling. Eng. Geol. 2023, 324, 107271. [Google Scholar] [CrossRef]
- Zhang, J.; Yin, J.; Wang, R. Basic Framework and Main Methods of Uncertainty Quantification. Math. Probl. Eng. 2020, 2020, 6068203. [Google Scholar] [CrossRef]
- De Vuyst, T.; Vignjevic, R.; Albero, A.A.; Hughes, K.; Campbell, J.; Djordjevic, N. The effect of the orientation of cubical projectiles on the ballistic limit and failure mode of AA2024-T351 sheets. Int. J. Impact Eng. 2017, 104, 21–37. [Google Scholar] [CrossRef]
- Li, X.; Shephard, M.S.; Beall, M.W. 3D anisotropic mesh adaptation by mesh modification. Comput. Methods Appl. Mech. Eng. 2005, 194, 4915–4950. [Google Scholar] [CrossRef]
- Boussetta, R.; Coupez, T.; Fourment, L. Adaptive remeshing based on a posteriori error estimation for forging simulation. Comput. Methods Appl. Mech. Eng. 2006, 195, 6626–6645. [Google Scholar] [CrossRef]
- Dunyach, M.; Vanderhaeghe, D.; Barthe, L.; Botsch, M. Adaptive Remeshing for Real-Time Mesh Deformation. In Proceedings of the Eurographics 2013—Short Papers, Girona, Spain, 6–10 May 2013; Otaduy, M.A., Sorkine, O., Eds.; The Eurographics Association: Eindhoven, The Netherlands, 2013. [Google Scholar] [CrossRef]
- Zienkiewicz, O.C.; Zhu, J.Z. The superconvergent patch recovery and a posteriori error estimates. Part 1: The recovery technique. Int. J. Numer. Methods Eng. 1992, 33, 1331–1364. [Google Scholar] [CrossRef]
- Zienkiewicz, O.C.; Zhu, J.Z. The superconvergent patch recovery and a posteriori error estimates. Part 2: Error estimates and adaptivity. Int. J. Numer. Methods Eng. 1992, 33, 1365–1382. [Google Scholar] [CrossRef]
- Brown, B.W.; Mariano, R.S. Residual-Based Procedures for Prediction and Estimation in a Nonlinear Simultaneous System. Econometrica 1984, 52, 321–343. [Google Scholar] [CrossRef]
- Wohlmuth, B.I. A residual based error estimator for mortar finite element discretizations. Numer. Math. 1999, 84, 143–171. [Google Scholar] [CrossRef]
- Prudhomme, S.; Oden, J. On goal-oriented error estimation for elliptic problems: Application to the control of pointwise errors. Comput. Methods Appl. Mech. Eng. 1999, 176, 313–331. [Google Scholar] [CrossRef]
- Oden, J.; Prudhomme, S. Goal-oriented error estimation and adaptivity for the finite element method. Comput. Math. Appl. 2001, 41, 735–756. [Google Scholar] [CrossRef]
- Luce, R.; Wohlmuth, B.I. A Local A Posteriori Error Estimator Based on Equilibrated Fluxes. SIAM J. Numer. Anal. 2004, 42, 1394–1414. [Google Scholar] [CrossRef]
- Buffa, A.; Chanon, O.; Grappein, D.; Vázquez, R.; Vohralík, M. An Equilibrated Flux A Posteriori Error Estimator for Defeaturing Problems. SIAM J. Numer. Anal. 2024, 62, 2439–2458. [Google Scholar] [CrossRef]
- Creusé, E.; Nicaise, S.; Tang, Z. Goal-oriented error estimation based on equilibrated flux and potential reconstruction for the approximation of elliptic and parabolic problems. Comput. Math. Appl. 2023, 146, 323–338. [Google Scholar] [CrossRef]
- Zeramdini, B.; Robert, C.; Germain, G.; Pottier, T. Numerical simulation of metal forming processes with 3D adaptive Remeshing strategy based on a posteriori error estimation. Int. J. Mater. Form. 2019, 12, 411–428. [Google Scholar] [CrossRef]
- Giacomini, M. Quantitative a Posteriori Error Estimators in Finite Element-Based Shape Optimization. Ph.D. Thesis, Université Paris Saclay (COmUE), Orsay, France, 2016. [Google Scholar]
- Rochery, L.; Loseille, A. Fast High-Order Mesh Correction for Metric-Based Cavity Remeshing and a Posteriori Curving of P2 Tetrahedral Meshes. Comput.-Aided Des. 2023, 163, 103575. [Google Scholar] [CrossRef]
- Rabizadeh, E.; Bagherzadeh, A.S.; Anitescu, C.; Alajlan, N.; Rabczuk, T. Pointwise dual weighted residual based goal-oriented a posteriori error estimation and adaptive mesh refinement in 2D/3D thermo-mechanical multifield problems. Comput. Methods Appl. Mech. Eng. 2020, 359, 112666. [Google Scholar] [CrossRef]
Disclaimer/Publisher’s Note: The statements, opinions and data contained in all publications are solely those of the individual author(s) and contributor(s) and not of MDPI and/or the editor(s). MDPI and/or the editor(s) disclaim responsibility for any injury to people or property resulting from any ideas, methods, instructions or products referred to in the content. |
© 2025 by the authors. Licensee MDPI, Basel, Switzerland. This article is an open access article distributed under the terms and conditions of the Creative Commons Attribution (CC BY) license (https://creativecommons.org/licenses/by/4.0/).