Abstract
The study of the strain rate effects on the PA6 glass fiber-reinforced polyamide, in this specific case, PA6 GF30 (30% reinforced glass fiber), is critical due to composites widely used in automotive applications where the velocity of loading can vary significantly. Some insights into material safety under high quasistatic strain rate regime are given by understanding tensile behavior with focus on strain and stress at break. For this, using injection molding, dog bone samples were subjected to tensile tests at different strain rates, using a precise displacement control and extensometer to record the engineering stress–strain. The results demonstrate that higher strain rates increased the stiffness and strength of the specimen, shifting the stress–strain behavior to higher stress at break due to the reduced time for the polymer relaxation. However, the strain at break decreases under rapid movement, indicating the fact that the specimens exhibited reduced ductility. The results indicate a pronounced strain rate sensitivity that needs to be evaluated and considered for the design and failure mechanism of the components made of PA6 GF30, highlighting the necessity of strain rate specific mechanical characterization for accurate evaluation of performance under high quasistatic strain rate load cases, leading to a more safe and reliable design.
1. Introduction
In recent years, due to the strong strength-to-weight ratio, recyclability, sustainability, etc., the PA6 GF30 is increasingly used in the automotive industry, in components from the engine compartment, chassis, dashboard and safety equipment [1].
Within an assembly or subassembly, throughout its service life, such a component may be subjected to static or high quasistatic strain rate loads that can induce malfunctions within the system. Consequently, understanding the fracture behavior of the material under various loading conditions is of critical importance.
The outcomes of experimental investigations aimed at determining material properties can be influenced by multiple factors, including the material’s composition and microstructure, the clamping position and tightening force applied to the specimen, ambient temperature, and strain rate. In recent years, the influence of strain rate on material properties has attracted growing interest among researchers worldwide [2,3,4], with efforts directed toward a deeper understanding of its impact on metallic [5,6], non-metallic [7,8], and composite materials [9,10] under different loading conditions. Chen examined the effect of strain rate on the mechanical properties and fracture surface roughness of specimens subjected to high quasistatic strain rate regime tensile loading using a Split Hopkinson Tensile Bar (SHTB) system, their findings indicating that tensile strength, elastic modulus, and maximum strain increase in an almost linear manner with strain rate. Furthermore, fracture surface roughness was also observed to rise with increasing strain rate [11]. Cui investigated the mechanical behavior and fracture mechanisms of long glass fiber-reinforced thermoplastic composites (LGFRPPs) within the strain rate range of 0.001 s−1–400 s−1, obtaining results that demonstrates the significant increase of fracture strength and elongation at break with strain rate [12]. He focused on the behavior of a high-entropy alloy, Fe50Mn30Co10Cr10, subjected to uniaxial tensile testing within the strain rate interval of 10−3 s−1–103 s−1 [13]. Their results revealed a nonlinear variation in strength and elongation: the properties decreased at intermediate strain rates (around 1 s−1) but increased markedly at higher strain rates. Dey explored the strain rate sensitivity of aluminum alloys 5754-O and 6111-T4 through uniaxial tensile tests at room temperature complemented by microstructural observations. They reported an increase in fracture strength and yield strength with increasing strain rate, particularly in the high quasistatic strain rate regime [14]. A slight reduction in elongation at break was also observed, attributed to plastic instability. Gao further investigated the effect of strain rate (0.001–100 s−1) on the mechanical response of aluminum foam sandwich panels with aluminum face sheets, employing tensile tests at variable rates and fracture surface examinations using scanning electron microscopy (SEM) [15]. Their findings showed a pronounced increase in tensile strength and stiffness with strain rate. Moreover, the fracture behavior transitioned from ductile deformation to brittle fracture, characterized by abrupt and localized failure.
In the present work, the authors focus on assessing the impact of strain rate on the mechanical properties of the material PA6 GF30. The experimental analyses are based on the use of dog-bone samples that are the subject of a tensile test using different elongation speeds, starting with static domain (e.g., 1 mm/min elongation speed) and evaluation of the high quasistatic strain rate regime behavior (e.g., 1000 mm/min elongation speed). Both static and high quasistatic strain rate evaluations are critical for failure prediction; this criticality applies in some cases, like with the suspension components, where most of the loads that are predicted within the lifetime are correlated to a static load, and in areas where high vibration occurs, like engine compartment or components that come into a possible contact with the occupants and are part of the safety equipment and need to withstand a certain impact until failure. These elements need to be described from a high-quasistatic point of view.
2. Materials and Methods
The material investigated in this study was a polyamide, type 6, reinforced with a 30% glass fiber (PA6 GF30). This material is widely used in the automotive industry due to its high stiffness and strength. The addition of the glass fiber not only increased the mechanical properties of the polyamide but also modified its fracture behavior, making it sensitive to strain rate effects.
The tensile samples used are obtained using the injection molding process [16] where the fiber orientation of 0°—reinforced fibers are distributed along the sample length—is obtained, and can be seen in Figure 1a. A CT analyses was made to confirm the fiber orientation within the sample—see Figure 1b. The parameters for injection molding adhered to ISO 294-1 guidelines [17]; a reciprocating-screw injection-molding machine was employed for the high-filling injection process of pre-melted material at approximately 280 °C in a mold pre-heated to around 90 °C with a holding duration of approximately 12 s at peak pressure, followed by a cooling period of about 40 s.
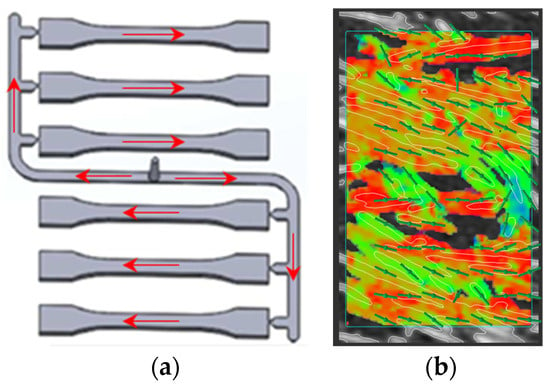
Figure 1.
(a) material flow during injection molding-red arrows; (b) CT check of the fiber orientation in the calibrated area-green lines.
The specimens were prepared according to ISO 527-2 [18] standards, which define a dog-bone geometry suitable for thermoplastic materials. The gauge length was 80 mm, with a nominal width of 10 mm and a thickness of 4 mm in the reduced cross-section. Examples of test specimens before and after the tests are shown in Figure 2.
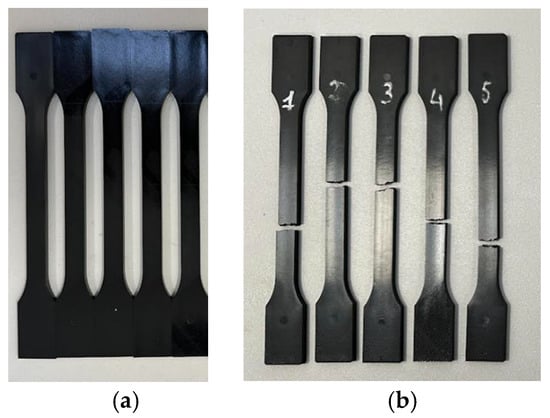
Figure 2.
(a)Test specimens according to ISO 527-2 before test; (b) specimen after test.
For the tensile stress determination, a uniaxial tensile machine, Walter + Bai LFV-T 15/200, made by Walter + Bai AG in Switzerland, Löhningen, was used; force was measured using a 20 kN force transducer from Interface USA, Scottsdale, Arizona, and displacement was measured using an LVTD sensor from MTS USA, Eden Prairie, Minnesota, with a total travel of 250 mm. To connect the test samples to equipment, two pneumatic grips were used with a 185 mm pneumatic membrane, and a pressure of 7 bar relative was used in the system to correspond with a 10 kN clamping force. For strain determination, a video extensometer Vexio ONE, build by Walter + Bai AG in Switzerland, Löhningen is used, using the principles of DIC to measure the relative displacement between two selected points on the calibrated area of the sample and calculate the elongation throughout the test progress—see Figure 3. The test was conducted at room temperature, using 48 h conditioned samples at 23 ± 2 °C and 50 ± 5% relative humidity, to reach the requirements of humidity and temperature mentioned in the ISO 527-2 for the determination of the elasto–plastic properties. Although the standard specifies a minimum preconditioning period of 16 h, extended exposure under controlled temperature and humidity was applied to account for the hygroscopic nature of polyamides and to ensure stable material properties before to testing.
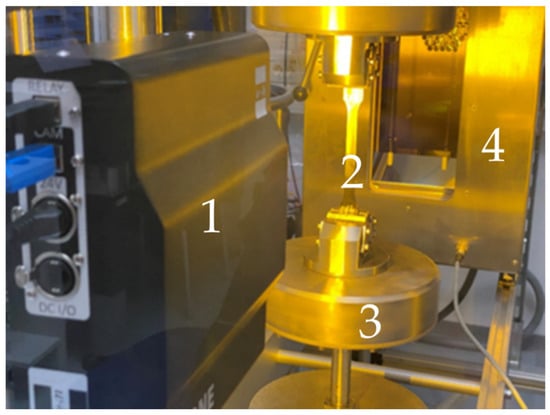
Figure 3.
Test set-up: 1—Specimen, 2—environmental chamber, 3—Walter + Bai LVF-T 15/200 testing machine, 4—Vexio ONE video extensometer.
The primary objective of the test is to investigate the influence of the strain rate on the stress–strain behavior at the fracture of the PA6-GF30 specimens. To this end, tests were conducted under uniaxial tensile load [19] at a range of speed described in Table 1.

Table 1.
Definition of test.
The interval was chosen to represent general quasi-static application at the lower end and high loading rate relevant for high quasistatic strain rate application.
Engineering stresses were calculated as the ratio of the applied load to the initial cross-sectional area, and the engineering strain values were computed from the video extensometer measurements. The recorded data were processed into complete stress–strain curves for each test condition, and the following mechanical parameters were extracted and analyzed: time, force, displacement, tensile strength and strain, and elastic modulus (E). The strain rate, according to ISO527-2 is calculated based on the formula below:
where
- υ = elongation speed
- L0 = initial length of the specimen—calibrated area
The output from the test, strains—stress curves were used as an input for a finite element method analysis. The software used to perform the FEA is Abaqus 2021 HF9, where the model is composed of a dog-bone sample with dimensions according to ISO 527-2, as shown in Figure 4, and used to perform a 3D tensile simulation.
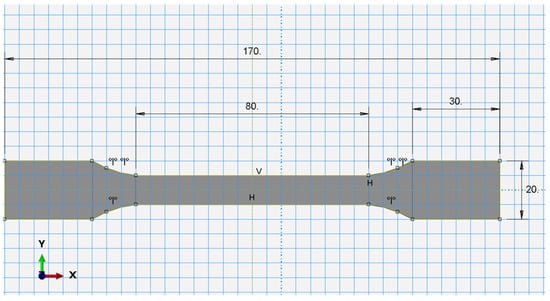
Figure 4.
Sketch of the uniaxial testing specimen used in FEA.
In Abaqus 2021 HF9, the material is described by two parts:
- The elastic component of the curve that is defined by the Young’s modulus [20,21]—determined using Abaqus 2021 HF9 material calibration tool based on the elastic slope of the material definition—see Poisson’s ratio [22]—see Table 2. The value of the Poisson’s ratio is obtained from the literature.
 Table 2. Definition of elastic component.
- For the plasticity definition of the material, the values are given by the machine, stress, σeng, and strain, εeng, and are calculated based on the following formulas:
The material calibration tool [23] from Abaqus 2021 HF9 is used to calculate the true form for each engineering stress–strain curve. The steps required to evaluate the curves are described in Figure 5a–c.
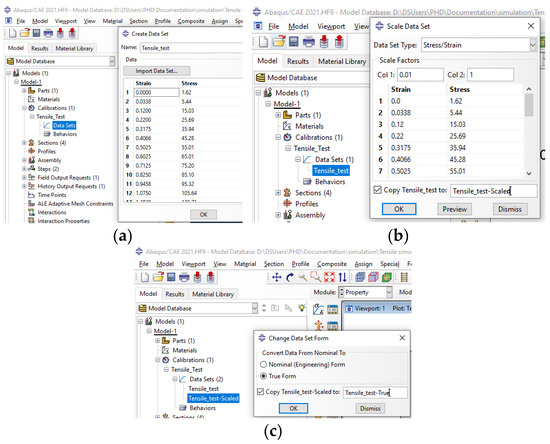
Figure 5.
(a) Engineering stress–strain data import; (b) Scale strain from % to mm/mm; (c) Conversion from engineering to true stress–strain data.
The E modulus is obtained using the Abaqus 2021 HF9 software by calculating the slope of the elastic part on the material from the true stress–strain data. Details are shown in Figure 6.
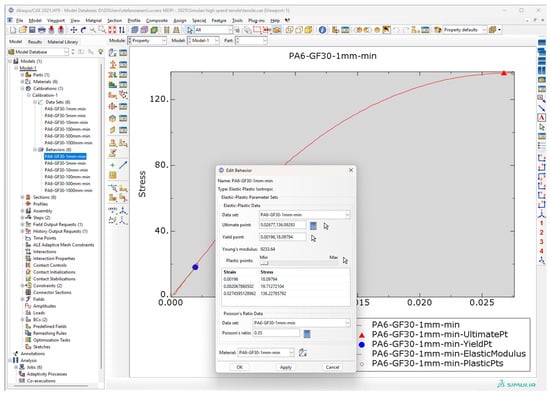
Figure 6.
E modulus determination.
The tensile simulation is performed using the 3D shape of the dog bone sample, discretized using a total no. of 16,128 C3D8 elements with 21,505 nodes, with an global element size of 1 mm; in the calibrated area of 80 mm total length, the double seed size control was selected with the dimension varying from 1 mm at the extremities towards the fixation area of up to 0.2 mm in the middle. Size of the elements was used for a better evaluation of the results and increased accuracy of the field output, which is fixed on one end and the other end has a displacement equal to the mean value calculated from the test that is imposed, see Figure 7.
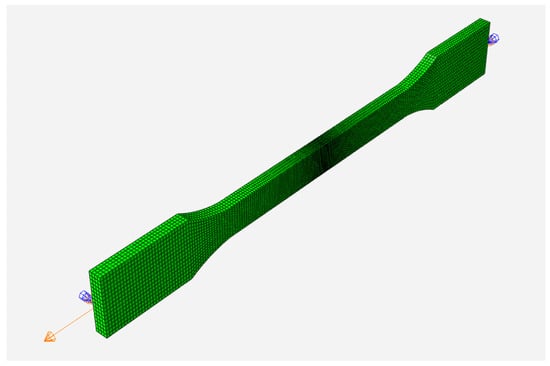
Figure 7.
3D model of tensile specimen discretized, used for uniaxial tensile test using simulation method, with loads and constraint applied.
After the simulations are finished, the results, stresses, strains, forces and displacements are then compared to the ones obtained in the test.
3. Results
A total of 30 samples were subjected to uniaxial tensile loading at six different elongation speeds: 1, 5, 10, 100, 500 and 1000 mm/min, with five samples for each elongation speed. The main output consists of force, displacement, elongation and stress. For each of the five tested samples that correspond to a certain tensile velocity, a mean value for each output channel was made and with that, results were processed into engineering stress–strain curves.
3.1. Test Results
In Figure 8 presents the stress–strain curves obtained at each tensile test speed, with each curve representing the mean values of five specimens subjected to each speed rate.
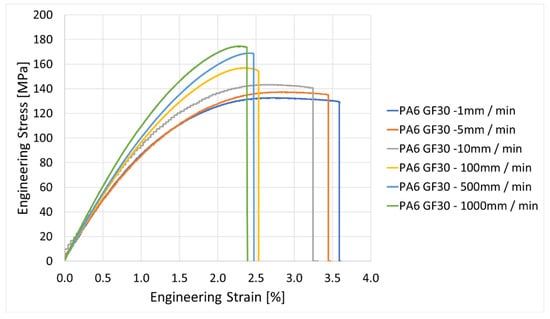
Figure 8.
Experimental engineering stress vs. engineering strain curve.
It can be observed that at the lower speed, in the quasi-static regime (1–10 mm/min), the material is described as predominantly ductile, showing a higher elongation at fracture, with an average of 3.5% at lower tensile speed compared to an average of 2.5% at higher tensile speed (100 to 1000 mm/min). In contrast, with the high quasistatic strain rate regime (100–1000 mm/min), the material behavior shows a reduction in ductility; the displayed curves have steeper slopes and show an earlier fracture at a higher force, at approx. 7 kN for 1000 mm/min compared to ~5.2 kN for 1 mm/min—an approximate drop of force at failure of 30% for the lower speed compared to high speed—see Figure 9.
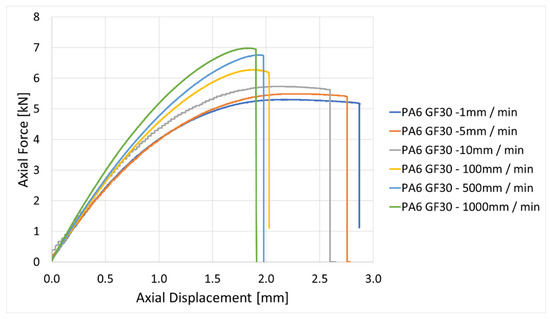
Figure 9.
Characteristic curves of force vs. displacement.
For better reliability, a statistical evaluation was performed on the experimental results, in relation to stress and strain. This evaluation includes maximum values and mean values with standard deviation for the stress and strain results for each elongation speed. Results of the statistical Anova evaluation are described in Table 3.

Table 3.
Statistical summary of stress and strain at break.
The statistical evaluation confirms the robustness of the experimental results: stress increases with speed while strain decreases with reduced scattering along the tested specimens, as shown in Figure 10 and Figure 11.
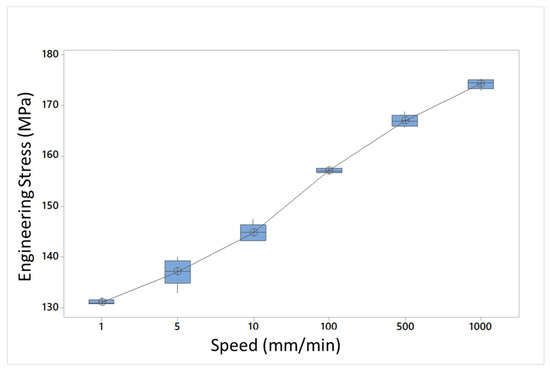
Figure 10.
Graphical evaluation of the mean stress in relation to elongation speed.
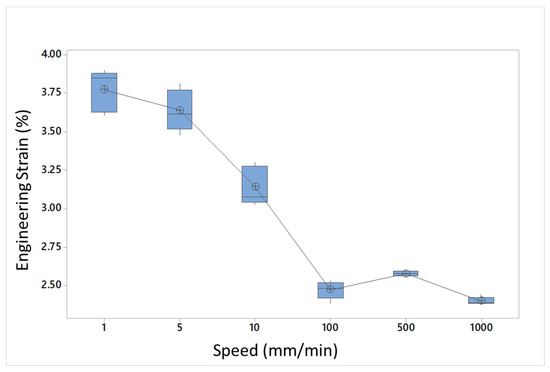
Figure 11.
Graphical evaluation of the mean strain in relation to elongation speed.
For all six elongation speeds investigated, the Anderson–Darling test confirmed that the data followed a normal distribution, as no significant deviations from normality were observed (all p > 0.05). Accordingly, the assumption of normality was accepted, indicating that the experimental results reflect consistent and naturally distributed variability across the test conditions. Outlier analysis using the Grubbs test likewise did not identify any statistically significant extreme values (all p > 0.05). Both specific strain and normal stress values were confined within relatively narrow intervals, suggesting a moderate yet coherent experimental variation across all elongation speeds.
Since the statistical outcomes were consistent across all six elongation speeds, normality of the datasets corresponding to 1000 mm/min elongation speed were evaluated using the Anderson–Darling test, which revealed no significant departures from a normal distribution (all p > 0.05). Thus, the null hypothesis of normality was not rejected, supporting the assumption that the experimental data reflect natural and consistent variability. Outlier detection was performed using the Grubbs test, which did not identify any significant outliers for the specific strain (p = 0.097), with values distributed within a narrow range and showing no major deviations. In the case of normal stress, the observed values ranged from 172.934 MPa to 175.851 MPa, indicating a moderate but consistent experimental variation. No statistically significant extreme values were detected in this dataset either (all p > 0.05)—see Figure 12 and Figure 13.
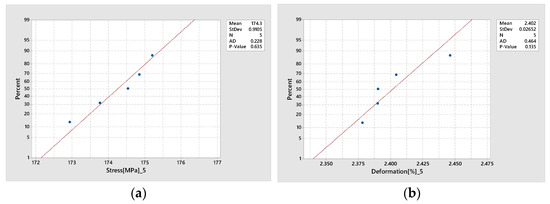
Figure 12.
Anderson–Darling test evaluation for (a) stress and (b) strain.
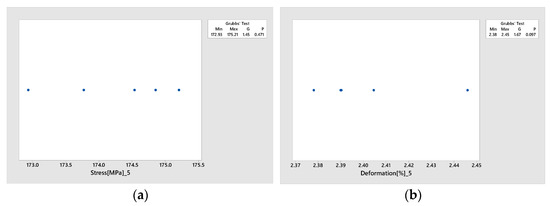
Figure 13.
Grubbs test evaluation for (a) stress and (b) strain.
3.2. FEA Validation
To further increase the confidence of the experimental results, a series of six finite element simulations were made, one for each elongation speed, all using the standard solver from Abaqus 2021 HF9. Figure 14, Figure 15, Figure 16, Figure 17, Figure 18 and Figure 19 show stress and displacement output from the simulation.
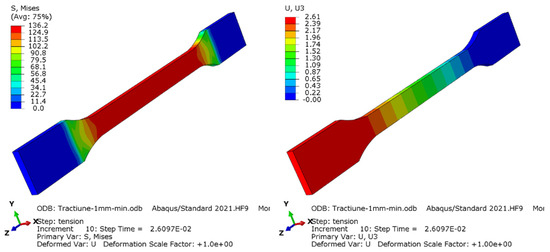
Figure 14.
Distribution of von Mises equivalent stress (left) and displacement of the specimen on testing direction (right) for 1 mm/min elongation speed.
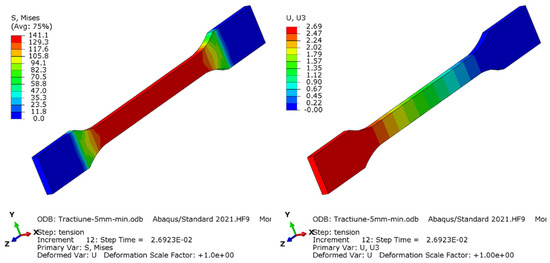
Figure 15.
Distribution of von Mises equivalent stress (left) and displacement of the specimen on testing direction (right) for 5 mm/min elongation speed.
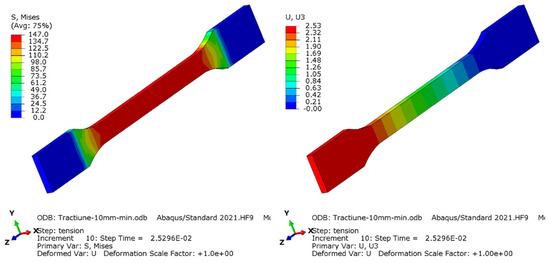
Figure 16.
Distribution of von Mises equivalent stress (left) and displacement of the specimen on testing direction (right) for 10 mm/min elongation speed.
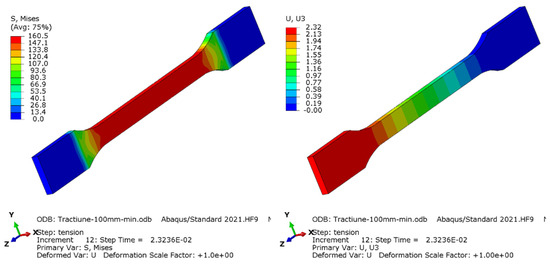
Figure 17.
Distribution of von Mises equivalent stress (left) and displacement of the specimen on testing direction (right) for 100 mm/min elongation speed.
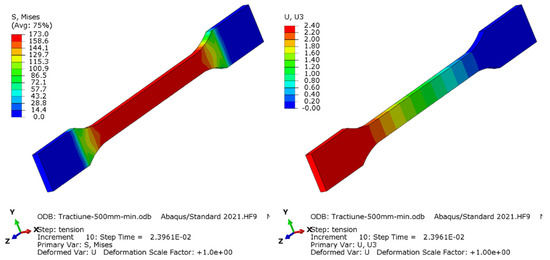
Figure 18.
Distribution of von Mises equivalent stress (left) and displacement of the specimen on testing direction (right) for 500 mm/min elongation speed.
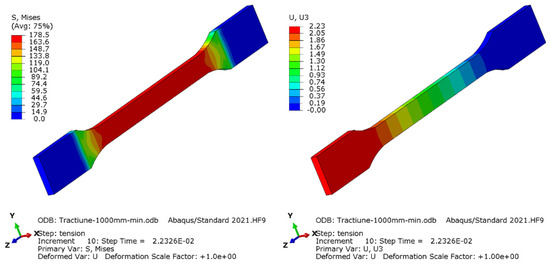
Figure 19.
Distribution of von Mises equivalent stress (left) and displacement of the specimen on testing direction (right) for 1000 mm/min elongation speed.
Figure 20, Figure 21, Figure 22, Figure 23, Figure 24 and Figure 25 represent the comparison of force vs. displacement between the test and simulation.
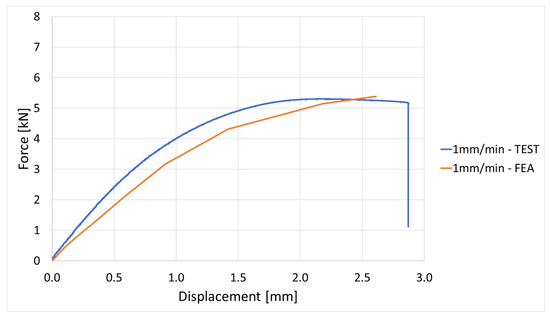
Figure 20.
Force vs. displacement curve evaluation for 1 mm/min elongation speed.
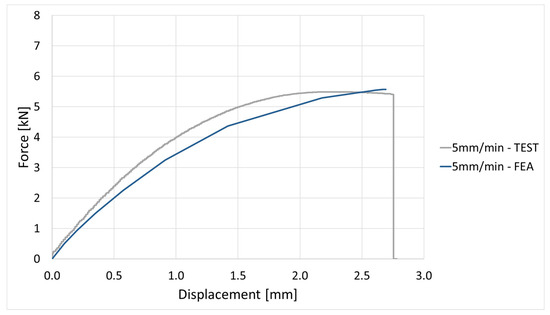
Figure 21.
Force vs. displacement curve evaluation for 5 mm/min elongation speed.
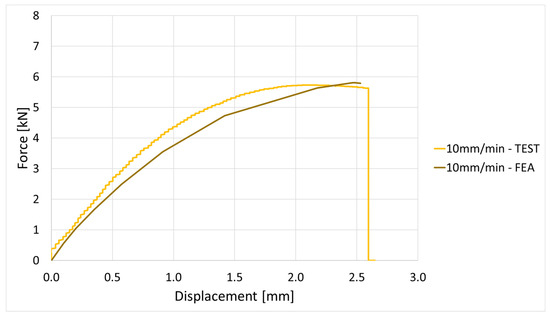
Figure 22.
Force vs. displacement curve evaluation for 10 mm/min elongation speed.
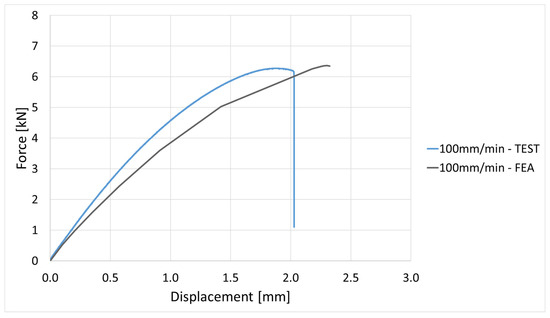
Figure 23.
Force vs. displacement curve evaluation for 100 mm/min elongation speed.
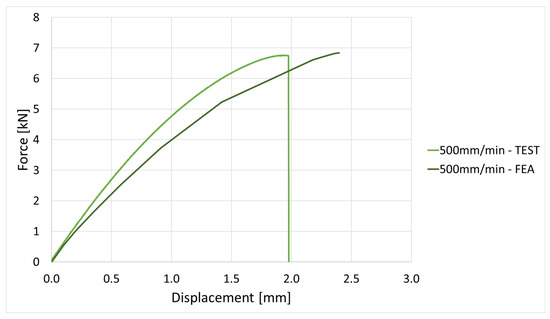
Figure 24.
Force vs. displacement curve evaluation for 500 mm/min elongation speed.
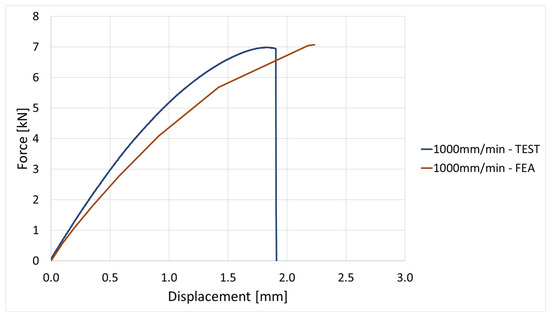
Figure 25.
Force vs. displacement curve evaluation for 1000 mm/min elongation speed.
The FEA simulation provides further validation of the test data. Stress–displacement and force–displacement comparisons show a good correlation across the elongation speed domain; if the deviation value is approx. 7%, which is under the 10% error that can be given, then it is accepted by any FEA software or method.
4. Discussion
The experimental investigation shows a clear sensitivity of PA6 GF30 towards strain rate. With increasing the speed from 1 to 1000 mm/min, it was noticed that the maximum stress increased by approximately 30%, while the elongation at break decreased by about one third—the trend was consistent throughout all the samples tested, confirming the strong dependency of the mechanical properties of the PA6 GF30 to strain rate.
This behavior can be attributed to the viscoelastic–plastic nature of the polyamide matrix. At low strain rates, the polymer chains have sufficient time to rearrange and undergo plastic deformation, which allows higher strains at failure. In contrast, under higher rates, the reduced time for molecular rearrangement results in a stiffer response and premature fracture, with ductility being compromised. Similar strain rate effects have been widely reported in thermoplastic composites. For example, Cui et al. [12] observed that long glass fiber-reinforced thermoplastics exhibited increased tensile strength but reduced strain at break with increasing loading rate, while Schössig et al. [10] and Zhou & Mallick [9] reported comparable trends for injection-molded glass-fiber composites, linking them to matrix relaxation and fiber–matrix interface effects. Comparable mechanisms have also been described for aluminum alloys [14] and high-entropy alloys [13], underlining the generality of this rate-dependent trade-off between strength and ductility.
The FEA provides further validation of the experimental data. Stress-displacement and force-displacement comparison show good correlation across the elongation speed. Is noticed that at lower speeds (1–10 mm/min), the FEA model replicates almost identical experimental data. At higher rates (100–1000 mm/min), the FEA model slightly overestimates stiffness, most probably due to the missing definition in the model of the local micro damages, such as fiber debonding, cracks in the polyamide matrix, or local strain localization, which are difficult to introduce in a simple model. Such effects have been emphasized in before studies on short glass fiber composites (e.g., Zhou & Mallick [9]; Schössig et al. [10]), where micro-damage plays a critical role in limiting ductility under dynamic loads.
Nevertheless, the numerical model results are within 10% deviation, confirming that the FEA can be reliably used in the prediction of the strain rate response of the PA6 GF30. Components can be evaluated via simulation with a high level of confidence and is expected to better perform under high quasistatic strain rate regime due to their increase strength at higher rates, while exhibiting reduced ductility. The validated FEA model constitutes a valuable predictive tool for evaluating strain rate performance, supporting optimization of the design and increasing safety assessments.
Finally, while the present study provides a strong foundation, its limitation lies in the absence of scanning electron microscopy (SEM) characterization, which would have offered deeper insights into the failure mechanisms. Future work should therefore focus on incorporating detailed SEM analysis and extending the evaluation to specimens with different fiber orientations (45° and 90°), including evaluation at higher temperatures [24], to achieve a more comprehensive understanding of microstructural damage evolution and fracture behavior under various strain rate conditions, and to expand the available database to establish a damage mechanism that can be considered in the FEA model.
5. Conclusions
The study presents a comprehensive and quantitative validated strain rate sensitivity evaluation of PA6 GF30 components, providing information beyond what was previously reported on glass-fiber reinforced polymers. Previous research concentrated on dynamic or impact behavior; this study characterizes the reaction of PA6 GF30 at quasi-static and high quasi-static strain rates (1–1000 mm/min), using extensive experimental findings, statistical analysis, and finite element analysis correlation.
The tensile strength increased from 132.6 MPa at 1 mm/min to 175.2 MPa at 1000 mm/min, reflecting a rise of 32%, whilst the strain at failure decreased from 3.9% to 2.44%, indicated an approximate reduction of 37%. The failure force increased from 5.2 kN to 7 kN, while the predicted Young’s modulus grew from 9228 MPa to 13,104 MPa, representing an almost 42% increase. The findings emphasize the compromise between strength and ductility as strain rate increases, highlighting the need for integrating strain rate-dependent material characterization into the design and safety assessment of PA6 GF30 components utilized in automotive applications exposed to varying loading speeds.
One limitation of the present study is the absence of SEM analyses, which would have provided more detailed views regarding failure mechanism. To build on the current findings, further research must investigate specimens with alternative fiber orientation—45° and 90° along the tensile direction—and should integrate SEM analyses for a better understanding of the microstructural damage and fracture behavior, as well as their role in strain rate dependent performance.
Author Contributions
Conceptualization, A.M.P. and N.S.; Methodology, A.M.P. and N.S.; Software, N.S.; Validation, A.M.P. and N.S.; Formal analysis, A.M.P. and N.S.; Investigation, A.M.P. and N.S.; Resources, A.M.P. and N.S.; Data curation, N.S.; Writing—original draft, N.S.; Writing—review & editing, A.M.P.; Visualization, A.M.P. and N.S.; Supervision, A.M.P. All authors have read and agreed to the published version of the manuscript.
Funding
This research received no external funding.
Institutional Review Board Statement
Not applicable.
Informed Consent Statement
Not applicable.
Data Availability Statement
The original contributions presented in this study are included in the article. Further inquiries can be directed to the corresponding author.
Conflicts of Interest
The authors declare no conflicts of interest.
Abbreviations
The following abbreviations are used in this manuscript:
| FEA | Finite element analysis |
| PA6 GF30 | Polyamide, type 6, reinforced with 30% glass fiber |
| SEM | Scanning electron microscopy |
References
- Caputo, F.; Lamanna, G.; De Luca, A.; Armentani, E. Thermo-Mechanical Investigation on an Automotive Engine Encapsulation System Made of Fiberglass Reinforced Polyamide PA6 GF30 Material. Mcromolecular Symp. 2020, 389, 1900100. [Google Scholar] [CrossRef]
- Duan, S.; Mo, F.; Yang, X.; Tao, Y.; Wu, D.; Peng, Y. Experimental and numerical investigations of strain rate effects on mechanical properties of LGFRP composite. Compos. Part B Eng. 2016, 88, 101–107. [Google Scholar] [CrossRef]
- Brown, K.A.; Brooks, R.; Warrior, N.A. The static and high strain rate behaviour of a commingled E-glass/polypropylene woven fabric composite. Compos. Sci. Technol. 2010, 70, 272–283. [Google Scholar] [CrossRef]
- Zhai, Z.; Jiang, B.; Drummer, D. Strain rate-dependent mechanical behavior of quasi-unidirectional E-glass fabric reinforced polypropylene composites under off-axis tensile loading. Polym. Test. 2018, 69, 276–285. [Google Scholar] [CrossRef]
- Mohapatra, S.; Kumar, S.; Das, S.; Das, K. Effect of strain rate on the microstructure evolution and tensile behavior of medium manganese steel. Mater. Lett. 2023, 330, 133243. [Google Scholar] [CrossRef]
- Zhou, N.; Song, R.; Huo, W.; Zhang, Z. Strain rate effect on microstructural evolution and deformation behavior of medium-Mn transformation-induced plasticity steels. Steel Res. Int. 2021, 92, 2000261. [Google Scholar] [CrossRef]
- Naka, T.; Yoshida, F. Deep drawability of type 5083 aluminium–magnesium alloy sheet under various conditions of temperature and forming speed. J. Mater. Process. Technol. 1999, 89, 19–23. [Google Scholar] [CrossRef]
- Li, D.; Ghosh, A. Tensile deformation behavior of aluminum alloys at warm forming temperatures. Mater. Sci. Eng. A 2003, 352, 279–286. [Google Scholar] [CrossRef]
- Zhou, Y.; Mallick, P.K. A non-linear damage model for the tensile behavior of an injection molded short E-glass fiber reinforced polyamide-6,6. Mater. Sci. Eng. A 2005, 393, 303–309. [Google Scholar] [CrossRef]
- Schoßig, M.; Bierögel, C.; Grellmann, W.; Mecklenburg, T. Mechanical behavior of glass-fiber reinforced thermoplastic materials under high strain rates. Polym. Test. 2008, 27, 893–900. [Google Scholar] [CrossRef]
- Chen, Y.; Lin, G.; Mao, R.; Li, M.; Mao, X.; Zhang, K. Strain Rate Effect on the Mechanical Properties and Fracture Surface Roughness of Sandstone Subjected to Dynamic Direct Tension. IEEE Access 2020, 8, 107977–107992. [Google Scholar] [CrossRef]
- Cui, J.; Wang, S.; Wang, S.; Li, G.; Wang, P.; Liang, C. The effects of strain rates on mechanical properties and failure behavior of long glass fiber reinforced thermoplastic composites. Polymers 2019, 11, 2019. [Google Scholar] [CrossRef] [PubMed]
- He, Z.F.; Jia, N.; Wang, H.W.; Liu, Y.; Li, D.Y.; Shen, Y.F. The effect of strain rate on mechanical properties and microstructure of a metastable FeMnCoCr high entropy alloy. Mater. Sci. Eng. A 2020, 776, 138982. [Google Scholar] [CrossRef]
- Wang, M.; Shan, A. Effect of strain rate on the tensile behavior of ultra-fine grained pure aluminum. J. Alloys Compd. 2008, 455, L10–L14. [Google Scholar] [CrossRef]
- Yao, Y.; Xie, L.; Xi, H.; Rong, Y.; Mobasher, B. Strain rate and fracture analysis in closed-cell aluminum foams in tension: Quasi-static to dynamic loads. Mater. Today Commun. 2025, 44, 111959. [Google Scholar] [CrossRef]
- Morar, C.; Popescu, A. The design of a plastic injection mold for the part “tensile test specimen”. Acta Tech. Napoc.-Ser. Appl. Math. Mech. Eng. 2017, 60. Available online: https://api.semanticscholar.org/CorpusID:73667182 (accessed on 11 September 2025).
- ISO294-1:2017; Plastics—Injection Molding of Test Specimens of Thermoplastic Materials. ISO: Geneva, Switzerland, 2017. Available online: https://www.iso.org/standard/67036.html (accessed on 11 September 2025).
- ISO 527-2:2025; Plastics—Determination of Tensile Properties—Part 2: Test Conditions for Moulding and Extrusion Plastics. ISO: Geneva, Switzerland, 1 June 2025.
- Incercarea la Tracțiune a Materialelor Compozite. Available online: https://sim.utcluj.ro/stm/download/Mat_compozite/Inc_tractiune.pdf (accessed on 11 September 2025).
- Stanciu, A.; Teodorescu Draghicescu, H.; Candea, I.; Munteanu, V.; Guman, V. Experimental Aproaches Regarding the Elastic Properties of a Composite Laminate Subjected to Static Loads. In Proceedings of the The 3rd International Conference on International Conference Computational Mechanics and Virtual Engineering COMEC 2009, Brasov, Romania, 29–30 October 2009. [Google Scholar]
- Available online: https://polymerdatabase.com/polymer%20physics/Poisson%20Table.html (accessed on 11 September 2025).
- Curtu, I.; Stanciu, A. Determinarea caracteristicilor mecanice ale epruvetelor realizate din material compozit de tip mat&roving. Bul. AGIR 2011, 1. Available online: https://www.buletinulagir.agir.ro/articol.php?id=961 (accessed on 11 September 2025).
- Gómez-Garraza, S.; de Santos, R.; Infante-García, D.; Marco, M. Visco-hyperelastic material model fitting to experimental stress–strain curves using a genetic algorithm and its application to soft tissue simulants. Sci. Rep. 2024, 14, 18026. [Google Scholar] [CrossRef] [PubMed]
- Zhang, L.; Townsend, D.; Petrinic, N.; Pellegrino, A. Temperature dependent dynamic compressive response of PA66-GF30 composite under constant strain rate multiaxial loading. Compos. Part B Eng. 2022, 234, 109738. [Google Scholar] [CrossRef]
Disclaimer/Publisher’s Note: The statements, opinions and data contained in all publications are solely those of the individual author(s) and contributor(s) and not of MDPI and/or the editor(s). MDPI and/or the editor(s) disclaim responsibility for any injury to people or property resulting from any ideas, methods, instructions or products referred to in the content. |
© 2025 by the authors. Licensee MDPI, Basel, Switzerland. This article is an open access article distributed under the terms and conditions of the Creative Commons Attribution (CC BY) license (https://creativecommons.org/licenses/by/4.0/).