Article

Early Prediction of Student Performance Using an Activation Ensemble Deep Neural Network Model

by
Hassan Bin Nuweeji
and
Ahmad Bassam Alzubi
*
Department of Business Administration, Institute of Graduate Research and Studies, University of Mediterranean Karpasia, Mersin 33010, Turkey
*
Author to whom correspondence should be addressed.
Appl. Sci. 2025, 15(21), 11411; https://doi.org/10.3390/app152111411
Submission received: 12 September 2025 / Revised: 10 October 2025 / Accepted: 12 October 2025 / Published: 24 October 2025

Abstract

In recent years, academic performance prediction has evolved as a research field thanks to its development and exploration in the educational context. Early student performance prediction is crucial for enhancing educational outcomes and implementing timely interventions. Conventional approaches frequently struggle on behalf of the complexity of student profiles as a consequence of single activation functions, which prevent them from effectively learning intricate patterns. In addition, these models could experience obstacles such as the vanishing gradient problem and computational complexity. Therefore, this research study designed an Activation Ensemble Deep Neural Network (AcEnDNN) model to gain control of the previously mentioned challenges. The main contribution is the creation of a credible student performance prediction model that comprises extensive data preprocessing, feature extraction, and an Activation Ensemble DNN. By utilizing various methods of activation functions, such as ReLU, tanh, sigmoid, and swish, the ensembled activation functions are able to learn the complex structure of student data, which leads to more accurate performance prediction. The AcEn-DNN model is trained and evaluated based on the publicly available Student-mat.csv dataset, Student-por.csv dataset, and a real-time dataset. The experimental results revealed that the AcEn-DNN model achieved lower error rates, with an MAE of 1.28, MAPE of 2.36, MSE of 4.55, and RMSE of 2.13 based on a training percentage of 90%, confirming its robustness in modeling nonlinear relationships within student data. The proposed model also gained the minimum error values MAE of 1.28, MAPE of 2.97, MSE of 4.77, and RMSE of 2.18, based on a K-fold value of 10, utilizing the Student-mat.csv dataset. These findings highlight the model’s potential in early identification of at-risk students, enabling educators to develop targeted learning strategies. This research contributes to educational data mining by advancing predictive modeling techniques that evaluate student performance.

1. Introduction

Students hold the most important role as stakeholders in educational institutions and the strong performance of these organizations is necessary for producing high-quality post-graduates (PGs) and graduates. Significant efforts must be made to ensure student retention, identify at-risk students, and allocate resources to enrich student performance [1]. Universities are aware that they are facing a complex and fiercely competitive environment. Their primary task is to analyze their performance rigorously, pinpoint what sets them apart, and create strategies for ongoing growth and success [2]. Educational institutions recognize the vast benefits of data mining (DM) and use it to enhance their performance. The academic success of college students is critical for appraising the quality of a university. Academic success is a fundamental measure for assessing the effectiveness of teaching and learning and for selecting and assessing students. The performance of students is impacted by various complex factors, with their socio-economic background and past academic achievements having the ability to influence their academic performance. The majority of current research has focused on analyzing and predicting student performance in a straightforward manner using statistical methods. The increasing prevalence of data mining applications is largely attributed to the ability to store large amounts of data and process them quickly [3,4]. Educational data mining incorporates techniques from statistics, machine learning (ML), and deep learning (DL) within the education sector.
Data mining examines a diverse range of educational data to enhance education, such as student modeling, performance prediction, and behavior modeling [5,6,7,8]. Determining student performance by browsing data is a key benefit of educational data mining for the improvement in the effectiveness of these environments. Students are considered the primary beneficiaries of these educational institutions [8,9]. However, government and accreditation agencies ensure that organizations sustain a standardized learning environment through accreditation processes to devise new procedures to uphold their standards [9,10]. Educational institutions make use of modern technologies like Intelligent Tutoring Systems (ITSs), Learning Management Systems (LMSs), and online platforms to gather extensive data on students and the learning environment [11]. The data includes student documentation, behavior, exam performance, social forum interaction, demographic information, and administrative details. Institutions need to adopt innovative techniques to effectively utilize these data and enhance their decision-making processes [12,13]. Various computer technologies simplify complex materials for more comprehensible and retainable information, while data mining algorithms use advanced techniques to extract important information [14]. It is common for research studies to focus on predicting and analyzing student performance using basic statistical methods, often overlooking the intricacies of these influences [15,16]. To address this constraint, machine learning is increasingly being utilized in data science applications to examine intricate connections. It possesses the ability to learn automatically without explicit programming.
In machine learning, although artificial neural network (ANN) models have a long history in computing and data science, they are now receiving more attention and being applied in various fields [17]. ANN has indicated considerable success in prediction sectors such as healthcare, climate, stock markets, and more. ANN expands its capability to analyze complex datasets irreducibly using traditional statistical methods. Additionally, ANN can uncover nonlinear relationships between variables. However, its use in educational research remains limited [18]. The challenges faced in utilizing artificial neural networks (ANNs) include the increasing complexity of network models, the difficulty in explaining the system’s decisions due to its black-box nature, the risk of overfitting, and the time required for network training [19]. Handling an imbalanced class distribution and leveraging feature selection are crucial aspects of enhancing prediction accuracy [20]. Imbalanced class distribution is a frequent issue in educational data that can greatly impact model performance. Other researchers have focused on creating different algorithms and feature importance methods, such as the SMOTE oversampling method, to address the imbalanced data problem [21]. Furthermore, a comparison between random oversampling and the SMOTE balancing technique was conducted to analyze the academic achievement of students. The selection of a suitable method for addressing imbalanced data can present challenges as there are numerous resampling options available for managing the issue [22].
Building upon the existing drawbacks, this research proposes the AcEn-DNN model for effective student performance prediction. Conventional approaches face complexity and gradient problems, which prevent them from effectively learning intricate patterns [23]. Therefore, this research study designed the new model AcEn-DNN to overcome the previously mentioned challenges. The main contribution of this research is the creation of a credible student performance prediction model that comprises extensive data preprocessing, feature extraction, and an Activation Ensemble DNN. By utilizing various methods of activation functions, the ensembled activation functions are able to learn the complex structure of student data, which leads to more accurate performance prediction.
Activation Ensemble Deep Neural Network (AcEnDNN): The incorporation of ensembled activation functions with the DNN model enhances early student performance predictions. Further, the proposed model’s architecture is made up of different activation functions, including rectifier linear unit (ReLU), hyperbolic tangent (tanh), sigmoid, and swish, combined as an ensembled activation function. The ensemble activation function improves the potential of the AcEn-DNN model to identify the complex patterns in nonlinear student data and generate more accurate predictions. Moreover, the proposed AcEn-DNN method captures complex links and relationships, which enhances the effectiveness of education interventions and support strategies.
We organize the research work as follows: In Section 2, various existing methods are discussed for predicting student performance. The methodology of AcEn-DNN is derived in Section 3. In Section 4, the mathematical model of AcEn-DNN is derived in detail. Moreover, Section 5 provides efficient results and discussions, which prove the efficacy of the model. Finally, Section 6 concludes the paper and suggests potential directions for further studies.

2. Literature Review

Ramin Ghorbani and Rouzbeh Ghousi [3] conducted a study focusing on the impact of data that is not balanced and identifying the most effective resampling method for addressing the problem. The results obtained through various evaluation metrics suggest that models perform better when dealing with fewer classes and nominal features. However, further enhancements in model performance could be achieved through the development of new ensemble and hybrid classifiers. Nikola Tomasevic et al. [4] conducted a detailed comparison and analysis of advanced supervised ML methods that would help in predicting student exam performance and future achievements, like final exam scores. The model they developed demonstrated high accuracy in making these predictions. One common issue frequently discussed in learning analytics is profiling, which can arise from improper application.
E.T. Lau et al. [5] introduced a method that combines traditional statistical analysis with NN modeling to predict student performance. The neural network model demonstrated strong accuracy in its predictions. This suggests that incorporating artificial intelligence-based analytics in academic settings could help improve students’ academic success in the future. Qi Liu et al. [6] examined student performance predictions by developing a framework that analyzed both the student’s exercise history and the content of the exercises themselves. Their approach aimed to enhance prediction accuracy by including an attention mechanism. However, they found that predicting student performance still faced challenges due to the cold start problem.
Hanan Abdullah’s [2] goal was to help higher education institutions make informed decisions about the applicant’s academic performance during the admission process. Hanan Abdullah employed popular data mining techniques to generate four prediction models. Their study revealed that these techniques were more accurate and precise compared to others. However, further enhancements in performance could be achieved by incorporating other data mining techniques, like clustering, in the future. Lubna Mahmoud Abu Zohair [1] introduced a model that demonstrates the potential for training and modeling with a limited dataset size while achieving accurate predictions. Their study’s results confirmed the effectiveness of algorithms in training with small datasets and achieving satisfactory levels of accuracy in classification and reliability tests, despite encountering computational challenges.
Mustafa Yagci [7] introduced a novel model that utilizes ML algorithms to forecast the final exam scores of college students by using their midterm exam grades as input data. While the model demonstrated a strong performance in accurately predicting grades, it encountered challenges related to overfitting. Seyhmus Aydogdu [8] assessed how well machine learning algorithms could track students’ academic advancement with impressive precision. Their study aimed to take the concept further by reapplying the model following the second exam, potentially enhancing its effectiveness. The approach could benefit struggling students by giving them a chance to improve and adequately prepare for future assessments.
N.U. Rehman Junejo et al. [24] designed a deep learning SAPPNet model to predict student academic performance that analyzed the patterns within a dataset. The model consisted of spatial and convolution modules that learn how student behaviors and performances change, which would improve educational results in real-time circumstances. However, the model struggled with interpretability and scalability, limiting its overall efficiency. N.U. Rehman Junejo et al. [25] presented an SLPNet deep learning model termed the student learning performance prediction network to predict students’ grades using a Jordan University dataset. The model had three convolutional stages to improve accurate prediction. Although the model improved prediction performance, it also faced complexity in computation.
L.H. Baniata et al. [26] proposed a Gated Recurrent Neural Network that incorporates dense layers, max-pooling layers, and the ADAM optimizer to identify underperforming students that overtook traditional educational recommendation systems in terms of robustness. Although the model had high performance and applicability, it still required a long computation time. Luis Vives et al. [27] offered a Long Short-Term Memory Neural Network for students’ academic performance. The employment of GAN and SMOTE techniques rectified the data imbalance problem. However, the model still struggled with complexity due to its complex structure.
Table 1 provides a comparative discussion of the existing methods.

2.1. Challenges

  • Improving a model’s predictive accuracy is widely known to be difficult. Various factors play a role in enhancing predictive accuracy [3].
  • The uneven distribution of classes in educational data is a frequent issue that can significantly impact the efficiency of models. Additionally, creating new ensembles and hybrid classifiers for the scenario poses a challenge [9].
  • Examining and contrasting the effectiveness of classifiers is an important process. While it may seem easy to assess their performance, the results can be deceiving. Thus, determining the most optimal method that results in their strengths is a crucial task [4].
  • Even though artificial neural networks help to reveal connections between neurons, a major drawback is the challenge of interpreting the relationships between independent and dependent variables [5].

2.2. Problem Statement

The earlier prediction research aimed to predict students’ performance in learning to improve the university students’ international and national ranking levels and innovation. Education institutes use the popular evaluation and prediction technique, namely conventional statistical methods with educational data mining (EDM) as an efficient predictive method. However, when they analyze a larger database, educational institutes face problems [2]. With respect to graph data and obtaining attention in multiple domains, such as prediction, multi-model graph learning explores the fusion of multiple modalities and natural language processing (NLP) in various fields of multi-models, such as prediction. The goal of multi-modeling is to improve graph analysis, tasks that come after it, and the way that learning information is shown in a lot of different ways. Finding a way to incorporate information about graph structure into a machine learning model is a problem for machine learning [28]. Artificial neural network (ANN) has gained wider attention in prediction applications. However, ANN is limited in the educational area due to overfitting issues and the rising complexity of the modeled network [5].

3. Methodology

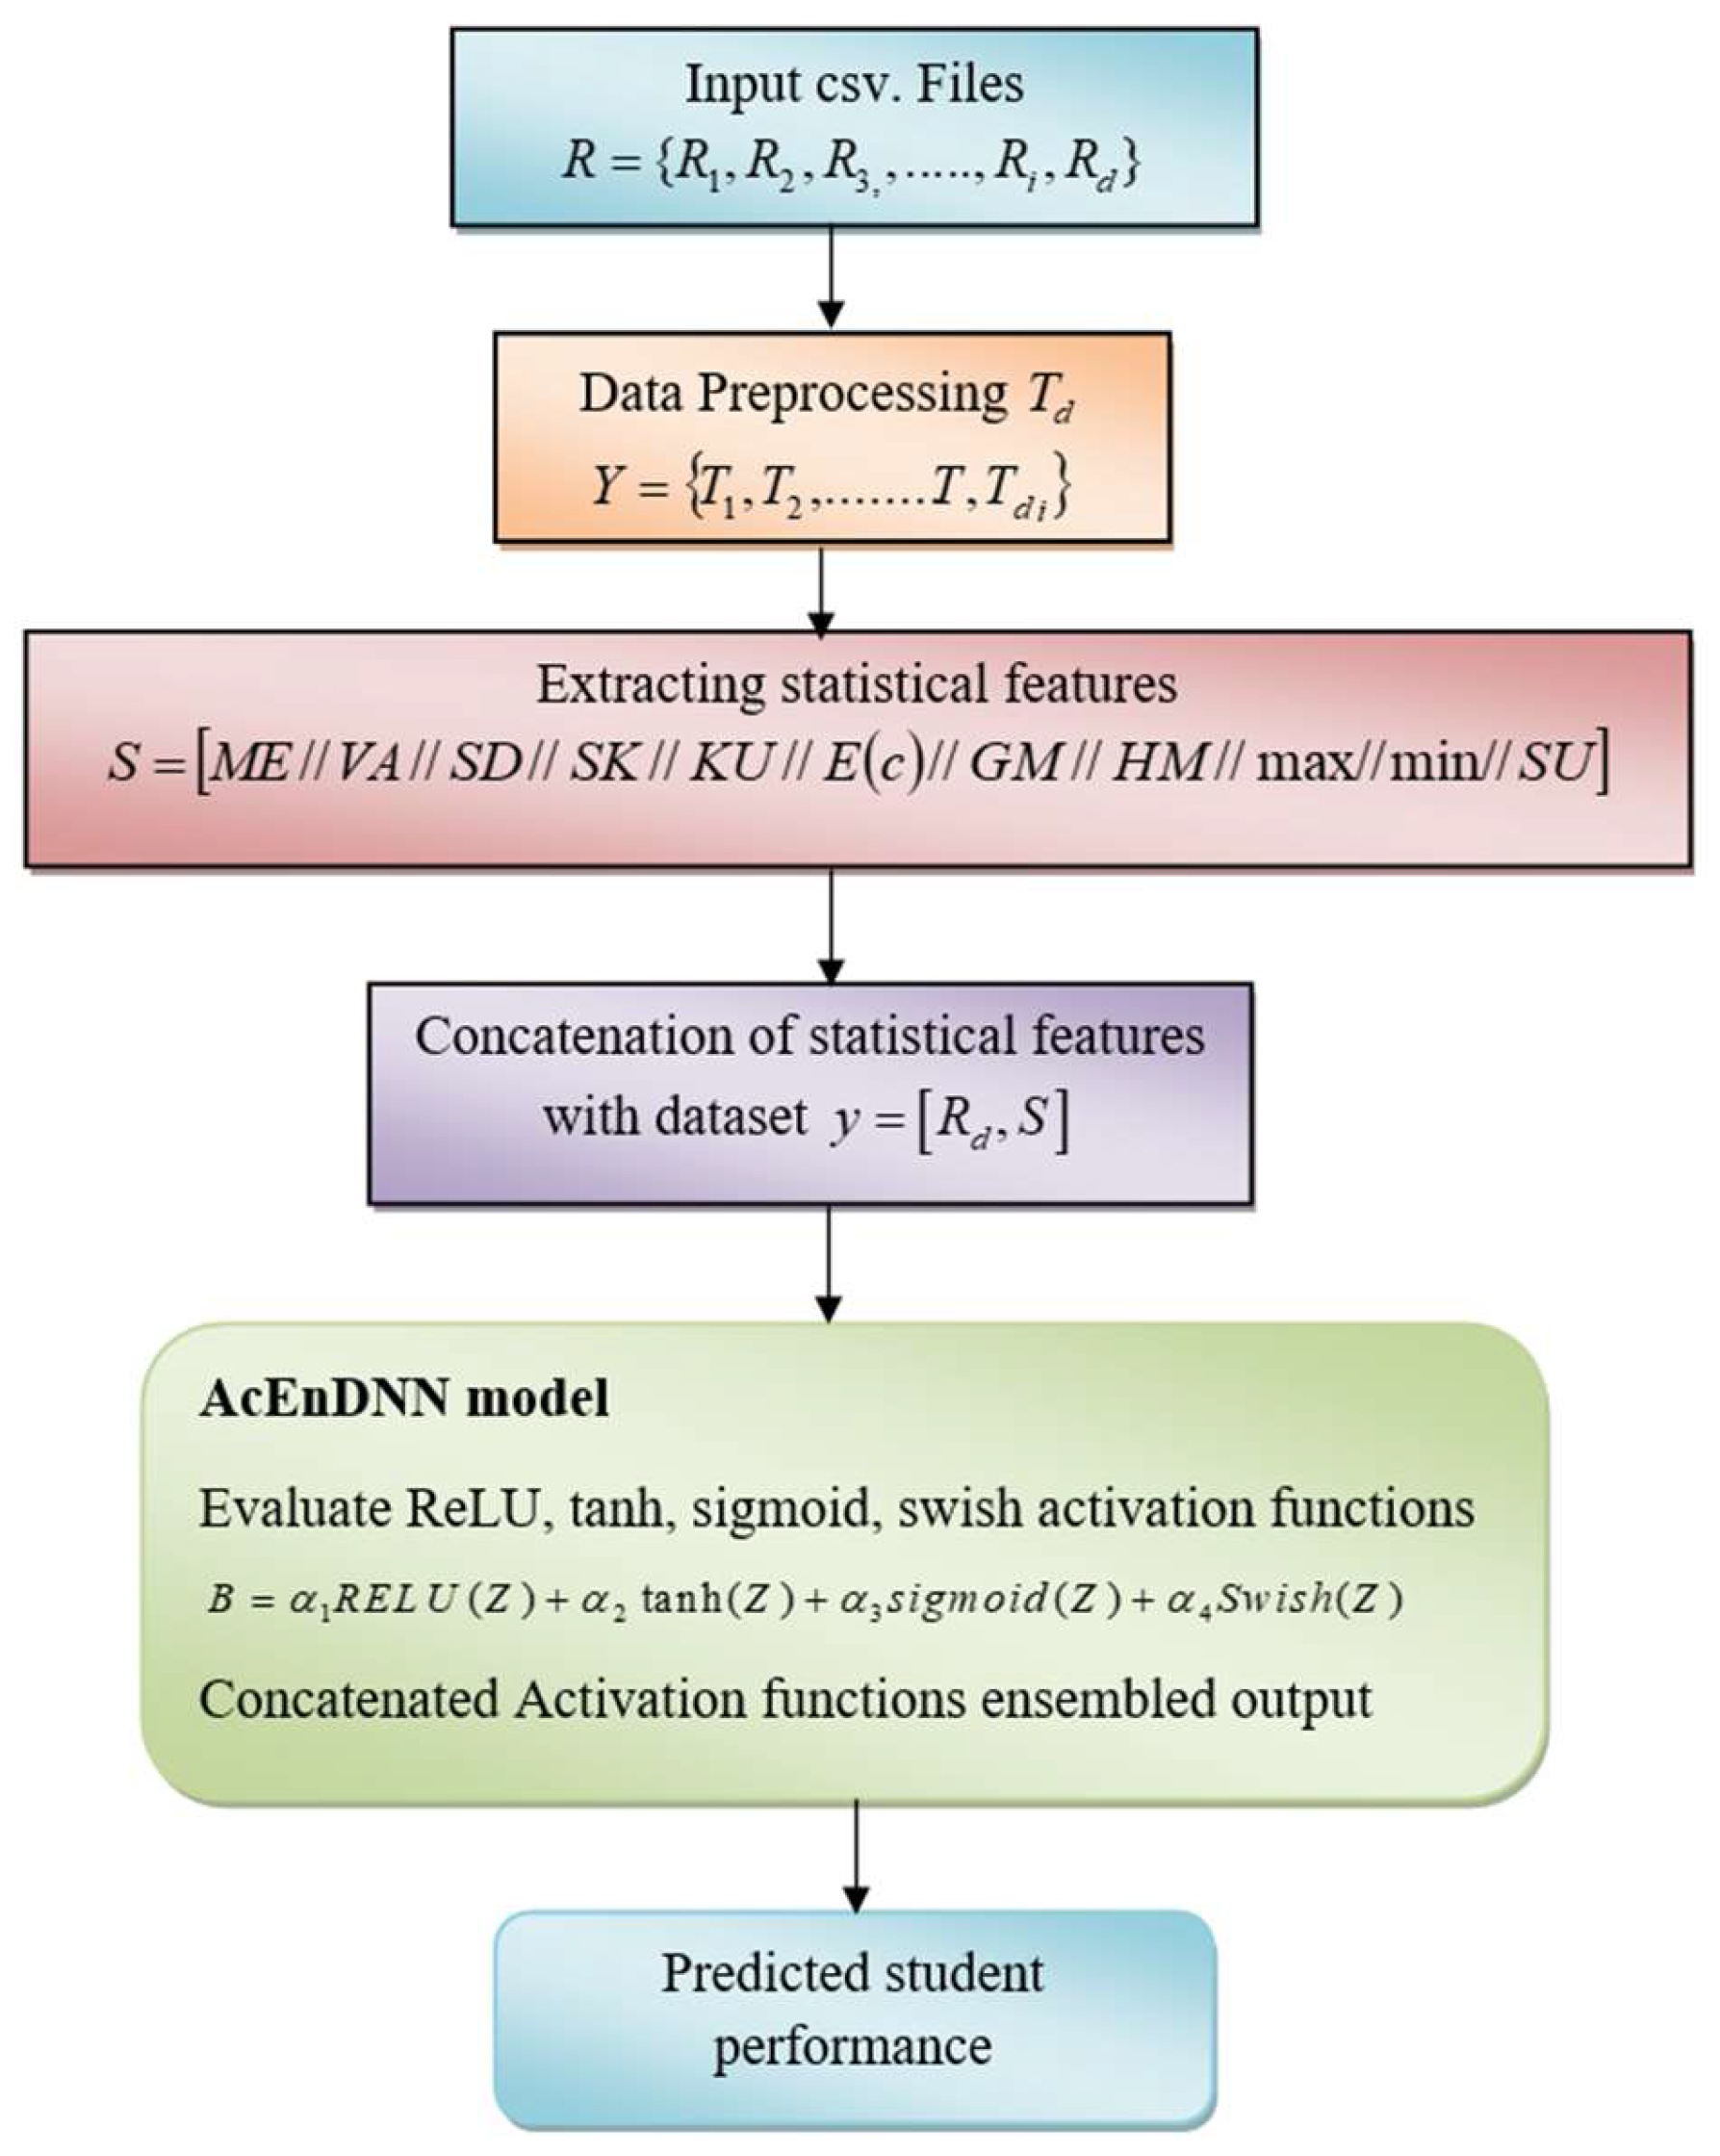
The main aim of this research is to build a robust student performance prediction model by using the AcEn-DNN model. At first, the input data is gathered from the CSV dataset [29] and then subjected to cleansing processes to enable data integrity. Next, we use feature extraction algorithms to extract the statistical features from the preprocessed data. These statistical entities are then embedded in the dataset. After the array, the processed dataset is fed into the AcEn-DNN model, which has a collection of activation functions like ReLU, tanh, sigmoid, and swish. The developed model precisely predicts the students’ performance through the combination of statistical features and activation functions, which consequently empowers educational interventions and supports feature extraction strategies that help students. Figure 1 illustrates the schematic diagram of the AcEn-DNN model.

3.1. Input Data for Students’ Performance Prediction

In the student performance prediction model, the data is gathered from a Student-mat.csv dataset, Student-por.csv dataset [25], and real-time dataset, which are represented in the mathematical form below:
R = R 1 , R 2 , R 3 , . . . . . . . . R n
Here, R d denotes the database or gathered data.

3.2. Preprocessing Data Mining for Students’ Performance Prediction

Preprocessing data is an essential step in developing any ML model. Models that lack preprocessing may encounter issues such as invalid or overfitting data, error-prone models, and low accuracy. Therefore, preprocessing plays a key role in ensuring the success of an ML model. In the context of forecasting student performance, a preprocessing step is necessary to appropriately represent the data. Effective data preprocessing is crucial for enhancing data quality and ensuring the reliability of data mining techniques. The data cleaning technique is utilized to handle missing data and for data encoding. Here, the input CSV file is converted into numerical values to enhance the performance for prediction. Data cleaning aims to eliminate incomplete or incorrect data, as well as data that do not contribute to producing high-quality data [30]. Further, these data mining processes overcome the data imbalance and overfitting issues. In our case, the dataset is transformed from nominal data into numerical data to facilitate the modeling process.
Y = T 1 , T 2 , . . . . . . . . T , T d i
Here, the preprocessed data is denoted as T d with a dimension. In the feature extraction process, the preprocessed data is given for successful student performance forecasting.

3.3. Statistical Feature Extraction for Students’ Performance Prediction

In feature extraction, we extract or create important attributes from unfiltered datasets to characterize students’ behavior, academic history, and socio-demographic factors. This approach reduces the complexity of the raw dataset, which maintains the integrity of the predictions [31]. Methods involve choosing existing attributes of the data, creating new ones, and applying statistical operations to measure trends and relations.
Statistical features represent collected quantitative indicators demonstrating the distribution and dispersion of students’ performance data. These features encompass the mean, variance, entropy, standard deviation, kurtosis, harmonic mean, skewness, geometric mean, max, min, and sum. They offer key perspectives on the average value, variation, form, and inter-relations of the data. The mathematical formulation for each statistical feature is explained below.
(i)
Mean:
M E = 1 c i = 1 c R d *
Therefore, the location of the data point in the dataset is represented as c and the total elements in the dataset as R .
(ii)
Variance:
V A = 1 c i = 1 c R d * M E 2
(iii)
Standard Deviation (SD):
S D = 1 c i = 1 c R d * M E 2
(iv)
Skewness:
S K = 1 c i = 1 c R d * M E 3 1 c i = 1 c R d * M E 2 3 / 2
(v)
Kurtosis:
K U = 1 c i = 1 c R d * M E 4 1 c i = 1 c R d * M E 2 2
(vi)
Entropy:
E c = i = 1 c p R d * log 2 p R d *
Here, p R d * means the probability mass function of c .
(vii)
Geometric Mean:
G M = i = 1 c p R d * 1 c
(viii)
Harmonic Mean:
H M = c i = 1 c 1 R d *
(ix)
Maximum:
M a x = max R 1 * , R 2 * , . . . . . . . . . . . . . . . . . R n *
(x)
Minimum:
M i n = min R 1 * , R 2 * , . . . . . . . . . . . . . . . . . R n *
(xi)
Sum:
S U = i = 1 c R n *
Finally, the extracted statistical features are concatenated using the following equation, which has a dimension of (n × 11).
S = M E / / V A / / S D / / S K / / K U / / E c / / G M / / H M / / max / / min / / S U

3.4. Data Integration

The statistical features are finally added to the original data from the dataset R d , which is carried out by simply concatenating the original features with the statistical features derived. Consider y as an integrated data representation. The integration is mathematically given below:
y = R d , S
where R d , S denotes the concatenation of the original data R d with the matrix of statistical features S .

4. Activation Ensemble Neural Network in Student Performance Prediction

Here, R d forms the input for AcEn-DNN in student performance prediction. AcEn-DNN works by utilizing a variety of activation functions, such as ReLU, tanh, sigmoid, and swish, to represent the nonlinear features and accurately model the student performance data. The resulting ensembles of activation functions at every step of the network let ReLU explore various nonlinear transforms, making it possible to extract the meaningful characteristics and patterns hidden in the input data. Concluded using an amalgamation of these activation function outputs, a network can effectively learn and map the complicated relations between student features and academic performance. During the iterative process, the network fine-tunes its parameters to reduce prediction error, thus improving the method’s performance to accurately forecast a student’s performance.

Activation Ensemble Deep Neural Network Model

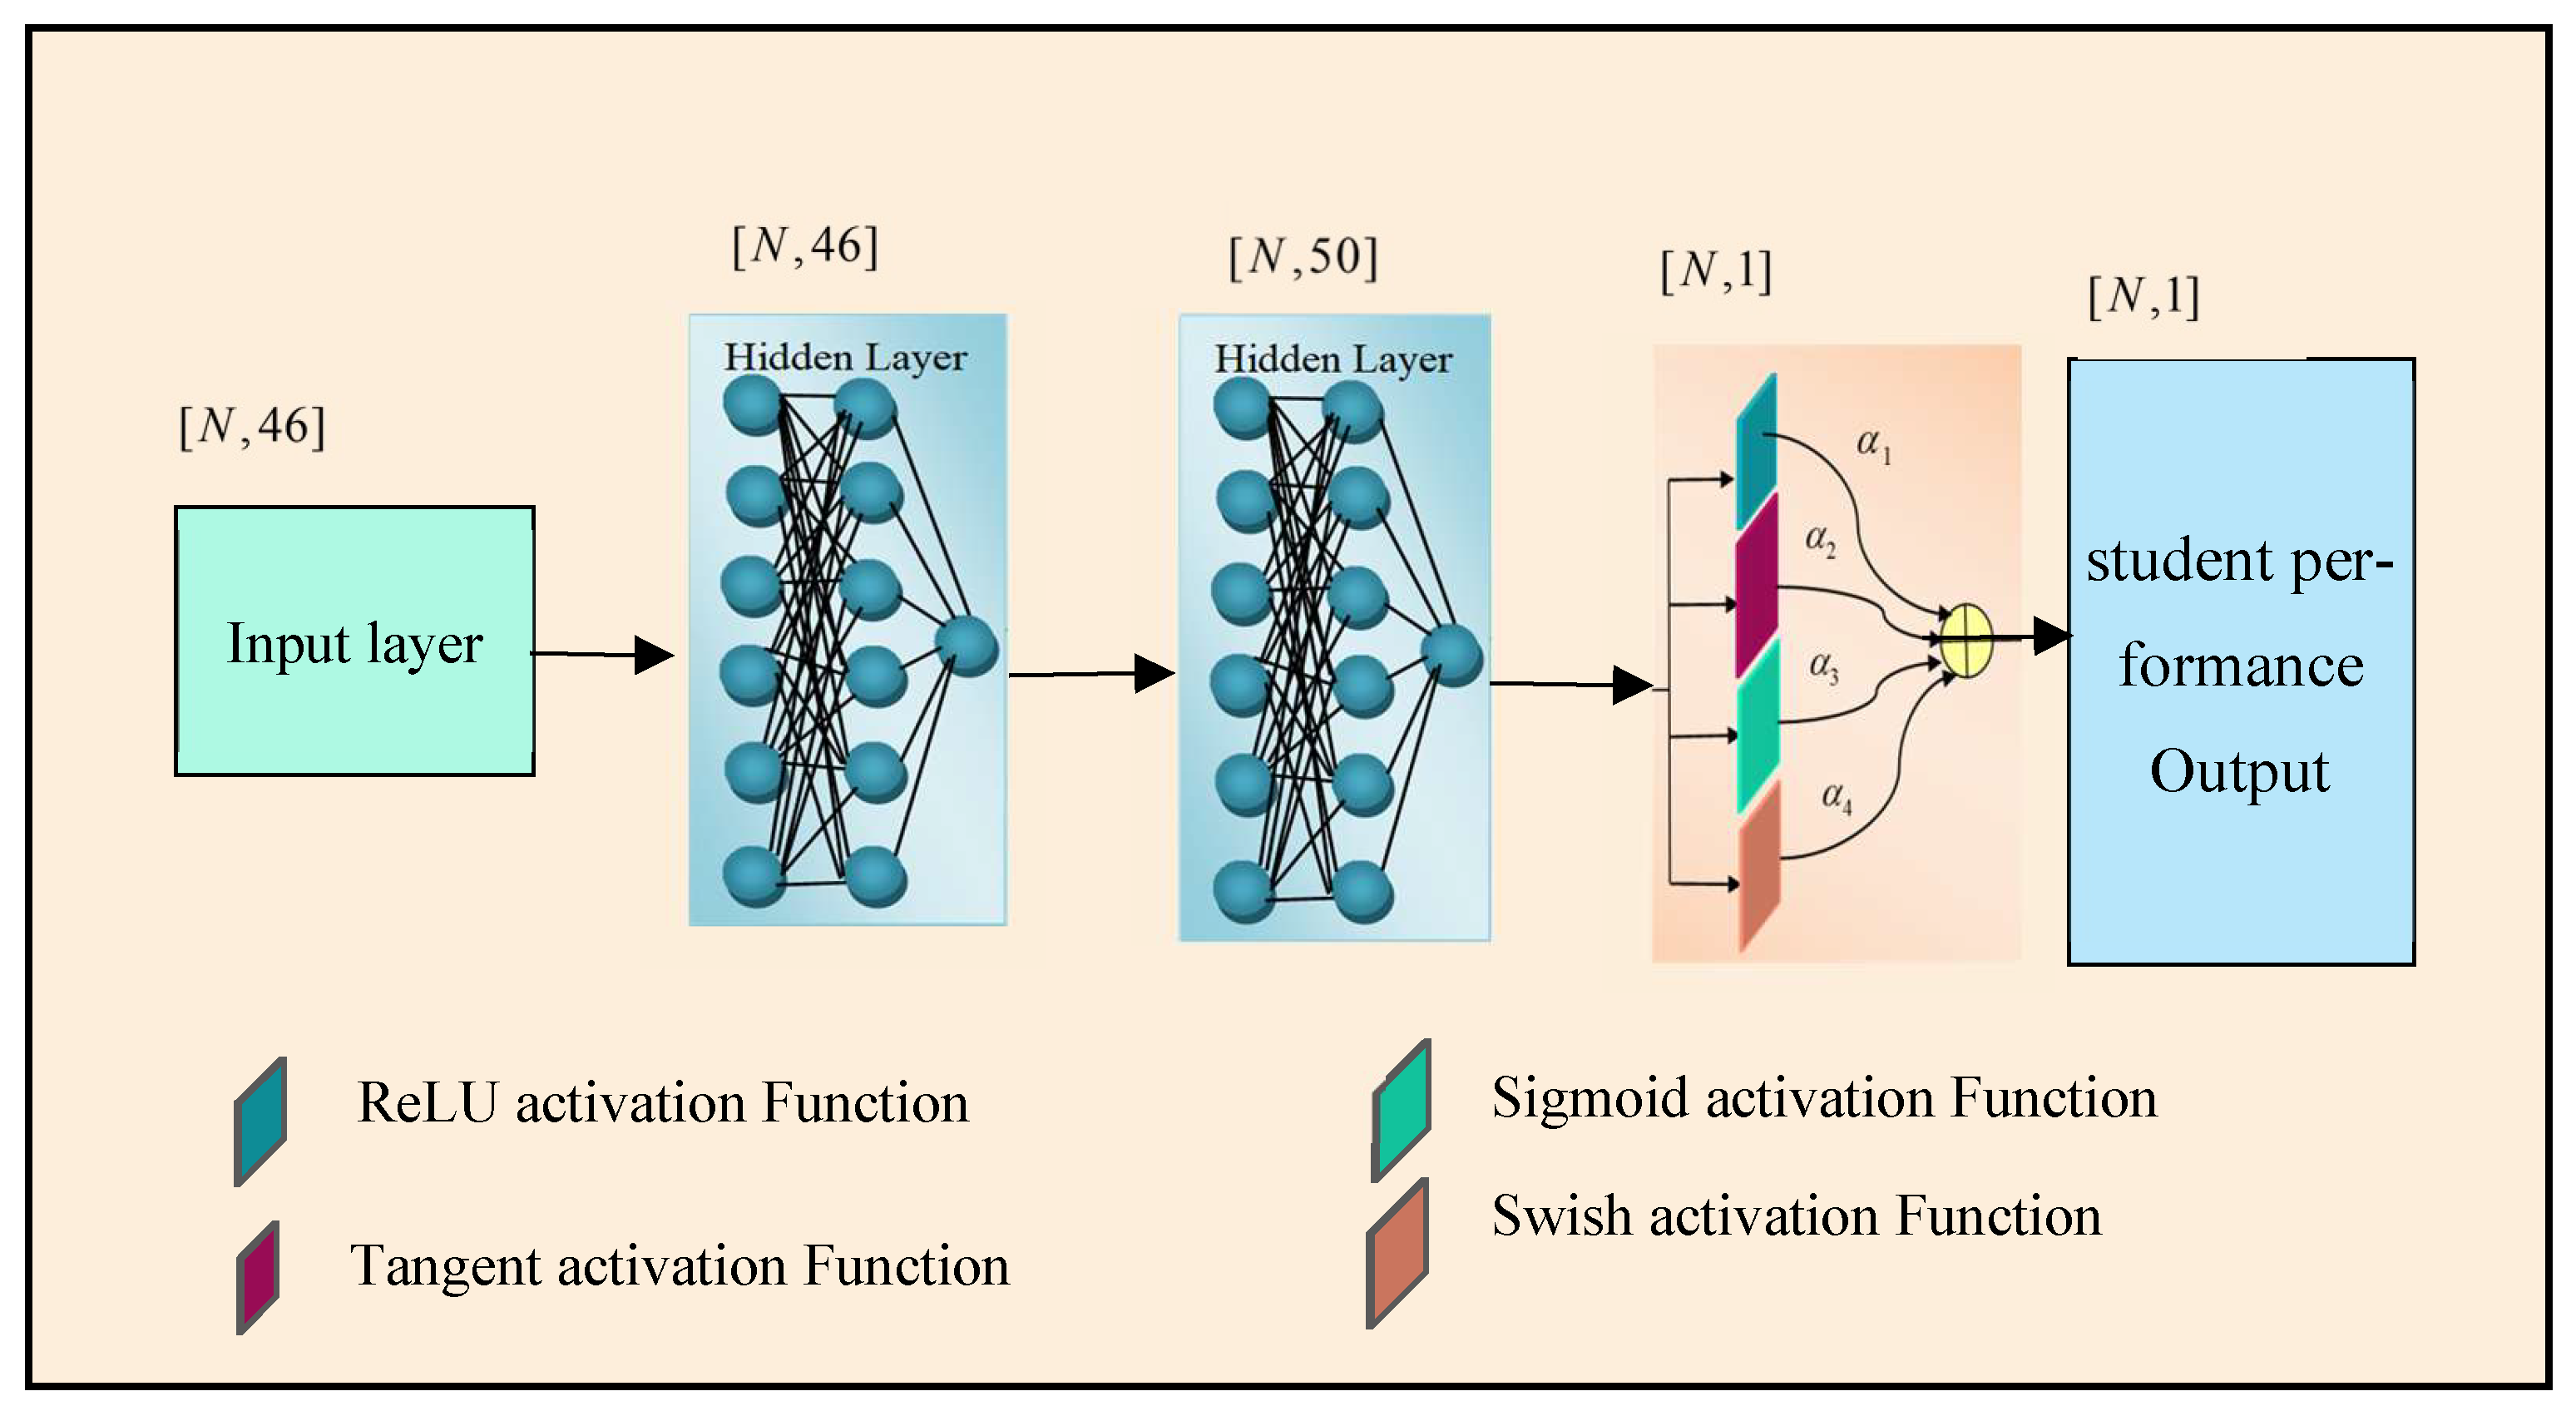
The proposed AcEn-DNN model is a valuable tool for approximating functions, capable of understanding the connection between input and output variables. The proposed architecture includes an input layer, multiple hidden layers, ensemble activation functions, and an output layer. Typically, the DNN will have more than one hidden layer, in addition to its input and output layers. The occurrence of hidden layers allows us to learn complex data and create a DNN model appropriate for tasks, including high-dimensional data and complex patterns. Initially, the extracted features are sent to the input layer. The input layer receives the extracted features and forwards them to the hidden layer. The hidden layers consist of numerous interconnected neurons that help to process the input data. Each neuron in a hidden layer calculates the weight and bias of its inputs. These layers extract and identify the relevant features and learn complex relationships within the data. Then, the output data is sent to the ensemble activation functions, such as Sigmoid, Tanh, ReLU, and swish functions, which are fused to generate an accurate prediction of the student’s performance. For every iteration, the data is passed through each activation function, and features are stored non-simultaneously. Finally, these extracted significant features from the activation functions are concatenated and given to the output layer. The output layer produces an accurate prediction of student performance. Figure 2 depicts the architecture of the proposed AcEn-DNN model.
Figure 2 illustrates the multiple layers of the proposed model, which perform early student performance prediction. To simplify, lets us say there are M hidden layers, with the input represented by a vector Y and the output as a vector Z . The forward expression for the DNN can be written as follows:
A = σ W Y + b
Z = W M Y M 1 + b M
The bias and weights of the i t h layer are denoted as W and b , respectively, and A and σ refer to network parameters. The output of the i t h layer is determined by the activation function α , which is either Sigmoid, hyperbolic tangent (Tanh), ReLU, or swish activation functions. The previous layer’s output is denoted as Y M 1 . Equations (16) and (17) simplify the forward formulation Z = N Y ; θ . The loss function, often the MSE between the output and the actual data, is then represented as follows:
M θ = M S E d a t a = 1 N i = 1 N N y i , θ z i 2
The loss function is used to adjust the network parameters in the DNN training. Here, N represents the total number of labeled data. Once trained, the DNN can make predictions for new inputs.
The problem of a vanishing gradient occurs in sigmoid and hyperbolic tangent activation functions when they reach a certain threshold value, where their derivative becomes unable to be computed. To address the issue, the ReLU activation function is created as a solution. ReLU is a nonlinear activation function that allows for the derivative operation to be performed. Equations (19) and (20) demonstrate the ReLU activation function.
f d = 0 ,                   d < 0 1 ,                   d 0
d f d d x = 0 ,                   d < 0 1 ,                   d 0
ReLU is the most commonly used activation function due to its ability to address the issue of the vanishing gradient. However, ReLU struggles with the negative region problem as it sets negative values to zero, making it difficult to calculate derivatives and slowing down the learning process [30]. Despite this drawback, one of the main benefits of ReLU is its low computational load compared to other functions, making it apt for use in complex multi-layered structures. As a result, ReLU remains one of the most commonly utilized activation functions in deep neural networks.
The hyperbolic tangent (tanh) activation function is a nonlinear function that has the ability to compute derivatives. Tanh shares structural similarities with the sigmoid activation function. Both the standard and derivative forms of the tanh activation function can be seen in Equations (21) and (22).
f d = sinh d cosh d = e y e y e y + e y
d f d d x = 1 f d 2
Although the sigmoid activation function can generate results in the range of [0, 1], the tanh activation function can produce values within the range of [−1, 1]. The learning process is noted to involve negative values because of the range of the hyperbolic tangent activation function. However, sigmoid activation encounters the challenge of the vanishing gradient problem as the derivative values approach zero after reaching [−1, 1].
A sigmoid function is a mathematical function that resembles a sigmoid curve. The combinations of the function are not linear because the function is considered a nonlinear activation function. Therefore, it is beneficial to stack layers using the type of function, including non-binary activation. The smooth gradient value of the sigmoid function makes it ideal for shallow networks, such as function simulation. Equation (26) below demonstrates how sigmoid functions can be utilized in deep learning.
σ d = 1 1 + e d
The characteristic of the function causes Y values to be pushed toward the ends of the curve, improving the classifier’s ability to make clear predictions. Because of this, the function is well suited for shallow networks, especially for simulating logic functions.
d d x σ d = σ d 1 σ d
Additionally, another benefit of the function is that its range is limited to values between 0 and 1, unlike the linear function, which has a range of , . This means that the activation values are restricted, making it easier to control and prevent them from increasing too much during activation. As a result, the sigmoid function is commonly used and has been popular for a long time. However, studies have shown that it is not flawless because the output values tend to respond less to changes in input values at the extremes of the function. This causes a small gradient at these points, leading to a vanishing gradient issue that occurs in the almost flat parts of the activation function near the ends. Consequently, the gradient diminishes or becomes too small to bring about significant changes, essentially causing the network to learn slowly or even stop learning entirely until the gradient approaches the limits of floating-point precision.
The sigmoid function has a drawback due to its non-zero central value, always producing a positive result. In a sigmoid neuron, the inputs with sigmoid units are considered, which have weights. Moreover, the positive results of the inputs are attained from the sigmoid function. This leads to challenges during backpropagation, as the error gradient will either be positive or negative. The backpropagation process cannot improve the weights in a single step, and instead requires the optimal weight vector to increase the weights simultaneously. Consequently, the training process takes longer to converge compared to using a more effective activation function.
Research conducted by the Google Brain team found that the swish activation function is a viable alternative to ReLU. However, the computation cost for both backpropagation and feedforward is higher for the swish function. Despite its limitations, ReLU is still essential in deep learning research, but studies show that the new swish activation function outperforms ReLU in deep networks. The swish activation function can be represented by the equation provided below in Equation (27).
f d = x σ d = d 1 + e d
Additionally, certain authors have suggested incorporating a non-zero β parameter to allow for a basic swish function. The equation for the adjustment is provided below Equation (28).
f d = β d σ β d = β d 1 + e β d
If the parameter β approaches zero, the function will become linear, but if β approaches one, the parameter will resemble the ReLU function. The beta value in the model is a learned parameter. The swish function can be easily differentiated.
f d = f d + σ d σ d f d = e d d + 1 + 1 1 + e d 2
This function addresses the issue of the vanishing gradient problem that sigmoid cannot solve. Studies have demonstrated that swish outperforms ReLU, which was previously considered the most effective activation function in deep learning. However, it is important to note that the computation cost of the function is significantly higher than that of ReLU and its related functions, both during feedforwarding and backpropagation. The final equation for AcEnDNN is provided below, obtained from Equation (16).
B = α 1 R E L U ( Z ) + α 2 tanh ( Z ) + α 3 s i g m o i d ( Z ) + α 4 S w i s h ( Z )
where α 1 , α 2 , α 3 , a n d   α 4 stand for the weights assigned to each activation function within the introduced ensemble. This equation denotes the forward propagation of a neural network by a collection of activation functions. The equation multiplies the outputs of the ReLU, tanh, sigmoid, and swish activation functions, weighted by α 1 , α 2 , α 3 , a n d   α 4 . Finally, the weights achieved from each activation function are concatenated and sent to the output layer. More specifically, the output layer generates an accurate early prediction based on the student’s performance. The overall process utilized for student performance prediction is depicted in Figure 3.

5. Results and Discussion

A new method, AcEn-DNN, was built for predicting student performance. Its accuracy is determined by comparing the model to other top methods in the domain.

5.1. Experimental Setup

The AcEn-DNN model for student performance prediction is implemented in Windows 10 OS using the Python 3.7 programming language with 16 GB RAM, 128 GB ROM, and 12 GB of GPU memory. The initial parameters involve a batch size of 32, a learning rate of 0.001, a number of epochs of 500, the loss function ‘MSE’, the metric ‘MAE’, and a default optimizer as Adam. Moreover, the input data is split as 90:10, where 90% is taken for training purposes and 10% is taken for testing and validation purposes.

5.2. Dataset Description

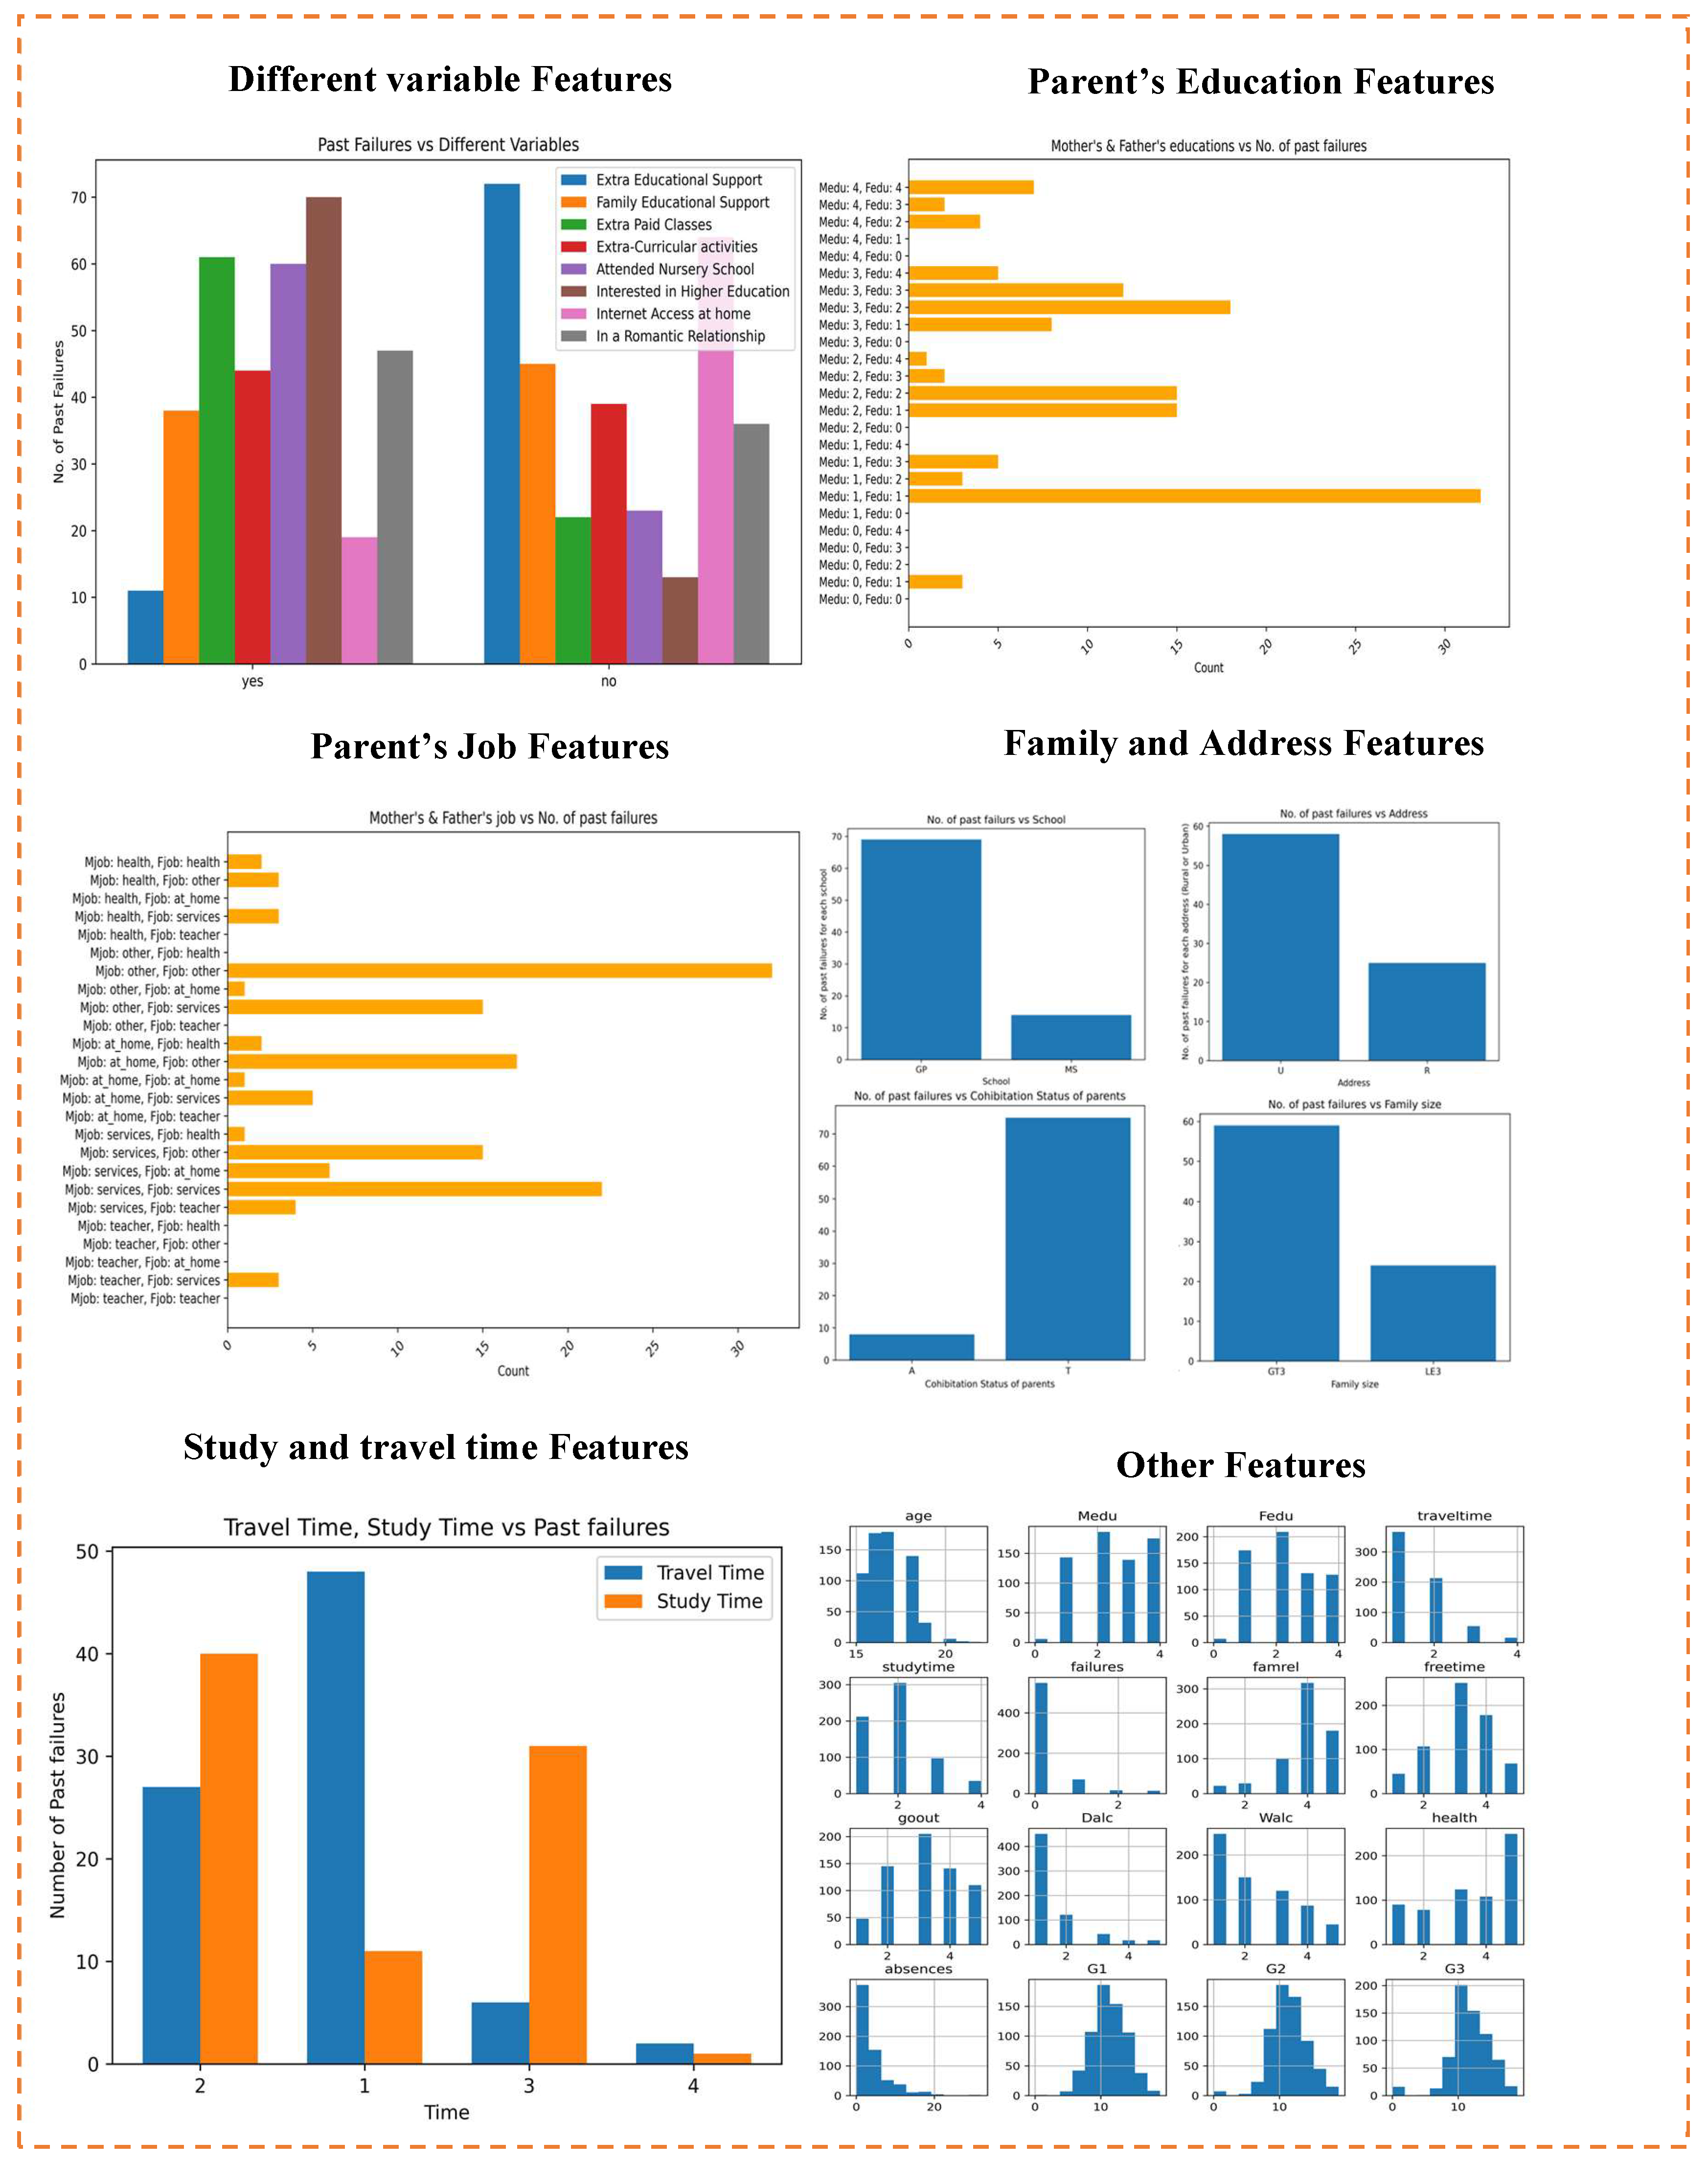
Student-mat.csv and Student-por.csv [29]: In the student-mat.csv and student-por.csv files, details like gender, age, address, parents’ marital status, their occupation, education levels, family size, reasons for choosing the guardian, and school details are included. In addition, travel time information, academic failure history, study hours, family and school support, additional classes, extracurricular activities, home Internet access, an evaluation of family bond strength, and alcohol consumption details are insisted on in the files. Well-being is assessed on a scale of 1 to 5, while absences are counted as the number of school days missed, ranging from 0 to 93. Academic grades are split into G1, G2, and G3, with a range of 0 to 20. In both datasets, students’ details are presented, and the identical attributes are matched to identify the students’ details, which are listed in the R file. A visualization of the student-mat.csv and student-por.csv datasets is illustrated in Figure 4.

5.3. Performance Metrics

In this research, the proposed AcEnDNN model used for student performance prediction is evaluated based on the performance metrices such as MAE, MAPE, MSE, and RMSE. The MAE metric determines the actual and predicted values by taking the average magnitude of absolute error. Moreover, the percentage of the MAE is represented as the MAPE. The MSE metric calculates the predictive model performance, and the RMSE metric shows the disparity between observed and predicted values.

5.4. Performance Analysis of the AcEn-DNN Model Using Student-mat.csv Dataset

The performance analysis of the proposed AcEn-DNN model is evaluated at epochs 180, 200, 300, 400, and 500 for the Student-mat.csv dataset, which is illustrated in Figure 5. The performance analysis shows that the proposed AcEn-DNN model outperformed in predicting student performance. The MAE values demonstrate the lowest errors at 2.68, 2.44, 1.99, 1.93, and 1.28 with 90% of training. Similarly, the AcEn-DNN model results in an MAPE during 90% of training that achieved the lowest error values of 8.94, 4.61, 4.45, 3.51, and 2.36. The results indicate the lowest MSE values at 12.65, 10.22, 8.36, 7.06, and 4.55 for 90% of training for epoch values of 100, 200, 300, 400, and 500. Similarly, the AcEn-DNN model’s RMSE during 90% of training outcomes is represented in Figure 5.

5.5. Performance Analysis of the AcEn-DNN Model Using Student-por.csv Dataset

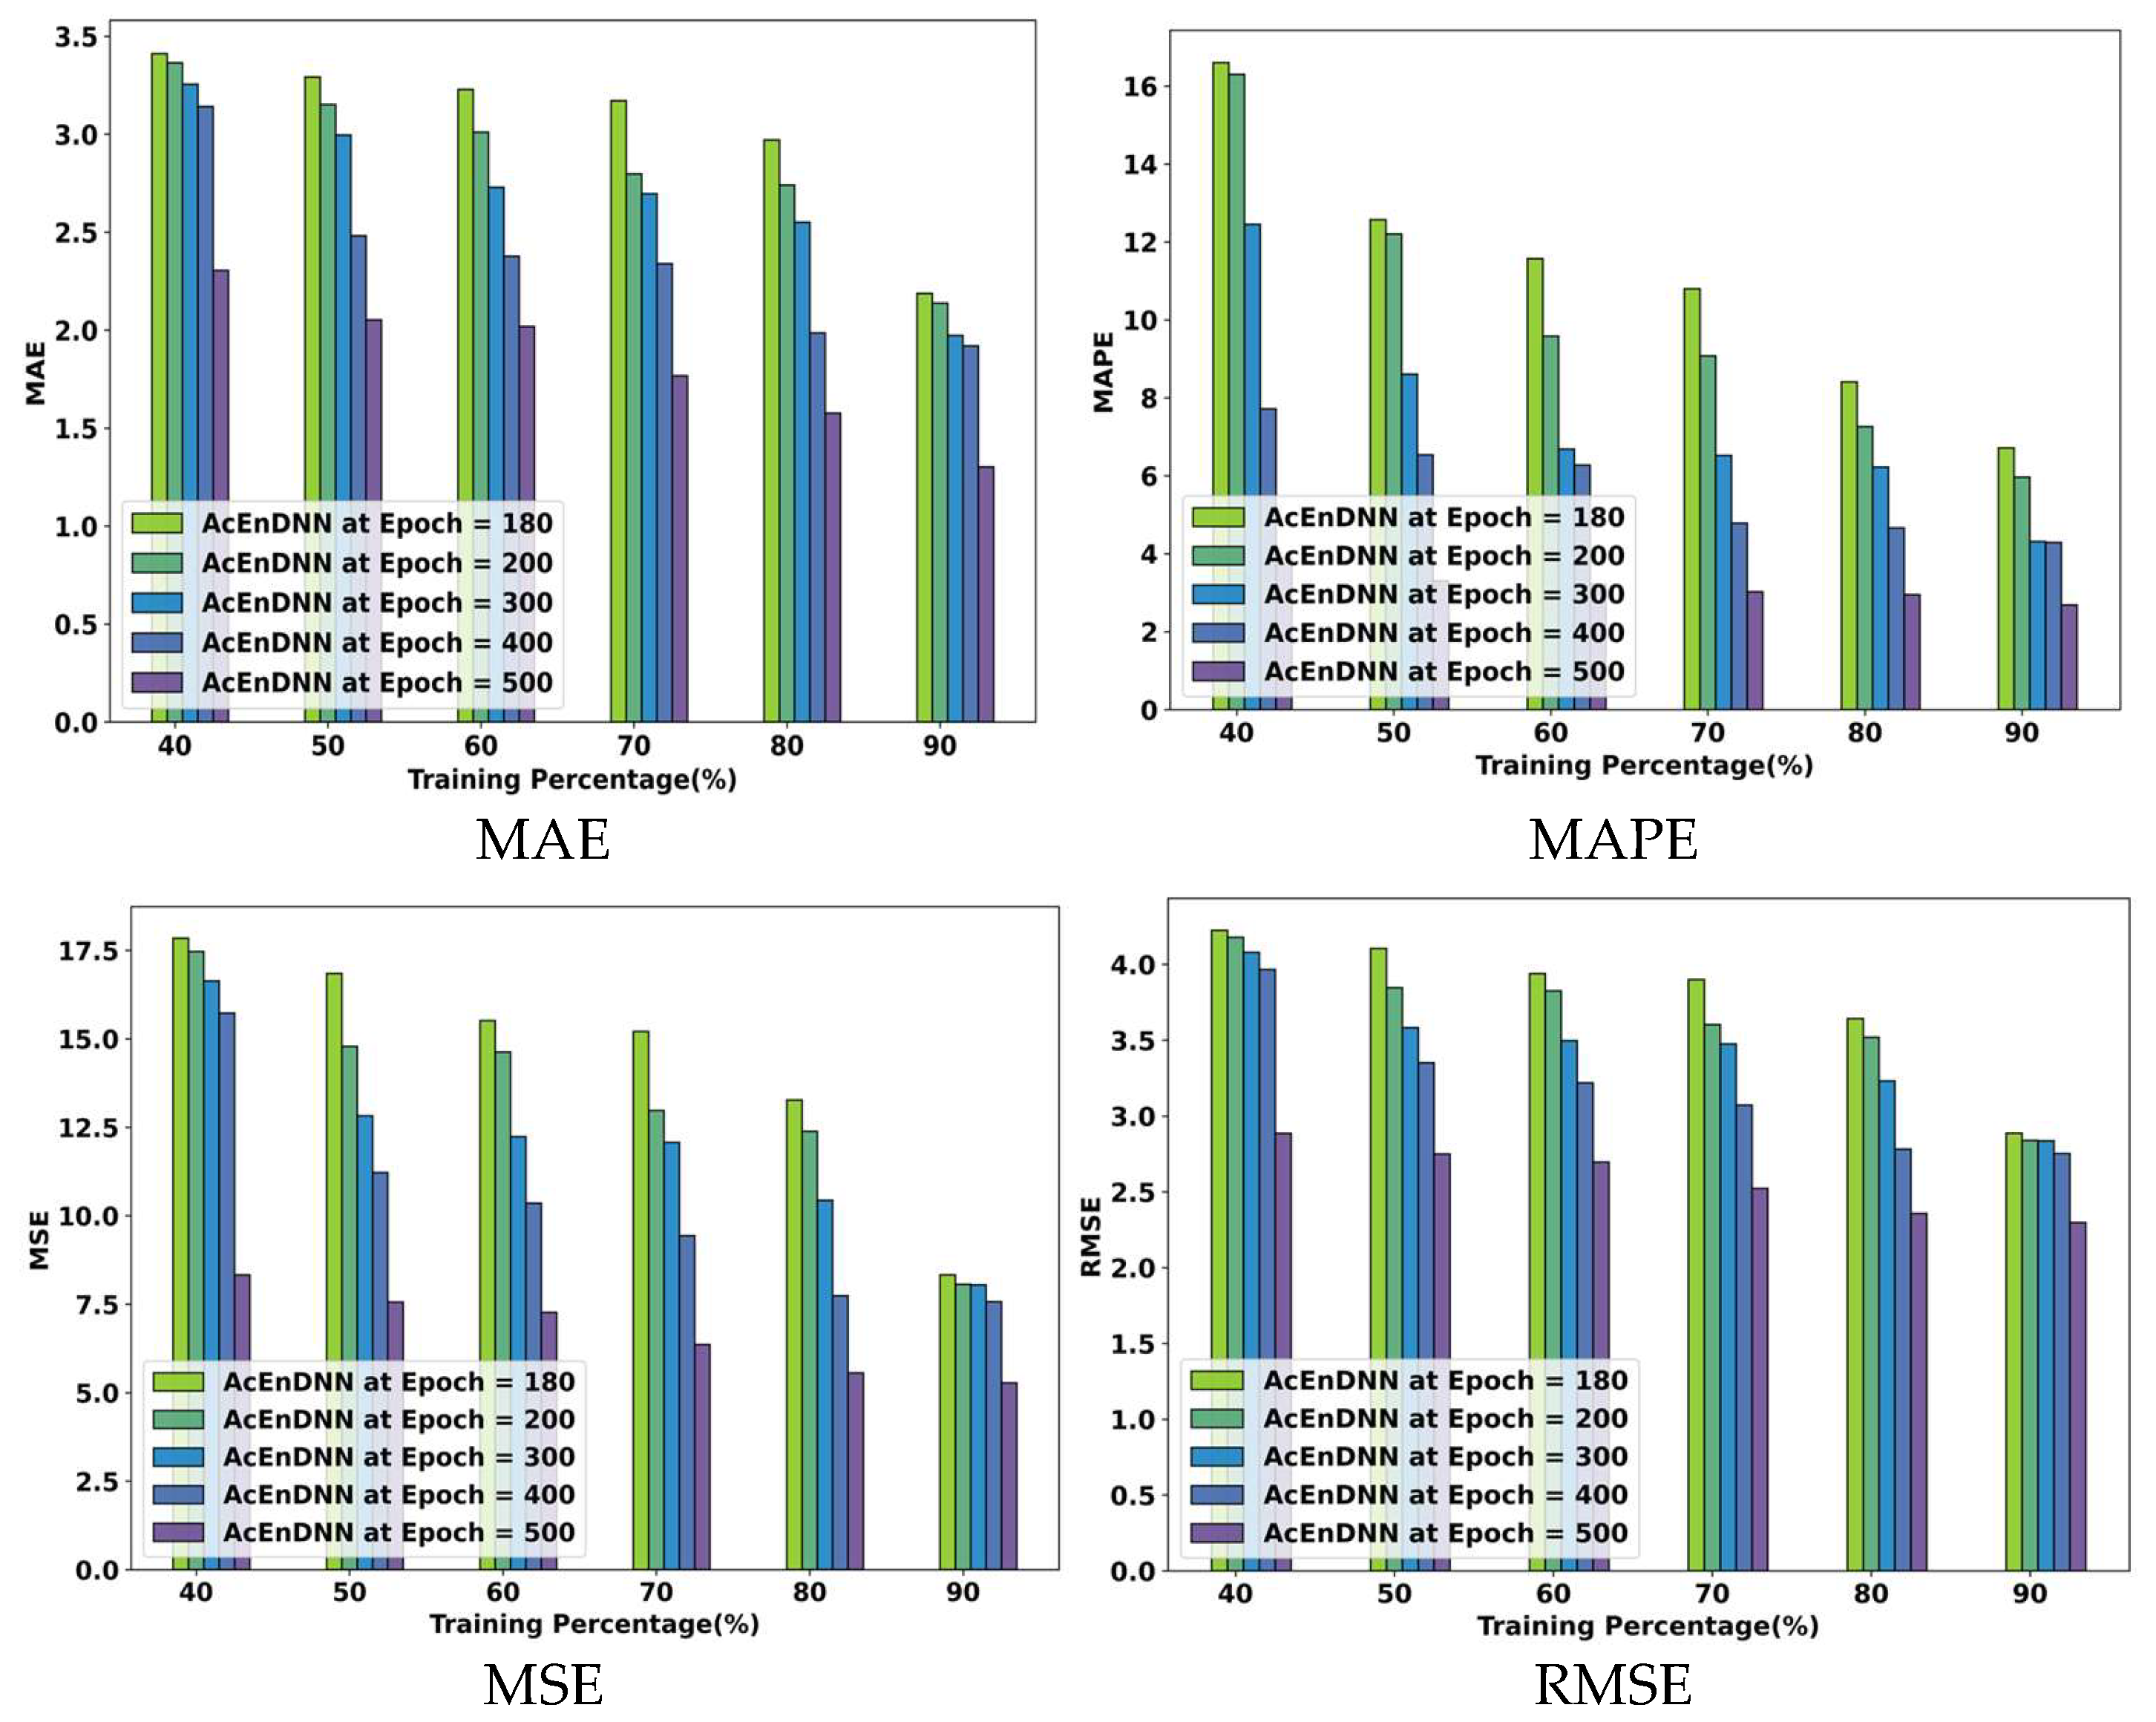
The performance analysis of the proposed AcEn-DNN model is evaluated at epochs 180, 200, 300, 400, and 500 for the Student-por.csv Dataset. The MAE values demonstrate the lowest errors at 2.19, 2.14, 1.97, 1.92, and 1.30 with 90% of training. The AcEn-DNN model attained an MAPE of 90% during training, which achieved error values of 6.72, 5.97, 4.31, 4.29, and 2.69. The lowest MSE values at 8.33, 8.06, 8.04, 7.57, and 5.28 for 90% of training are exhibited at the epoch values of 100, 200, 300, 400, and 500, as illustrated in Figure 6. Moreover, the proposed AcEn-DNN model achieved minimum RMSE values of 2.89, 2.84, 2.84, 2.75, and 2.30 for multiple epochs during 90% of training.

5.6. Comparative Methods

The accomplishments of the AcEn-DNN method are compared by utilizing different techniques, including Random Forest (RF) [32], Logistic Regression (LR) [33], Support Vector Machine (SVM) [34], K-Nearest Neighbor (KNN) [35], Cat Boosting algorithm [36], LightGBM [37], DNN [38], Haar-MGL [39], Gated Recurrent Unit (GRU) [26], and LSTM [27]. The evaluation is carried out based on the training percentage and cross-validation using the Student-mat.csv, Student-por.csv, and real-time datasets.

5.6.1. Comparative Analysis Using Student-mat.csv Dataset Based on TP

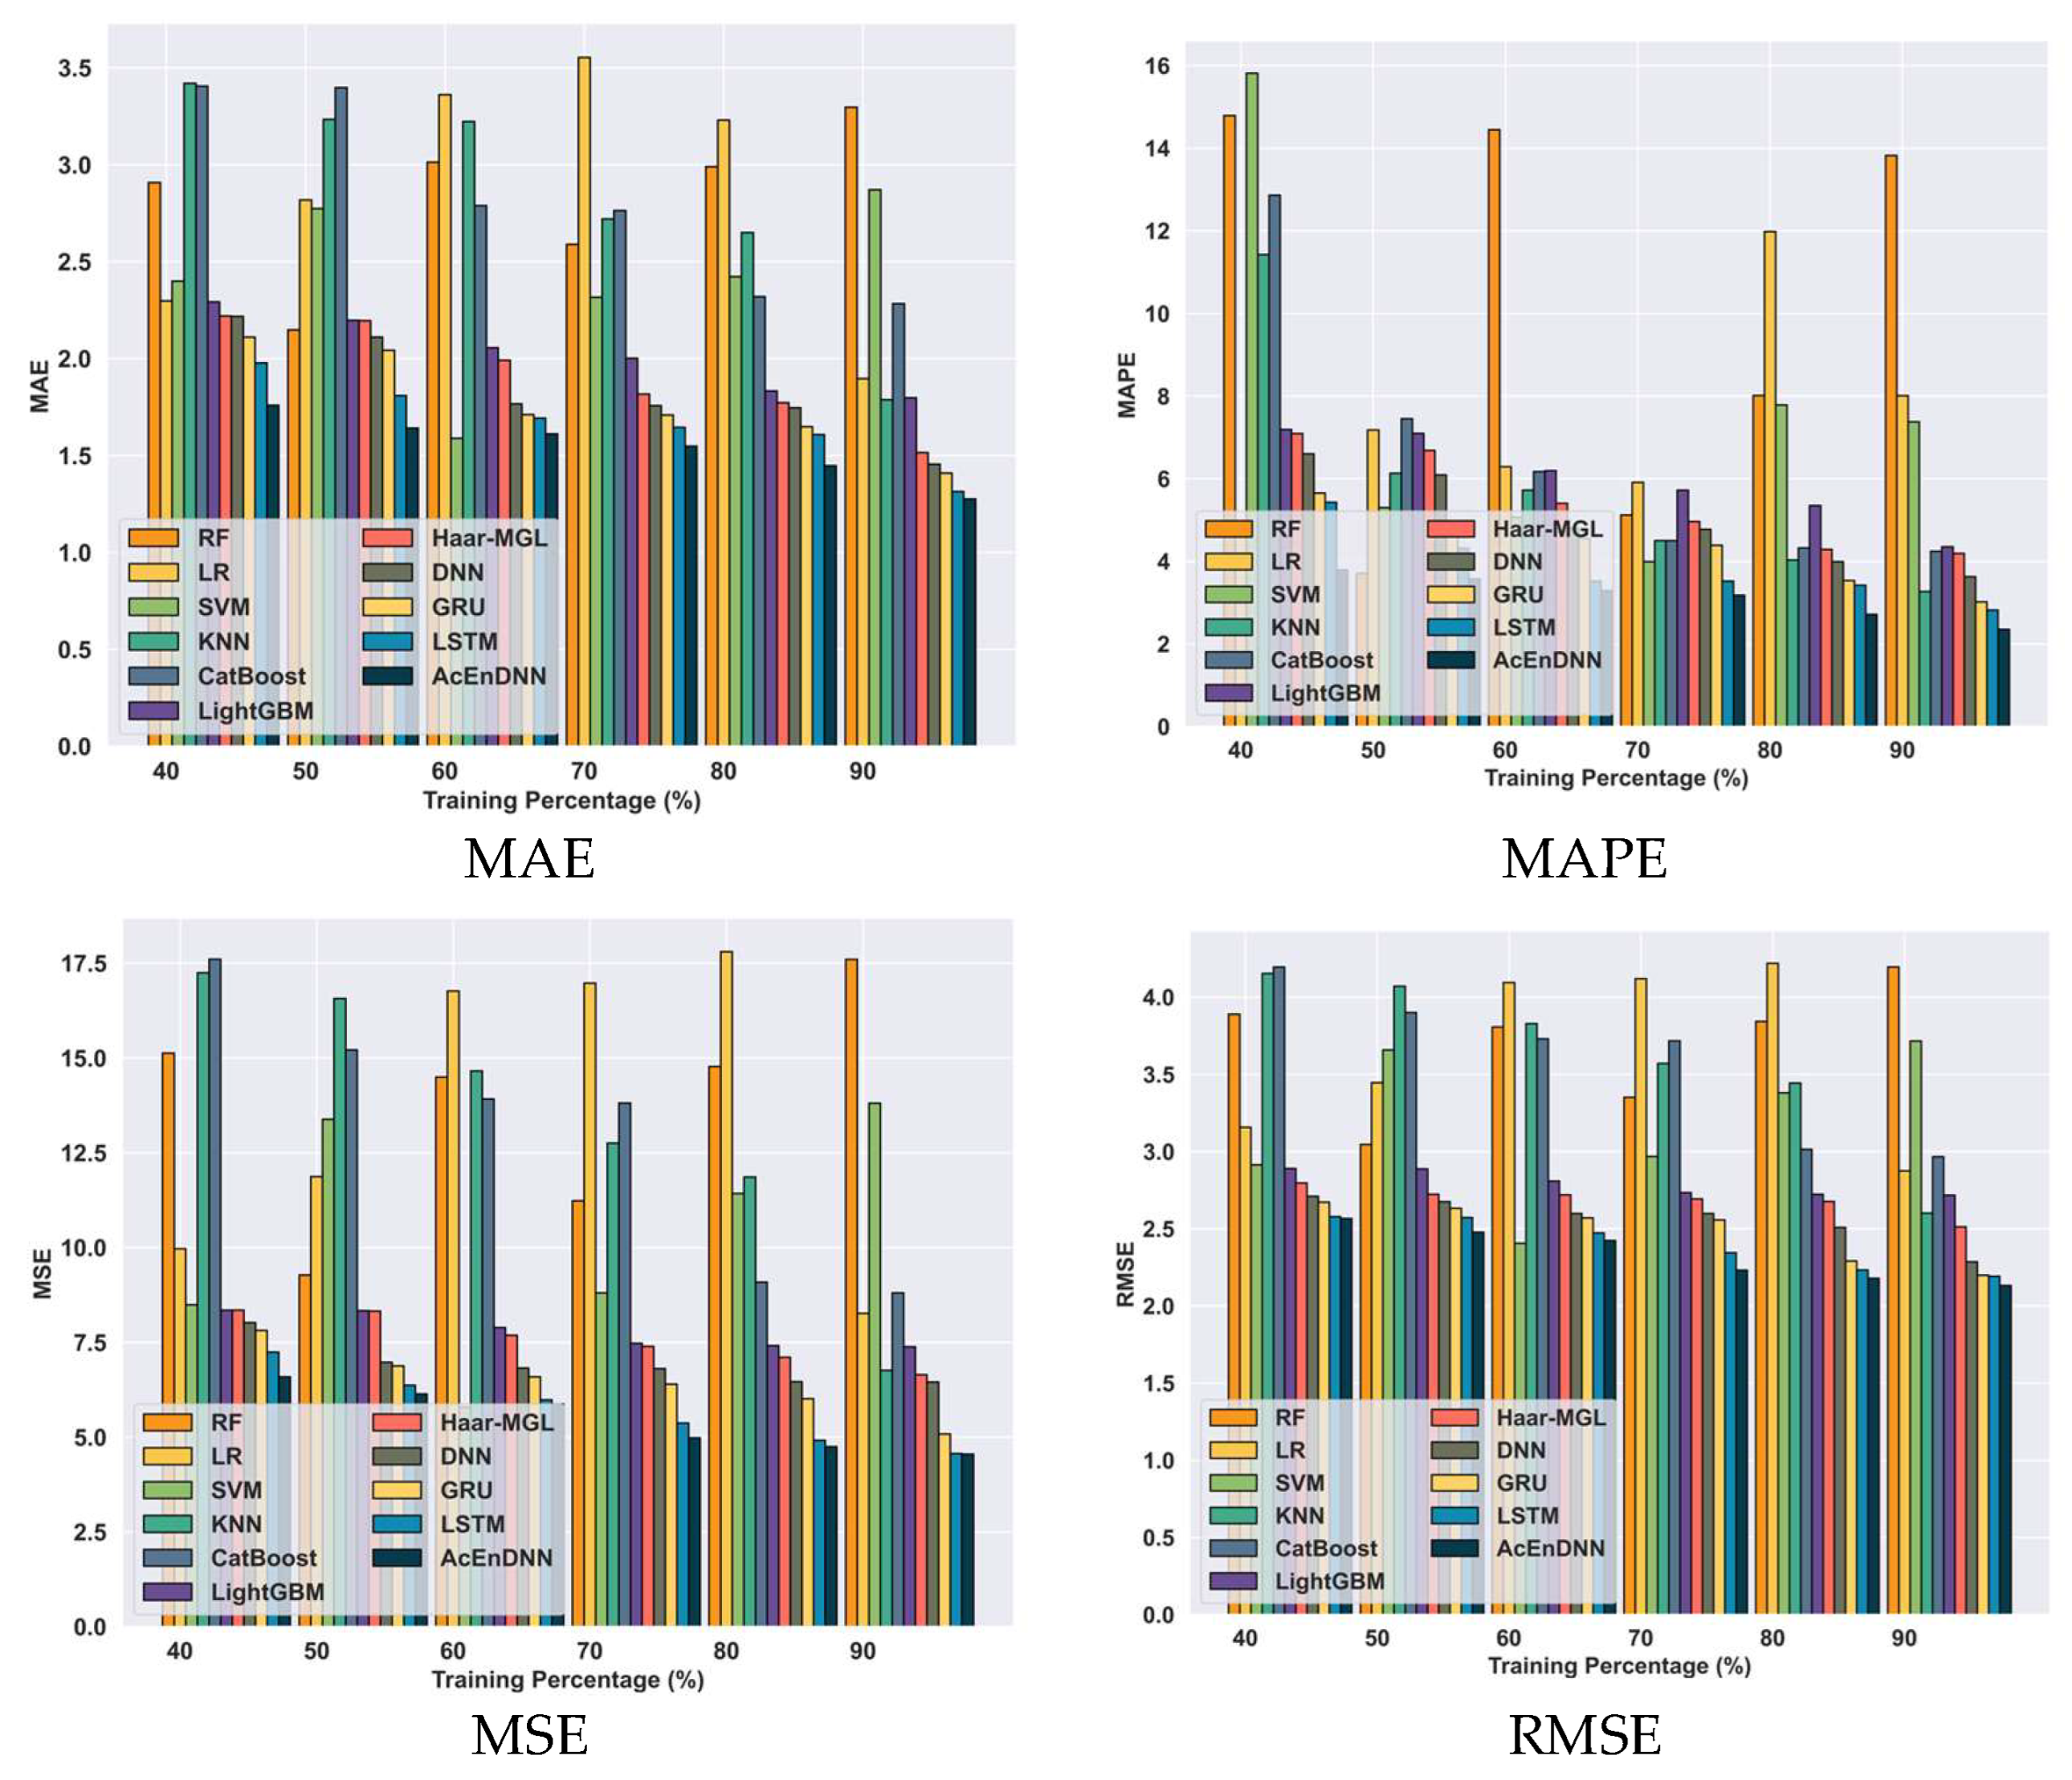
The comparative analysis of the AcEnDNN model is evaluated with other existing models using the Student-mat.csv dataset based on various training percentages, as illustrated in Figure 7. The proposed model surpassed the Light GBM model in forecasting student performance, displaying a remarkable error difference of 0.52 and reaching a low MAE of 1.28 at 90% training. The AcEn-DNN method resulted in better predictive performance for student performance prediction when compared to Light GBM. The model surpassed the Light GBM model with an error difference of 2, obtaining a minimum MAPE of 2.36 with 90% of the training data. The AcEn-DNN model outperformed the Light GBM model with an error difference of 2.83 and obtained an MSE value of 4.55 with 90% training, exceeding the performance of previous methods. The proposed AcEn-DNN model showed superior performance compared to the existing models in forecasting student performance, surpassing the Light GBM method with an error difference of 0.58, reaching an RMSE of 2.13 with 90% of training.

5.6.2. Comparative Analysis Using Student-por.csv Dataset Based on Training Percentage

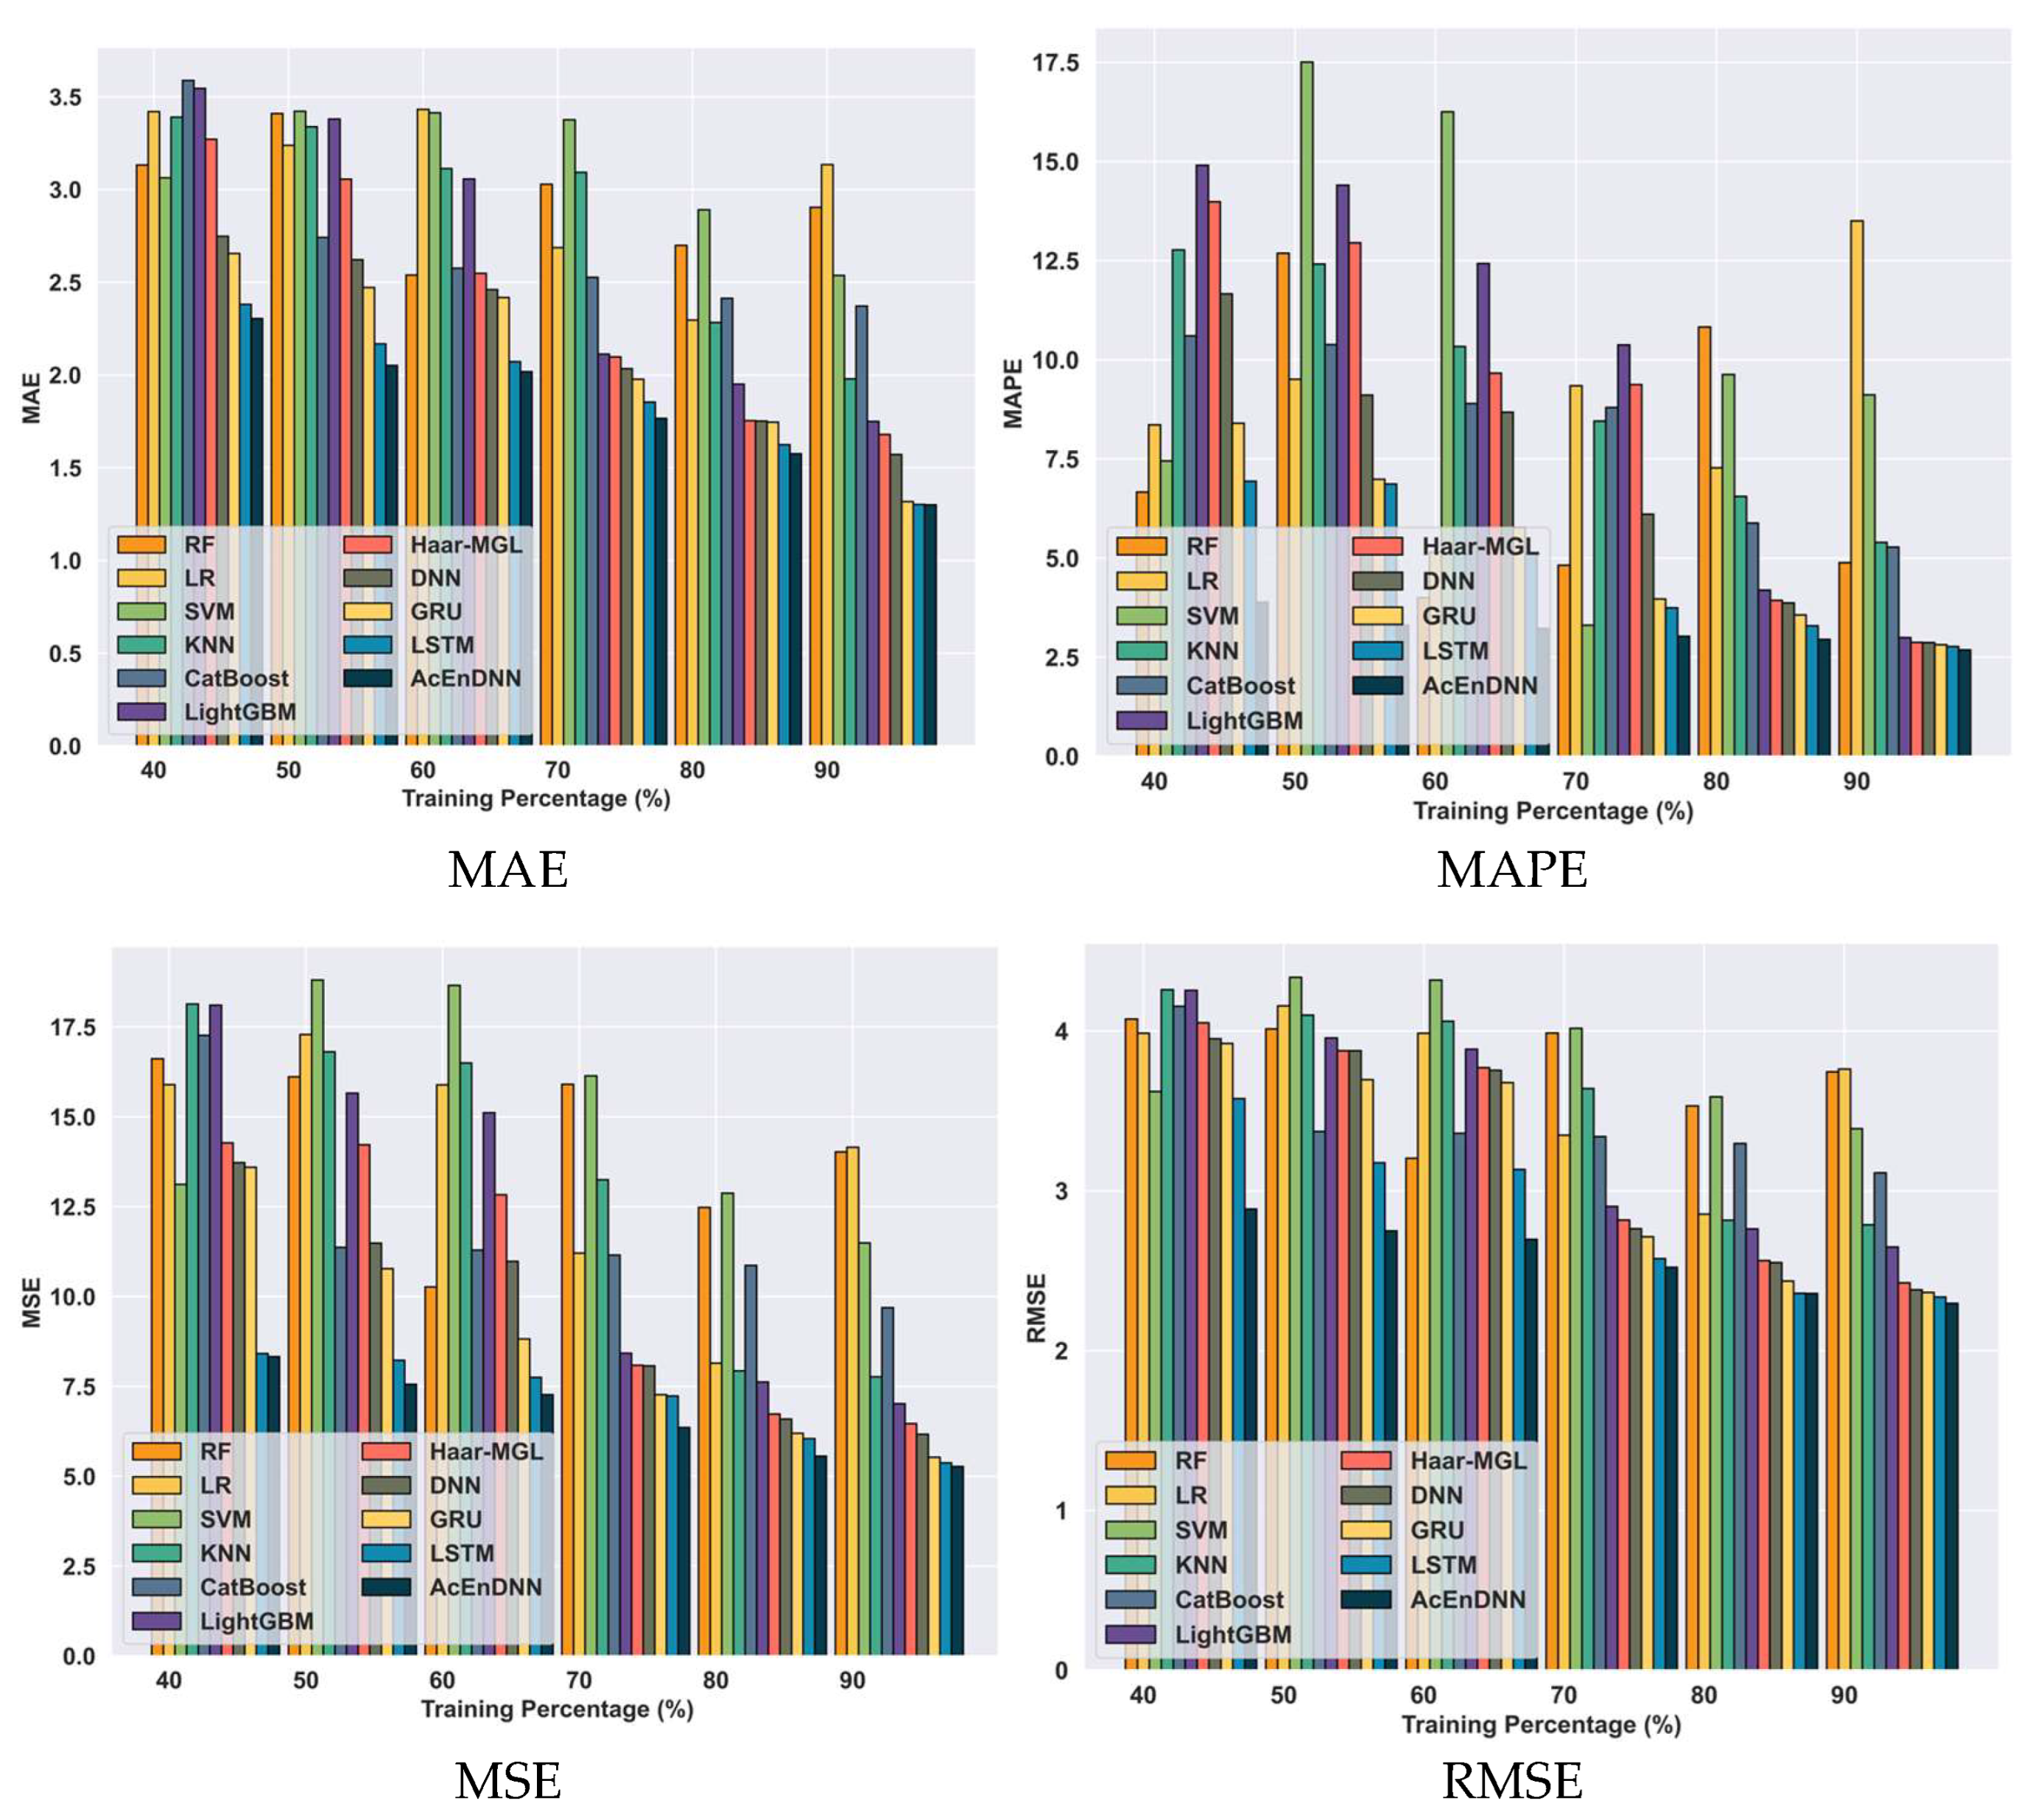
The proposed model is evaluated with other existing models using the Student-por.csv dataset, which is depicted in Figure 8. The AcEnDNN model surpassed the Light GBM model in forecasting student performance, displaying a remarkable error difference of 0.45 and reaching a record-low MAE of 1.30. The AcEnDNN model resulted in better predictive performance for student performance prediction when compared to Light GBM. The model surpassed the Light GBM model with an error difference of 0.31 and obtained a minimum MAPE of 2.69 with 90% of training. The AcEnDNN model outperformed the Light GBM model with an error difference of 1.74 and achieved an MSE value of 5.28 with 90% of training, exceeding the performance of previous methods. The AcEnDNN model showed superior performance by reaching a minimum RMSE of 2.3 with 90% of training and surpassing the Light GBM model with an error difference of 0.35 with training percentage.

5.6.3. Comparative Analysis Using the Real-Time Dataset Based on Training Percentage

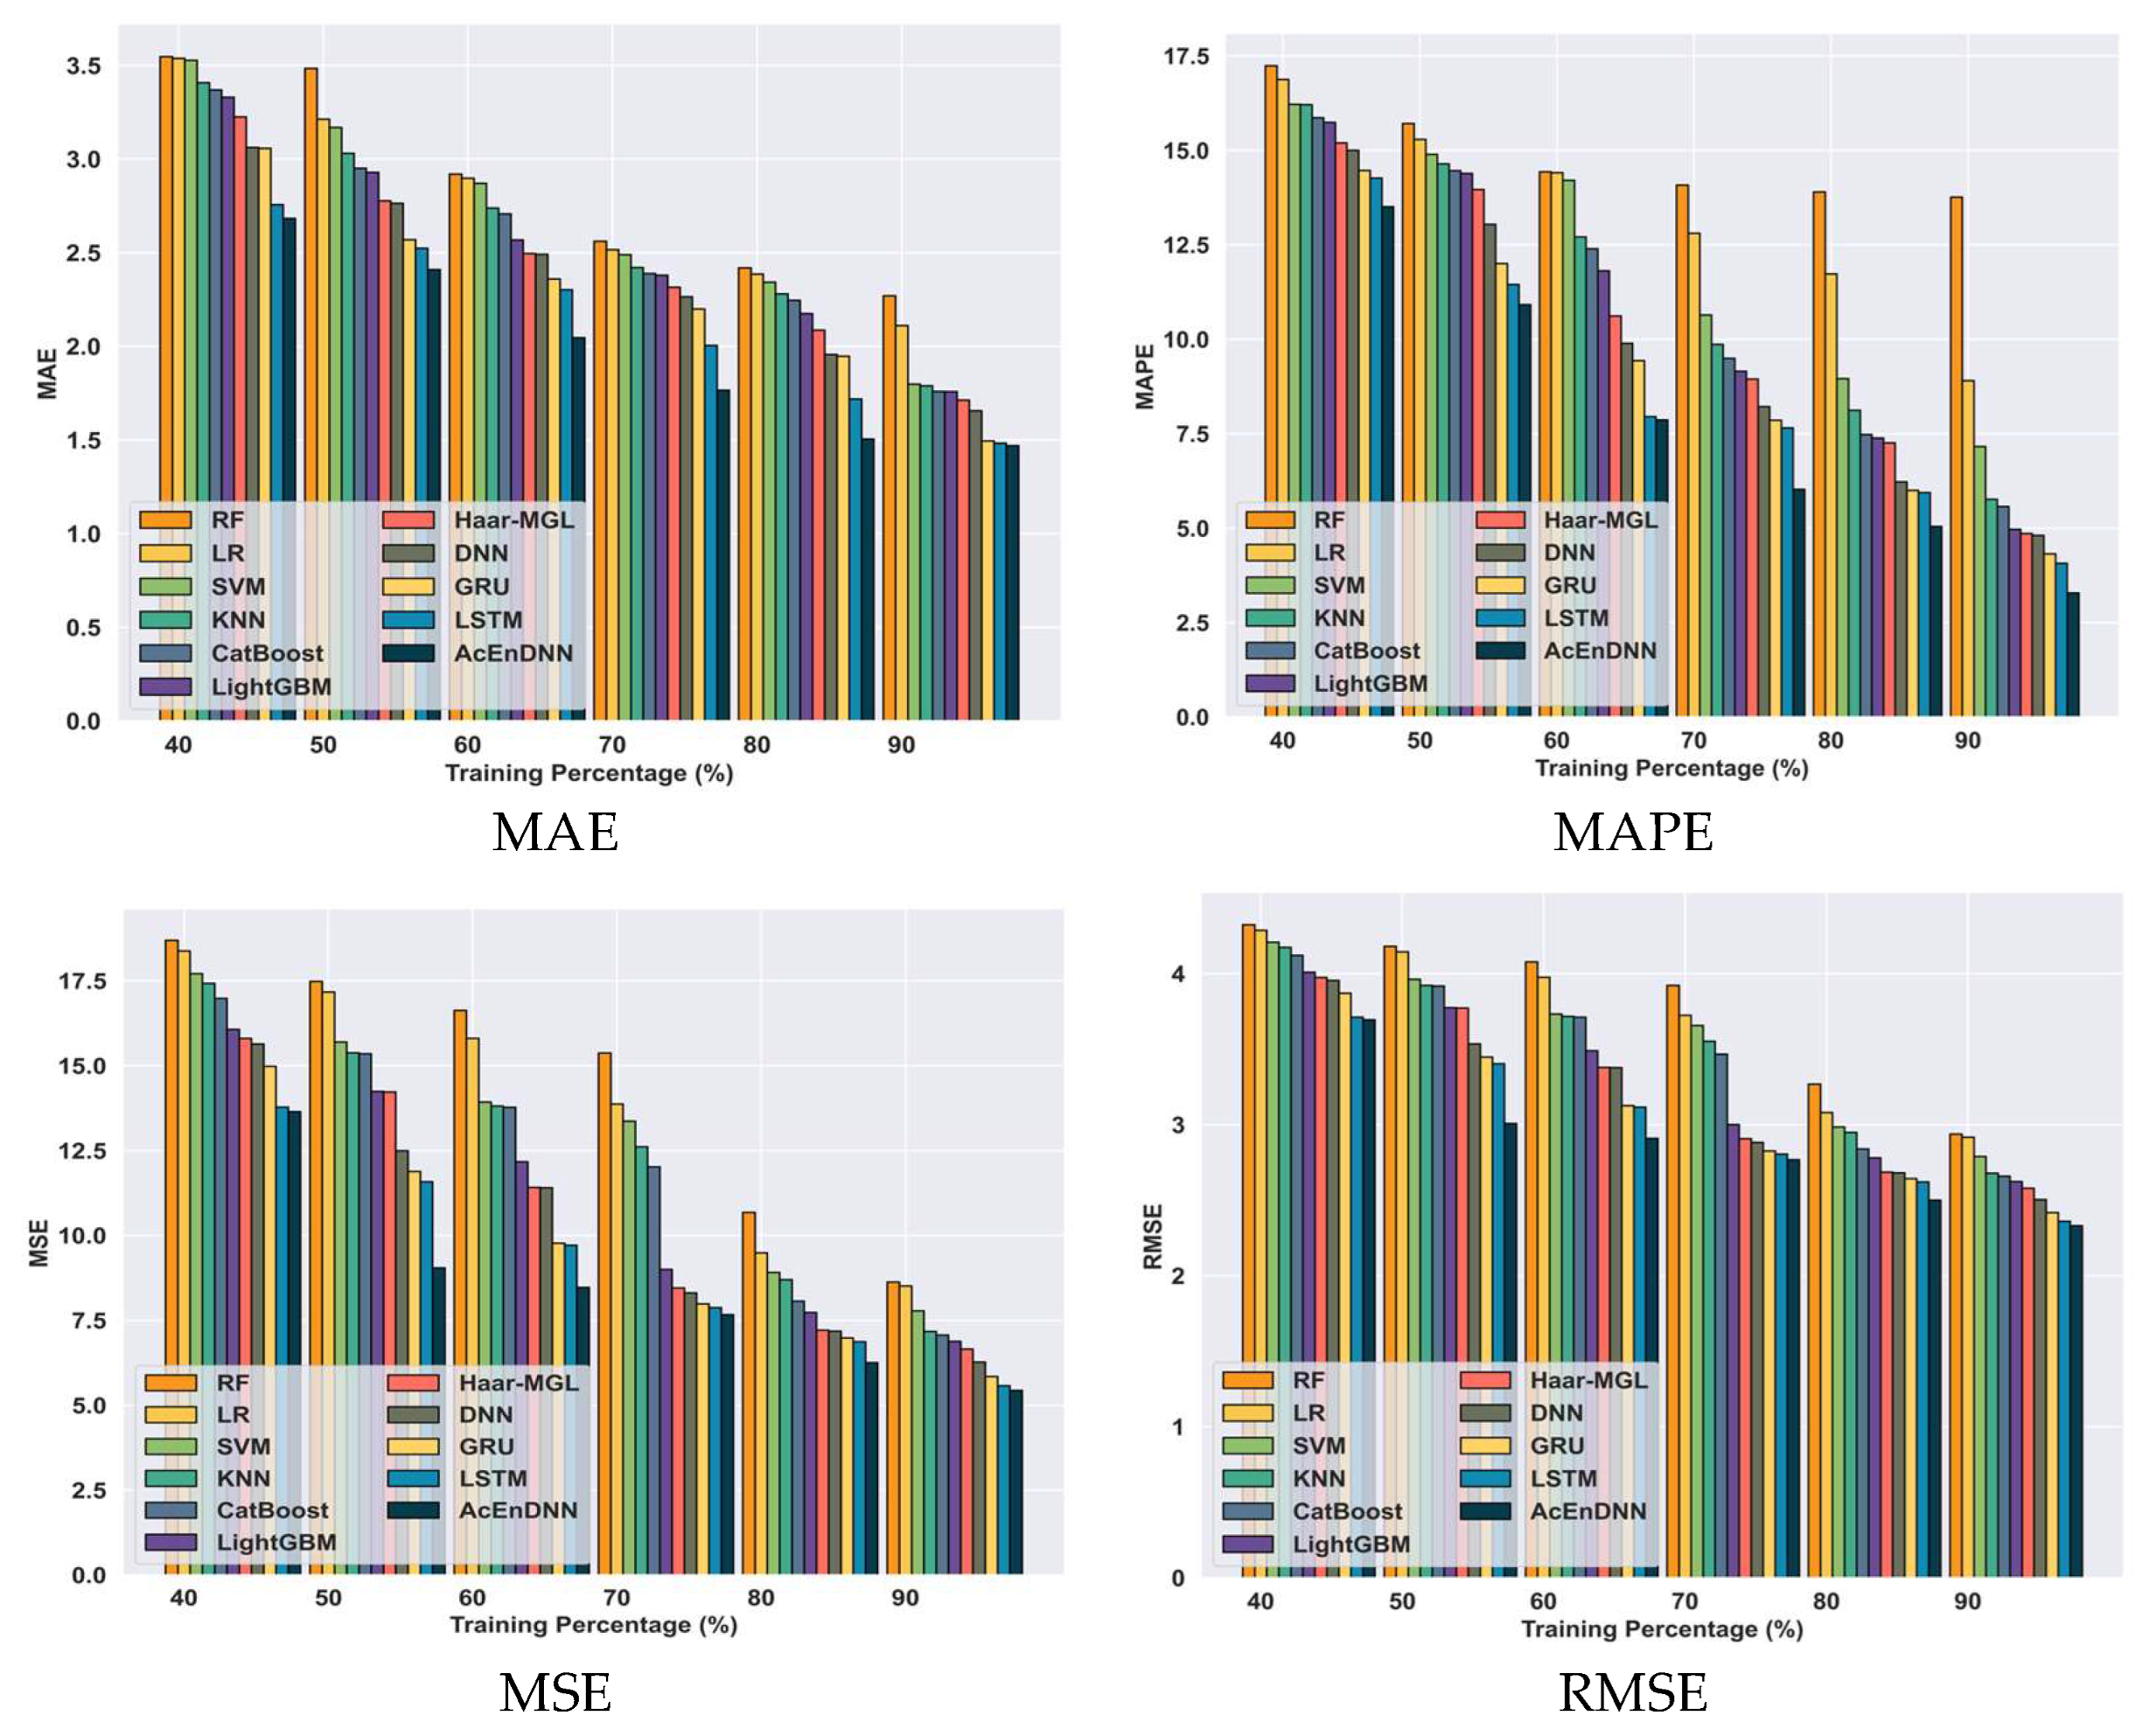
The comparative analysis of the AcEnDNN model is evaluated with other existing models using the real-time dataset based on training percentage, which is illustrated in Figure 9. The proposed model surpassed the Light GBM model in forecasting student performance, displaying a remarkable error difference of 0.29 and reaching a low MAE of 1.47. The proposed model surpassed the Light GBM model with an error difference of 1.69, obtaining a minimum MAPE of 3.29 with 90% of the training data. The AcEn-DNN model outperformed the Light GBM model with an error difference of 1.45 and obtained an MSE value of 5.44 with 90% training, exceeding the performance of previous methods. The proposed AcEn-DNN model showed superior performance compared to the existing models in forecasting student performance, surpassing the Light GBM method with an error difference of 0.29, reaching an RMSE of 2.33 with 90% of training.

5.6.4. Comparative Analysis Based on K-Fold Value for Student-mat.csv Dataset

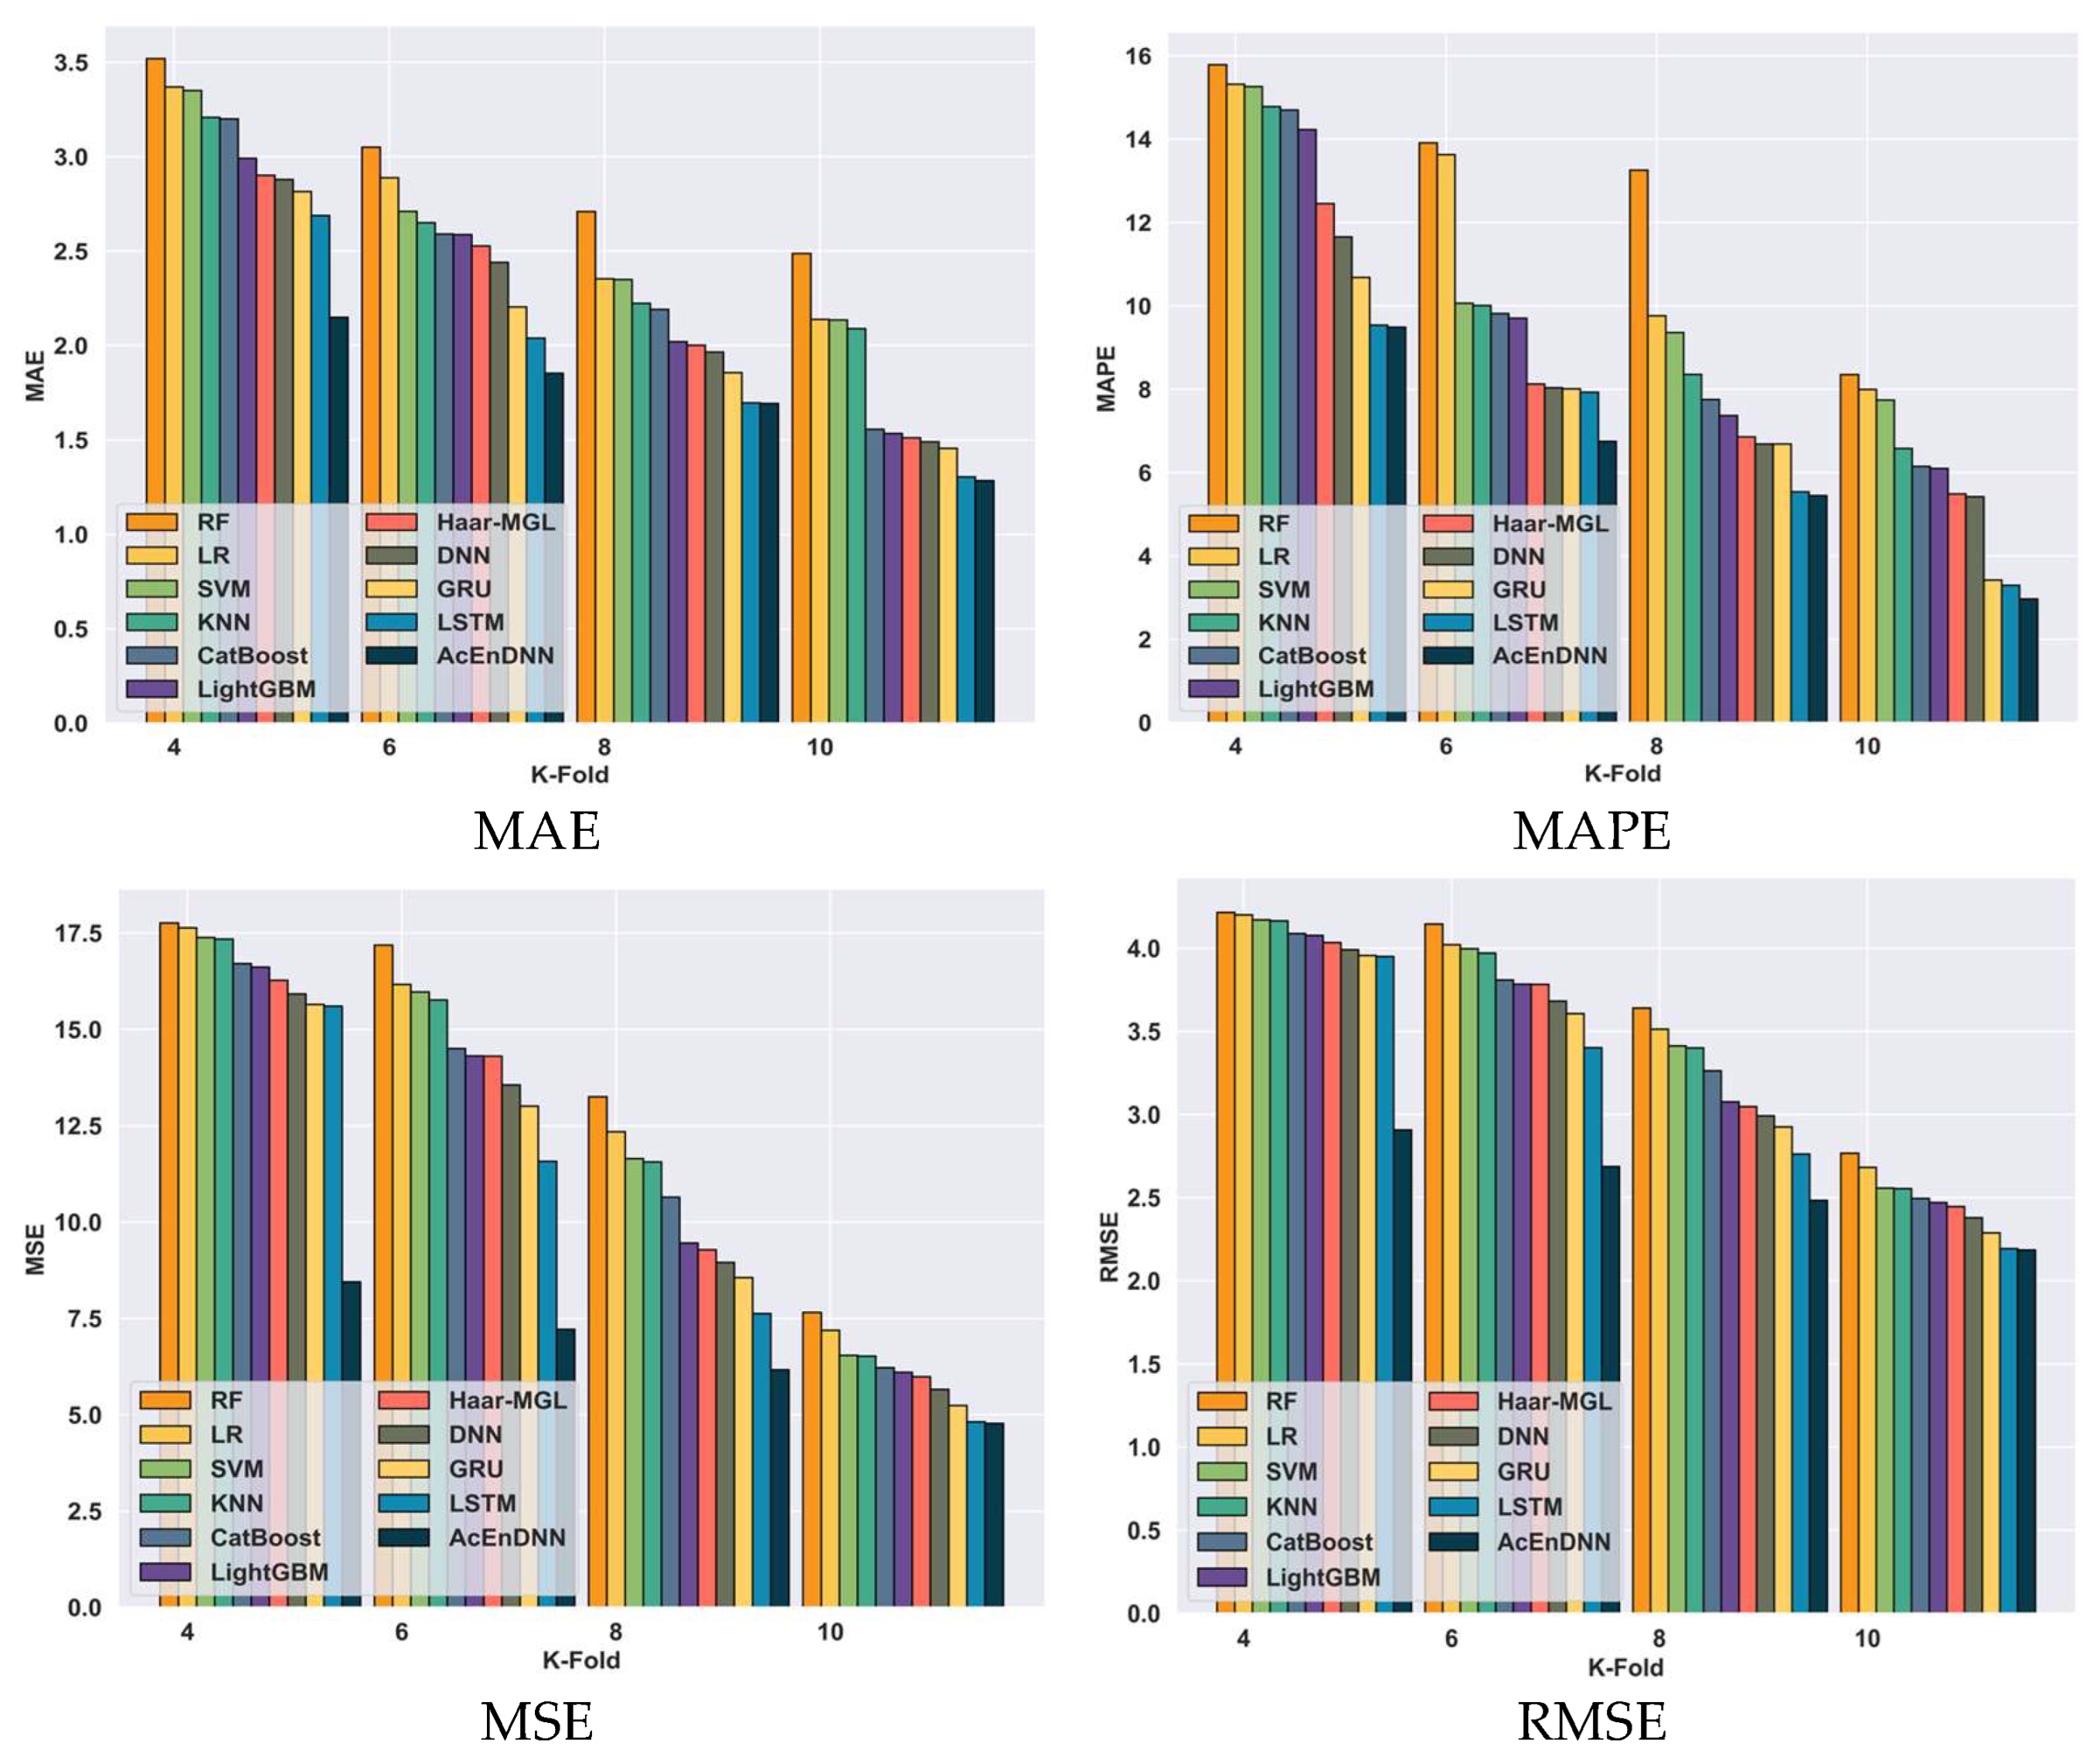
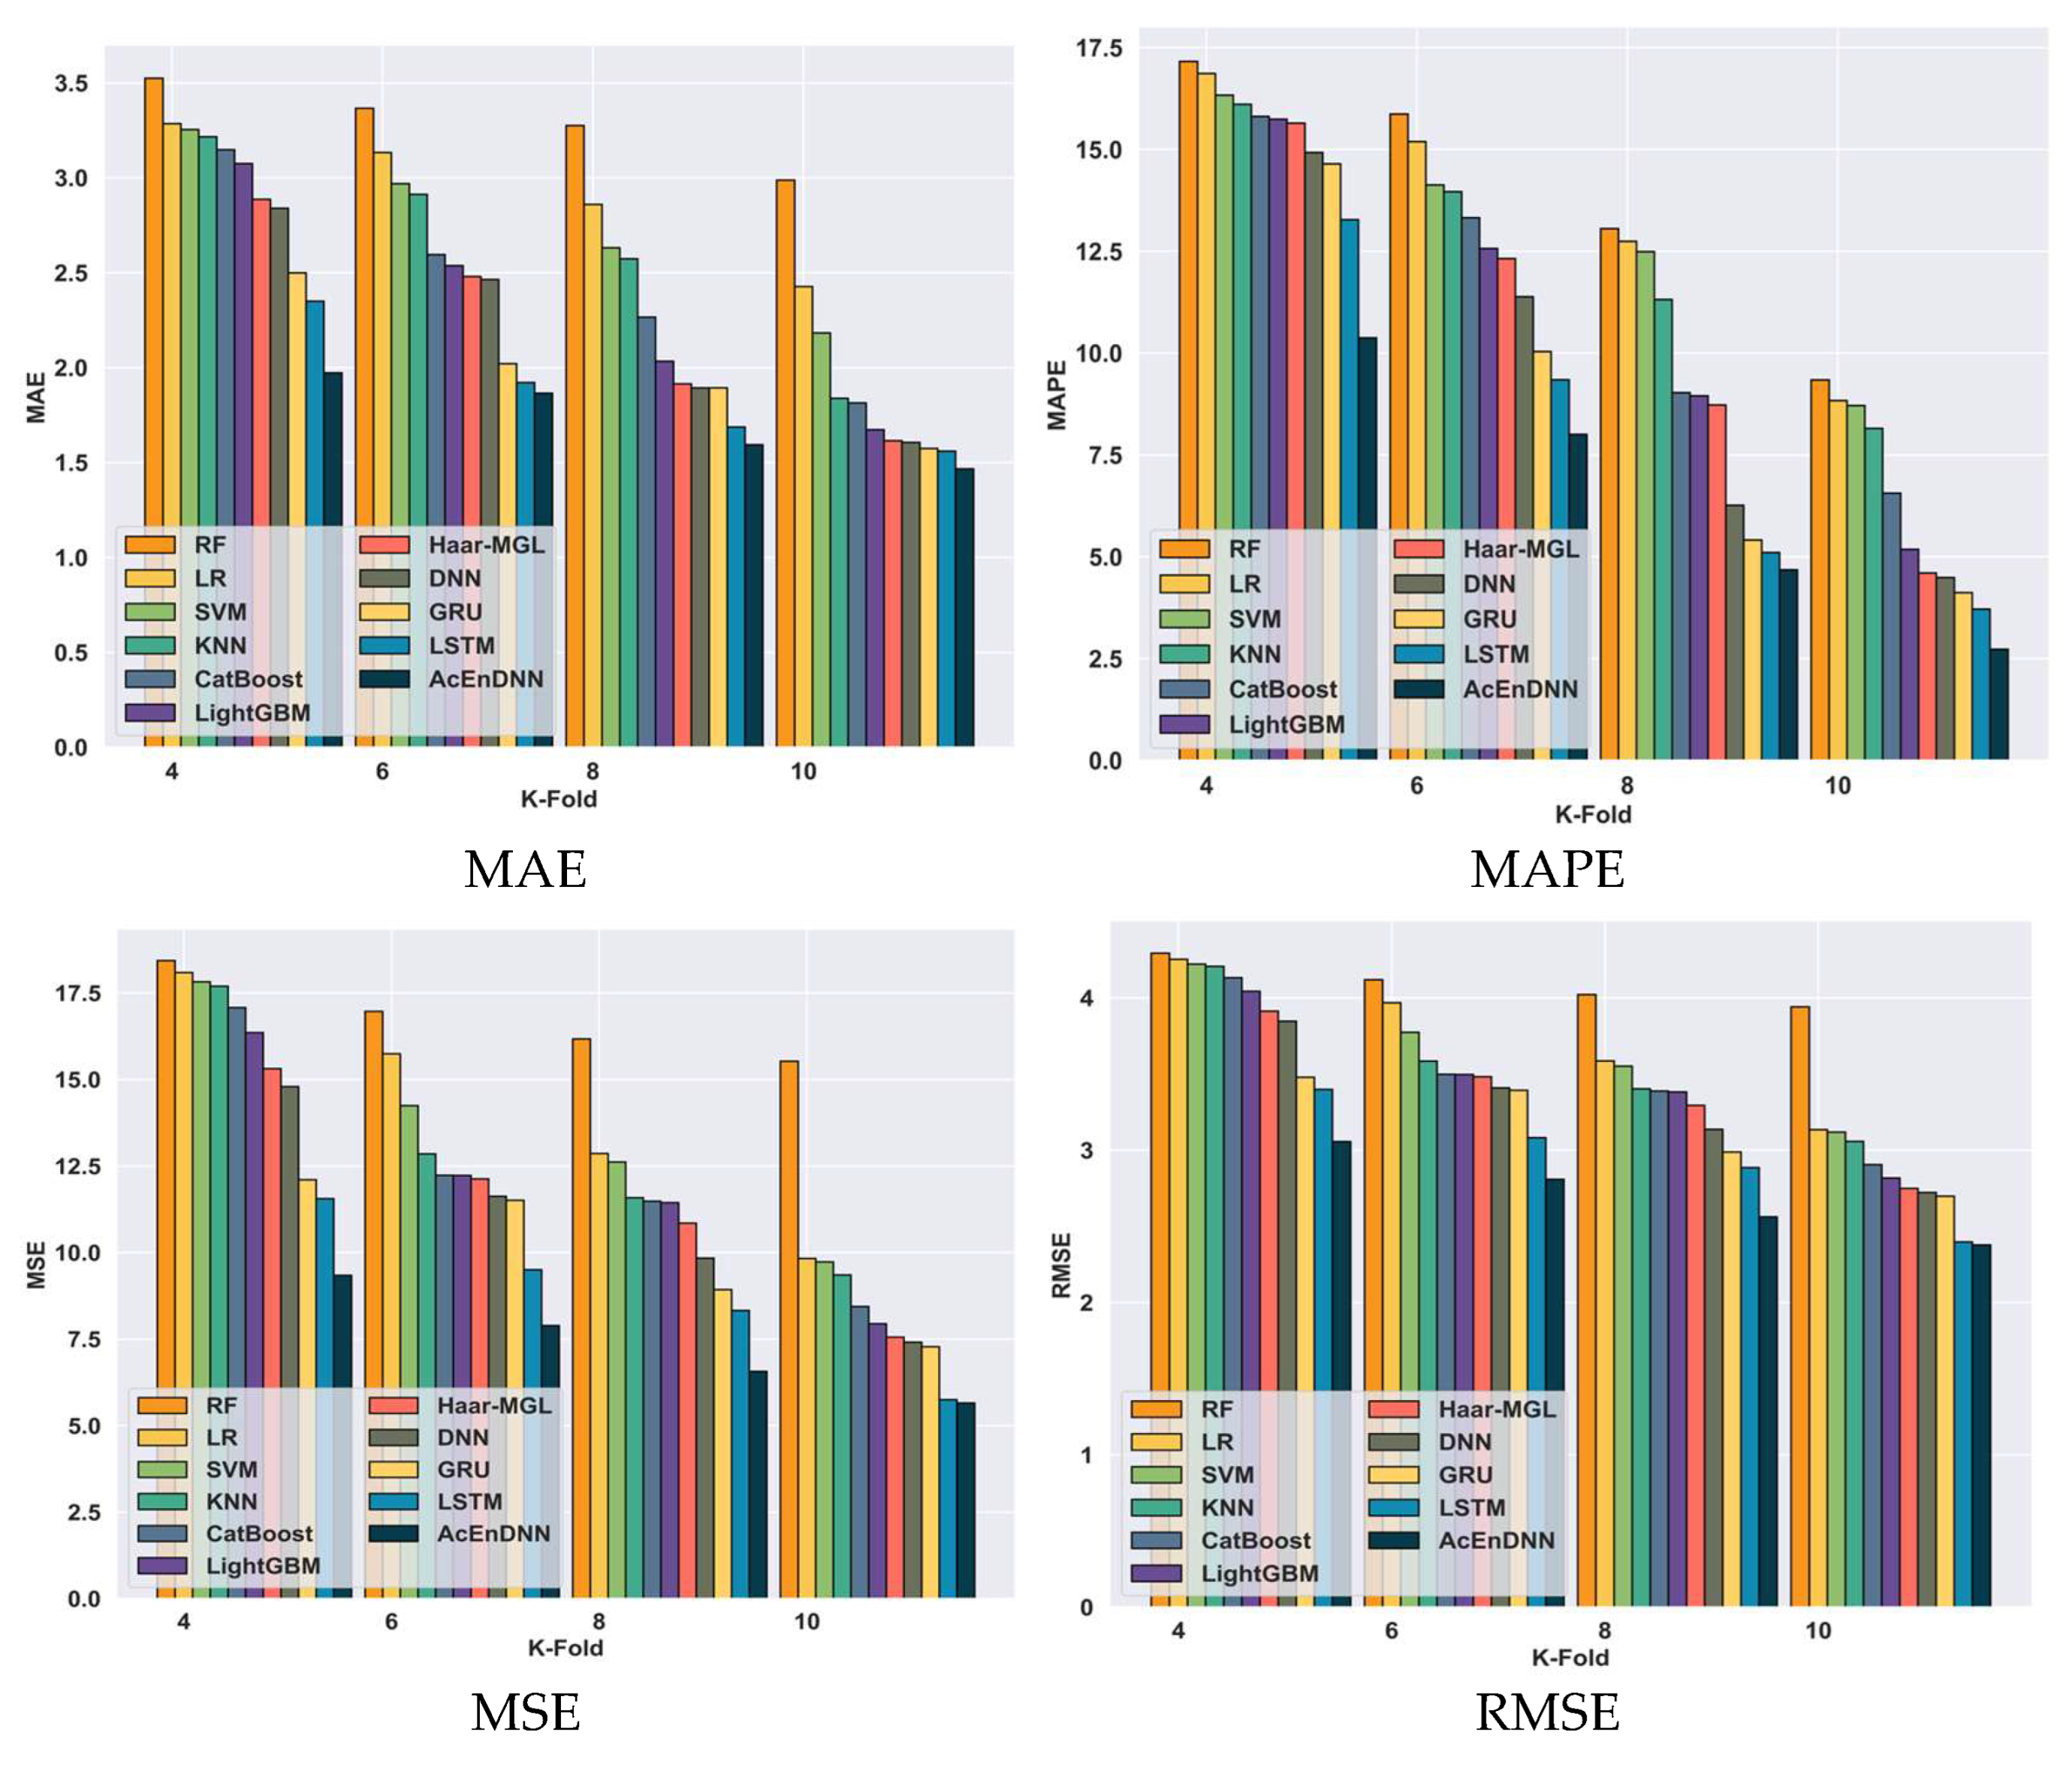
The proposed AcEn-DNN model is evaluated with other existing models using the Student-mat.csv dataset based on the K-fold value, which is illustrated in Figure 10. The proposed model achieved a minimum MAE value of 1.28 at a 10-fold value, surpassing other existing methods in forecasting student performance, with the Light GBM model displaying an error difference of 0.25. The AcEn-DNN method resulted in better predictive performance for student performance prediction when compared to Light GBM. The proposed model surpassed the Light GBM model with an error difference of 3.13 and obtained a minimum MAPE of 2.97 with a K-fold value of 10. The AcEn-DNN model outperformed the Light GBM model with an error difference of 1.33 in MSE for predicting student performance. The proposed method obtained an MSE value of 4.77 with a K-fold value of 10. The proposed AcEn-DNN model gained a minimum RMSE of 2.18 and surpassed the Light GBM method by an error difference of 0.29 with a K-fold value of 10. The proposed AcEn-DNN model shows superior performance compared to all the other existing methods for estimating student performance.

5.6.5. Comparative Analysis Based on K-Fold Value Using Student-por.csv Dataset

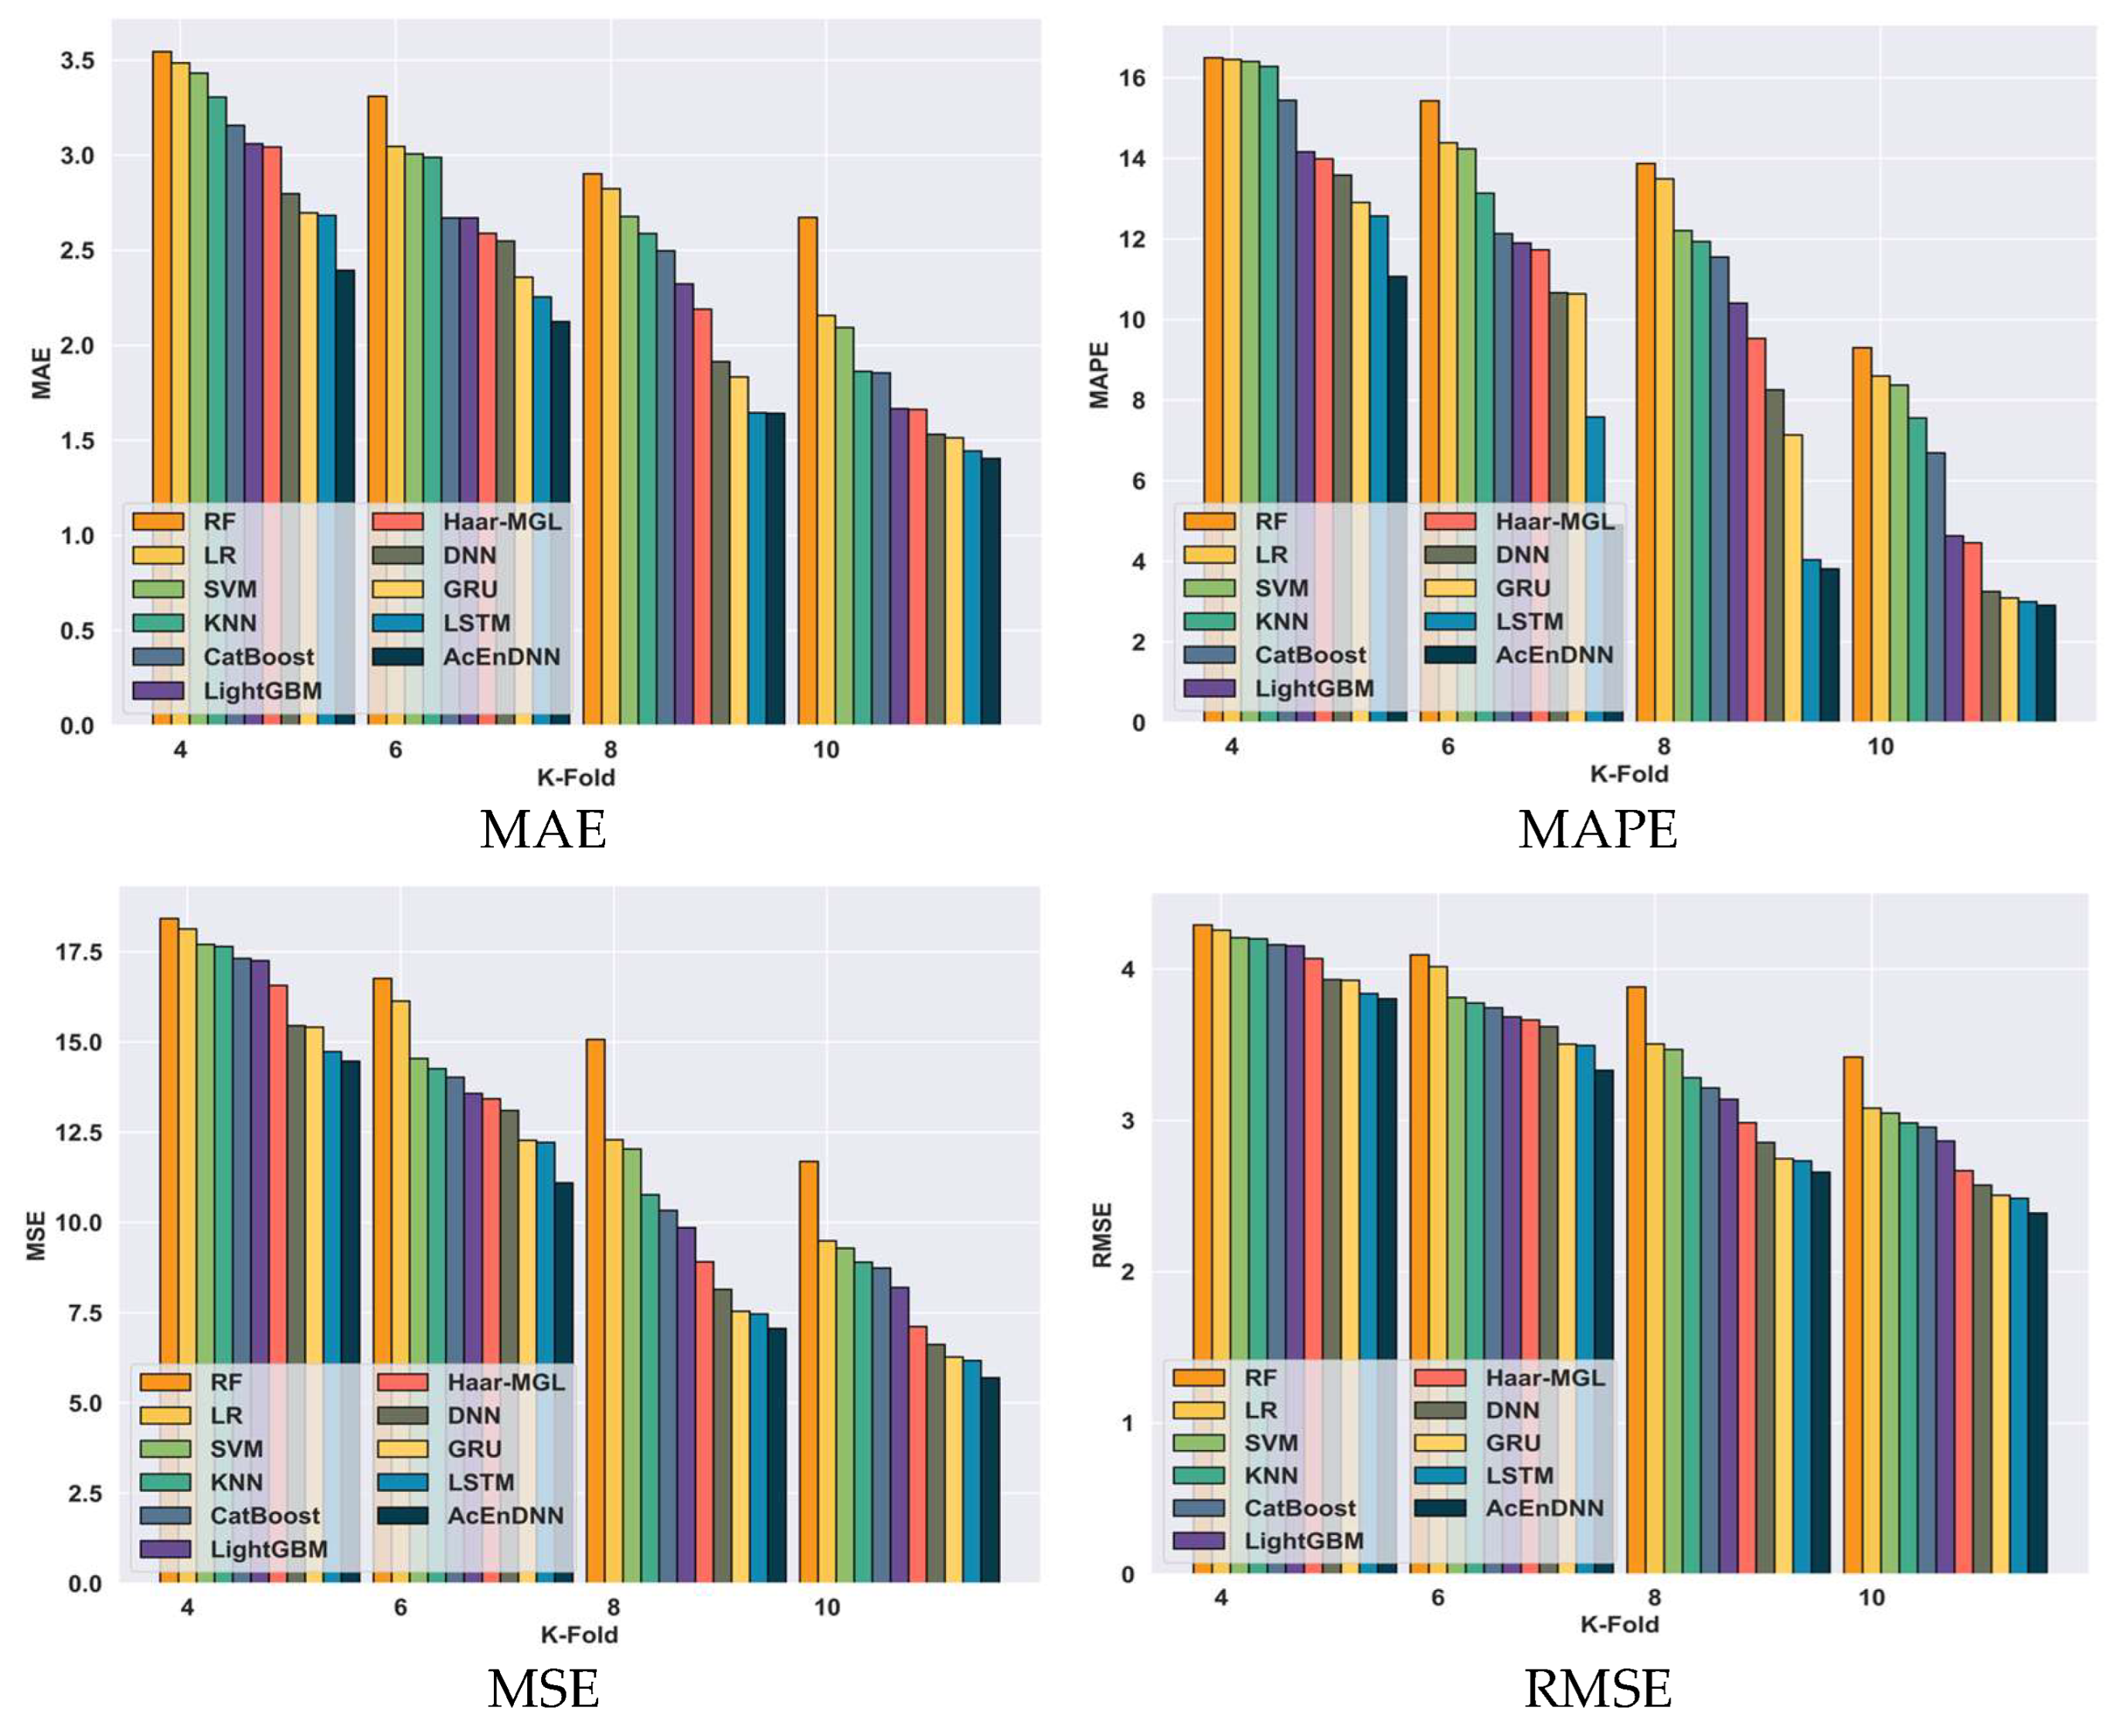
The proposed AcEn-DNN model is compared with other existing models based on the K-fold value using the Student-por.csv dataset, which is depicted in Figure 11. The AcEn-DNN model reached a low MAE of 1.47 and surpassed the Light GBM model with an error difference of 0.21. The proposed model obtained a minimum MAPE of 2.73 with a K-fold value of 10 and surpassed the Light GBM model with an error difference of 2.45. The AcEn-DNN model achieved a minimum MSE value of 5.65 with a K-fold value of 10 and outperformed the Light GBM model with an error difference of 2.29 in forecasting student performance. The AcEn-DNN model showed a lower RMSE of 2.38 with a K-fold value surpassing the Light GBM model with an error difference of 0.44. The comparative analysis of the AcEn-DNN model based on the K-fold value using the Student-por.csv dataset is illustrated in Figure 11.

5.6.6. Comparative Analysis Based on K-Fold Value Using Real-Time Dataset

The proposed AcEn-DNN model is compared with other existing models based on their K-fold value using the real-time dataset, which is depicted in Figure 12. The AcEn-DNN model reached a low MAE of 1.4 and surpassed the Light GBM model with an error difference of 0.26. The proposed model obtained a minimum MAPE of 2.91 with a K-fold value of 10 and surpassed the Light GBM model with an error difference of 1.72. The AcEn-DNN model achieved a minimum MSE value of 5.7 with a K-fold value of 10 and outperformed the Light GBM model with an error difference of 2.5 in forecasting student performance. The AcEn-DNN model showed a low RMSE of 2.39 with a K-fold value surpassing the Light GBM model with an error difference of 0.48.

5.7. Comparative Discussion

The existing methods compared face challenges, such as the RF classifier facing issues due to the small dataset. The LR model finds difficulty when dealing with a large number of features. Similarly, the SVC model also faces challenges with computational complexity. The KNN model faces overfitting issues. The Cat Boosting model faces issues with a long training time. Moreover, Gradient Boosting faces issues with high computational costs while dealing with large datasets. To overcome the above-mentioned limitations, the proposed AcEnDNN is employed in this research. The superiority of AcEnDNN is demonstrated by its performance, being compared to a bunch of traditional machine learning algorithms. AcEnDNN outperforms the other models after evaluating against the existing models, and hence, it emerges as the leading candidate in predictive performance for student performance data. Its uniqueness results from AcEnDNN’s architectural innovations, which include multiple hidden layers and an ensemble of activation methods like ReLU, tanh, sigmoid, and swish. Unlike standalone nonlinear modeling, the AcEnDNN aggregating depth network approach can provide a complete grasp of those complicated nonlinear relationships in the process of forecasting the performance of students. Moreover, the proposed model rectifies overfitting issues and the imbalance in data. Further, the evaluation of diverse datasets in the proposed model improves the generalizability of the model. Besides its capability, AcEnDNN would ensure adaptability to changing student behaviors and learning patterns, leading to consistently higher predictive precision. The analysis reveals that the proposed model outperforms other existing models with a minimum error rate and less computational complexity. Table 2 represents the comparative discussion of the AcEn-DNN model and existing methods based on training percentage and K-fold.

5.8. Statistical Analysis

The statistical analysis is carried out in terms of Best, Mean, and Variance for performance metrics MAE, MAPE, MSE, and RMSE. Here, the results of the proposed AcEnDNN model are compared with the existing methods RF, LR, SVM, KNN, Cat Boost, Light GBM, Haar-MGL, DNN, GRU, and LSTM. Table 3 explains the statistical validation of the proposed AcEn-DNN model compared with existing methods.

5.9. Ablation Study

The proposed Activation Ensembled Deep Neural Network comprises activation functions such as ReLU, tanh, sigmoid, and swish functions to evaluate the model using multiple student performance datasets. The AcEnDNN model ensures flexibility to fluctuating student behaviors and learning patterns, leading to a reliable, more predictive output. The ReLU-based DNN achieved a high MSE value of 5.12 in the evaluation. The tangent-based DNN model gained an MSE value of 5.84. The Sigmoid-based DNN achieved an MSE value of 5.54 in simulation. The swish activation function-based DNN gained an error value of 5.46, and the GELU-based DNN model attained a high MSE of 5.97 for student performance prediction, which limited the model’s performance in terms of errors. More specifically, the proposed AcEnDNN model achieved a minimum MSE of 4.55 compared with the single activation function-based DNN models. More specifically, the activation functions were utilized in deep neural networks to enhance nonlinearity in the model to learn complex patterns, which led to accurate student performance prediction. Figure 13 illustrates the performance of the proposed model with a single activation function-based deep neural network, such as ReLU-DNN, Tanh-DNN, Sigmoid-DNN, Swish-DNN, and GELU-DNN, based on MSE metrics.

5.10. Correlation Matrix

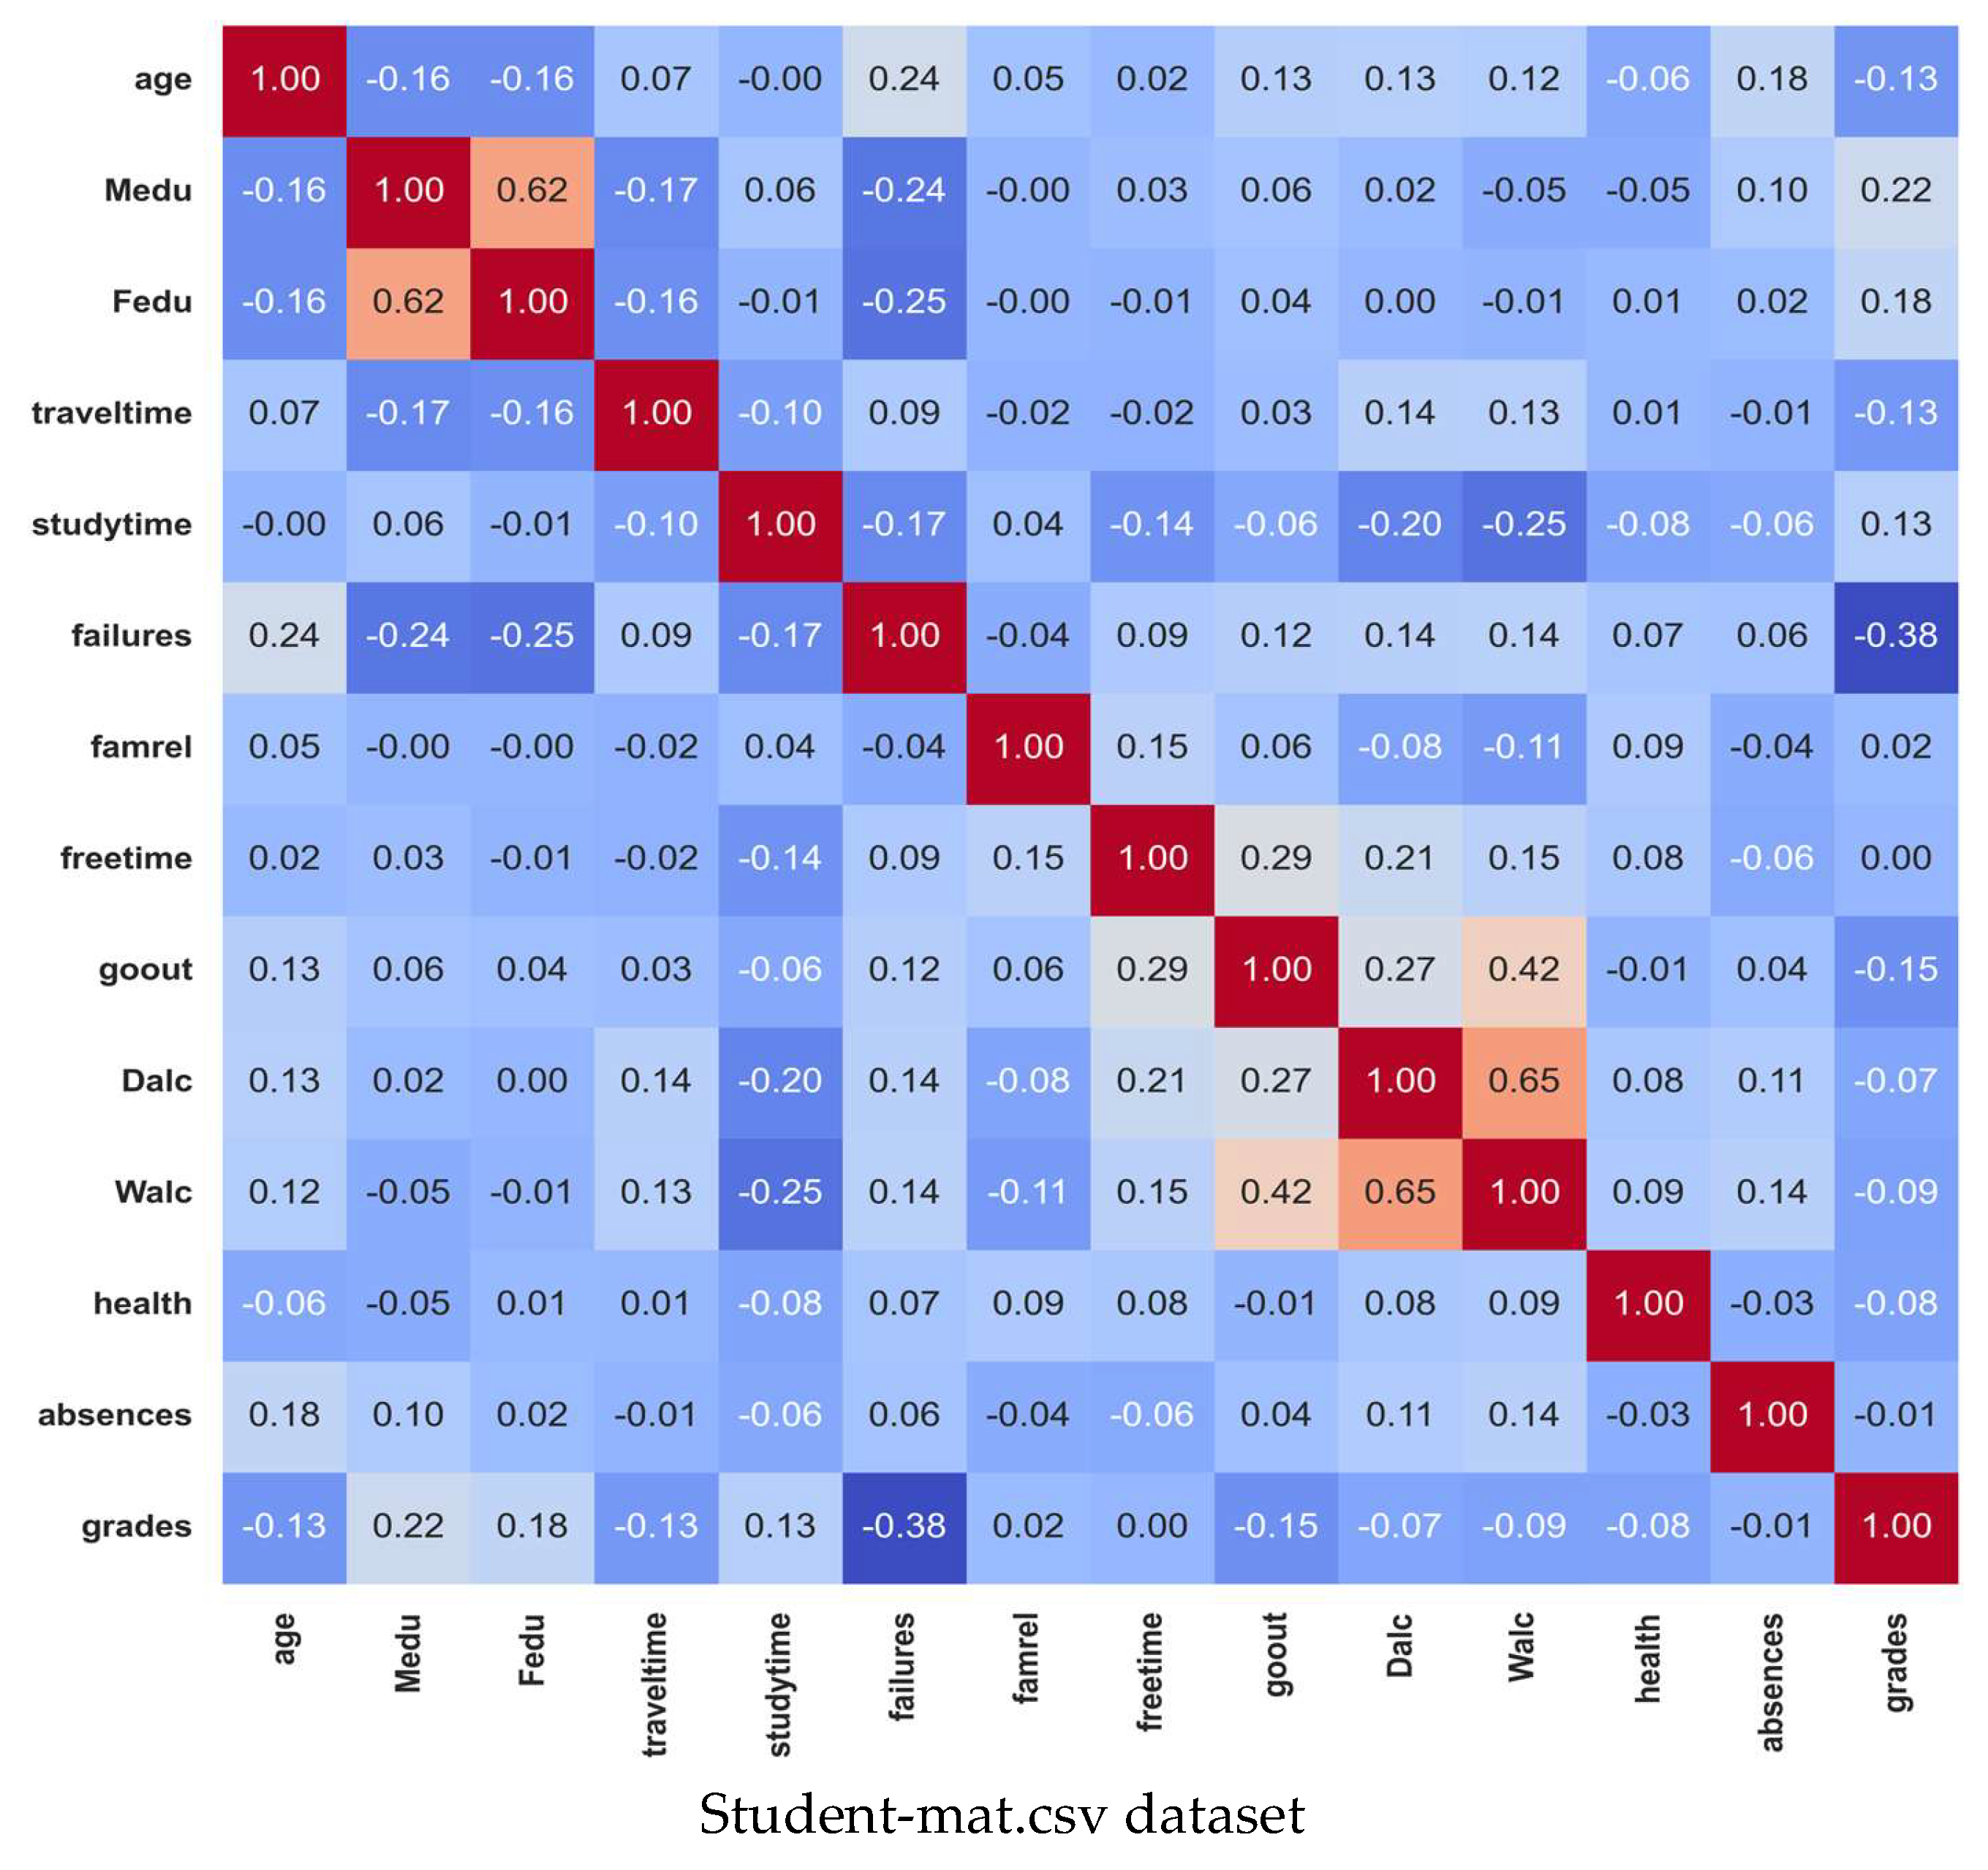
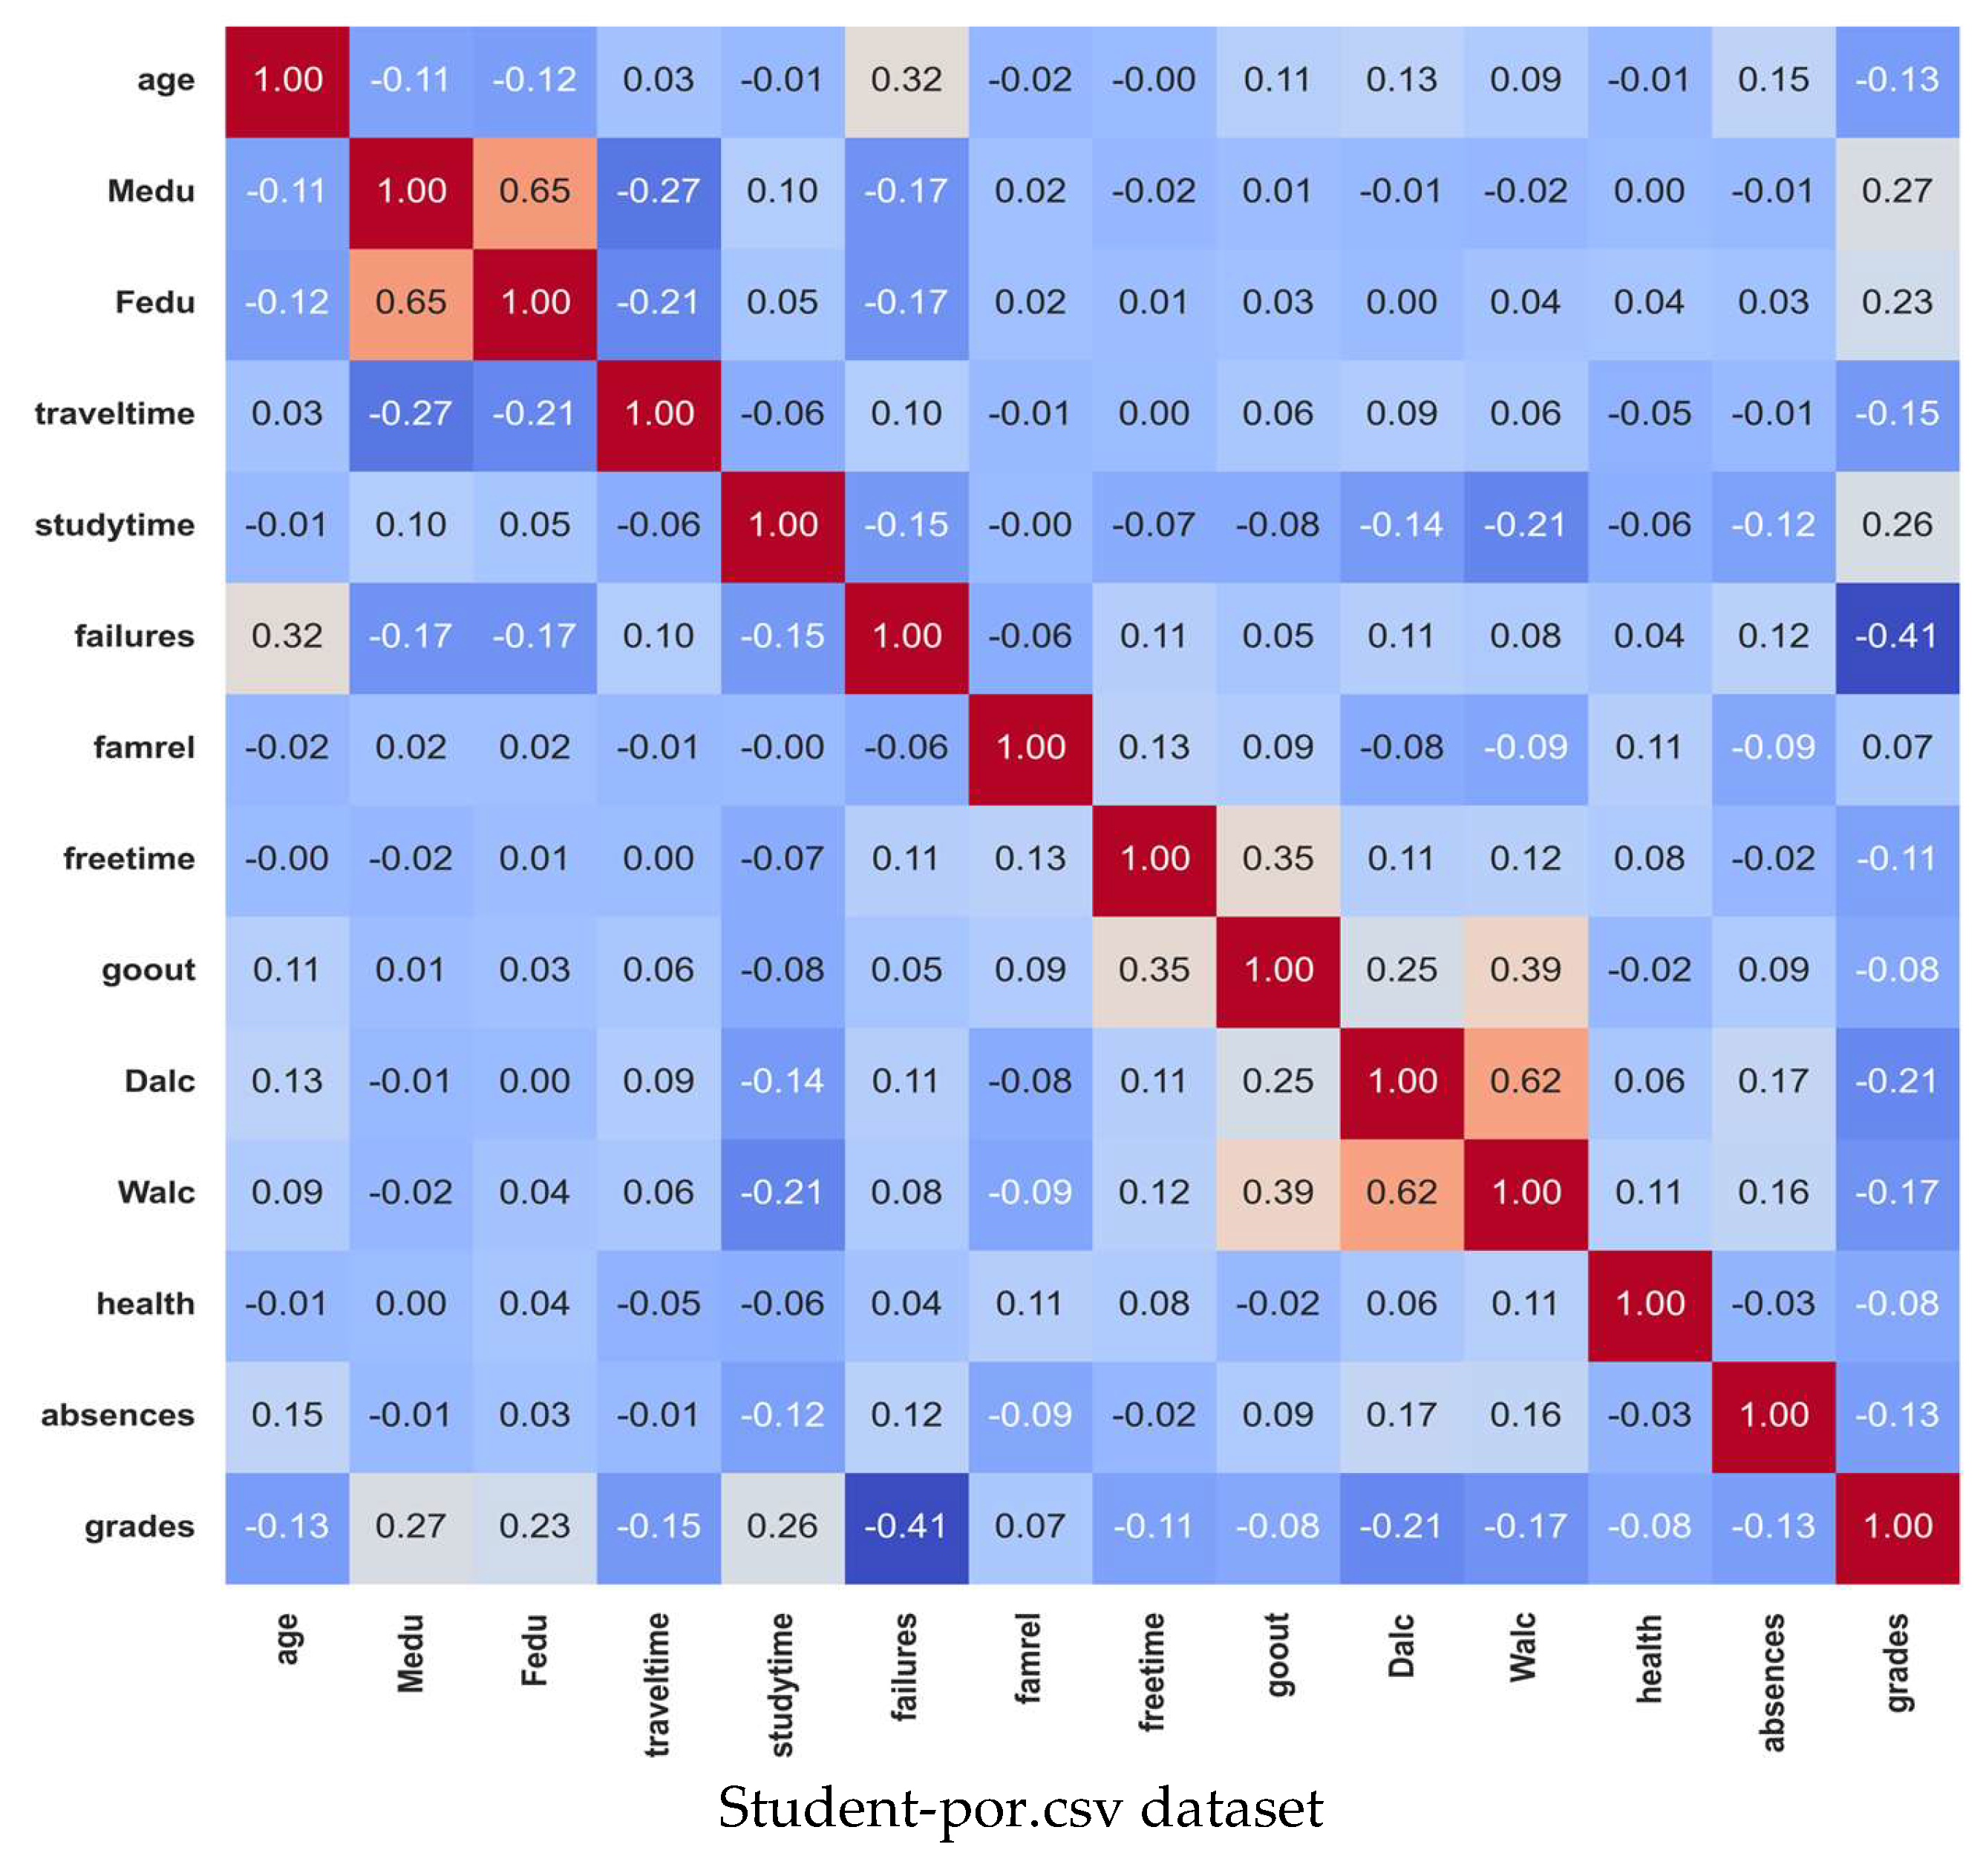
The correlation matrix is a table containing rows and columns illustrating the correlation coefficients for variables that identify the relationship between different variables in the datasets to understand the input data. The correlation matrix contains numerous cells that indicate the strength between variables, with numerical values ranging from −1 to +1. Specifically, +1 represents a strong positive correlation, −1 denotes a negative correlation, and 0 represents no correlation. Figure 14 depicts the correlation matrix of the proposed AcEn-DNN model based on the Student-mat.csv dataset and Student-por.csv dataset as follows.

5.11. Sensitivity Analysis

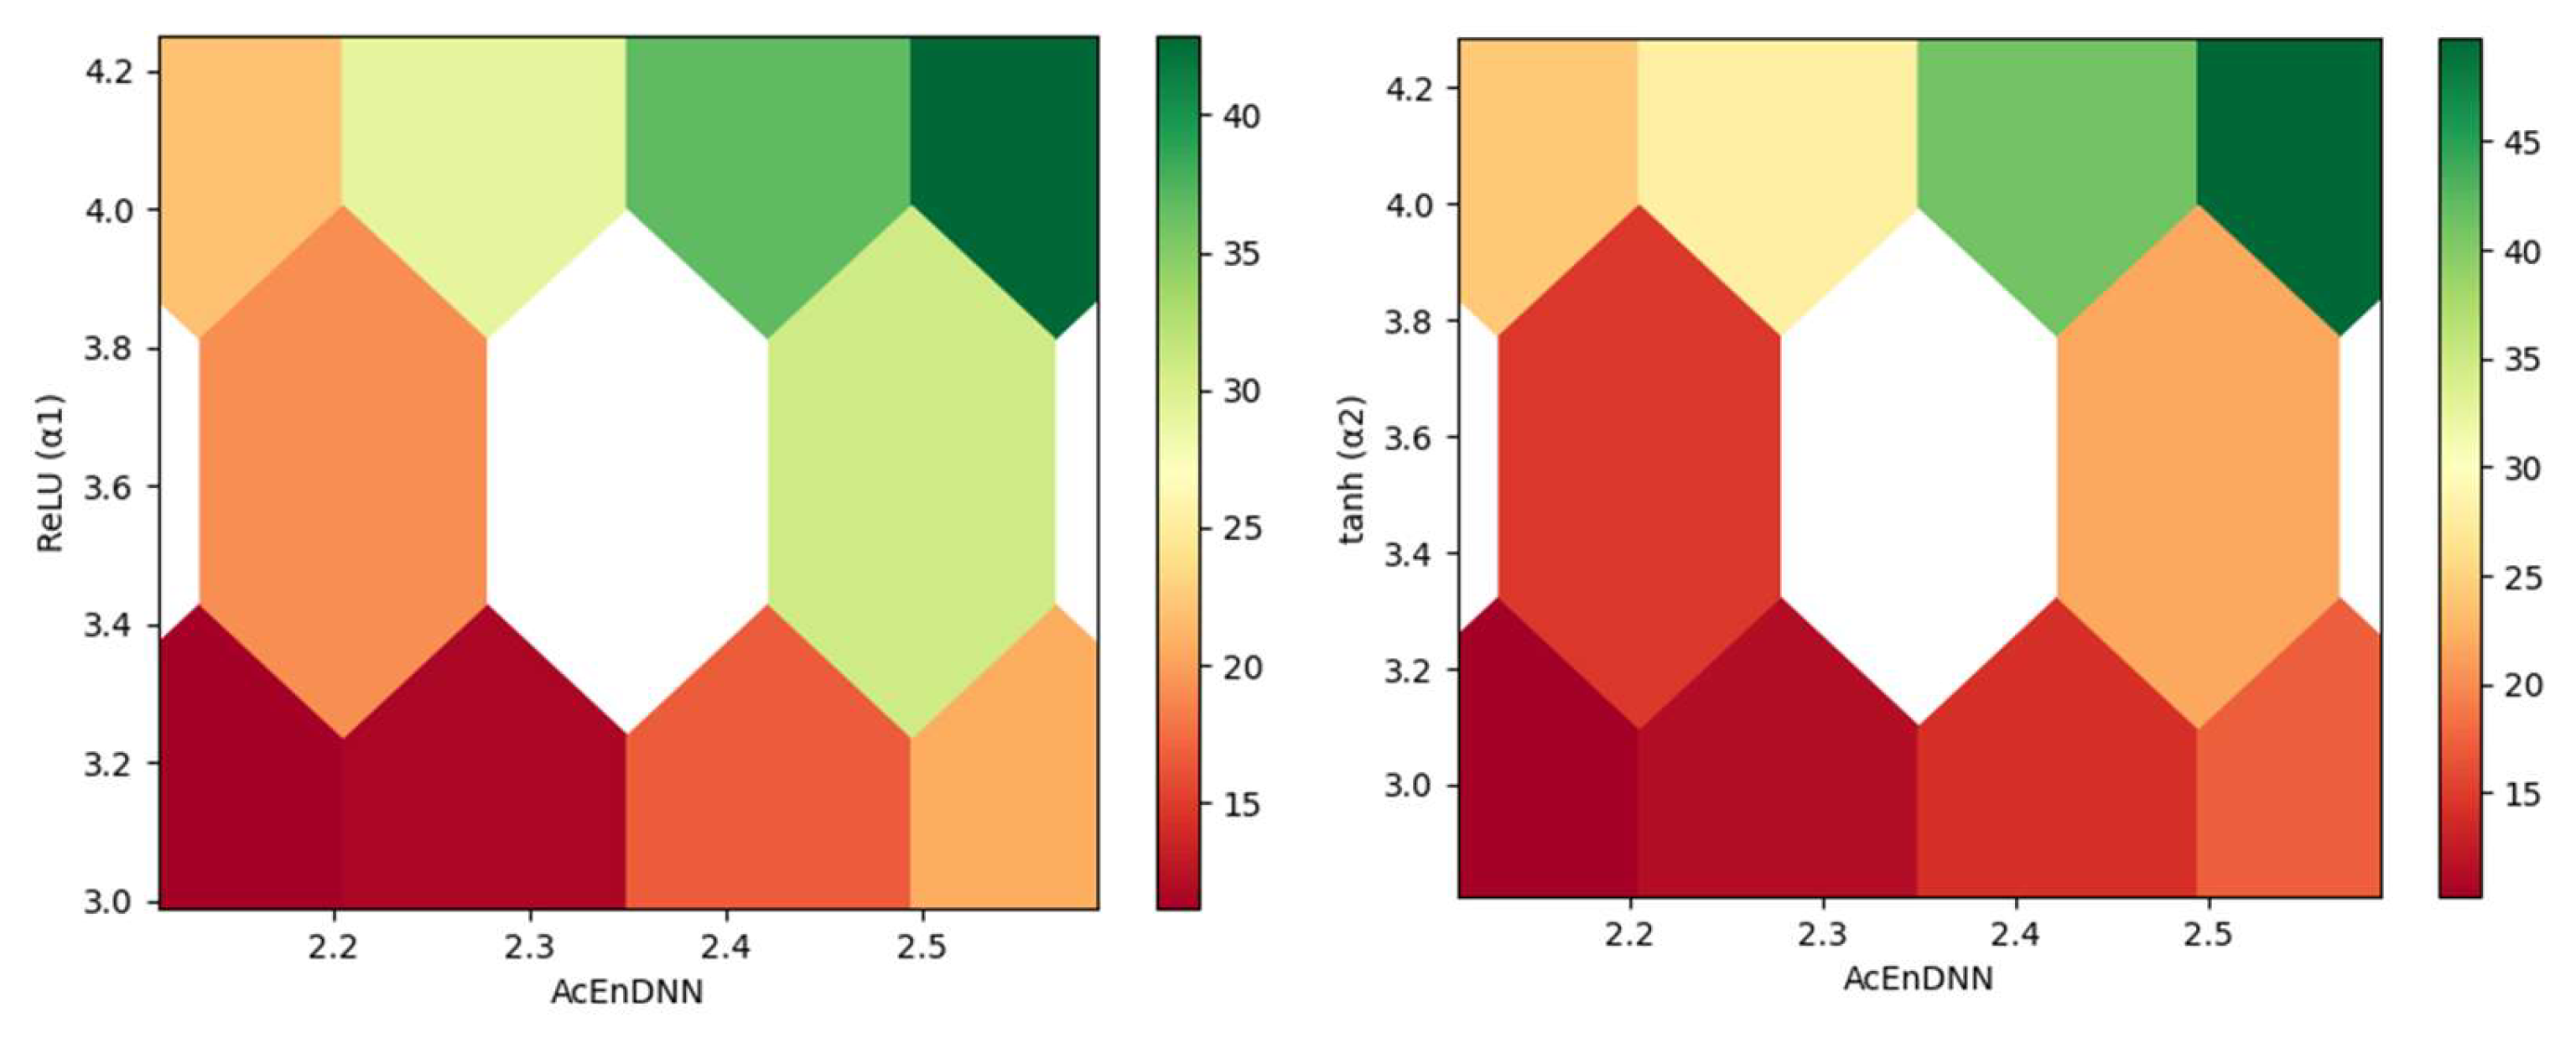
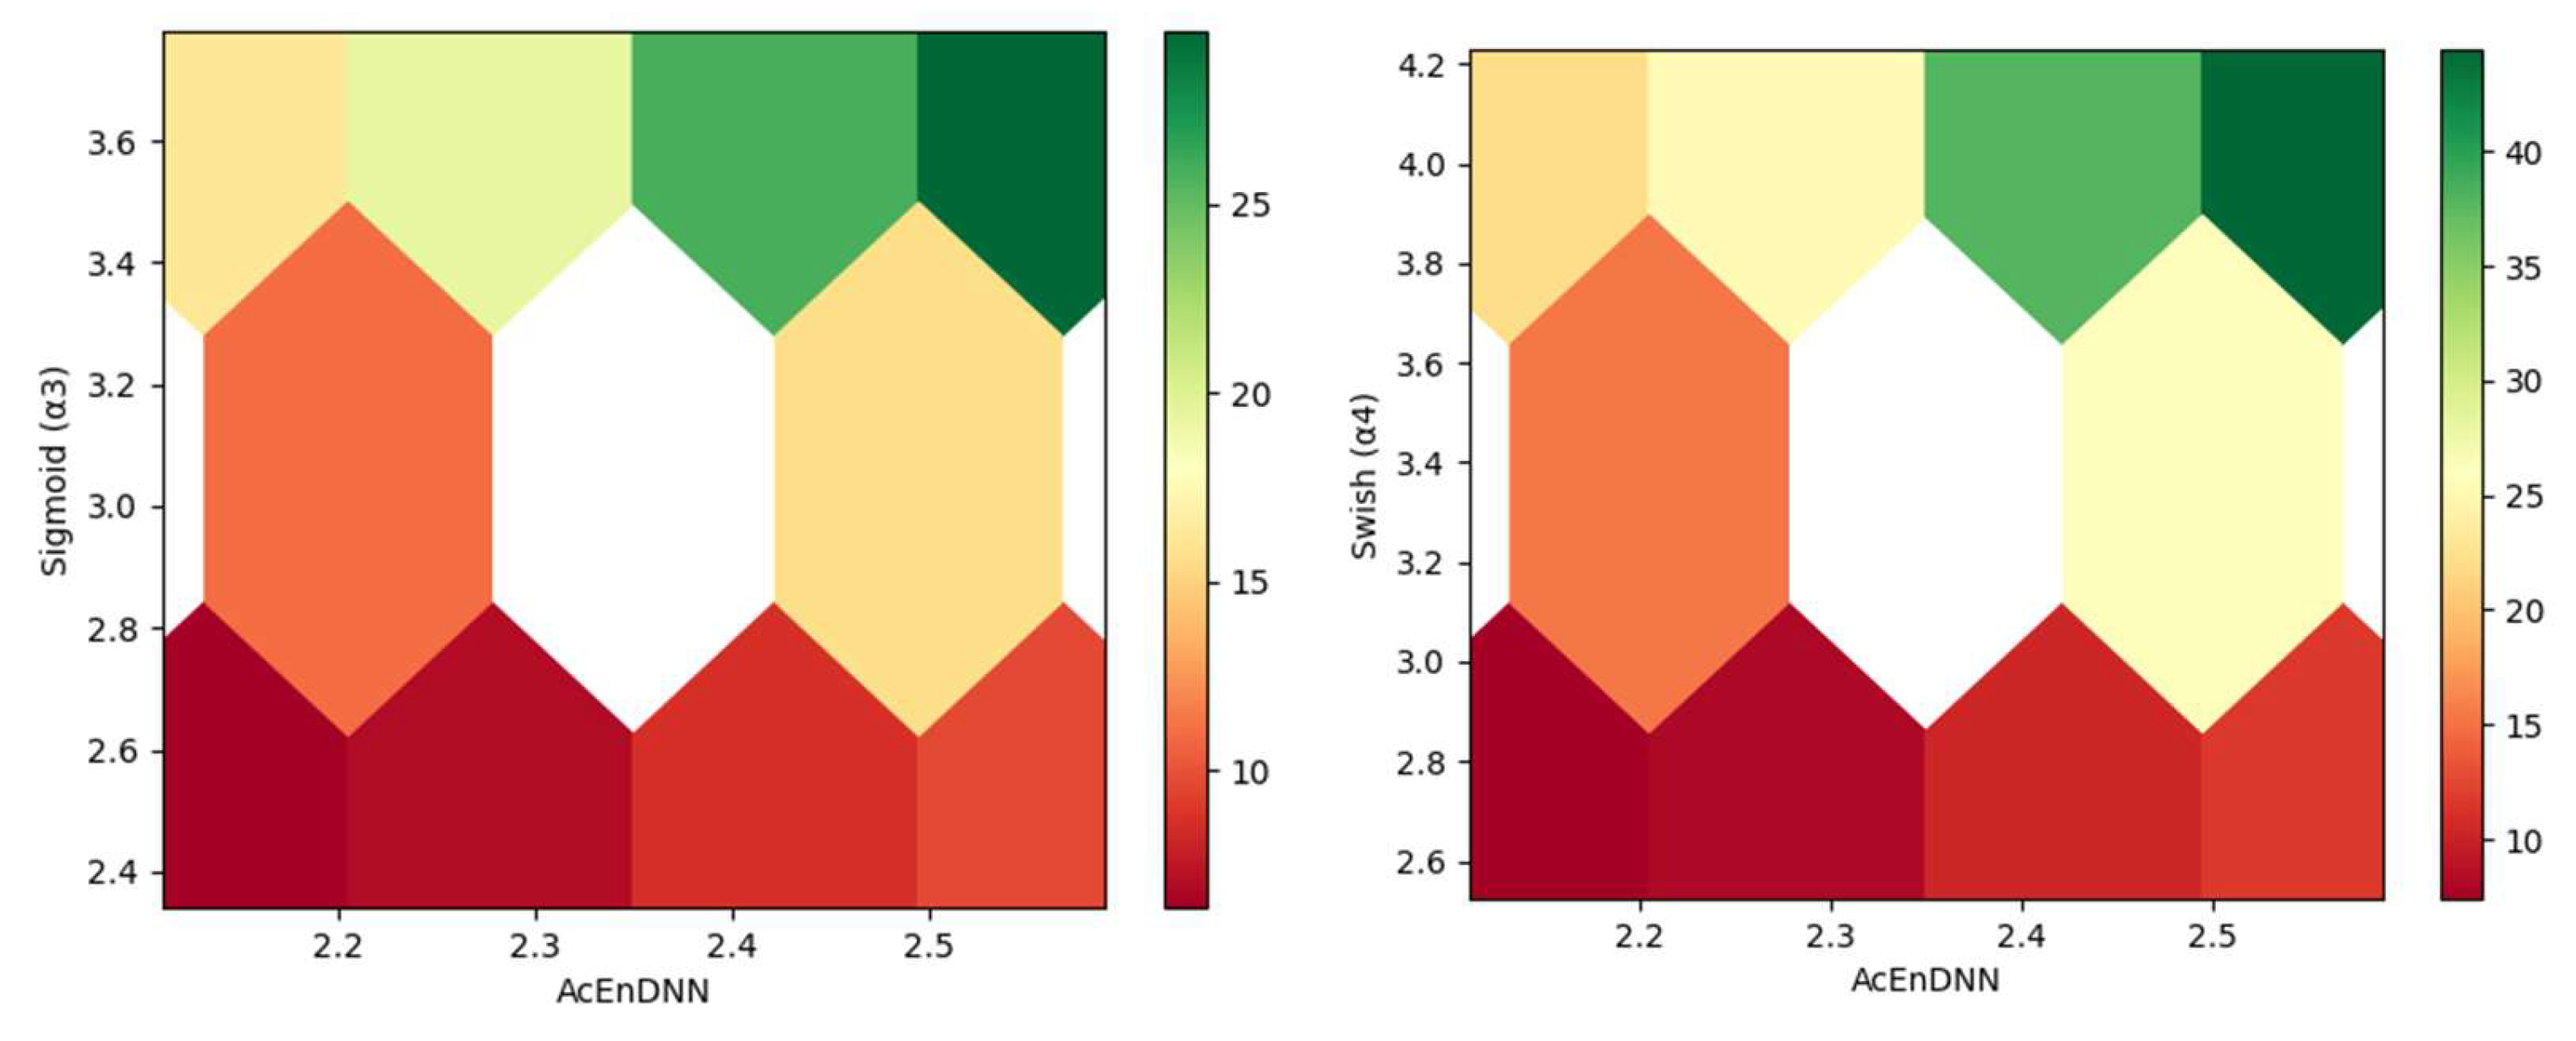
The sensitivity analysis for the proposed AcEnDNN model is conducted based on the weighted parameters of the ensemble activation function in student performance prediction. The fluctuations in the input variables affect the prediction output, which is varied based on the learning styles, individual characteristics, missing data, and sudden changes in student behaviors that affect the student’s performance. Significantly, the proposed model is compared with every activation function in order to enhance the robustness and reliability of the prediction results. The variations in the input weighted parameters for ReLU ( α 1 ), tanh ( α 2 ), sigmoid ( α 3 ), and swish ( α 4 ) are graphically represented in Figure 15.

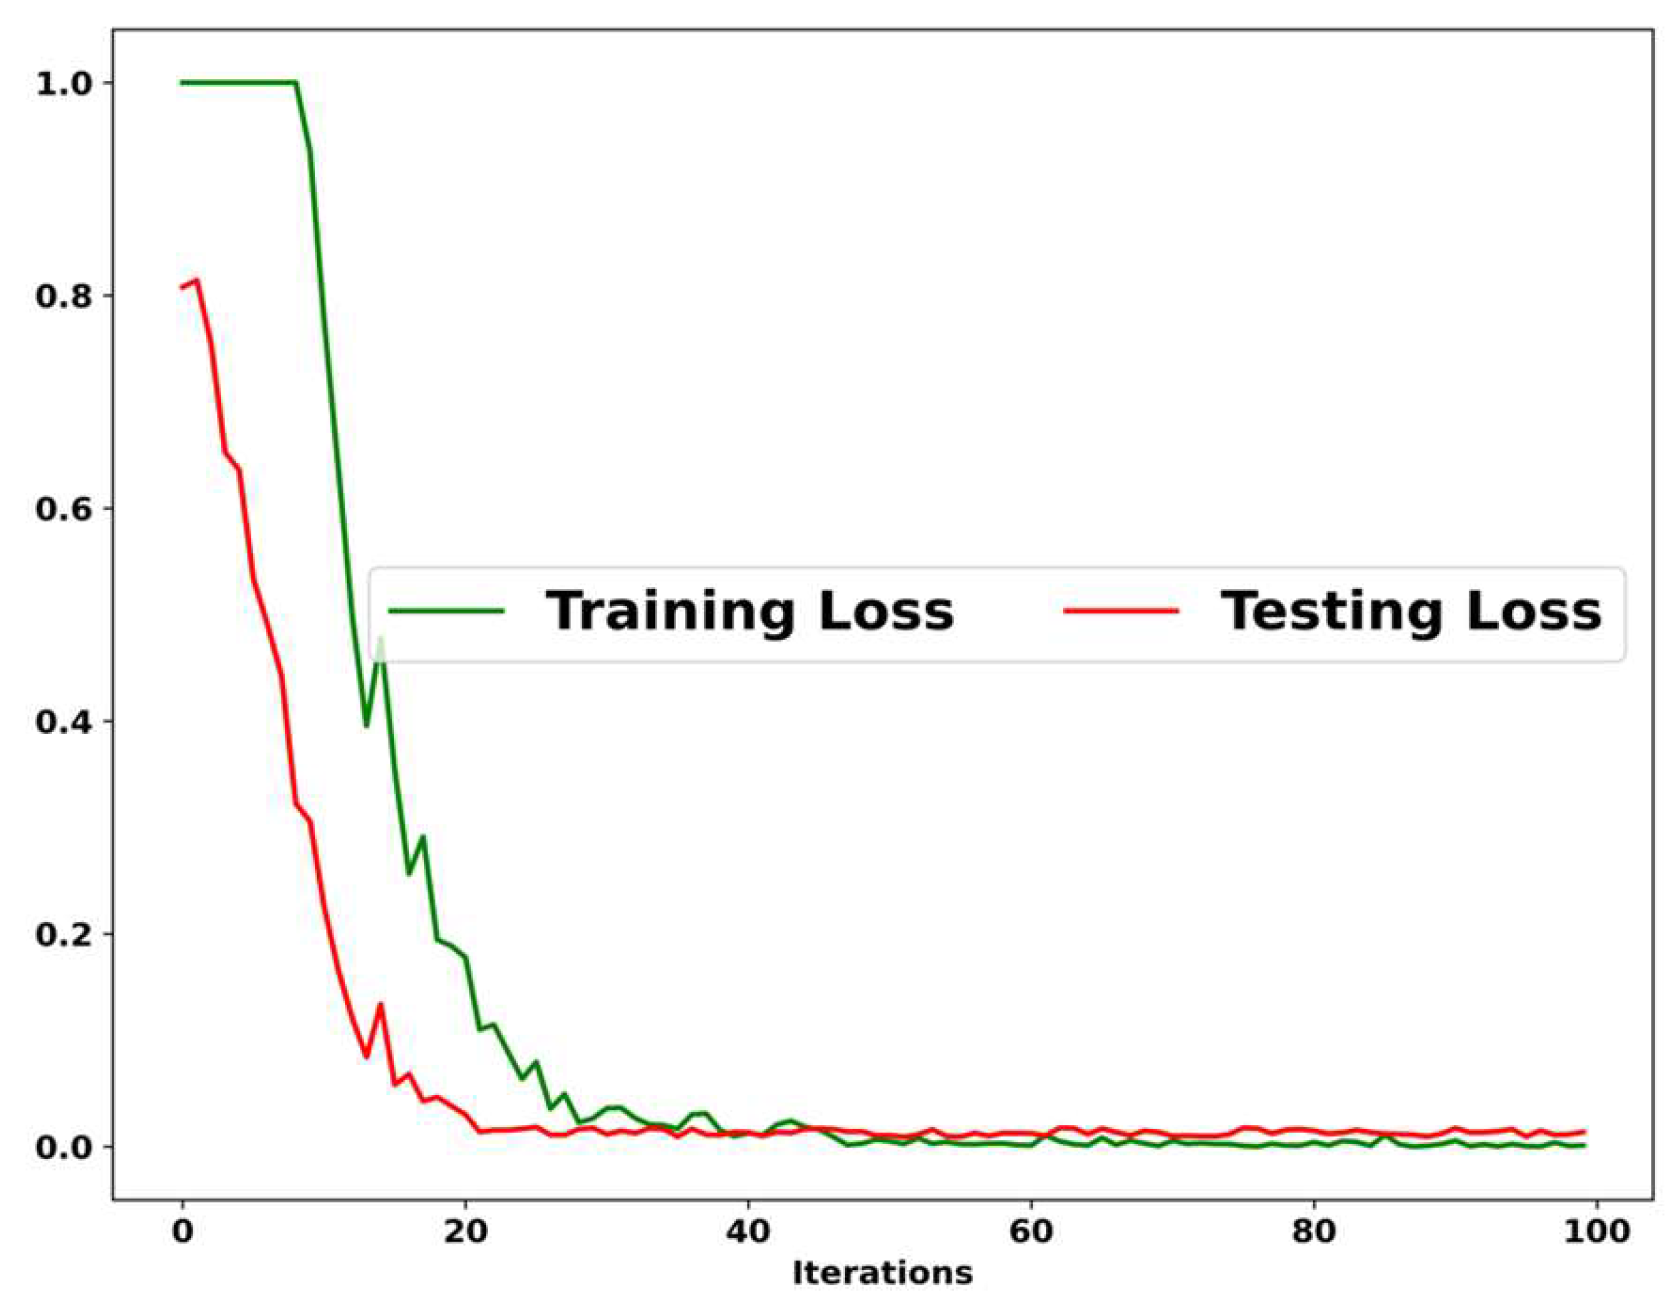
5.12. Training and Testing Loss Analysis

Figure 16 illustrates the training loss curve and testing loss curve of the proposed AcEn-DNN model, which are plotted against the number of iterations, ranging from 0 to 100. Specifically, the proposed method attained a minimum training loss value of 0.01 at epoch 100, which explicates the efficiency of the proposed model. The testing loss curve represents a testing loss value of 0.99 through the student performance prediction process. Moreover, the training and testing curves reveal the efficiency of the proposed AcEn-DNN model based on the minimum training loss and testing loss.

5.13. Spider Plot Analysis

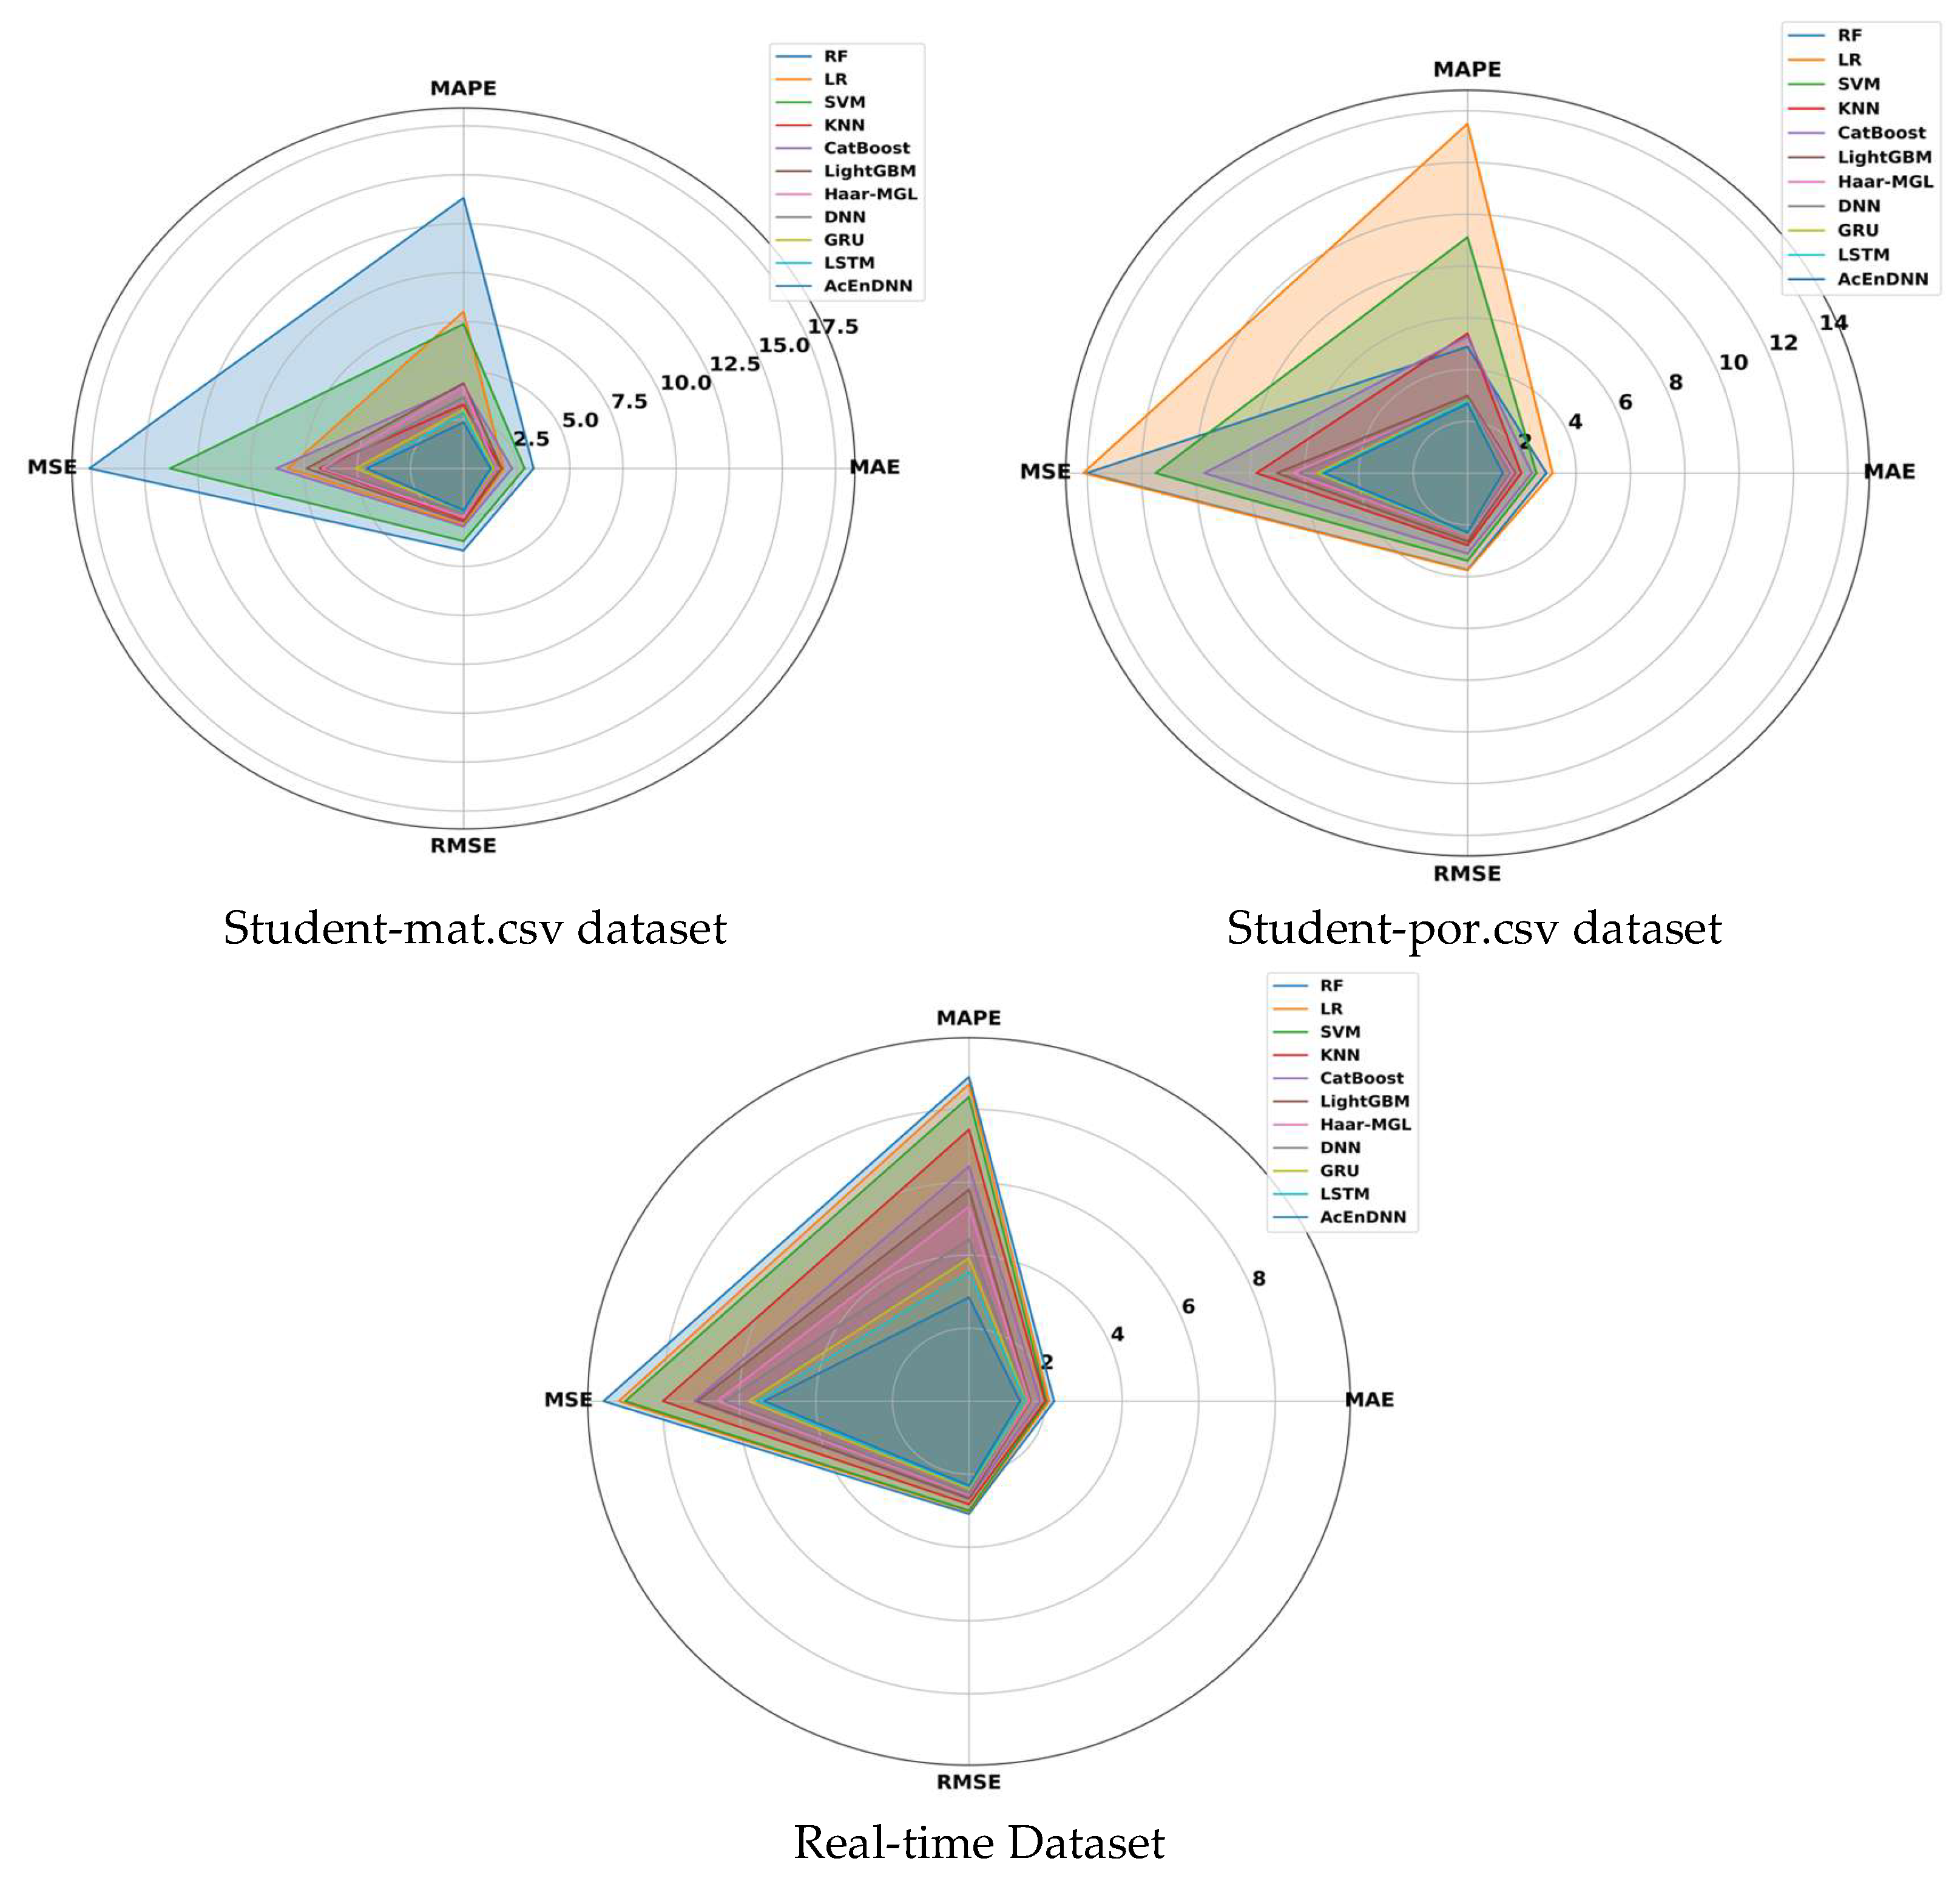
Figure 17 illustrates a visual representation of the performance of the proposed AcEnDNN model compared with other existing models based on the Student-mat.csv dataset, Student-por.csv dataset, and real-time dataset. Further, every axis in the spider plot denotes the performance metrics MSE, MAPE, MAE, and RMSE. The spider plots visualize the best performance of the model utilized for early student performance prediction. More specifically, the proposed AcEnDNN model achieved a minimum error rate in MAE of 1.28, MAPE of 2.36, MSE of 4.55, and RMSE of 2.13 using the Student-mat.csv dataset based on 90% training, confirming its robustness in modeling nonlinear relationships within student data.

5.14. Computational Complexity

The computational complexity of the proposed AcEnDNN model explains the total computation time taken for student performance prediction compared with other existing models. Figure 18 demonstrates the computational complexity of the proposed model for numerous iterations. The proposed AcEnDNN model utilized a shorter computation time of 228.4 s at the 100th epoch compared with other existing models, which enabled high-speed computation with minimum errors. The execution times required for the existing models, such as RF with 232.77 s, LR with 229.12 s, SVM with 229.28 s, KNN with 229.92 s, Cat Boost with 230 s, LightGBM with 231.7 s, Haar-MGL with 231.93 s, DNN with 232.04 s, GRU with 232.42 s, and LSTM with 232.62 s, are longer than that of the proposed AcEnDNN model.

6. Conclusions

This research establishes the AcEn-DNN model for early student performance prediction by integrating ensembled activation functions. The experimental results demonstrate the superior predictive accuracy of the AcEn-DNN model compared with conventional models. By effectively capturing nonlinear patterns, the AcEn-DNN model discharges lower error rates, confirming its robustness and effectiveness in handling diverse student attributes. More particularly, the proposed AcEn-DNN model achieves lower error rates, with an MAE of 1.28, MAPE of 2.36, MSE of 4.55, and RMSE of 2.13 with the Student-mat.csv dataset based on 90% training. In addition, the model gained minimum errors, namely an MSE of 1.28, MAPE of 2.97, MSE of 4.77, and RMSE of 2.18, based on a K-fold value of 10 utilizing the Student-mat.csv dataset. These findings underscore the potential of the AcEn-DNN in facilitating early identification of at-risk students, thereby enabling timely interventions to improve academic outcomes. Despite these promising results, this study has certain limitations, namely the risk of overfitting, the computational demands of the ensemble model, and the extent to which the approach could generalize to other educational settings.
Future research work will focus on exploring hybrid deep learning architectures, such as transformer-based models, with optimization techniques to enhance performance. Further, pruning and quantization would facilitate deployment in real-time educational settings. Finally, incorporating explainability mechanisms within the AcEn-DNN model will enhance its interpretability, ensuring transparency for educators and policymakers in decision-making processes. Overall, by advancing predictive modeling techniques, this research paves the way for more effective student performance assessment and will also help high-risk students with intervention strategies, ultimately contributing to higher educational quality.

Author Contributions

Conceptualization, H.B.N.; methodology, A.B.A.; software, H.B.N.; investigation, A.B.A.; writing—original draft, H.B.N.; visualization, A.B.A.; supervision, A.B.A.; project administration, A.B.A. All authors have read and agreed to the published version of the manuscript.

Funding

This research received no external funding.

Institutional Review Board Statement

Not applicable.

Informed Consent Statement

Not applicable.

Data Availability Statement

The datasets generated and/or analyzed during the current study are available from the following links: https://www.kaggle.com/datasets/larsen0966/student-performance-data-set/data (accessed on 14 March 2024).

Conflicts of Interest

The authors declare no conflicts of interest.

References

  1. Zohair, A.; Mahmoud, L. Prediction of Student’s performance by modelling small dataset size. Int. J. Educ. Technol. High. Educ. 2019, 16, 1–8. [Google Scholar] [CrossRef]
  2. Mengash, H.A. Using data mining techniques to predict student performance to support decision making in university admission systems. IEEE Access 2020, 8, 55462–55470. [Google Scholar] [CrossRef]
  3. Ghorbani, R.; Ghousi, R. Comparing different resampling methods in predicting students’ performance using machine learning techniques. IEEE Access 2020, 8, 67899–67911. [Google Scholar] [CrossRef]
  4. Tomasevic, N.; Gvozdenovic, N.; Vranes, S. An overview and comparison of supervised data mining techniques for student exam performance prediction. Comput. Educ. 2020, 143, 103676. [Google Scholar] [CrossRef]
  5. Lau, E.T.; Sun, L.; Yang, Q. Modelling, prediction and classification of student academic performance using artificial neural networks. SN Appl. Sci. 2019, 1, 982. [Google Scholar] [CrossRef]
  6. Liu, Q.; Huang, Z.; Yin, Y.; Chen, E.; Xiong, H.; Su, Y.; Hu, G. Ekt: Exercise-aware knowledge tracing for student performance prediction. IEEE Trans. Knowl. Data Eng. 2019, 33, 100–115. [Google Scholar] [CrossRef]
  7. Yağcı, M. Educational data mining: Prediction of students’ academic performance using machine learning algorithms. Smart Learn. Environ. 2022, 9, 11. [Google Scholar] [CrossRef]
  8. Aydoğdu, Ş. Predicting student final performance using artificial neural networks in online learning environments. Educ. Inf. Technol. 2020, 25, 1913–1927. [Google Scholar] [CrossRef]
  9. Bisri, A.; Heryatun, Y.; Navira, A. Educational Data Mining Model Using Support Vector Machine for Student Academic Performance Evaluation. J. Educ. Learn. 2025, 19, 478–486. [Google Scholar] [CrossRef]
  10. Ghorbani, R.; Ghousi, R. Predictive data mining approaches in medical diagnosis: A review of some diseases prediction. Int. J. Data Netw. Sci. 2019, 3, 47–70. [Google Scholar] [CrossRef]
  11. Zhou, R.; Wang, Q.; Cao, L.; Xu, J.; Zhu, X.; Xiong, X.; Zhang, H.; Zhong, Y. Dual-Level Viewpoint-Learning for Cross-Domain Vehicle Re-Identification. Electronics 2024, 13, 1823. [Google Scholar] [CrossRef]
  12. Ni, L.; Wang, S.; Zhang, Z.; Li, X.; Zheng, X.; Denny, P.; Liu, J. Enhancing student performance prediction on learnersourced questions with sgnn-llm synergy. Proc. AAAI Conf. Artif. Intell. 2024, 38, 23232–23240. [Google Scholar] [CrossRef]
  13. Adekitan, A.I.; Noma-Osaghae, E. Data mining approach to predicting the performance of first year student in a university using the admission requirements. Educ. Inf. Technol. 2019, 24, 1527–1543. [Google Scholar] [CrossRef]
  14. Fernandes, E.; Holanda, M.; Victorino, M.; Borges, V.; Carvalho, R.; Van Erven, G. Educational data mining: Predictive analysis of academic performance of public school students in the capital of Brazil. J. Bus. Res. 2019, 94, 335–343. [Google Scholar] [CrossRef]
  15. Mai, J.; Wei, F.; He, W.; Huang, H.; Zhu, H. An Explainable Student Performance Prediction Method Based on Dual-Level Progressive Classification Belief Rule Base. Electronics 2024, 13, 4358. [Google Scholar] [CrossRef]
  16. Gao, J.; Chen, M.; Xiang, L.; Xu, C. A comprehensive survey on evidential deep learning and its applications. arXiv 2024, arXiv:2409.04720. [Google Scholar] [CrossRef]
  17. Chen, P.; Lu, Y.; Zheng, V.W.; Pian, Y. Prerequisite-driven deep knowledge tracing. In Proceedings of the 2018 IEEE International Conference on Data Mining, Singapore, 17–20 November 2018; pp. 39–48. [Google Scholar]
  18. Chen, Y.; Liu, Q.; Huang, Z.; Wu, L.; Chen, E.; Wu, R.; Su, Y.; Hu, G. Tracking knowledge proficiency of students with educational priors. In Proceedings of the 2017 ACM on Conference on Information and Knowledge Management, Singapore, 6–10 November 2017; pp. 989–998. [Google Scholar]
  19. Corbett, A.T.; Anderson, J.R. Knowledge tracing: Modeling the acquisition of procedural knowledge. User Model. User-Adapt. Interact. 1994, 4, 253–278. [Google Scholar] [CrossRef]
  20. Cui, P.; Liu, S.; Zhu, W. General knowledge embedded image representation learning. IEEE Trans. Multimed. 2017, 20, 198–207. [Google Scholar] [CrossRef]
  21. Cui, P.; Wang, X.; Pei, J.; Zhu, W. A survey on network embedding. IEEE Trans. Knowl. Data Eng. 2018, 31, 833–852. [Google Scholar] [CrossRef]
  22. Liu, X.; Wu, W.; Hu, Z.; Sun, Y. SCECNet: Self-correction feature enhancement fusion network for remote sensing scene classification. Earth Sci. Inform. 2024, 17, 4555–4573. [Google Scholar] [CrossRef]
  23. Liu, Y.; Ren, Z.; Liu, X.; Wang, X.; Wang, Y.; Wang, H. Research on Multimodal Link Prediction Method Based on Vision Transformer and Convolutional Neural Network. Available online: https://www.researchsquare.com/article/rs-4489200/v1 (accessed on 11 June 2024).
  24. Junejo, N.U.; Huang, Q.; Dong, X.; Wang, C.; Zeb, A.; Humayoo, M.; Zheng, G. SAPPNet: Students’ academic performance prediction during COVID-19 using neural network. Sci. Rep. 2024, 14, 24605. [Google Scholar] [CrossRef] [PubMed]
  25. Junejo, N.U.; Huang, Q.; Dong, X.; Wang, C.; Humayoo, M.; Zheng, G. SLPNet: Student Learning Performance Prediction During the COVID-19 Pandemic via a Deep Neural Network. In Proceedings of the CCF National Conference of Computer Applications, Harbin, China, 15–18 July 2024; pp. 65–75. [Google Scholar]
  26. Baniata, L.H.; Kang, S.; Alsharaiah, M.A.; Baniata, M.H. Advanced deep learning model for predicting the academic performances of students in educational institutions. Appl. Sci. 2024, 14, 1963. [Google Scholar] [CrossRef]
  27. Vives, L.; Cabezas, I.; Vives, J.C.; Reyes, N.G.; Aquino, J.; Cóndor, J.B.; Altamirano, S.F.S. Prediction of students’ academic performance in the programming fundamentals course using long short-term memory neural networks. IEEE Access 2024, 12, 5882–5898. [Google Scholar] [CrossRef]
  28. Sugiarto, H.S.; Tjandra, Y.G. Uncovering University Application Patterns Through Graph Representation Learning 2024. Available online: https://www.researchsquare.com/article/rs-4820733/v1 (accessed on 29 July 2024).
  29. Dataset Description. Available online: https://www.kaggle.com/datasets/larsen0966/student-performance-data-set/data (accessed on 14 March 2024).
  30. Shaban, W.M.; Ashraf, E.; Slama, A.E. SMP-DL: A novel stock market prediction approach based on deep learning for effective trend forecasting. Neural Comput. Appl. 2024, 36, 1849–1873. [Google Scholar] [CrossRef]
  31. Chen, Y.; Wu, Y.; Cheng, M.; Zhu, J.; Meng, Y.; Mu, X. Performance prediction and parameter optimization of alumina-titanium carbide ceramic micro-EDM hole machining process based on XGBoost. Proc. Inst. Mech. Eng. Part L J. Mater. Des. Appl. 2024, 238, 310–319. [Google Scholar] [CrossRef]
  32. Batool, S.; Rashid, J.; Nisar, M.W.; Kim, J.; Mahmood, T.; Hussain, A. A random forest students’ performance prediction (rfspp) model based on students’ demographic features. In Proceedings of the 2021 Mohammad Ali Jinnah University International Conference on Computing (MAJICC), Karachi, Pakistan, 15–17 July 2021; pp. 1–4. [Google Scholar]
  33. Roy, K.; Farid, D.M. An adaptive feature selection algorithm for student performance prediction. IEEE Access 2024, 12, 75577–75598. [Google Scholar] [CrossRef]
  34. Sarwat, S.; Ullah, N.; Sadiq, S.; Saleem, R.; Umer, M.; Eshmawi, A.A.; Mohamed, A.; Ashraf, I. Predicting students’ academic performance with conditional generative adversarial network and deep SVM. Sensors 2022, 22, 4834. [Google Scholar] [CrossRef] [PubMed]
  35. Al-Shehri, H.; Al-Qarni, A.; Al-Saati, L.; Batoaq, A.; Badukhen, H.; Alrashed, S.; Alhiyafi, J.; Olatunji, S.O. Student performance prediction using support vector machine and k-nearest neighbor. In Proceedings of the 2017 IEEE 30th Canadian Conference on Electrical and Computer Engineering (CCECE), Windsor, ON, Canada, 30 April–3 May 2017; pp. 1–4. [Google Scholar]
  36. Tirumanadham, N.K.; Thaiyalnayaki, S.; SriRam, M. Evaluating boosting algorithms for academic performance prediction in E-learning environments. In Proceedings of the 2024 International Conference on Intelligent and Innovative Technologies in Computing, Electrical and Electronics (IITCEE), Bangalore, India, 24–25 January 2024; pp. 1–8. [Google Scholar]
  37. Wang, C.; Chang, L.; Liu, T. Predicting student performance in online learning using a highly efficient gradient boosting decision tree. In Proceedings of the International Conference on Intelligent Information Processing, Qingdao, China, 27–30 May 2022; pp. 508–521. [Google Scholar]
  38. Afzaal, M.; Zia, A.; Nouri, J.; Fors, U. Informative feedback and explainable AI-based recommendations to support students’ self-regulation. Technol. Knowl. Learn. 2024, 29, 331–354. [Google Scholar] [CrossRef]
  39. Li, M.; Zhuang, X.; Bai, L.; Ding, W. Multimodal graph learning based on 3D Haar semi-tight framelet for student engagement prediction. Inf. Fusion 2024, 105, 102224. [Google Scholar] [CrossRef]
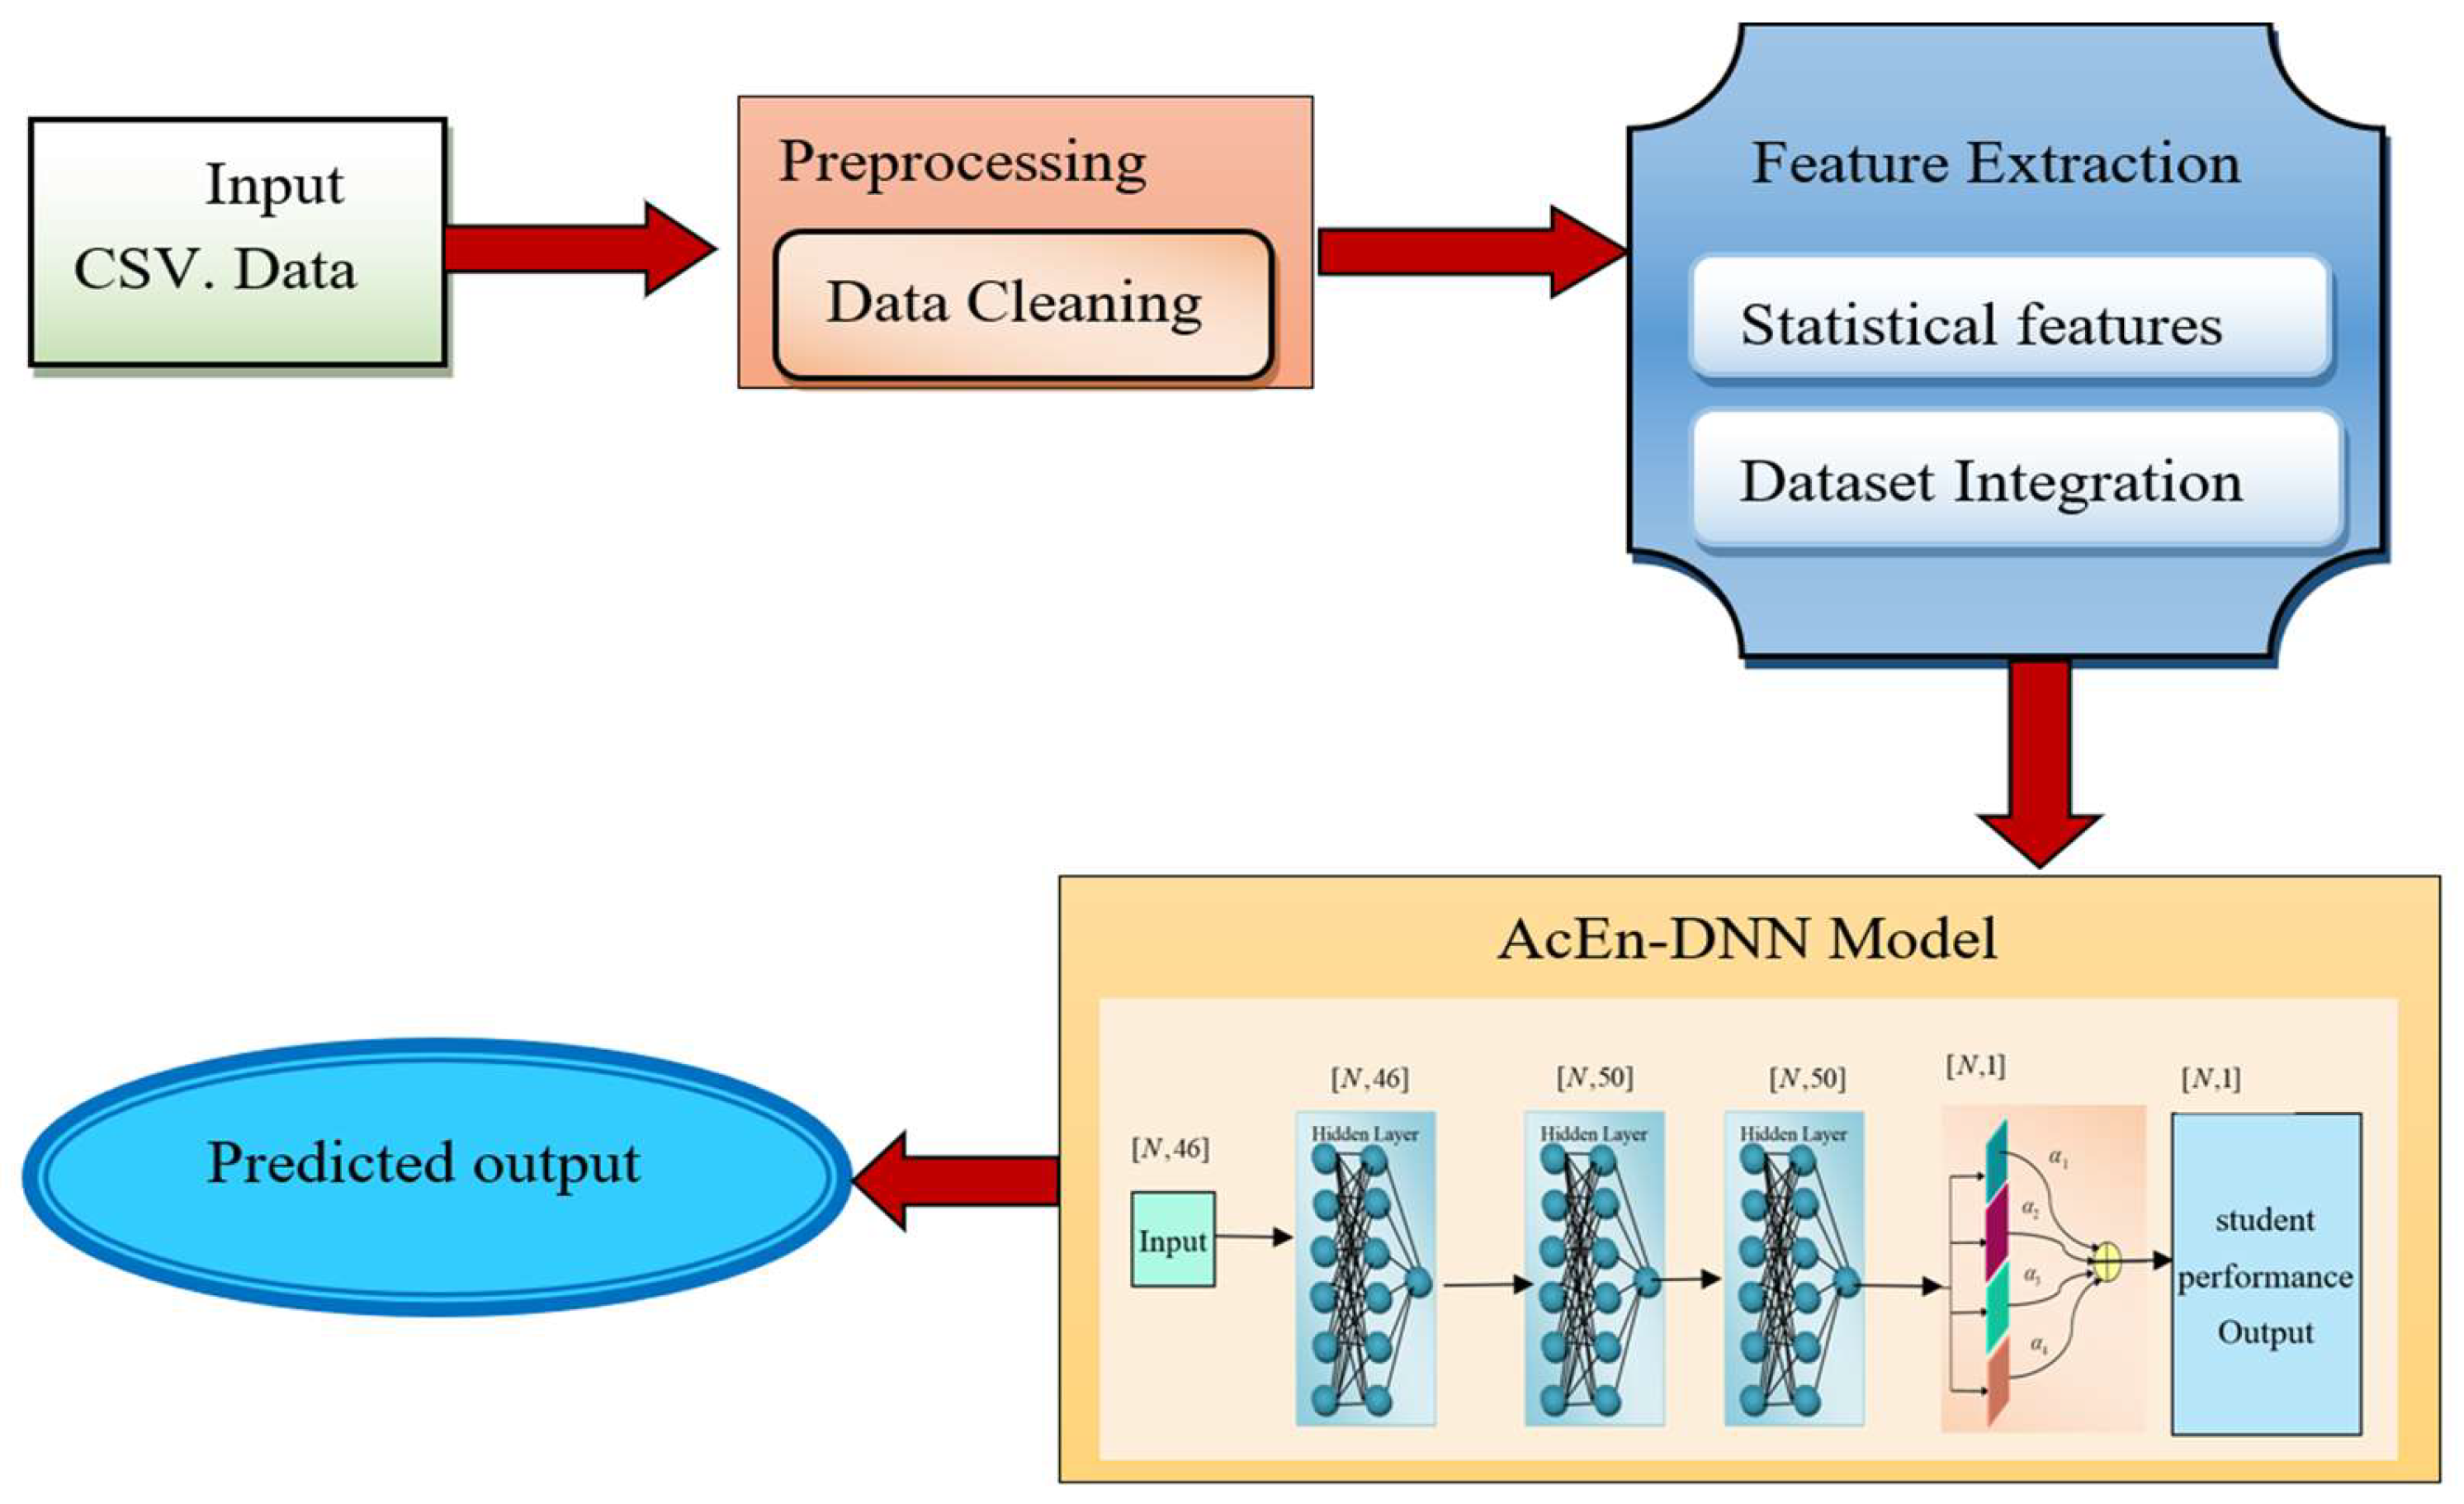
Figure 1. Schematic diagram for early student performance prediction model.
Applsci 15 11411 g001
Figure 2. Architecture of the proposed AcEn-DNN model.
Applsci 15 11411 g002
Figure 3. Flowchart of the proposed AcEn-DNN model.
Applsci 15 11411 g003
Figure 4. Dataset visualization utilized for AcEnDNN model.
Applsci 15 11411 g004
Figure 5. Performance analysis of the AcEn-DNN model using Student-mat.csv dataset.
Applsci 15 11411 g005
Figure 6. Performance analysis of the AcEn-DNN model using Student-por.csv dataset.
Applsci 15 11411 g006
Figure 7. Comparative analysis using the Student-mat.csv dataset based on training percentage.
Applsci 15 11411 g007
Figure 8. Comparative analysis using the Student-por.csv dataset based on training percentage.
Applsci 15 11411 g008
Figure 9. Comparative analysis using a real-time dataset based on training percentage.
Applsci 15 11411 g009
Figure 10. Comparative analysis based on K-fold for Student-mat.csv dataset.
Applsci 15 11411 g010
Figure 11. Comparative analysis based on K-fold using Student-por.csv dataset.
Applsci 15 11411 g011
Figure 12. Comparative analysis based on K-fold using the real-time dataset.
Applsci 15 11411 g012
Figure 13. Ablation study.
Applsci 15 11411 g013
Figure 14. Correlation matrix.
Applsci 15 11411 g014aApplsci 15 11411 g014b
Figure 15. Sensitivity analysis of the AcEnDNN model based on the activation function.
Applsci 15 11411 g015aApplsci 15 11411 g015b
Figure 16. Training and validation loss curve.
Applsci 15 11411 g016
Figure 17. Spider plot analysis for AcEnDNN model.
Applsci 15 11411 g017
Figure 18. Computational complexity.
Applsci 15 11411 g018
Table 1. Comparison of the related literature works.
Sl.NoAuthorMethodAdvantage DisadvantageAchievement
1.Ramin Ghorbani and Rouzbeh Ghousi [3]Machine Learning ModelsThe models perform better when dealing with fewer classes and nominal features.The models obtain poor performance due to single classifiers.Median-69.56
Sum of Ranks-37
2.Nikola Tomasevic et al. [4]Supervised Data Mining TechniqueThe model demonstrates high accuracy in making these predictions.The model suffers from profiling, which can arise from improper application.F1-0.94
RMSE-14.59
3.E. T. Lau et al. [5]Artificial Neural NetworkThe model performs with better accuracy in this prediction.According to gender, the model performs poorly in the classification of students.Accuracy-84.8%
4.Qi Liu et al. [6]Exercise-aware Knowledge Tracing (EKT)The prediction accuracy is enhanced by including an attention mechanism.However, the model found that predicting student performance still faced challenges due to the cold start problem.MAE-0.32
RMSE-0.41
5.Hanan Abdullah’s [2]ANNPopular data mining techniques are utilized to generate four prediction models.However, input variables such as pre-admission tests are
rarely used to predict student performance
Accuracy-79%
6.Lubna Mahmoud Abu Zohair [1]KNNThe model achieves better accuracy by using a small dataset.However, the model faces challenges in computational complexity.Accuracy-72%
7. Mustafa Yagci [7]ML AlgorithmsThe predictions are made using the parameters of midterm grades, department data, and faculty data.The model faces challenges in overfitting.Accuracy-75%
8.Seyhmus Aydogdu [8]ANNThe model could benefit struggling students by giving them a chance to improve.The model suffers from computational issues.Accuracy-80.47%
9.N.U. Rehman Junejo et al. [24]SAPPNetThe model improves educational results in real-time situations.The model has poor resilience and flexibility.Accuracy-93%
10.N.U. Rehman Junejo et al. [25]SLPNetThe model predicts students who are at risk of dropping out early and helps to improve their academic scores.The model obtains computational complexity.Accuracy-89%
Table 2. Comparative discussion of the AcEnDNN model.
Model/MetricRFLRSVMKNNCat BoostLightGBMHaar-MGLDNNGRULSTMAcEnDNN
Student-mat.csvTP-90%MAE3.301.902.871.792.281.801.521.461.411.311.28
MAPE13.838.017.383.274.254.354.193.633.022.822.36
MSE17.608.2613.816.768.807.386.656.455.084.574.55
RMSE4.202.873.722.602.972.722.512.292.202.192.13
K-fold 10MAE2.492.142.142.091.561.531.511.491.461.311.28
MAPE8.358.007.746.586.156.105.495.423.423.302.97
MSE7.657.196.546.526.226.105.985.665.244.814.77
RMSE2.772.682.562.552.492.472.452.382.292.192.18
Student-por.csvTP-90%MAE2.93.132.541.982.371.751.681.571.321.31.30
MAPE4.8813.59.115.45.282.992.872.872.812.772.69
MSE14.0214.1511.497.779.697.026.476.175.535.375.28
RMSE3.743.763.392.793.112.652.432.382.362.342.30
K-fold 10MAE2.992.432.181.841.811.671.611.611.571.561.47
MAPE9.348.848.718.156.565.184.604.494.123.722.73
MSE15.539.839.739.358.447.947.567.417.285.755.65
RMSE3.943.143.123.062.912.822.752.722.702.402.38
Real-time datasetTP-90%MAE2.272.111.801.791.761.761.711.661.501.481.47
MAPE13.768.907.165.775.584.974.864.814.324.073.29
MSE8.638.517.787.187.076.886.666.275.855.585.44
RMSE2.942.922.792.682.662.622.582.502.422.362.33
K-fold 10MAE2.672.162.091.861.851.671.661.531.511.441.40
MAPE9.308.608.377.566.694.634.463.253.093.002.91
MSE11.699.499.298.908.748.207.126.626.286.175.70
RMSE3.423.083.052.982.962.862.672.572.512.482.39
Table 3. Statistical analysis of the AcEnDNN model.
DatasetModel/MetricRFLRSVMKNNCat BoostLightGBMHaar-MGLDNNGRULSTMAcEnDNN
Student-mat.csvBestMAE3.303.552.873.423.412.292.222.222.111.981.76
MAPE14.7911.9815.8111.4212.867.197.096.615.655.433.79
MSE17.6017.8013.8117.2517.618.358.358.027.827.246.59
RMSE4.204.223.724.154.202.892.802.712.672.582.57
MeanMAE2.822.862.402.842.832.031.921.841.771.671.55
MAPE9.987.337.565.856.595.995.444.984.303.843.15
MSE13.7513.6110.2813.3113.077.817.586.926.465.745.48
RMSE3.693.653.173.613.592.792.692.562.492.402.34
VarianceMAE0.130.350.170.300.200.030.060.060.060.040.02
MAPE20.795.4415.377.159.210.981.231.120.710.700.24
MSE7.4413.958.1512.2110.080.170.380.280.690.820.58
RMSE0.140.270.210.270.200.010.010.020.030.020.03
Student-por.csvBestMAE3.413.433.423.393.593.553.272.752.662.382.30
MAPE12.6813.5017.5012.7710.6014.9013.9911.668.406.933.89
MSE16.6117.2918.8118.1417.2718.1114.2813.7213.598.418.33
RMSE4.084.164.344.264.164.264.053.953.923.582.89
MeanMAE2.953.033.122.872.702.632.402.202.101.901.84
MAPE7.318.8610.549.328.319.888.807.055.254.793.18
MSE14.2313.7615.1813.4011.9411.9910.449.508.707.176.73
RMSE3.763.683.883.613.443.403.253.213.132.862.58
VarianceMAE0.080.170.110.290.170.510.370.190.220.130.11
MAPE10.796.4524.317.724.2022.0417.349.443.942.740.14
MSE5.149.948.2217.545.9919.5211.637.597.771.251.19
RMSE0.100.200.140.360.110.420.440.440.420.220.04
Real-time datasetBestMAE3.553.543.533.413.373.333.233.063.062.762.68
MAPE17.2416.8816.2216.2115.8615.7415.2015.0014.4714.2713.51
MSE18.6918.3817.7117.4216.9816.0715.8015.6414.9813.7813.65
RMSE4.324.294.214.174.124.013.983.953.873.713.69
MeanMAE2.872.782.702.612.572.522.442.372.272.131.98
MAPE14.8513.3412.0111.2210.8810.5810.149.539.018.567.78
MSE14.5813.8712.9012.5212.2111.0210.6310.229.589.238.42
RMSE3.793.693.563.503.453.283.223.163.063.002.87
VarianceMAE0.250.240.320.270.270.260.230.220.240.200.20
MAPE1.556.6710.9313.3413.6014.3913.0012.8911.8911.5212.23
MSE13.4613.8212.4012.8413.1211.5412.0810.739.627.876.98
RMSE0.260.270.260.280.290.260.280.260.240.210.19
Disclaimer/Publisher’s Note: The statements, opinions and data contained in all publications are solely those of the individual author(s) and contributor(s) and not of MDPI and/or the editor(s). MDPI and/or the editor(s) disclaim responsibility for any injury to people or property resulting from any ideas, methods, instructions or products referred to in the content.