1. Introduction
Many structures in downtown areas are becoming more irregular in shape to provide space flexibility based on varying individual needs, lack of residential land in downtown area, and efficient space. Irregular structures can cause damage to structural elements where responses are amplified due to asymmetry in discontinuous weak layers or in the lateral force-resisting system. Such amplification may lead to partial or total collapse of the structure. Especially in multi-household housing, vertical irregularity often arises when the upper section is a wall-based structure, while the lower section is a pilotis-type structure composed of columns and beams. The asymmetric positioning of walls or columns often results in planar irregularity.
For a structure with vertical or horizontal irregularities or both irregularities, the local demand load or displacement acting on the member may be increased relative to the regular structure, potentially increasing the structure’s vulnerability to earthquakes. In the case of these irregular structures, three-dimensional, bi-directional analysis is required. In accordance with KDS 41 [
1], the Korean building code, when performing three-dimensional dynamic analyses, the input ground motions shall consist of pairs of orthogonal horizontal acceleration time histories, selected from recorded ground motions and scaled to match the design response spectrum over the period range of interest.
Most seismic design provisions, such as those in ASCE 7 [
2], recognize three principal analysis procedures: the equivalent lateral force procedure, the modal response spectrum analysis, and linear or nonlinear response history analyses [
1,
2,
3]. In accordance with the seismic design category, a suitable analysis method should be performed considering dynamic properties and regularities of structures. The use of the equivalent lateral force method is restricted to structures that are considered regular in configuration, located in low seismic design categories, and within specified height limitations. When these criteria are not met, more advanced methods such as response spectrum or time-history analysis must be employed instead. Of the three analysis methods, response history analysis is capable of providing the most precise results. To ensure reliable results from response history analysis (RHA), it is essential to employ accurate analytical models and appropriate ground motion inputs. According to KDS 41 [
1], appropriate ground motions for RHA should be selected and modified based on records from events with similar magnitudes, fault distances, source mechanisms, and site soil conditions to those likely to generate the ground motion intensity level of interest. In cases where suitable recorded ground motions are unavailable, synthetic ground motions may be used as an alternative.
Kalkan and Çelebi [
4] investigated the ASCE 7–10 [
5] ground motion selection method using a 52-story building in Los Angeles and found that it does not guarantee a consistent scaling factor for individual records. Also, nonlinear response history analyses were performed by Reyes and Kalkan [
6] on various single-degree-of-freedom (SDF) systems using ground motions selected and scaled based on the ASCE 7–10 [
5] provisions. The results indicated that this procedure could lead to notable overestimations in structural responses. Jalayer et al. [
7] investigated how the number of ground motions used in nonlinear time history analysis influences the reliability of code-compatible seismic safety assessments. Their findings indicate that using a small set of records—even if spectrum-compatible—can result in substantial variability in predicted demands, thereby highlighting the critical role of ground motion sample size in performance evaluation. Furthermore, Park et al. [
8] have addressed how variability in input ground motions influences seismic fragility curves, underlining the importance of carefully considering ground motion quantity in fragility evaluations.
In recent years, numerous studies have proposed reliable and computationally efficient methods to select ground motions that are consistent with a specified response spectrum [
9,
10,
11,
12]. Identifying a suite of ground motions intended to closely align with a target response spectrum typically requires evaluating all possible combinations from a ground motion database [
9]. This procedure, however, can be computationally demanding, particularly when the database contains many records.
To address this limitation, several studies have proposed more efficient methods and selection strategies that significantly reduce computational demands while still ensuring a good match with the target response spectrum. Mergos and Sextos [
10] developed a multi-objective genetic algorithm to select ground motions that optimize spectral compatibility, intensity, duration, and regional seismic characteristics simultaneously. Their method outperformed traditional approaches by explicitly considering multiple criteria rather than treating some as constraints. However, the computational cost increases significantly with larger ground motion libraries, limiting its practical use for extensive datasets. Alternative methods have been developed to improve the efficiency of ground motion selection by incorporating simulation techniques that account for the target spectrum’s mean, variance, and correlation characteristics [
11,
12,
13,
14]. Nevertheless, due to the reliance on random number generation, simulation-based selection methods yield different ground motion sets in each run, which can lead to variability in the structural response results obtained from RHA.
This study introduces a simple and precise selection method for bi-directional ground motions that aligns with the requirements specified in KDS 41. To validate the proposed method, this study evaluates its effectiveness in satisfying the KDS 41 selection criteria. For this purpose, nonlinear response history analyses were conducted on both regular and irregular multi-degree-of-freedom structural models using the ground motions selected by the proposed method.
2. Overview of Ground Motion Selection Process Based on KDS 41
Chapter 7 of KDS 41 17 00 [
1] outlines specific requirements for the selection and scaling of ground motions used in response history analysis (RHA). To perform RHA, a minimum of 3 recorded or simulated ground motions must be provided as input.
When conducting 3D analyses, each ground motion must consist of two horizontal acceleration components. These components should be taken from recorded earthquake events and must be representative of the seismic characteristics that influence the site-specific earthquake, including magnitude, distance to fault, and source mechanism. In cases where an adequate number of recorded ground motion pairs is unavailable, simulated ground motions that satisfy the selection criteria may be used to supplement the dataset. For each such pair, the square root of the sum of the squares (SRSS) method is used to combine the 5% damped response spectra of the two scaled components. Both components in a pair must be scaled using the same factor. The scaling must ensure that, within the period range of 0.2 Tn to 1.5 Tn seconds, the average SRSS spectrum across all ground motion pairs meets or exceeds the target response spectrum.
Chapter 7 of KDS 41 17 00 [
1] provides guidance on interpreting analysis results. If fewer than 7 ground motion pairs are used, the design response parameters must be taken as the maximum values observed among all motions. However, if 7 or more pairs are used, it is acceptable to use the average of the calculated responses across all ground motions as the design demand.
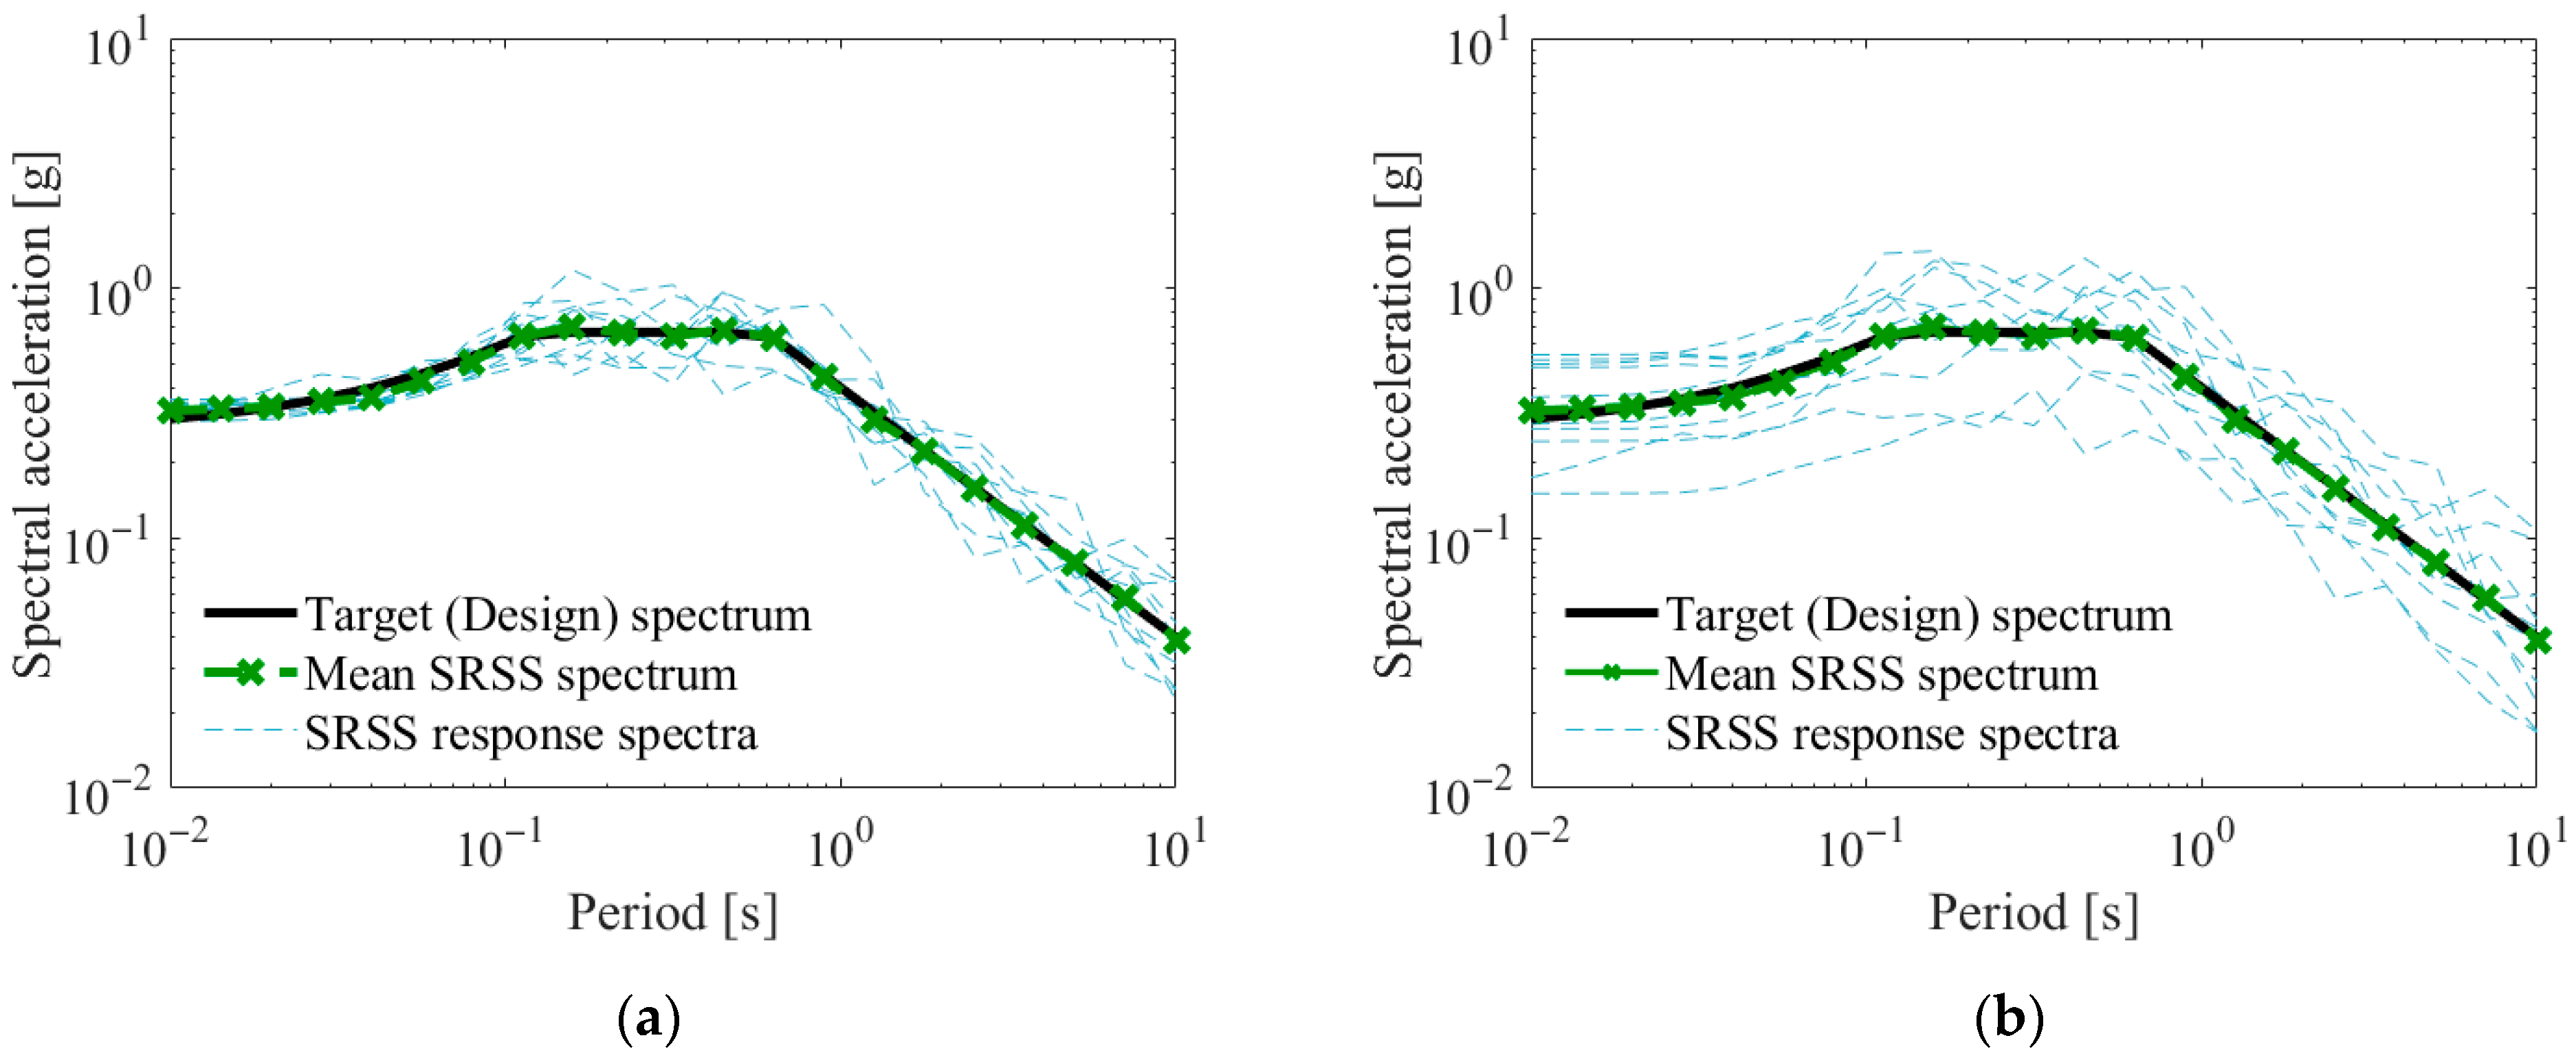
Figure 1 shows the SRSS spectra for each set and their corresponding mean values, derived from two different groups of 7 ground motions. These motions were chosen and adjusted to align with the design response spectrum, following the selection guidelines specified in KDS 41. In this figure, although it is possible to select multiple sets of ground motions—each scaled using different factors—that exhibit similar mean SRSS response spectra matching a specified target spectrum, the level of variability in the individual SRSS spectra can differ significantly depending on the selected motions [
9]. Consequently, under the selection criteria provided by KDS 41, it is not feasible to identify a single, uniquely defined set of ground motions.
3. A Method for Selecting Bi-Directional Ground Motions
Accurate seismic responses from nonlinear time history analysis depend on the use of dependable input ground motions. Several strategies have been developed to assist in identifying suitable input ground motions for analysis [
15]. The most widely adopted approach involves selecting ground motions that align with a specified target mean response spectrum [
16].
The sequential process for developing the selection method for bi-directional ground motions in this study can be summarized as follows.
- (i)
Determine a target response spectrum (Design spectrum, UHS, etc.).
- (ii)
Construct a library and calculate the SRSS spectra for the ground motions.
- (iii)
Scale ground motions in a library.
- (iv)
Select ground motions.
Fewer than 7 ground motions: Sequentially selected bi-directional ground motions that are most similar to the target SRSS response spectrum.
7 or more ground motions: Sequentially selected bi-directional ground motions so that the mean SRSS response spectrum matches the target spectrum.
- (v)
Rescale ground motions so that their mean SRSS response spectrum exceeds the target response spectrum.
3.1. Determine Target Response Spectrum (Design Spectrum, UHS, Etc.)
The target spectrum used for ground motion selection may take various forms, such as the Uniform Hazard Spectrum (UHS) derived from probabilistic seismic hazard [
17,
18,
19,
20], the Conditional Mean Spectrum (CMS) as proposed by Baker [
21], or spectra corresponding to specific scenario earthquakes estimated using empirical ground motion prediction equations [
22,
23,
24].
To collect a ground motion library, a set of 184 ground motions, each consisting of two horizontal components (bi-directional ground motion), was selected from the NGA database [
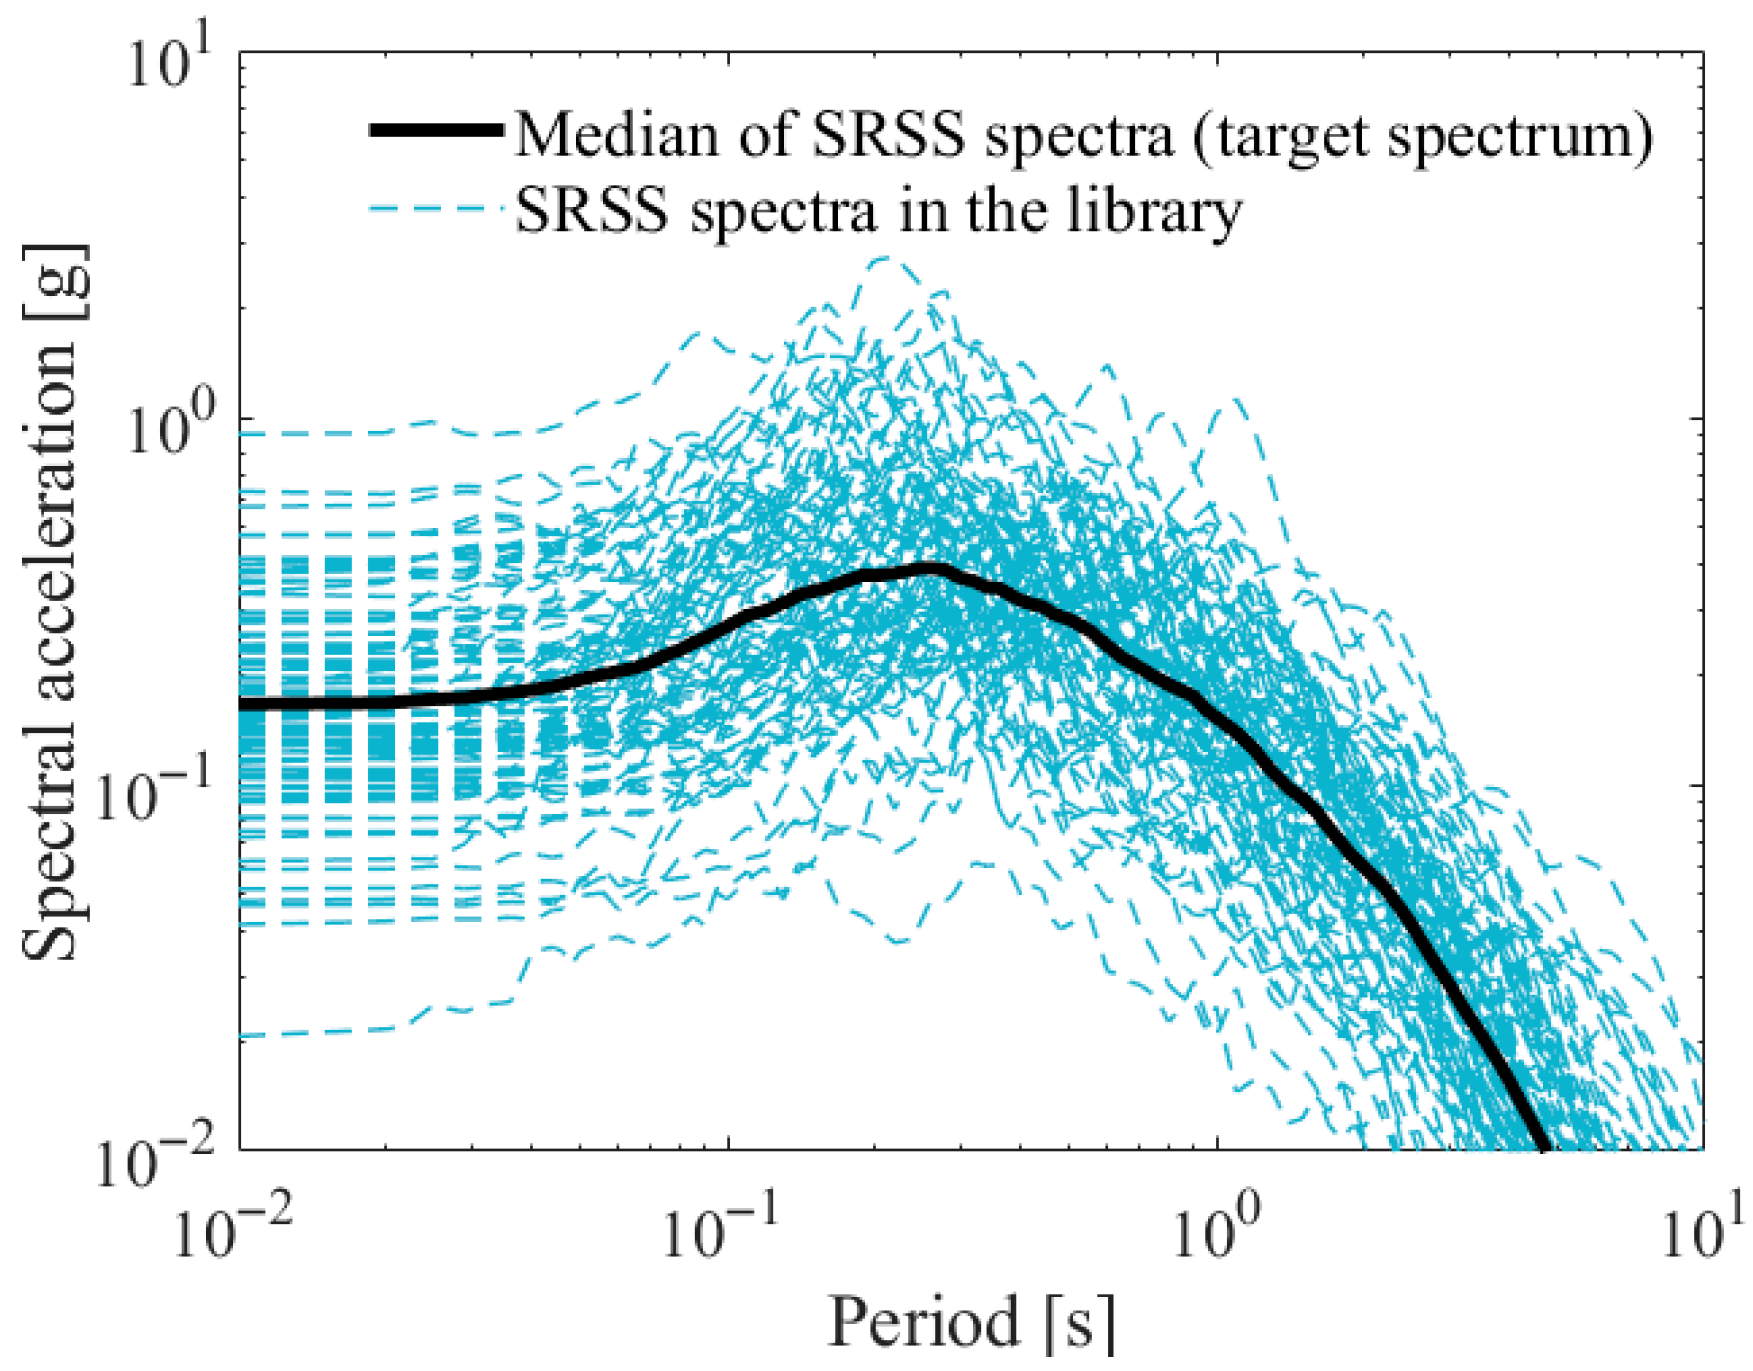
25] based on the following selection criteria. In this study, the median SRSS response spectrum of the compiled bi-directional ground motions is adopted as the target response spectrum.
Magnitude: M = 6.5–6.9;
Joyner–Boore distance: R_JB = 20–30 km;
Source mechanism: Reverse fault;
NEHRP soil type: C or D (V_S30 = 180–360 m/s).
In
Figure 2, the median (target) response spectrum is shown along with the SRSS response spectra of total 184 ground motions in the library. The procedure for constructing the SRSS spectra in this study is described in the following section.
3.2. Constructing Library and Calculating SRSS Spectra
As mentioned earlier, the individual recorded ground motions used for three-dimensional time history analysis must consist of bi-directional (two horizontal acceleration components) ground motions that are selected and appropriately scaled. For this purpose, the SRSS spectra for bi-directional ground motions in the library were calculated and then selected and scaled appropriately to the target spectrum.
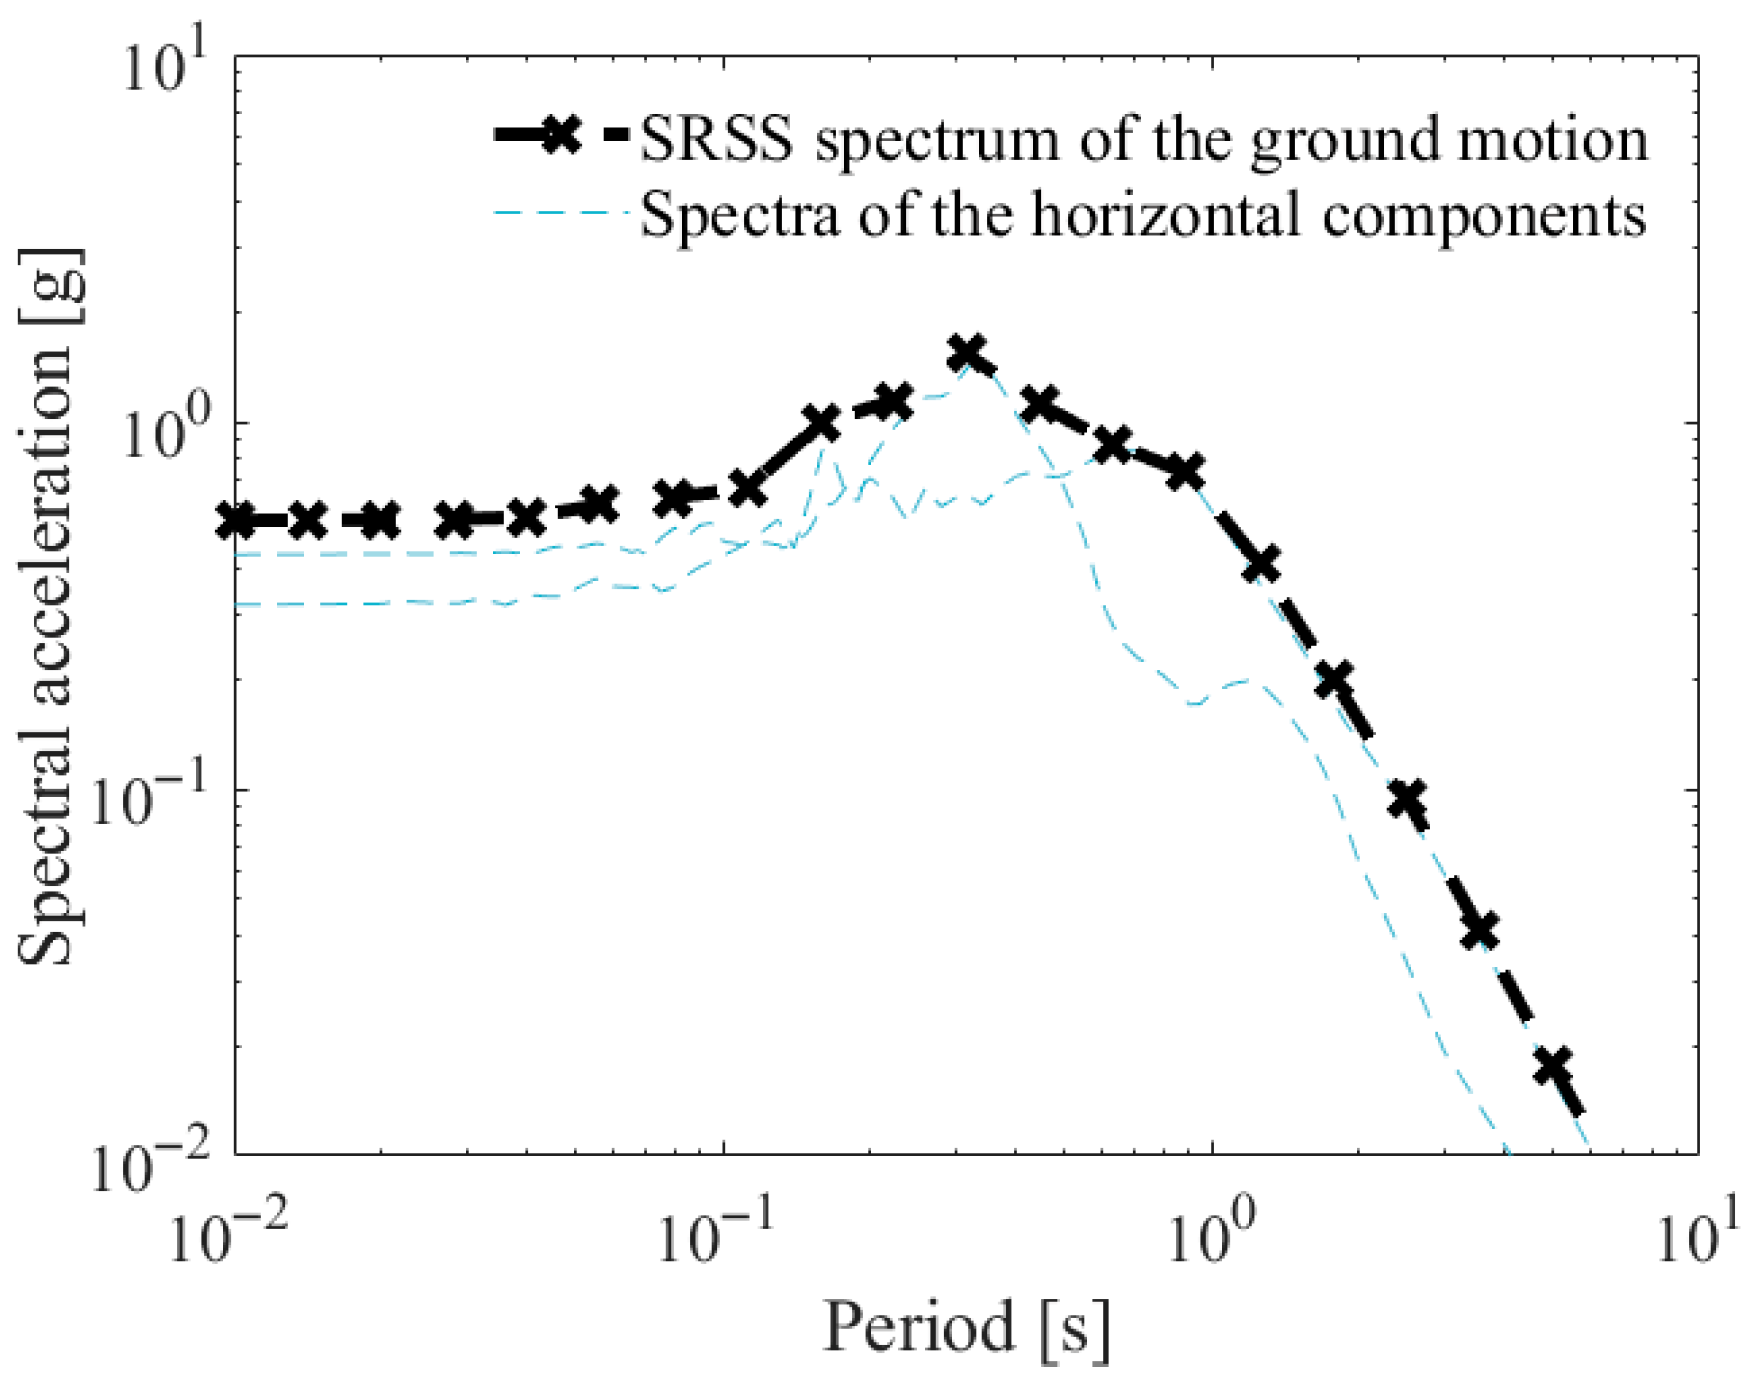
Each ground motion in the library consists of two horizontal components orthogonal to each other and one vertical component ground motion. In this study, for every ground motion in the library, a response spectrum with 5% damping ratio was calculated for each of the two horizontal components. The SRSS spectrum of each ground motion was then calculated using Equation (1).
where
is the SRSS spectrum for the
jth ground motion in the database at period
, and
and
are response spectra of the two horizontal components of the
jth ground motion. In other words, a total of 184 SRSS spectra were constructed using Equation (1) from the library.
Figure 3 shows the two horizontal ground motion response spectra for one ground motion in the library and the SRSS spectrum calculated by Equation (1).
3.3. Adjusting the Amplitude of Ground Motions Within a Library
This study introduces a reliable and numerically efficient method to select ground motions that satisfy the requirements in KDS 41 [
1].
The first step requires scaling all ground motions in the library to match the target response spectrum, a procedure permitted under KDS 41. If the number of available ground motions is large and the size of the ground motion response spectra is similar to the target spectrum, it is possible to select the input ground motion with a response spectrum very close to the target spectrum.
When the scaled ground motion is selected, it is possible to predict the seismic response of the structure more precisely because the variance of the response spectrum is greatly reduced compared to the case where it is not scaled. Therefore, the SRSS response spectra in
Section 3.2 were scaled from the constructed library to fit the target spectrum in
Section 3.1. The appropriate scaling factor (s) for each SRSS response spectrum of ground motions can be determined at once without repeated calculation using the method developed by Ha et al. [
26], by Equations (2) and (3):
where
and
are the logarithmic 5% damped target and sample SRSS response spectra at period
Ti, respectively, and
np is the total number of periods in the defined period range. In this study, the period range of 0.2
Tn to 1.5
Tn was used in accordance with KDS 41.
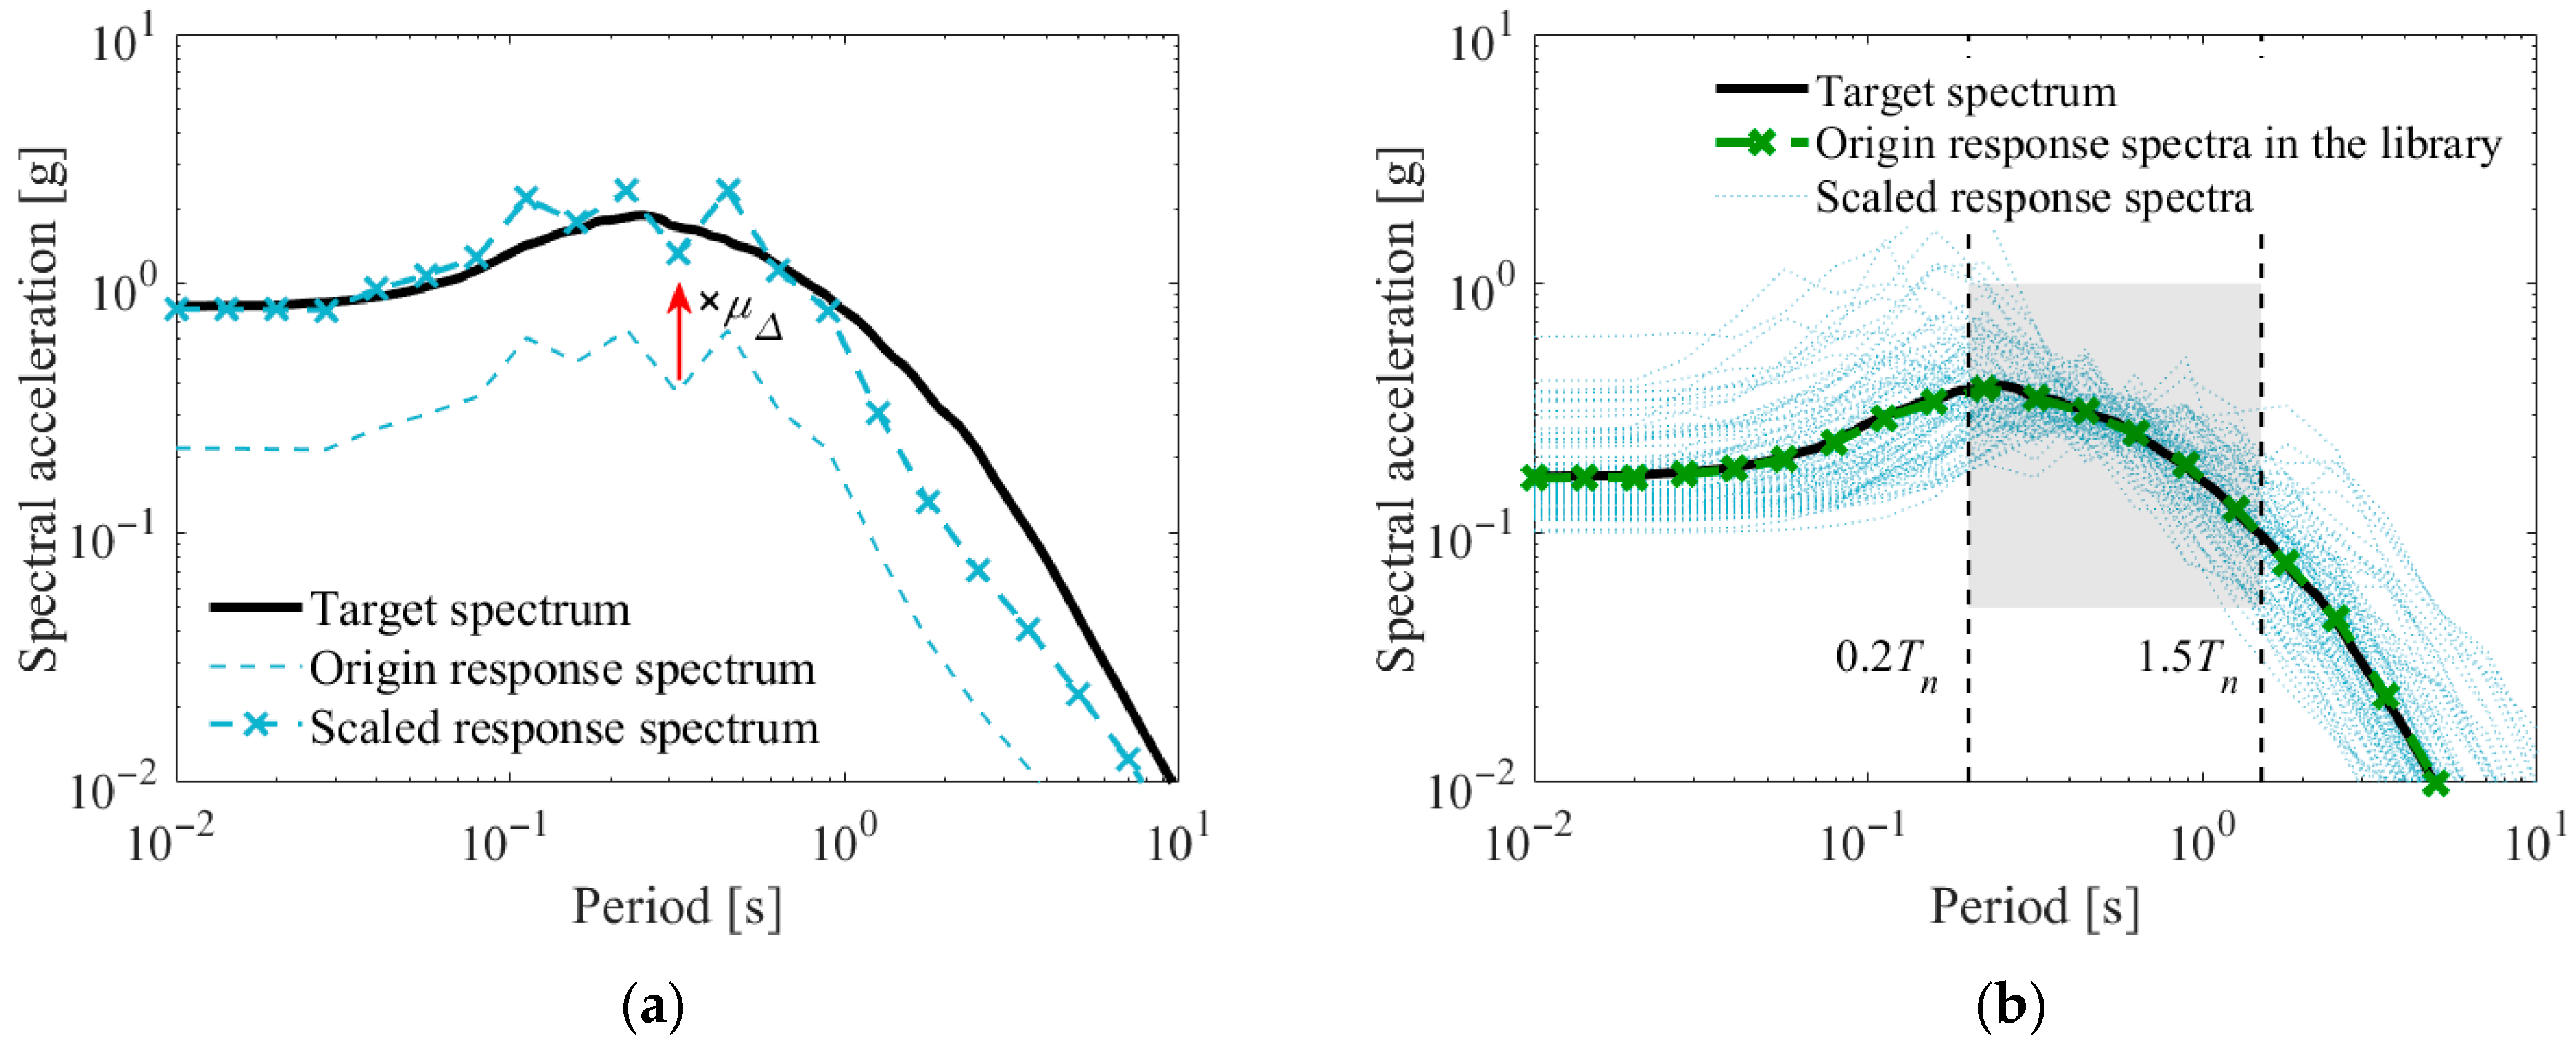
Figure 4a shows the SRSS response spectrum of a ground motion both before and after scaling. For this analysis, the first period of the structure is assumed to be 1.0 s, and a period range of 0.2 s to 1.5 s is used to calculate the scaling factor.
Figure 4b presents the SRSS response spectra for the 184 scaled ground motions. It is apparent that the dispersion in the SRSS response spectra of the scaled ground motions (
Figure 4b) is significantly smaller compared to that of the unscaled ground motions (
Figure 2) within the range of period.
3.4. Approach to Ground Motion Selection When Fewer than 7 Records Are Used
In accordance with KDS 41, when the number of ground motions used in the analysis is greater than 3 but fewer than 7, the seismic response demands must be taken as the maximum values observed across all ground motion records.
In the proposed method, ground motions are chosen from a library of scaled SRSS response spectra of bi-directional ground motions, based on their similarity to the target response spectrum, until the target number of ground motion records has been collected. The degree of fit between the target spectrum and each SRSS response spectrum is quantified by the normalized sum of squared errors (
nSSE), as defined in Equation (4).
where
and
are the logarithmic target and scaled sample SRSS response spectra at a period
Ti, respectively. The ground motion with the lowest
nSSE value is considered to have the best match to the target response spectrum compared to all the other scaled ground motions available in the library.
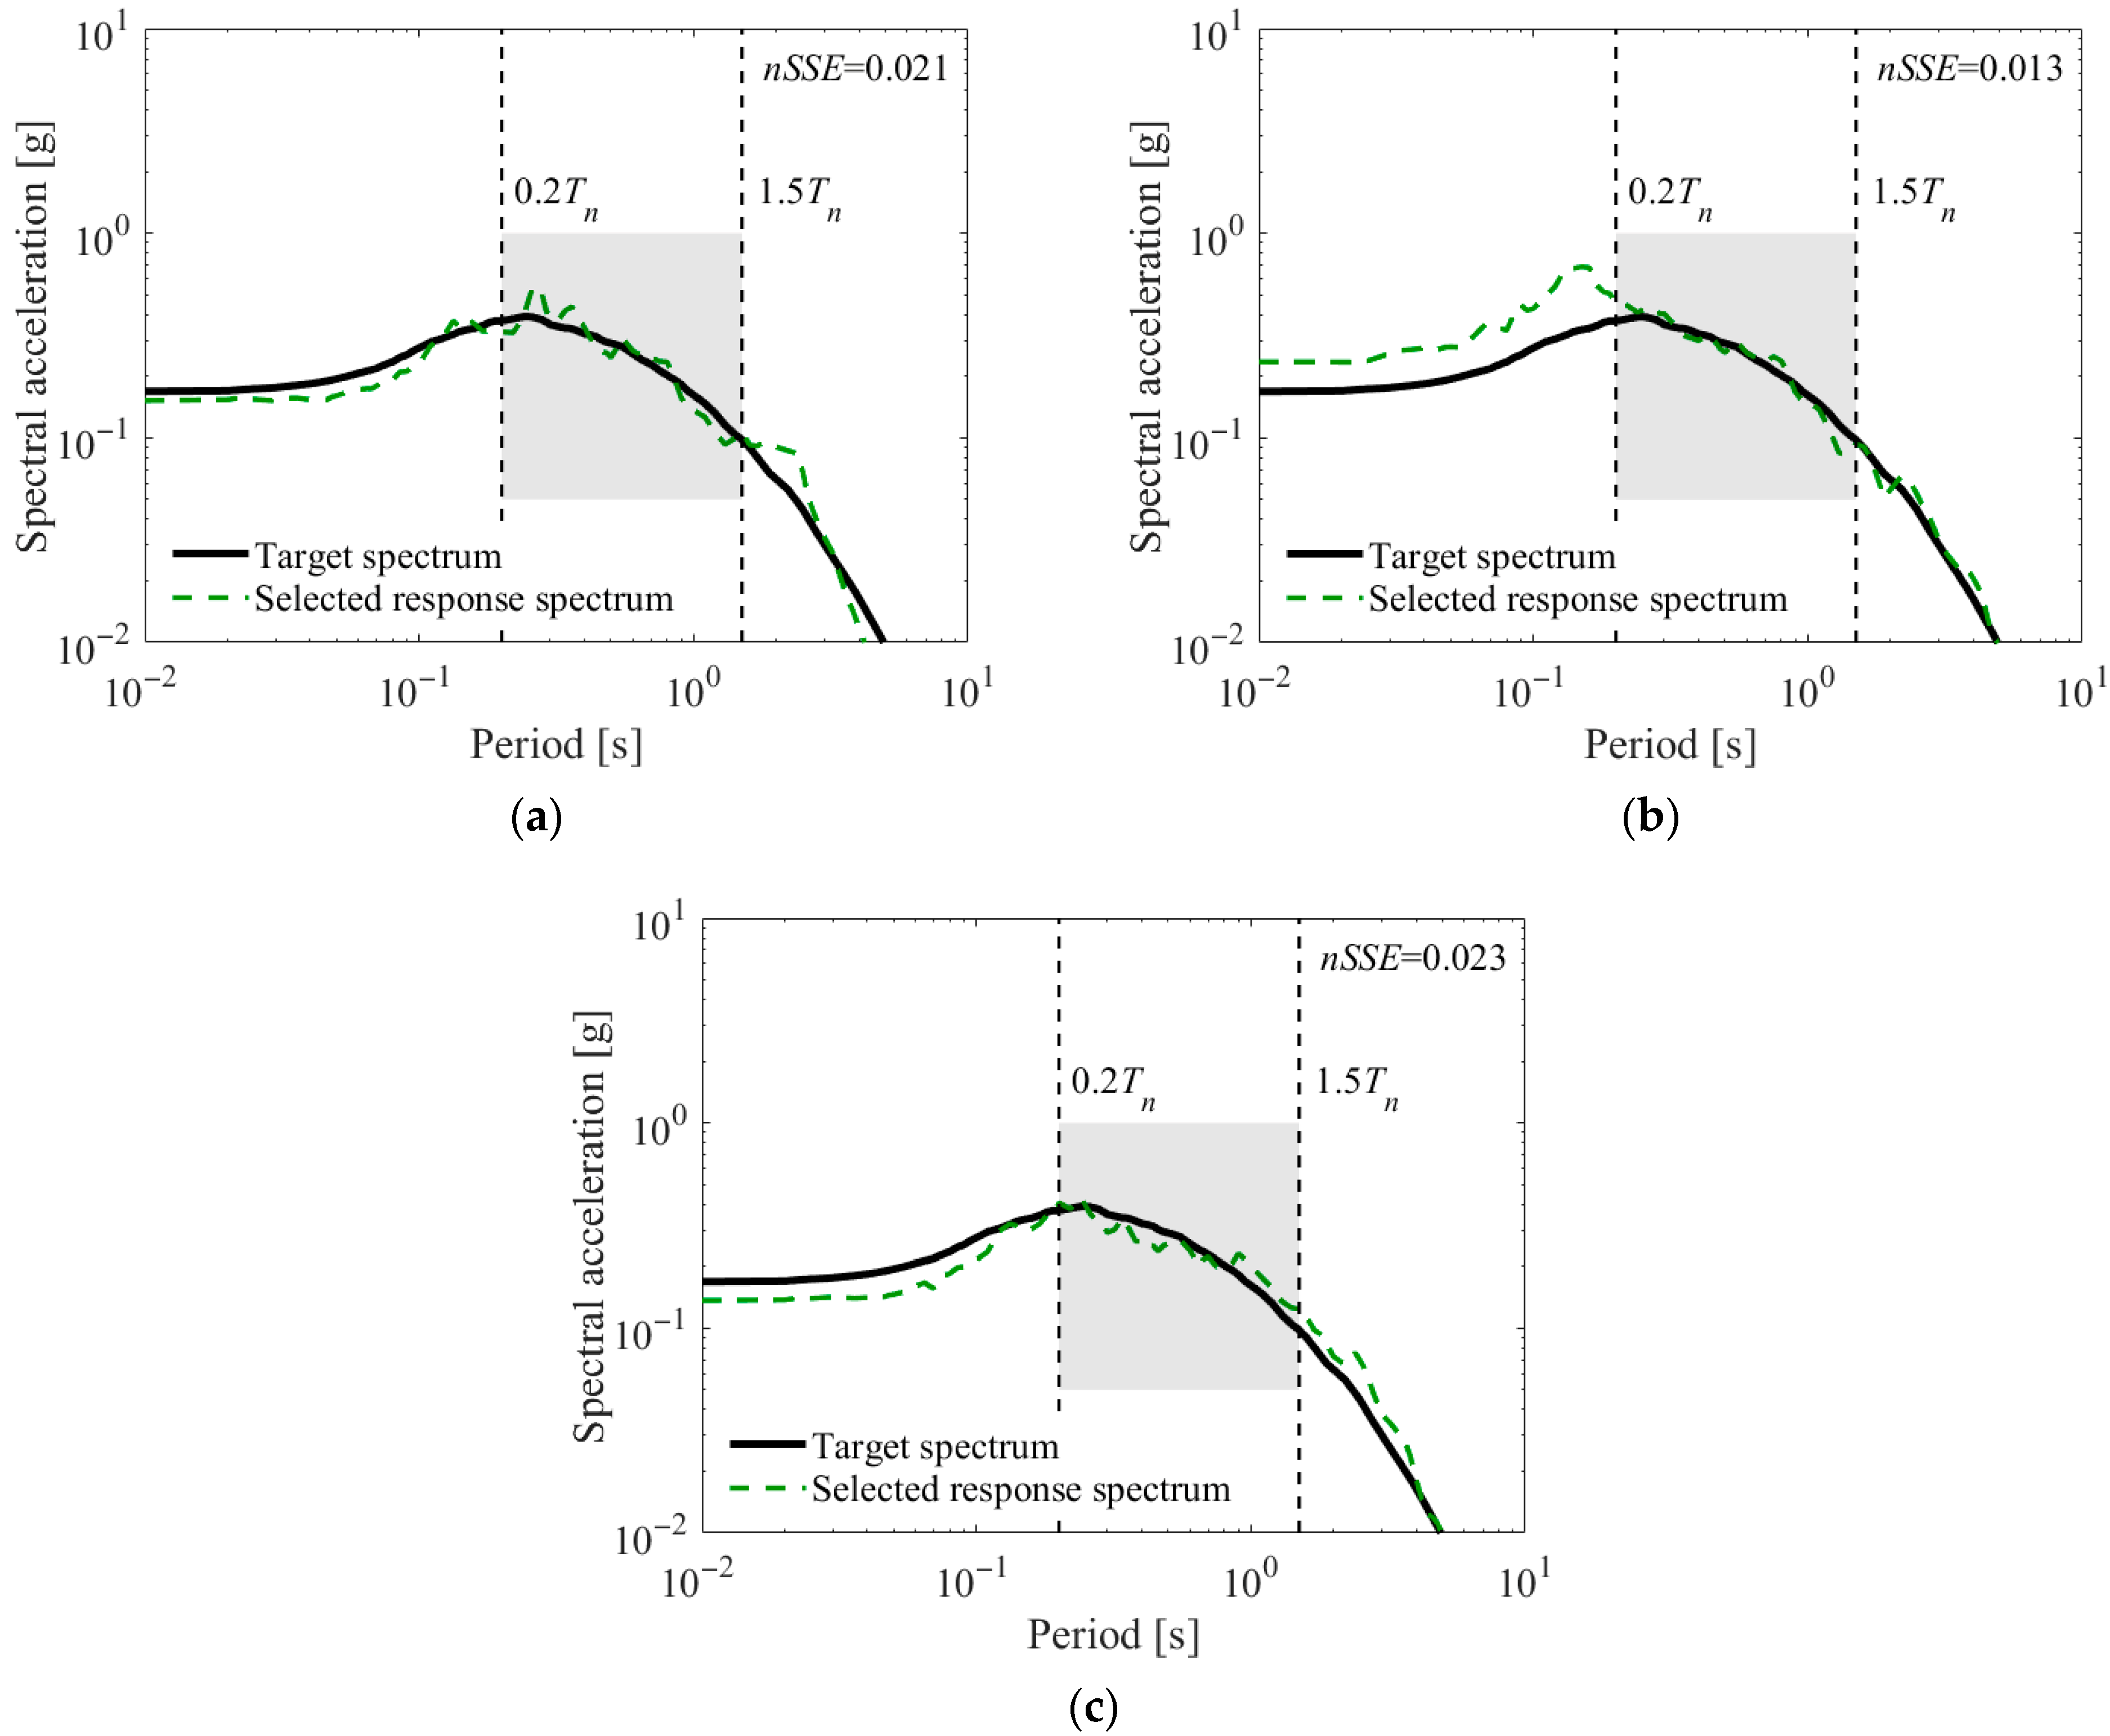
Figure 5 shows the sample response spectra of three different ground motions producing the first three smallest
nSSE among 184 ground motions with a target mean response spectrum. For calculating
nSSE, a period range from 0.2 s (0.2
Tn) to 1.5 s (1.5
Tn) is applied to the structure having
Tn = 1.0 s. The SRSS response spectrum in
Figure 5b has the smallest
nSSE = 0.013 among 184 ground motions. Thus, this SRSS spectrum (composed of bi-directional ground motions) is chosen as the initial selection.
3.5. Approach to Ground Motion Selection When 7 or More Records Are Used
As previously discussed, when a minimum of 7 ground motions is employed in the analysis, it is necessary that the design response demands are determined as the average of the response demands across all selected ground motions [
1]. However, selecting ground motions whose mean SRSS response spectrum aligns with a target response spectrum, is a complex task, given the large number of potential ground motion combinations available in a library. Particularly, when a library contains a large number of ground motions, the computational effort becomes substantial. For instance, selecting 7 ground motions from a library of 184 would require considering a total of 1.3 × 10
12 possible combinations. Ha and Han [
27] also analyzed the computational time of sequential, simulation-based, and combination-based methods, showing that the time required can vary greatly depending on the number of ground motions selected and the size of the library.
To address the computational challenges associated with selecting a set of ground motions that most closely fit a target response spectrum, this study proposes a straightforward yet precise approach for ground motion selection. In this approach, ground motions are sequentially chosen from a library of scaled motions until the desired number of ground motions is selected. The degree of fit between the target and mean SRSS response spectra is evaluated over a period range from 0.2 Tn to 1.5 Tn seconds. The following are the steps for selecting the ground motions.
The first ground motion is chosen from the library based on having the smallest value of nSSE [Equation (4)] among SRSS spectra of ground motions in the library that have already been scaled. Initially, the process follows the same methodology used in cases where fewer than 7 ground motions were selected. As a result, the first ground motion selected in both procedures is identical. As discussed earlier, among the motions in the library, the record with the lowest value is identified as most closely corresponding to the target response spectrum.
Following the selection of the first ground motion, the second or more subsequent ground motion is chosen to ensure that the mean SRSS response spectrum of the selected motions provides the best match to the target response spectrum. This procedure needs to be repeated iteratively until the required number (
ng) of ground motions is selected. To prevent the repetition of previously selected ground motions, the motions chosen in earlier iterations are removed from the library during the selection of the subsequent ground motion. Therefore, the subsequent ground motion is selected from the remaining
nL − (
k − 1) ground motions in the library, where
nL represents the total number of ground motions in the library and
k is a selection step. The degree of fit between the target and mean response spectrum is assessed from the normalized value of
nSSES by Equations (5) and (6):
where
is the
jth ground motion (
j ≤
k) previously selected from the library. To select the
kth ground motion (
k ≥ 2),
nSSES is calculated using Equation (5) with the previously chosen (
k − 1) ground motions and a sample ground motion in a library with
nL − (
k − 1) scaled ground motions. The ground motion generating the smallest
nSSES is the one to be selected as the
kth ground motion.
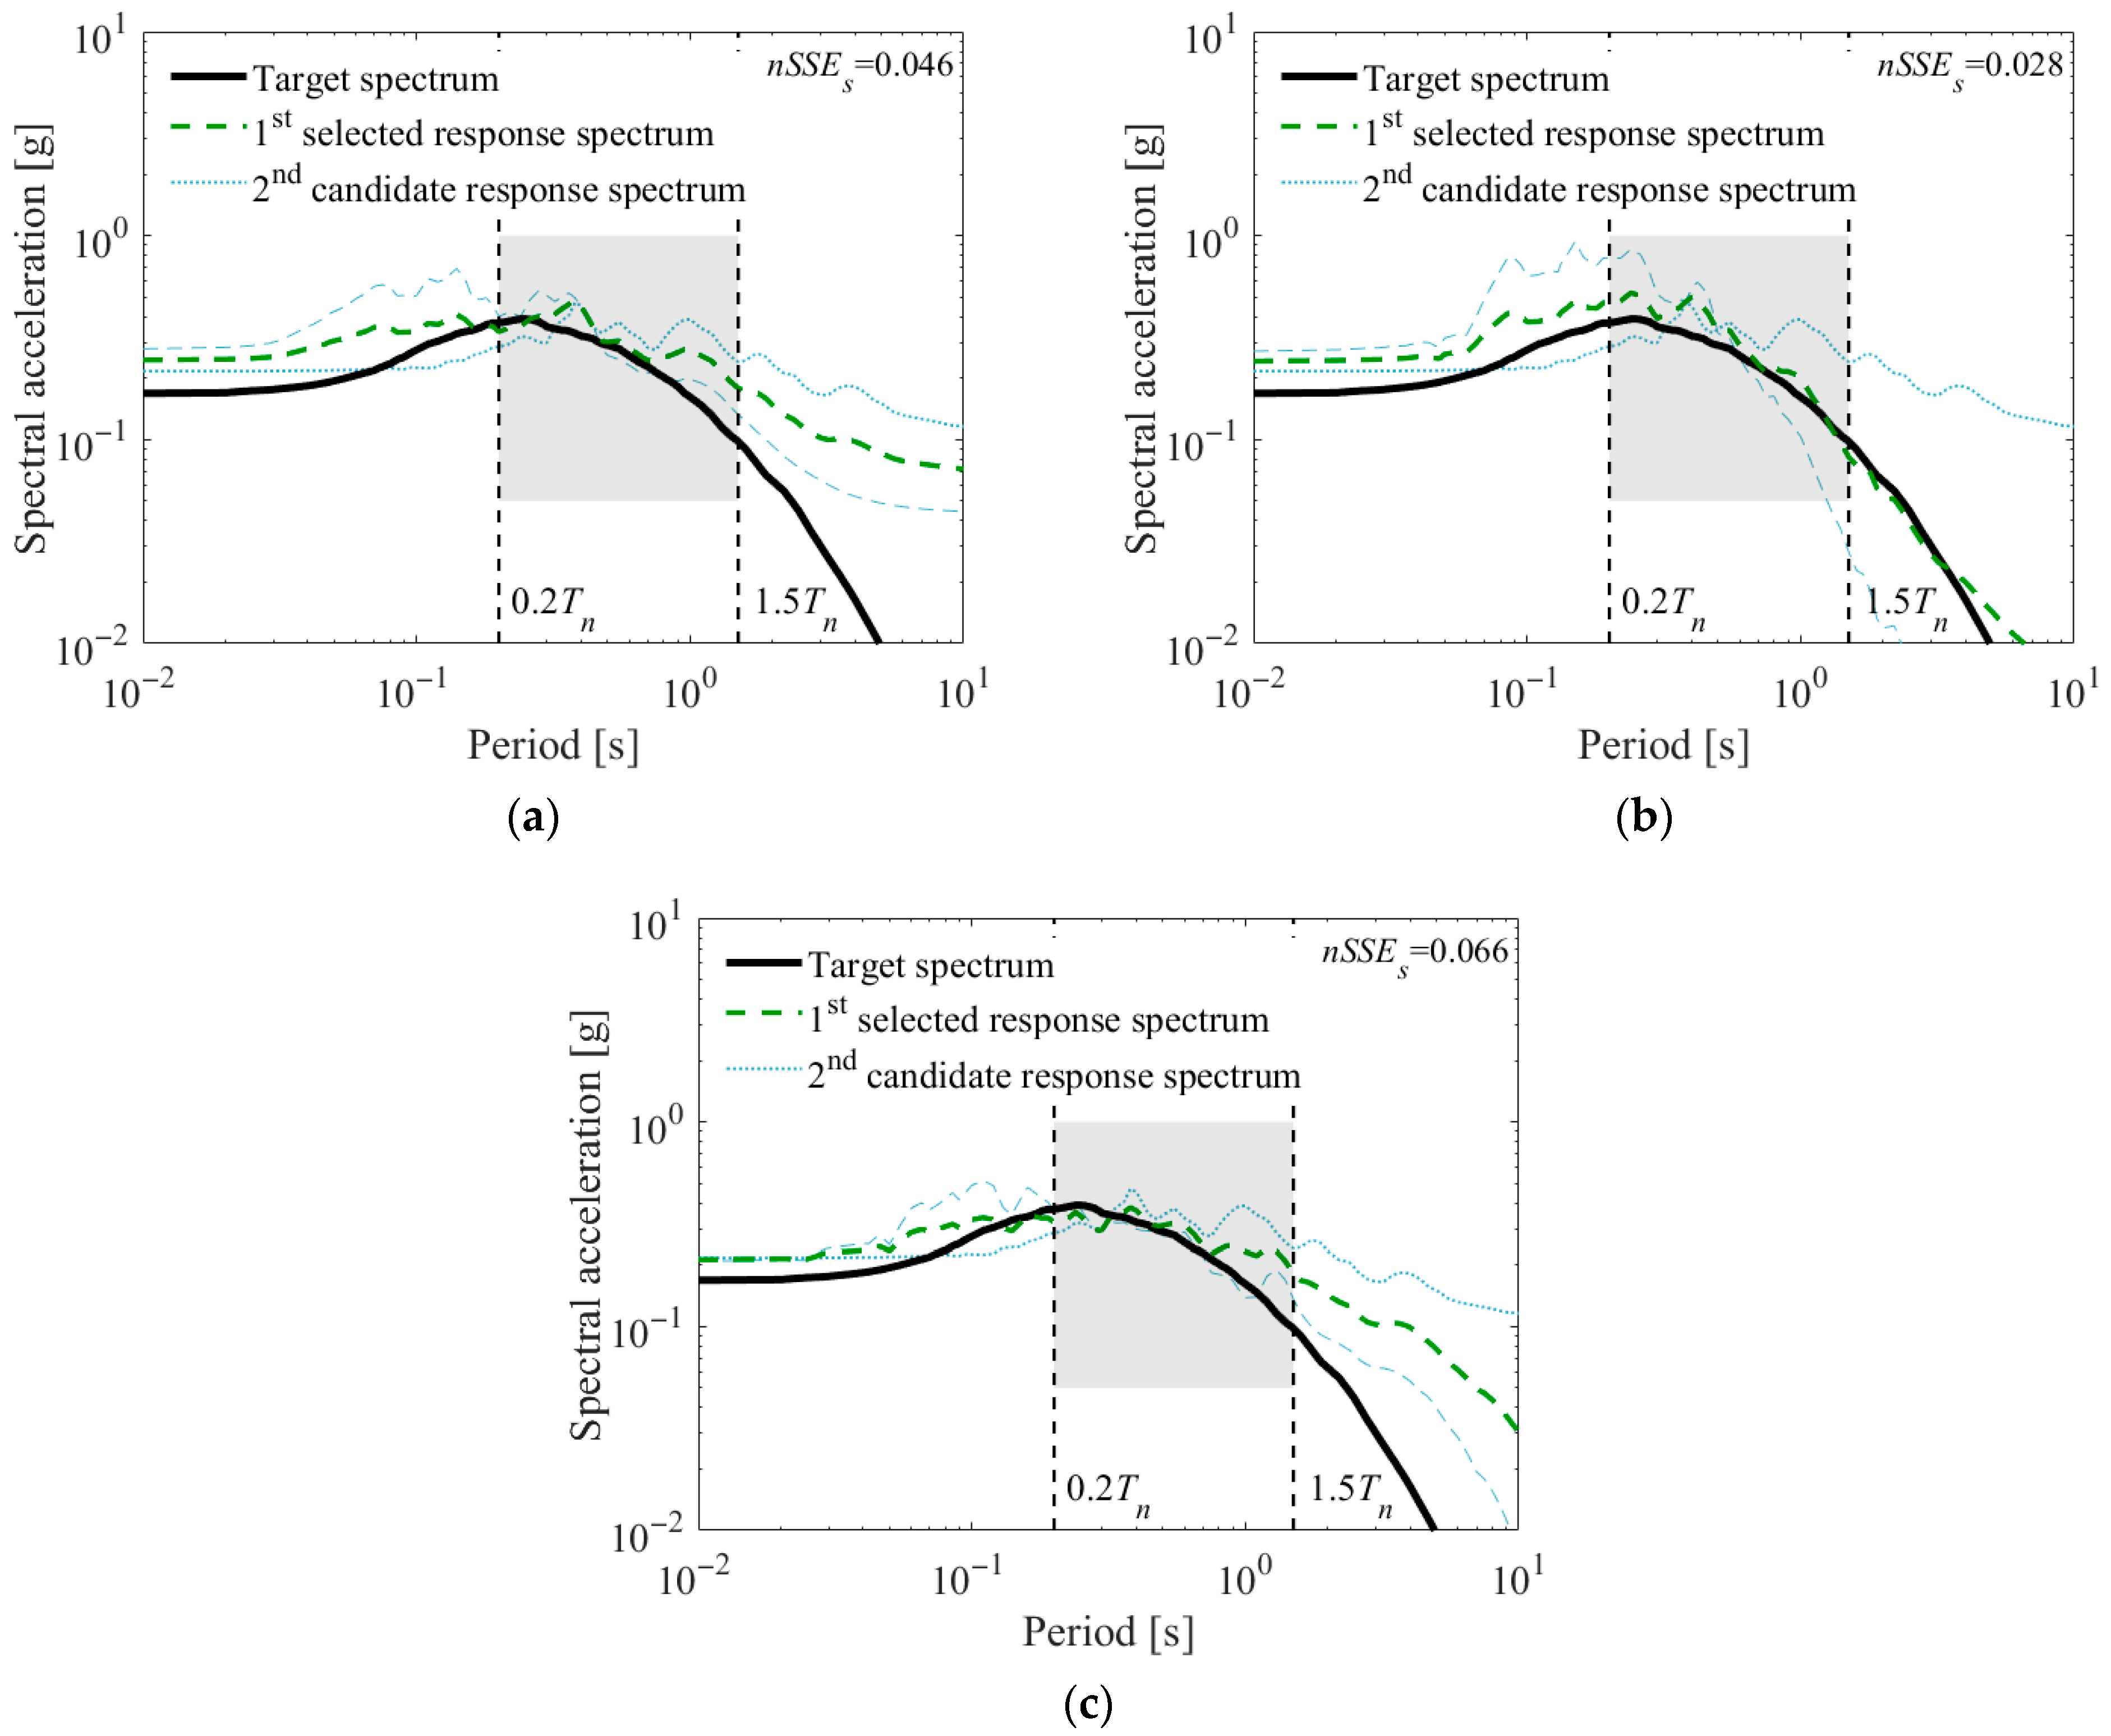
Figure 6 shows the
nSSES of three sample ground motions considered for the second selection on the choice of two ground motions, following the initial selection of the first ground motion. The mean SRSS response spectrum for the two ground motions in
Figure 6b produces the smallest
nSSES (=0.028) among those in
Figure 6. Accordingly, when the three potential ground motions shown in
Figure 6 are evaluated for the selection of the 2nd ground motion, the one presented in
Figure 6b is chosen as the 2nd ground motion.
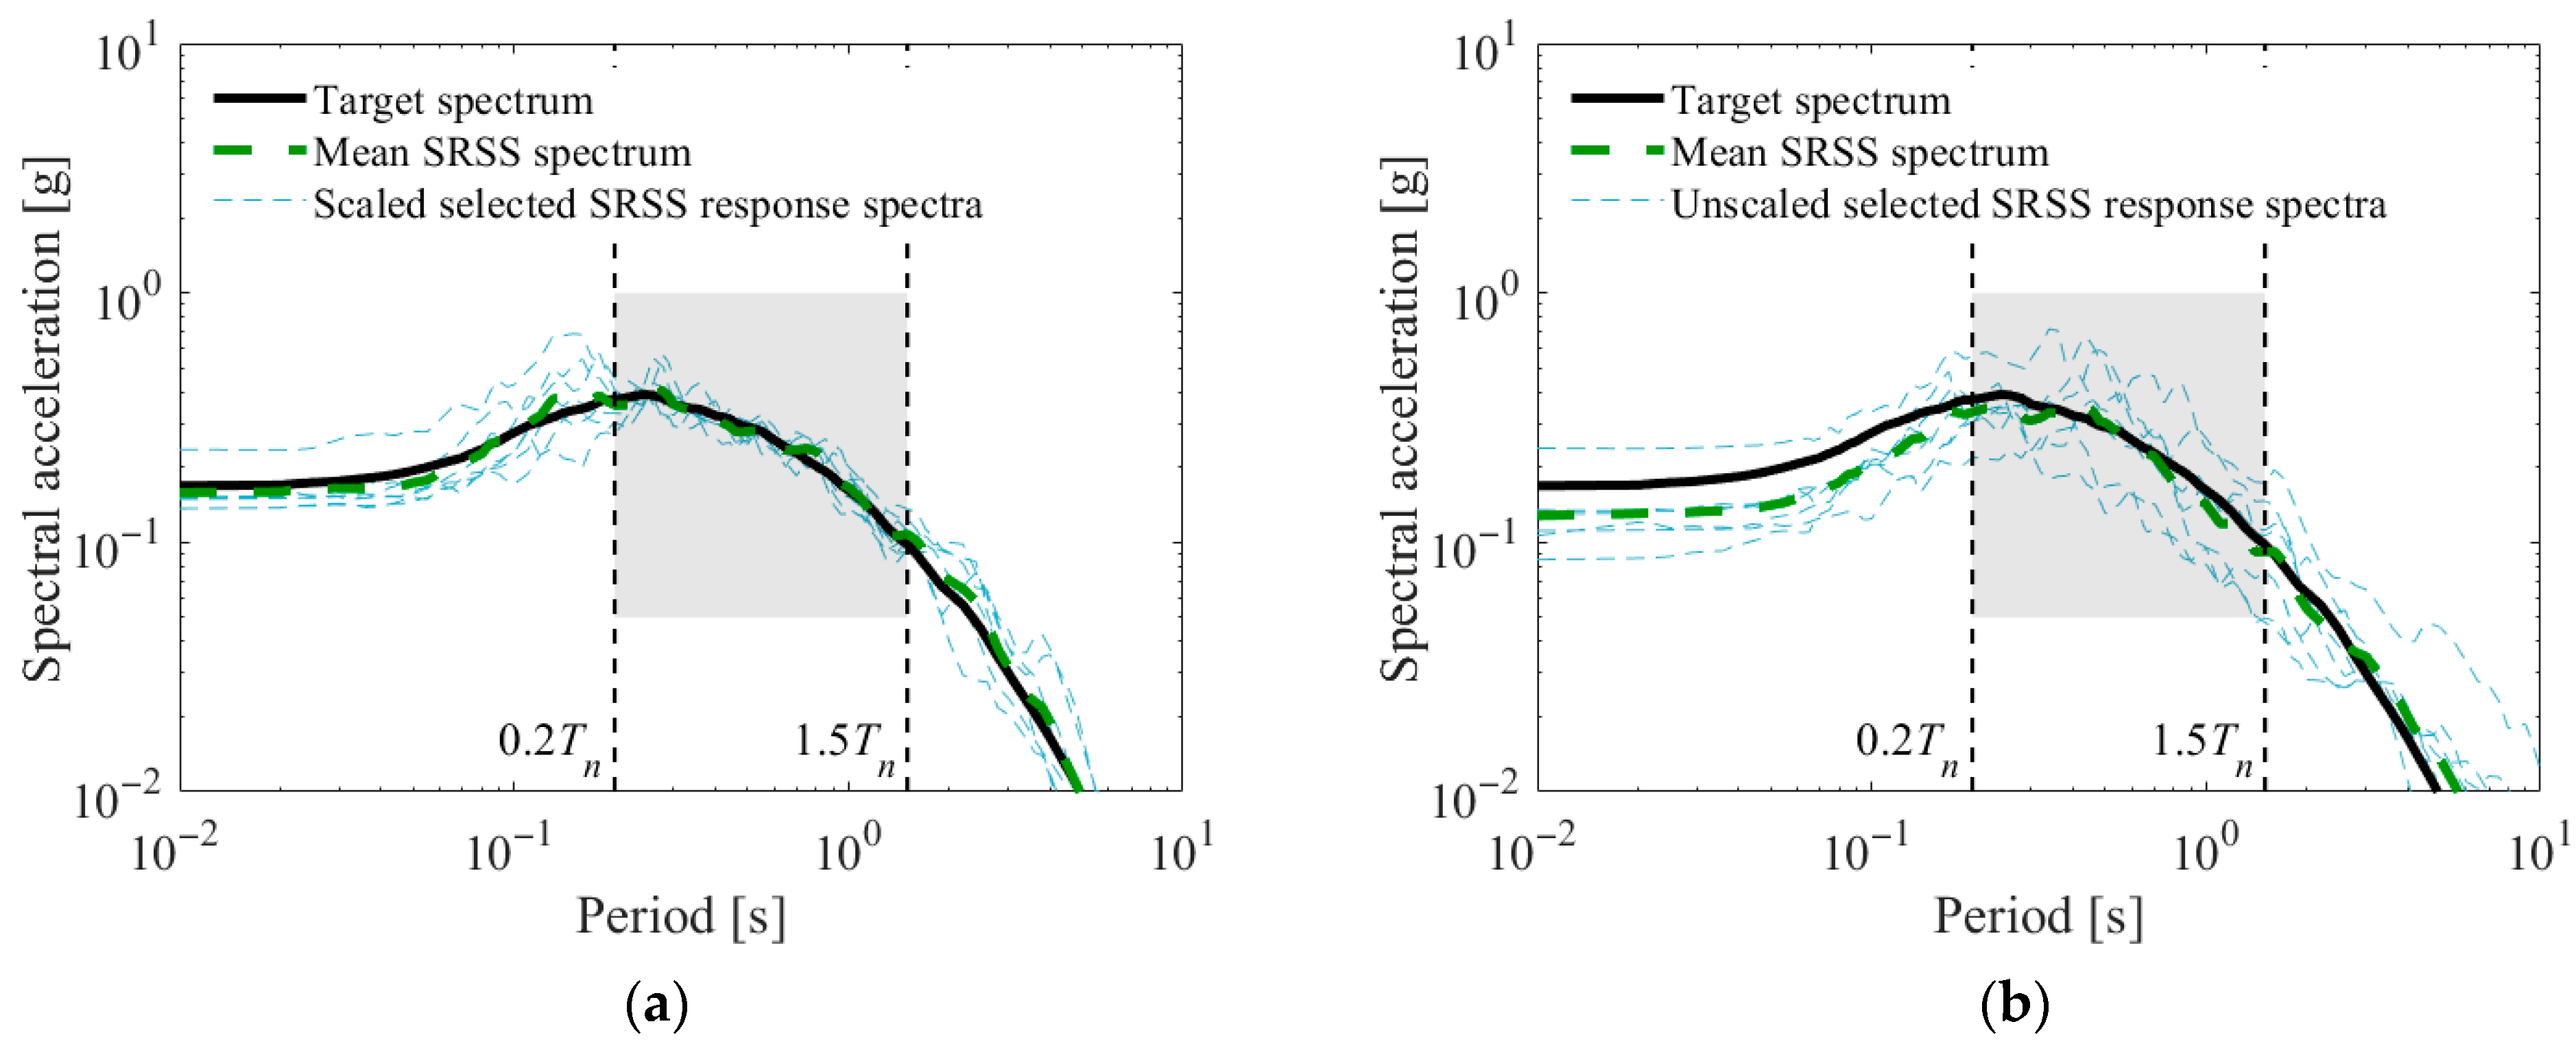
Figure 7 presents the SRSS response spectra of 7 ground motions, with and without scaling, selected using the proposed method from a database of 184 scaled ground motions. The structure’s fundamental period is assumed as 1 s so that the considered period range is from 0.2 s to 1.5 s.
Figure 7a shows that the ground motions chosen from the library of scaled records through the proposed method exhibit a mean SRSS response spectrum closely matches the target spectrum, while their individual SRSS spectra show minimal dispersion.
As depicted in
Figure 7b, the results obtained from a ground motion library without applying scaling are comparable to those found when selecting fewer than 7 motions. However, the absence of scaling contributes to increased uncertainty in the accuracy of the ground motions selection, as shown by pronounced variability in the SRSS response spectra of the selected ground motions.
3.6. Adjustment of Ground Motions for Mean SRSS Spectrum Beyond Target
In accordance with KDS 41, the average SRSS response spectrum of the selected ground motions needs to exceed the target response spectrum within a defined period range. Accordingly, the ground motions initially chosen through the proposed method need to be re-scaled to meet the KDS 41 requirements.
For the calculation of re-scaling factors, the distance (
δi) between the target and mean SRSS response spectra at period
Ti is calculated using Equation (7).
where
is the mean logarithmic 5% damped SRSS response spectra of selected ground motions at period
Ti. The maximum positive
δi [max(
δi)] within a specified period range is used to define the re-scaling factor. If the value of
δi is negative within the specified period range, there is no need to rescale the selected ground motions. Otherwise, the ground motions are adjusted using max(
δi). Therefore, the final scaling factor
sk* for each selected ground motions is determined using Equation (8).
where
sk represents the scaling factor previously applied to the ground motions in the library, as described in the preceding procedure.
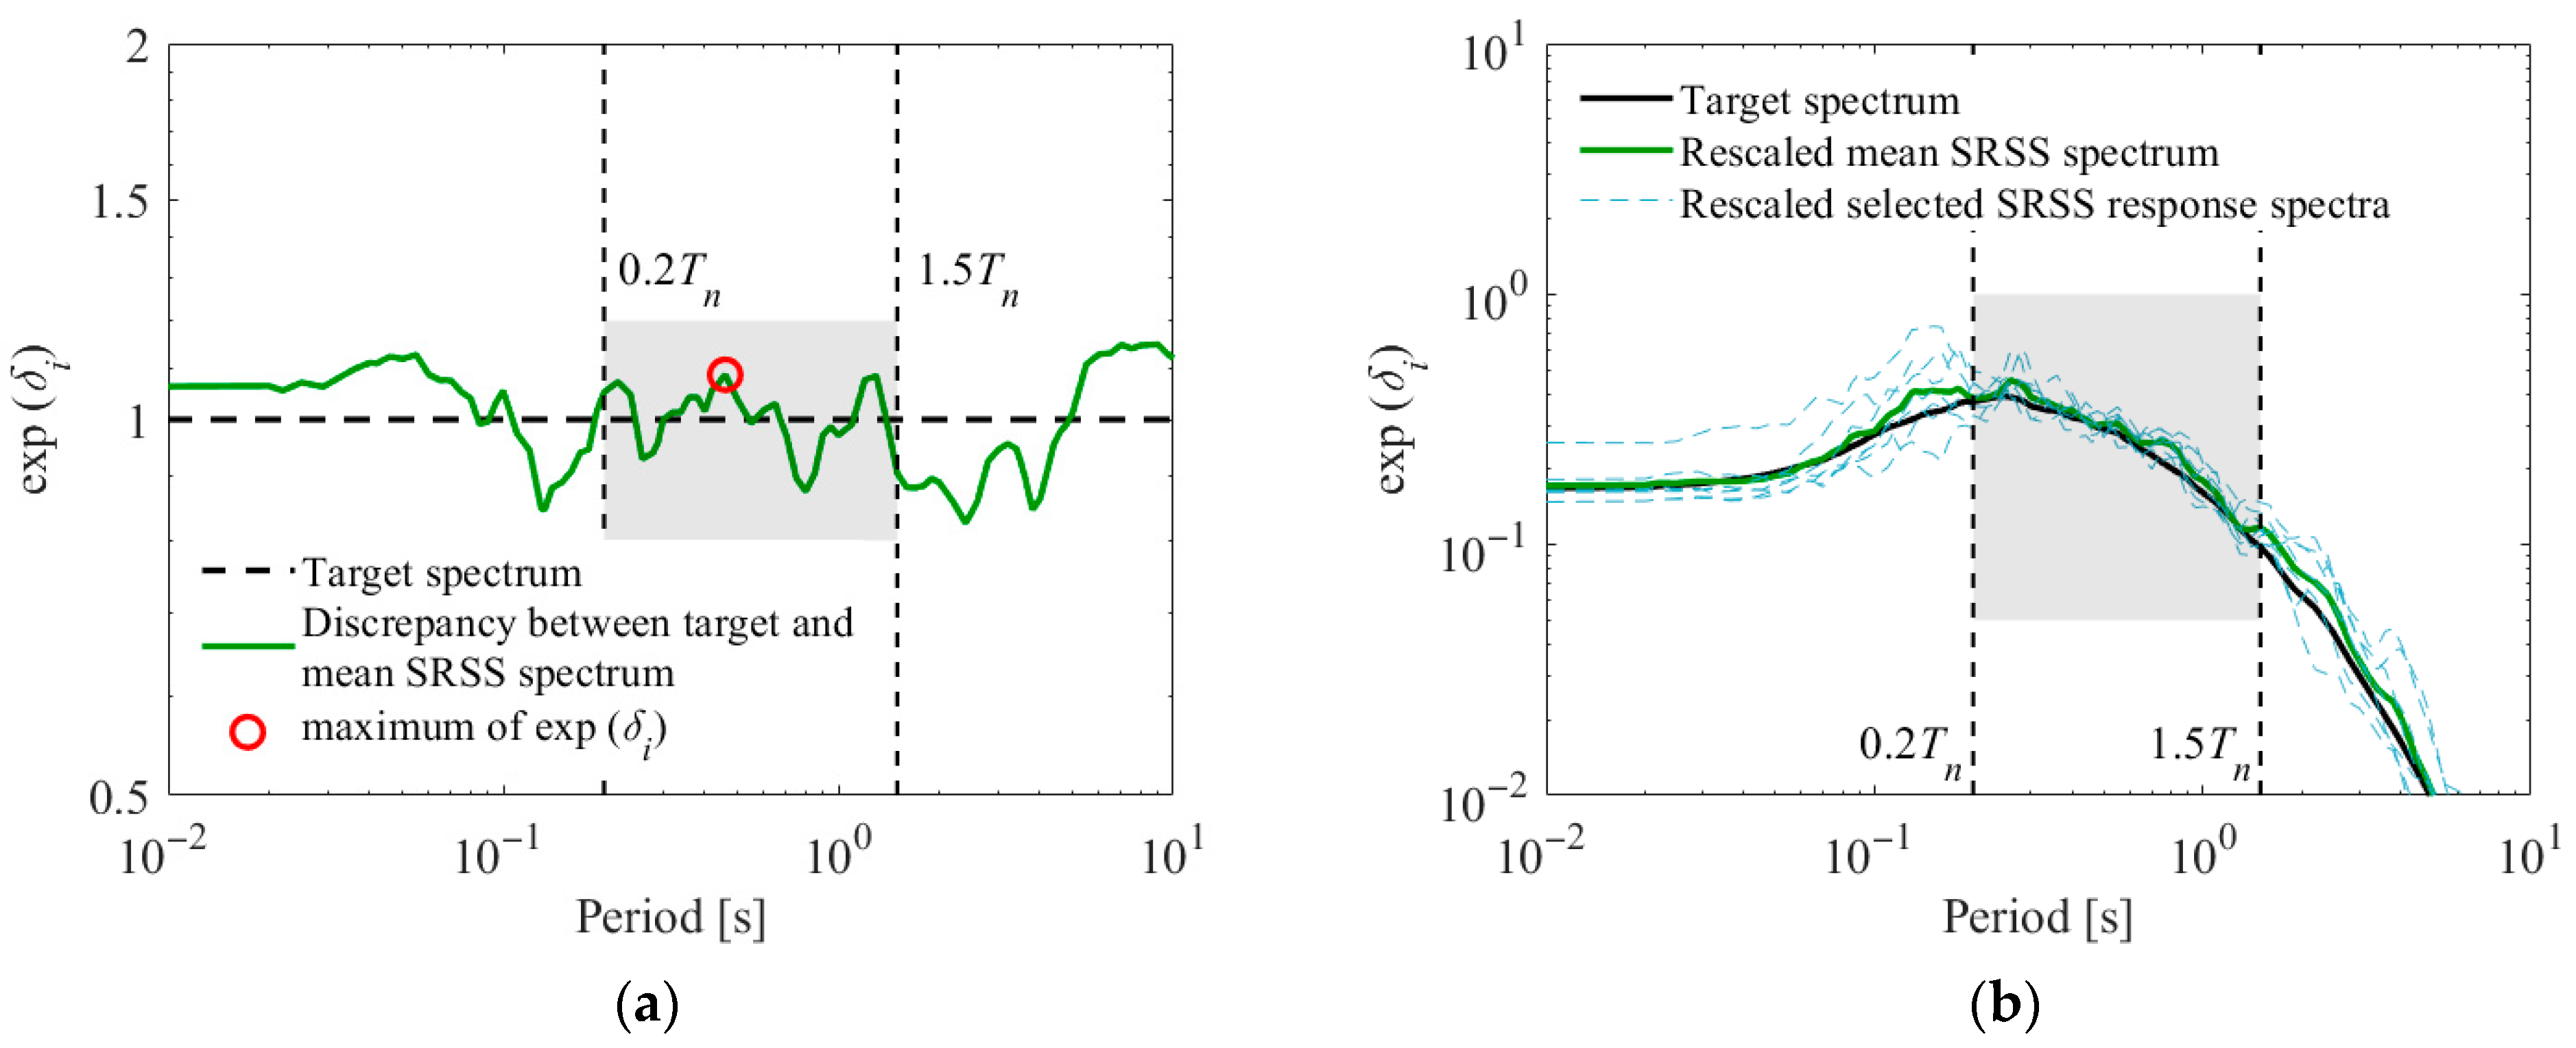
Figure 8a shows
δi and the maximum value of positive
δi (re-scaling factor).
Figure 8b shows the target response spectrum and mean SRSS response spectrum of rescaled ground motions.
4. Verification of KDS 41 Ground Motions Selection Criteria with the Proposed Method
In this study, the KDS 41 selection criteria were evaluated using the proposed method on several MDF systems. Five 3-story steel moment structures, consisting of four torsionally irregular frames and one regular frame, were used as the analytical models. According to KDS 41, a torsional irregular structure is defined as one whose maximum story drift exceeds 1.2 times the average story drift measured at the two ends of the structure.
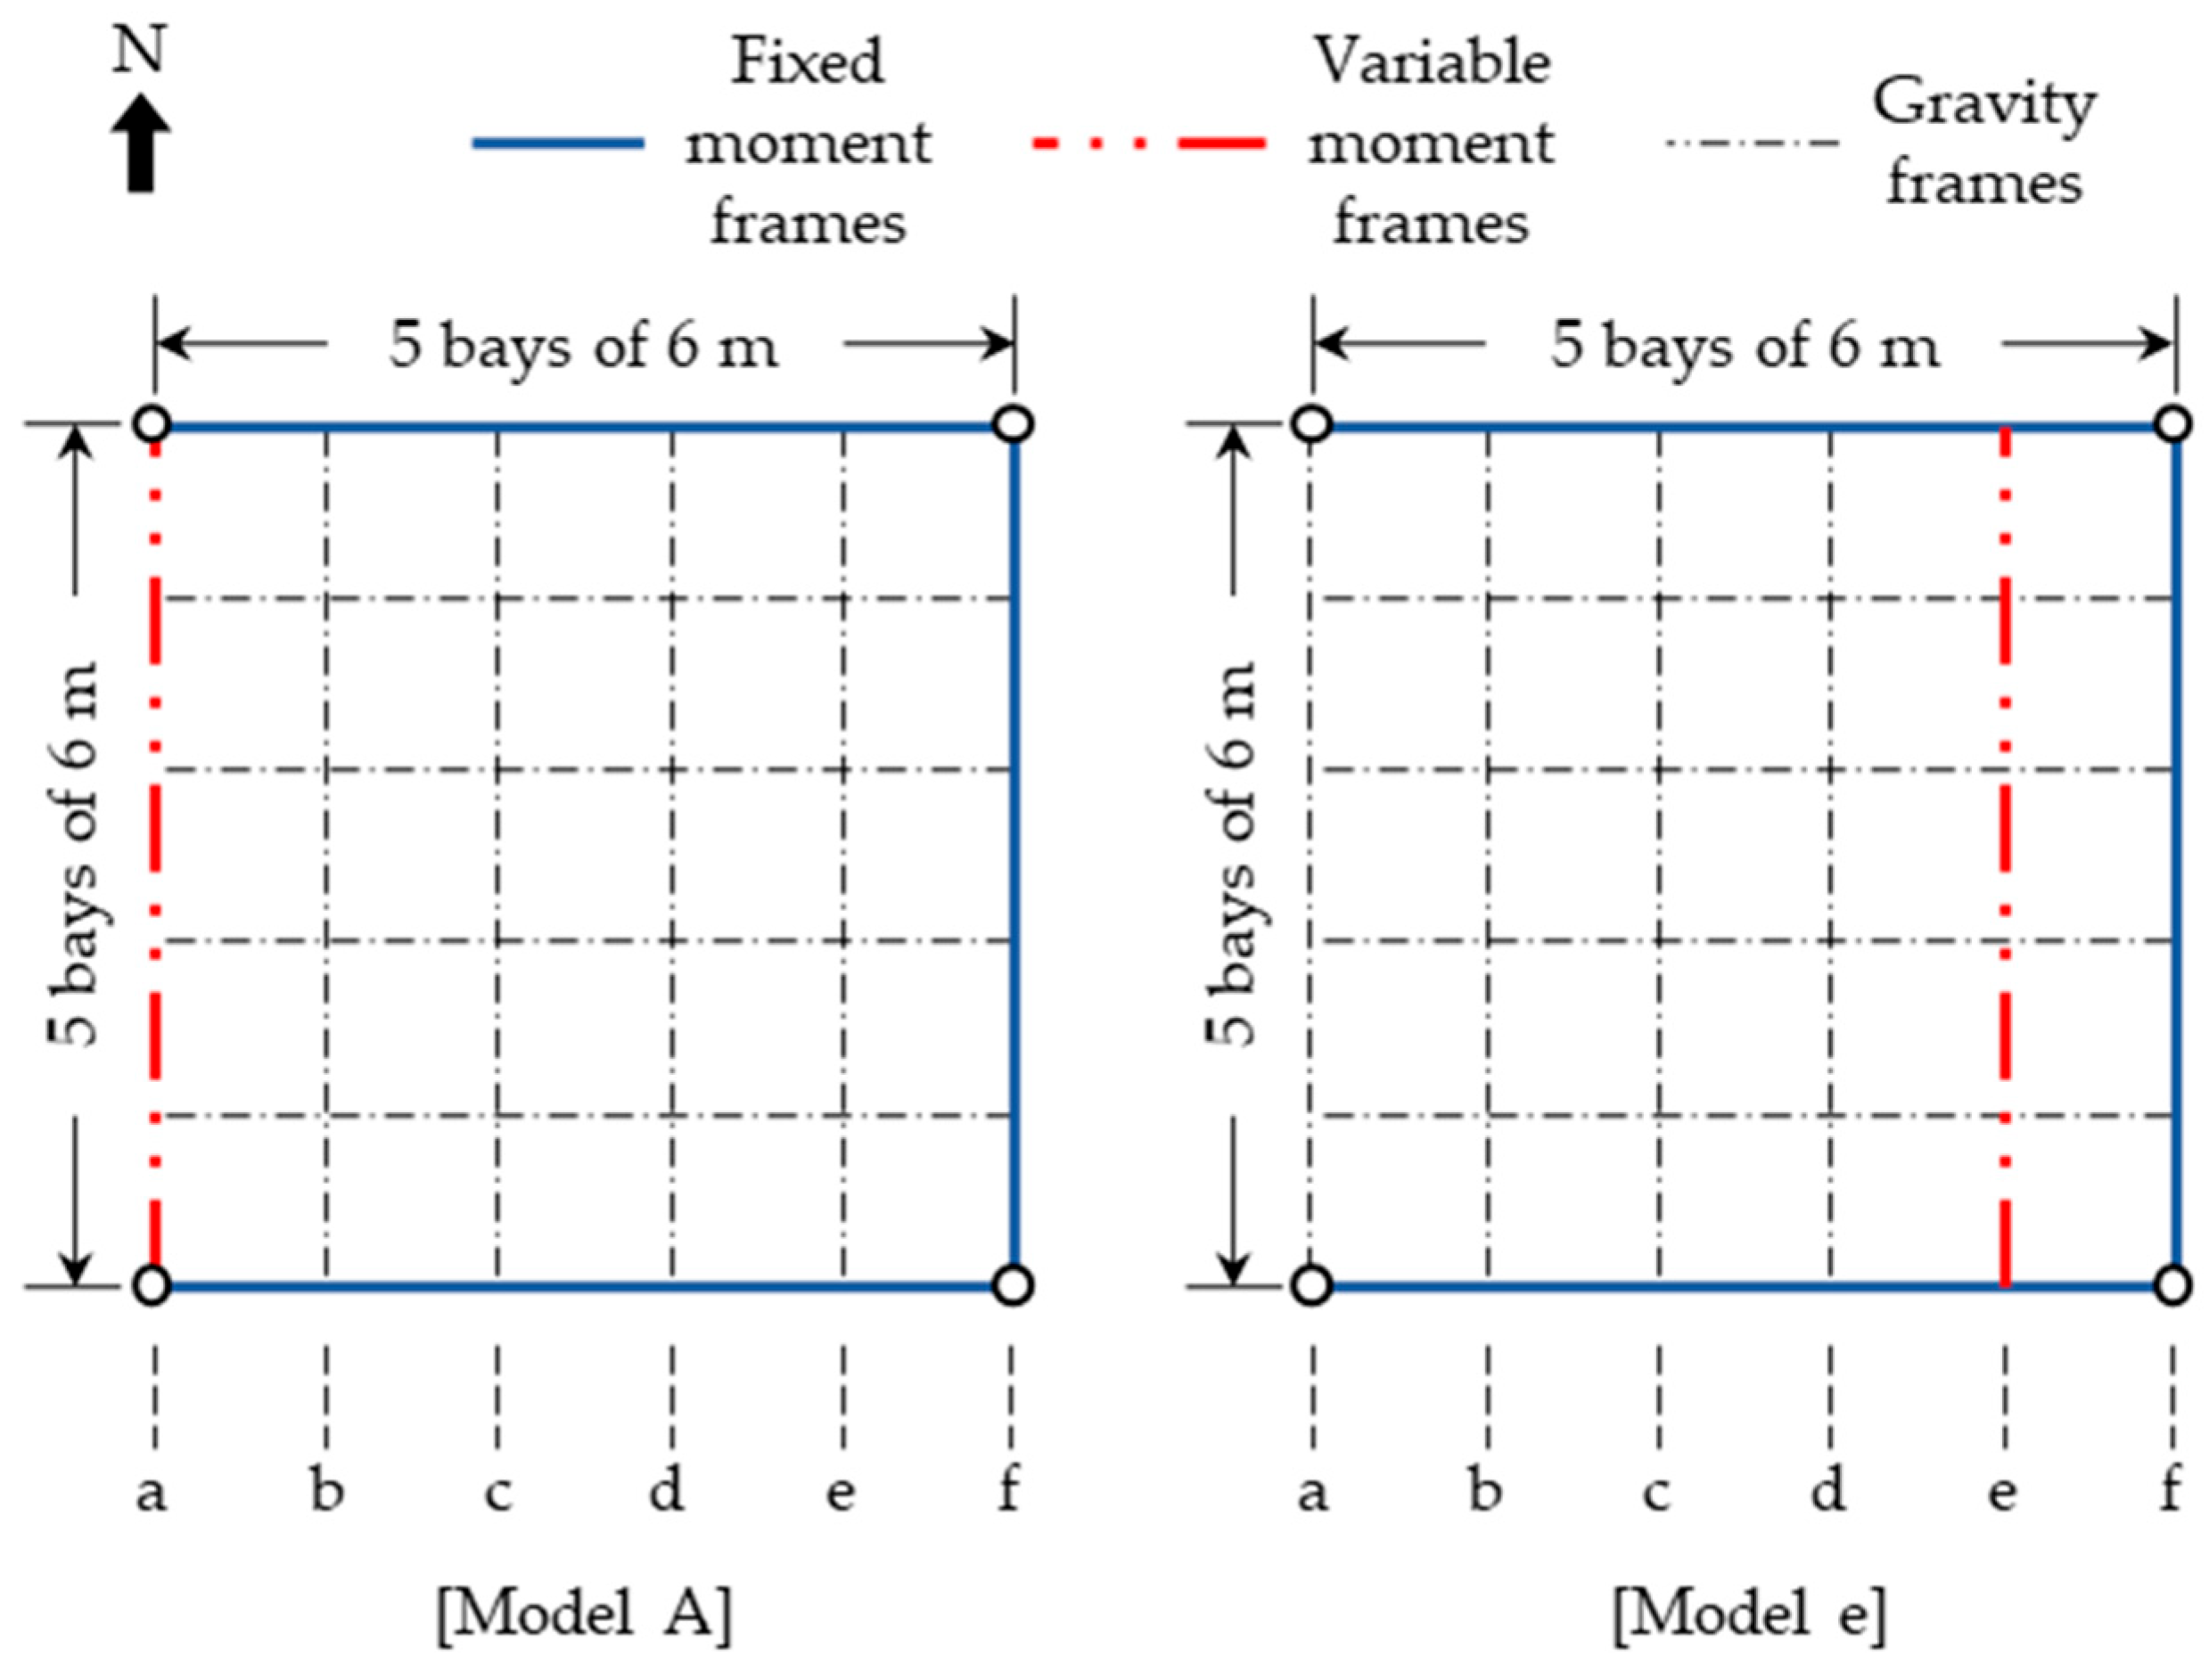
The target frames for the analysis are as follows. To evaluate the effects of the maximum interstory drift ratio using the proposed ground motion selection method, the model structures were determined as shown in
Figure 9. As shown in the floor plan, the target frames comprise a gravity frame designed to carry vertical loads and a moment frame intended to resist lateral forces, represented by dotted and solid lines, respectively. The detailed information on the target structural model, including the dimensions of columns and girders, is provided in Han et al. [
28]. Because the column of the moment frame has a fixed support and, the connection between the beam and column in the gravity frame is a pin joint, the seismic load-induced moment is primarily distributed to the moment frames during structural analysis. Moreover, variations in the position of the moment frame supporting the north–south direction result in changes to the eccentricity, which arises from the discrepancy between the center of rigidity and the center of mass. The floor plans were classified into five models (Model a, b, c, d and e) based on the location of the moment frames. Furthermore, the height was three-story structure, which was analyzed separately. The structure consisted of five spans measuring 6 m in both directions, and each story had a height of 4 m. The fundamental periods of the Model a to Model e structures are 1.84 s, 1.92 s, 2.06 s, 1.42 s, and 1.19 s, respectively.
Nonlinear response history analysis of this frame was performed using the OpenSees (Version 2.4.7) software [
29]. The site for structures was classified as Seismic Design Category D, where the design spectral acceleration is 0.6 g at a structural fundamental period of 1 s and short period spectral acceleration is 1.0 g. To construct a ground motion library, total 126 ground motions (
= 126) were collected from the NGA database, including the following ranges of earthquake parameters.
Magnitude: M = 6.06–7.62;
Closest distance: 5–30 km;
Source mechanism: Reverse fault or Reverse-Oblique;
NEHRP soil type: D (Vs30 = 180–360 m/s).
The target response spectrum is defined as the median spectrum computed from 126 ground motions.
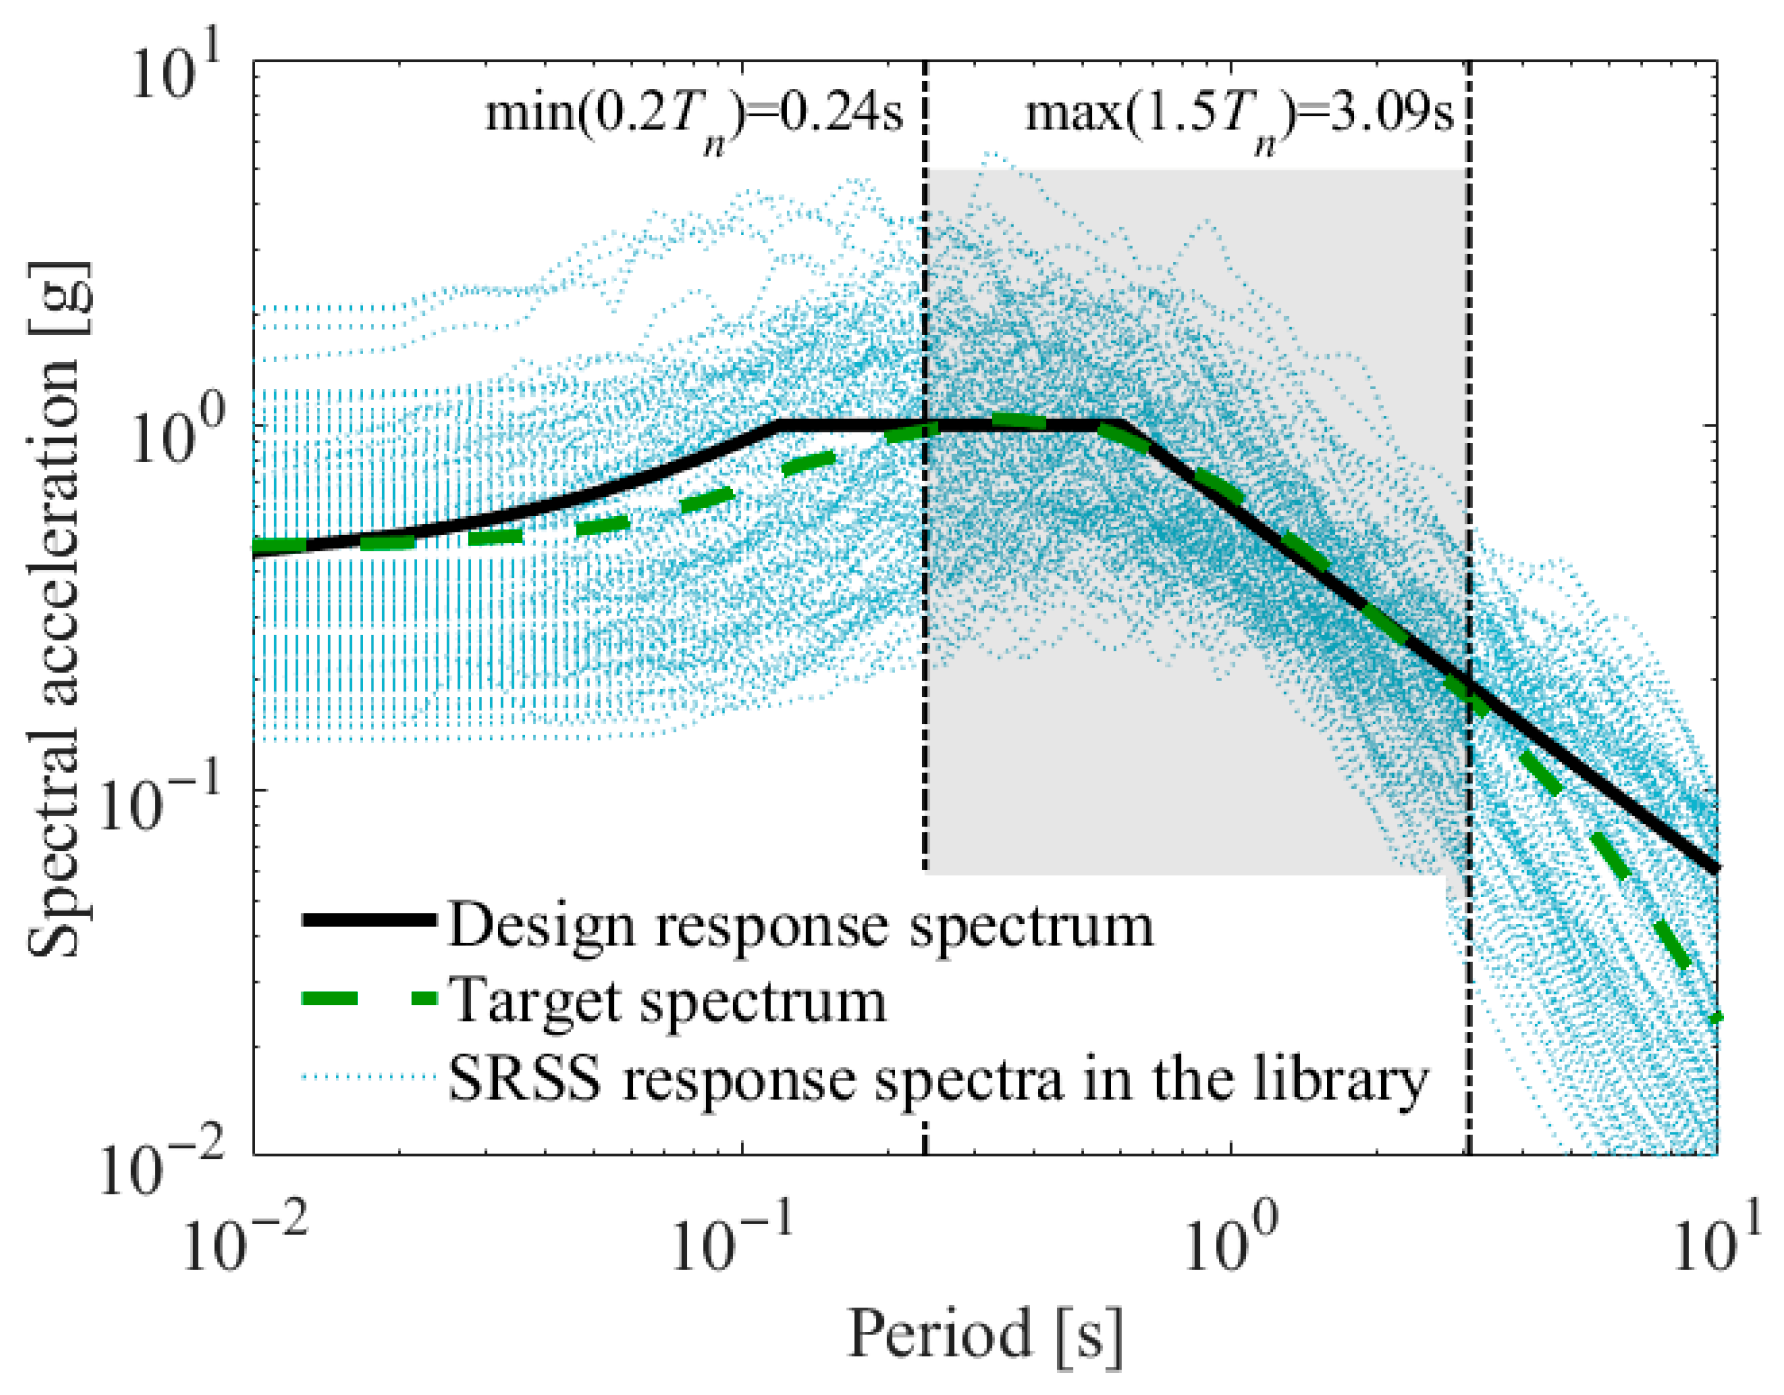
Figure 10 shows individual and target SRSS spectra. For comparison between target and design spectrum, a design response spectrum is developed for the site based on KDS 41 and plotted in
Figure 10. The fundamental period of the design structure is selected to satisfy both the Model e with the smallest fundamental period and the Model c with the largest fundamental period of the structure among the target frames.
As depicted in the figure, the shape and magnitude of the target and design spectra are comparable. It means that the earthquake parameter ranges used to collect the 126 ground motions adequately capture the seismicity characteristic of design-level earthquakes.
According to the proposed method, the ground motions of fewer (
ng = 3–6) and 7 or more (
ng = 7–10) were selected for all models of structures according to the target spectrum.
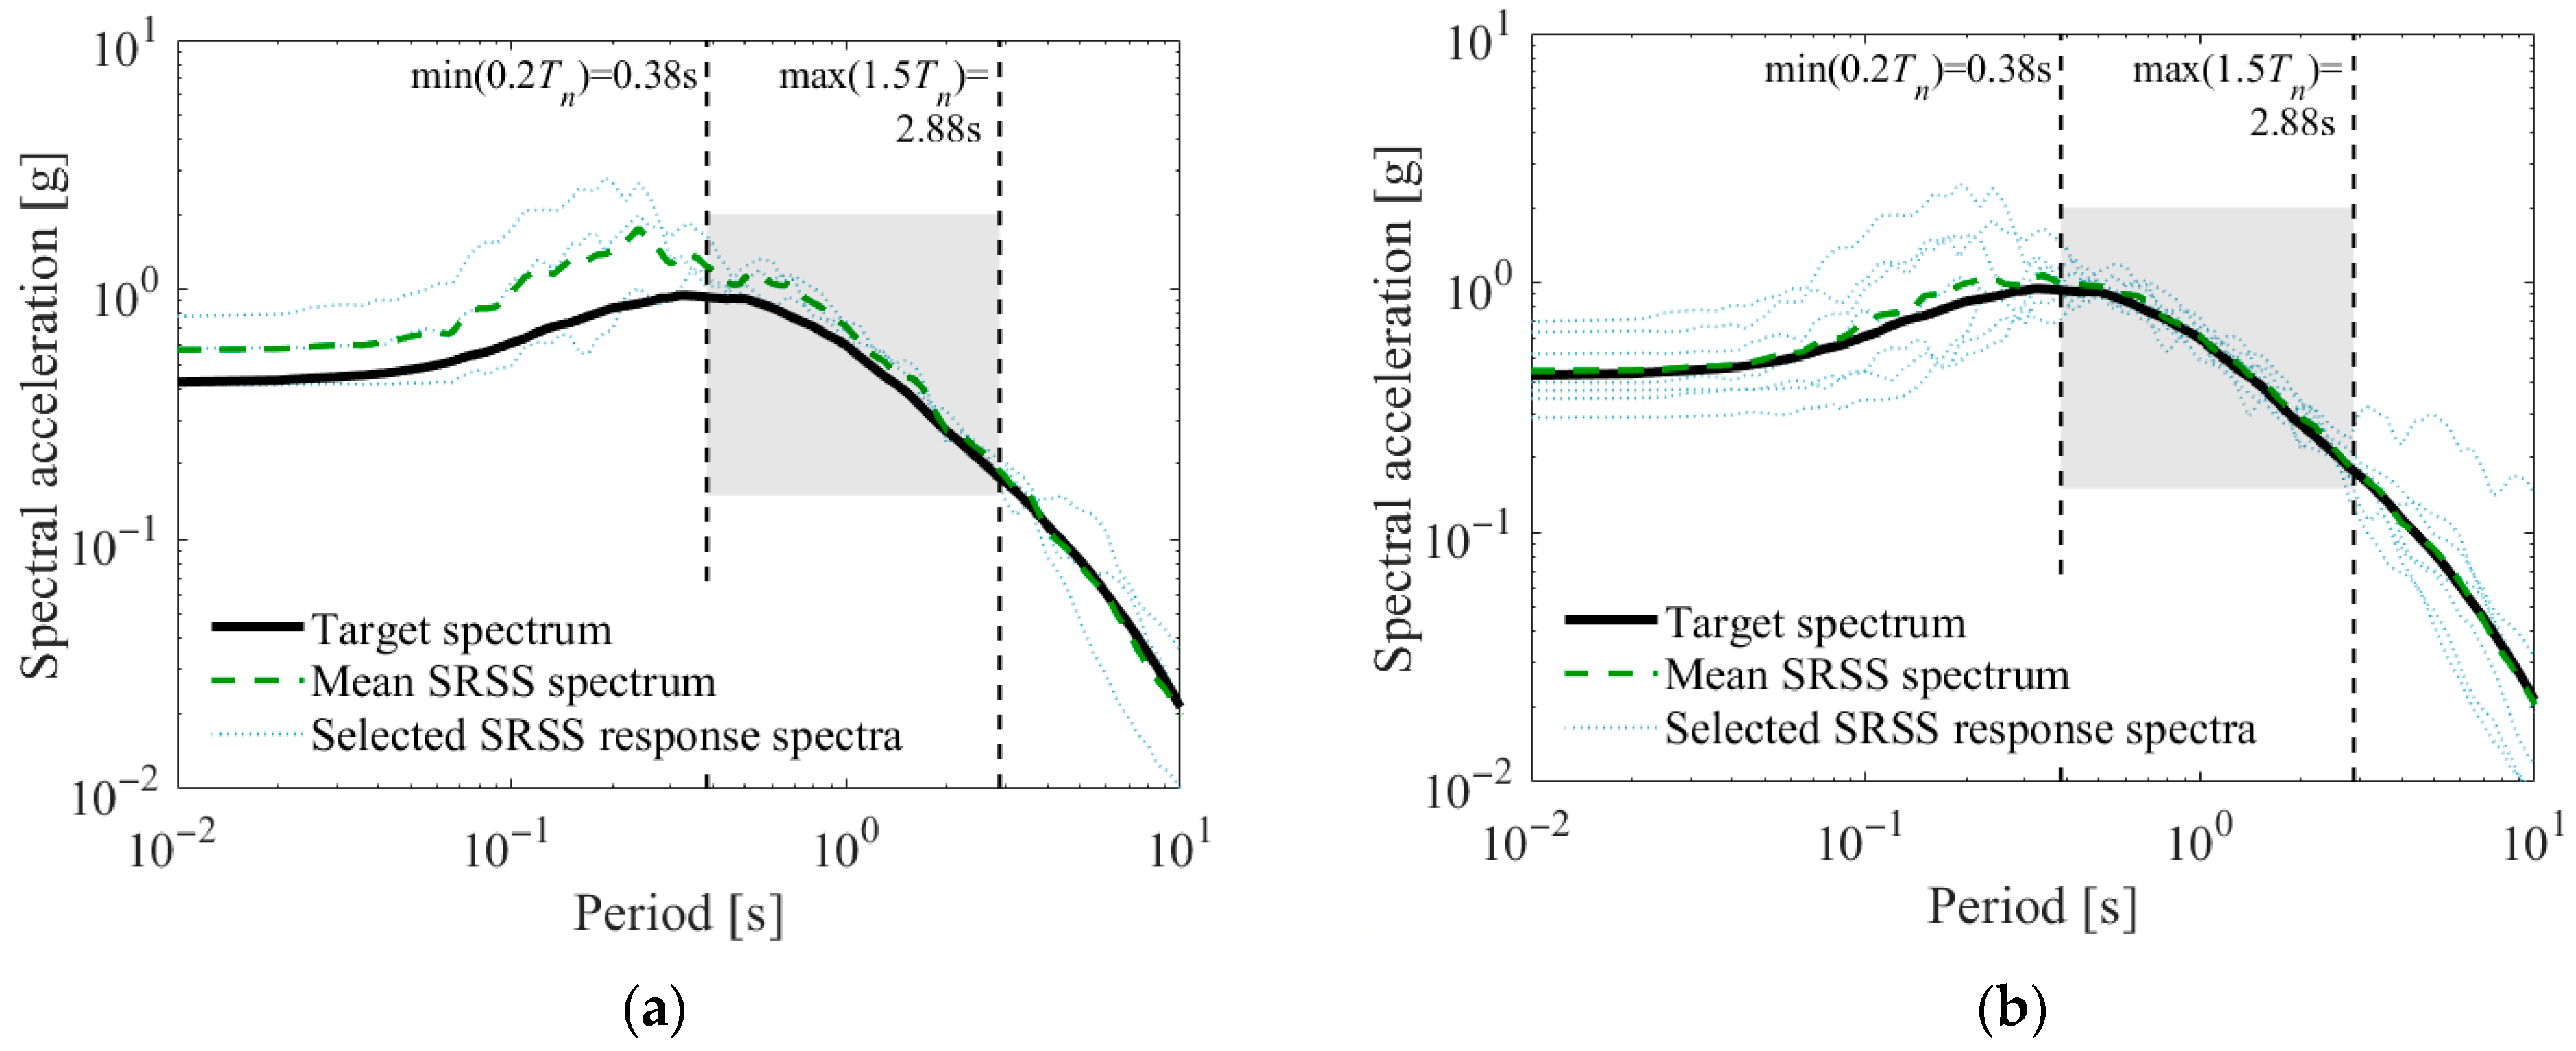
Figure 11 shows the result of selecting the ground motions for the Model b. The ground motions were selected for the fundamental period of the models. The sample mean SRSS spectrum in
Figure 11b can be seen to be more suitable for the target spectrum. Therefore, the results of response history analysis using 7 or more ground motions are expected to exhibit less variability compared to those using fewer than 7 ground motions.
To evaluate the seismic response of the models, the two horizontal components of each ground motion were simultaneously applied along the x- and y-axes of the structure. The SRSS of displacement in both directions was calculated at each time step. Then, the maximum SRSS displacement (ratio) was evaluated. Subsequently, the same two horizontal ground motion components are rotated by 90 degrees and analyzed, and the maximum SRSS displacement (ratio) is likewise evaluated. This process was repeated for each of the 126 ground motions to estimate the maximum SRSS displacement of the structure.
The median value of the maximum SRSS displacement (ratio) over 126 ground motions is assumed as the target displacement (ratio) of a structure. Since ground motion models are generated based on a lognormal distribution, employing median structural responses as target responses is considered more appropriate than using mean structural responses.
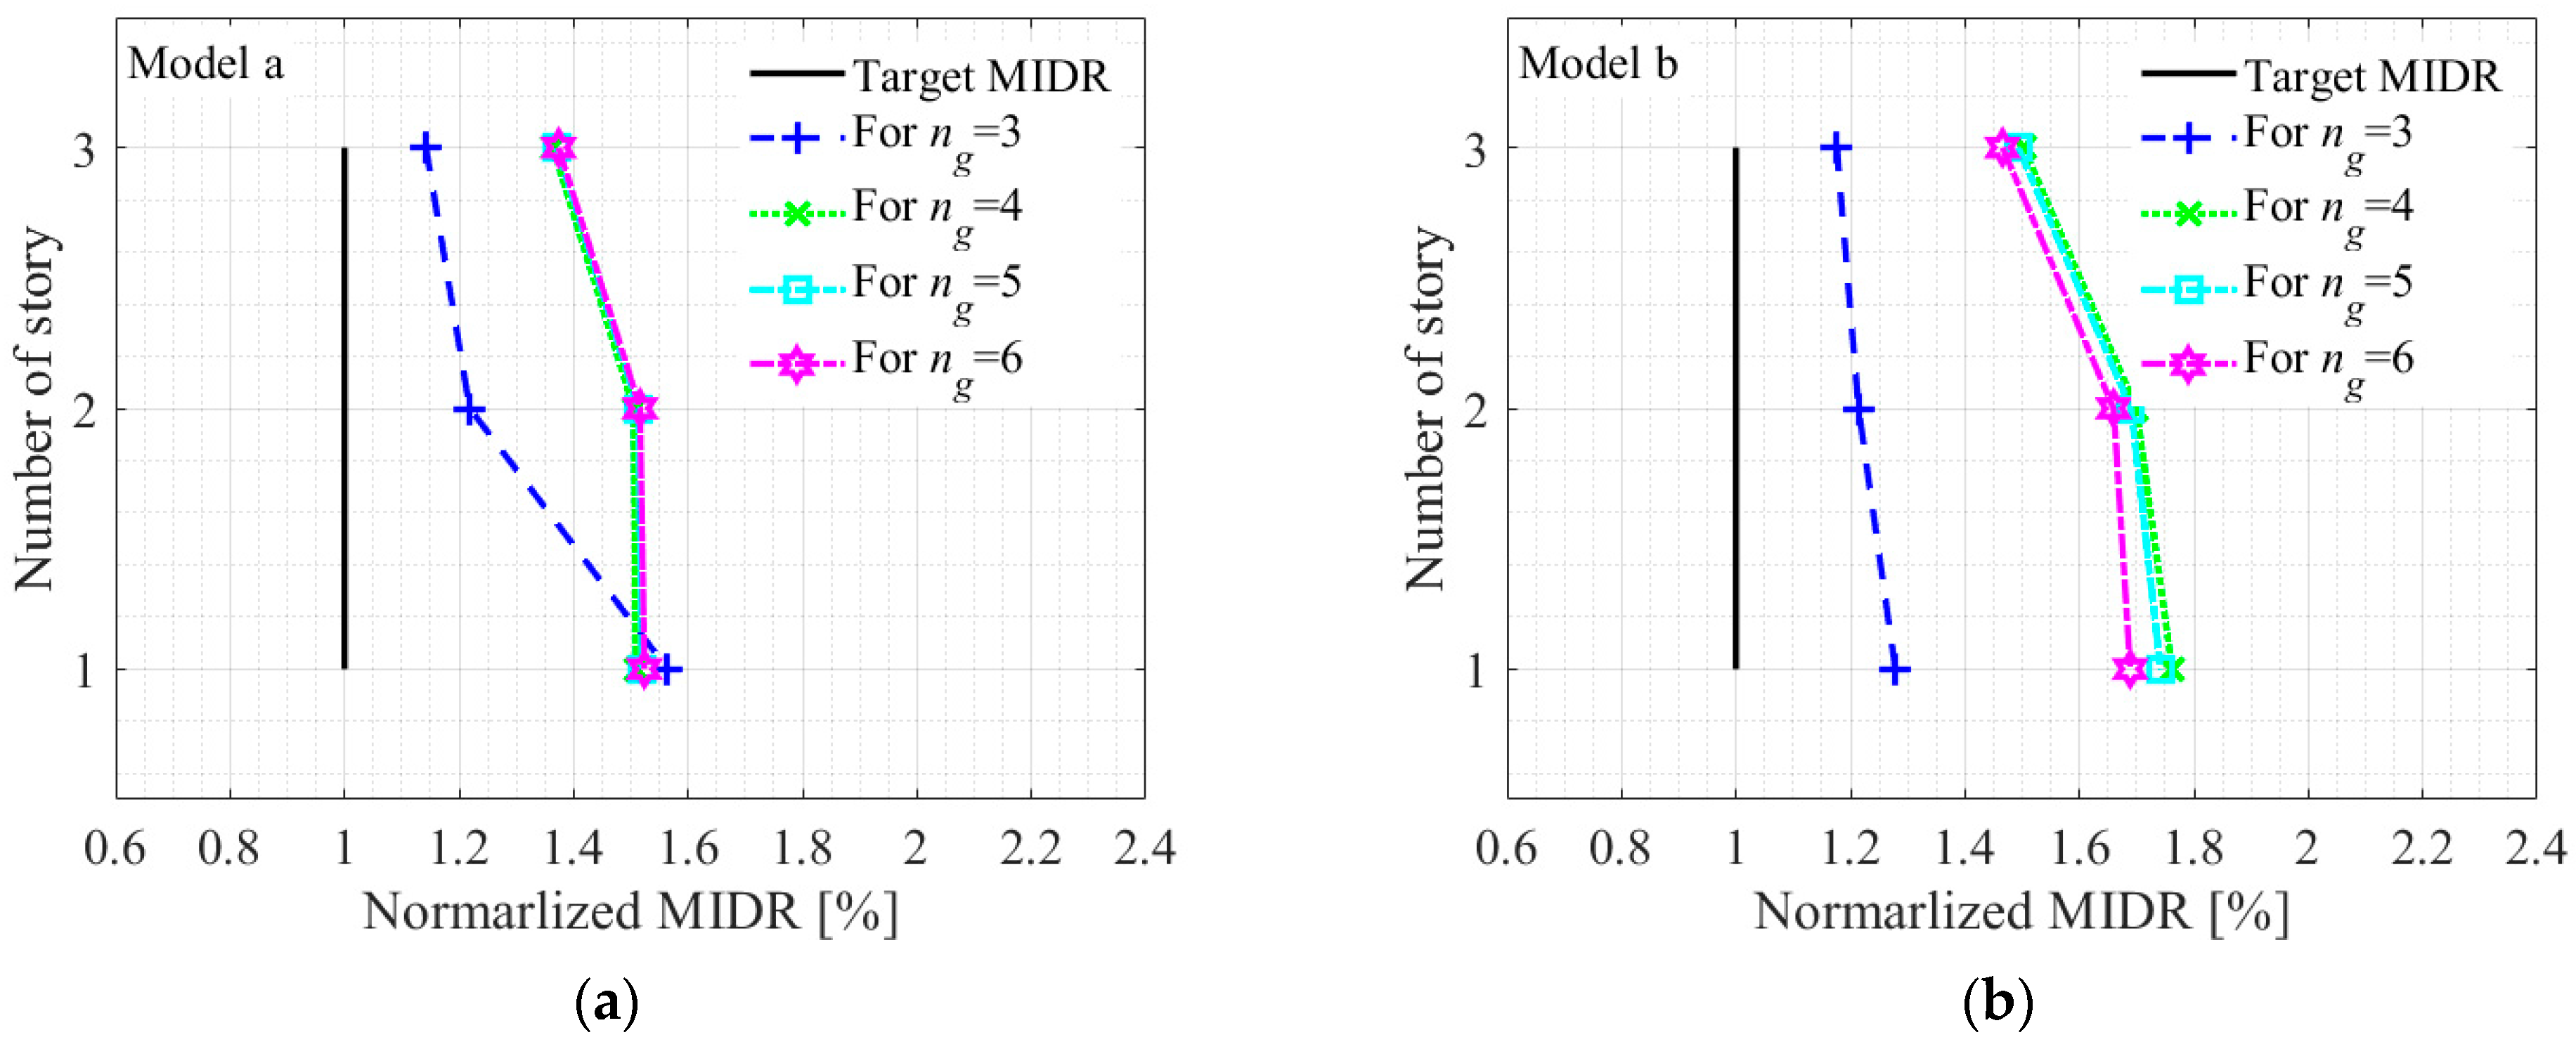
In accordance with KDS 41, when fewer than 7 ground motions are employed in the analyses, seismic design responses shall be defined as the maximum response demands observed across all ground motions. This study considers different numbers (3 ≤ ng < 7) of ground motions selected according to the KDS 41 criteria using the proposed selection procedure presented herein. Nonlinear RHA are performed on five models of MDF structures. Maximum interstory drift ratios (MIDRs) of the structures are calculated for each selected ground motion. Then, the maximum value of MIDRs over all ground motions is determined. Subsequently, the errors in the calculated values were computed relative to the target MIDR, which is defined here as the median value of MIDRs for the structure calculated using all ground motions in the library.
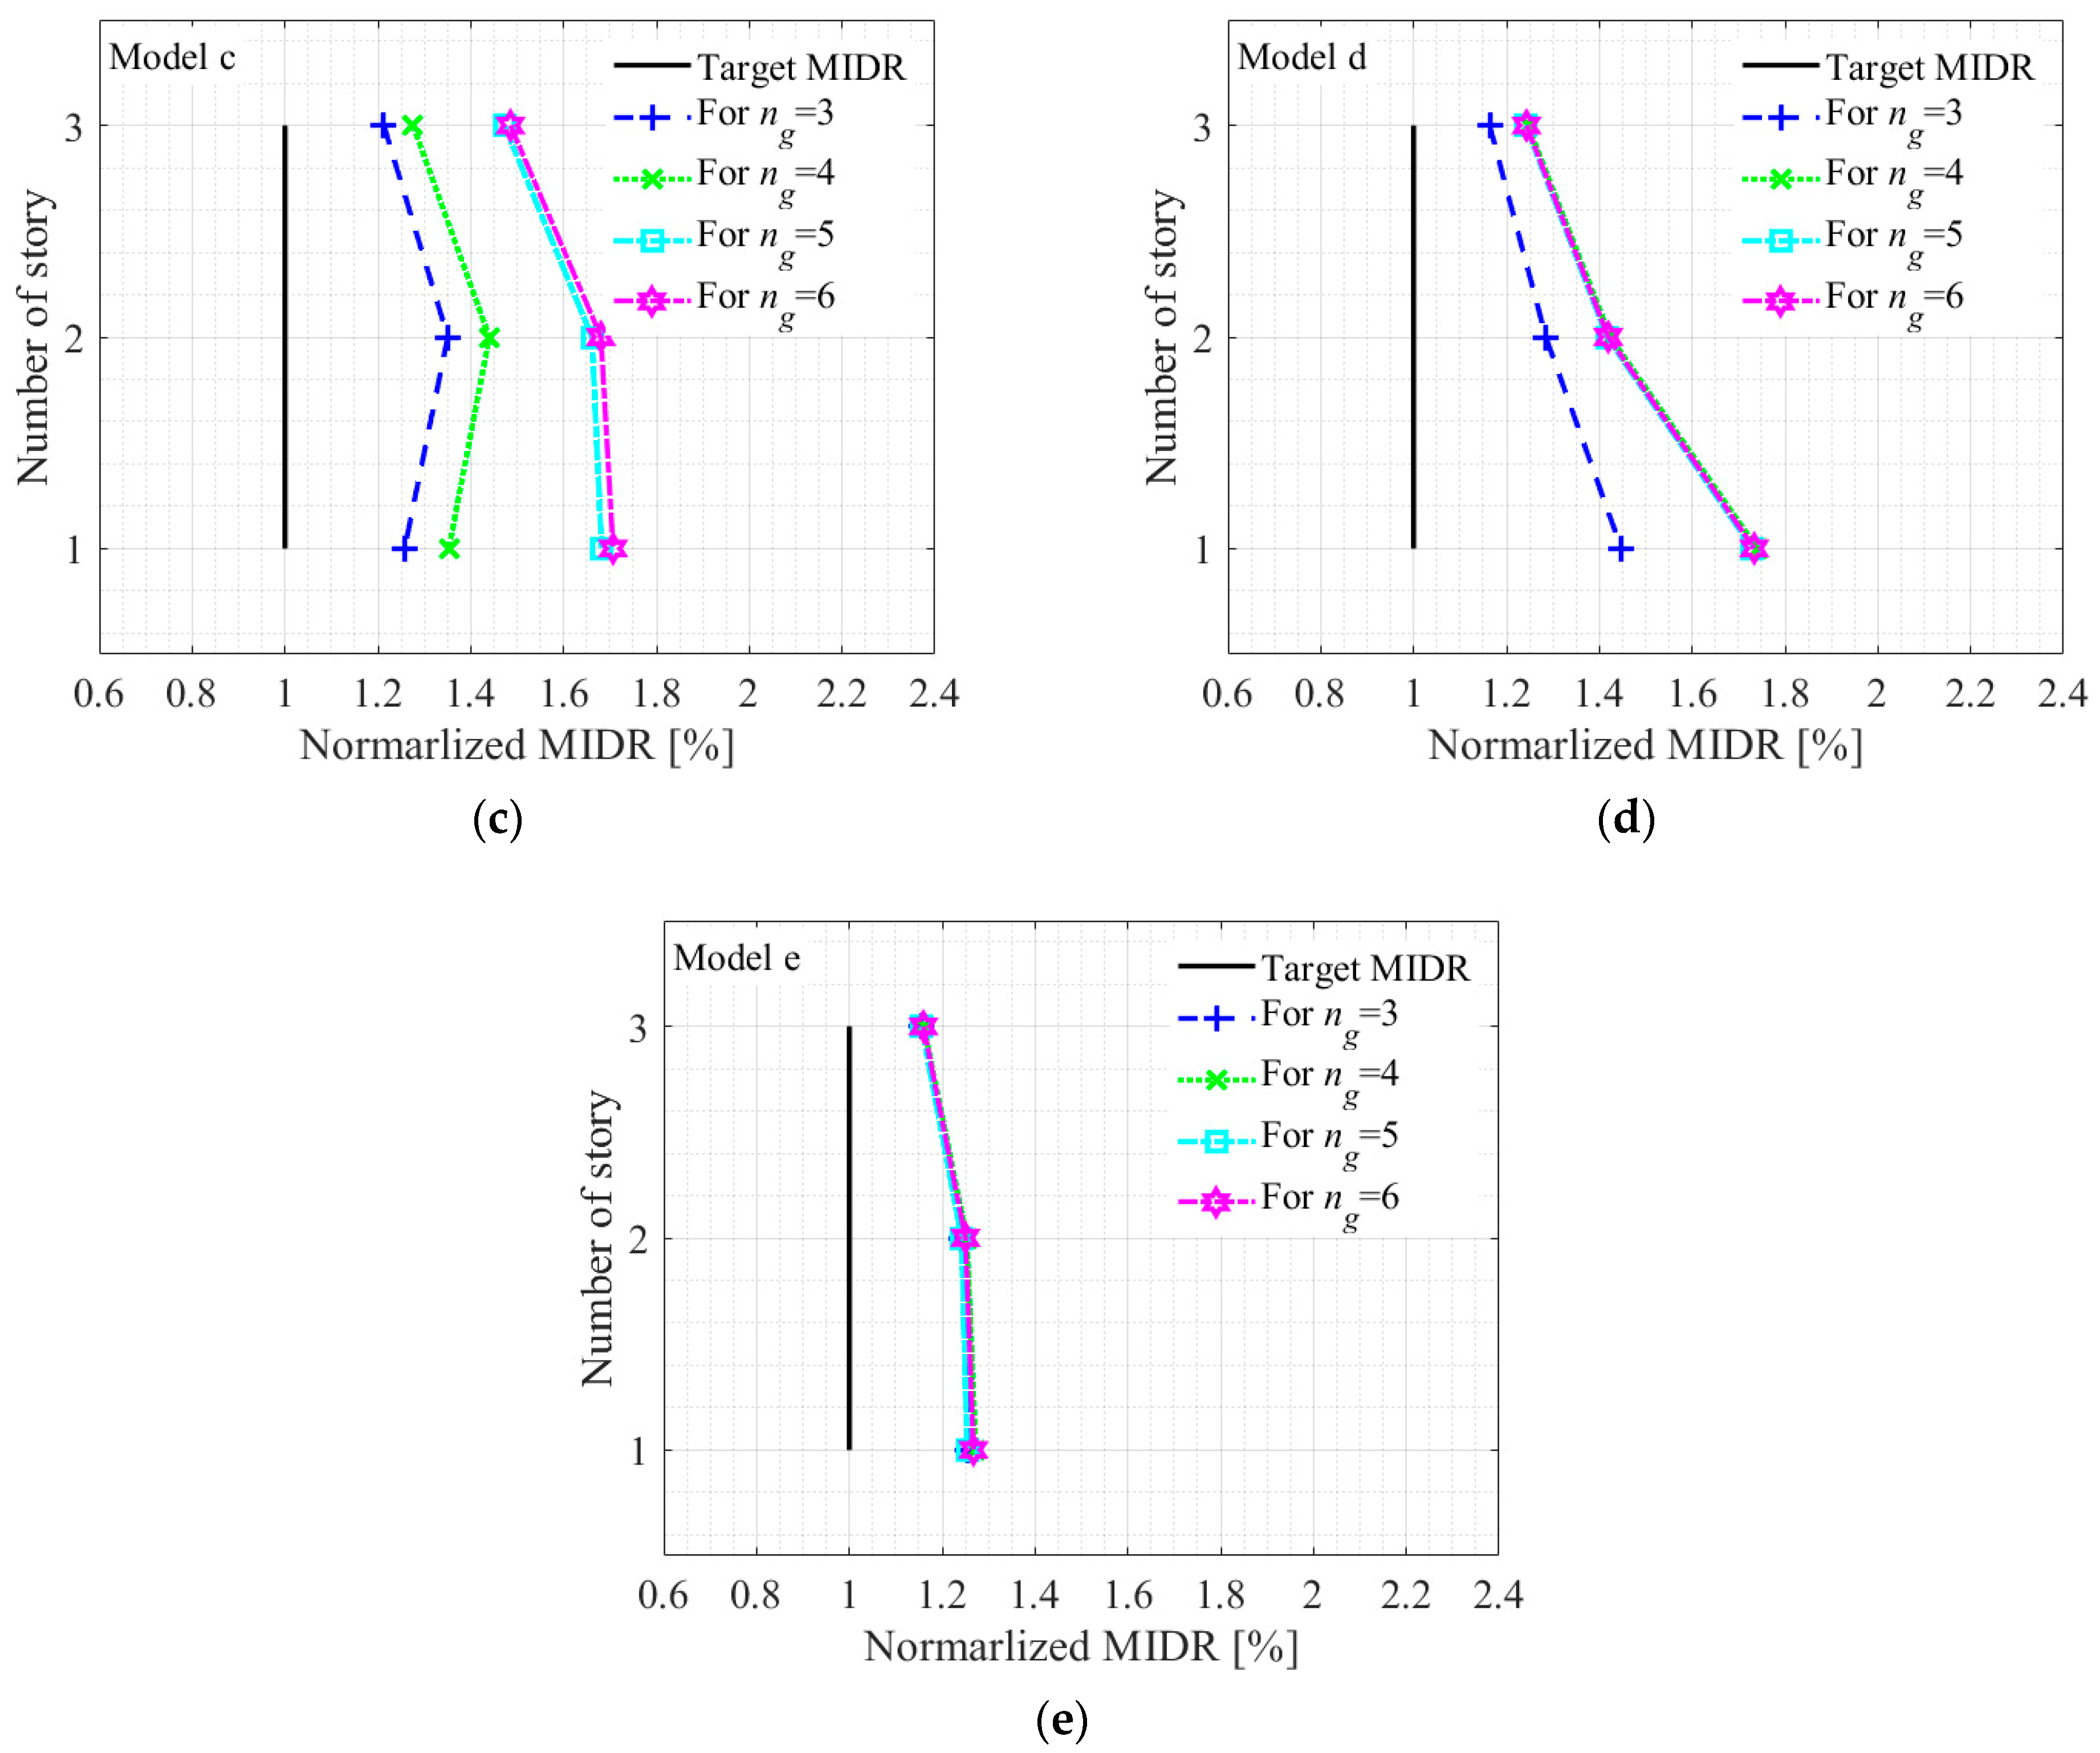
Figure 12 shows target and normalized maximum MIDRs by target MIDR of five models of MDF structures obtained from fewer than 7 selected ground motions. It is observed that maximum MIDRs obtained from fewer than 7 ground motions consistently exceeded the target MIDR. In other words, the KDS 41 criteria with the proposed selection procedure always overestimate target MIDR. As shown in this figure, when the number of ground motions is less than 7 (
ng < 7), the error in the maximum MIDR generally exceeds 25% across all models. Notably, the error does not consistently decrease with an increasing
ng. For example, in the MDF Model c, the error for
ng = 3 is 34%, whereas for
ng = 6 it increases to 72%. A similar pattern is observed in MDF Model d, where the error for
ng = 3 is 44%, but rises sharply to 73% for
ng = 4. However, in Model b, the MIDR for
ng = 6 is slightly smaller than for
ng = 4 or 5, which is likely attributable to a slight reduction in the amplitude of the selected ground motions during the response spectrum re-scaling procedure. These results indicate that using a moderate number of records (4–6) can, in some cases, lead to greater variability than using only 3, likely due to the amplification of record-to-record variability when the suite size is insufficient to stabilize the statistical median. In contrast, MDF Model e (
Figure 13) exhibits a relatively stable response for
ng ≥ 7, with error magnitudes showing minimal dependence on the number of motions.
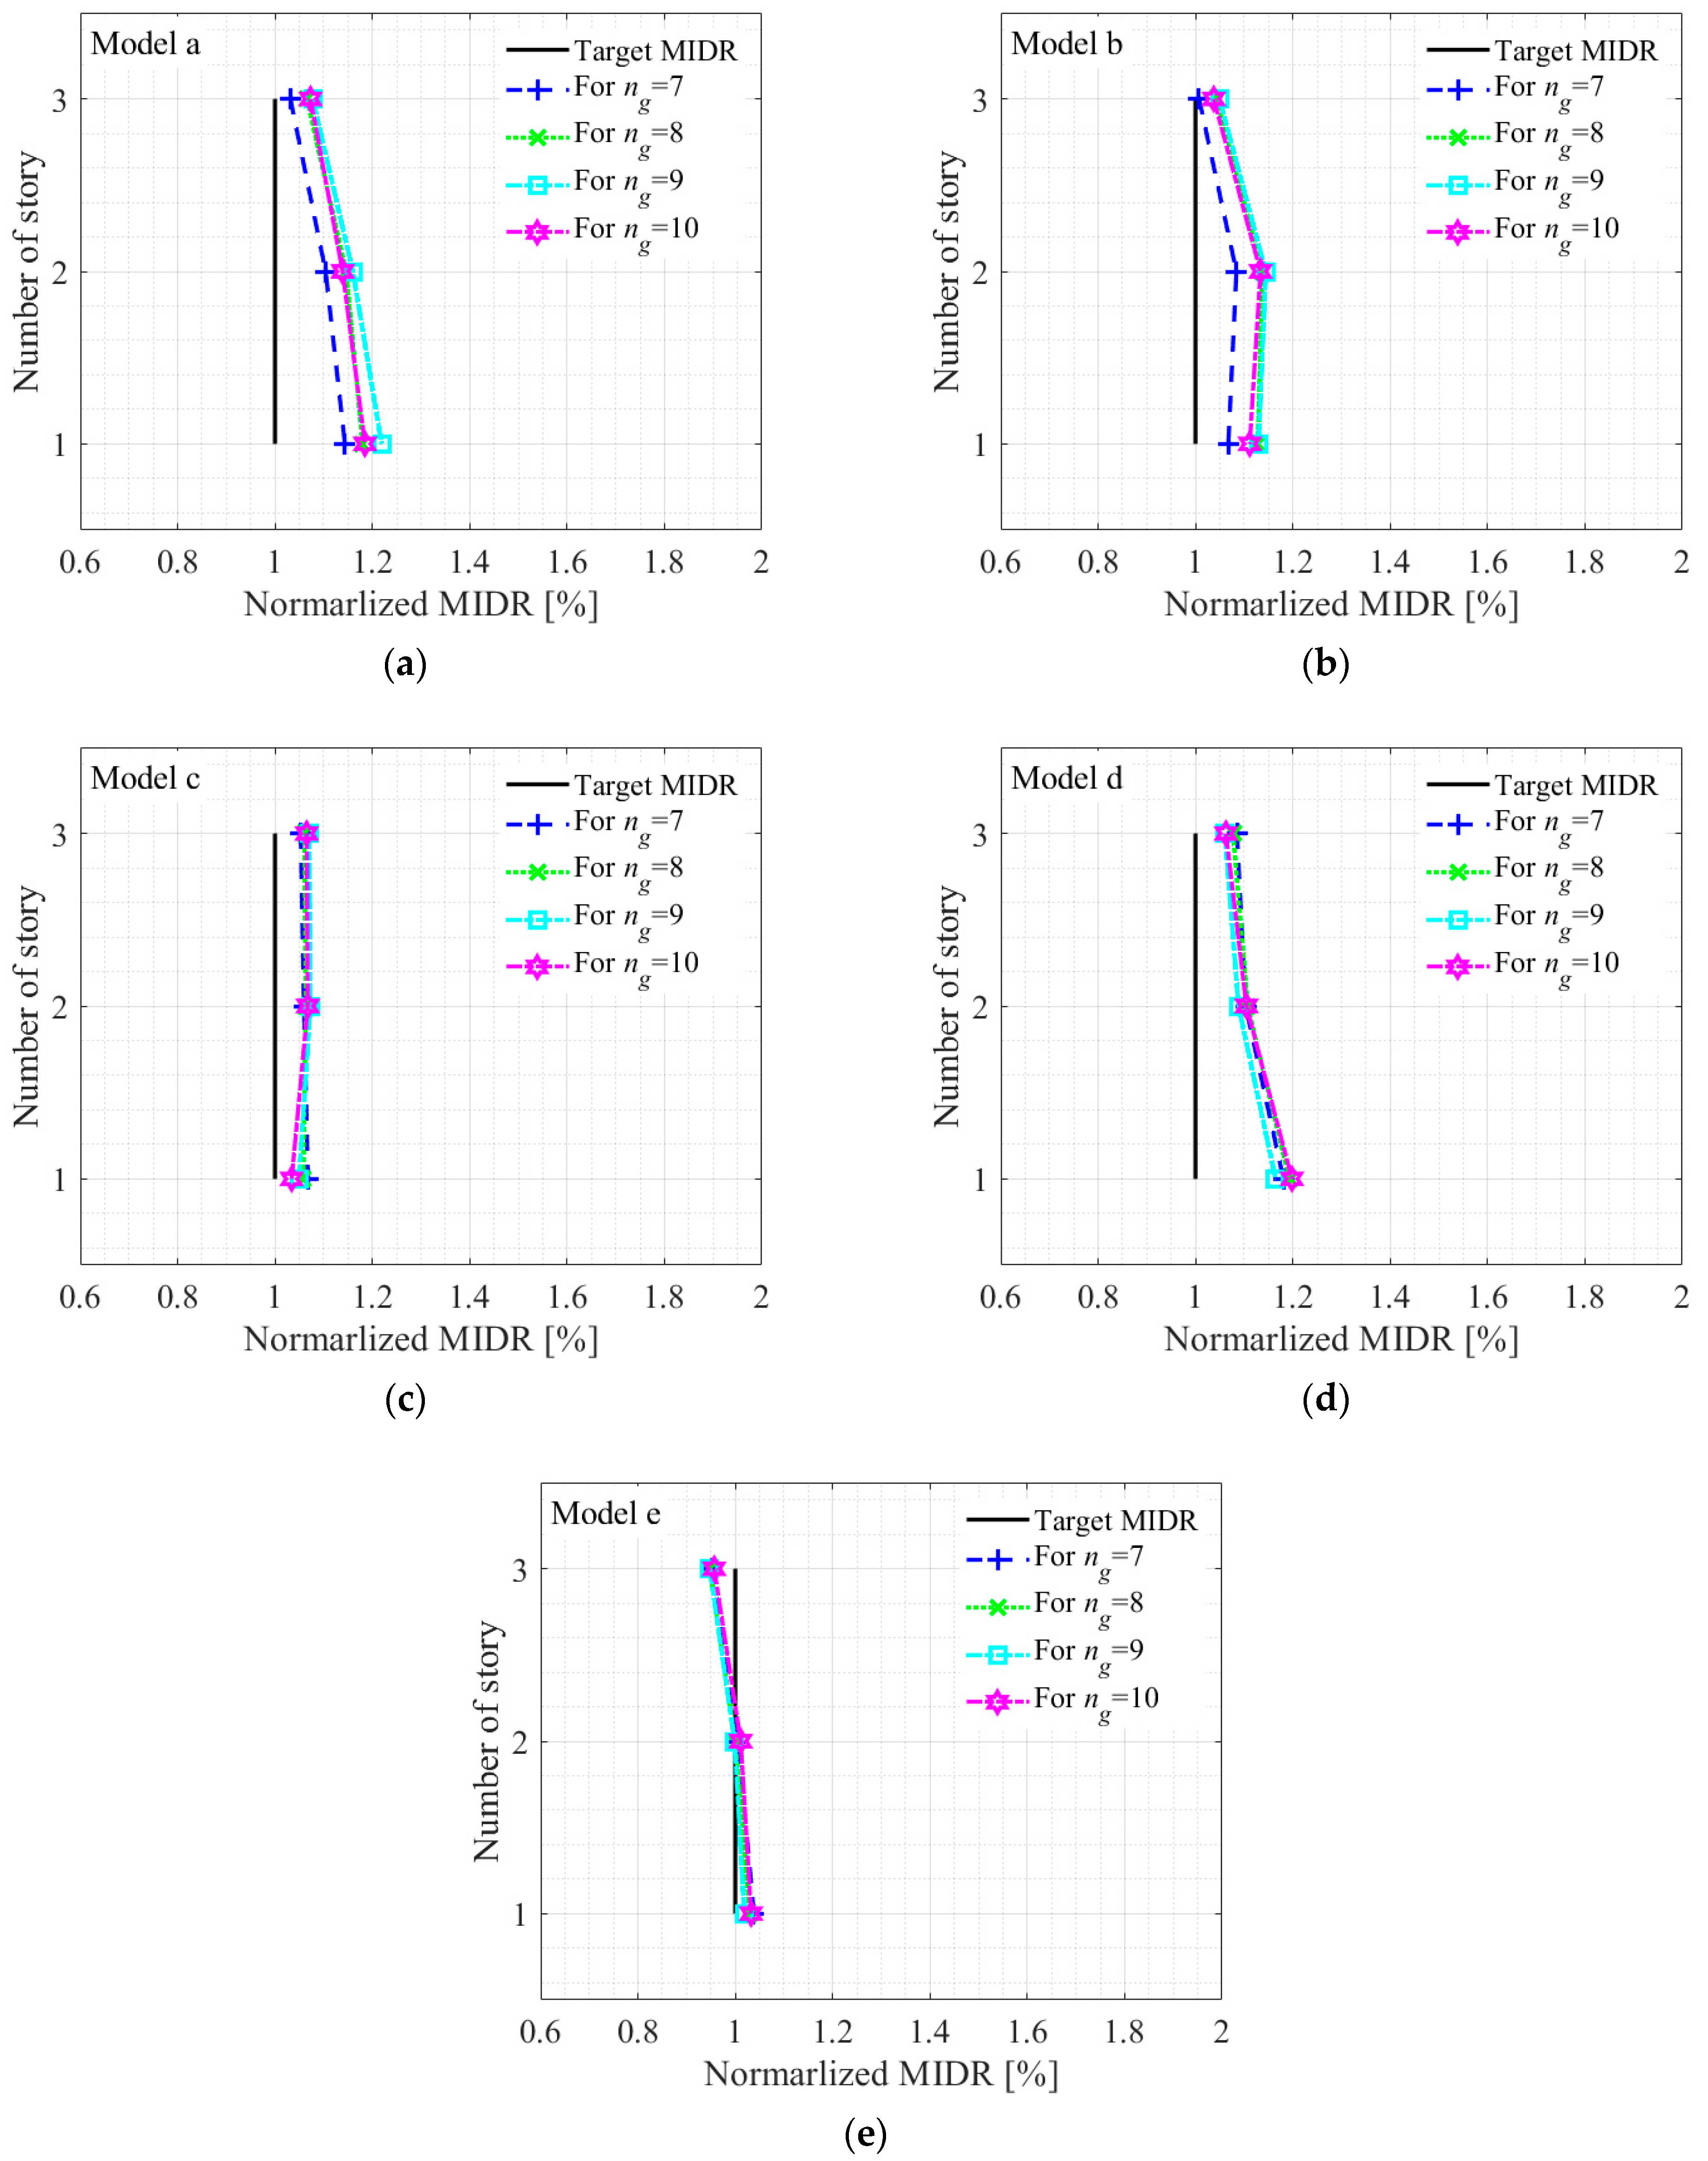
Figure 13 shows mean MIDRs of five MDF structures and corresponding errors of mean MIDRs when using 7 or more ground motions. The errors of mean MIDRs for all structures for
ng = 7–10 are generally less than 20%. Therefore, the errors of mean MIDR for
ng ≥ 7 are much smaller than those of maximum MIDR for
ng < 7 (
Figure 12). This implies that the use of mean MIDR when
ng ≥ 7 predicts a more reliable and precise estimation of the target displacement than the use of
ng < 7. It is noted that for Model e of MDF structures, the mean MIDRs are underestimated by approximately 5% compared to the target MIDR.
Furthermore, nonlinear time-history analyses using ten ground motions yielded MIDRs with errors within 20%, irrespective of the irregularity of the target structure.
In summary, the analysis demonstrates that using fewer than 7 ground motions results in systematic overestimation and considerable variability in maximum MIDR predictions. Conversely, suites comprising 7 or more ground motions yield more reliable and consistent mean MIDR estimates across all MDF structural models. This highlights the critical role of adequate ground motion quantity in achieving stable and accurate seismic demand assessments.
5. Discussion
A comparison with existing selection approaches reveals the clear advantages of the proposed sequential method. By minimizing the normalized sum of squared errors (nSSE), the sequential process effectively balances bias and dispersion, which allows for the construction of more representative ground motion sets. The method is also highly adaptable; its straightforward and systematic process allows it to be readily applied to diverse design scenarios and target spectra without requiring case-specific parameter tuning.
A key finding of this study, however, is the tendency for the maximum interstory drift ratio (MIDR) to be overestimated when a small set of ground motions (i.e., 3 to 6) is selected using this statistically rigorous method. This phenomenon may be attributed to the selection criteria, which consider not only the mean but also the variance (by minimizing nSSE). This process tends to select individual ground motions that envelop the target spectrum over a wide period range, causing spectral accelerations at certain periods to significantly exceed the target. The cumulative effect of this may amplify the nonlinear structural response, leading to a conservative estimation of engineering demand parameters like MIDR.
This result offers a critical practical implication for engineers. It suggests that when using a limited number of ground motions as permitted by KDS 41, a selection method that strictly adheres to statistical targets might lead to overly conservative design outcomes. Furthermore, the observation that the error increases as the number of motions increases from 3 to 6 highlights the inherent limitations and potential volatility of using small ensembles. This finding reinforces the recommendation in KDS 41 to use a set of at least 7 ground motions to ensure the stability and reliability of nonlinear response history analysis results.
