Abstract
Rock mass characterization is crucial for evaluating slope stability and recommending effective prevention mechanisms. This study presents a comparative analysis of three approaches for discontinuity analysis: (1) conventional field survey, (2) digital manual measurement on 3D models generated with UAV-based photogrammetry, and (3) semi-automatic analysis based on clustering algorithms (K-NN) for point cloud segmentation. All three methods were applied to the same slope, allowing their performance to be evaluated in terms of accuracy, efficiency, and replicability. The results showed that the semi-automatic method achieved the highest coverage (81%) and identified 586 discontinuities, with RMSE values of 2.58° for orientation, 0.087 m for spacing, and 2.05 m for persistence, using the conventional method as a reference. The digital manual method, with 19% coverage, yielded very low error (RMSE of 3.27° for orientation, 0.012 m for spacing, and 0.063 m for persistence), validating it as a complementary and reliable alternative. In contrast, the conventional method required the longest execution time (10 h) and achieved only 19% coverage, being the least replicable due to its dependence on expert judgment. Overall, the comparison highlights the advantages of digital methods, especially the semi-automatic approach, in improving efficiency, safety, and replicability, while providing robust information to recommend prevention strategies for rock slope stability.
1. Introduction
The characterization of rock masses is a fundamental stage in slope stability analysis, civil infrastructure design, mining operations, and geological risk assessment. Discontinuities represent the planes of weakness within the rock mass and must be accurately described in terms of dip direction, dip, spacing, persistence, aperture, and roughness [1], along with physical properties such as moisture content, weathering degree, and infill type. This information helps evaluate the current condition of the rock mass, predict potential failures, and understand failure mechanisms [2].
Traditionally, geomechanical characterization has been conducted through direct field methods using geological compasses, clinometers, and measuring tapes. However, this approach presents significant limitations: subjectivity in measurements, dependence on the operator’s experience, physical constraints due to irregular topography, and safety risks in unstable zones [3].
In recent years, aerial photogrammetry using Unmanned Aerial Vehicles (UAVs) has emerged as an effective alternative to overcome these limitations. This technique enables the generation of detailed three-dimensional models from overlapping images processed with algorithms such as Structure from Motion (SfM) and Multi-View Stereo (MVS) [4]. These models allow the generation of dense point clouds and Digital Surface Models (DSMs), which represent the surface geometry of the rock mass with high accuracy [5]. Previous studies [1,3,6] have demonstrated the applicability of these methods for geomechanical characterization in challenging topographies and hard-to-reach locations, enabling broader coverage and reducing operational risk. To obtain a reliable reconstruction, the rock surface must be exposed, and vegetation, shadows, or elements that interfere with photogrammetric capture or affect the accuracy of the point cloud must be removed.
For example, previous research [7] reported improvements in positional accuracy of cm through the integration of GNSS with RTK/PPK capabilities and ground control points (GCPs), making geomechanical analysis feasible in inaccessible areas. Similarly, previous studies [8] highlighted the importance of proper flight planning and camera calibration to obtain 3D models under real-world conditions. Previous studies have shown that factors such as dense vegetation and shadows can negatively affect the density and quality of the point cloud, making it more difficult to identify relevant discontinuities [9].
The processing of these models has been enhanced by digital tools such as Cloud Compare [10], an open-source software that allows visualization, filtering, and measurement directly on 3D point clouds. Additionally, we use the Discontinuity Set Extractor [11], a specialized plugin that performs semi-automatic detection and statistical analysis of discontinuity planes. Both enable direct extraction of geometric parametric parameters from the point cloud.
In a complementary study [6], the authors analyzed how the method used to acquire geomechanical data, whether manual or semi-automatic, directly influences rockfall susceptibility assessments. Using 3D models generated from UAV photogrammetry, the authors compared different survey techniques applied to 3D kinematic analysis, showing that the most critical factor is not the number of mapped planes but the accurate detection of dominant discontinuity sets. Their study introduces a 3D Kinematic Hazard Index (KHI) and emphasizes that tools such as CloudCompare, qFacet, and DSE can efficiently integrate structural data into susceptibility models, provided that the acquisition stage is appropriately managed.
Additionally, artificial-intelligence-based approaches have emerged to automate the segmentation process. Battulwar et al. [2] applied neural networks, such as PointNet, and clustering algorithms (DBScan) to segment discontinuities with minimal human intervention. Similarly, Pola et al. [12] proposed machine learning models for the geomechanical classification of rock masses, while [13] developed geometric methods based on normal vector analysis in triangulated meshes. Similarly, K-Nearest Neighbor (K-NN) has been applied to evaluate local geometric similarity between points and improve the clustering process by identifying coplanar regions within dense point clouds [2,13].
Despite these technological advances, several challenges remain, including sensitivity to lighting conditions, vegetation, point cloud noise, and the high computational cost of automatic methods. Moreover, the continuous validation of these approaches against traditional methodologies remains necessary. Although the literature has widely documented the benefits of these technologies, few studies provide direct and quantitative comparisons among different approaches, highlighting their advantages, limitations, and applicability [3,5,7]. These gaps emphasize the need for comparative studies that evaluate the performance of conventional, digital, and semi-automatic methods under the same conditions, a key motivation of the present work.
Hence, the present work not only compares different techniques for the geomechanical characterization of rock masses but also evaluates their potential to support the design of prevention mechanisms. By contrasting conventional field surveys, digital manual measurements, and semi-automatic analyses based on UAV photogrammetry, this study aims to compare their performance and identify their respective strengths, limitations, and applicability, providing evidence to guide the selection or combination of methodologies for the geomechanical characterization of rock masses, especially in environments with limited access or technical resources.
The main contributions are as follows.
- A comparative analysis is presented between three different approaches for geomechanical characterization:
- Traditional field measurements using a compass, a clinometer, and a measuring tape;
- A proposed semi-automatic process based on UAV photogrammetry and point cloud processing with DSE;
- Digital measurements carried out on 3D models using virtual measurement tools in CloudCompare.
- The comparison encompasses key aspects, including geometric accuracy, data coverage, site accessibility, execution time, and ease of implementation. Furthermore, we provide a description of the advantages and limitations of each approach, providing evidence to guide the selection or combination of methods, with an emphasis on their role in recommending geomechanical prevention mechanisms to reduce slope instability risk.
The main contributions of this study are (1) the integration and comparison of conventional, manual, digital, and semiautomatic UAV-based methods for rock mass characterization; (2) the assessment of their operational efficiency, geometric accuracy, and reliability; and (3) the formulation of a combined methodological framework applicable to slope stability analysis under real field conditions.
2. Literature Review
Over the past decade, aerial photogrammetry using Unmanned Aerial Vehicles (UAVs) has become a reliable technique for characterizing rock masses. This technology relies on three-dimensional reconstruction algorithms, such as SfM and MVS, which enable the DSMs and dense point clouds by overlapping images captured from multiple angles. Its use has expanded in geotechnical engineering due to its low cost, ease of implementation, and ability to acquire data in hazardous or hard-to-reach areas, reducing risks for field personnel and improving spatial coverage [5].
Several studies have shown that the quality of the generated models depends directly on factors such as image resolution, the type and quality of sensors, georeferencing methods (RTK, PPK, or ground control points), and the site’s physical and environmental conditions. For instance, Migliazza et al. [1] demonstrated that the combination of UAVs and close-range photogrammetry using professional cameras allows the generation of detailed rock surface models with geometric precision of up to ±3 cm, facilitating the identification of principal failure planes.
Other works have focused on optimizing the technical process. Refs. [4,7] highlighted the importance of selecting suitable sensors (RGB, thermal, multispectral, or LiDAR) and planning flights that ensure sufficient image overlap, uniform lighting conditions, and complete coverage of the rock mass. Meanwhile, previous studies [8,9] pointed out that slight variations in flight altitude or camera calibration errors can significantly affect the density and accuracy of the 3D model, especially in areas with vegetation or shadows.
More recently, automated and semi-automated analyses have been incorporated. In particular, previous research [14] proposed a semi-automatic segmentation method that utilizes K-means clustering applied to the normal vectors of point clouds and digital elevation models (DEMs). This approach allowed the classification of the slope into three stability zones, based on the comparison between the local inclination angle and the internal friction angle. The method stood out for its speed and reproducibility and because it reduced the need for additional field data, although it is sensitive to initial parameters and does not consider the physical characteristics of the discontinuities.
A terrestrial laser scanning (TLS)-based approach combined with multiscale K-means analysis was applied to achieve high-resolution semi-automatic recognition [15]. This method enables the analysis of complex rock masses at multiple scales, although it requires expensive equipment and substantial computing resources for processing.
A hybrid approach combining UAV, TLS, and a fused point cloud was proposed to enhance the detection of fault geometries and discontinuities [16]. This method employed deep learning techniques (PointNet++) for semantic segmentation and validated its result using kinematic models, demonstrating high geometric precision. However, it requires model training and significant computational power.
An automatic system for the detection and classification of discontinuities using UAVs, 3D models, and convolutional neural networks was developed by [17].
A comparative summary of these recent studies is presented in Table 1, highlighting the main methodological approaches, technologies used, and advantages and limitations observed in each case. This table reveals a clear trend toward automation and the use of artificial intelligence in geomechanical analysis, with proposals that integrate UAVs, laser scanners, segmentation algorithms, and neural networks. Likewise, although these methodologies significantly improve efficiency, coverage, and replicability, they still face significant challenges such as sensitivity to input parameters, environmental conditions, and the need for validation with field data. The present study fits within this context, proposing a methodological strategy that balances semi-automated processes with expert technical judgment. It optimizes the characterization of discontinuities in complex environments through the combined use of manual digital techniques and semi-automatic analysis.

Table 1.
Comparative summary of recent studies on geomechanical characterization using UAVs and digital techniques.
Other recent studies have focused on microstructural and stress-induced failure mechanisms in rock and coal using techniques such as in situ nuclear magnetic resonance and folding catastrophe models [18,19]. Although these approaches address different spatial and mechanical scales, they complement digital and photogrammetric methods by broadening the understanding of rock behavior under varying stress and structural conditions.
3. Study Site Description
This study site is a rock slope located along State Highway No. 171, between Morelia and Pátzcuaro, in Michoacán, Mexico. It consists of an exposed road cut, approximately 100 m in length and reaching a maximum height of 14 m at its highest point. Just a few meters away lies the Cointzio Dam, an important water supply source for the city of Morelia and its surrounding areas. Figure 1 and Figure 2 show the geographical location of the study site and its position relative to the highway.
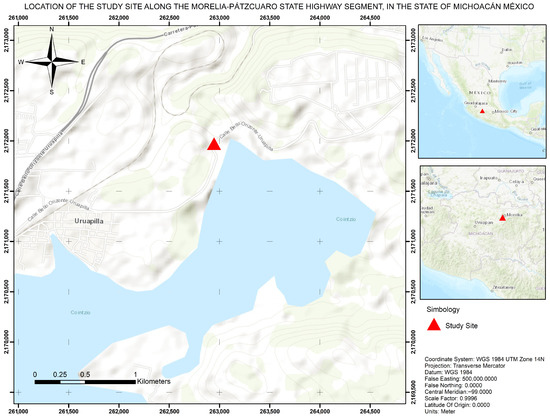
Figure 1.
Location of the study site along the Morelia–Pátzcuaro state highway segment, in the state of Michoacán, México. The red triangle indicates the position of the exposed rock slope analyzed in this study. The map includes a regional and national reference for geographic context.
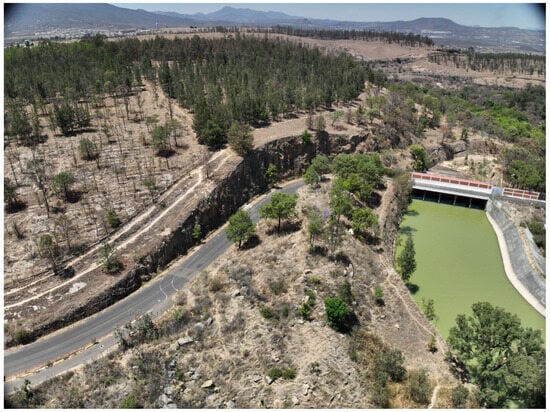
Figure 2.
Rock slope adjacent to the dam used for the geomechanical analysis showing the area surveyed by UAV and the reference points applied in the photogrammetric reconstruction.
The area is part of the Trans-Mexican Volcanic Belt, a physiographic province characterized by predominantly mountainous terrain with a wide variety of landforms, including mountain ranges, volcanic cones, and ash deposits [20,21]. As a result, the prevailing lithology at the site corresponds to ignimbrite, a volcanic igneous rock composed of a glassy matrix with embedded pumice fragments, exhibiting a well-defined fracture pattern.
The region has a temperate sub-humid climate, with rainfall primarily concentrated during the summer months. These conditions favor dense vegetation growth, particularly along the upper portion of the slope. However, the survey was conducted during the dry season, which facilitated visibility and maneuverability in the field and allowed for the removal of vegetation at the base and face of the slope for the execution of the conventional geomechanical survey.
For the photogrammetric survey, an existing trail located at the southern end of the slope was used to access the upper part of the outcrop, allowing for the placement of ground control points (GCPs) and the execution of UAV aerial flights from that location.
4. Materials and Methods
The methodology implemented in this study integrates traditional field measurements with digital measurement techniques and semi-automated processes applied to three-dimensional photogrammetric models, with the aim of analyzing discontinuities in rock slopes. This methodology is structured into three main approaches, as shown in Figure 3.
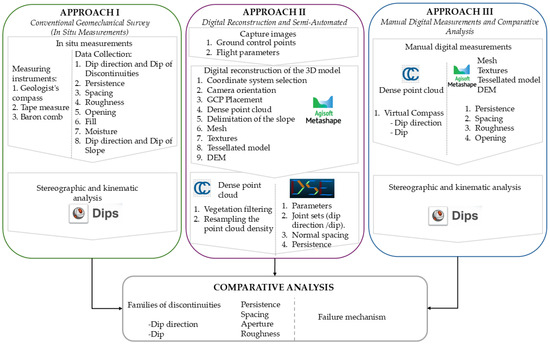
Figure 3.
General workflow of the methodology applied for discontinuity analysis in rock slopes.
In Section 4.1, a conventional geomechanical survey was carried out directly on the slope, recording the geometric and physical properties of the discontinuities using manual instruments. In Section 4.2, a three-dimensional reconstruction of the slope was performed using images captured by an Unmanned Aerial Vehicle (UAV), applying photogrammetric restitution techniques to generate detailed digital products. Finally, in Section 4.3, manual measurements were performed on the 3D model, allowing the results obtained in the field to be complemented and compared with those derived from digital analysis.
This methodology made it possible to contrast the information obtained through different approaches, facilitating the identification of the advantages and limitations of each method.
4.1. Approach I: Conventional Geomechanical Survey (In Situ Measurements)
The conventional field survey was conducted following the guidelines of the International Society for Rock Mechanics [22] and the classification systems proposed by [23]. Measurements were carried out directly on the rock slope using a geological compass, clinometer, and measuring tape. For each discontinuity plane, the orientation (dip and dip direction), spacing, persistence, aperture, and infilling were recorded. The survey area covered the lower accessible area of the slope, where a total of 61 discontinuities were measured. These data were later used as reference values for comparison with the digital and semi-automatic analyses.
For the in situ geomechanical survey, conventional tools were used, including a geological compass, measuring tape, and a Barton comb, the latter deployed to estimate surface roughness. For each exposed discontinuity plane, the following parameters were recorded:
- Dip and dip direction;
- Spacing;
- Persistence;
- Aperture;
- Type of infill (if present);
- Degree of moisture;
- Degree of weathering;
- Roughness.
Additionally, the general orientation of the slope and its inclination angle were measured to assess the potential failure mechanism. The data collected in the field were subsequently analyzed using stereographic projections through the Dips software version 8.011. This tool allows the representation of discontinuity planes on a Schmidt projection, facilitating the identification of dominant sets through statistical analyses based on the Fisher distribution. Dips also enable preliminary kinematic analysis by considering the most common failure modes in rock masses, such as planar sliding, wedge failures, and toppling. This analysis is based on the comparison between the orientations of the discontinuities and the geometry of the slope, allowing the evaluation of the kinematic compatibility of potential failure mechanisms.
To facilitate the precise identification of discontinuities measured in the field within the generated 3D model, the selected planes were marked on site using white chalk. This strategy is proposed to provide visual reference points that enabled the subsequent matching between conventional field measurements and the digital measurements carried out on the photogrammetric model.
Fieldwork was conducted along a 60 m section, where a conventional geomechanical survey was performed through direct measurements on the exposed rock surface. A total of 61 discontinuity planes were recorded, all located in the lower part of the slope. The selection of these planes was based on their relevance and the specialist’s judgment, prioritizing those that contribute to wedge formation or planar failures with representative geometric characteristics.
The conventional geomechanical survey was conducted using manual tools such as a geological compass, measuring tape, and Barton comb. For each accessible selected plane, the following parameters were recorded: dip and dip direction, spacing, persistence, aperture, type of infill, degree of weathering, degree of moisture, and surface roughness.
To ensure an equivalent evaluation between methods, each plane was marked with white chalk directly on the slope surface, using a visible numbering system that matched the field records. Most measurements were taken on planes free of vegetation and with sufficient visibility. However, some areas required a slight clearing of the surface to properly measure and mark the selected planes. Figure 4 illustrates the process of marking, measuring, and recording discontinuities during the conventional field survey.
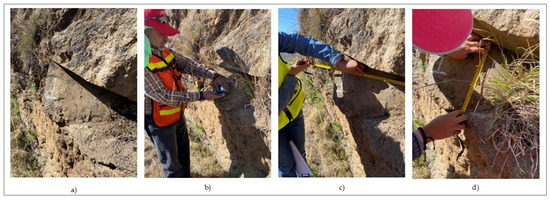
Figure 4.
Field recording during the conventional geomechanical survey. (a) Marking of discontinuity plane with white chalk; (b) measurement of dip and dip direction with a geological compass; (c) measurements of persistence using a measuring tape; (d) measurement of discontinuity aperture.
4.2. Approach II: Digital Reconstruction and Semi-Automated Analysis
The second approach of the methodology consisted of generating a three-dimensional model of the slope using digital photogrammetry techniques, followed by a semi-automated analysis based on point cloud data (Figure 5).
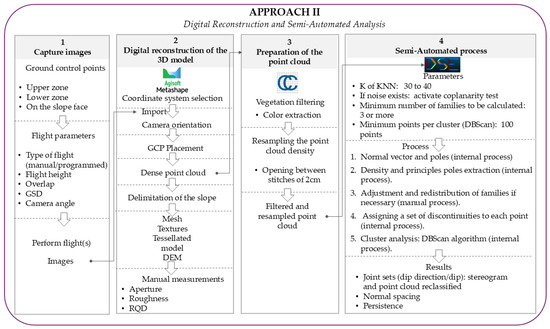
Figure 5.
Workflow for Approach II.
This approach is divided into the following stages:
4.2.1. Image Capture
UAV-based image acquisition covered the upper zone, the base, and the frontal face of the slope, ensuring complete coverage of the outcrop. To ensure accurate georeferencing of the 3D model, GCPs were strategically distributed across each of these zones, and their positions were precisely determined using high-precision topographic equipment. Flight parameters were then defined according to the mission type (manual or programmed), altitude, overlap percentage, ground sampling distance (GSD), and camera tilt angle, ensuring proper coverage of the study area. This enables the acquisition of a dataset of images to be used as input for the 3D reconstruction process.
Upon completion of the geomechanical survey, a photogrammetric survey was conducted, employing two types of UAV flights: one programmed and one manual. The UAV used was a DJI Mavic 3M, equipped with a 20-megapixel RGB camera. The programmed flight followed a single-grid pattern at an altitude of 30 m above ground level, with 80% frontal and lateral overlap. The manual flight consisted of two inspection lines: one as close as possible to the base of the slope and another at mid-height. The camera was oriented perpendicular to the slope face to capture complementary images and achieve better reconstruction of vertical planes.
Before the flights, 12 GCPs were placed as follows:
- Four on the slope face, using 10 × 10 cm markers;
- Four at the base, on the roadway pavement, marked with “L” shaped paint markings approximately 1 × 1 m, interspersed;
- Four at the top of the slope, using 1 × 1 m plastic markers.
The GCPs were surveyed using high-precision topographic equipment, achieving an average re-projection error of 5 cm for the markers within the three-dimensional model.
Weather conditions during the fieldwork were optimal: clear skies and good lighting were present during most of the survey. However, starting around 1:00 p.m., certain areas of the slope began to cast shadows, which were considered during flight planning to minimize their impact on image quality.
4.2.2. Three-Dimensional Model Reconstruction
The images were processed in Agisoft Metashape [24] using SfM workflow. GCP coordinates were then integrated and manually adjusted to optimize model accuracy. A dense point cloud was generated, from which the slope boundary was delineated, and the corresponding photogrammetric products were derived: triangular mesh, textured model, tessellated model, and digital elevation model (DEM).
The combination of flight modes enabled the optimization of image coverage and quality in areas with difficult access and complex geometries, which is common in rock slopes. The photogrammetric workflow consisted of the following stages: (1) image alignment, (2) optimization of internal camera parameters, (3) incorporation of GCPs, and (4) generation of the following outputs:
- Dense point cloud: derived from 3D reconstruction based on overlapping images, representing the detailed geometry of the slope surface.
- Three-Dimensional mesh: a triangulated surface model generated from the dense point cloud, which delineates the contours and geometric relationships between discontinuity planes in the rock mass.
- Textured model: created by mapping the original image onto the 3D mesh, providing a realistic visualization of the slope’s features and aiding in the identification of marked discontinuities.
- Digital elevation model: extracted from the point cloud and rasterized to represent the topography of the slope, enabling profile extraction for roughness analysis.
- Orthomosaic: a set of geometrically corrected and seamlessly stitched images, useful for both general reference and the precise location of marked discontinuity planes.
Photogrammetric processing of the 3D model presented the following technical characteristics:
- Number of images used: 556 RGB images;
- Coordinate system: UTM Zone 14 N, WGS84 datum;
- Average flight altitude: 26.6 m;
- Ground Sampling Distance (GSD): 6.21 mm/pixel;
- Mean reprojection error (GCPs): 1.33 cm;
- Dense point cloud with 7,519,710,743 points, processed at “ulta-hig” quality. The total processing time was approximately 2 h and 19 min. However, this parameter depends on computer specifications and is provided only for reference, as it does not affect the analytical result.
- Model accuracy was evaluated through the reprojection error of the GCPs, achieving an average value of 1.33 cm. Figure 6 shows the spatial distribution of this error, where most GCPs exhibit values below ±2 cm, ensuring an adequate geometric quality of the 3D model.
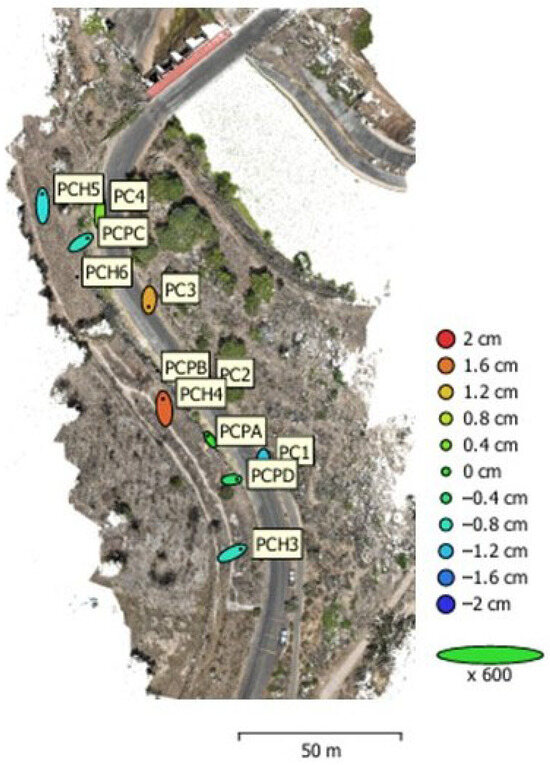 Figure 6. Spatial Distribution of GCP Reprojection Error. Each Ground Control Point (GCP)’s location and associated reprojection error are expressed in centimeters. Most GCPs show values below ±2 cm, indicating high geometric accuracy in the photogrammetric model.
4.2.3. Point Cloud Preparation
The point cloud was exported to CloudCompare [10]. We applied a color-based filtering process to remove vegetation and retain only the exposed rock surface. This procedure can be repeated as many times as necessary to adequately reduce noise in the dataset. Once filtering was complete, the point cloud was resampled, maintaining an approximate point spacing of 2 cm. This resulted in a clean and optimized point cloud suitable for the semi-automated analysis. The initially generated point cloud included a broad area of the slope’s surrounding environment. Therefore, a specific delimitation was applied to retain only the portion corresponding to the study slope, reducing the dataset to 368,137,001 points.
Figure 7 presents two comparative views of the generated 3D model: Figure 7a shows the full model, which includes the immediate surroundings of the slope, while Figure 7b displays the delimited point cloud, focused exclusively on the rocky slope face for detailed geomechanical analysis.
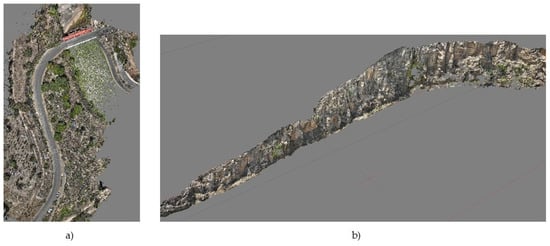
Figure 7.
Comparison of 3D point cloud models. (a) Full 3D model including the surrounding road environment. (b) Delimited point cloud focused exclusively on the rock slope for detailed geomechanical analysis.
4.2.4. Semi-Automated Process
The analysis was conducted using the open-source DSE [11], which enables semi-automated identification of discontinuities from the point cloud. The following key parameters were defined:
- K-nearest neighbors (K-NNs): set between 30 and 40. The value of K was selected following the recommendations of [2,11]. Values between 30 and 40 provide an optimal balance between the detection of coplanar regions and the reduction of over-segmentation, ensuring stable normal vector estimation across heterogeneous environments.
- Coplanarity test activation: recommended when residual noise remains due to unfiltered vegetation, shadows, or other visual interferences.
- Minimum number of discontinuity sets to be calculated: at least three, since multiple joint families are typically required to assess complex failure mechanisms.
- Minimum number of points per cluster (DBScan): 100 points, to prevent small groupings from being misinterpreted as actual joint planes.
Once the parameters were set, the internal workflow of the software was followed. This began with the identification of normal vectors and the application of the coplanarity test, followed by the automatic extraction of principal poles. Although these processes are automated, the user must interpret the resulting stereonet, identify the areas with the highest pole density, and manually reassign or add joint families if necessary.
After the manual adjustments, the software assigns each point in the cloud to a joint set and applies the DBScan clustering algorithm to filter out groups with fewer than 100 points.
The following results were obtained from the semi-automated analysis:
- Orientation (dip and dip direction) of joint sets, represented both in stereographic projections and in the color-classified point cloud, where each color corresponds to a specific discontinuity family.
- Normal spacing between discontinuities for each identified joint set.
- Estimation of the average persistence for each discontinuity family.
The semi-automated discontinuity analysis was performed using the DSE [11], based on the point cloud that had been previously processed and filtered in CloudCompare [10]. The goal of this process was to identify and classify the principal discontinuity families present in the rock slope and to determine associated geometric properties, such as orientation, spacing, and persistence.
Parameters used in DSE:
- K in K-NN algorithm: 30.
- Coplanarity test: enabled, due to incomplete filtering of vegetation and shaded areas.
- Minimum number of points per cluster (DBScan): 100
- Initial number of families: initially set to three, then redistributed into six main families based on the grouping patterns observed in the stereographic projection.
The DSE automatically calculates the orientation parameters (dip, dip direction, and dispersion) of each discontinuity cluster detected within the point cloud. These geometric data were subsequently used to determine the kinematic adjustment factor of the SMR, following the empirical relationships proposed by [23]. Specifically, the angular difference between the slope face and the mean plane orientation was used to derive the coefficients F1, F2, and F3, which represent the correction terms associated with the direction, dip, and potential failure mechanism, respectively. According to [25], these coefficients can be computed either using the original analytical expression of SMR or by applying equivalent geometric relationships based on 3D model data, which are consistent with the information extracted by the DSE. Therefore, the kinematic influence was implicitly incorporated into the methodology through the DSE-based extraction and statistical characterization of discontinuity sets.
4.3. Approach III. Manual Digital Measurements and Comparative Analysis
The manual measurement of the geometric properties of discontinuities in a rock slope uses the photogrammetric products previously generated in Approach II, see Section 4.2. Manual measurements were subsequently performed on these products, including estimations of joint aperture, surface roughness, and the Rock Quality Designation (RQD) index.This stage aimed to complement and contrast the results obtained through traditional field methods with those derived from three-dimensional models, including both semi-automated processes and manual digital measurements, allowing for an evaluation of the consistency and usefulness of each approach (Figure 8).
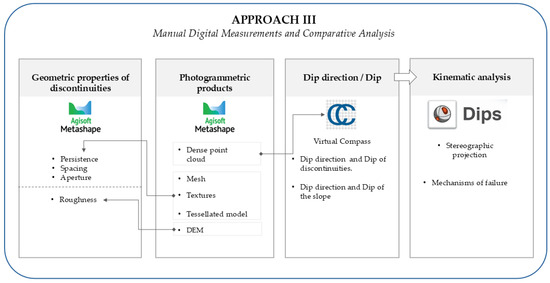
Figure 8.
Workflow for Approach III.
The photogrammetric products generated in Agisoft Metashape [24], including the dense point cloud, 3D mesh, textured model, tessellated model, and digital elevation model (DEM), were used as the basis for determining the geometric properties of discontinuities and the orientation of the slope.
The geometric properties of discontinuities, persistence, spacing, aperture, and roughness were manually measured on the digital models (mesh, textures, DEM) using the following criteria:
- Persistence: measured as the exposed length of the discontinuity plane within the 3D model.
- Spacing: the average perpendicular distance between two parallel planes that belong to the same joint set.
- Aperture: estimated based on the visible separation between the walls of the discontinuity plane.
- Roughness: determined by analyzing extracted profiles from the digital elevation model and comparing them visually against the Barton scale to assign a quantitative value.
The orientation (dip and dip direction) of the discontinuities and the slope were obtained from the point cloud using the virtual compass tool in CloudCompare [10]. To ensure a valid comparison with the conventional method, the same discontinuity planes previously measured and physically marked in the field were analyzed in the 3D model for accurate identification. The slope orientation was calculated using the same tool by projecting a reference line onto its surface.The measurement points were selected on clearly visible discontinuity planes previously identified and marked in the field. Priority was given to topographically accessible, flat surfaces free of vegetation, shadows, or image noise, allowing the virtual compass to compute reliable values of dip and dip direction.
The orientation data were then imported into Dips software, and the stereographic projections were generated to identify the principal families and assess potential failure mechanisms (planar sliding, wedge failure, and toppling). This information enables a direct comparison with the results of the conventional survey, aiming to validate the accuracy of the manual digital method and analyze its advantages, limitations, and reliability.
To directly compare the results from the conventional geomechanical survey with those from the semi-automated method, a manual digital measurement of discontinuities was performed on the three-dimensional model generated through photogrammetry.
This process was carried out in CloudCompare, utilizing the virtual compass tool, which enables the definition of a plane over the point cloud by precisely selecting vertices on the rock surface. For each defined plane, the software automatically calculates the dip direction and dip, generating a normal vector represented in 3D space.
A total of 61 discontinuity planes were measured, the same ones previously marked and recorded in the field, ensuring direct equivalence for comparative analysis. Each plane was manually adjusted over the slope surface, carefully aligned with the visual. Figure 9 presents a general view of the 3D model with the generated planes, each displayed using vectors according to its spatial orientation.
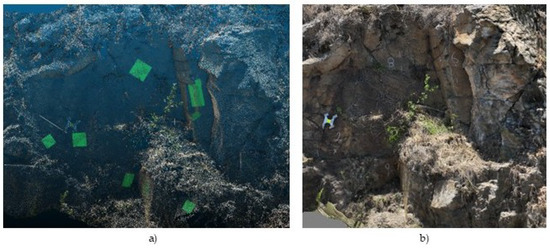
Figure 9.
View of the 3D model and manually generated planes. (a) Visualization of the point cloud in CloudCompare, showing manually defined discontinuity planes using the virtual compass tool. (b) Textured model with visible markings corresponding to field-measured discontinuities, allowing direct identification within the digital environment.
5. Results
Were obtained by applying the three previously described methods: conventional geomechanical field survey, semi-automated analysis based on photogrammetric models, and manual digital measurements performed on a three-dimensional model. The implementation of these three techniques at the same study site, beyond enabling the identification of instability mechanisms in a rock slope, aims to evaluate the consistency among the applied methods and analyze their main advantages and limitations.
5.1. Conventional Analysis
This section presents the results obtained from the conventional geomechanical survey, conducted through direct measurements on the exposed rock slope. A total of 61 discontinuities were evaluated, recording parameters such as dip direction and dip, spacing, persistence, aperture, roughness (JRC), infill type, moisture content, and degree of weathering, as well as the orientation of the slope face for subsequent kinematic analysis.
Based on the orientations obtained, a stereographic projection was generated (Figure 10), in which five principal discontinuity families (JS1 to JS5) were identified, along with a sixth dispersed family that may also be considered part of the structural system. These groupings help define dominant configurations relevant to slope stability assessment.
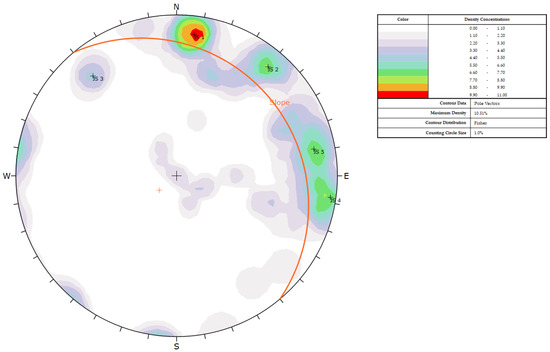
Figure 10.
Upper hemisphere Schmidt equal-area stereographic projection showing discontinuities measured in the field during the conventional geomechanical survey. Pole density contours were calculated using Fisher statistics, identifying five main structural families (JS1 to JS5) and a sixth dispersed family.
The pole density contours were computed using Fisher statistics with a 2% contour interval, following the default method implemented in Dips software [26].
The average values obtained in the field are presented in Table 2.
Table 2.
Average geomechanical parameters obtained from the conventional field survey.
Based on the structural data and slope geometry, a kinematic analysis was carried out using the Dips software. The results are summarized in Figure 11, which illustrates the four main failure mechanisms evaluated: planar, wedge, direct toppling, and flexural toppling.
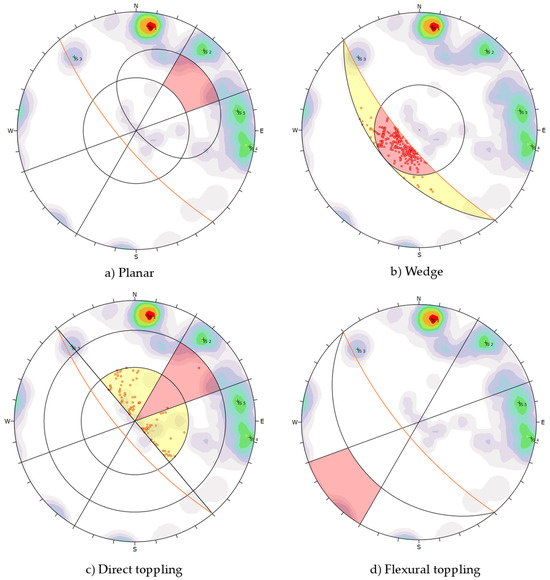
Figure 11.
Results of the kinematic analysis based on conventional survey data, evaluating planar failure.
The results suggest that the most critical failure modes correspond to planar and wedge failures, which should be prioritized in any slope stability assessment. On the other hand, direct toppling may occur under specific geometric conditions, although its incidence is low. Flexural toppling, meanwhile, does not represent a significant risk under the current slope conditions.
5.2. Semi-Automated Analysis
The algorithm identified six discontinuity families, derived from the analysis of the normal vectors in the point cloud. The pole concentrations were plotted in a stereographic projection (Figure 12), where well-defined groupings were observed, suggesting a heterogeneous structural system.
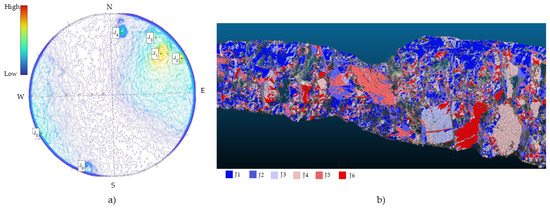
Figure 12.
Structural classification of discontinuities using semi-automated analysis with DSE. (a) Stereographic projection with pole density contours corresponding to the six identified discontinuity families (J1 to J6), derived from the normal vectors extracted from the 3D model. (b) Processed point cloud of the slope, color-coded according to the structural family assigned by the DSE software version 3.01. Each color represents a specific family, allowing clear visualization of the distribution and relative orientation of the structural planes across the slope face.
Table 3 summarizes the dip direction and dip angle for each identified discontinuity family:
Table 3.
Orientation of discontinuity families.
These values enable a more accurate characterization of the spatial orientation of the structural discontinuity sets, facilitating their integration into kinematic and geomechanical models.
In Figure 12, the stereographic projection generated from the calculated normal vectors is shown, along with the corresponding color-coded point cloud. Each color represents a structural discontinuity family identified by the software, clearly illustrating the consistency between the spatial grouping and its oriented projections.
In addition to geometric analysis, DSE allows for a preliminary kinematic assessment by calculating the F1, F2, and F3 coefficients, following the methods proposed by [23,25], to evaluate the potential occurrence of planar and toppling failure mechanisms.
Figure 13 and Figure 14 show the kinematic histograms generated using coefficients for the six discontinuity families. Conditions favorable to planar failure are observed in most groups, particularly J1, J2, and J3. To a lesser extent, possible toppling conditions were identified in families J4 and J5.
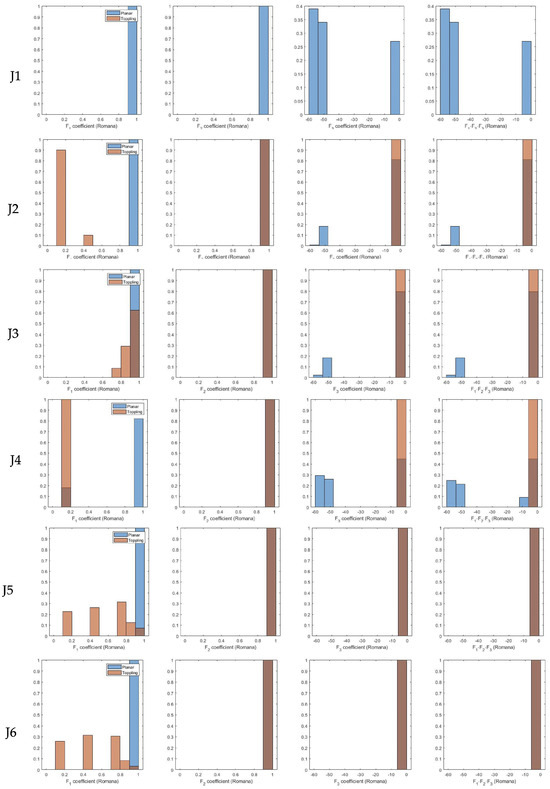
Figure 13.
Distribution of kinematic coefficients using the [23] method. Histograms of the coefficients F1, F2, F3, and the product F1*F2*F3, calculated based on the [23] method for the six structural sets (J1 to J6). Colors indicate the type of potential failure mechanism: black for planar sliding, orange for toppling, and brown for configurations not favorable for failure.

Figure 14.
Distribution of kinematic coefficients using the [25] method. Histograms of the coefficients F1, F2, F3, and the product F1*F2*F3, calculated according to the [25] method. The six discontinuity families (J1 to J6) are analyzed in terms of geometric conditions that favor planar or toppling failures. Colors indicate the type of potential failure mechanism: blue for planar sliding, orange for toppling, and brown for configurations not favorable for failure.
The coefficient values indicate that in most cases, the criteria F1 > 0.856 and F2 > 0.85 are met, which reinforces the likelihood of planar failure. The F3 values allow the relative stability to be assessed based on the inclination of the slope relative to the orientation of discontinuities.
The persistence of discontinuities was evaluated based on the extension of the planar segments assigned to each family (J1 to J6). Histograms were generated for four persistence components:
- Dip direction.
- Strike direction.
- Maximum length.
- Projected area.
The results showed exponential-type distributions, which are typical of natural fracture systems. Families J2 and J5 exhibited notably higher average persistence values, which may correspond to more continuous planes within the rock mass. However, these values may also be influenced by how the algorithm interprets the local geometry or point density in those areas (Figure 15).
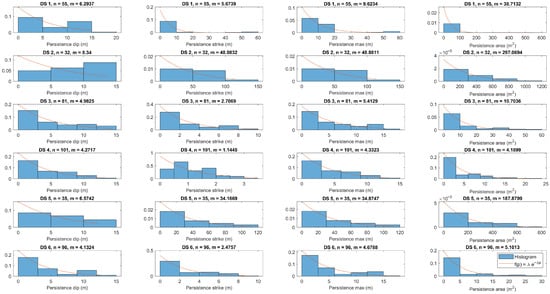
Figure 15.
Discontinuity persistence distribution. Persistence histograms for the six families, evaluating four geometric components: dip direction, strike direction, maximum length, and projected area. The fitted curves exhibit exponential distributions, typical of natural fracture systems. Higher persistence is observed in join sets J2 and J5, indicating the presence of more continuous or extensive planes within the rock mass.
Discontinuity spacing was evaluated under two approaches:
- Including all extracted planes (non-persistent);
- Including only those classified as persistent, defined based on minimum length, projected area, and consistency with the predominant orientation of each family.
In the resulting histograms (Figure 16), the spacing values for persistent discontinuities exhibit sharper and more concentrated distributions, indicating greater geometric coherence. In contrast, the analysis that includes all discontinuities results in a much more dispersed distribution. This difference highlights the importance of applying geometric persistence filters, such as minimum length, projected area, or orientation consistency, to exclude minor discontinuities or noise and obtain more representative metrics.
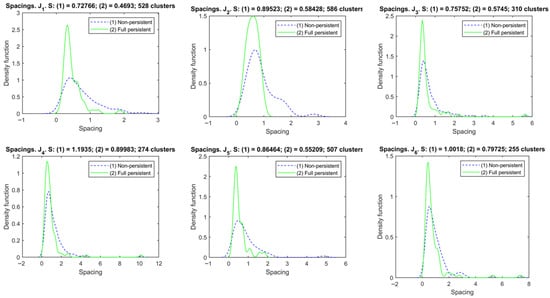
Figure 16.
Normal spacing distribution between discontinuities. Histograms of normal spacing for the six discontinuity families, comparing two scenarios: all discontinuities (blue dashed line) versus only persistent discontinuities (green solid line). The persistent discontinuities show sharper, more concentrated distributions and more representative spacing values, indicating greater structural and geometric consistency compared to the full set.
5.3. Manual Digital Analysis
The collected data were exported and used for stereographic and kinematic analysis in the software Dips to identify clustering patterns and potential failure mechanisms. Figure 17 shows the stereographic projection of poles generated from the digital measurements, where five principal families (JS1 to JS5) were identified, along with a sixth, more dispersed set. The digitally measured slope plane was also incorporated in the same physical location as in the field, enabling a direct comparison.
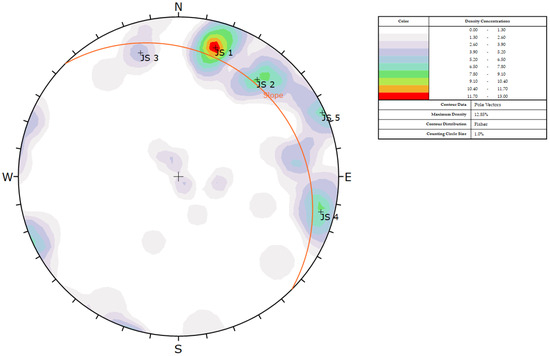
Figure 17.
Stereographic projection of digitally measured planes. Upper hemisphere stereographic projection obtained from the 61 discontinuities measured on the 3D model. Five main families (JS1 to JS5) and one dispersed set are identified. The orientation of the slope face, measured digitally, is also included for kinematic comparison.
In Figure 18, the results of the kinematic analysis are presented based on the five dominant families. Failure mechanisms such as planar sliding, wedge failure, direct toppling, and flexural toppling were evaluated. The results indicate that the most critical conditions correspond to planar and wedge-type failures, which show a higher likelihood of occurrence based on the observed geometry. In contrast, configurations associated with toppling failures exhibited a lower incidence at the study site, suggesting a reduced kinematic probability for this type of instability.
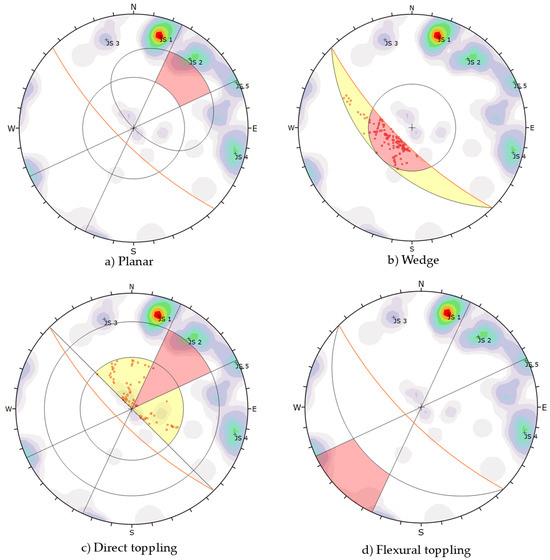
Figure 18.
Kinematic analysis based on digital measurements. Representation of potential failure mechanisms identified through kinematic analysis in Dips. Colored zones indicate areas of potential intersection with the slope face.
Additionally, the persistence and spacing of the discontinuities were obtained using Agisoft Metashape through measurements over the generated photogrammetric products (3D mesh, textured model, and point cloud). These measurements were performed on the same 61 planes previously identified and digitally marked on the model.
Persistence was measured as the visible length of each discontinuity plane on the 3D surface, using the distance tool to measure the distance between endpoints. The set of measurements yielded an average persistence of 1.96 m, with values ranging from 0.20 m to 15.03 m, highlighting the natural variability of the rock mass and the differing visibility across the model.
Spacing was estimated as the average perpendicular distance between parallel planes of the same structural family, using visible spatial references in the model. The average spacing was 1.03 m, with values ranging between 0.14 m and 5.15 m, and a higher density of fracturing was observed in families JS1 and JS3.
These results quantitatively complement the geometric analysis and confirm the effectiveness of the photogrammetric model as a reliable tool for geomechanical characterization under real terrain conditions, especially when aiming to reduce operational risk and improve the efficiency of data acquisition.
5.4. Classification Rock Mass Rating (RMR) and Slope Mass Rating (SMR)
Table 4 presents a comparative summary of the geomechanical classifications RMR [27] and SMR [23], obtained through the three analyzed approaches: (1) conventional, (2) manual digital, and (3) semi-automatic. The values reflect the weightings established by the RMR classification, based on the geometric and physical parameters of the discontinuities.
Table 4.
Comparison of RMR and SMR results obtained through three geomechanical characterization methodologies.
In the first two approaches (conventional and manual digital), identical results were obtained, since both methods follow a similar reading logic. The base RMR value was 61, and after applying the orientation correction for slope cases, the final RMR was 36, corresponding to Class IV, considered “poor” quality.
In contrast, the semi-automatic method yielded a slightly lower base RMR value (59) and a corrected RMR of 34, which also corresponds to Class IV, thus maintaining consistency in the overall classification of the rock mass.
For the SMR classification, the same discontinuity family was considered in all three cases, corresponding to the most unfavorable for planar failure. This allowed for the calculation of the product of factors F1, F2, and F3 under comparable conditions. Both the conventional and manual digital methods classified the slope as “stable,” recommending treatments such as rock bolts, wire mesh, and scaling. In contrast, the semi-automatic method—despite only a minor variation in values—classified the slope as “partially unstable,” which implies the additional use of shotcrete as a complementary support measure.
The difference between the stability classifications is mainly associated with the number and spatial resolution of the discontinuities detected by each approach. The semi-automatic method identifies a greater number of planes, including minor and dispersed families that are often not captured during manual surveys. This higher detection density slightly reduces the overall safety margin, resulting in a “partially unstable” classification. In contrast, the conventional and digital manual methods rely on selective measurements of principal planes, which depend on the specialist’s judgment and tend to simplify the structural configuration of the discontinuities, leading to a stable result. These findings highlight the sensitivity of the SMR index to the completeness of discontinuity data and the potential of semi-automatic methods to reveal important instability conditions that are not evident through traditional observations.
Overall, the three approaches yielded consistent results in classifying the rock mass. However, it is worth noting that the semi-automatic method enabled the evaluation of the entire slope, whereas the other two methods were limited to the lower section. Furthermore, the conventional method requires a higher investment of time and resources. Both the digital manual and semi-automatic approaches significantly reduce fieldwork time. However, the former requires an expert’s intervention during post-processing, while the latter relies on complementary parameters obtained through conventional and manual digital methods to achieve reliable interpretation.
These findings support the proposal of a combined methodology that integrates both the semi-automatic and manual digital approaches, leveraging their respective strengths to improve the efficiency and reliability of geomechanical slope characterization.
6. Discussion
The integrated analysis of the three applied methods, conventional geomechanical survey, manual digital measurement, and semi-automatic analysis, allows for the identification of key coincidences, advantages, and limitations from both technical and operational perspectives. Additionally, this comparative approach serves as a cross-validation among the methods used.
In terms of identifying and classifying structural discontinuity families, both conventional and manual digital methods agreed on identifying five principal families and one dispersed family. In contrast, the semi-automatic method not only agreed with the same five families but also defined a much more transparent and coherent sixth family, demonstrating greater statistical grouping capacity, provided that a wee-filtered point cloud is used.
Regarding the measurement of geometric parameters, the semi-automatic method showed higher precision in quantifying persistence and spacing, although its interpretation may be more complex. Conversely, the manual digital method proved to be a reliable alternative, with results that were highly consistent with field data. It also allows for expanding the number of measurements beyond the 61 marked initially, especially in hard-to-reach areas such as the upper parts of the slope. While digital measurement also takes time, it is significantly shorter than the traditional method.
One of the main advantages of both the digital manual and semi-automatic methods is that the analysis can be performed from any location, using the 3D model, thus reducing dependence on fieldwork. Moreover, data acquisition time is significantly reduced, and operational safety is improved for technical personnel. However, both methods present limitations in characterizing parameters such as infill or moisture, as these typically require direct sensory evaluation on site.
These results are consistent with previous studies that have explored UAV-based and semi-automatic techniques for rock slope analysis. Battulwar et al. [2] demonstrated that semi-automatic segmentation of photogrammetric point clouds can achieve accuracies comparable to terrestrial laser scanning (TLS), while [12,28] showed that segmentation quality and point-cloud density directly influence the identification of major discontinuity families. Similarly, the works [29,30] emphasized that UAV photogrammetry significantly improves coverage and operational safety in hard-to-access areas, advantages that were also observed in this study.
The semi-automatic method stands out for its high potential for replicability and automation, provided that the input parameters are properly defined and a transparent, robust methodology is established. This approach can reduce the need for direct specialist intervention, which is beneficial in contexts where highly experienced personnel may be unavailable. However, its effectiveness depends on the quality of the point cloud. In the case of rock masses, vegetation and shadows can introduce noise that affects the quality of the results. Even so, applying an appropriate filtering and optimization strategy, such as removing outlier, noise, and redundant points, can still yield reliable results and improve the accuracy of discontinuity detection.
As summarized in Table 5, the quantitative comparison shows the advantages and limitations among the three approaches.
Table 5.
Comparison of methods for rock discontinuity analysis.
The conventional method, despite being the most widely used in practice, presents some limitations: (1) its coverage is restricted to 19% of the total slope area, corresponding only to the lower section analyzed, and (2) it requires a total of 10 h, including both fieldwork and office processing. Although it provides reference data, its efficiency is low compared to digital alternatives.
In contrast, the semi-automatic method achieved 81% coverage, detecting a total of 586 discontinuity planes, which represents almost ten times more information than that obtained with the conventional method. Furthermore, with respect to the field reference, the RMSE was 2.58 degrees for orientation, 0.087 m for spacing, and 2.05 m for persistence, reflecting a superior ability to quantify geometric parameters with a high level of detail. These results confirm that, under appropriate point cloud quality conditions, the semi-automatic analysis constitutes the most robust alternative.
The digital manual method represents an intermediate option. Although its coverage was also 19%, this approach allows for a significant increase in the number of planes analyzed. In this study, the primary purpose was to validate the consistency of digital methods, showing an RMSE of 3.27 degrees for orientation, 0.012 m for spacing, and 0.063 m for persistence. These errors are low, which confirms the reliability of the method, especially when direct field measurements are not possible.
Overall, the comparison shows that although the conventional method remains the basis for rock mass validation and assessment, digital methods provide improvements in terms of efficiency, safety, and replicability. The semi-automatic method offers the greatest coverage and information density, while the digital manual method reinforces and validates the use of digital models in geomechanical characterization.
One of the most relevant contributions of this study is to demonstrate that, from a single photogrammetric model, it is possible to perform various types of geomechanical analyses with different levels of automation and depth. This highlights the potential of digital photogrammetry as a powerful tool to strengthen rock slope stability assessments, improving efficiency, safety, and methodological flexibility.
Finally, this work provides direct validation of the application of photogrammetric, digital, and semi-automatic techniques, in comparison with the traditional method, which remains widely accepted among professionals. This contrast helps dispel doubts about the reliability of innovative methods by demonstrating that, when correctly applied, they can achieve results that are equivalent to or even superior to those of traditional methods.
In the case of RMR and SMR classifications, the observed differences arise from the conceptual relationship between both systems rather than from discrepancies in the collected data. The SMR classification is derived from the basic RMR value, which represents the intrinsic quality of the rock mass before applying any orientation corrections. However, the correction applied in RMR is general and largely dependent on the expert’s judgment, whereas SMR incorporates a more rigorous geometric evaluation through specific correction factors (F1–F4) that quantify the spatial relationship between discontinuity sets and the slope face. These factors allow SMR to assess kinematic conditions such as planar, wedge, or toppling failures. Consequently, while both indices share the same geomechanical foundation, SMR provides a slope-oriented adjustment or RMR that reflects the geometric configuration and potential instability of the rock mass.
SMR incorporates an additional correction factor. In the conventional approach, the survey was limited to only a portion of the slope (mainly the lower section), and the selection of the most unfavorable discontinuity family for RMR correction and SMR calculation was based on expert judgment, supported by field observations and stereographic interpretation. A similar logic was applied in the manual digital method, although with the advantage of performing measurements directly on a 3D model, which allowed for a slight increase in the number of evaluated planes.
In contrast, the semi-automatic method enables a comprehensive analysis of the entire slope, covering all groupings detected during the segmentation process. In this case, the dip direction and dip angle of each family are explicitly defined within the model, allowing for the objective selection of the most unfavorable family based on the SMR correction factors. Unlike the other methods—where the stereogram does not indicate which family each plotted point belongs to—the semi-automatic approach offers a direct correspondence, reducing subjectivity and facilitating the selection of critical conditions for analysis.
Additionally, it is essential to note that both the RMR and SMR systems present inherent limitations that may affect the results regardless of the data acquisition method. One of the main constraints lies in the structure of their rating scales, which use discrete ranges to assign values to geometric and physical properties. When measured values lie near the boundaries between two ranges, slight variations can lead to significant jumps in the total score, potentially altering the final classification. This phenomenon introduces a degree of ambiguity that may compromise the accuracy of results, particularly in studies seeking high resolution or requiring objective criteria for engineering decision-making.
These observations reinforce the importance of using RMR and SMR as reference tools that should be complemented with engineering judgment, detailed kinematic analysis, and, when possible, additional validation methods. Table 6 presents a comparative summary of the main technical, operational, and analytical features obtained through the three approaches applied for discontinuity analysis: conventional geomechanical field survey, manual digital measurement, and semi-automatic analysis. This comparison provides a clear overview of the scope, accuracy, requirements, and limitations of each methodology, as well as objective criteria for determining which approach is most favorable in different contexts.
Table 6.
General comparison of the methods applied for discontinuity analysis.
Regarding the identification of discontinuity families, the conventional and manual digital methods both identified five main families and a sixth dispersed one. This is because both approaches were based on the same set of discontinuity planes. However, the manual digital method allows for the analysis of many more exposed discontinuities, enabling a more comprehensive characterization. The semi-automatic method not only matched the five principal families but also clearly identified the sixth family, positioning it as the most effective approach for detecting discontinuity patterns in dense 3D models.
In terms of average spacing, the results were very similar between the conventional method (1.05 m) and the manual digital method (1.03 m), validating the accuracy of digital measurement when applied to the same planes measured in the field. However, the semi-automatic method yielded a spacing of 0.90 m when considering all detected planes and 0.65 m when limited to persistent planes, highlighting its capacity to identify minor fractures that may go unnoticed with traditional methods.
Regarding persistence, the conventional method showed an average of 2.07 m, the manual digital method 1.96 m, and the semi-automatic method a median of 5.63 m in the dip direction. While this last value may seem high, it is justified by the algorithm’s nature, which groups continuous segments based on spatial density. The median was chosen as a representative measure due to the skewed distribution of the data, improving comparability with the other methods and supporting the validity of the semi-automatic approach.
The aperture of discontinuities was measured directly in the field (0 to 80 mm) and partially in the manual digital method (6 to 42 mm in areas with good visibility). In models affected by vegetation or low resolution, this parameter becomes less reliable, making the conventional method the most accurate for this property. However, under favorable conditions, the manual digital method offers a viable alternative.
Physical parameters such as moisture, infill type, and degree of weathering could only be directly assessed in the field, which remains a significant limitation of digital model-based methods. While visual estimations can be made on 3D models, sensory field inspection by an expert is still indispensable. Nevertheless, future studies could incorporate complementary sensors—such as multispectral cameras—to integrate these variables into the digital environment.
Regarding the kinematic analysis, all three methods identified planar and wedge failures as the most probable instability mechanisms. Some potential for direct toppling was also detected, though with low incidence, and none for flexural toppling. The consistency of results across the methods validates the use of digital techniques in slope stability assessment.
Concerning execution time, the digital manual and semi-automatic methods required only about 2 h in the field to capture the entire slope geometry via photogrammetry, while the conventional method required 6 h to survey only the lower part of the slope. Additionally, the latter required another 3 h to process the data and generate the discontinuity families.
The photogrammetric processing took 3 h, including the generation of the 3D model, point cloud, and vegetation filtering. Subsequently, the manual digital method required an additional 3 h to identify field-measured planes, perform measurements directly on the 3D model, and transfer the results to a stereographic projection.
In contrast, the semi-automatic method required only 30 min to execute segmentation, group discontinuity families, and extract the main parameters. This demonstrates the substantial efficiency of the automated approach in the analysis and processing stage.
Finally, replicability is another crucial aspect of this comparison. In the conventional method, it is low, since even the same expert may record different results in a repeated survey. The manual digital method improves on this, although it still depends on the analyst’s plane selection. In contrast, the semi-automatic approach stands out for its high replicability and autonomy, relying less on individual judgment and more on standardized criteria and automated processes. Therefore, a combination of the semi-automatic and manual digital approaches significantly strengthens the geometric characterization of discontinuities.
Table 7 presents a comparative synthesis of various recent studies focused on the analysis of discontinuities in rock slopes through digital methodologies. It highlights aspects such as the type of analysis performed, sensors used, applied methods, extracted parameters, environmental conditions, and validation schemes, as well as their main advantages and limitations.
Table 7.
Comparison of recent studies on discontinuity analysis using digital methods in rock slopes.
This review enables the present work to be contextualized within the state of the art, highlighting relevant similarities with other approaches, particularly in the pursuit of reducing the human bias inherent in traditional geomechanical characterization, where limited accessibility and strong dependence on expert judgment compromise the precision and replicability of results. In this context, automation through 3D models and segmentation algorithms emerges as a common trend.
However, a key distinction of the proposed approach lies in the fact that, unlike other methods that require advanced programming knowledge or the fine-tuning of multiple parameters, this study presents a semi-automatic methodology with clearly defined visual criteria and recommended parameter ranges. This enables the analysis to be replicated even by personnel with intermediate technical experience, without compromising the quality of the results.
Furthermore, although most of the reviewed studies focus on geometric parameters such as orientation, spacing, or persistence, few address the characterization of physical properties like moisture, type of infill, or degree of weathering. This work acknowledges the limitations of digital models and proposes expert visual inspection on high-quality 3D models as a complementary solution, enhancing interpretation potential without requiring constant physical presence in situ.
Overall, this comparison highlights the strength of the methodological proposal developed in this study, as it integrates semi-automatic processes with specialized technical control, offering an effective balance between precision, operational autonomy, and robustness compared to traditional methods.
7. Conclusions
This study presented a comparative framework for the geomechanical characterization of rock slopes using conventional, digital, and semiautomatic approaches based on UAV photogrammetry. The results revealed both geometric correspondences and operational differences among the methods, providing useful criteria for selecting or combining techniques depending on project requirements.
- All approaches identified five main discontinuity families. However, the semi-automatic method more clearly identified a sixth family, demonstrating a superior capacity for statistical analysis when working with dense and well-filtered 3D models.
- The semiautomatic method achieved 81% coverage and identified 586 planes, with RMSE values of 2.58° in orientation, 0.087 m in spacing, and 2.05 m in persistence, demonstrating its strong quantification capacity for geometric properties. The digital manual method, with 19% coverage, can be extended depending on the specialist’s criteria. However, since its main purpose is model validation, this percentage covered the same area as the conventional method. It was validated with low error (3.27°, 0.012 m, and 0.063 m in orientation, spacing, and persistence, respectively), confirming its reliability, particularly in areas that are difficult to access or when field specialists are unavailable.
- Digital methods enable analysis without direct field exposure, thereby reducing both time and operational risks. The semi-automatic analysis proved to be the most efficient, with shorter processing time and lower technical requirements for interpretation, unlike the conventional and manual digital approaches, which depend more heavily on expert experience.
- Properties such as infill type, moisture, or degree of weathering still require direct field observation. For this reason, the conventional methods remain a reference point for validating sensory aspects that cannot be captured digitally. In the future, digital models are expected to be complemented with additional sensors, such as multispectral or thermal cameras.
- All three methods led to similar classification under the RMR and SMR schemes, categorizing the slope as Class IV (“poor quality”) and suggesting comparable support recommendations. These classifications were performed under equivalent conditions in terms of the discontinuity sets analyzed, which allowed for a direct and objective comparison of the semi-automatic and manual digital methods relative to the conventional approach.Despite this equivalence, the semi-automatic method showed a slight reduction in RMR and SMR values, attributed to its ability to integrate global slope characteristics more comprehensively. Furthermore, this approach enables objective selection of geometric parameters, unlike the conventional and manual digital methods, where the choice of the most unfavorable family depends on the specialist’s judgment. Although the evaluation in this study was applied to the same family across all three methods to maintain comparability, the semi-automatic approach allows for individual analysis of each family identified in the model, representing a significant advantage in complex contexts or when using analysis windows.Moreover, both RMR and SMR have inherent limitations, particularly due to their use of discrete rating intervals. When values are near the boundaries between categories, slight variations can cause significant jumps in the final classification, introducing ambiguity that may affect the accuracy of the analysis. Therefore, these classifications should be used as reference tools, complemented by detailed kinematic analysis and the technical judgment of the specialist.
- The proposed method demonstrated high replicability and reduced dependence on expert judgment. The manual digital method stands as an intermediate option offering greater traceability than the traditional method, though with less objectivity than the semi-automatic approach. Both methods can be used in a complementary manner.
- The semi-automatic method is proposed as the optimal strategy, provided that high-quality 3D models are available and the segmentation parameters are applied correctly. This approach should be complemented with manual digital measurements to refine specific parameters, validate critical zones, or incorporate properties that are difficult to automate. This combination optimizes efficiency, improves precision, and maintains a balance between operational autonomy and specialized technical control.
- All three methods led to similar classification under the RMR and SMR schemes, categorizing the slope class IV (“pore quality”) and suggesting comparable support recommendations. These classifications were performed under equivalent conditions in terms of the discontinuity sets analyzed, which allowed for a direct and objective comparison of the semi-automatic and manual digital methods relative to the conventional approach.
This study directly addresses the research gap identified in the literature by integrating and comparing conventional, manual digital, and semi-automatic UAV-based methods for rock mass characterization. The findings demonstrate that the proposed semi-automatic approach bridges the gap between field precision and digital efficiency, providing a practical and replicable alternative for slope stability assessment.
In conclusion, this study supports the application of advanced digital methods in geomechanical studies, demonstrating that a combined strategy can achieve more comprehensive, safer, and replicable characterizations, even in areas with limited accessibility and dense vegetation. In future work, we are developing an automatic extraction of the geometrical properties using digital image processing and deep learning to identify elements and components that will facilitate the slope stability analysis.
Author Contributions
Conceptualization, M.G.R.-S., J.E.A.-R. and L.A.M.-R.; Data curation, H.R.-R. and J.M.D.-B.; Formal analysis, H.R.-R. and L.A.M.-R.; Investigation, J.E.A.-R. and J.M.D.-B.; Methodology, M.G.R.-S., J.E.A.-R. and L.A.M.-R.; Project administration, L.A.M.-R.; Software, M.G.R.-S.; Supervision, L.A.M.-R.; Validation, H.R.-R., M.L.-B. and L.A.M.-R.; Visualization, M.L.-B.; Writing—original draft, M.G.R.-S., J.E.A.-R. and L.A.M.-R.; Writing—review and editing, H.R.-R., M.L.-B. and J.M.D.-B. All authors have read and agreed to the published version of the manuscript.
Funding
This research was partially funded by Secretaría de Ciencias, Humanidades, Tecnología e Innovación through the scholarship 1006917 and the project 613. Besides, it was supported by the Coordinación de la Investigación Científica of the Universidad Michoacana de San Nicolás de Hidalgo).
Data Availability Statement
The raw data supporting the conclusions of this article will be made available by the authors on request.
Acknowledgments
During the preparation of this manuscript, the authors used Grammarly to review the English grammar and syntax. The authors have reviewed and edited the output and take full responsibility for the content of this publication.
Conflicts of Interest
The authors declare no conflicts of interest.
Abbreviations
The following abbreviations are used in this manuscript:
| UAV | Unmanned Aerial Vehicle |
| SfM | Structure from Motion |
| MVS | Multi-View Stereo |
| DSE | Discontinuity Set Extractor |
| CC | CloudCompare |
| GCP | Ground Control Point |
| DSM | Digital Surface Model |
| DEM | Digital Elevation Model |
| SfM | Structure from Motion |
| K-NN | K Nearest Neighbor |
| RTK | Real Time Kinematic |
| PPK | Post Processing Kinematic |
| UTM | Universal Transverse Mercator |
References
- Migliazza, M.; Carriero, M.T.; Lingua, A.; Pontoglio, E.; Scavia, C. Rock Mass Characterization by UAV and Close-Range Photogrammetry: A Multiscale Approach Applied along the Vallone dell’Elva Road (Italy). Geosciences 2021, 11, 436. [Google Scholar] [CrossRef]
- Battulwar, R.; Emami, E.; Zare, M.; Battulwar, K.; Shahsavar, M.; Moniri-Morad, A.; Sattarvand, J. Utilizing Deep Learning for the Automated Extraction of Rock Mass Features from Point Clouds. Geotech. Geol. Eng. 2024, 42, 6179–6194. [Google Scholar] [CrossRef]
- Cirillo, D.; Zappa, M.; Tangari, A.C.; Brozzetti, F.; Ietto, F. Rockfall Analysis from UAV-Based Photogrammetry and 3D Models of a Cliff Area. Drones 2024, 8, 31. [Google Scholar] [CrossRef]
- Sun, J.; Yuan, G.; Song, L.; Zhang, H. Unmanned Aerial Vehicles (UAVs) in Landslide Investigation and Monitoring: A Review. Drones 2024, 8, 30. [Google Scholar] [CrossRef]
- Hartwig, M.E.; Santos, G.G.d.S.d. Enhanced discontinuity mapping of rock slopes exhibiting distinct structural frameworks using digital photogrammetry and UAV imagery. Environ. Earth Sci. 2024, 83, 624. [Google Scholar] [CrossRef]
- Lukačić, H.; Noël, F.; Jaboyedoff, M.; Krkač, M. Impact of discontinuity data acquisition methods on rockfall susceptibility assessment using high-resolution 3D point cloud. Eng. Geol. 2024, 340, 107677. [Google Scholar] [CrossRef]
- Tomás, R.; Riquelme, A.; Cano, M.; Pastor, J.; Pagán, J.; Asensio, J.; Ruffo, M. Evaluation of the stability of rocky slopes using 3D point clouds obtained from an unmanned aerial vehicle. Rev. Teledetec. 2020, 1–15. [Google Scholar] [CrossRef]
- Pagano, M.; Palma, B.; Ruocco, A.; Parise, M. Discontinuity Characterization of Rock Masses through Terrestrial Laser Scanner and Unmanned Aerial Vehicle Techniques Aimed at Slope Stability Assessment. Appl. Sci. 2020, 10, 2960. [Google Scholar] [CrossRef]
- Liu, C.; Liu, X.; Peng, X.; Wang, E.; Wang, S. Application of 3D-DDA integrated with unmanned aerial vehicle–laser scanner (UAV-LS) photogrammetry for stability analysis of a blocky rock mass slope. Landslides 2019, 16, 1645–1661. [Google Scholar] [CrossRef]
- Girardeau-Montaut, D. CloudCompare: 3D point cloud and mesh processing software. Open Source Proj. 2015, 197. Available online: https://www.cloudcompare.org/ (accessed on 1 September 2025).
- Riquelme, A.J.; Abellán, A.; Tomás, R.; Jaboyedoff, M. A new approach for semi-automatic rock mass joints recognition from 3D point clouds. Comput. Geosci. 2014, 68, 38–52. [Google Scholar] [CrossRef]
- Pola, A.; Herrera-Díaz, A.; Tinoco-Martínez, S.R.; Macias, J.L.; Soto-Rodríguez, A.N.; Soto-Herrera, A.M.; Sereno, H.; Avellán, D.R. Rock characterization, UAV photogrammetry and use of algorithms of machine learning as tools in mapping discontinuities and characterizing rock masses in Acoculco Caldera Complex. Bull. Eng. Geol. Environ. 2024, 83, 260. [Google Scholar] [CrossRef]
- Chen, J.; Zhu, H.; Li, X. Automatic extraction of discontinuity orientation from rock mass surface 3D point cloud. Comput. Geosci. 2016, 95, 18–31. [Google Scholar] [CrossRef]
- Hao, J.; Zhang, X.; Wang, C.; Wang, H.; Wang, H. Application of UAV Digital Photogrammetry in Geological Investigation and Stability Evaluation of High-Steep Mine Rock Slope. Drones 2023, 7, 198. [Google Scholar] [CrossRef]
- Li, M.; Xiu, Z.; Han, J.; Meng, F.; Wang, F.; Ji, H. Characterization and Stability Analysis of Rock Mass Discontinuities in Layered Slopes: A Case Study from Fushun West Open-Pit Mine. Appl. Sci. 2024, 14, 11330. [Google Scholar] [CrossRef]
- Chen, J.L.; Li, H.B.; Jiang, N.; Chen, Q.; Yang, Y.C.; Zhou, J.W. Stability evaluation of shallow blocks in high and steep slope combining TLS and UAV photogrammetry. Geomat. Nat. Hazards Risk 2025, 16, 2464052. [Google Scholar] [CrossRef]
- Junaid, M.; Al-Atroush, M.E.; Mahmood, S.; Shah, K.S.; Ullah, A. Recent developments in unmanned aerial vehicle (UAV) surveys for rock slope stability analysis—A review. Geocarto Int. 2025, 40, 2519915. [Google Scholar] [CrossRef]
- Cao, Z.; Zhang, S.; Xue, Y.; Wang, Z.; Du, F.; Li, Z.; Huang, C.; Wang, S.; Yu, Y.; Wang, W.; et al. Disaster-causing mechanism of spalling rock burst based on folding catastrophe model in coal mine. Rock Mech. Rock Eng. 2025, 58, 7591–7604. [Google Scholar] [CrossRef]
- Teng, T.; Chen, Y.; Wang, Y.; Qiao, X. In Situ Nuclear Magnetic Resonance Observation of Pore Fractures and Permeability Evolution in Rock and Coal under Triaxial Compression. J. Energy Eng. 2025, 151, 04025036. [Google Scholar] [CrossRef]
- Carrasco-Núñez, G.; Hernández, J.; Cavazos-Álvarez, J.; Norini, G.; Orozco-Esquivel, T.; López-Quiroz, P.; Jáquez, A.; León-Barragán, L.D. Volcanic geology of the easternmost sector of the Trans-Mexican Volcanic Belt, Mexico. J. Maps 2021, 17, 486–496. [Google Scholar] [CrossRef]
- Carlón Allende, T.; Villanueva Díaz, J.; Soto Castro, G.; Mendoza, M.E.; Macías, J.L. Tree rings as indicators of climatic variation in the Trans-Mexican Volcanic Belt, central Mexico. Ecol. Indic. 2021, 120, 106920. [Google Scholar] [CrossRef]
- Hatheway, A.W. The complete ISRM Suggested methods for rock characterization, testing and monitoring; 1974–2006. Environ. Eng. Geosci. 2009, 15, 47–48. [Google Scholar] [CrossRef]
- Romana, M.R. 23—A Geomechanical Classification for Slopes: Slope Mass Rating. In Rock Testing and Site Characterization; Hudson, J.A., Ed.; Pergamon: Oxford, UK, 1993; pp. 575–600. [Google Scholar] [CrossRef]
- Agisoft LLC. Agisoft Metashape: Professional 3D Reconstruction Software, Version 1.8; 2025. Available online: https://www.agisoft.com/ (accessed on 11 September 2025).
- Tomás, R.; Romana, M.; Serón Gáñez, J. Review of the current status of the geomechanic classification Slope Mass Rating (SMR). Bol. Soc. Esp. Mec. Suelos E Ing. Geotec. 2017, 190, 25–32. [Google Scholar]
- Romana, M. SMR Classification. In Proceedings of the 7th ISRM Congress, Aachen, Germany, 16–20 September 1991; Available online: https://onepetro.org/isrmcongress/proceedings-pdf/CONGRESS91/CONGRESS91/ISRM-7CONGRESS-1991-189/1996666/isrm-7congress-1991-189.pdf (accessed on 1 September 2025).
- Bieniawski, Z. 22—Classification of Rock Masses for Engineering: The RMR System and Future Trends. In Rock Testing and Site Characterization; Hudson, J.A., Ed.; Pergamon: Oxford, UK, 1993; pp. 553–573. [Google Scholar] [CrossRef]
- Riquelme, A.; Tomás, R.; Cano, M.; Pastor, J.L.; Abellán, A. Automatic Mapping of Discontinuity Persistence on Rock Masses Using 3D Point Clouds. Rock Mech. Rock Eng. 2018, 51, 3005–3028. [Google Scholar] [CrossRef]
- Pu, C.; Zhan, J.; Zhang, W.; Peng, J. Characterization and clustering of rock discontinuity sets: A review. J. Rock Mech. Geotech. Eng. 2025, 17, 1240–1262. [Google Scholar] [CrossRef]
- Peralta, T.; Menoscal, M.; Bravo, G.; Rosado, V.; Vaca, V.; Capa, D.; Mulas, M.; Jordá-Bordehore, L. Rock Slope Stability Analysis Using Terrestrial Photogrammetry and Virtual Reality on Ignimbritic Deposits. J. Imaging 2024, 10, 106. [Google Scholar] [CrossRef]
- Gantimurova, S.; Parshin, A. Combined Methodology for Rockfall Susceptibility Mapping Using UAV Imagery Data. Remote Sens. 2024, 16, 177. [Google Scholar] [CrossRef]
Disclaimer/Publisher’s Note: The statements, opinions and data contained in all publications are solely those of the individual author(s) and contributor(s) and not of MDPI and/or the editor(s). MDPI and/or the editor(s) disclaim responsibility for any injury to people or property resulting from any ideas, methods, instructions or products referred to in the content. |
© 2025 by the authors. Licensee MDPI, Basel, Switzerland. This article is an open access article distributed under the terms and conditions of the Creative Commons Attribution (CC BY) license (https://creativecommons.org/licenses/by/4.0/).