Article

Softening Deformation Characteristics of Tuff Gully Tunnels Under Heavy Rainfall Infiltration and Their Influence on Stability

1
College of Civil Engineering and Architecture, Xinjiang University, Urumqi 830000, China
2
Xinjiang Academy of Architectural Science (Limited Liability Company), Urumqi 830001, China
3
Xinjiang Communications Polytechnic University, Urumqi 831401, China
*
Author to whom correspondence should be addressed.
Appl. Sci. 2025, 15(21), 11385; https://doi.org/10.3390/app152111385
Submission received: 22 September 2025 / Revised: 15 October 2025 / Accepted: 22 October 2025 / Published: 24 October 2025

Abstract

Heavy rainfall infiltration is a key disaster-inducing factor that triggers the softening of surrounding rock and deformation of support structures in tuff gully tunnels. Based on the gully section of the left line of the Dabao Tunnel of the Leigongshan–Rongjiang Expressway in Guizhou Province, this study systematically reveals the synergistic disaster-inducing mechanism of “topography-seepage-softening” in tuff gully tunnels under heavy rainfall infiltration through laboratory tests and FLAC3D 3D numerical simulations. The main innovative conclusions are as follows: (1) The “phased” attenuation law of tuff mechanical parameters was quantified, and the critical water content for significant strength deterioration was determined to be 2.5%, with a saturated softening coefficient of 0.59. These results provide key data for early warning and evaluation of similar projects. (2) A “convergence-disorder” distribution pattern of pore water pressure controlled by gully topography was revealed. It was found that the rock mass directly below the aqueduct exhibits a disordered zone with downward-extending pore water pressure due to fluid convergence, with the maximum pore water pressure reaching 0.55 MPa. This clarifies the essence that tunnel stability is controlled by the coupling of topography and seepage field. (3) The key sensitive areas for tunnel stability—namely the gully bottom, arch haunches, and the area below the aqueduct—were accurately identified. The significant increase in displacement of these areas after rock stratum softening was quantified (e.g., the displacement at the crown of the secondary lining increased from 3 mm to 4 mm, and the influence range expanded to the arch haunches). This study clarifies the deformation characteristics and instability mechanism of tuff gully tunnels under heavy rainfall from two aspects: the “internal mechanism of rock mass softening” and the “external condition of topographic seepage control.” It can provide a theoretical basis and key technical pathway for disaster prevention and control as well as stability design of similar tunnels.

1. Introduction

The influence of water on rocks has long been a key research topic in the fields of geology and geomorphology. In nature, water gradually alters the composition, morphology, and structure of rocks through erosion, freeze–thaw, dissolution, and sedimentation. In underground space engineering, rock–water contact leads to reduced strength, which is a critical factor contributing to deformation, failure, or engineering disasters. One of the main challenges impacting the stability of surrounding rock in underground engineering is the interaction between water and rocks [1,2,3]. As an aggregate composed of mineral particles, the bonding force between internal particles in rock depends not only on covalent bonds or ionic bonds but also is significantly influenced by van der Waals forces—intermolecular attraction and repulsion that do not involve covalent or ionic bonds—and serve as the key forces maintaining the stable bonding of particles in solids and liquids [4,5]. When rocks undergo physicochemical modification by water (e.g., water infiltration into pores triggering mineral hydration and dissolution), van der Waals forces weaken due to increased interparticle distance or reduced surface energy. This further leads to the degradation of rock mechanical parameters (Elastic Modulus, internal friction angle, cohesion, uniaxial/triaxial compressive strength), causing the mechanical behavior of rocks to gradually transition from that of intact rock blocks to the mechanical characteristics of residual soil. Moreover, such physical and mechanical parameters continuously change with prolonged exposure to modifying agents like water, further increasing the risk of surrounding rock instability [6,7]. It should be noted, however, that anisotropy exerts a particularly critical influence on rock strength—most sedimentary and metamorphic rocks exhibit significant anisotropic characteristics. Due to differences in genesis, the internal mineral components of these rocks often show preferred orientation, forming a typical planar structure. The angular relationship between the strike of bedding planes or schistosity planes and the stress direction has a far greater impact on rock strength than water seepage alone. For instance, when the stress direction is parallel to bedding planes, rocks are more prone to shear failure along interlayers; when the stress direction is perpendicular to bedding planes, rocks may exhibit higher compressive strength [8,9]. Therefore, when analyzing the reduction in rock strength caused by water infiltration, attention should not only be paid to the effect of water on discontinuities but also to clarifying the angular relationship between discontinuities and the stress direction—a key aspect often overlooked in existing studies. On the other hand, water-rock physicochemical interactions soften fracture surfaces and the surrounding rock mass. Thus, when analyzing the strength reduction in such rock masses, it is necessary to comprehensively consider classical strength theories, such as the Mohr–Coulomb criterion and the Griffith criterion, to deeply reveal the fracture mechanism of anisotropic rock masses along weak structures and the process of overall stability loss under hydro-mechanical coupling.
Among numerous scholars, Huang Wei et al. [10] conducted multiple sets of triaxial mechanical tests and cyclic loading tests on argillaceous siltstone and silty mudstone in Southwest China. They presented the stress–strain characteristic curves of soft rocks after saturation and summarized in detail the laws governing the influence of confining pressure and saturated state on soft rock strength. Huining Xu et al. [11] used the MTS815 Rock Mechanics Testing System to prepare replica samples with structural planes from rock masses of different lithologies, and carried out hydro-mechanical coupled triaxial compression tests to study the impact of hydrostatic pressure on weakening rock masses with various lithologies. The findings indicated that hydrostatic pressure of 1–4 MPa significantly reduces the internal cohesion of rock masses but has little impact on the internal friction coefficient. Heap Michael J. et al. [12] found that the proportions of uniaxial compressive strength and Young’s modulus between the wet and dry states range from 0.30 to 0.95 and 0.10 to 1.00, respectively, indicating that rocks undergo mechanical weakening under saturated water conditions. Yue Pan et al. [13] performed mechanical testing on rock samples with varying water levels to study how water affects rock mechanical behavior, and established a water-induced weakening function for rocks. Zhihao Zhou et al. [14], using homogenization theory and a lattice model, determined the stress–strain relationship and strength criteria of rocks while considering the weakening effects of water. They analyzed in detail the effects of water softening (characterized by saturation) and chemical weathering (characterized by mass loss rate) on the macro-mechanical behavior of rocks. Ding Changdong et al. [15] used tight sandstone to conduct seepage tests with variable pore water pressure under varying confining pressures. They studied the evolution law of rock permeability under high confining pressure and high pore water pressure, and revealed the trend in permeability variation, its consistency involving volumetric strain, and the mechanism of micro irreversible deformation. Jiangtao Zheng et al. [16], using low-permeability sedimentary rocks, establishes theoretical models based on the Two-Part Hooke’s Model (TPHM), verifies them by combining experimental data from the literature, investigates the relationships between their porosity, permeability, and effective stress, and reveals the mechanism by which the closure of soft microfractures under low stress leads to a significant decrease in permeability. Rui Zhang et al. [17] studied the permeability of shale and sandstone varies with stress, and derived expressions for the porosity sensitivity index of several pore models. Wei Mao et al. [18] used the F2 fault case of the Tianshan Tunnel, adopted the FDM-DEM coupled method (Finite Difference Method-Discrete Element Method), analyzed the displacement deformation and crack propagation of tunnel lining under different dislocation amounts, and revealed the mechanism by which dislocation intensifies lining damage and reduces stability. J.-A Wang et al. [19] showed that rock permeability changes with the distribution of stress and strain: before reaching the peak strength, increased loading leads to decreased permeability; however, during the strain-softening stage, permeability increases significantly. Chaoteng Jiang et al. [20] focused on the shallow-buried tunnel portal in the unconsolidated pebble layer of the Tianshan Tunnel. By combining the new method theory to simulate 7 excavation schemes with FLAC3D (https://www.itasca.fr/en/software/flac3d, accessed on 24 August 2025) (and comparing simulation and field-measured data), they analyzed the guarantee mechanism of long pipe shed advanced support on tunnel stability and the influence of construction inclination angle and concluded that the pipe shed achieves the optimal effect when the inclination angle ranges from 0° to 3°. Jinquan Xing et al. [21] used cylindrical gypsum to conduct uniaxial and triaxial compression tests on samples with a single prefabricated fracture. Combined with CT and SEM analysis, they studied the influence of hydro-mechanical coupling on the mechanical properties and cracking tendencies of jointed rock masses.
Despite significant progress in research on water–rock interaction, existing achievements mostly focus on sedimentary rocks or homogeneous sites, and there remains a lack of research on volcanic rocks (with tuff as a representative) under special topographic conditions. Particularly in the southwestern mountainous areas of China, tunnel projects often pass through tuff gully terrain, where the water accumulation effect is significant during heavy rainfall, forming a dynamic rainfall infiltration–runoff–convergence process. However, there are clear gaps in current research as follows: First, for the atypical geomorphic unit of tuff gullies, the evolution law and spatial heterogeneity of the surrounding rock pore water pressure field under the coupled effect of heavy rainfall infiltration and topographic runoff convergence remain unclear. Second, the disturbance mechanism of water-rich softening on the stress field and displacement field of surrounding rock in ultra-shallow buried, large cross-section tuff tunnels, as well as its chain effects on the stability of support structures, have not yet been fully revealed. Based on this, this study takes the tuff gully section of the Dabao Tunnel of the Leigongshan–Rongjiang Expressway in Guizhou Province as the engineering background. It focuses on researching the softening law of tuff mechanical parameters under heavy rainfall infiltration, as well as the induced deformation characteristics of surrounding rock and support structures and their stability responses. The aim is to provide a theoretical basis for tunnel safety design and risk prevention and control under similar geological conditions.

2. Engineering Overview

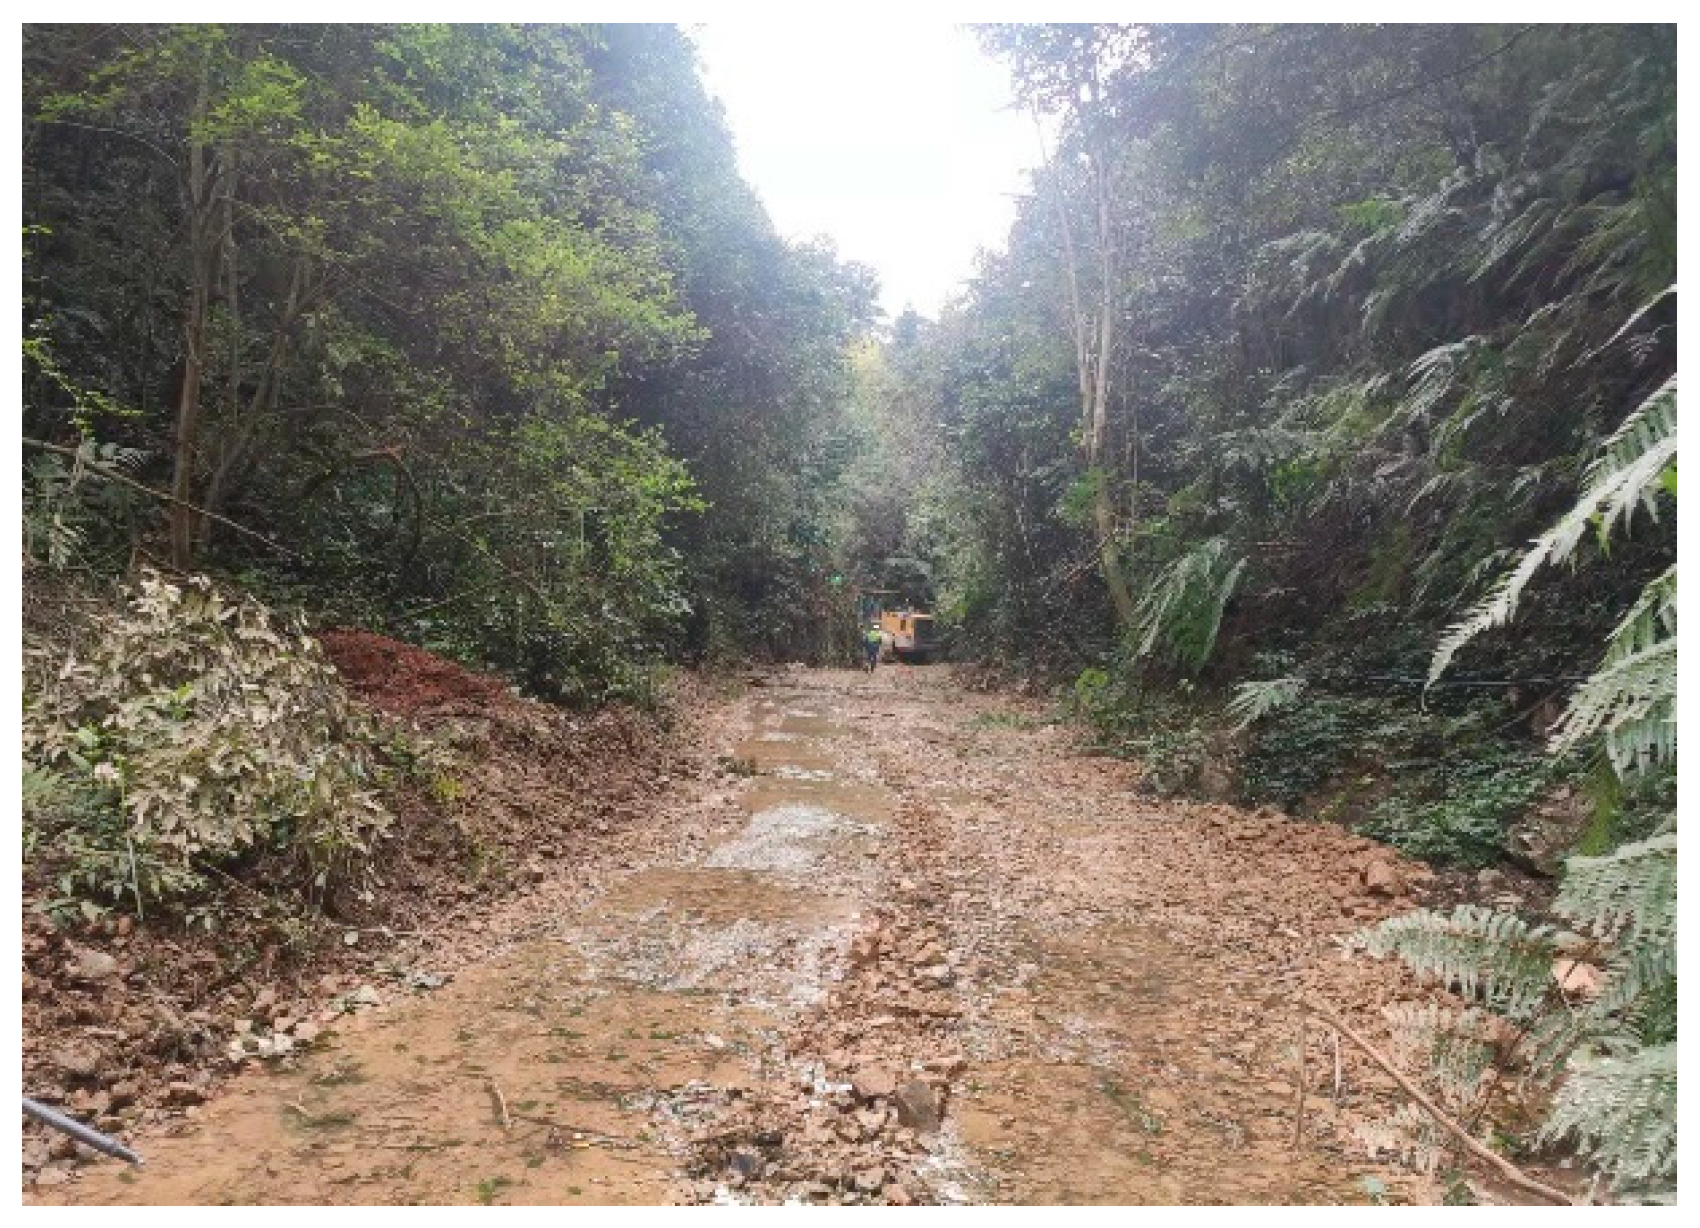
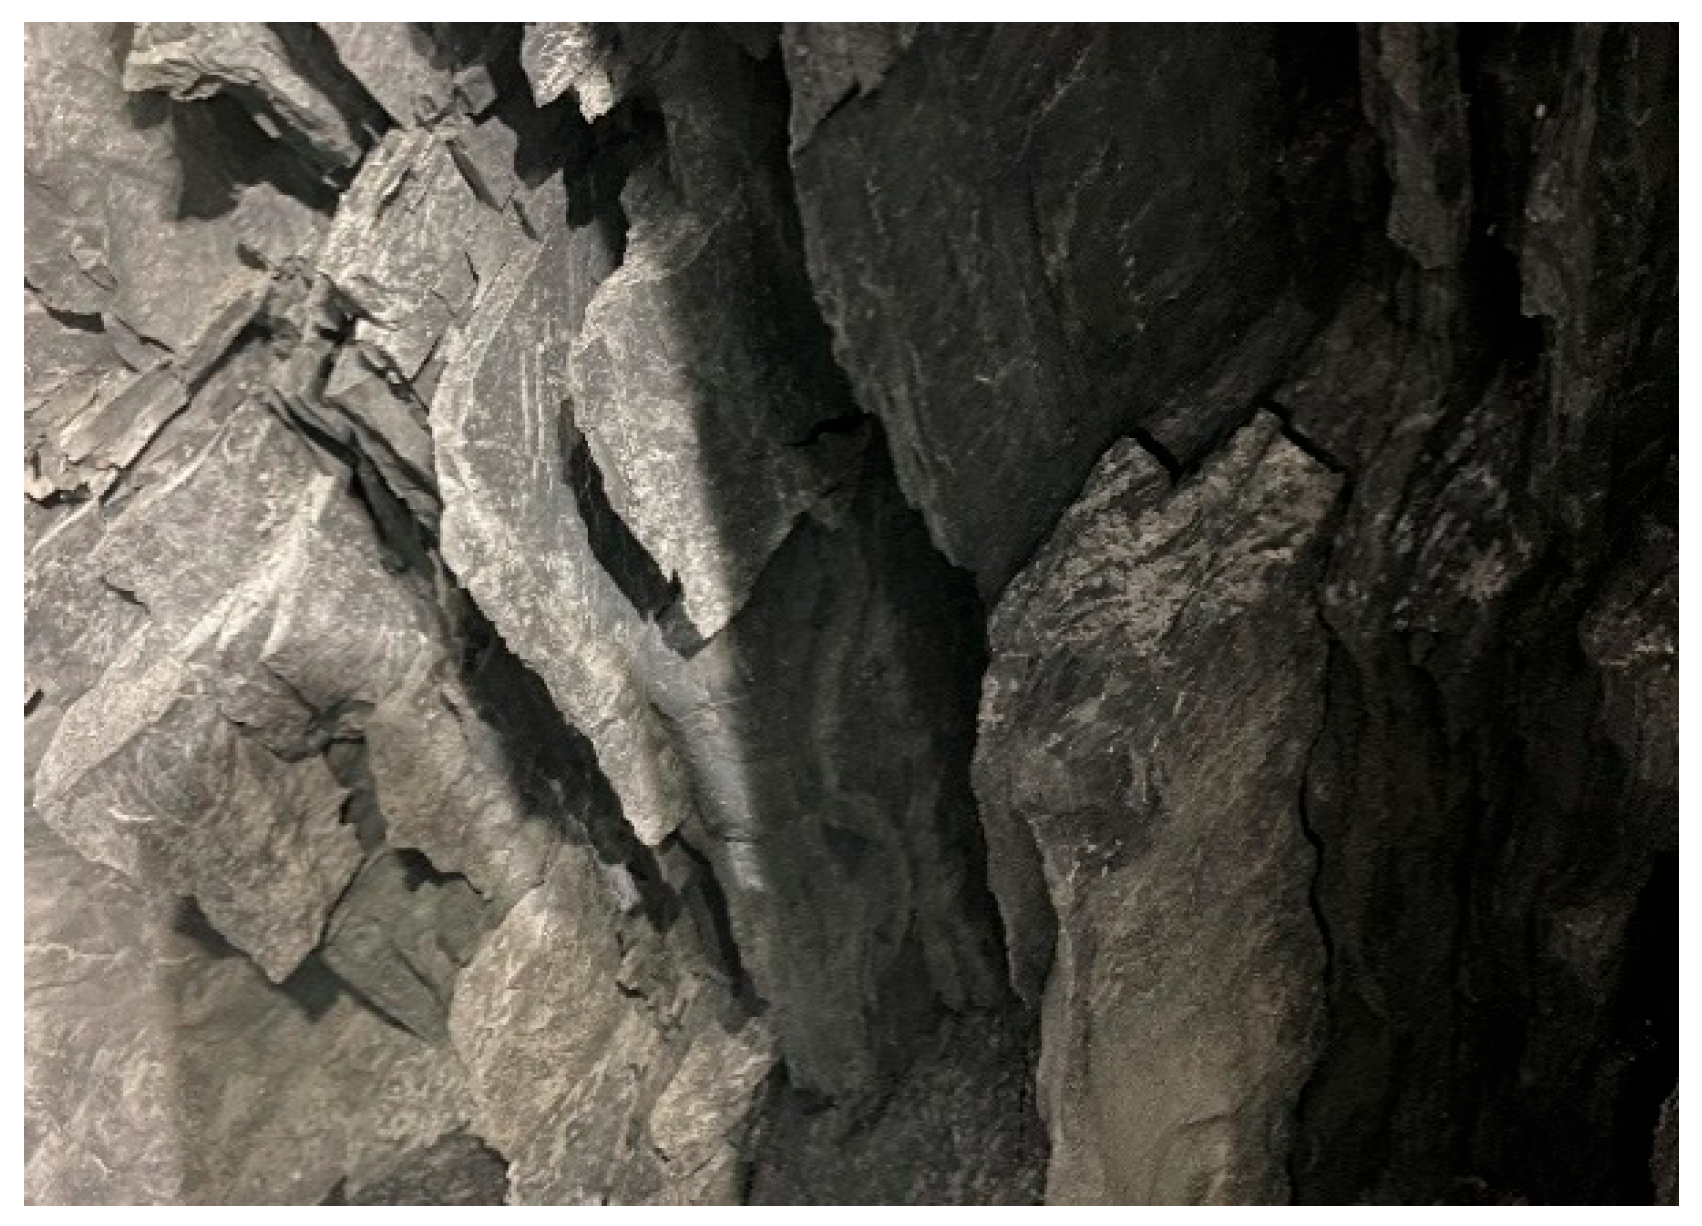
The Dapu Tunnel on the Leigongshan–Rongjiang Expressway in Guizhou Province is a separated double-tube tunnel, with the right tube having a total length of 1512 m and the left tube with a length of 1507 m. The distance between the left and right tubes ranges from approximately 6.6 m to 22.4 m, and the exit section adopts a small interval arrangement. The research section is the gully section of the tunnel: the left tube covers the mileage range L2K48 + 583~L2K48 + 610 with a total length of 27 m, while the right tube covers K48 + 597~K48 + 622 with a total length of 25 m. Considering the on-site construction environment, when the entire gully section of the left tube was excavated, the gully section of the right tube had not yet been constructed. Therefore, the left tube’s gully section (L2K48 + 583~L2K48 + 610) was selected as the research object. This section consists of shallow-buried and ultra-shallow-buried tunnel segments; the central mileage of the section (L2K48 + 594) is only about 9.4 m away from the gully surface, belonging to a class V surrounding rock section. The project is located on the southeast side of the Yunnan–Guizhou Plateau, on a slope platform transitioning to the Xianggui Hilly Basin. The terrain of the tunnel section is affected by erosion, showing medium-low mountain landform characteristics: the rear part of the right tunnel is the highest topographic point with an altitude of approximately 656 m, while the lowest point in the area is at the entrance of the left tunnel with an altitude of approximately 457 m, resulting in an elevation difference of about 200 m. Both the entrance and exit of the tunnel are situated on slopes: the slope gradient of the entrance is approximately 25~40°, and that of the exit is about 20~35°. The surrounding slopes are covered with lush vegetation, mainly arbors and shrubs. Figure 1 shows the geological survey profile of the gully section of the Dapu Tunnel, and Figure 2 shows the actual appearance of the gully valley. Based on surface surveying and drilling results, the strata in the study area can be divided into two main layers, with the stratigraphic composition from top to bottom as follows: The upper layer is the Quaternary eluvial–diluvial Q4el+dl silty clay layer: It is brownish-yellow and grayish-yellow, mainly composed of clay particles and silt particles, containing a small amount of weathered gravel. It has a covering thickness of approximately 20–40 cm and is discontinuously distributed. The lower layer is the blastotuff of Member 1 to Member 2 of the Qingshuijiang Formation, Upper Banxi Group, Proterozoic Eonothem Ptbnbq1−2. This rock is a pyroclastic rock that has undergone low-grade metamorphism; its “blast texture” indicates that a large amount of the original structure of the primary igneous tuff—composed of larger crystals (phenocrysts) and fine-grained volcanic ash matrix—is preserved. The rock mass is mainly gray and blue-gray, showing a medium-thick bedded to massive slab-like structure. It consists of unevenly distributed strongly weathered layers and moderately weathered layers, with argillaceous cementation and well-developed joints and fractures. Figure 3 shows the lithology of the main tunnel stratum, where the rock depicted is blastoporphyritic tuff. In terms of hydrology, the area has a subtropical humid monsoon climate, with an annual average rainfall of 1184 mm. The rainfall during the rainy season (April–September) accounts for 70~80% of the annual total, and the maximum daily rainfall reaches 112.8 mm. Surface water is mainly in the form of gully streams (with a flow rate of 30 L/s during the survey period, increasing to more than 3 times the dry season flow in the rainy season). Groundwater includes unconsolidated layer pore water and bedrock fissure water, which is significantly recharged by rainfall. Through a water injection test (test hole depth: 25.1 m; lithology of the test section: blastoporphyritic tuff), the average permeability coefficient of the stratum was determined to be 1.9 × 10⁻⁴ m/s.

3. Tunnel Support Design Scheme

Considering necessary factors such as the lithological characteristics of the tunnel site area, fracture zone distribution, groundwater conditions, and initial in situ stress conditions, the surrounding rock of the tunnel is classified in accordance with the Code for Design of Highway Tunnels (JTG D70-2004) [22]. The surrounding rock grade of the tunnel in this gully section is determined as Grade V. Through mechanical tests, the natural elastic modulus of the blastotuff in this area is 47.1 GPa, the natural compressive strength is 46.2 MPa, and the saturated compressive strength is 27.9 MPa—classifying it as a soft rock. The rock strata have well-developed fractures and poor interlayer bonding, and they are prone to softening under the influence of rainfall infiltration during the rainy season. Therefore, targeted support is required to control the deformation of the surrounding rock. Combined with the on-site construction practice, a combined support system of “advanced support + lining support” is adopted for this section. For the specific support structure type, key design parameters, and construction steps; see Support Design Figure 4 and Figure 5 for details. Its core components include the following:
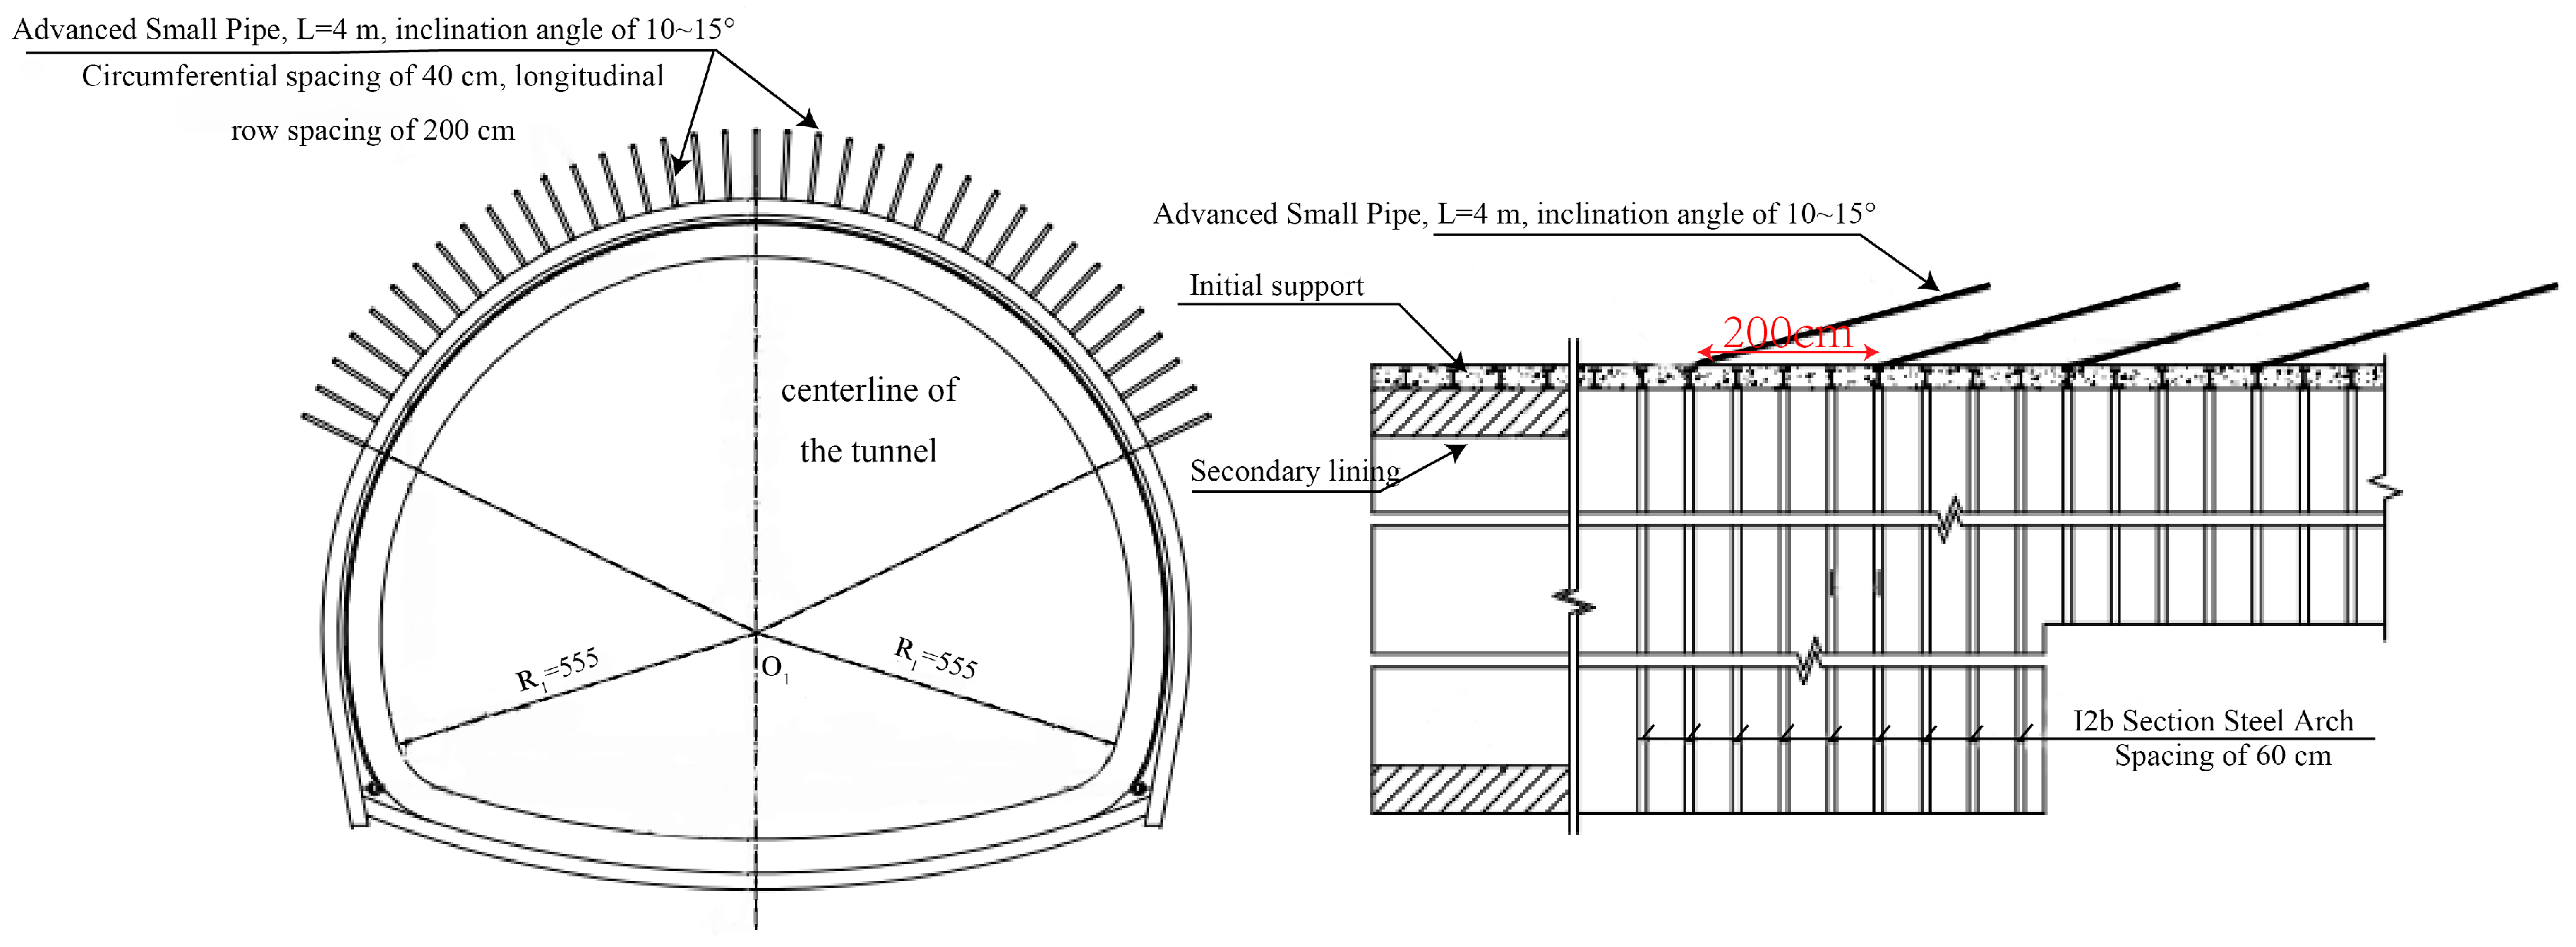
Advanced small pipe support design: The advanced small pipes are made of hot-rolled seamless steel pipes, with a single length of 400 cm, adjacent circumferential spacing of 40 cm, longitudinal spacing of 200 cm, and a construction inclination angle of 10–15°. 1:1 cement slurry is injected through the small pipes to reinforce the surrounding rock, enhance the integrity of the surrounding rock in front of the tunnel face, and prevent tunnel face instability during excavation.
For the lining support design, the primary support consists of steel arch frames, rock bolts, and shotcrete: among them, the steel arch frames adopt I20b steel sections with a longitudinal spacing of 60 cm, and adjacent frames are connected by longitudinal steel bars; the rock bolts are Φ25 hollow grouted rock bolts, each with a length of 3.5 m, arranged in a quincunx pattern; the shotcrete is of C20 grade with a thickness of 24 cm, which closely adheres to the surrounding rock and is welded to the steel arch frames and rock bolts to form an integral load-bearing structure. The secondary lining uses C30 reinforced concrete with a thickness of 50 cm, and its construction timing is determined based on on-site monitoring data to further ensure the long-term operational stability of the tunnel.
  • Design of advanced small pipe support
This scheme is applicable to some sections of class IV surrounding rock and shallow-buried sections of class V surrounding rock. The advanced small pipes are made of hot-rolled seamless steel pipes, with a single length of 400 cm, adjacent circumferential spacing of 40 cm, longitudinal spacing of 200 cm, and construction inclination angle of 10~15°. To enhance the stability of the surrounding rock, 1:1 cement grout is injected through the small pipes to reinforce the surrounding rock; when excavating water-rich sections, cement–sodium silicate double grout can be used for grouting. The design of the advanced small pipe support is shown in Figure 4.
Figure 4. Advanced Support Design Scheme.
Applsci 15 11385 g004
2.
Design of Lining Support
The initial support for class V surrounding rock mainly consists of a steel arch structure, rock bolt structure, and shotcrete structure. The steel arches are connected using longitudinal steel bars, and they are welded with the rock bolt structure and steel mesh to fit closely with the surrounding rock, jointly forming a load-bearing structure. Plain concrete is usually used for the secondary lining to facilitate construction. When the design load is large, especially in the construction of shallow-buried, biased-pressure, or weak surrounding rock sections, reinforced concrete is selected to ensure the safety of the tunnel support structure. The construction time of the secondary lining should be determined based on construction monitoring data to optimize the load-bearing capacity of the surrounding rock and initial support. The detailed tunnel support design is shown in Figure 5.
Figure 5. Lining Support Design.
Applsci 15 11385 g005

4. Study on Softening Law of Tuff Under Rainfall Infiltration

To clarify the influence of water content on tuff strength, multiple sets of unsaturated tuff samples were prepared, and tests involving uniaxial compression and splitting tests were carried out to obtain the mechanical parameters of rocks under different water contents, thereby analyzing the softening law of tuff. In this test, a multi-functional press machine was used to conduct uniaxial compression tests and splitting tests. This testing machine has a maximum vertical load of 600 kN, with a force sensor accuracy of 0.001 kN and a displacement sensor accuracy of 0.001 mm. The test protocol adopted herein refers to the GB/T 50081-2019 ConcreteStandard for Test Methods of Concrete Physical and Mechanical Properties (for circular specimens) [23]. For the uniaxial compression test, axial loading was controlled by displacement: the displacement control rate was set to 4 mm/min, and the test stop condition was set to 15% of the stress attenuation amplitude. After the compression of each specimen was completed, the resulting specimen fragments were placed in sealed bags for storage. Once all specimens were tested, the broken specimens were first weighed using an electronic balance. They were then placed in a drying oven for 24 h, after which they were weighed again for subsequent calculations. The water content of the specimens was calculated in Equation (1):
w = m o m s m o × 100 %
The test data of uniaxial compression tests on tuff specimens are shown in Table 1, and the test data of splitting tests are shown in Table 2.

4.1. Relationship Between Elastic Modulus, Cohesion and Water Content

Elastic modulus describes the elastic properties of rock materials under stress and is used to evaluate the elastic deformation capacity of rock materials when subjected to forces. From a macroscopic perspective, elastic modulus is a physical parameter for evaluating the capacity of an object to withstand elastic deformation; from a microscopic perspective, this parameter indicates the atomic bonding strength, molecules and ions in a substance. Factors affecting bonding strength, such as crystal structure, bonding method, chemical composition, and temperature, all affect the magnitude of elastic modulus.
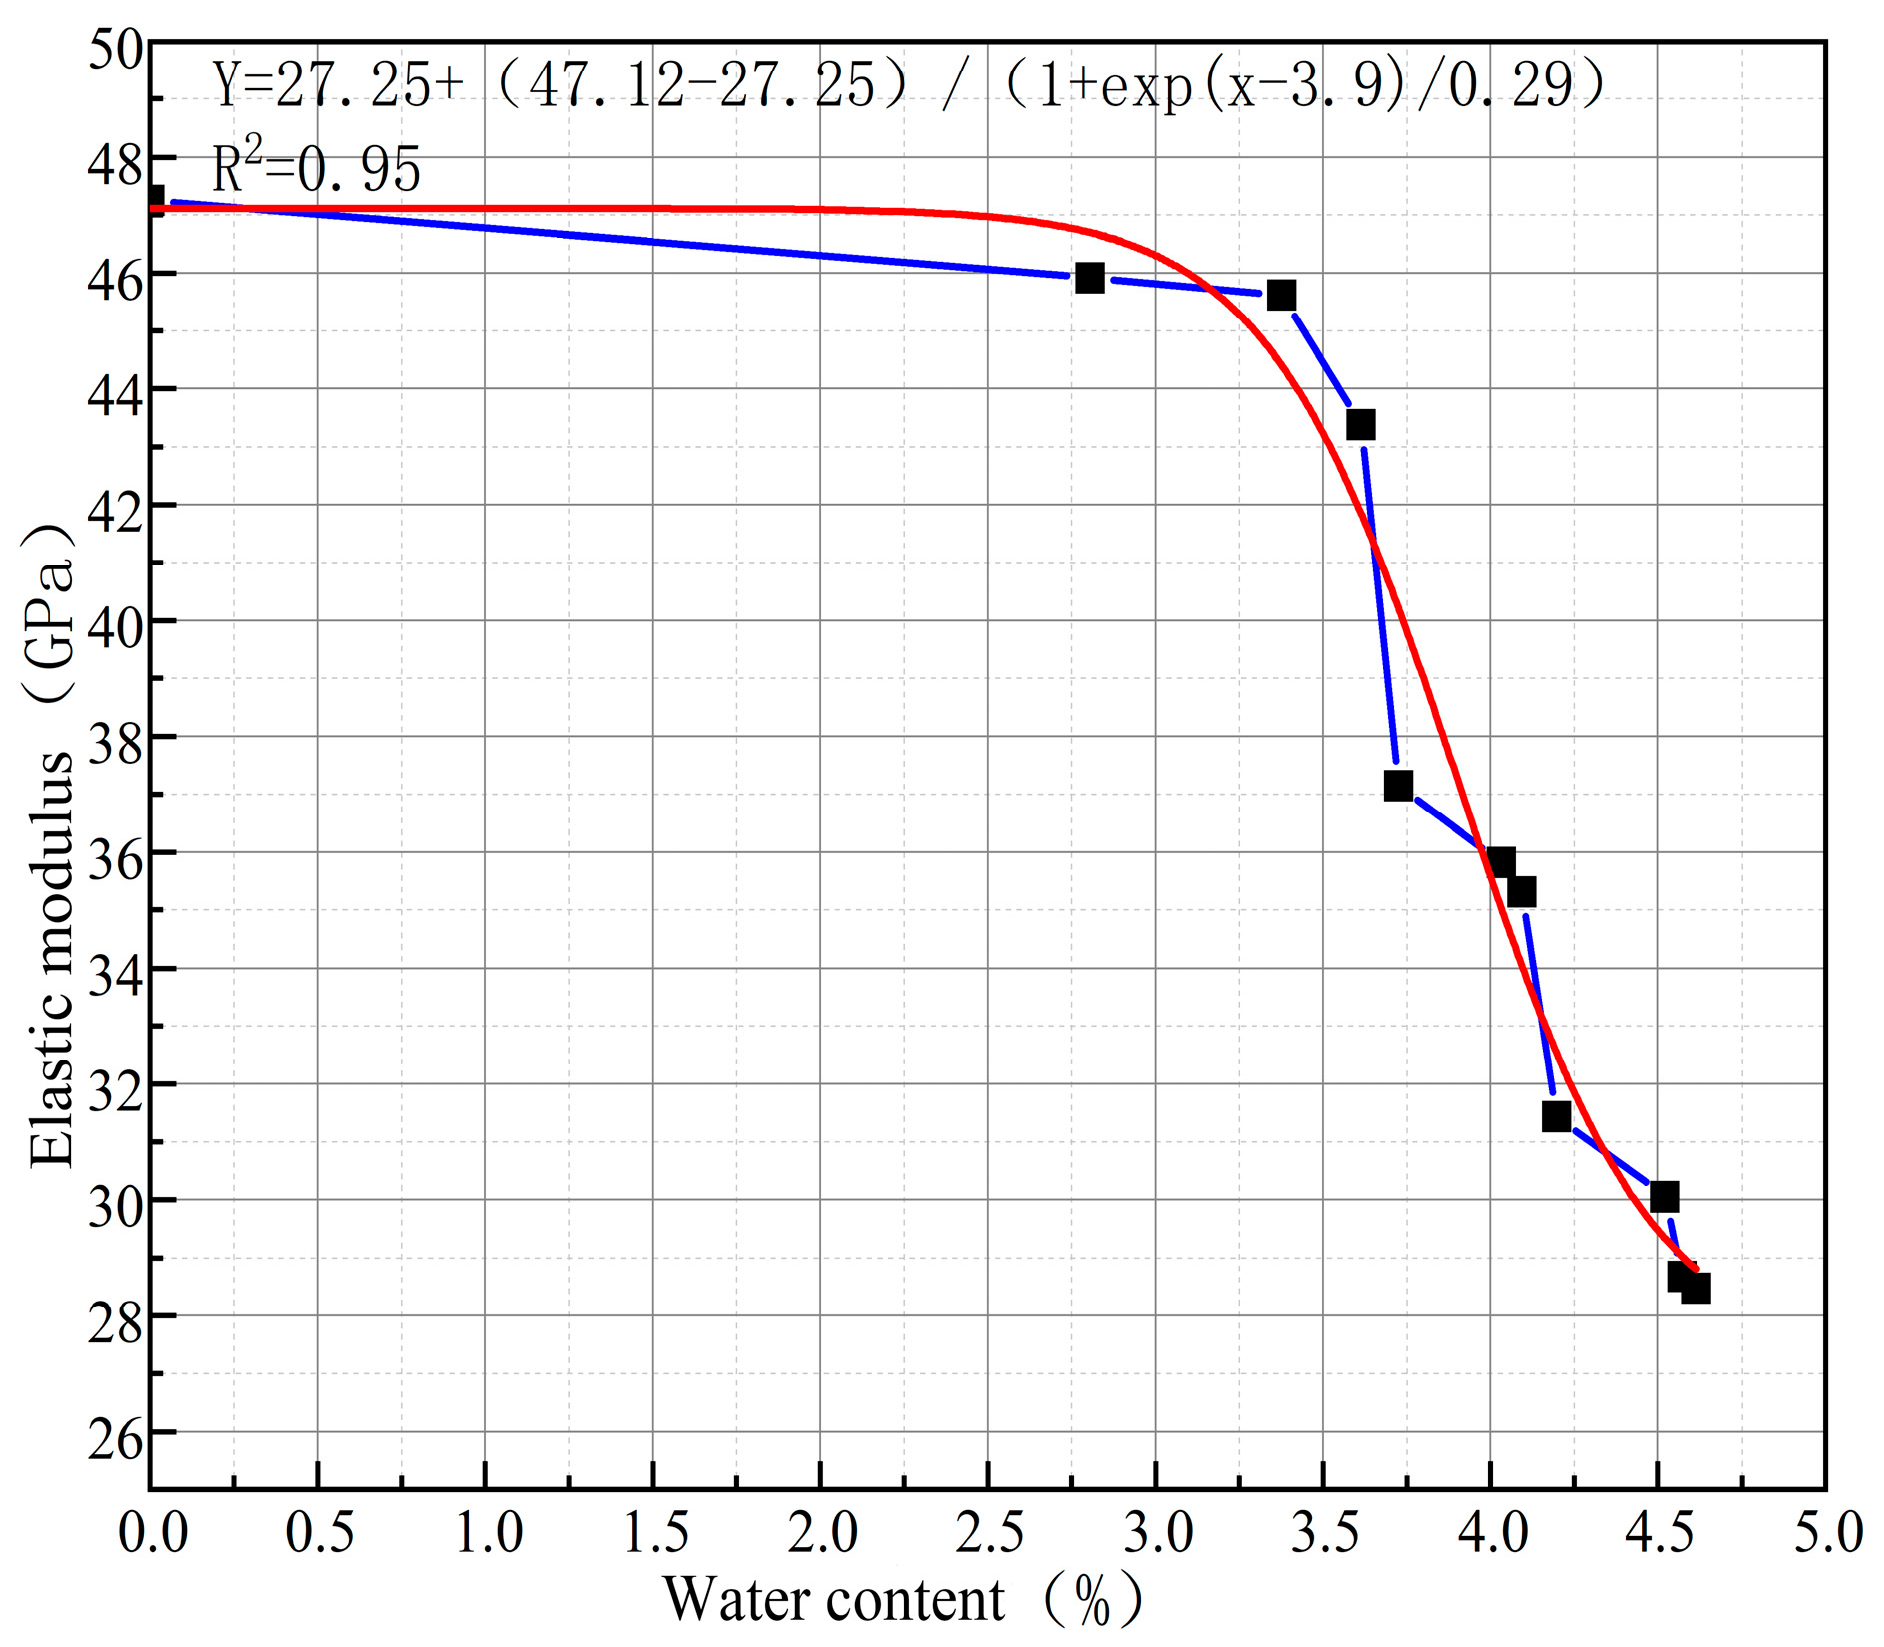
Meanwhile, it can be intuitively analyzed from Table 1 that water content has a significant impact on elastic modulus and compressive strength. To quantify the relationship between elastic modulus and water content, based on the test data in Table 1, a nonlinear fitting was performed using an exponential function, resulting in an empirical formula with a correlation coefficient R2 = 0.95, as shown in Equation (2):
Y = 27.25 + 19.87 1 + e x 3.9 0.29
where x denotes the water content, with a value range of (0, 4.6).
Analysis from Figure 6 shows that the variation in tuff elastic modulus with water content can be roughly divided into two stages: slow decrease and rapid decrease. When the water content of the sample is in the range of (0, 2.5%), the elastic modulus is less affected by water content; when the water content exceeds 2.5%, the elastic modulus is significantly affected by water content, and its strength decreases rapidly as the water content increases. Substituting a water content of 4.2% into Equation (1) gives a Y value of 31.46, which differs from the test group results by approximately 3%, indicating a high correlation.
Cohesion is a key parameter in the Mohr–Coulomb strength criterion, and it is defined as the shear strength of a material under the condition of zero normal stress. This parameter characterizes the inherent bonding property within rock that is independent of normal stress; together with the internal friction angle, it constitutes the macroscopic shear strength of rock mass. Therefore, cohesion is one of the important parameters for evaluating the ability of rock to resist shear failure. Cohesion is determined by the combined physical and chemical interactions between particles in the rock, including van der Waals forces, electrostatic forces, surface tension, and other forces between particles. The magnitude of cohesion directly affects the shear strength and stability of the rock. Water content has a significant impact on the tensile strength of tuff, which decreases as the water content increases. It can be seen from Table 2 that water content has a significant impact on the tensile strength of tuff, and the tensile strength decreases with the increase in water content. From Equations (3) and (4) for calculating cohesion and internal friction angle, it is known that the cohesion and internal friction angle of tuff are jointly determined by tensile strength and compressive strength; thus, both the internal friction angle and cohesion diminish as water content increases.
C = σ c σ t 2
φ = arctan σ c σ t 2 σ c σ t
where C denotes the cohesion of rock core; σc is the compressive strength; σt is the tensile strength; φ is the internal friction angle.
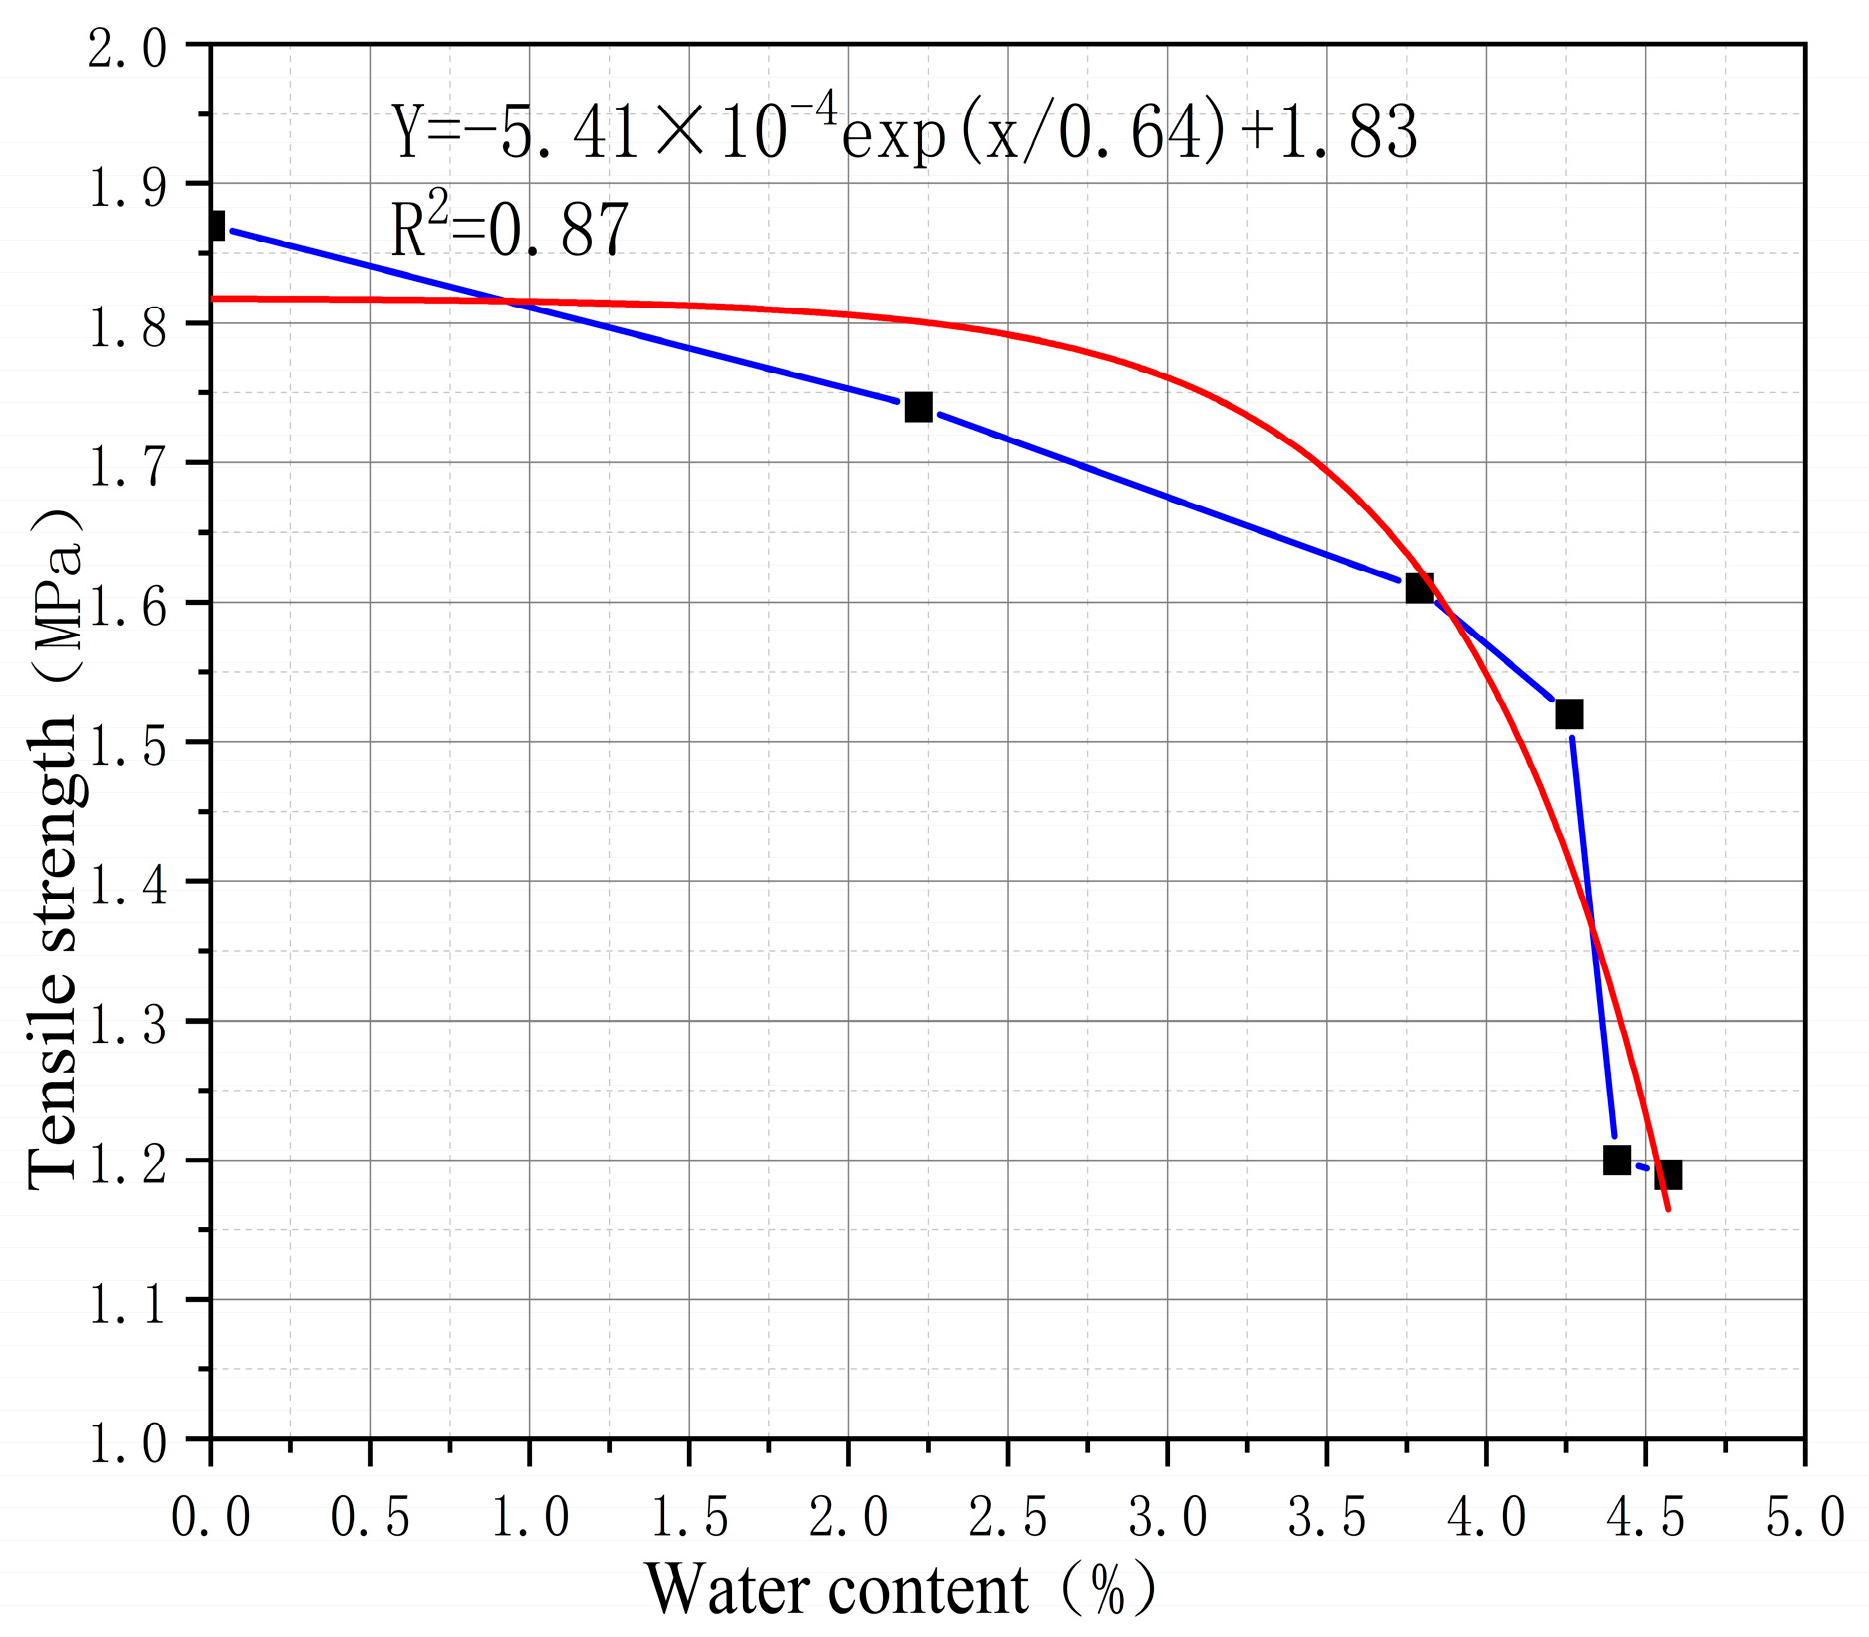
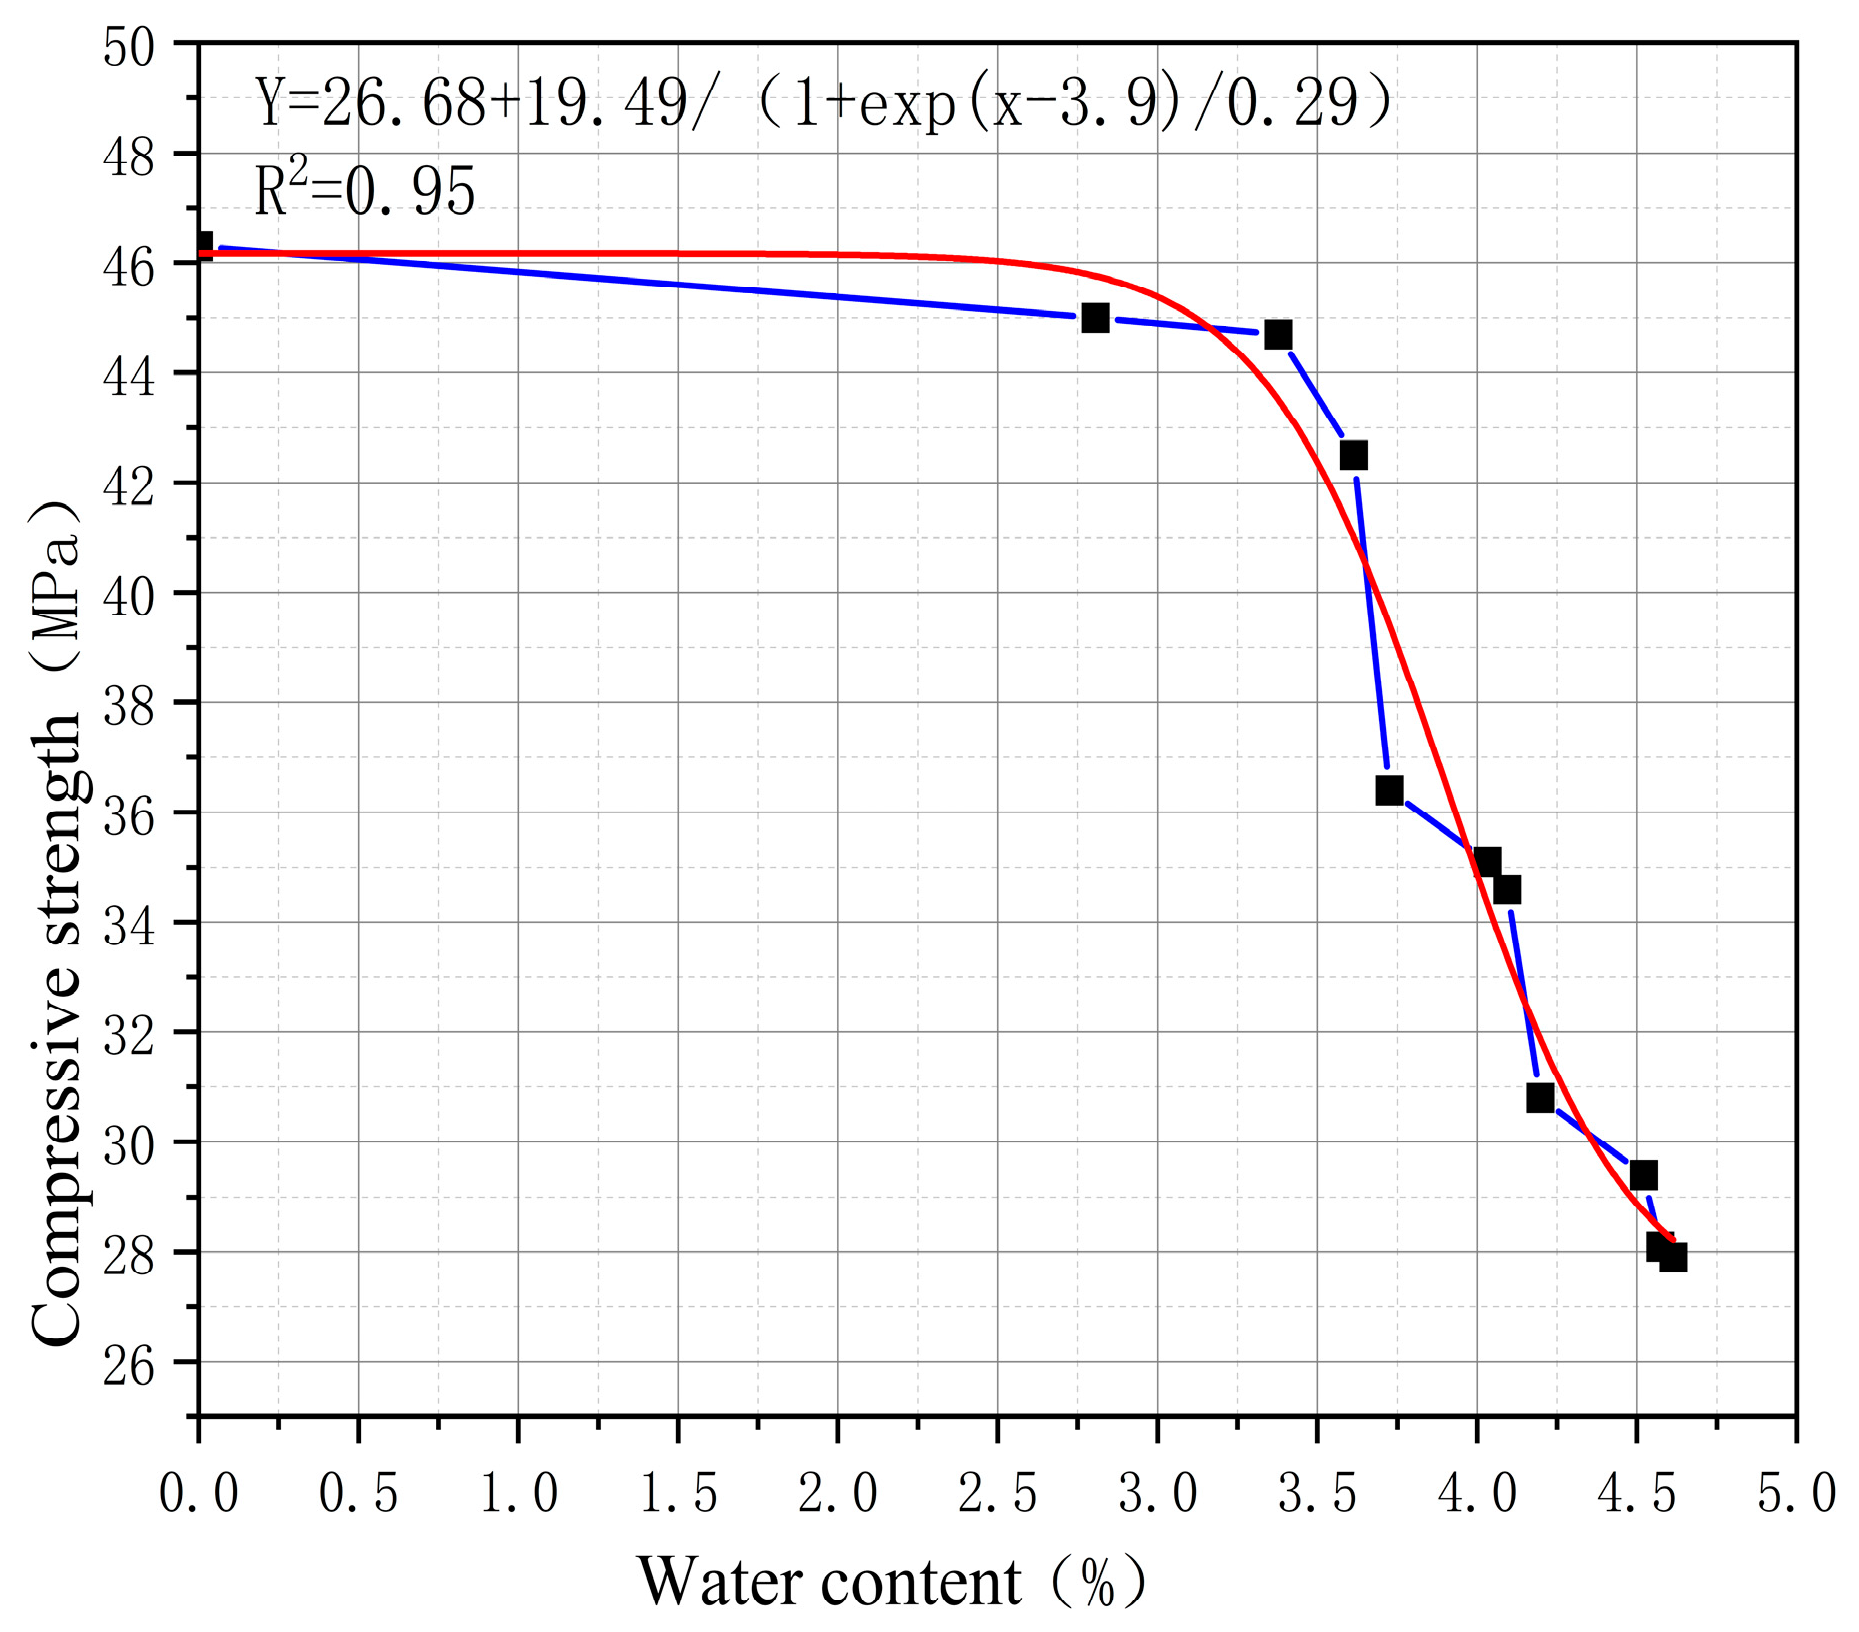
Based on the experimental data in Table 1 and Table 2, nonlinear fitting was performed using Origin, and the corresponding fitting formulas for the two parameters (tensile strength and compressive strength) were obtained, respectively. The correlation coefficient of the formula for the relationship between tensile strength and water content is R2 = 0.87, and the formula is as follows:
Y = 5.41 × 10 4 × e x 0.64 + 1.83
The correlation coefficient of the formula for the relationship between compressive strength and water content is R2 = 0.95, and the formula is as follows:
Y = 26.68 + 19.49 1 + e x 3.9 0.29
where x denotes the water content, with a value range of (0, 4.6).
The cohesion under a specific water content can be calculated using Equations (3)–(6). Observation from Figure 7 shows that the variation process of tensile strength, affected by water content, can be divided into two stages: stable decrease and rapid decrease. When the water content of the sample is less than 2.5%, the tensile strength of tuff is less affected by water content; when the water content is in the range of (2.5%, 4.6%), the tensile strength of tuff is significantly affected by water content and decreases rapidly. It is found from Figure 8 that the variation trend of compressive strength affected by water content is consistent with that of elastic modulus; thus, detailed description is omitted here.

4.2. Relationship Between Softening Coefficient and Water Content

The water-induced softening coefficient of rock is usually used to describe the softening degree of rock under the influence of water. When there are a large number of pores and cracks in the rock, the rock is more susceptible to water erosion and softening [24,25]. The magnitude of the softening coefficient depends on factors such as rock type, pore structure, and internal permeability of the rock. The ratio of uniaxial compressive strength between saturated samples and dry samples is an important index for evaluating the water resistance of rocks and rock masses. The value of the softening coefficient reflects the intensity of water–rock interaction: a smaller softening coefficient indicates a higher degree of rock softening. In the Engineering Geology Handbook, the influence of water on rocks is evaluated through the rock softening coefficient (as shown in Table 3).
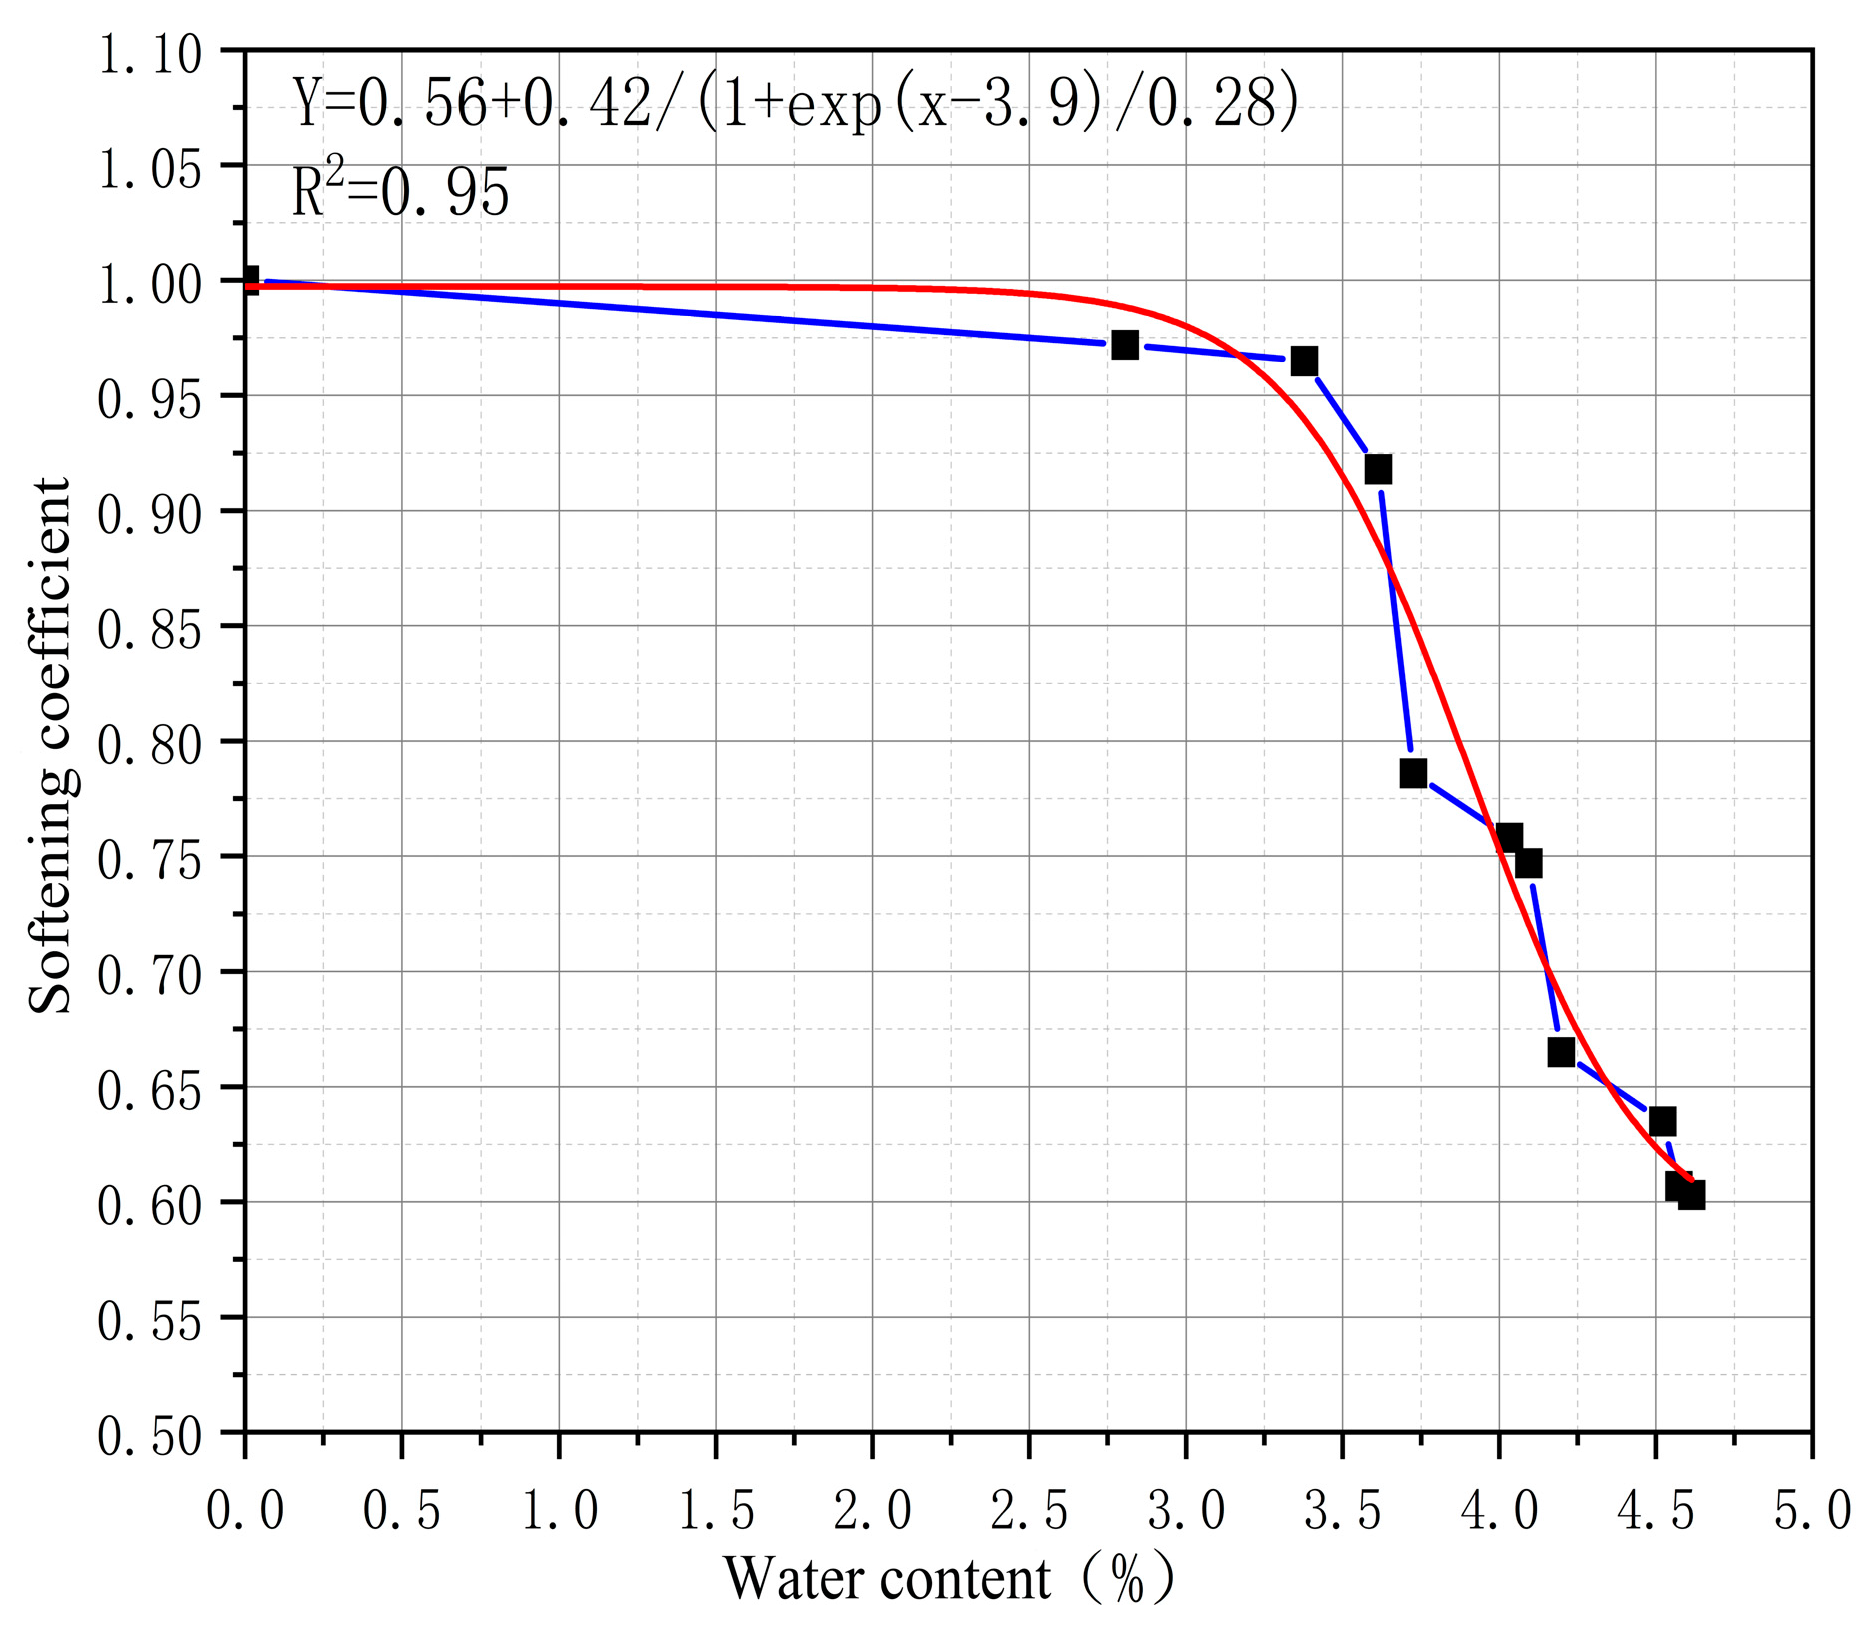
The previous section mainly studied the influence of water content on the physical and mechanical parameters of tuff, which proved that under different water content conditions, the mechanical parameters of tuff (such as elastic modulus, cohesion, and internal friction angle) would be weakened to different degrees. This section introduces the concept of rock softening coefficient, sorts out the variation trend of uniaxial compressive strength, and thus obtains the variation characteristics of tuff softening coefficient under different water content conditions. Furthermore, according to the Engineering Geology Handbook [26], the tuff under different water content conditions is evaluated, and the safety of surrounding rock for large-section tunnel excavation in ultra-shallow-buried strata can be analyzed. The variation characteristics of tuff softening coefficient are shown in Figure 9.
By organizing and analyzing the softening coefficients under different water contents, the influence of water content on tuff strength can be divided into four stages: When 0 < ω 3.25 % , water exerts almost no influence on tuff: the mechanical properties of the rock remain intact, and its stability is strong. When 3.25 % < ω 3.75 % , water has a slight influence on tuff strength, with a relatively small impact. When 3.75 % < ω 4.25 % , the influence of water on tuff increases: the compressive strength, cohesion, and other properties of the rock begin to undergo significant attenuation, and the general stability of the surrounding rock diminishes. When 4.25 % < ω 4.60 % , tuff undergoes substantial attenuation due to water: its original physical and mechanical parameters are severely attenuated, some internal mineral components disappear, and the structural strength of the surrounding rock decreases extensively.
According to the numerical relationship between the softening coefficient and water content, data fitting was performed using Origin (https://www.originlab.com, accessed on 24 August 2025). The correlation coefficient of the formula is R2 = 0.95, and the fitting formula is as follows:
Y = 0.56 + 0.42 1 + e x 3.9 0.28
Through comparative analysis, it is found that the three parameters of tuff—elastic modulus, compressive strength, and softening coefficient—have strong similarity, and their attenuation patterns caused by the influence of water content are basically the same.

5. Study on Heavy Rainfall Infiltration in Gullies

5.1. Construction of Numerical Test Model for Gully Valley Tunnel

To accurately establish a 3D numerical model that can reflect the softening and deformation characteristics of tuff gully tunnels under heavy rainfall infiltration, it is first necessary to clarify the selection basis for the research object. This study selects the gully section of the left line of the Dabao Tunnel (pile numbers: L2K48 + 583~L2K48 + 610) as a typical analysis section. Its screening is mainly based on the following considerations: First, the representativeness of geology and topography. This section is an ultra-shallow-buried tunnel (with a minimum burial depth of approximately 9.4 m) with surrounding rock of Grade V. It is composed of moderately weathered blastotuff with well-developed fractures and poor self-stability, and it is located at the bottom of a typical “concave”-shaped gully, which is extremely sensitive to rainfall infiltration and topographic bias effect. Second, the independence of the construction sequence. During on-site construction, when the entire left-line section had been excavated, the corresponding right-line section had not yet been constructed, with a staggered distance of nearly 100 m between the left and right lines. Therefore, the left line can be simplified as an independent single-line tunnel for research, effectively avoiding mutual disturbance between the construction of double-line tunnels. Third, the sensitivity of hydrological and softening responses. The permeability coefficient of the rock stratum in this section is 1.9 × 10⁻⁴ m/s, which is significantly recharged by atmospheric rainfall. Laboratory tests show that the saturated softening coefficient of tuff is 0.59, and its mechanical parameters respond sharply to changes in water content. This section is thus an ideal carrier for studying the “rainfall infiltration—rock mass softening—structural deformation” mechanism.
Based on the above analysis, and to eliminate the model boundary effect, this study is conducted in accordance with Saint-Venant’s Principle: after the tunnel face has been dug out, the stress redistribution area is within 3~5 times the size of the excavated tunnel diameter. For this reason, a three-dimensional numerical model with a length of 76 m, depth (width) of 27 m, height of 50 m on the south side, and 55 m on the north side is established based on the size of the excavated cavity. A three-dimensional “concave” surface of the gully is constructed; according to the formed three-dimensional surface, the slope on both sides of the gully is approximately 45°. The detailed modeling of the L2K48 + 583~L2K48 + 610 section is shown in Figure 10.
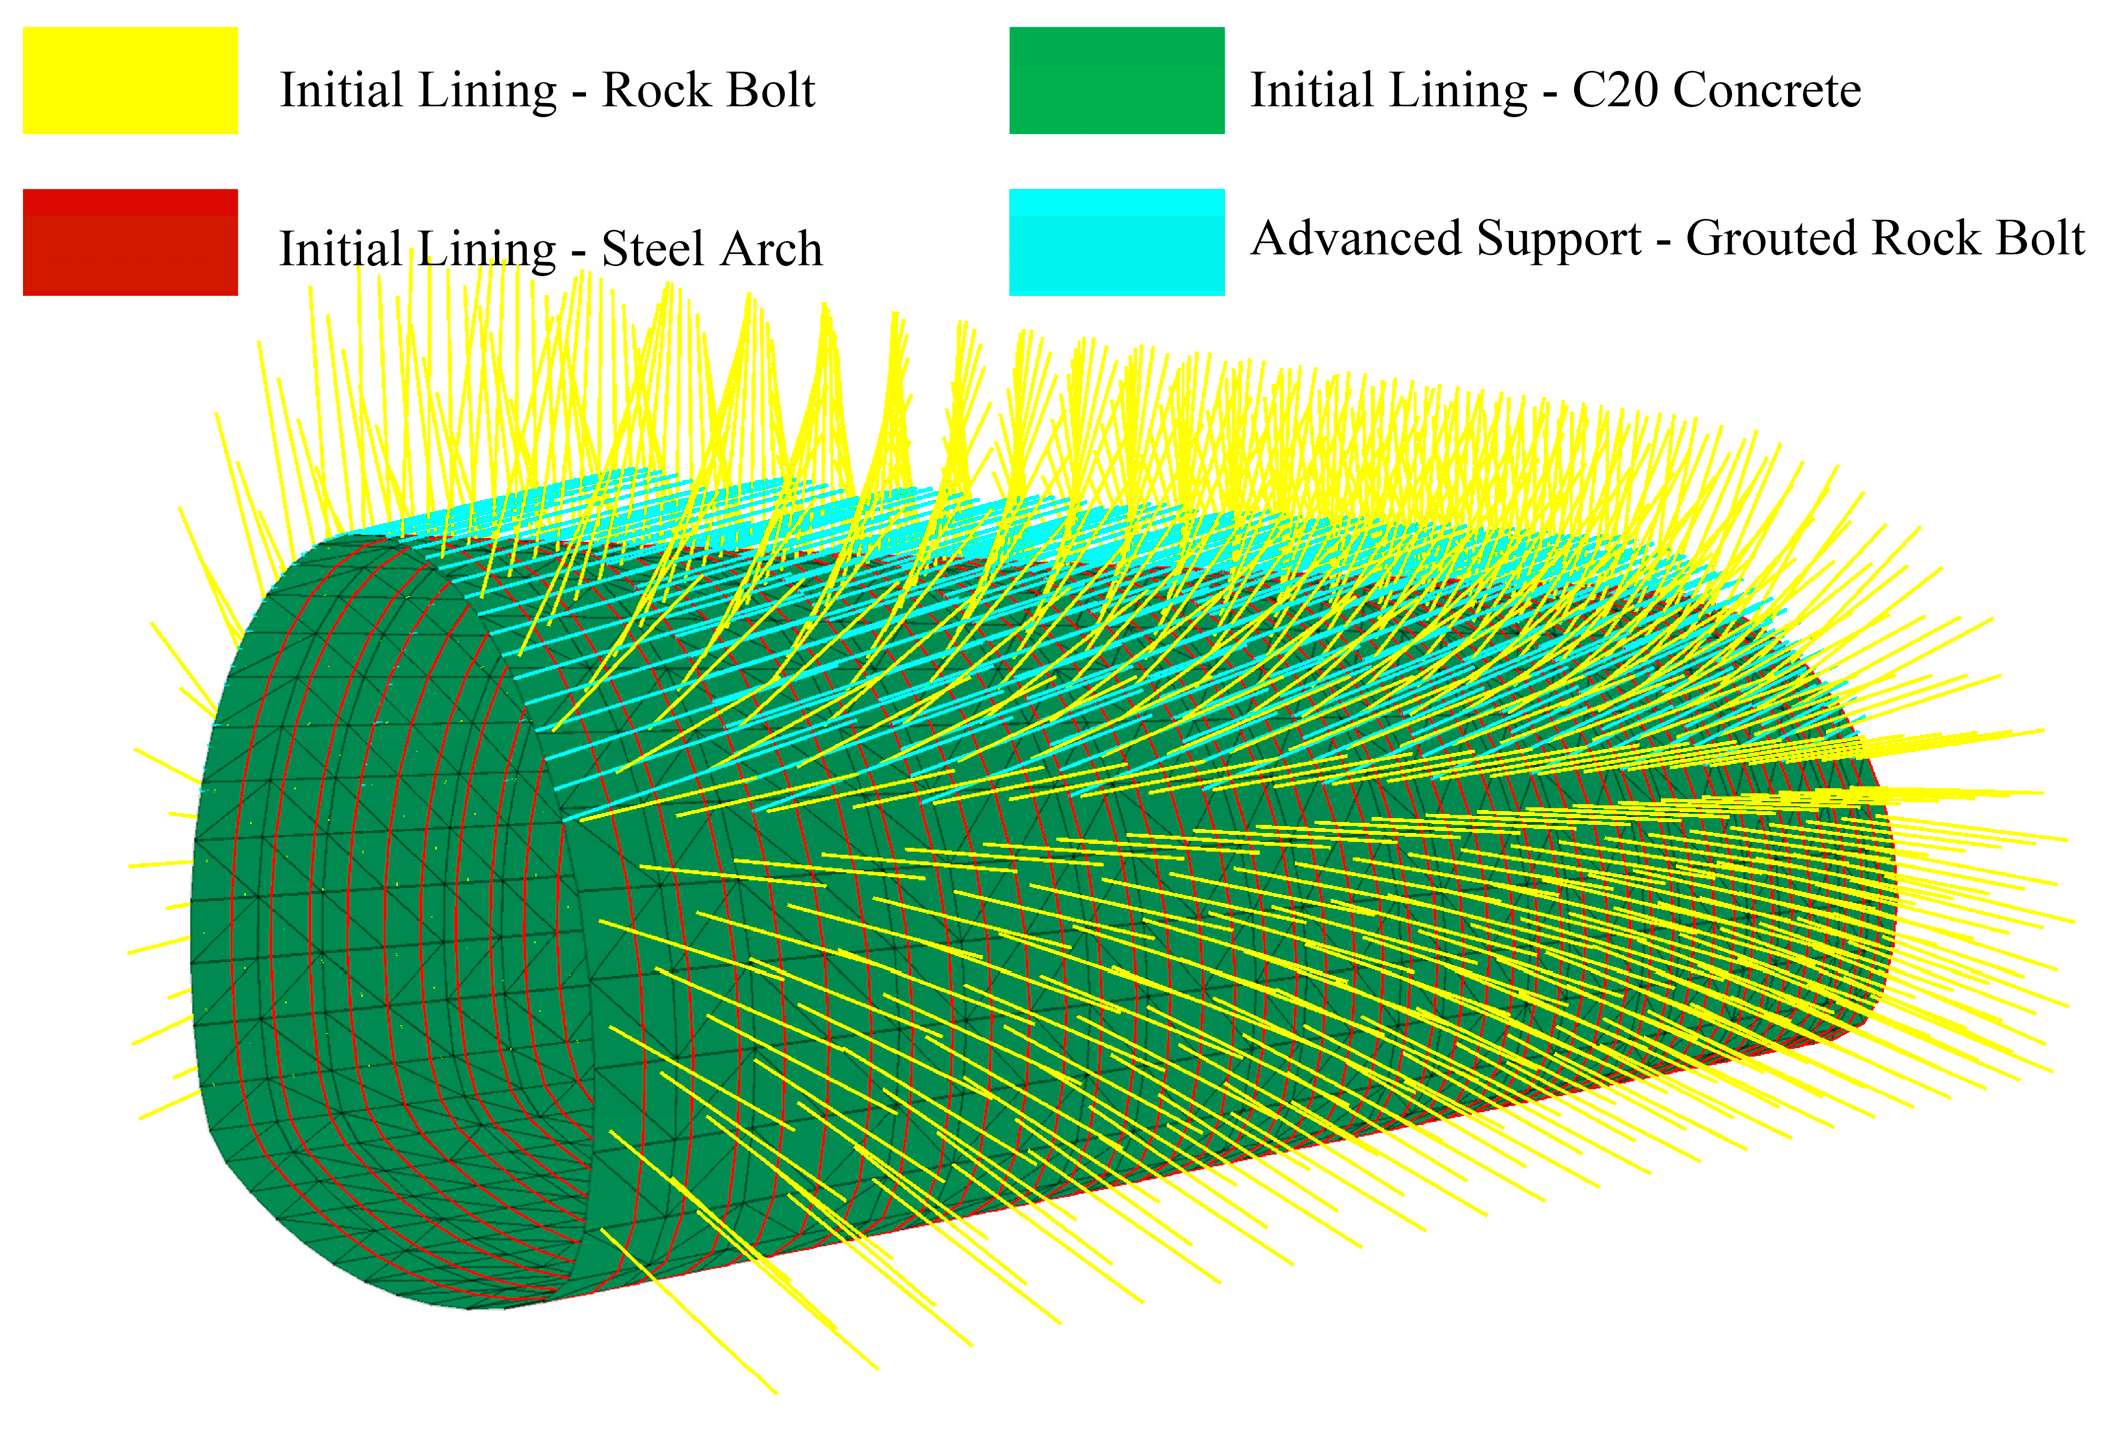
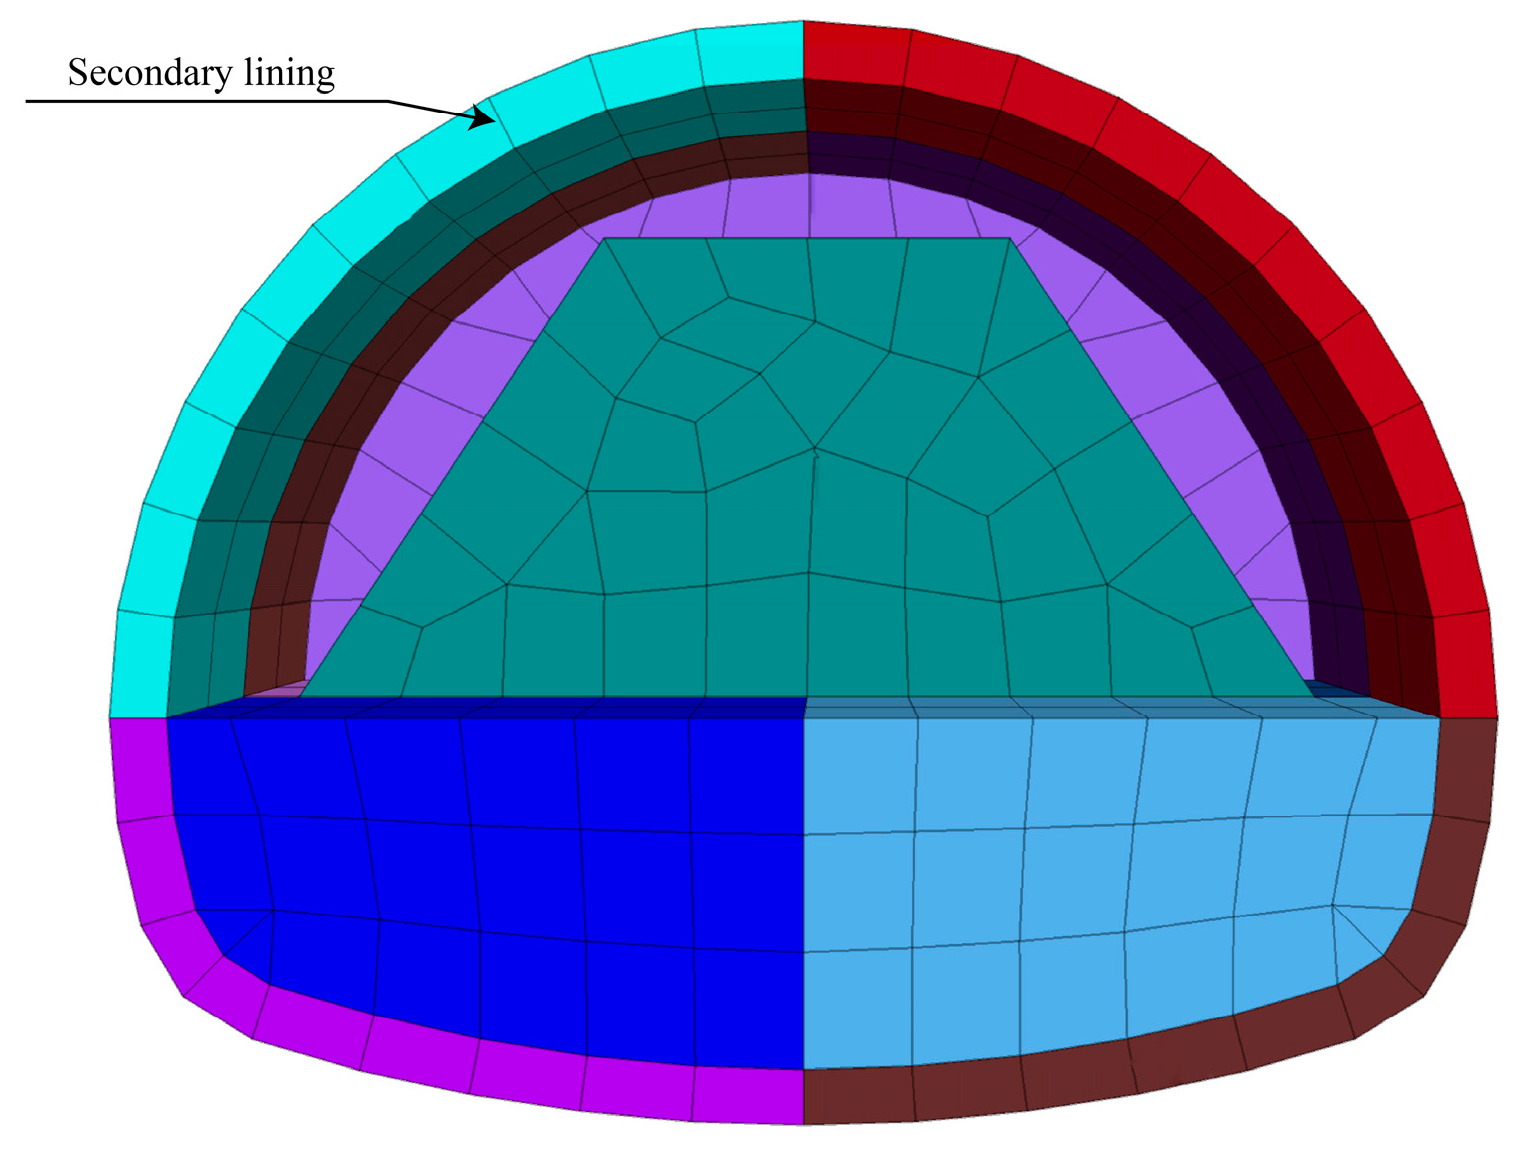
Based on the tunnel excavation and support design data, the tunnel excavated cavity and support structure are established. Advanced support: Adopts a beam structure, with a single length of 4 m, circumferential spacing of 40 cm, external insertion angle of 15°, and longitudinal spacing of 200 cm. Rock bolt structure: Uses cable elements, with a single length of 3.5 m, spacing of 120 × 60 cm (circumferential × longitudinal), and adjacent rock bolts are staggered by 60 cm for support. Steel arch: Applies beam elements, with a longitudinal spacing of 60 cm. Initial lining shotcrete support: Employs shell elements, with a specified thickness of 24 cm. Secondary lining and tunnel face: Set as zone elements, with a specified cycle footage depth of 2 m. The next stage of tunnel face excavation is carried out only after the advanced support construction in the to-be-excavated area is completed. The distribution of the structure modeling is shown in Figure 11. The modeling of the secondary lining and tunnel face is shown in Figure 12. For the surface reinforcement simulation of the gully section, cable elements are used, and the modeling method is similar to that of rock bolts.
Since the burial depth of the research model is relatively shallow, this numerical simulation does not consider the influence of in situ stress of the surrounding rock around the model, and the initial stress field is generated by the self-weight of the rock mass. The basis for material parameters is as follows: The physical and mechanical parameters of the surrounding rock are mainly determined based on the results of laboratory uniaxial and triaxial compression tests; the parameters of the support structure are determined in accordance with the Code for Design of Highway Tunnels (JTG D70-2004). All parameters of the tunnel surrounding rock and support structure obtained are shown in Table 4.

5.2. Pore Water Pressure Distribution in Rock Strata

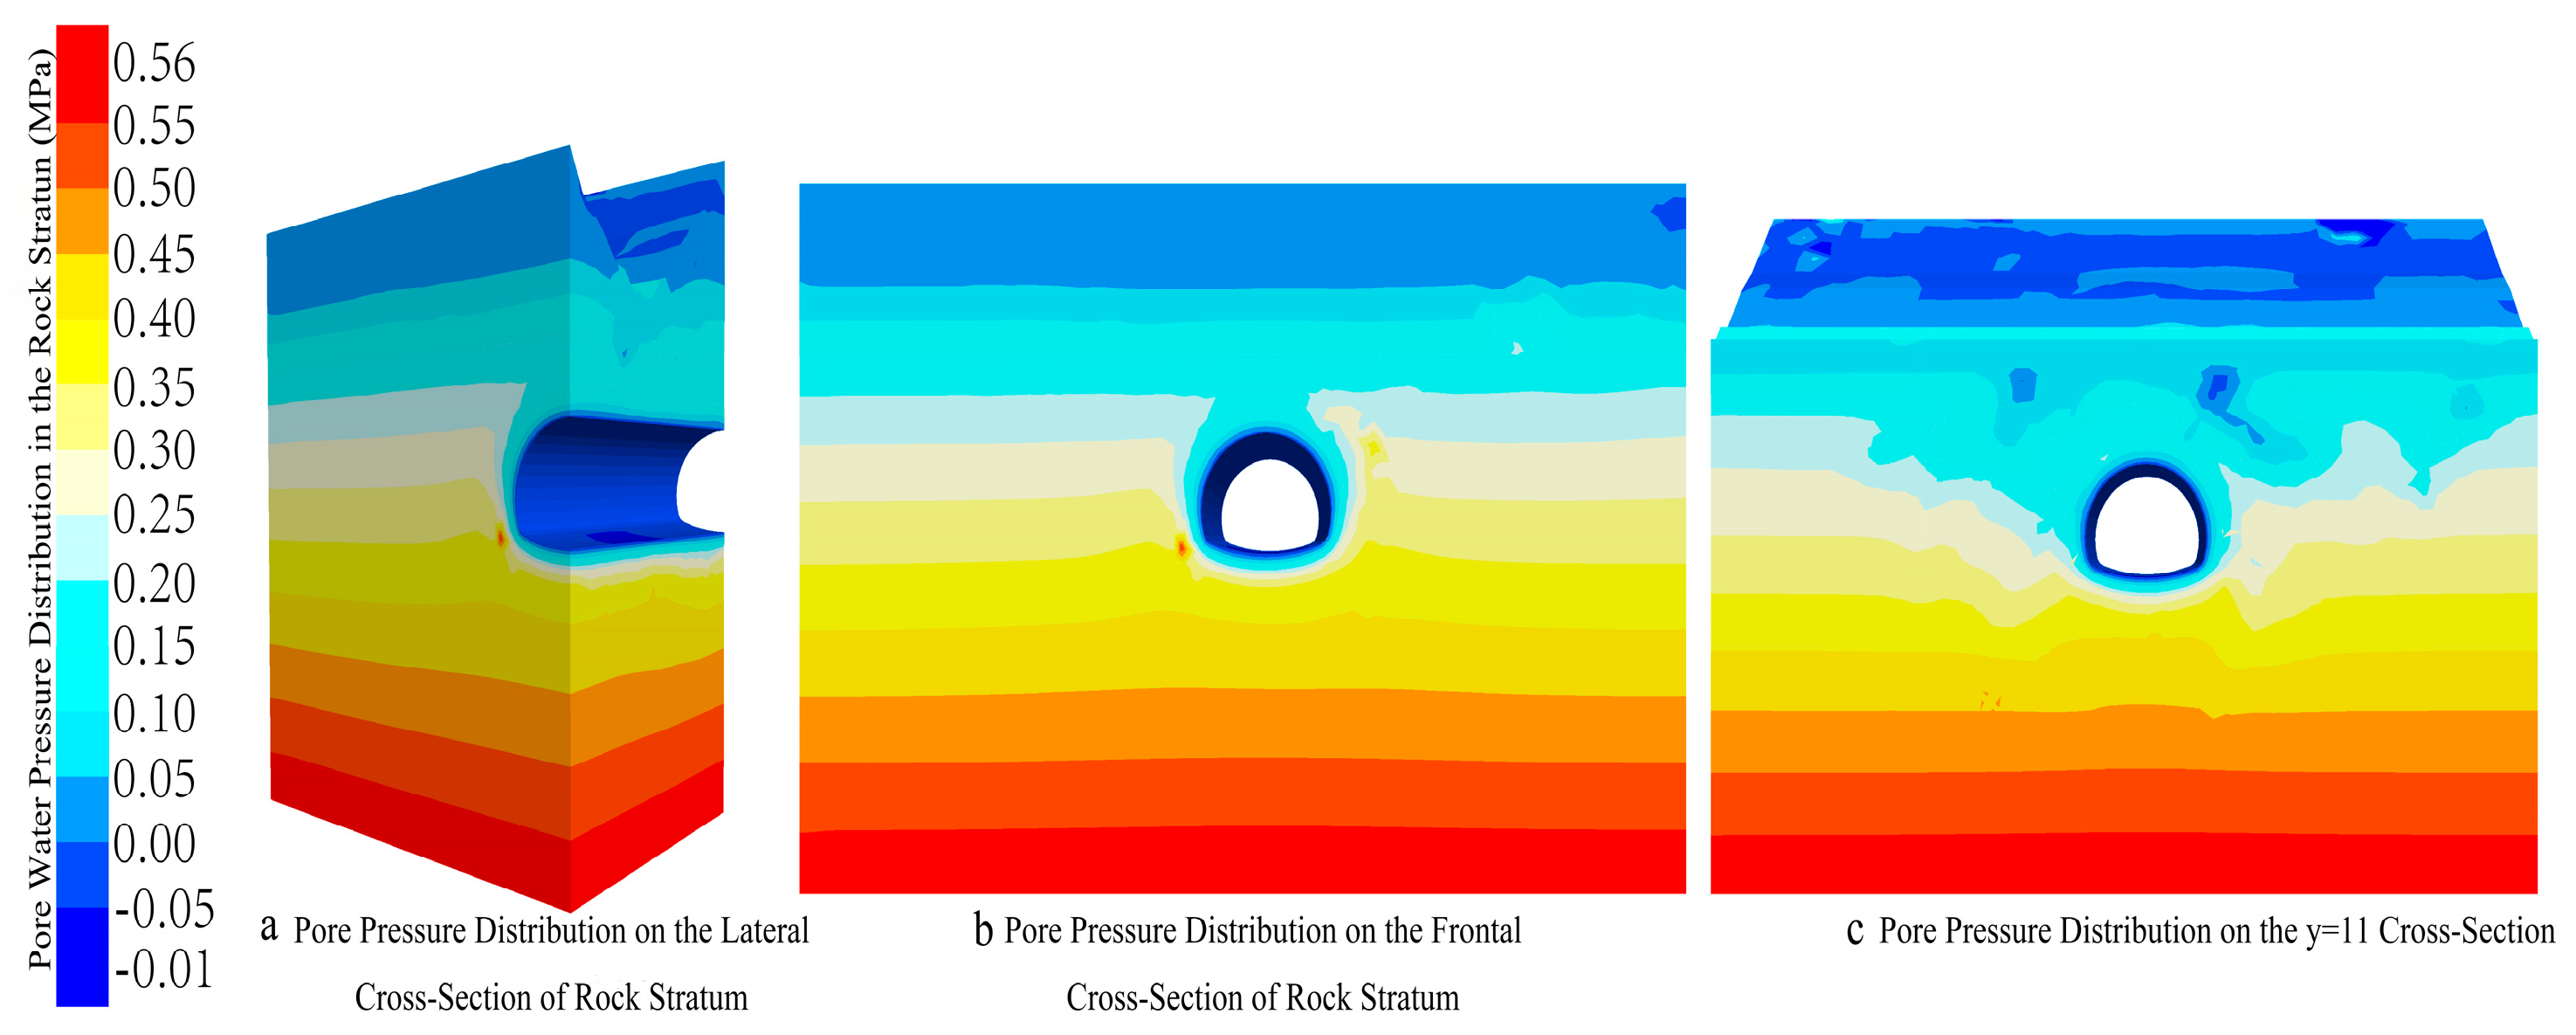
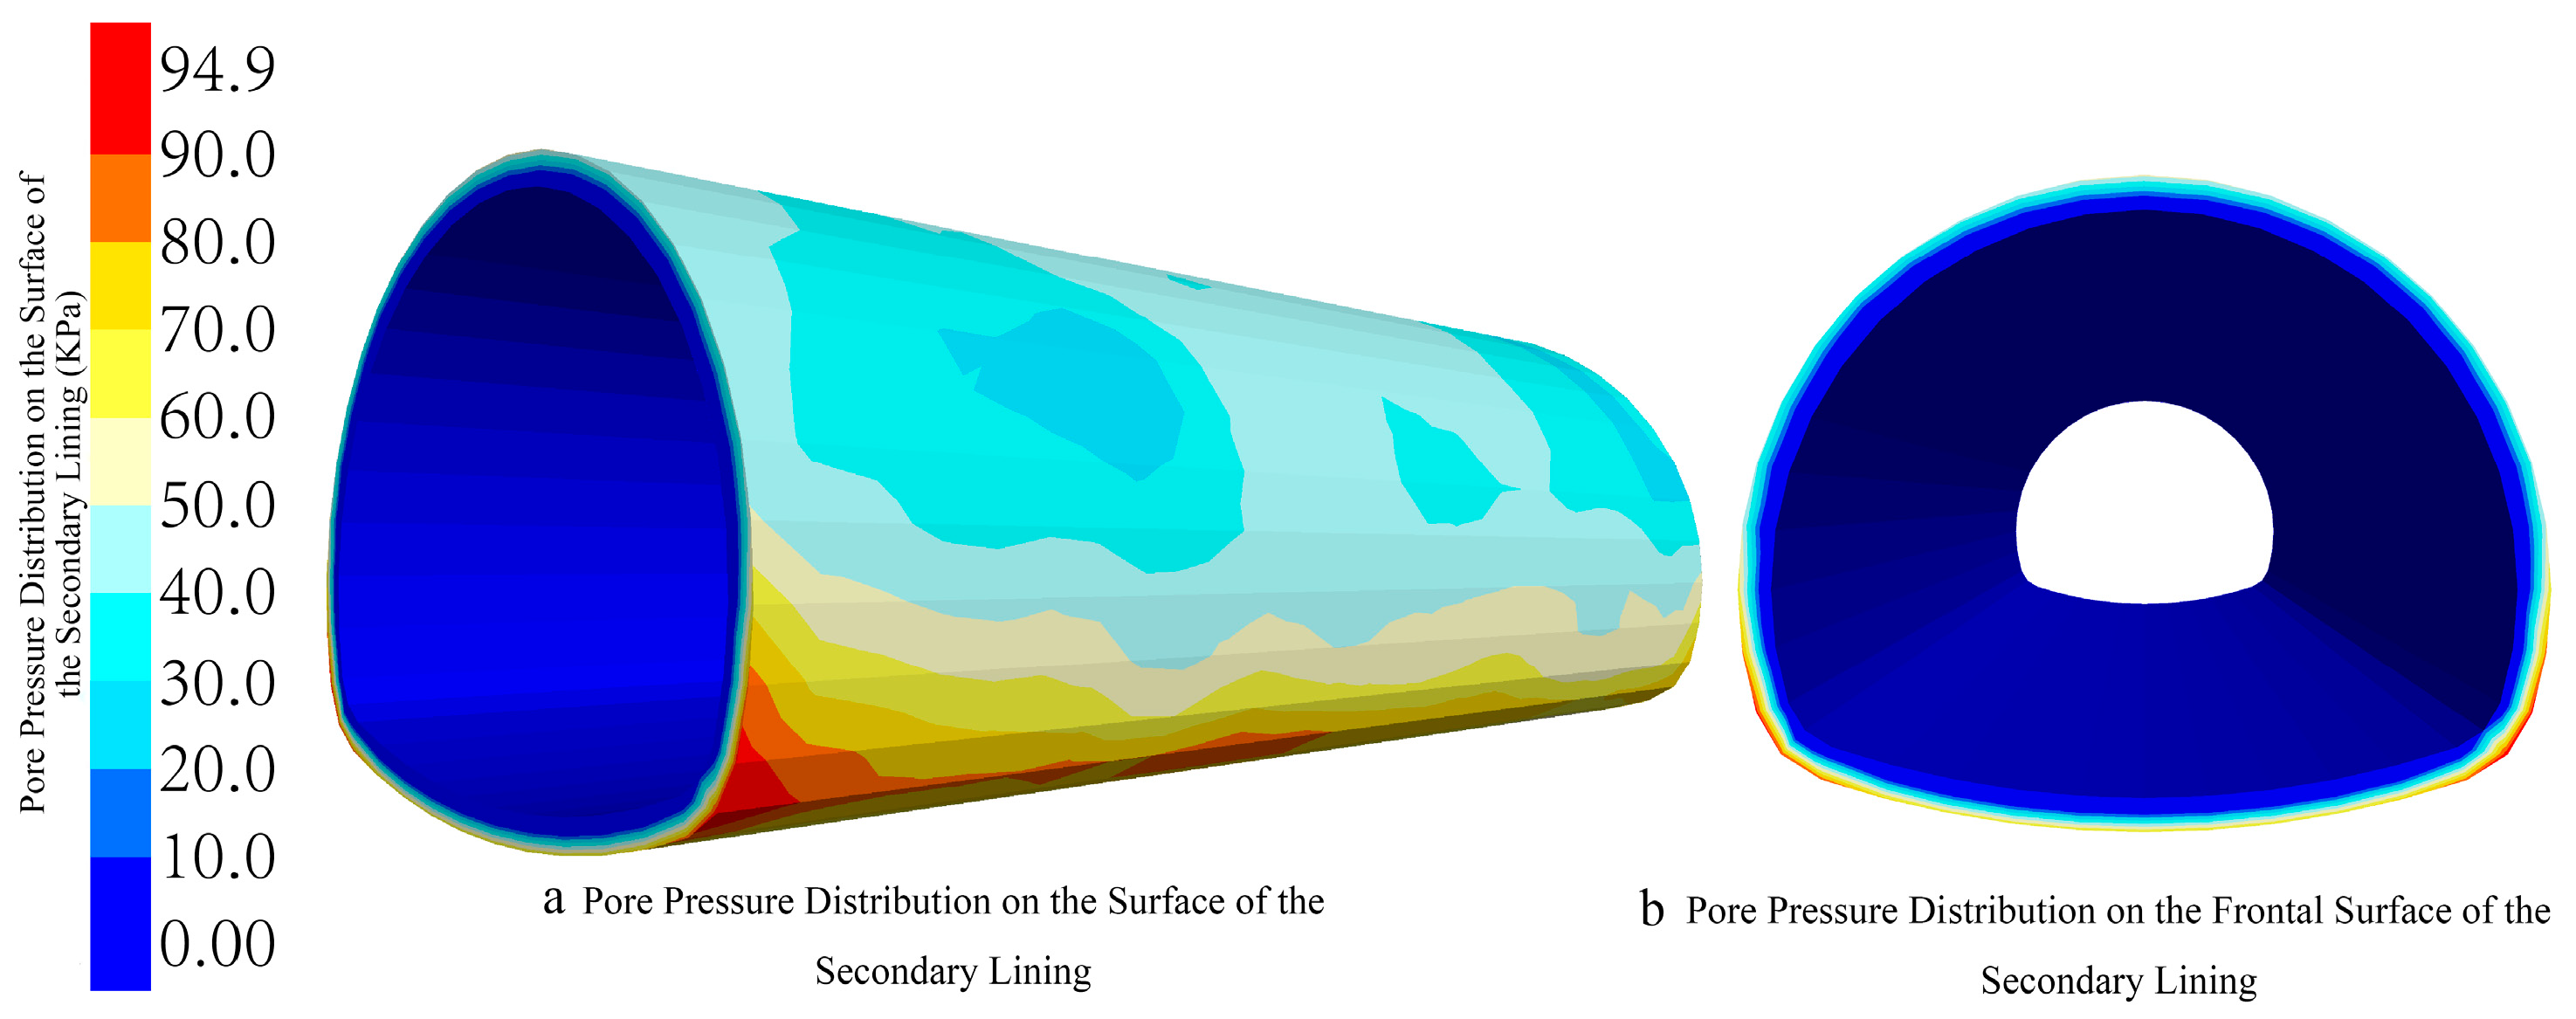
To analyze the pore water pressure distribution in the gully valley after 24 h of heavy rainfall, the cross-section of the stratum, the overall state, and the gully bottom (y = 11 cross-section) state were analyzed, respectively, after the seepage simulation was completed. For the convenience of observing the pore water pressure distribution in each region, the color scale was uniformly processed. The pore water pressure distribution in the rock stratum is shown in Figure 13, and the pore water pressure distribution in the secondary lining is shown in Figure 14.
It is found from the pore water pressure distribution in the rock stratum (Figure 13) that after the completion of the 24 h heavy rainfall seepage simulation, the surface pore water pressure gradually increases from the initial 0 or negative pressure to a positive pore water pressure state. The overall pore water pressure distribution of the rock stratum shows that the pressure starts from 0 or negative at the top surface and gradually increases downward, with the maximum pore water pressure at the bottom of the rock stratum being 0.55 MPa. The pore water pressure distribution of the rock stratum is divided into two states with the tunnel as the boundary: the pore water pressure in the rock stratum below the tunnel is uniformly distributed; the pore water pressure in the tunnel area and the rock stratum above the tunnel is generally uniform and continuous, with minor disorder in a small number of areas. The disordered distribution of pore water pressure mainly occurs in two areas: the rock stratum directly below the gully bottom and the surrounding rock stratum with the tunnel as the outline. From the contour maps (a and c) in Figure 13, it can be clearly observed that affected by the gully terrain, the pore water pressure extends downward and increases directly below the aqueduct. The reason for this phenomenon is that, affected by the valley terrain, fluids gradually converge at the gully bottom, resulting in higher pore water pressure in the rock mass directly below the gully bottom than in other areas, thus causing the disorder.
From the contour map (c) in Figure 13 and the pore water pressure distribution of the secondary lining in Figure 14, it can be found that since the secondary lining is an impermeable boundary model, the pore water pressure decreases toward the tunnel arch bottom, and the pore water pressure near the tunnel is less than that of the surrounding layer at the same elevation. The pore water pressure distribution on the outer surface of the secondary lining shows that the pressure in the area from the vault to the arch waist is lower than that in the area from the arch foot to the arch bottom, with the maximum pore water pressure occurring in the arch foot area. The pore water pressure distribution of the secondary lining cross-section shows an increasing trend from the inside of the tunnel cavity to the outside, and the pore water pressure inside the tunnel cavity is 0.
The above analysis clearly reveals the macroscopic distribution law of pore water pressure after rainfall; however, it should be noted that the research in this section still has certain limitations. The numerical model treats the rock mass as a homogeneous and continuous porous medium and does not consider the preferential flow guidance effect of preferential channels such as joints and fractures in the rock mass on rainfall infiltration. This simplification may cause the model to underestimate the concentration degree and rise rate of pore water pressure in local areas. In actual engineering, concentrated seepage along fractures is often the key inducement of local instability.

5.3. Displacement and Deformation Characteristics of Surrounding Rock and Support Structure

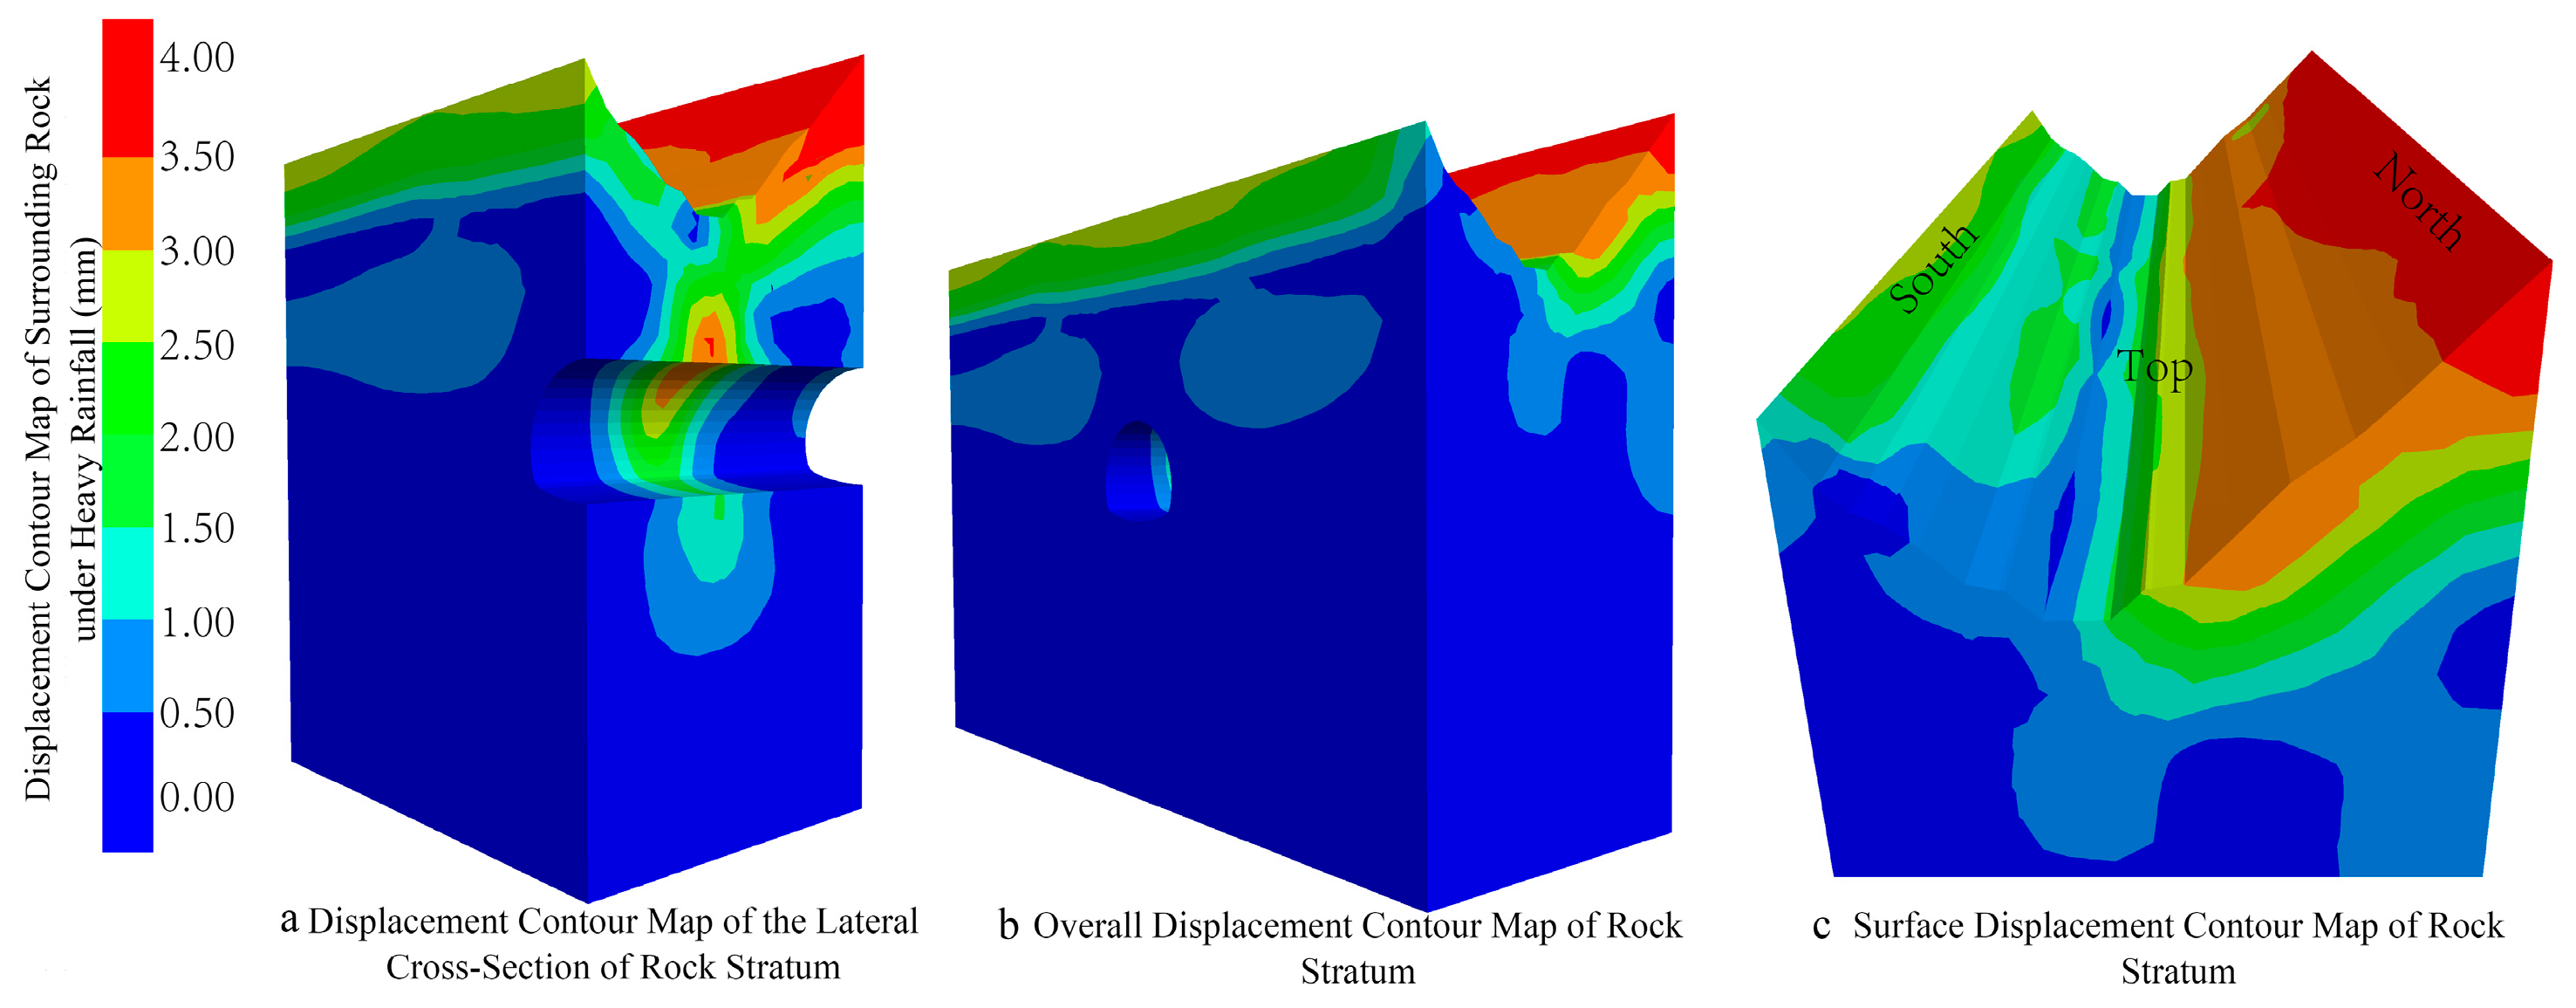
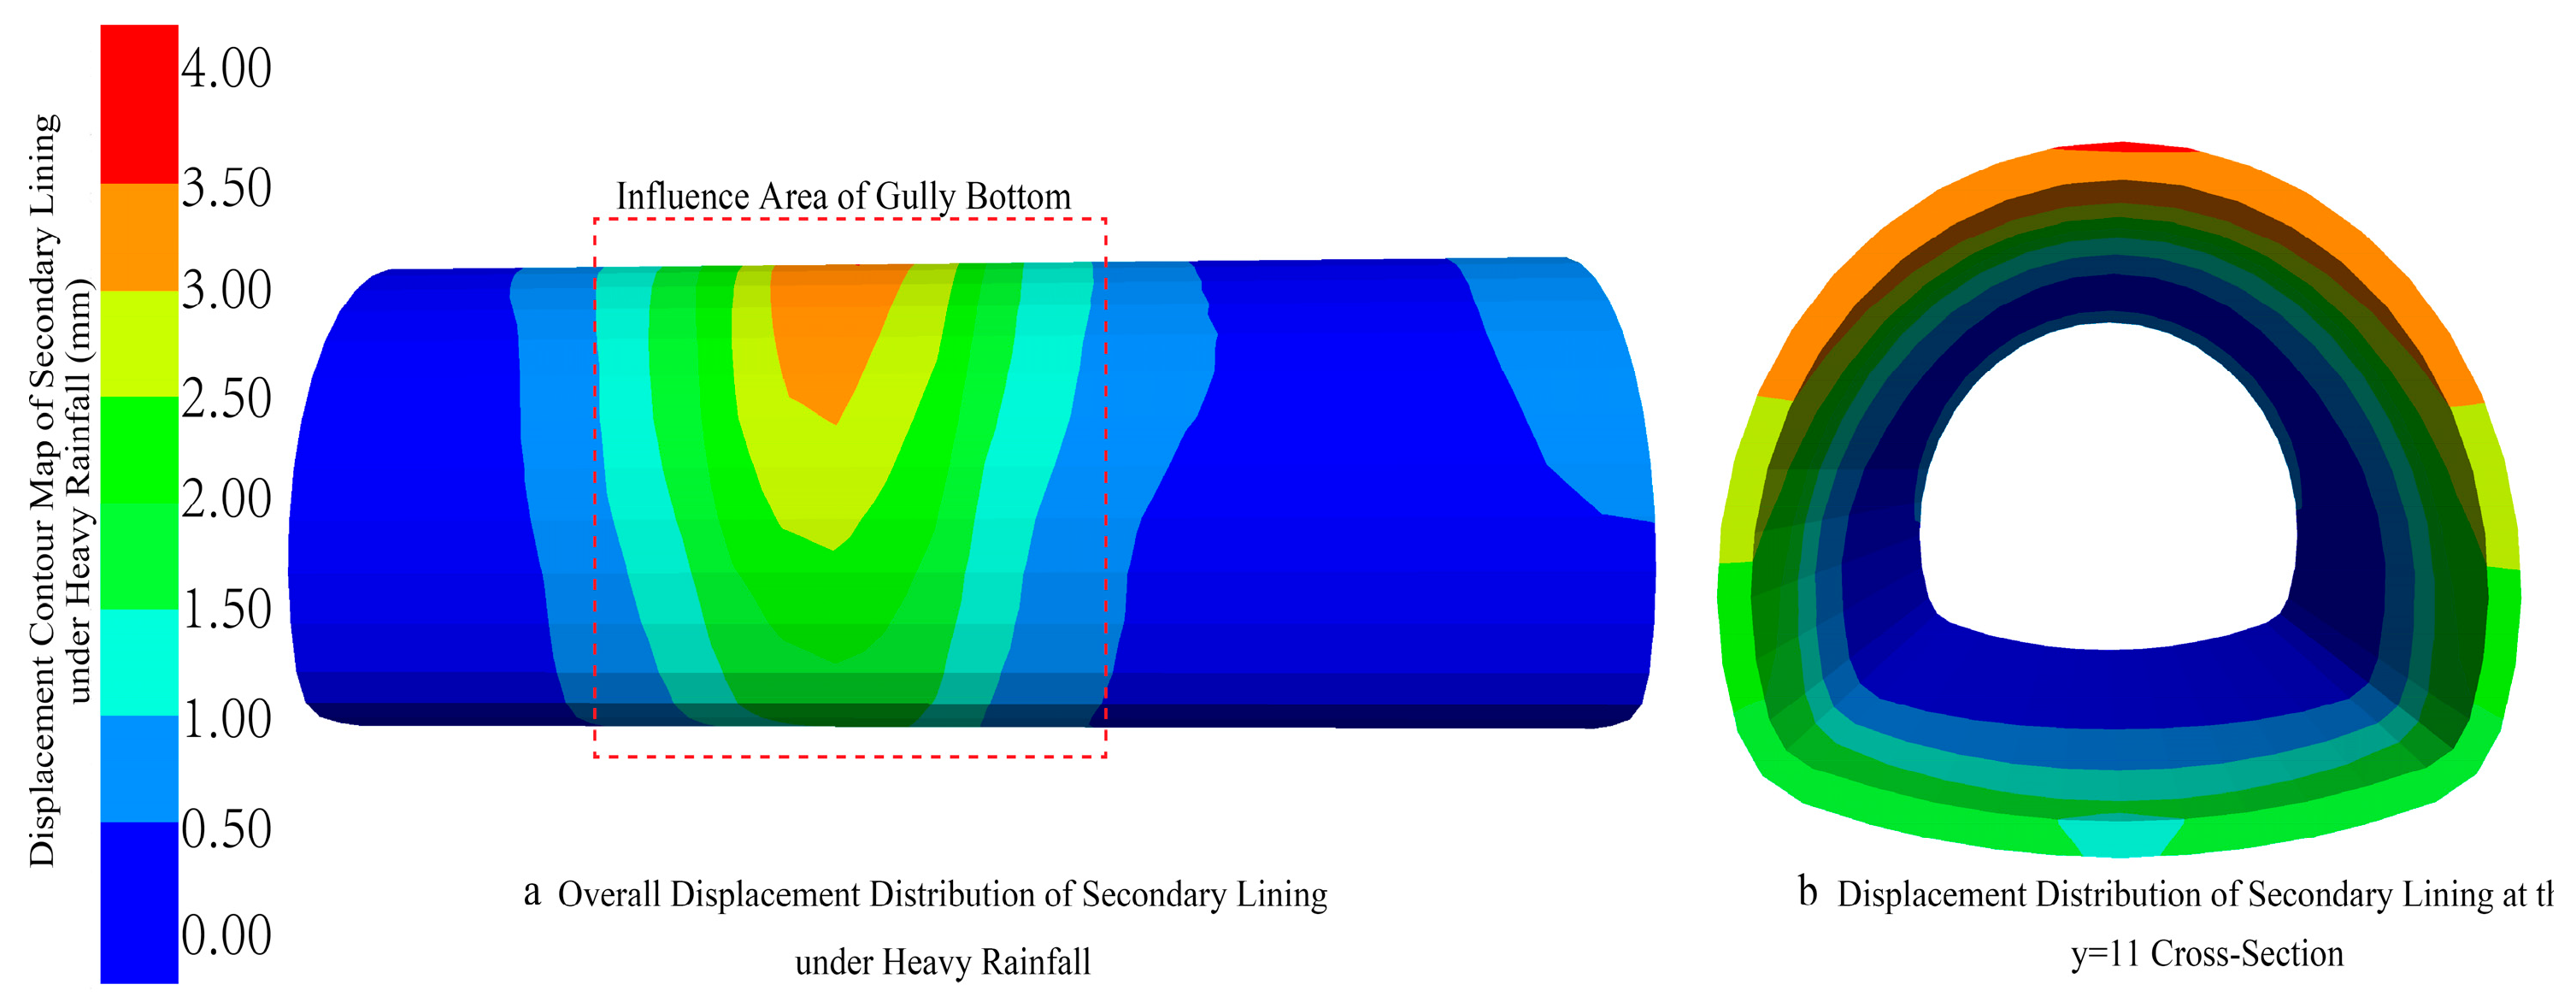
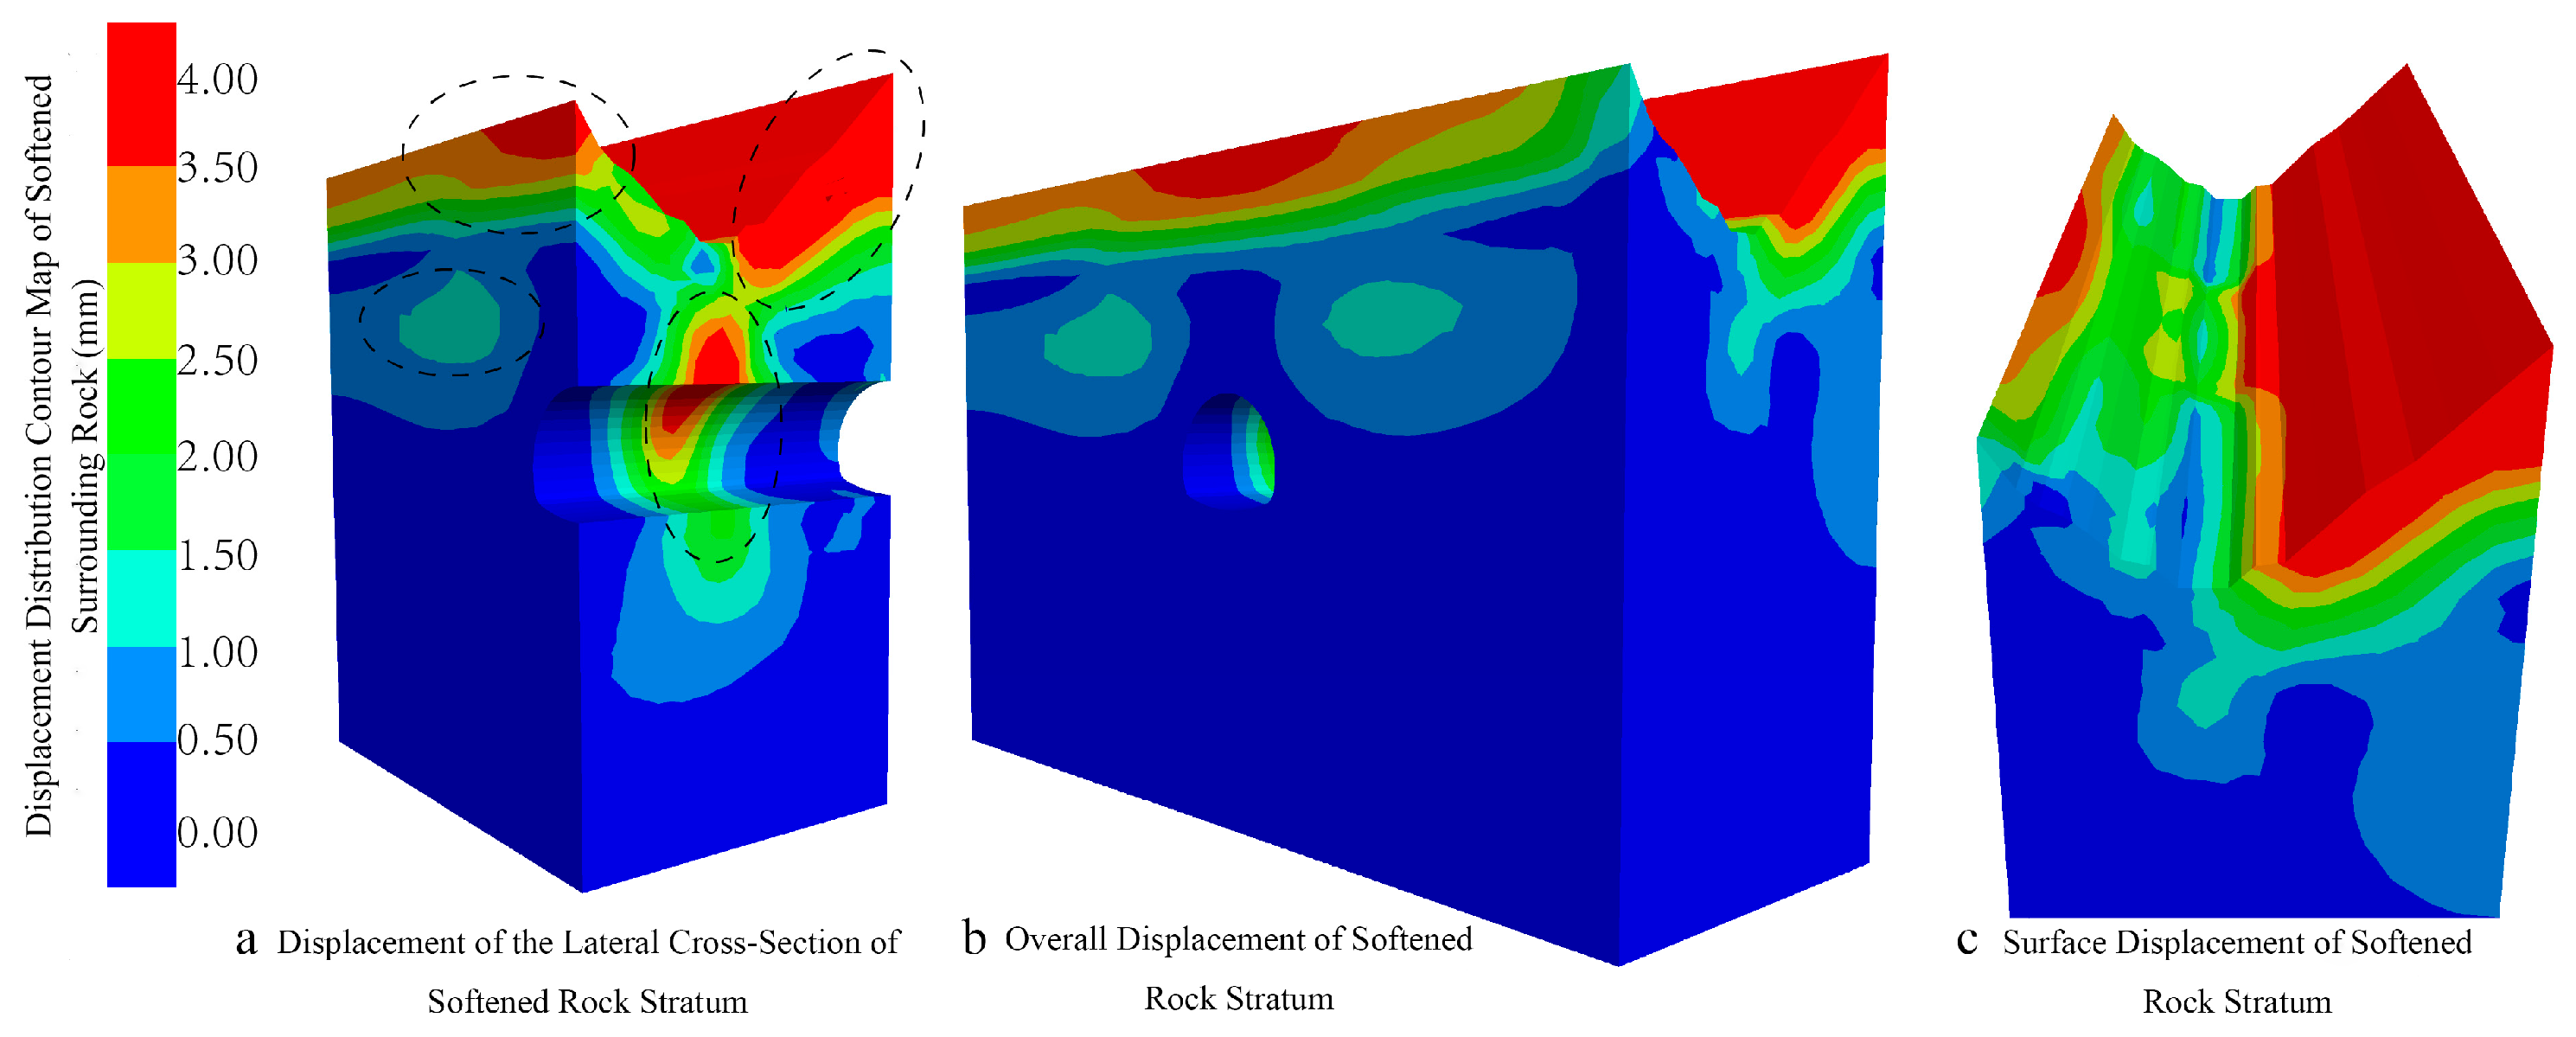
Figure 15 is the contour map of rock stratum displacement variation under heavy rainfall analysis. It can be seen from the figure that the main affected area of heavy rainfall is the two slopes above the gully valley, and there is basically no impact on the displacement of the rock stratum below the tunnel. Affected by the valley terrain, the displacement of the north slope is greater than that of the south slope: the maximum displacement of the north slope reaches 4 mm, and the maximum displacement of the south slope is 3 mm, with the two maximum displacements, respectively, occurring at the tops of the two slopes. Due to the convergence effect of the valley bottom, the rock stratum directly below the gully valley bottom has different degrees of displacement under this influence. The affected depth extends to below the tunnel arch bottom: in this area, the tunnel vault has a displacement of approximately 3 mm, and the arch bottom has a displacement of 1 mm. It is analyzed from Figure 14 that the main affected area of heavy rainfall on the tunnel secondary lining is distributed in the area directly below the valley bottom; the displacement of the tunnel in other sections is basically 0, with little influence from heavy rainfall. Through the comparison of Figure 16a,b, it is found that the distribution state of the rock stratum displacement contour map after heavy rainfall has a certain similarity to the pore water pressure distribution state. Both show a layered distribution from the slope to the valley bottom, extending downward.
This section successfully simulates the characteristics of the transient displacement field caused by heavy rainfall; however, it should be clarified that the displacement analysis in this study has the following limitations. The analysis is mainly based on elastic and elastoplastic constitutive models, which fail to fully reflect the nonlinear rheological properties of tuff under softening and large deformation conditions. The model simulates the displacement response after instantaneous heavy rainfall but does not consider the creep deformation of the rock mass under long-term high water content conditions, which may lead to deficiencies in the prediction of long-term displacement.

5.4. Influence of Rock Stratum Softening on Tunnel Stability

The saturated water content of blastoporphyritic tuff is 4.6%, and the saturated softening coefficient is 0.59; this degree of softening has a significant impact on the strength and stability of surrounding rock. This section introduces the concept of stratum softening: by establishing the relationship between rock stratum water content and softening degree, when the rock stratum water content increases with rainfall duration, the softening coefficient in the area with increased water content decreases from 1 to 0.59 eventually. Analyzing the influence of rock stratum weakening on the stability of the tunnel in this section is of great significance for tunnel drainage protection and long-term safe operation in this area. Figure 17 and Figure 18 are, respectively, the displacement contour maps of the rock stratum and secondary lining after the completion of the 24 h heavy rainfall weakening simulation; Figure 19 is the pore pressure distribution map on the outer surface of the secondary lining.
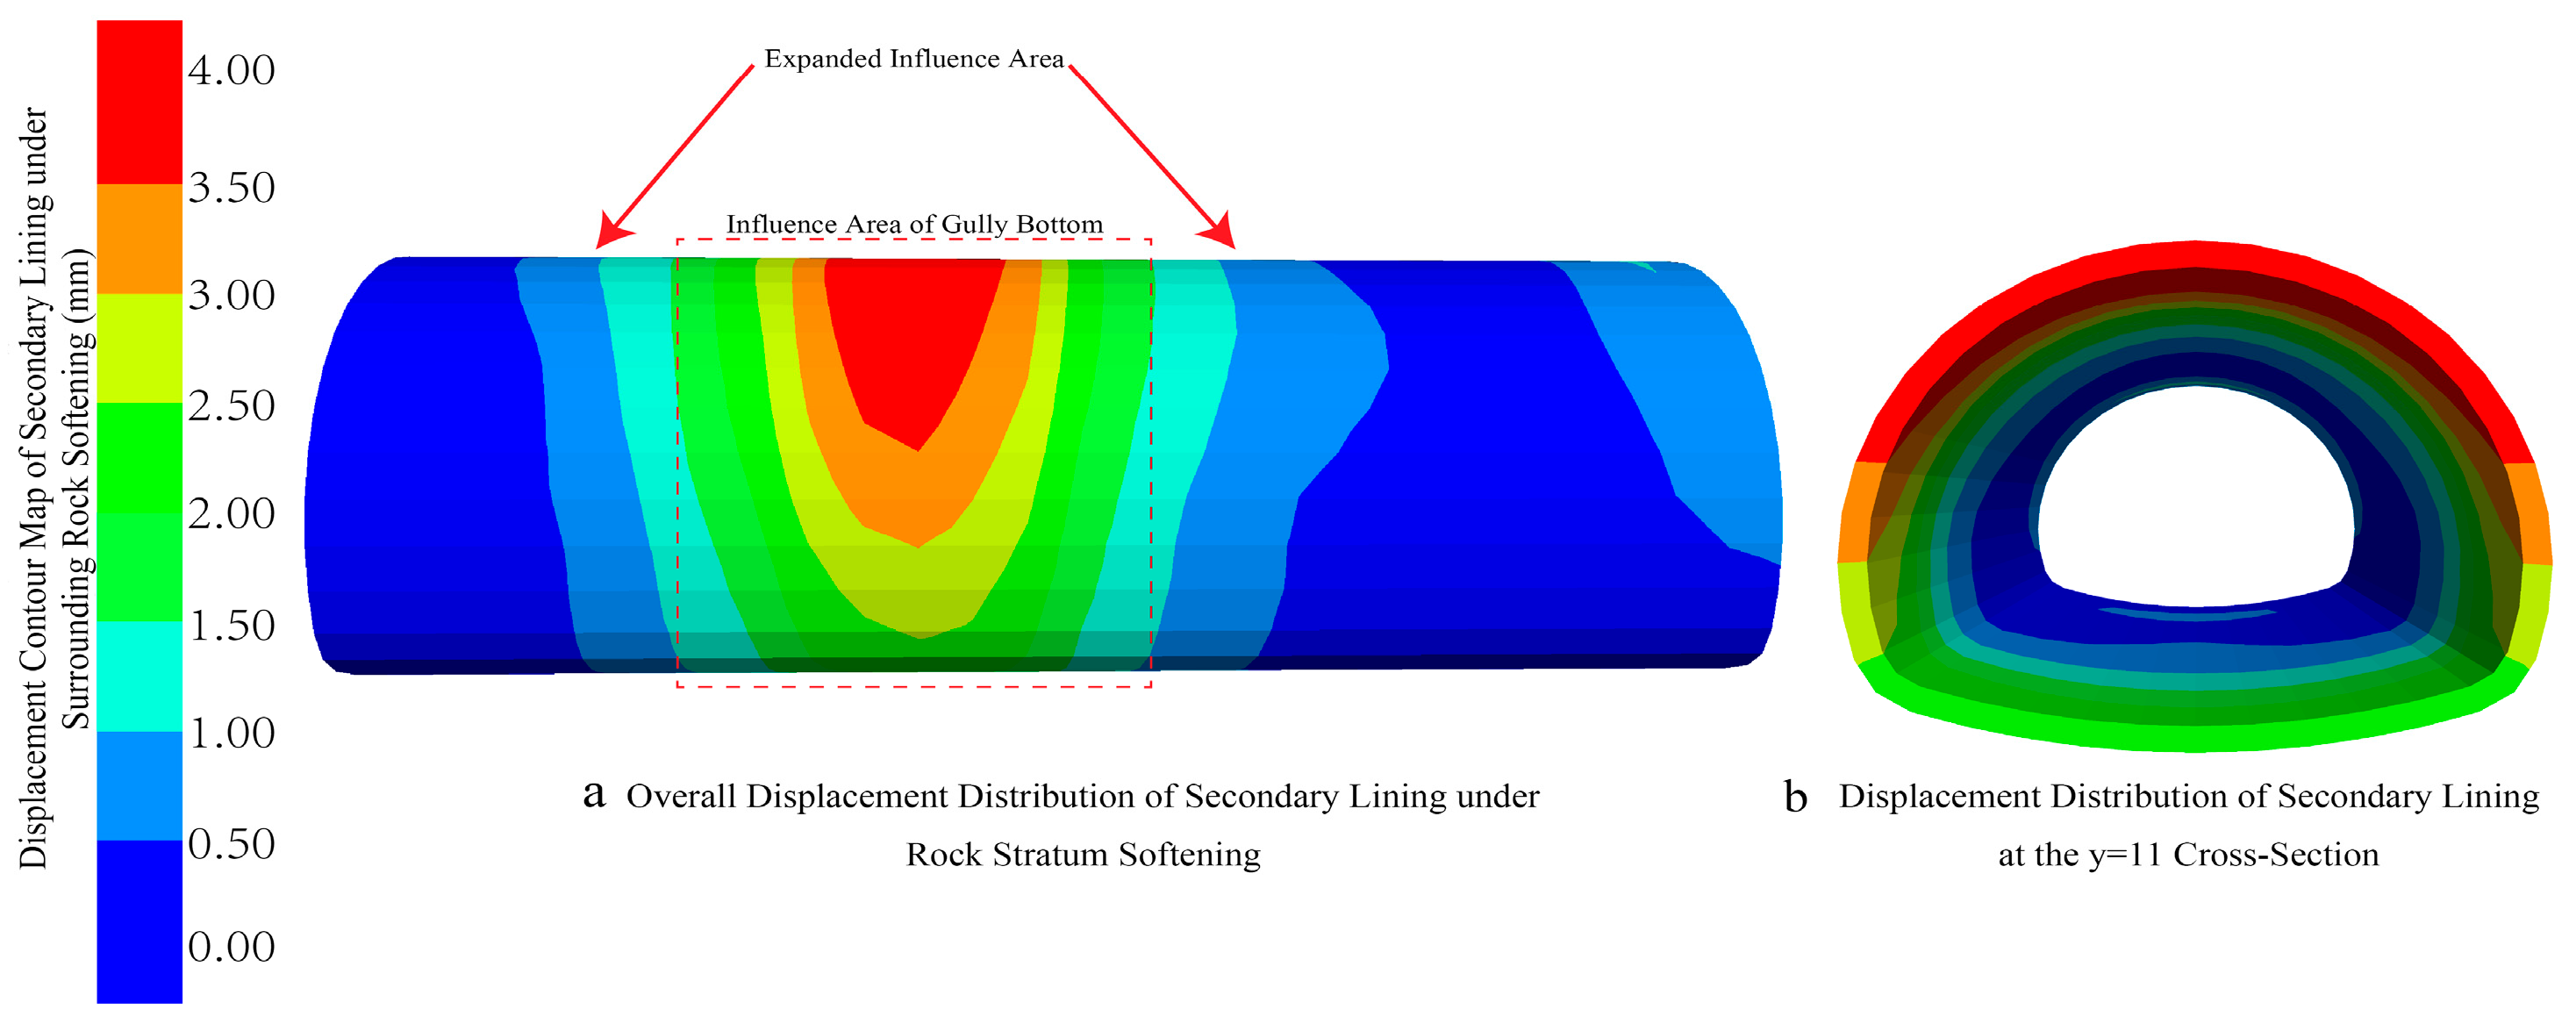
By comparing Figure 15 and Figure 17, it is concluded that the softening factor has a significant impact on rock stratum stability: when the stratum is basically in a saturated state and the rock stratum softening coefficient is 0.59, the overall distribution of rock stratum displacement changes significantly compared with the case where the weakening factor is not considered. For the convenience of analyzing the affected area, after unifying the displacement color scale, it is found that the displacement of the north slope of the gully has expanded from the partial area with 4 mm displacement only at the top of the slope to the entire slope surface of the north slope, while the top of the south slope also has a partial area with 4 mm displacement. Through data monitoring, the maximum displacement of the north slope top after softening is 6.3 mm, and the south slope has a maximum displacement of 4.5 mm. Besides the large-area impact on the gully slope surface, the rock stratum directly below the gully bottom also shows an increase in displacement due to softening. By comparing Figure 16 and Figure 18, it is found that the displacement of the secondary lining increases due to the rock stratum softening factor. The most affected area of the secondary lining is directly below the gully bottom: the displacement increases from the original 3 mm to 4 mm, and the distribution range expands from only the vault to the area from the vault to the waist of the arch; the maximum displacement of the secondary lining vault after weakening reaches 4.2 mm. In addition to the increase in displacement, the affected range of the gully bottom also expands from the original gully bottom area to the north and south sides, and the affected depth gradually extends.
By comparing Figure 19 and Figure 14, it is found that unlike the displacement changes in various areas of the rock stratum, the pore pressure distribution on the outer surface of the secondary lining does not change significantly due to the rock stratum softening. The location with the maximum pore pressure on the outer surface is still the arch foot area: the maximum value increases from the original 94.9 kPa to 95.8 kPa, with an increase of only 0.9%. The pore water pressure in some areas of the secondary lining arch waist increases slightly, which is marked with black circles in Figure 19.
Although this section quantitatively analyzes the significant impact of rock stratum softening on stability, the softening model adopted still needs to be viewed critically. In the model, the rock mass softening coefficient is set to change instantaneously and uniformly with water content; in reality, water–rock physicochemical interactions are a time-dependent process, and softening is inhomogeneous inside the rock mass. In addition, the model does not consider the cumulative damage and strength deterioration of the rock mass caused by cyclic wetting and drying, which is crucial for evaluating the long-term stability of tunnels under seasonal rainfall.

6. Conclusions

Through laboratory tests, on-site monitoring, and numerical simulations, this study systematically reveals the deformation mechanisms and stability control methods of tuff gully tunnels under heavy rainfall infiltration. The main conclusions are as follows:
(1)
It reveals the “water content threshold effect” and softening law of tuff mechanical properties. Through systematic unsaturated mechanical tests, the phased attenuation characteristics of the mechanical parameters of the local blastotuff with water content were quantified. The critical water content for significant strength deterioration was determined to be 2.5%, and the saturated softening coefficient was measured as 0.59. This law provides a key theoretical and data basis for the stability evaluation and early warning of tunnel surrounding rock during the rainy season.
(2)
It clarifies the “seepage-control and convergence” effect of gully topography and the redistribution law of pore water pressure under heavy rainfall infiltration. Numerical simulations reveal that rainfall converges at the gully bottom under the control of the gully’s “concave” topography, causing the pore water pressure of the rock stratum to increase from the top to the bottom, with the maximum reaching 0.55 MPa at the bottom. For the first time, it systematically presents a binary distribution pattern of “uniform below, disordered above” bounded by the tunnel, especially forming a significant pore water pressure extension zone directly below the aqueduct. This law clarifies that the reconstruction of the seepage field is the primary external environmental factor affecting tunnel stability.
(3)
It reveals the deformation synergy mechanism and stability-sensitive zones under the “seepage-softening” coupling effect. The study clarifies for the first time that the special seepage field controlled by topography and the strength softening effect of tuff are coupled with each other, leading to non-uniform distribution of deformations in the surrounding rock and support structures. Instead, deformations are highly concentrated in three key stability-sensitive zones: directly below the gully bottom, arch haunches, and arch crown. This mechanism explains the cause of the spatial differentiation of deformations and provides a reference for precise prevention and control.

Author Contributions

Methodology, W.M. and X.L.; investigation, P.S. and Y.L.; Formal analysis, S.W. and R.M.; Data curation, R.M.; writing—original draft preparation, L.X. and S.W.; writing and editing, S.W. All authors have read and agreed to the published version of the manuscript.

Funding

Funding was provided by Tianshan Talent Training Program: Science and Technology Innovation Leading Talents (Grant No. 2023TSYCLJ0055); China Construction Xinjiang Construction Engineering Group Project (Grant No. 65000022859700220245, 65000022859700X200173).

Institutional Review Board Statement

Not applicable.

Informed Consent Statement

Not applicable.

Data Availability Statement

Original data generated/analyzed in this study are partially included in the article and its figures/tables; complete datasets are available from the corresponding author on reasonable request.

Conflicts of Interest

Authors Xuejun Liu and Yanjun Li were employed by Xinjiang Academy of Architectural Science (Limited Liability Company), Urumqi, China. The remaining authors declare that the re-search was con-ducted in the absence of any commercial or financial relationships that could be construed as a potential conflict of interest.

References

  1. Li, X.; Luo, Q.; Yan, F.; Qi, C. Dynamic compressive micro-macro fracture mechanism with the water-saturated strengthening and weakening effect in brittle rocks. Theor. Appl. Fract. Mech. 2025, 137, 104871. [Google Scholar] [CrossRef]
  2. Yujing, J.; Lugen, C.; Dong, W.; Hengjie, L.; Guangchao, Z.; Ling, D.; Bin, L. Mechanical properties and acoustic emission characteristics of soft rock with different water contents under dynamic disturbance. Int. J. Coal Sci. Technol. 2024, 11, 36. [Google Scholar] [CrossRef]
  3. Ning, L.; Zhijun, J.; Haibo, W.; Yushi, Z.; Shicheng, Z.; Fengxia, L.; Tong, Z.; Minqu, J. Investigation into shale softening induced by water/CO2-rock interaction. Int. J. Rock Mech. Min. Sci. 2023, 161, 105299. [Google Scholar]
  4. Li, T.; Jiang, M.; Thornton, C. Three-dimensional discrete element analysis of triaxial tests and wetting tests on unsaturated compacted silt. Comput. Geotech. 2018, 97, 90–102. [Google Scholar] [CrossRef]
  5. Moore, D.E.; Lockner, D.A. Crystallographic controls on the frictional behavior of dry and water-saturated sheet structure minerals. J. Geophys. Res. Solid Earth 2004, 109, B03401. [Google Scholar] [CrossRef]
  6. Jiao, L.; Hao, C.; Duan, D.; Lu, W.; Gan, Y.; Qi, J.; Yang, W.; Chen, Y. Molecular dynamics simulation of water absorption and mechanical weakening in coal rocks based on Monte Carlo methods. Solid State Ion. 2024, 418, 116743. [Google Scholar] [CrossRef]
  7. Liang, N.; Jin, T.; Zhang, J.; Lu, D. Mechanism Study on the Intrinsic Damage and Microchemical Interactions of Argillaceous Siltstone Under Different Water Temperatures. Appl. Sci. 2024, 14, 11747. [Google Scholar] [CrossRef]
  8. Liu, Y.; Yu, Z.; Yin, Y.; Wen, J. Comparative Evaluation of Presented Strength Criteria of Anisotropic Rocks Based on Triaxial Experiments. Appl. Sci. 2025, 15, 5308. [Google Scholar] [CrossRef]
  9. Baud, P.; Louis, L.; David, C.; Rawling, G.C.; Wong, T.-F. Effects of Bedding and Foliation on Mechanical Anisotropy, Damage Evolution and Failure Mode; Geological Society, London, Special Publications: Bath, UK, 2005; Volume 245, pp. 223–249. [Google Scholar] [CrossRef]
  10. Wei, H.; Rui, F.; Huanran, F.; Jingyu, C.; Zili, F. Mechanical Properties of Soft Rocks Subjected to Water-Rock Reaction and Cyclic Pressure. Adv. Civ. Eng. 2022, 2022, 1533464. [Google Scholar]
  11. Xu, H.; Liu, J.; Wang, L.; Yang, B.; Yang, H. The weakening effect of hydrostatic pressure on rock mass of different lithology. Environ. Earth Sci. 2015, 74, 2489–2497. [Google Scholar] [CrossRef]
  12. Heap, M.J.; Harnett, C.; Farquharson, J.; Baud, P.; Rosas-Carbajal, M.; Komorowski, J.C.; Violay, M.E.S.; Gilg, H.A.; Reuschlé, T. The influence of water-saturation on the strength of volcanic rocks and the stability of lava domes. J. Volcanol. Geotherm. Res. 2023, 444, 107962. [Google Scholar] [CrossRef]
  13. Pan, Y.; Wu, G.; Zhao, Z.; He, L. Analysis of rock slope stability under rainfall conditions considering the water-induced weakening of rock. Comput. Geotech. 2020, 128, 103806. [Google Scholar] [CrossRef]
  14. Zhou, Z.; Wang, H.; Jiang, M. Theoretical study on the water-induced weakening of rock based on microstructural mechanics approach. Eur. J. Environ. Civ. Eng. 2025, 29, 89–111. [Google Scholar] [CrossRef]
  15. Ding, C.; Zhang, Y.; Yang, X.; Hu, D.; Zhou, H.; Lu, J. Permeability evolution of tight sandstone under high confining pressure and high pore pressure and its microscopic mechanism. Rock Soil Mech. 2019, 40, 3300–3308. [Google Scholar]
  16. Zheng, J.; Zheng, L.; Liu, H.-H.; Ju, Y. Relationships between permeability, porosity and effective stress for low-permeability sedimentary rock. Int. J. Rock Mech. Min. Sci. 2015, 78, 304–318. [Google Scholar] [CrossRef]
  17. Zhang, R.; Ning, Z.; Yang, F.; Zhao, H.; Wang, Q. A laboratory study of the porosity-permeability relationships of shale and sandstone under effective stress. Int. J. Rock Mech. Min. Sci. 2016, 81, 19–27. [Google Scholar] [CrossRef]
  18. Mao, W.; Ren, Z.L.; Liu, X.J.; Muhemaier, R.; Li, Y.J.; Jiang, C.T. Research on the Stability of Lining Structures Under Different Fault Moments Based on FDM-DEM. Build 2024, 14, 16. [Google Scholar] [CrossRef]
  19. Wang, J.-A.; Park, H.D. Fluid permeability of sedimentary rocks in a complete stress–strain process. Eng. Geol. 2002, 63, 291–300. [Google Scholar] [CrossRef]
  20. Jiang, C.T.; Mao, W.; Zhang, Y.K.; Liu, X.J.; Muhemaier, R.; Xie, L.F. Influence of external insert angle on structural deformation of long pipe shed with shallow hole. Sci. Rep. 2023, 13, 18. [Google Scholar] [CrossRef]
  21. Xing, J.; Zhao, C.; Yu, S.; Matsuda, H.; Ma, C. Experimental Study on Rock-Like Specimens with Single Flaw under Hydro-Mechanical Coupling. Appl. Sci. 2019, 9, 3234. [Google Scholar] [CrossRef]
  22. JTG D70-2004; Code for Design of Road Tunnel. Chongqing Transportation Research and Design Institute: Chongqing, China, 2004.
  23. GB/T 50081-2019; Standard for Test Methods of Concrete Physical and Mechanical Properties. China Architecture & Building Press: Beijing, China, 2019.
  24. Guo-Ping, X.; Hong-Zhou, L.; Bai-Yong, F.; Jian-Gang, Y. Research and prospect of post-peak strain-softening characteristics of rocks. IOP Conf. Ser. Earth Environ. Sci. 2021, 787, 012135. [Google Scholar]
  25. Liu, Z.; He, X.; Fan, J.; Zhou, C. Study on the Softening Mechanism and Control of Red-Bed Soft Rock under Seawater Conditions. J. Mar. Sci. Eng. 2019, 7, 235. [Google Scholar] [CrossRef]
  26. Shipiao, C.; Sumin, Z. Handbook of Engineering Geology; China Architecture&Building Press: Beijing, China, 2007. [Google Scholar]
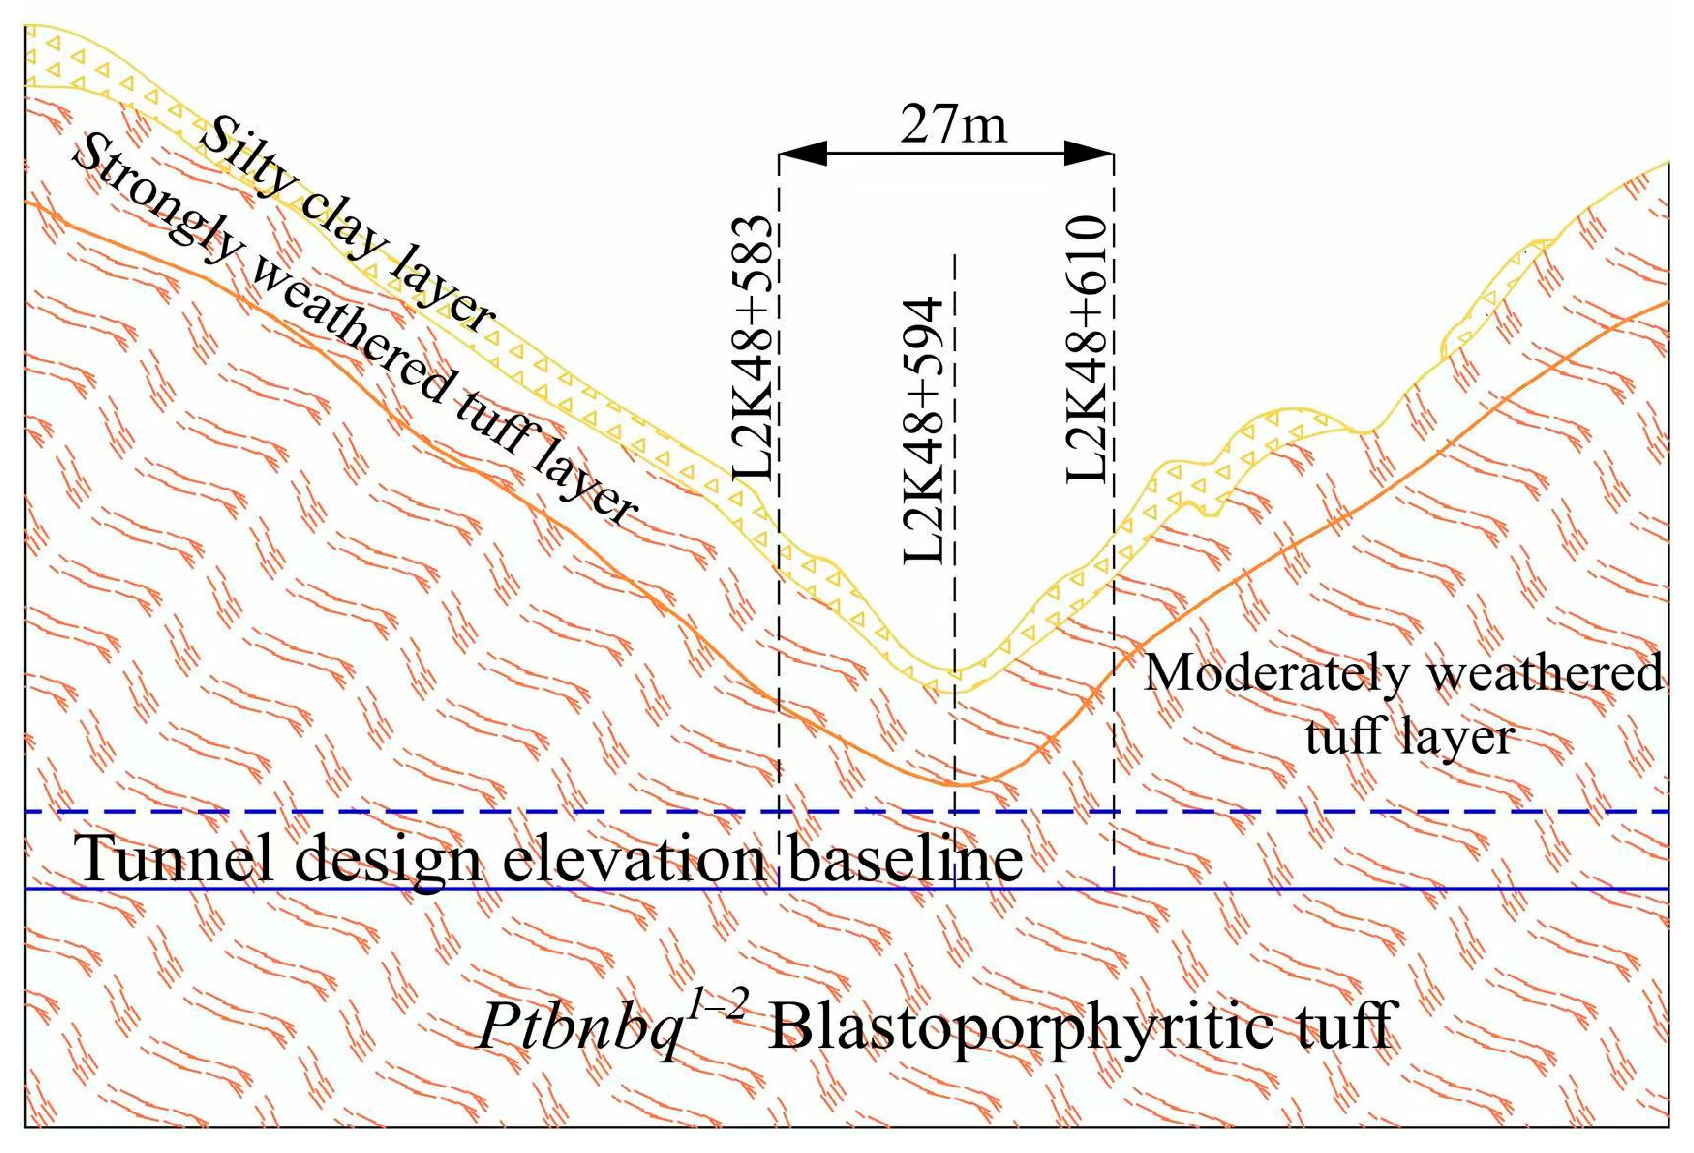
Figure 1. Geological Section of the Gully Section.
Applsci 15 11385 g001
Figure 2. Actual Scene of the Gully Valley.
Applsci 15 11385 g002
Figure 3. Lithology of the Main Tunnel Alignment.
Applsci 15 11385 g003
Figure 6. Relationship between Elastic Modulus and Water Content.
Applsci 15 11385 g006
Figure 7. Relationship between Tensile Strength and Water Content.
Applsci 15 11385 g007
Figure 8. Relationship between Compressive Strength and Water Content.
Applsci 15 11385 g008
Figure 9. Relationship between Softening Coefficient and Water Content.
Applsci 15 11385 g009
Figure 10. Overall Model of the Study Area.
Applsci 15 11385 g010
Figure 11. Structural Modeling.
Applsci 15 11385 g011
Figure 12. Secondary Lining Modeling.
Applsci 15 11385 g012
Figure 13. Contour Map of Pore Water Pressure Distribution in Rock Strata.
Applsci 15 11385 g013
Figure 14. Water Pressure Distribution Map on the Outer Surface of the Secondary Lining.
Applsci 15 11385 g014
Figure 15. Contour Map of Rock Strata Displacement under Heavy Rainfall Analysis.
Applsci 15 11385 g015
Figure 16. Contour Map of Secondary Lining Displacement under Heavy Rainfall Analysis.
Applsci 15 11385 g016
Figure 17. Contour Map of Rock Strata Displacement under Rock Strata Weakening.
Applsci 15 11385 g017
Figure 18. Contour Map of Secondary Lining Displacement under Rock Strata Weakening.
Applsci 15 11385 g018
Figure 19. Pore Water Pressure Distribution on the Outer Surface of the Secondary Lining under Rock Strata Weakening.
Applsci 15 11385 g019
Table 1. Data of Rock Core Unconfined Compression Tests.
ItemWater Content %Failure Load
kN
Compressive Strength MPaElastic Modulus
GPa
undisturbed rock core090.88746.347.245
soaked12.80588.33545.045.918
soaked23.37887.74644.745.612
soaked33.61483.42742.543.376
soaked43.72571.45336.437.143
soaked54.03268.90135.135.816
soaked64.09467.91934.635.306
soaked74.19760.46030.831.429
soaked84.52157.71229.430.052
soaked94.57355.16828.128.673
soaked104.61354.76227.928.469
Table 2. Data of Rock Core Splitting Tests.
ItemWater Content%Failure Load KNTensile Strength MPa
undisturbed rock core07.341.87
soaked12.226.831.74
soaked23.796.291.61
soaked34.265.981.52
soaked44.414.711.20
soaked54.574.671.19
Table 3. Engineering Geology Evaluation of Softening Coefficients.
Softening CoefficientEvaluation of Water Influence Degree on Rock
<0.40Water exerts severe influence on rock
0.40~0.65Water exerts significant influence on rock
0.65~0.80Water exerts moderate influence on rock
0.80~0.95Water exerts slight influence on rock
>0.95Water exerts no influence on rock
Table 4. Physical and Mechanical Parameters of Strata.
ItemDensity
/(kg/m3)
Elastic Modulus
E/GPa
Poisson’s RatioCohesion/MPaFriction Angle/°
Blastoporphyritic Tuff265047.10.157.345.8
Aqueduct25000.30.2
C30 Secondary Lining2500300.2
C20 Shotcrete2400280.13
Steel Arch78502060.3
Φ25Rock Bolt78502000.3
Φ50Rock Bolt78502000.3
Φ42Rock Bolt78502000.3
Disclaimer/Publisher’s Note: The statements, opinions and data contained in all publications are solely those of the individual author(s) and contributor(s) and not of MDPI and/or the editor(s). MDPI and/or the editor(s) disclaim responsibility for any injury to people or property resulting from any ideas, methods, instructions or products referred to in the content.