Article

Synergistic Effects of Fly Ash and Oyster Shell Powder in Ternary Low-Carbon Cementitious Materials: Macro–Micro Experimental Studies and Life Cycle Evaluation

1
Department of Integrated Energy and Infra System, Kangwon National University, Chuncheon-si 24341, Gangwon, Republic of Korea
2
Department of Architectural Engineering, Kangwon National University, Chuncheon-si 24341, Gangwon, Republic of Korea
*
Authors to whom correspondence should be addressed.
Appl. Sci. 2025, 15(21), 11319; https://doi.org/10.3390/app152111319
Submission received: 24 August 2025 / Revised: 20 October 2025 / Accepted: 20 October 2025 / Published: 22 October 2025
(This article belongs to the Section Civil Engineering)

Abstract

As a result of global urbanization, the construction industry has mainly emitted CO2 from ordinary Portland cement (OPC). Partially replacing cement with supplementary cementitious materials is a widely studied approach for reducing emissions. While previous studies have explored binary systems such as fly ash (FA)–cement and oyster shell powder (OSP)–cement, limited research has been conducted on ternary systems that combine FA, OSP, and cement. The differences in macro- and microsustainability performance between binary and ternary mixes remain unclear and require further exploration. To address this gap, this study verified the feasibility of using FA and OSP for partially replacing OPC in concrete. The environmental and mechanical performances of these materials were evaluated through macro- and microlevel experiments, as well as through life cycle assessments (LCAs). The results show that there is a synergistic effect in the FA-OSP-OPC ternary mixed cement (28-day strength: 40.44 MPa), which promotes the hydration of the three-component cement. Compared with the FA-OPC (28-day strength: 39.38 MPa) and OSP-OPC (28-day strength: 26.85 MPa) two-component cements, the strength is increased by 2.7% and 50.61%, respectively. At the same time, the resistivity of the three-component cement is also increased. The resistivity is increased by 19.27% ((50.69 − 42.5)/42.5) compared with the pure cement group. On this basis, the three-component cement also reduces carbon emissions by about 15% ((13.09 − 11.19)/13.09). FA-OSP-OPC ternary mixed cement improves strength and durability, reduces carbon emissions, and is an excellent new ternary mixed gel material that can be sustainably utilized.

1. Introduction

According to the UNEP (United Nations Environment Program) and other organizations, approximately 40% of carbon emissions originate from the building industry. Carbon emissions from building materials account for a large part of construction industry emissions [1]. Among them, 8% of global carbon emissions come from concrete production [2]. To reduce carbon emissions, recycling has become an important issue in building materials science [3].
Thermal power generation is still a mainstream power generation method. Fly ash (FA), a byproduct of thermal power generation, has been reused in concrete projects for decades [4]. Previous studies have shown that the proper use of FA can not only reduce the heat of hydration and improve the fluidity of fresh concrete but also improve the durability and strength of concrete after it hardens [5]. Using FA materials to replace cement [6] or fine aggregates [7] is helpful for reducing carbon emissions, avoiding wasting resources, and improving the strength of concrete [8], chloride ion corrosion resistance [9], and resistance to chemical attack [10].
On the other hand, with the development of aquaculture, the production of aquatic products such as shellfish has also grown steadily. Oysters are the main variety of shellfish cultivated in aquaculture, and oyster shells are a byproduct of oyster consumption. More than 20 million tons of oyster shells are discarded every year worldwide [11]. However, only a small portion of oyster shells are recycled; the majority are dumped in open fields or landfills, polluting water sources, producing unpleasant odors, and breeding bacteria. Furthermore, organic matter such as nitrogen (N) and phosphorus (P), which are used in aquaculture feeds, can cause eutrophication if discharged directly into the environment. Furthermore, the disposal process releases acidic gases, leading to air acidification and causing serious environmental health and pollution problems. The oyster shell powder used in this study was obtained by calcining discarded oyster shells at a medium temperature according to ASTM-F1736 and then pulverizing them to produce oyster shell powder with a particle size of approximately 27 microns [12]. CaCO3 is one of the main components of oyster shell powder, accounting for up to 96% of this product, and can be used as a filler in cement-based materials [13]. To reduce the possibility of waste oyster shells polluting the environment, some researchers have attempted to use OSP in concrete manufacturing, such as for reducing carbon emissions [14], reducing the potential for partial replacement in ternary cement and its effect on performance [15,16], etc.
Although FA and OSP have been widely studied as cement substitutes, there are research gaps (ternary systems, macro–micro correlation, extended LCA). First, regarding ternary systems, some current research focuses on the properties of binary cement blends, such as cement and FA [17,18], cement and OSP [19], etc. However, research on ternary-blended cement incorporating both FA and OSP remains relatively limited. In particular, the fundamental differences between ternary and binary systems, as well as the potential advantages of ternary systems—such as higher pozzolanic reactivity, improved durability, and lower carbon emissions—have not been fully demonstrated. Some researchers have investigated cement, FA, and limestone powder mixed with concrete [20,21]. However, research on the use of OSP to replace limestone powder in ternary-mix concrete is very limited, and there is no clear conclusion as to whether there is a synergistic effect between OSP and cement and the aluminum phase in FA for generating Hemicarbonate (Hc) or Monocarboaluminate (Mc). Second, regarding macro–micro correlation, current research on cement, FA, and OSP ternary-blended cement mostly considers macroscopic properties [22], and there is a lack of research on microscopic properties, as well as a lack of research on the relationship between these properties. Third, regarding extended LCA, in the current sustainability analysis, most researchers focus on global warming potential ( C O 2 emissions) [23,24] and lack detailed analysis of other aspects, such as the eutrophication potential (EP), ozone depletion potential (ODP), acidification potential (AP), abiotic depletion potential (AD), and photochemical ozone creation potential (POCP). Therefore, more comprehensive LCA studies are needed to fully evaluate the environmental benefits of ternary cementitious systems.
To address the shortcomings of previous studies, in this study, we conducted a systematic analysis of macro- and microsustainability at different ages for a new type of cementitious material, including cement, FA, and OSP, to clarify the microscopic mechanisms of macroscopic phenomena and emphasize the importance of this new type of three-mixed concrete in terms of sustainability [15,19,25].
This study combines macroscopic experiments (UPV, compressive strength, and surface resistivity) and microscopic experiments (heating of hydration, thermogravimetric analysis (TGA), X-ray diffraction (XRD), and Fourier transform infrared spectroscopy (FT-IR) analysis) and calculates the C O 2 emissions’ GWP and EP, ODP, AP, AD, and POCP during production. The performance of ternary-mixed cement, along with its advantages and disadvantages over binary-mixed cement, is analyzed. Additionally, whether there is a synergistic effect in ternary-mixed cement with cement, FA, and OSP, and the importance of this new ternary-mixed cementitious material in terms of sustainability are confirmed.
The main novelties of this study are summarized as follows: (1) A novel FA–OSP–cement ternary blended cementitious material was investigated, focusing on the synergistic effects between FA and OSP; (2) The study systematically explores the relationship between hydration mechanisms and macroscopic performance at different curing ages by combining macroscopic tests with microstructural analyses; (3) A comprehensive sustainability assessment was conducted based on multiple environmental impact indicators, providing a more holistic evaluation of the ternary system’s environmental performance.

2. Materials and Methods

2.1. Raw Materials

The OPC used in this study was Type I Portland cement, which complies with the KS L 5201 standard. FA and OSP were both purchased from South Korea. The FA used was formed during the combustion of coal in thermal power plants and was a low-calcium fly ash. To ensure that the organic matter and microorganisms in the oyster shell powder were completely removed, the oyster shell powder used in this paper was obtained by the manufacturer according to the ASTM-F1736 standard [12]. The discarded oyster shells were calcined at medium temperature (500 °C) and then crushed to obtain oyster shell powder with a particle size of about 27 microns. Figure 1a shows the particle size distributions of FA and OSP, and Figure 1b shows the cumulative curves of FA and OSP, with average particle sizes of 8.64 μm and 27.1 μm, respectively. Particle size is an important factor affecting the hydration kinetics of cementitious materials. Finer particles have a larger specific surface area, which facilitates their rapid dissolution during hydration and promotes the nucleation and growth of hydration products. Figure 2 shows the XRD patterns of OSP (a), FA (b), and OPC (c). Calcium carbonate is one of the main components of OSP, and the crystalline phases in FA are mainly mullite, quartz, and hematite. Table 1 shows the specific chemical compositions of OPC, FA, and OSP as determined via X-ray fluorescence (XRF).

2.2. Mixture Preparation and Mix Ratio Design

In this study, four groups of samples were prepared with different proportions of FA and OSP replacing OPC at a water/binder ratio of 0.5 (w/b = 0.5): the control group, REF without FA and OSP; the experimental group, FA20, with 20% FA replacing OPC; the experimental group, OSP20, with 20% OSP replacing OPC; and the experimental group, FA15OSP5, with 15% FA and 5% OSP replacing OPC. The mix used in this study was determined through preliminary testing, optimizing both early and late strength. This mix was more conducive to verifying the synergistic effects of the new three-component cementitious material and achieving sustainable material utilization. Due to limited experimental conditions and funding, only one ternary ratio was used in this study. Future research will need to conduct more experiments to demonstrate the synergistic effect. The effect of FA could be explained by comparing FA20 with REF, and the effect of OSP could be explained by comparing OSP20 with REF. The difference between three-mixed concrete and two-mixed concrete could be explained by comparing FA20 and OSP20 with FA15OSP5. Two types of samples, mortar and paste, were cast in the experiment.
The mortar was used for macro tests, such as UPV, compressive strength, and surface resistivity tests. The ratio of sand to cementitious material in the mortar was 2.5. The paste was used for microscopic experiments such as XRD, TGA, and FT-IR. The material proportions are shown in Table 2, Table 3, Table 4, Table 5 and Table 6.
In this study, the preparation of the pastes complied with the standard ASTM C305-20 [26]. The mixture was stirred using a Hobart-type stirrer at low speed for one minute and then at high speed for two minutes before being placed into a 50 × 50 × 50 mm cubic mold and a 40 × 40 × 160 mm cuboid mold. The mold was subsequently tapped to remove any air pockets from the mixture and sealed with a polyethylene sheet. The samples were sealed and cured at 20 °C for 24 h. Subsequently, the samples were demolded, sealed with polyethylene sheets, and stored at 20 °C until the experiment commenced.

2.3. Test Method

2.3.1. Mechanical Properties

In building structures, the basic property of concrete is its compressive strength. Therefore, mechanical property testing is crucial in concrete design. The mechanical properties were tested according to ASTM-C109/C109M_21 [27], and 50 × 50 × 50 mm cubic mortar samples were used and tested at 1, 3, 7, and 28 days. The results were the average of three tests.

2.3.2. UPV

The UPV values of the rectangular mortar samples at 1, 3, 7, and 28 days were tested via a portable nondestructive digital indicator. The samples were sealed and stored at 20 °C before testing. During the test, each sample was measured three times. The results were averaged. The test process complied with the ASTM C597 standard [28].

2.3.3. Surface Resistivity

The surface resistivity test is a low-cost, time-saving, nondestructive testing method that can predict the strength properties of samples. In accordance with the RILEM TC 154-EMC method [29], the mortar samples were produced with a φ100 × 200 mm mold. After 1, 3, 7, and 28 days of sealing and curing, the surface resistivity of the mortar samples was measured via a Resipod surface resistivity meter. The surface resistivity of each group of samples was measured three times, and the results were averaged.

2.3.4. Heat of Hydration

In this study, a constant temperature calorimeter was used to measure the hydration heat of the mixture. The laboratory room temperature was maintained at 20 °C, and the experimental temperature was 20 °C. The experimental materials were pretreated at 20 °C to reduce the impact of temperature differences on the experimental data. In accordance with the methods of Lin et al. [30], the materials and water were weighed, poured into an ampoule, and stirred. After sealing, the ampoule was placed in the instrument, and the time was set to 168 h.

2.3.5. Microscopic Analysis

A small amount of cement paste sample was placed in the center of an agate mortar, and an appropriate amount of isopropanol was added for grinding. After grinding, the samples were soaked in isopropanol for one week to prevent cement hydration. The suspension was subsequently filtered and dried under vacuum for testing.
XRD was performed using a diffractometer (X’Pert-Pro MPD, Malvern Panalytical B.V., Lelyweg, The Netherlands) with a scan range from 5° to 80° (2θ). The 1-day and 28-day samples were analyzed to determine the crystalline phase [31].
The mass of the sample required for conducting the TGA experiment was 30 mg. In this study, a thermal analysis system was used to measure the TGA data of the concrete powder in a nitrogen atmosphere, with the temperature increasing from 20 °C to 1000 °C at a rate of 10 °C per minute [32].
The spectral range of the FT-IR was 500~4000 cm−1. The infrared spectra of the mixture were recorded after 1 day and 28 days of hydration [33].

2.3.6. Life Cycle Assessment

The C O 2 emissions of one cubic meter of sample were calculated based on the 28-d compressive strength and impact factors. Moreover, the entire life cycle of concrete could be divided into three main stages: raw material production, transportation, and construction. The impact of the whole life cycle on G W P , E P , O D P , A P , A D , a n d   P O C P was calculated based on the impact of environmental factors on G W P , E P , O D P , A P , A D , a n d   P O C P . Life cycle assessment could promote the sustainable development of enterprises and enhance their socioeconomic performance.
The test methods and analysis methods are summarized in Table 7. In general, the experimental part of this paper covers macro- and micro-performance, and the sustainable analysis part considers multiple factors. We propose that multiscale experimental analysis and multiangle sustainable analysis can reveal the differences and connections between FA–OSP–cement ternary cement and binary cement, thereby promoting carbon neutrality in the concrete industry.

3. Experimental Results

3.1. Compressive Strength

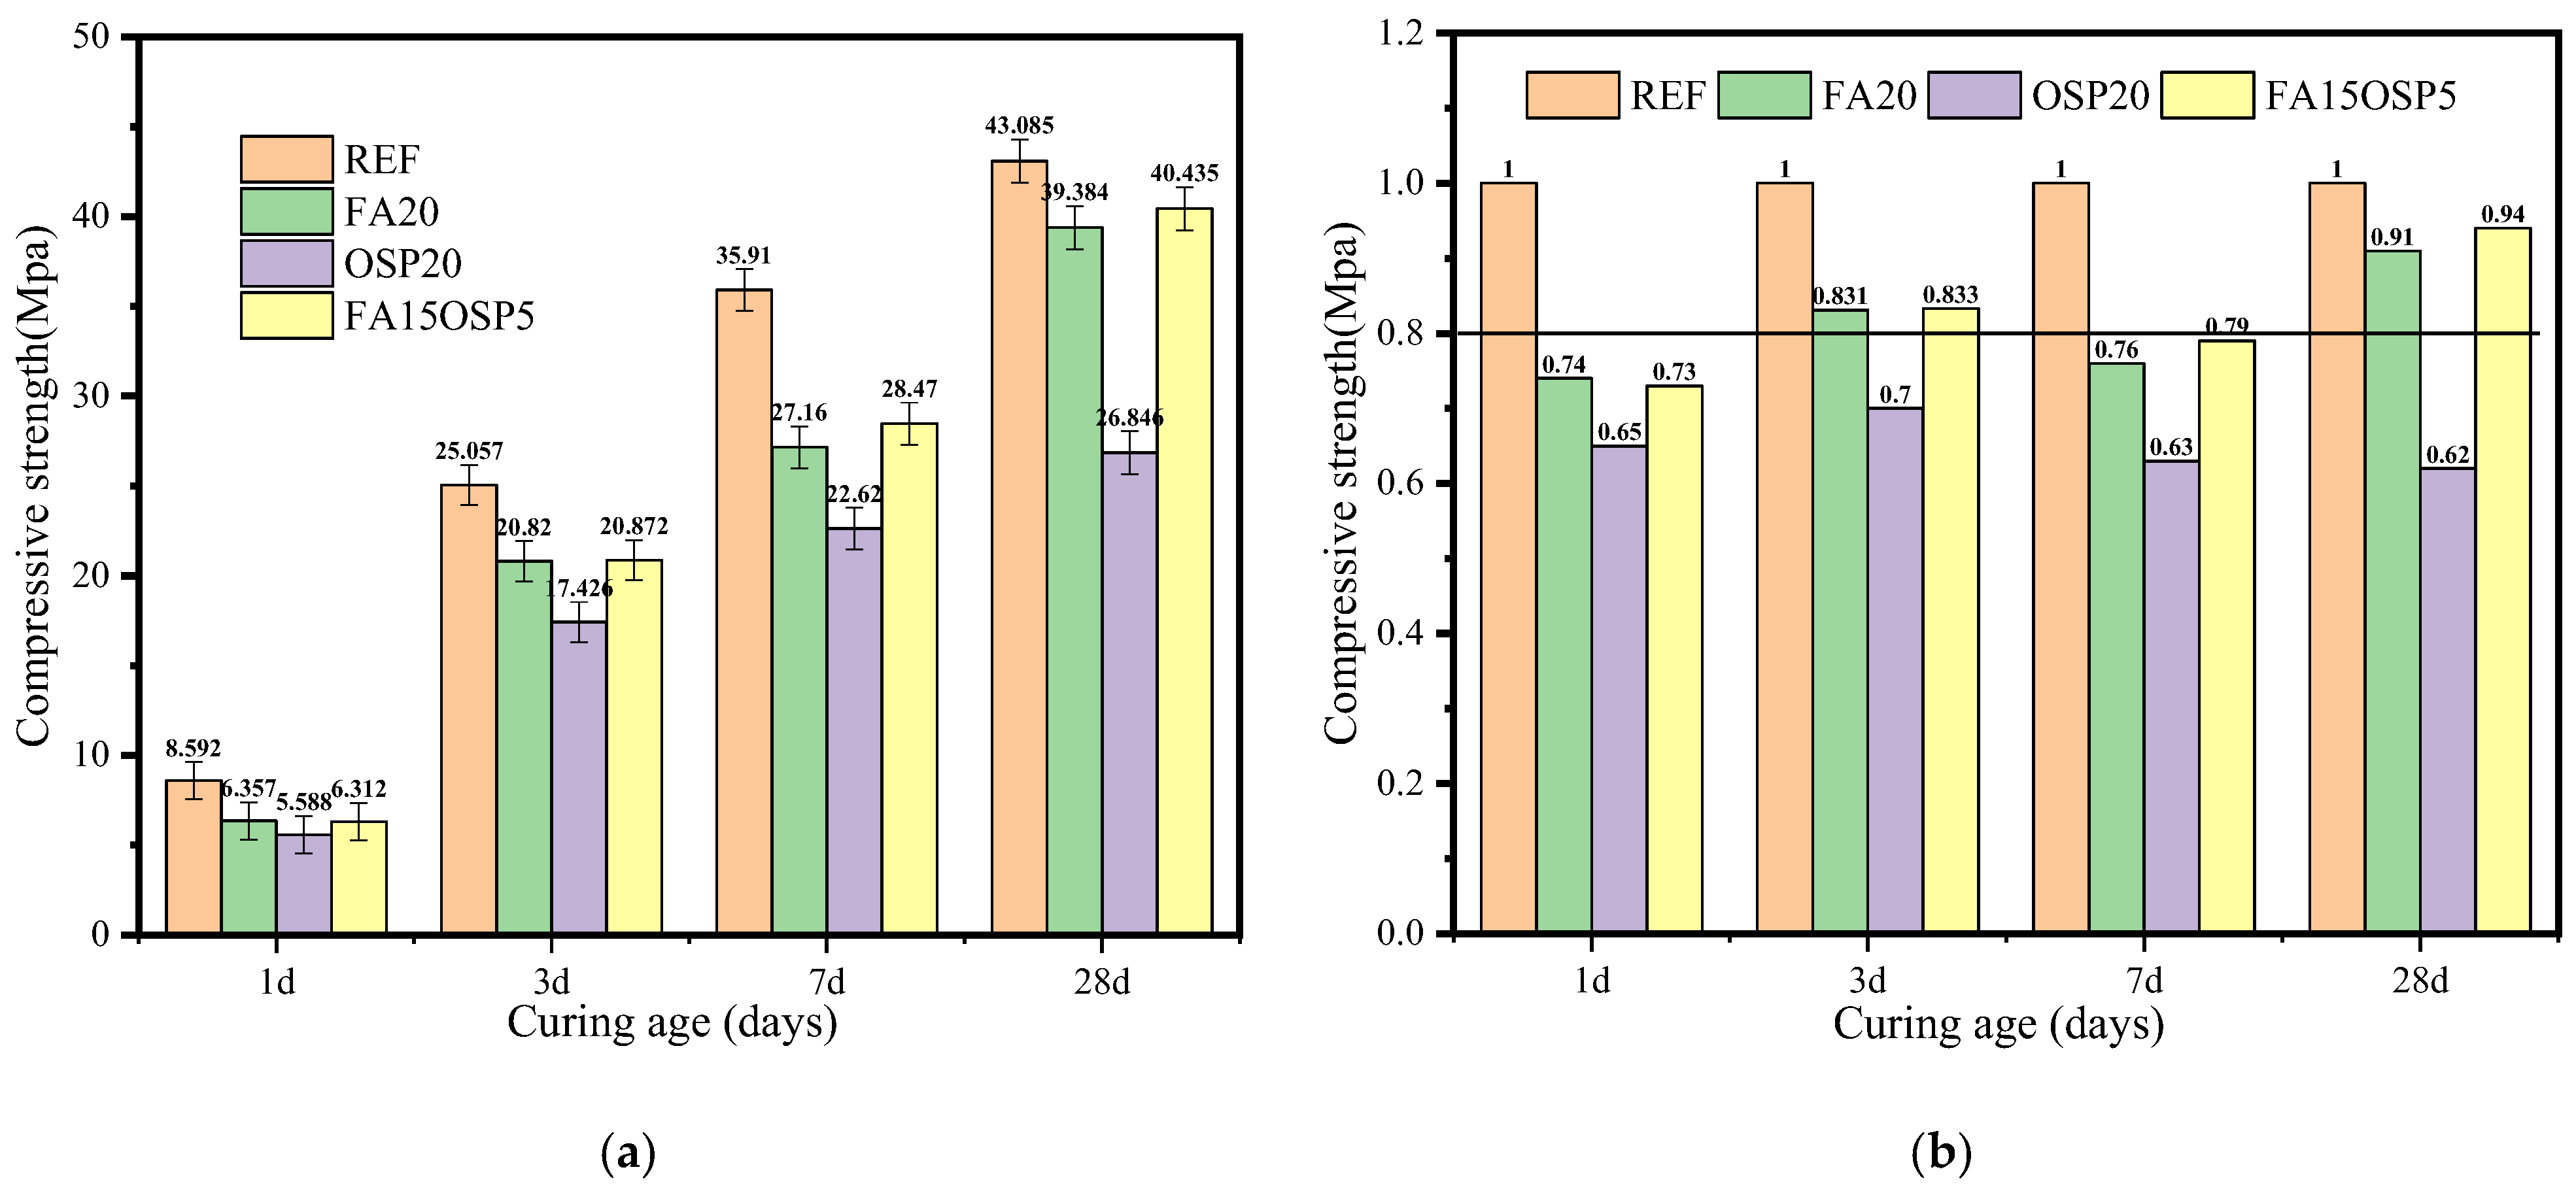
Figure 3a shows the compressive strength at each age of each group. Figure 3b shows the relative proportion of compressive strength, where the strength of the standard sample at each age is set to 100%. The horizontal line in Figure 3b corresponds to the 80% strength of the control group. Figure 3b shows that the strengths of the corresponding OSP20 samples in the experiments conducted at 1 d, 3 d, 7 d, and 28 d are 65%, 70%, 63%, and 62% of those of the control group, respectively. Compared with FA, OSP has very weak chemical reactivity. Adding OSP has two main effects: a nucleation effect and a dilution effect [34,35]. The nucleation effect means that hydration products can form on the surface of OSP particles, thereby accelerating the hydration of the cement. The dilution effect means that after OSP replaces OPC, the cement content in the mixture decreases, reducing the quantity of hydration products produced and, consequently, the strength. The strength of the OSP20 samples is caused by the combined effects of nucleation and dilution. The nucleation effect is obvious in the early stage (1 d, 3 d, and 7 d), and the dilution effect is obvious in the later stage (28 d). At 28 days, the relative strength of the OSP20 samples is the lowest of all relative strengths.
Like OSP, the strength of the FA20 samples is also lower than that of the standard samples at 1, 3, and 7 days. This is mainly due to the dilution effect of FA. After 28 days of sealing and curing, the strength of the FA20 samples reaches 91% of the strength of the standard samples. This occurs because the pozzolanic reaction of FA fills the pores with the generated reaction products, promoting the development of compressive strength [36].
In general, at different ages, the FA15OSP5 sample is lower than that of the REF group, but the strength of the FA15OSP5 group is higher than that of the FA20 and OSP20 groups. This is because there is a synergistic effect between FA and OSP, which generates additional hydration products and promotes the development of strength.

3.2. Ultrasonic Pulse Velocity

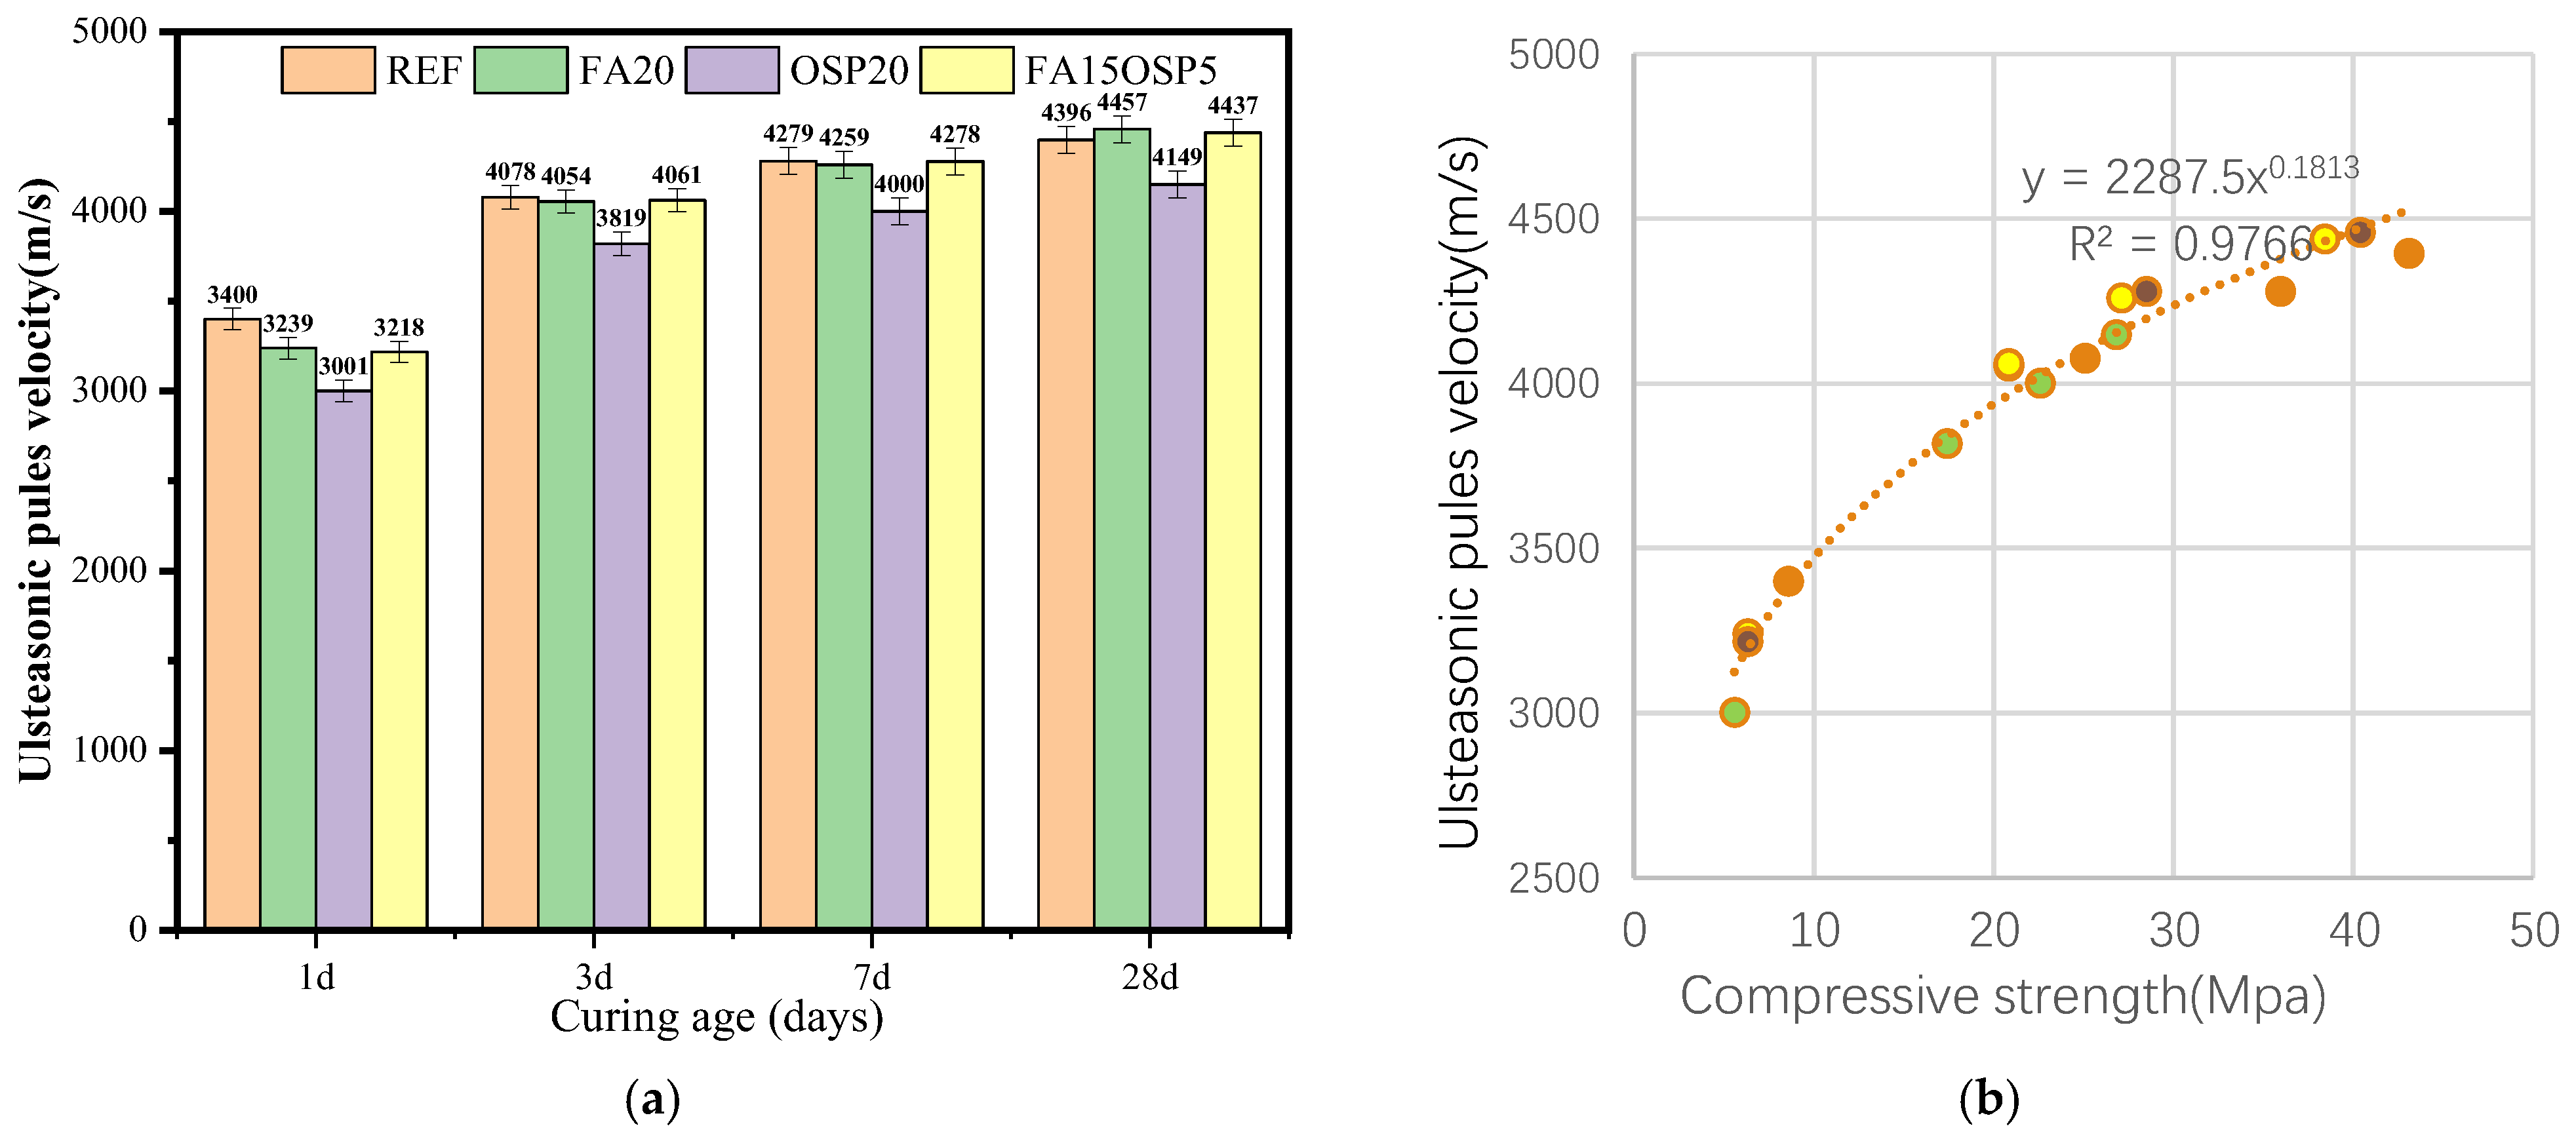
Many factors affect UPVs, such as the water/cement ratio, cement type, and cementitious materials used [37]. This study analyzed the effects of FA and OSP on UPV when used alone or in combination. The UPV results are shown in Figure 4a. In general, the trends of the UPV measurements are similar to those of the strength measurements. The UPVs of all the mixtures gradually increased with increasing curing time. In the early stage of hydration development, the standard sample had the highest UPV. In the later stage of hydration development, the pozzolanic reaction of FA refined the internal voids and improved the UPV of the mixtures. The relationship between the UPV and intensity is shown in Figure 4b. For all the samples of different ages, the UPV can be expressed as a power function of strength. The calculation results show that the power function R2 value is 0.9766. At the same time, the root mean square error (RMSE) of the UPV, calculated according to Figure 4, is 70.45 m/s, with a small deviation and good fitting accuracy. From this perspective, UPVs can be used as a nondestructive and efficient test method for determining compressive strength [38].

3.3. Surface Electrical Resistivity

Research has shown that the surface resistivity of concrete can be used to assess the durability of its structure [39]. The resistivity of concrete is influenced by its water–binder ratio, porosity, and material properties.
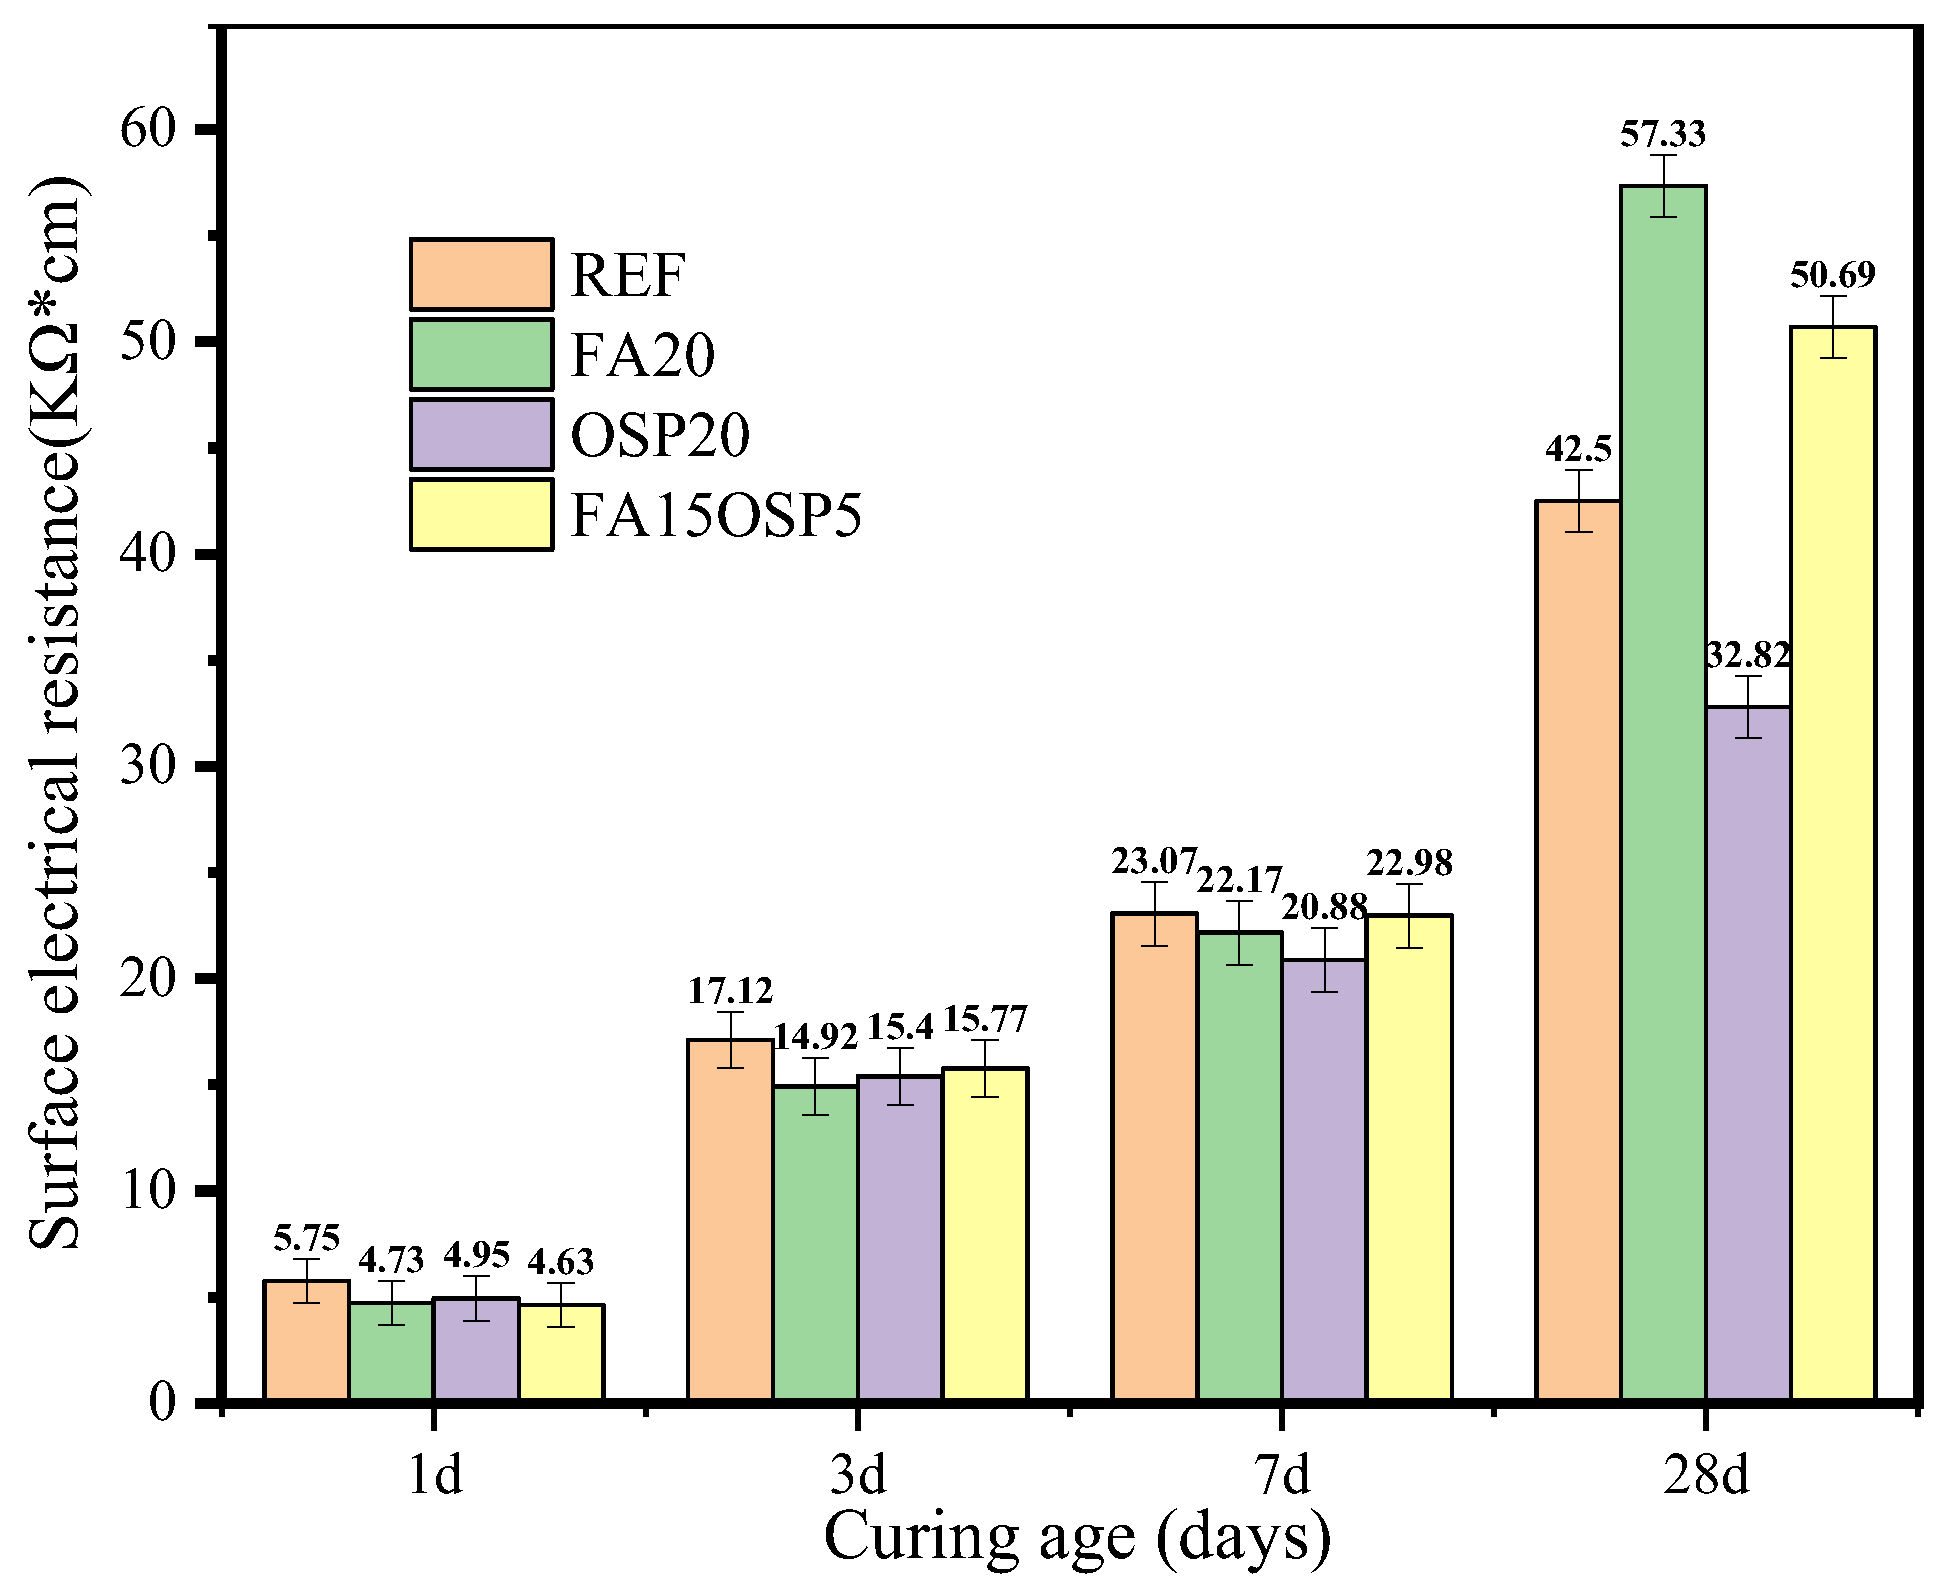
Figure 5 shows the test results of the surface resistivity. As shown in the figure, at 1 d, 3 d, and 7 d, the resistivity of the REF group is the highest. This is because at 1 d, 3 d, and 7 d, the reactions of both OSP and FA are not obvious. Compared with those of the REF group, the moisture contents of the other three samples are greater, and the resistivities are lower [40]. At 28 days of age, the resistivities of the FA20 and FA15OSP5 groups are greater than those of the REF group. This may be because the FA in the FA20 and FA15OSP5 groups undergoes a pozzolanic reaction in the late stage of hydration, which refines the pores and increases the resistivity of the samples [36].
Figure 6a shows that at the initial stage of hydration (1, 3, and 7 days), the resistivities and compressive strengths of all samples show a power function relationship, with an R2 of 0.9298, indicating that compressive strength and surface resistivity are strongly correlated [41]. Further verification via the root mean square error (RMSE) shows that the calculated result is 1.9344 MPa, indicating that the deviation between the fitting curve and the actual strength data is small and the fitting accuracy is high. However, if the resistivity at 28 days and the strength at 28 days are included, the R2 value of the power function drops to 0.8486, as shown in Figure 6b, while the RMSE increases to 9.5107 MPa, indicating that the model prediction accuracy is significantly reduced. The decreased coefficient of determination is mainly due to the pozzolanic reaction of FA, which can promote strength, refine pores, and increase resistivity. The increased resistivity is more apparent than the increased strength, indicating a certain correlation between strength and resistivity for the samples doped with FA. However, this correlation gradually decreases with increasing hydration. Combining the results of Figure 3 and Figure 6, the pozzolanic reaction improves the resistivity and compressive strength, but has a greater impact on the resistivity.

3.4. Heat of Hydration

Past studies have shown that the hydration of OPC constitutes an exothermic reaction, and the release of hydration heat can be divided into five stages: the initial stage, induction stage, acceleration stage, deceleration stage, and slow reaction stage [42].
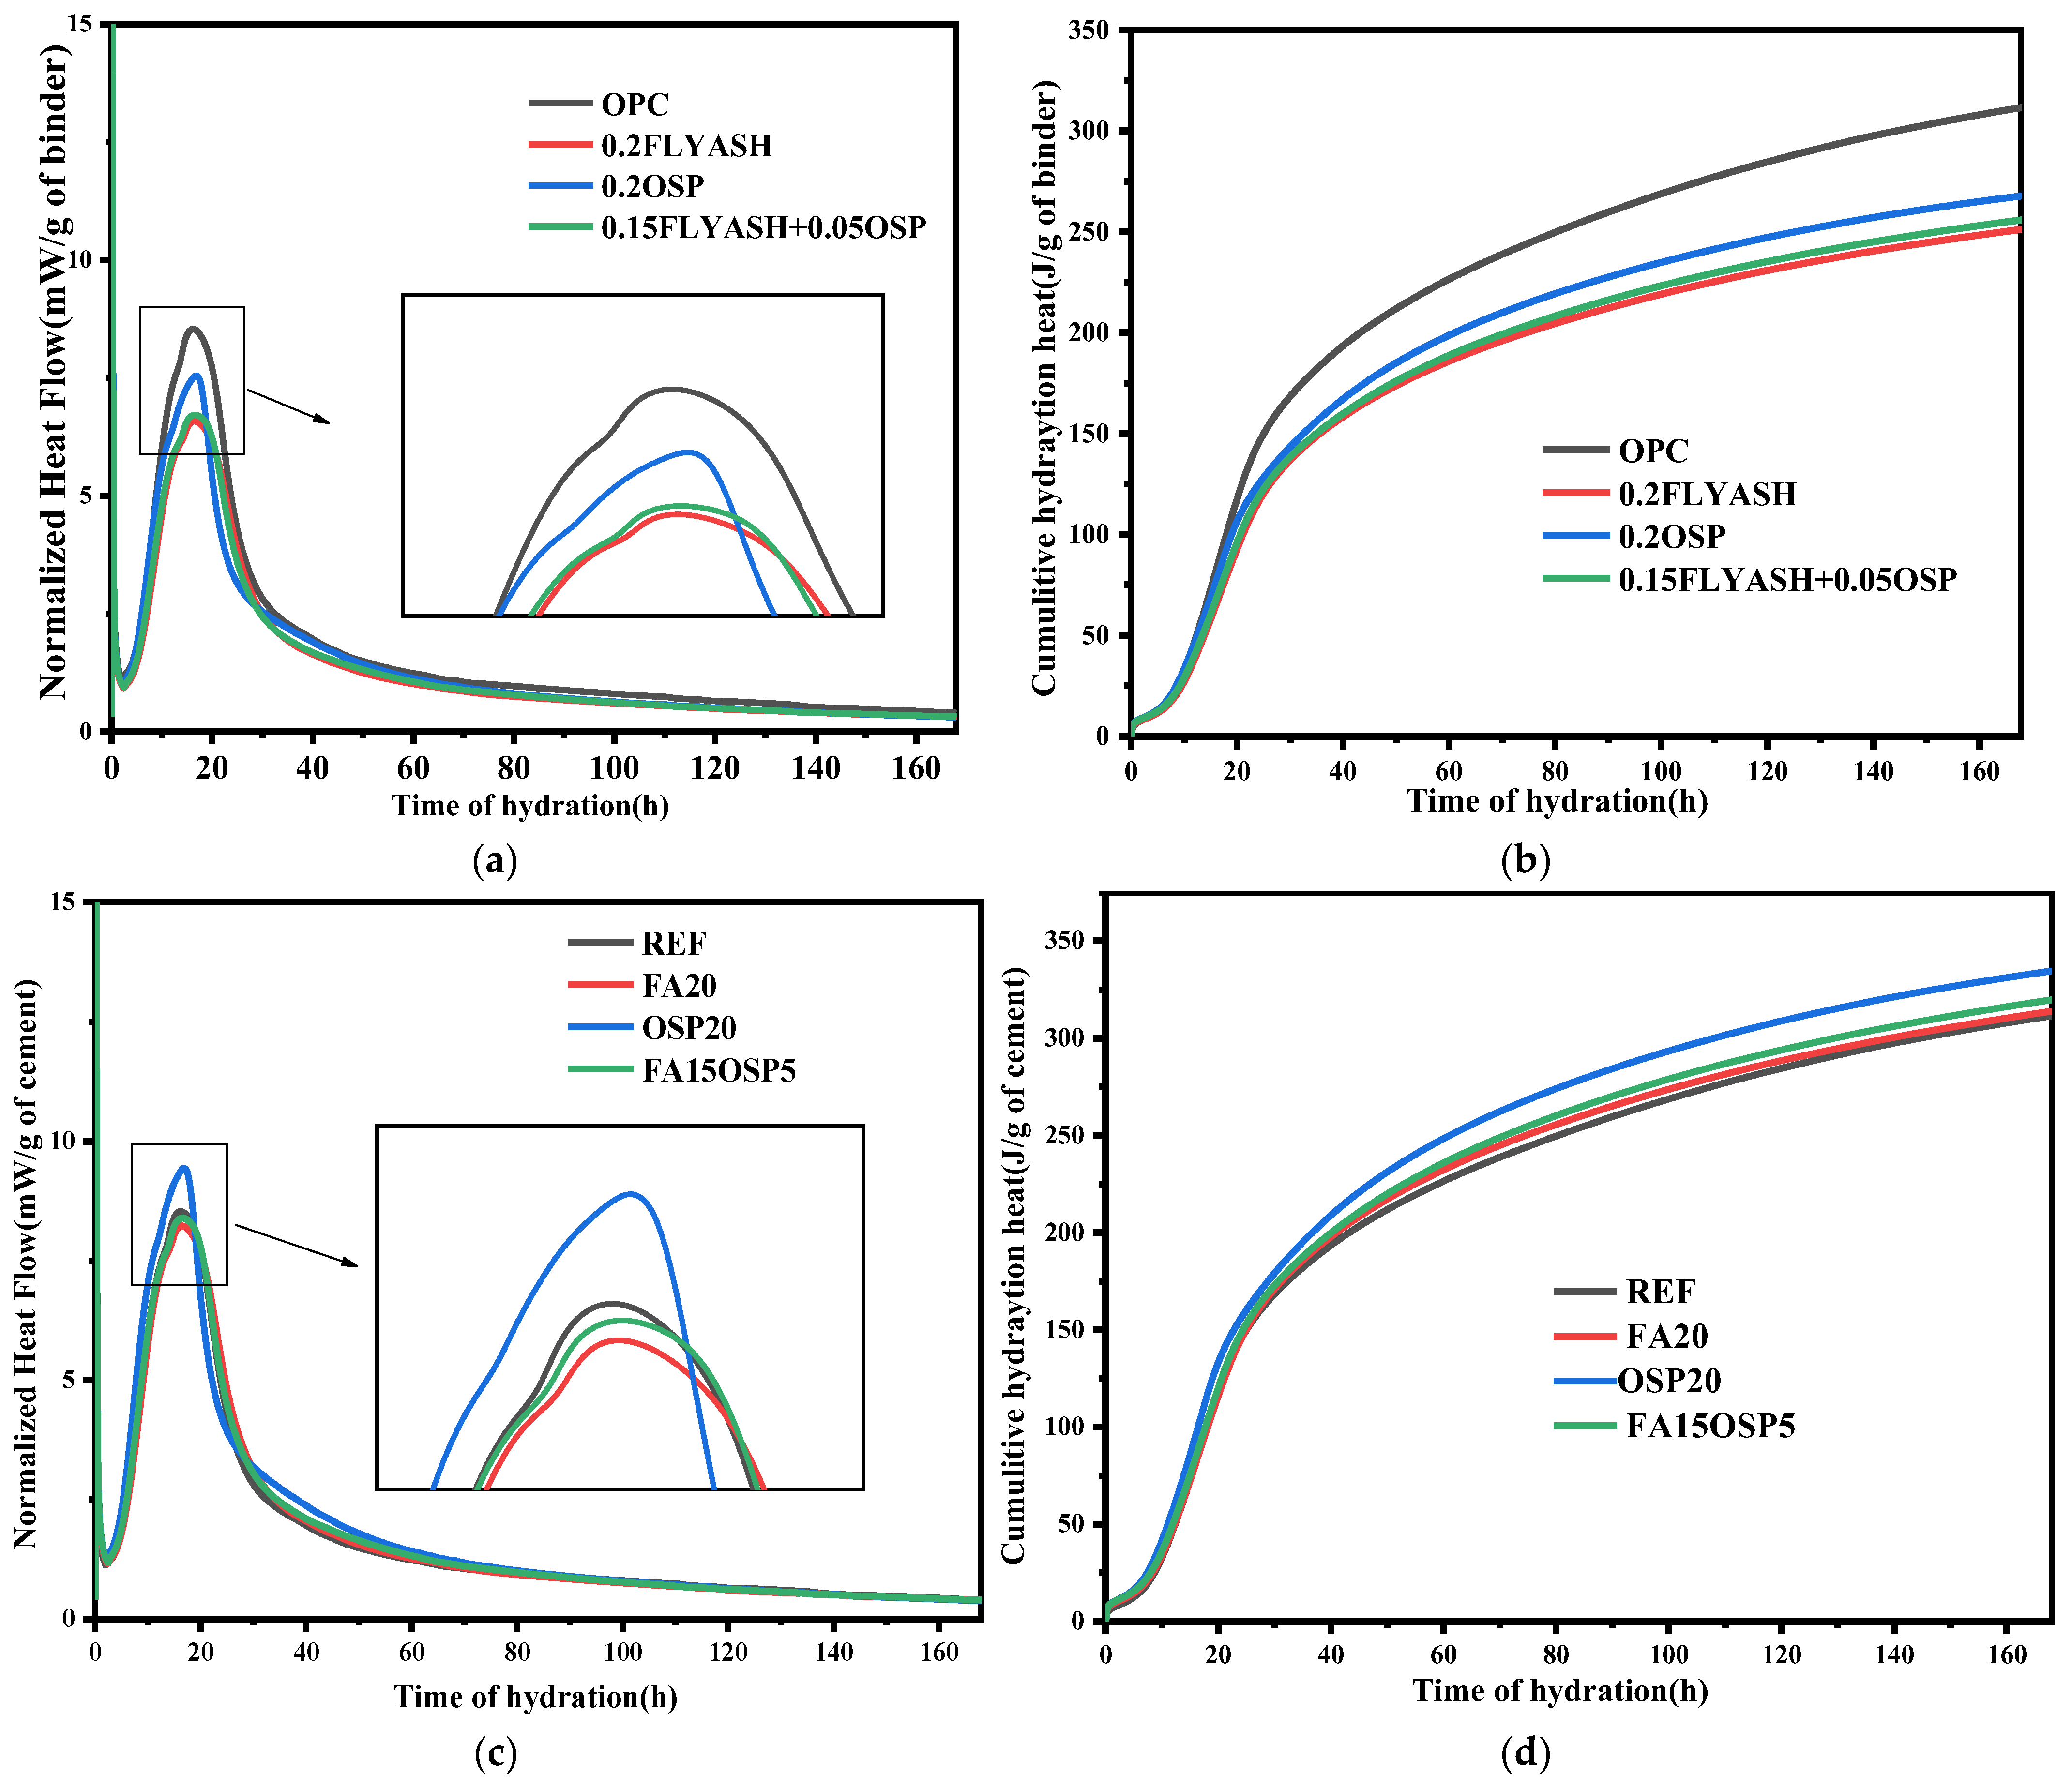
Figure 7a shows the hydration heat rate curve of the mixture. During the induction period, the heat flows induced by FA and OSP were lower than those of the REF group. This may be due to the decrease in the calcium ion concentration caused by the reduced cement content. At 16 h, the hydration heat peaked along with the hydration of C3S. The order of heat flux peak intensity is REF > OSP20 > FA15OSP5 > FA20. The peak strengths of the remaining samples were lower than those of the REF, mainly because of the dilution effect, in which the C3S content decreased. In addition, OSP has a nucleation effect, which accelerates the reaction of C3S; hence, the exothermic peak intensity of the OSP20 sample ranks second. The nucleation effect of FA is smaller than that of OSP, and the exothermic peak of the sample is the lowest. FA15OSP5 is between OSP20 and FA20, but it is closer to FA20. After approximately 2 days, the hydration heat enters the diffusion control period, and the hydration heat release rate of each sample tends to be stable. Figure 7a also shows that the hydration peak of C3S in the FA20 group and FA15OSP5 group occurred earlier than that in the REF group because the particle size of FA is smaller and has a filling effect.
Figure 7b shows the cumulative heat release rate curve of the mixture. During the induction period (from the start of stirring to approximately 3 h), the cumulative heat of hydration increases slowly. After that, it enters the acceleration period, and the rate of increase in the cumulative heat of hydration accelerates significantly. After approximately 48 h, the hydration reaction enters the diffusion period, and the rate of increase in the hydration heat slows. At 168 h, the order of the cumulative heat of hydration is also REF > OSP20 > FA15OSP5 > FA20, and the overall trend is consistent with that shown in Figure 7a.
Figure 7c shows the results of the hydration heat release rate per gram of cement. As hydration progresses, the order of peak intensity is OSP20 > REF > FA15OSP5 > FA20. The peak intensity of the OSP20 group is greater than that of the REF group because the nucleation of OSP accelerates the reaction of C3S and accelerates hydration. The peak intensity of the FA20 group is lower than that of the REF group because FA delays the initial hydration of the cement. The peak intensity of the FA15OSP5 group is between that of the REF group and the FA20 group, but it is closer to the FA20 group.
Figure 7d shows the cumulative hydration heat per gram of cement. As hydration progresses, the order of peak intensity is OSP20 > FA15OSP5 > FA20 > REF. This occurs because adding FA and OSP provides additional nucleation sites for hydration per gram of cement, and both play a role in promoting hydration. However, given the nature of FA itself, it inhibits cement hydration in the early stage, and this promotional effect is largely offset by its inhibitory effect. Therefore, Figure 7d shows a cumulative heat curve similar to that for the REF group.

3.5. XRD

The 1-d and 28-d XRD spectra of the mixed paste are shown in Figure 8. The main crystalline phases detected include ettringite (E), calcium hydroxide (CH, Ca(OH)2), calcium carbonate (CĈ, CaCO3), quartz (Qtz), and monocarbonate (Mc) [43].
Figure 8 shows that at 1 day of curing, obvious peaks for ettringite and calcium hydroxide can be observed in all samples, which shows that the early hydration reaction of the cement is ongoing. The reference sample (REF) shows the strongest CH peak, whereas the CH peak is significantly weaker in the samples with mineral admixtures (such as FA20, OSP, OSP20, and their composite samples FA15OSP5). This initial reduction in the CH peak is due mainly to the dilution effect; that is, the initial hydratable clinker content is reduced due to the replacement of part of the cement by low-reactivity or inert mineral admixtures.
After 28 days of curing, the mineral composition of each system changed significantly. First, the CH peak intensity in the FA20 and FA15OSP5 samples was significantly lower than that in the REF, which was the result of a combination of dilution and pozzolanic reactions. Second, the peak intensity of calcium carbonate (CĈ) was significantly greater in the samples containing OSP, an outcome assumed to be related to the high CaCO3 content in the OSP. Finally, monocarbonate aluminate (Mc) was obviously generated in the composite blending system, especially in FA15OSP5, indicating that the aluminum source reacted with carbonate to form a stable hydration product.
In general, the reduction in CH in the early stage is due mainly to the dilution effect; as the curing age increases, the FA in the hydration reaction promotes the formation of new hydration products and improves the microstructure. Among them, the mineral transformation of the FA15OSP5 system is the most obvious outcome, showing a good synergistic effect between FA and OSP.

3.6. FT-IR

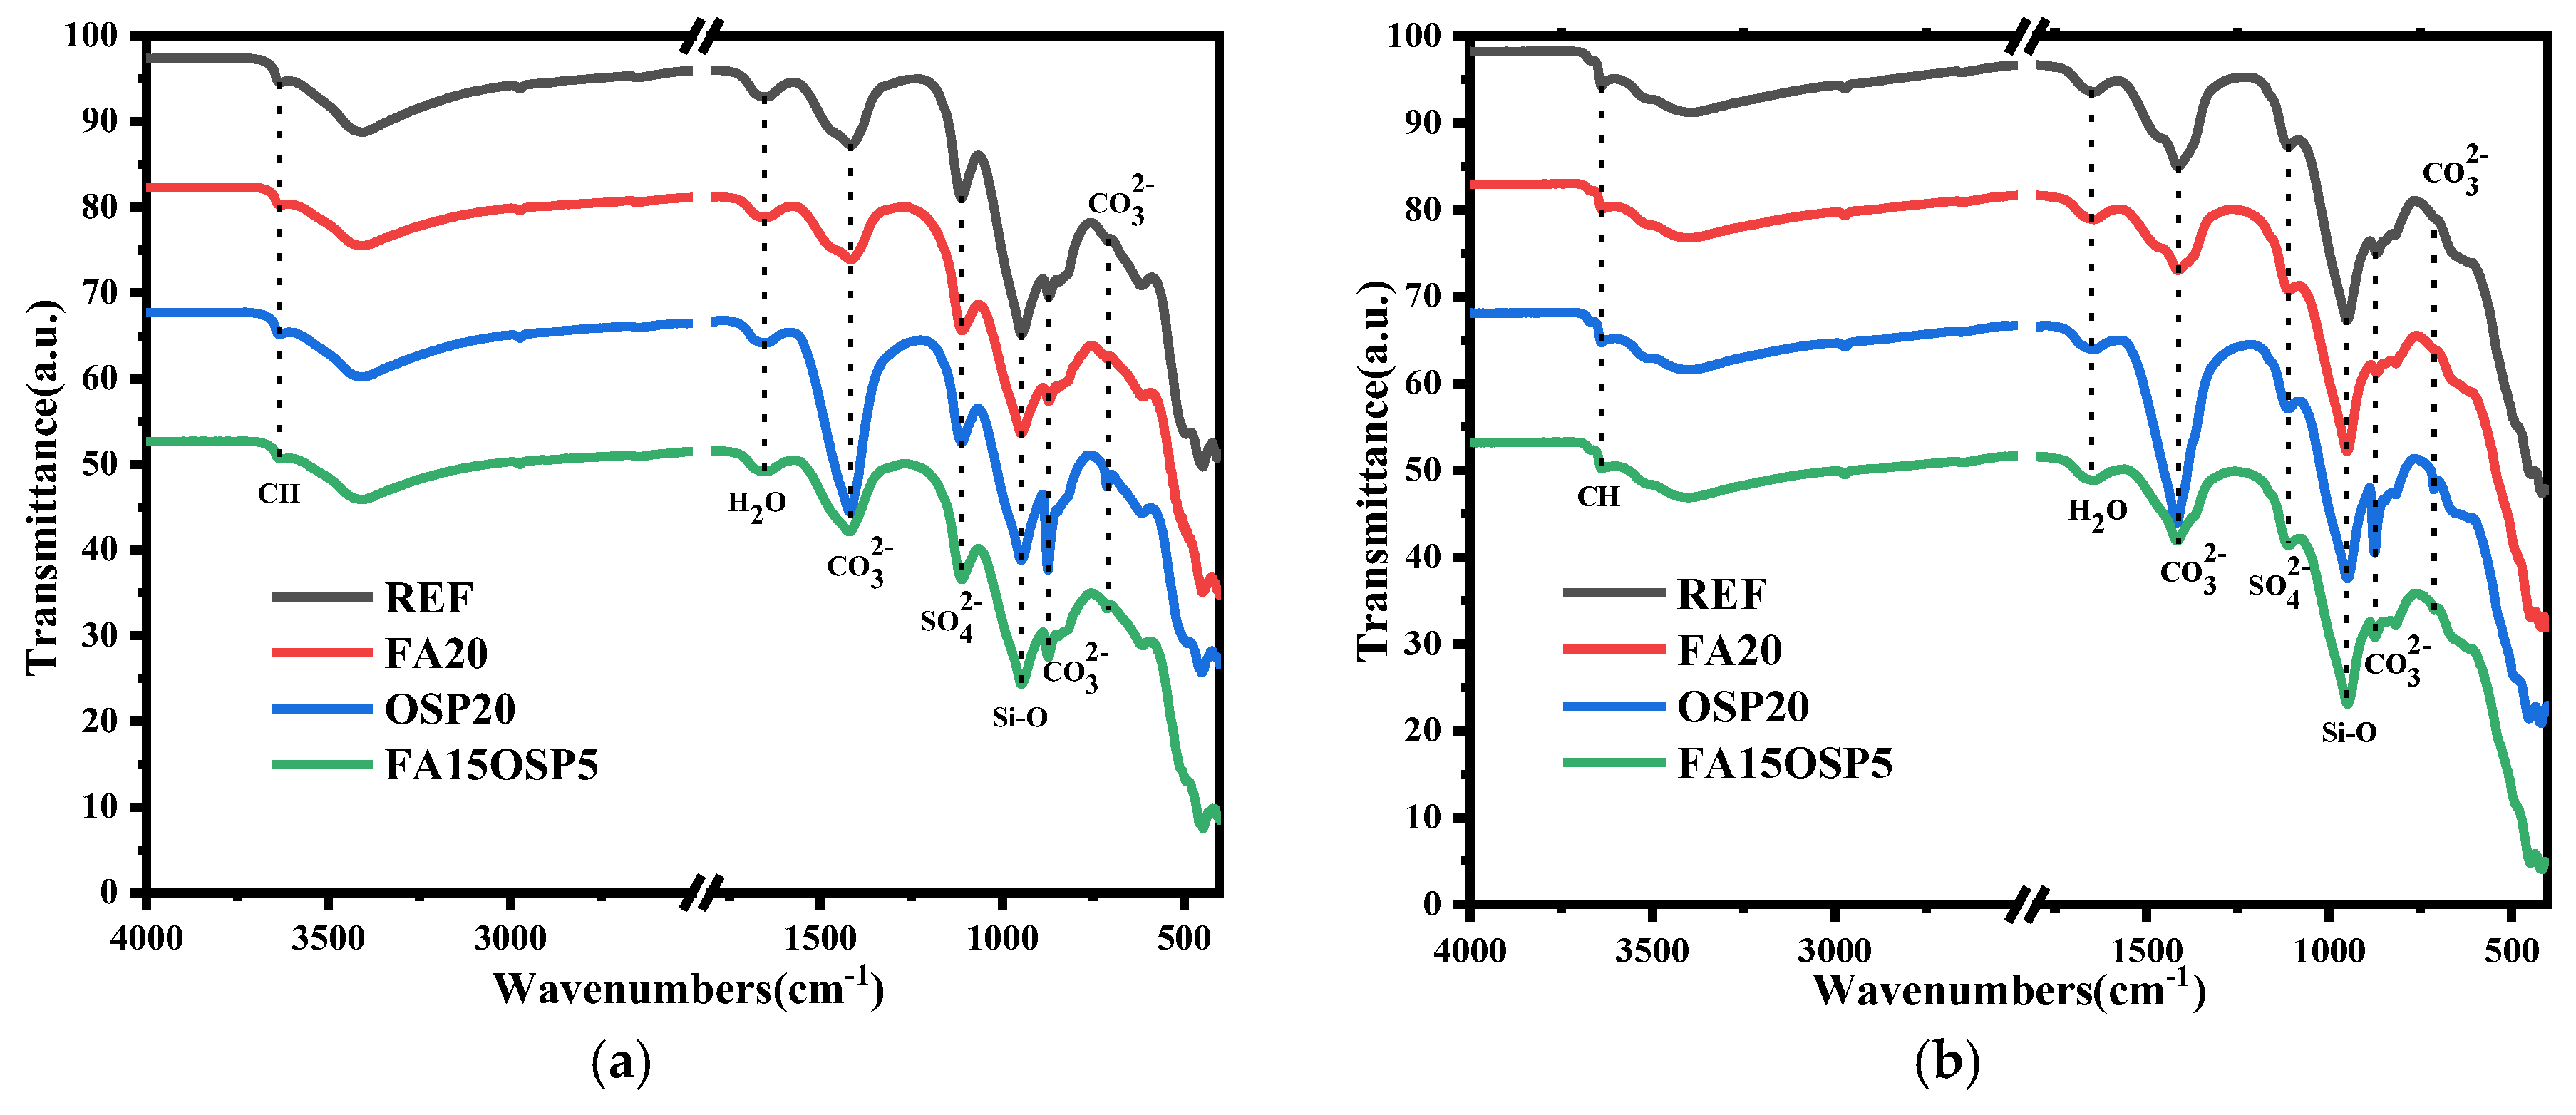
Figure 9a,b show the FT-IR spectra of the mixed pastes after 1 d and 28 d. The infrared spectrum band ranges from 500 to 4000 cm−1. The peak at 3638 cm−1 is the absorption peak caused by the stretching vibration of the O-H bond in CH. At 1417 cm−1, an absorption peak of C O 3 2 caused by the asymmetric stretching vibration of the C-O bond [44], and the out-of-plane bending vibration appears, and the absorption peak increases significantly upon substituting OSP. Moreover, the sharp absorption peaks at 876 cm−1 and 713 cm−1 are formed by the bending vibration of the C–O bond in C O 3 2 , which also increases significantly with the substitution of OSP. The peak at 950 cm−1 corresponds to the peak of CSH. From 1 day to 28 days, the peak CSH becomes more obvious, corresponding to increased intensity [44].

3.7. TGA/DTG

Figure 10a,b show the TGA–DTG curves of the four groups of samples after 1 day and 28 days of curing, respectively, with the temperature increasing from 20 °C to 1000 °C.
The temperature corresponding to the first absorption peak is approximately 100 °C because of the thermal decomposition of ettringite (AFt) and C-S-H. Figure 10a,b show that the absorption peak generated via the thermal decomposition of the REF group is significantly larger than the absorption peak of the thermal decomposition of the other three groups, and the thermal decomposition absorption peak of the OSP20 group is larger than the absorption peak of the FA20 group. This is mainly because adding OSP or FA reduces the cement content, thus creating a dilution effect. Therefore, it is manifested in the figure as a decrease in the absorption peak of thermal decomposition. The order of peak values is as follows: control group > blended group; this is also consistent with the REF group having the highest compressive strength. However, after one day of hydration, since OSP can provide additional nucleation sites to promote hydration, whereas FA hardly reacts in the initial stage of hydration, the hydration product of the OSP20 group at 1 d is larger than that of the FA20 group, which is shown in Figure 10, as the thermal decomposition peak of the OSP20 group is larger than that of the FA20 group. In the later stage of hydration (28 days), FA participates in the pozzolanic reaction and generates more C-S-H gel. Therefore, the thermal decomposition peak of the FA20 group is greater than that of the OSP20 group, and the corresponding compressive strength is also greater than that of the OSP20 group.
The temperature corresponding to the second absorption peak is between 400 and 500 degrees, which is the absorption peak of CH thermal decomposition. The order of peak values is REF > OSP20 > FA20 > FA15OSP5.
The third peak is roughly in the range of 550 to 850 degrees, corresponding to the decomposition of calcium carbonate. From small to large, the order of values is OSP20 > FA15OSP5 > REF > FA20. The OPC used contained a small amount of calcium carbonate; hence, the REF has a decomposition peak of calcium carbonate. For the FA20 sample, because the amount of cement used is reduced, the amount of calcium carbonate contained is also reduced accordingly. For the OSP sample, because OSP itself contains calcium carbonate, the intensity of the calcium carbonate decomposition peak is the highest. FA15OSP5 is between REF and OSP20.
In addition, the percentage of chemically bound water and CH in the samples after FA and OSP substitution can be calculated according to Equations (1) and (2) [45]:
C H = w 380 w 480 w 480 × 74 18 × 100 %
w H = w 40 w 480 w 480 × 100 %
where w H is chemically bound water, C H is calcium hydroxide, and w 40 , w 380 , and w 480 are the masses of the test samples at 40 °C, 380 °C, and 480 °C, respectively.
Table 8 shows the chemically bound water content of each group of samples after the partial replacement of FA and OSP at 1 d and 28 d. Table 9 shows the CH content of each group of samples after the partial replacement of FA and OSP at 1 d and 28 d.
Table 8 and Table 9 show that when FA and OSP partially replace OPC, the chemically bound water and CH contents decrease. This is because the replacement of FA and OSP reduces the amount of cement used, while the amount of OPC involved in the hydration reaction also decreases. Moreover, there is a reduction in the chemically bound water and CH contents, and by comparing the three FA20, OSP20, and FA15OSP5 groups, it is found that the chemically bound water and CH contents of the group with added OSP20 are higher than those without OSP20. This occurs because adding OSP provides additional nucleation sites for cement hydration, which promotes cement hydration.
Figure 11 shows that there was a good power function relationship between chemically bound water and strength in the mixtures where FA and OSP partially replaced OPC, and the determination coefficient reached 0.891. The root mean square error (RMSE) of the compressive strength prediction was 5.4920 MPa, indicating that the model fit the experimental data well.

3.8. Life Cycle Assessment

The entire life cycle of concrete production can be divided into three main stages: production, transportation, and the use of raw materials. During this cycle, we calculate the impacts of G W P , E P , O D P , A P , A D   a n d   P O C P . The calculation equation is as follows [25,46]:
E m = i = 1 3 E i
where m represents the six environmental impacts of G W P , E P , O D P , A P , A D , a n d   P O C P and E m represents the total impact of raw materials on G W P , E P , O D P , A P , A D , a n d   P O C P throughout the life cycle. Moreover, i represents the three stages of the raw material production, transportation, and mortar mixing process, and E i represents the impact on G W P , E P , O D P , A P , A D , a n d   P O C P in the three stages.

3.8.1. Raw Materials

For raw materials, the calculation equation of GWP is as follows [25,46]:
E G W P 1 = r = 1 5 M r × e 1 G W P
Using a method such as Equation (4), the G W P , E P , O D P , A P , A D , a n d   P O C P generated during the raw material production stage can be calculated. Among them, E G W P 1 , E A D 1 , E O D P 1 , E A P 1 , E E P 1 , a n d   E P O C P 1 are the impacts of the raw material production stage on G W P , E P , O D P , A P , A D , a n d   P O C P , respectively. M r is the mass of material r per unit volume of the mixture in k g / m 3 , as shown in Table 4 in Section 2.2. e 1 G W P is the impact factor of raw materials on the GWP. The six environmental impact factors in this article are all derived from the Korean Database of Environmental Impact Specialization Values (LCI-DB) [47], and the environmental impact factors of the other raw materials are shown in Table A1. The units involved in the formula are all standard units.

3.8.2. Transportation Stage of Raw Materials

In this study, the transportation stage refers to the environmental impact of the transportation and processing of raw materials in the Republic of Korea, and diesel trucks are selected as the main method of transportation to ensure the accuracy of the LCA [48]. The environmental impact calculation equation is as follows [25,46]:
E G W P 2 = r = 1 5 M r × d r × t m
Using a method such as Equation (5), the G W P , E P , O D P , A P , A D , a n d   P O C P generated during the raw material transportation stage can be calculated. Among them, E G W P 2 , E A D 2 , E O D P 2 , E A P 2 , E E P 2 , a n d   E P O C P 2 represent the impact of the raw material transportation stage on G W P , E P , O D P , A P , A D , a n d   P O C P ; M r represents the mass of material r per unit volume of the mixture, where k g / m 3 ; and d r represents the transportation distance of the materials, in km, as shown in Table A2. The distances in Table A2 are based on typical transportation distances in the Republic of Korea. For example, oyster shells are typically sourced from coastal areas, yet Chuncheon is located inland, almost in the middle of the Republic of Korea. Therefore, a transportation distance of approximately 200 km from the coast to the inland area was assumed. Similar assumptions were made for the remaining distances. Other researchers applying the proposed method will need to adjust it based on their specific circumstances, making adjustments based on the actual situation. In the above equation, t m is the impact of transporting each kilogram of raw material within a 1-km range of G W P , E P , O D P , A P , A D , a n d   P O C P , as shown in Table A3.

3.8.3. Mixing Process of Mortar

The impact on the environment during the mixing process can be calculated using Equation (6) [25]:
E G W P 3 = P × e p
Using a method such as Equation (6), the G W P , E P , O D P , A P , A D , a n d   P O C P generated via the mortar mixing process can be calculated. Among them, E G W P 3 , E A D 3 , E O D P 3 , E A P 3 , E E P 3 , a n d   E P O C P 3 are the impact of the mixing process on G W P , E P , O D P , A P , A D , a n d   P O C P ; P is the electricity consumed during construction (kWh), the power of the mixer is 50 kW, the mixing time is 5 min, and e p is the impact of the unit electric energy on G W P , E P , O D P , A P , A D , a n d   P O C P . The impact factor e p of electric energy is shown in Table A4.

3.8.4. Impact of Unit Compressive Strength on the Environment

Through Equations (3)–(6), we can obtain the overall impact of the three stages of raw materials on G W P , E P , O D P , A P , A D , a n d   P O C P throughout the entire life cycle. The impact of the unit compressive strength on the environment can be calculated via Equations (7) and (8):
E G W P = E G W P 1 + E G W P 2 + E G W P 3
E G W P c s = E G W P c s f i
where E G W P c s is the impact of the unit compressive strength on the GWP, E G W P is the overall impact on the GWP throughout the entire life cycle, and c s f i is the compressive strength of day i , where i = 28 . By using similar methods to Equations (7) and (8), the other aspects ( E P , O D P , A P , A D , a n d   P O C P ) of sustainability can be estimated.

3.8.5. Results of the Sustainability Analysis

  • GWP
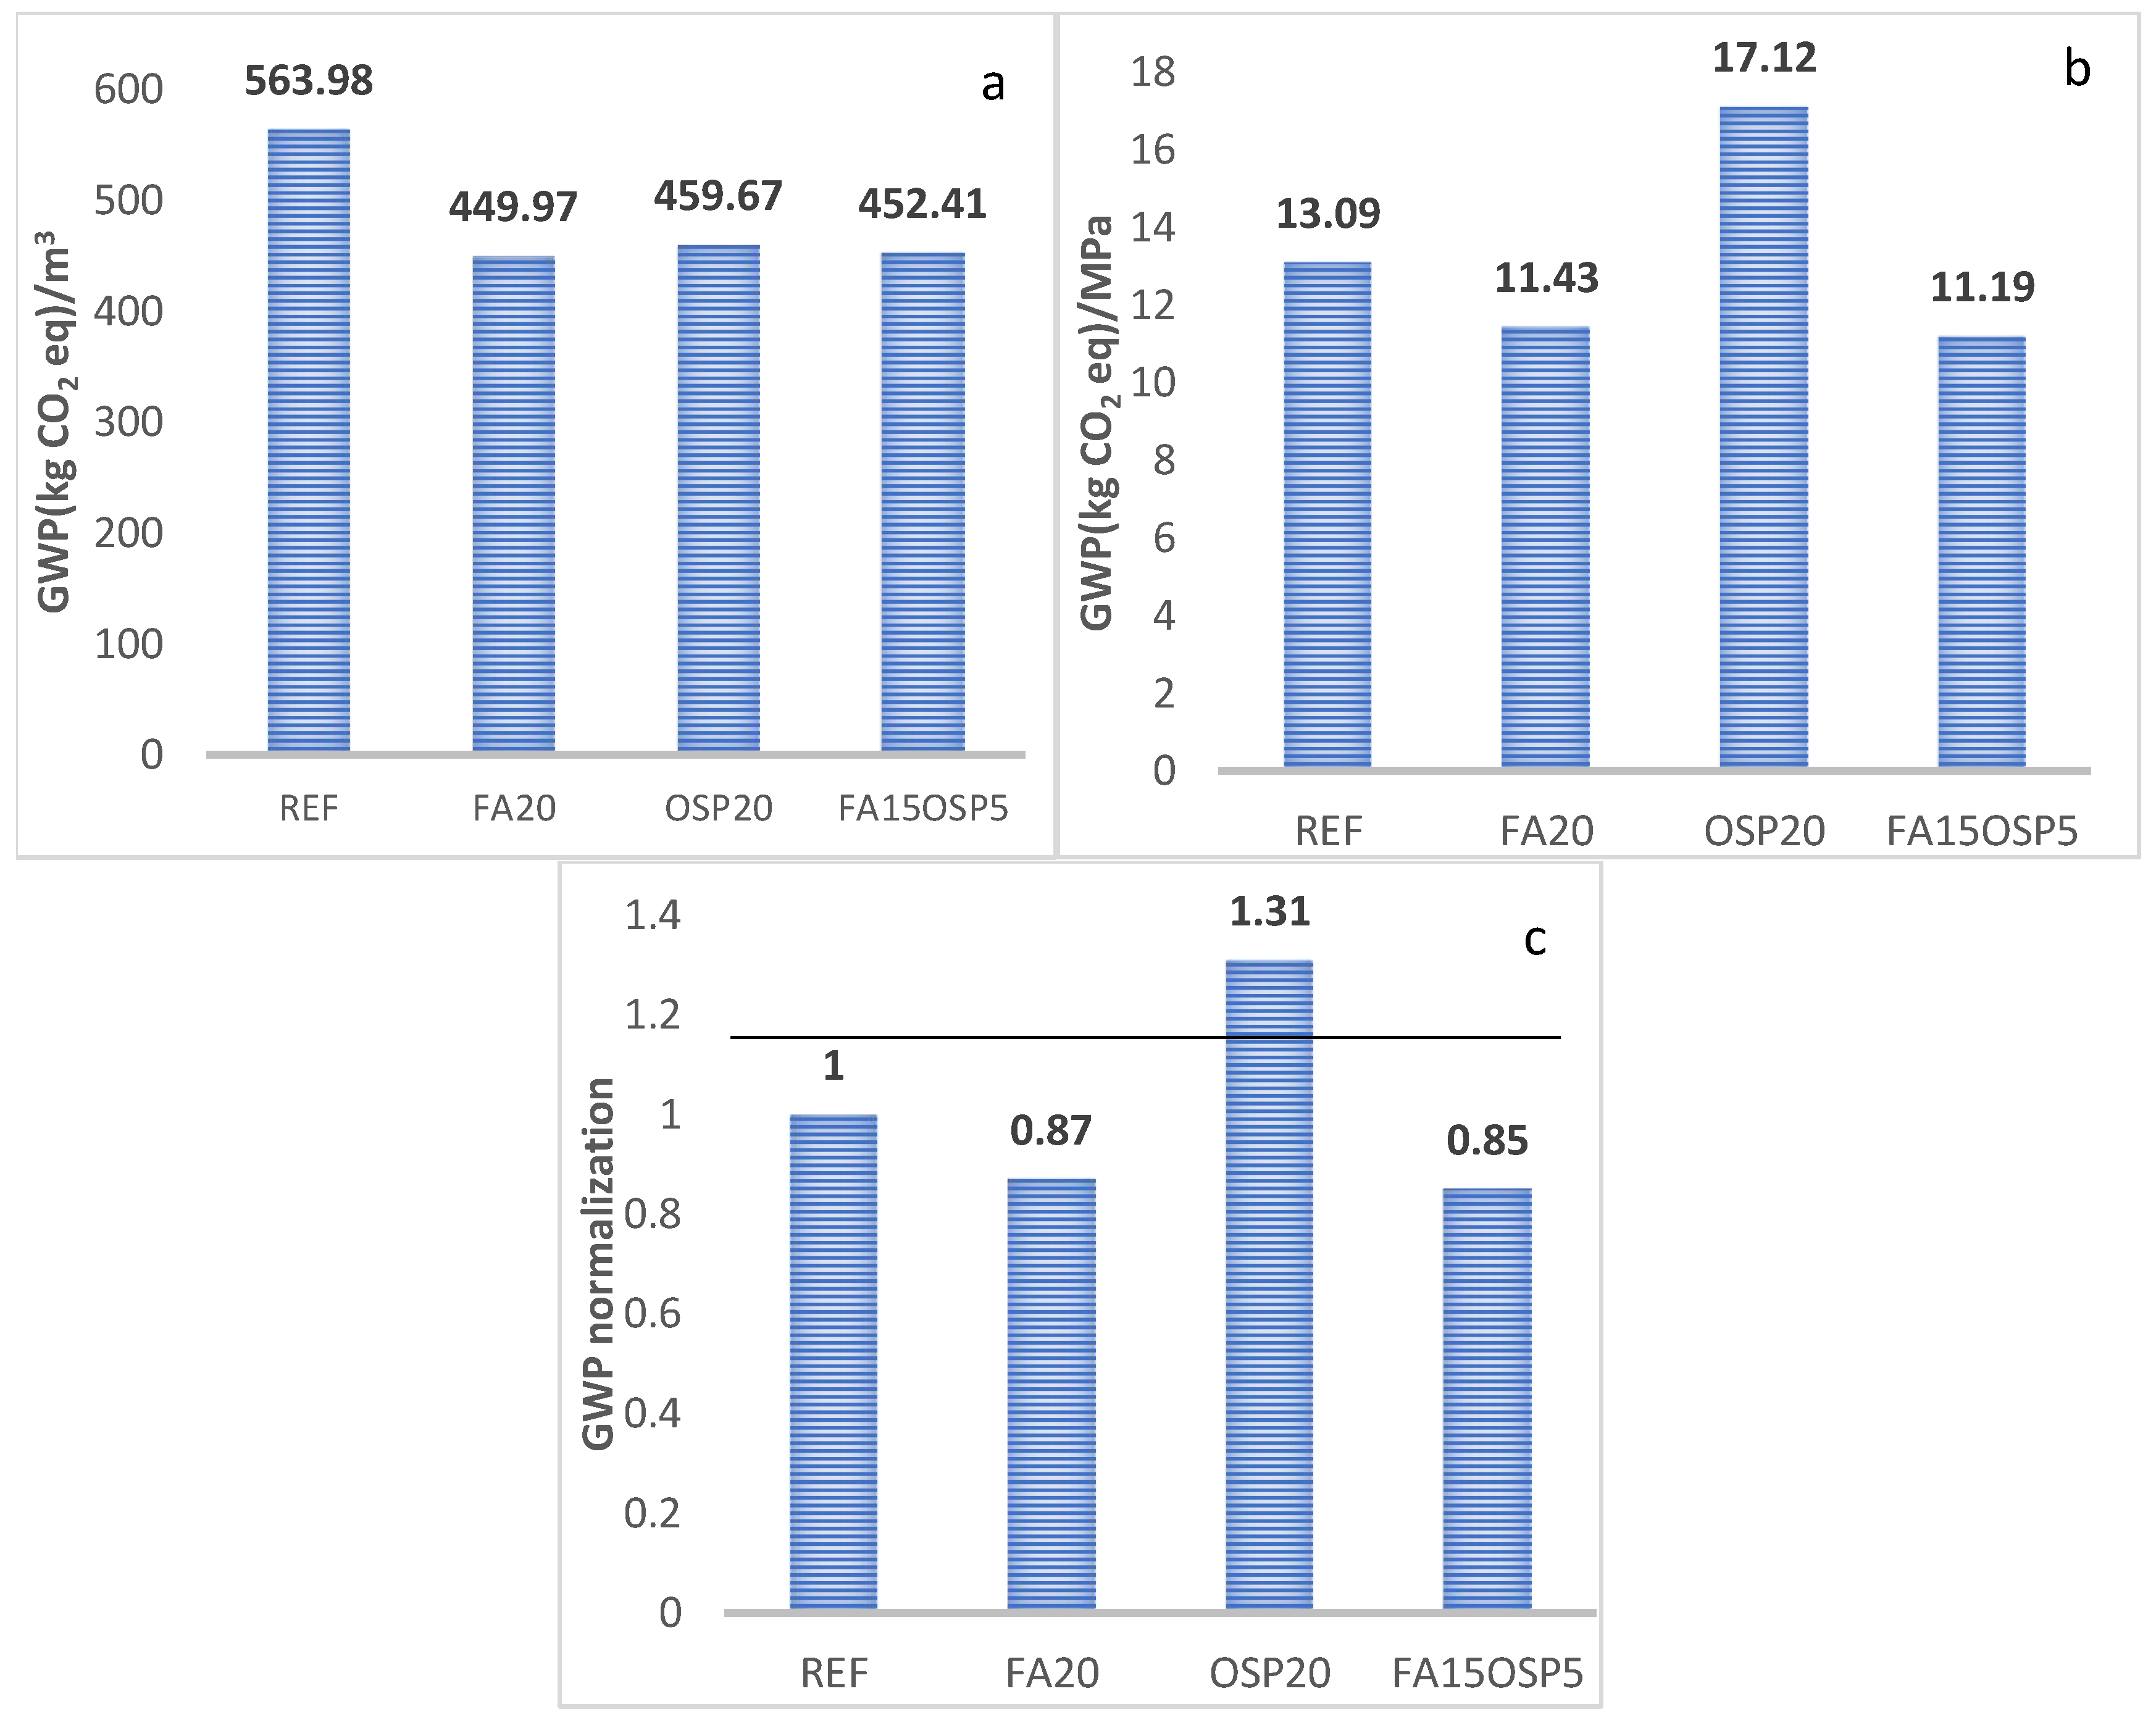
Figure 12a,b show the impact on GWP over the life cycle of each sample group, and Figure 12c compares the standardized percentage relative to the REF group. Figure 12a shows that for mixtures containing OSP or FA, the amount of carbon dioxide released per unit volume is significantly lower than that of pure cement mixtures, decreasing by approximately 20%. Figure 12b,c show that, compared with adding pure cement mixtures, adding FA to partially replace OPC can reduce the carbon dioxide released per unit of strength by approximately 12%, and when FA and OSP are used together, this value can be further reduced to approximately 15%. This shows that using FA and OSP to partially replace OPC helps to reduce C O 2 emissions.
2.
AD
Figure 13a,b show the effects on AD throughout the life cycle of the mixture, and Figure 13c compares the standardized percentages relative to those of the REF group. The results show that replacing OPC with OSP increases the AD of the mixture, whereas replacing OPC with FA decreases the AD of the mixture. The total AD of the mixture increases or decreases continuously with the addition of FA and OSP.
3.
ODP
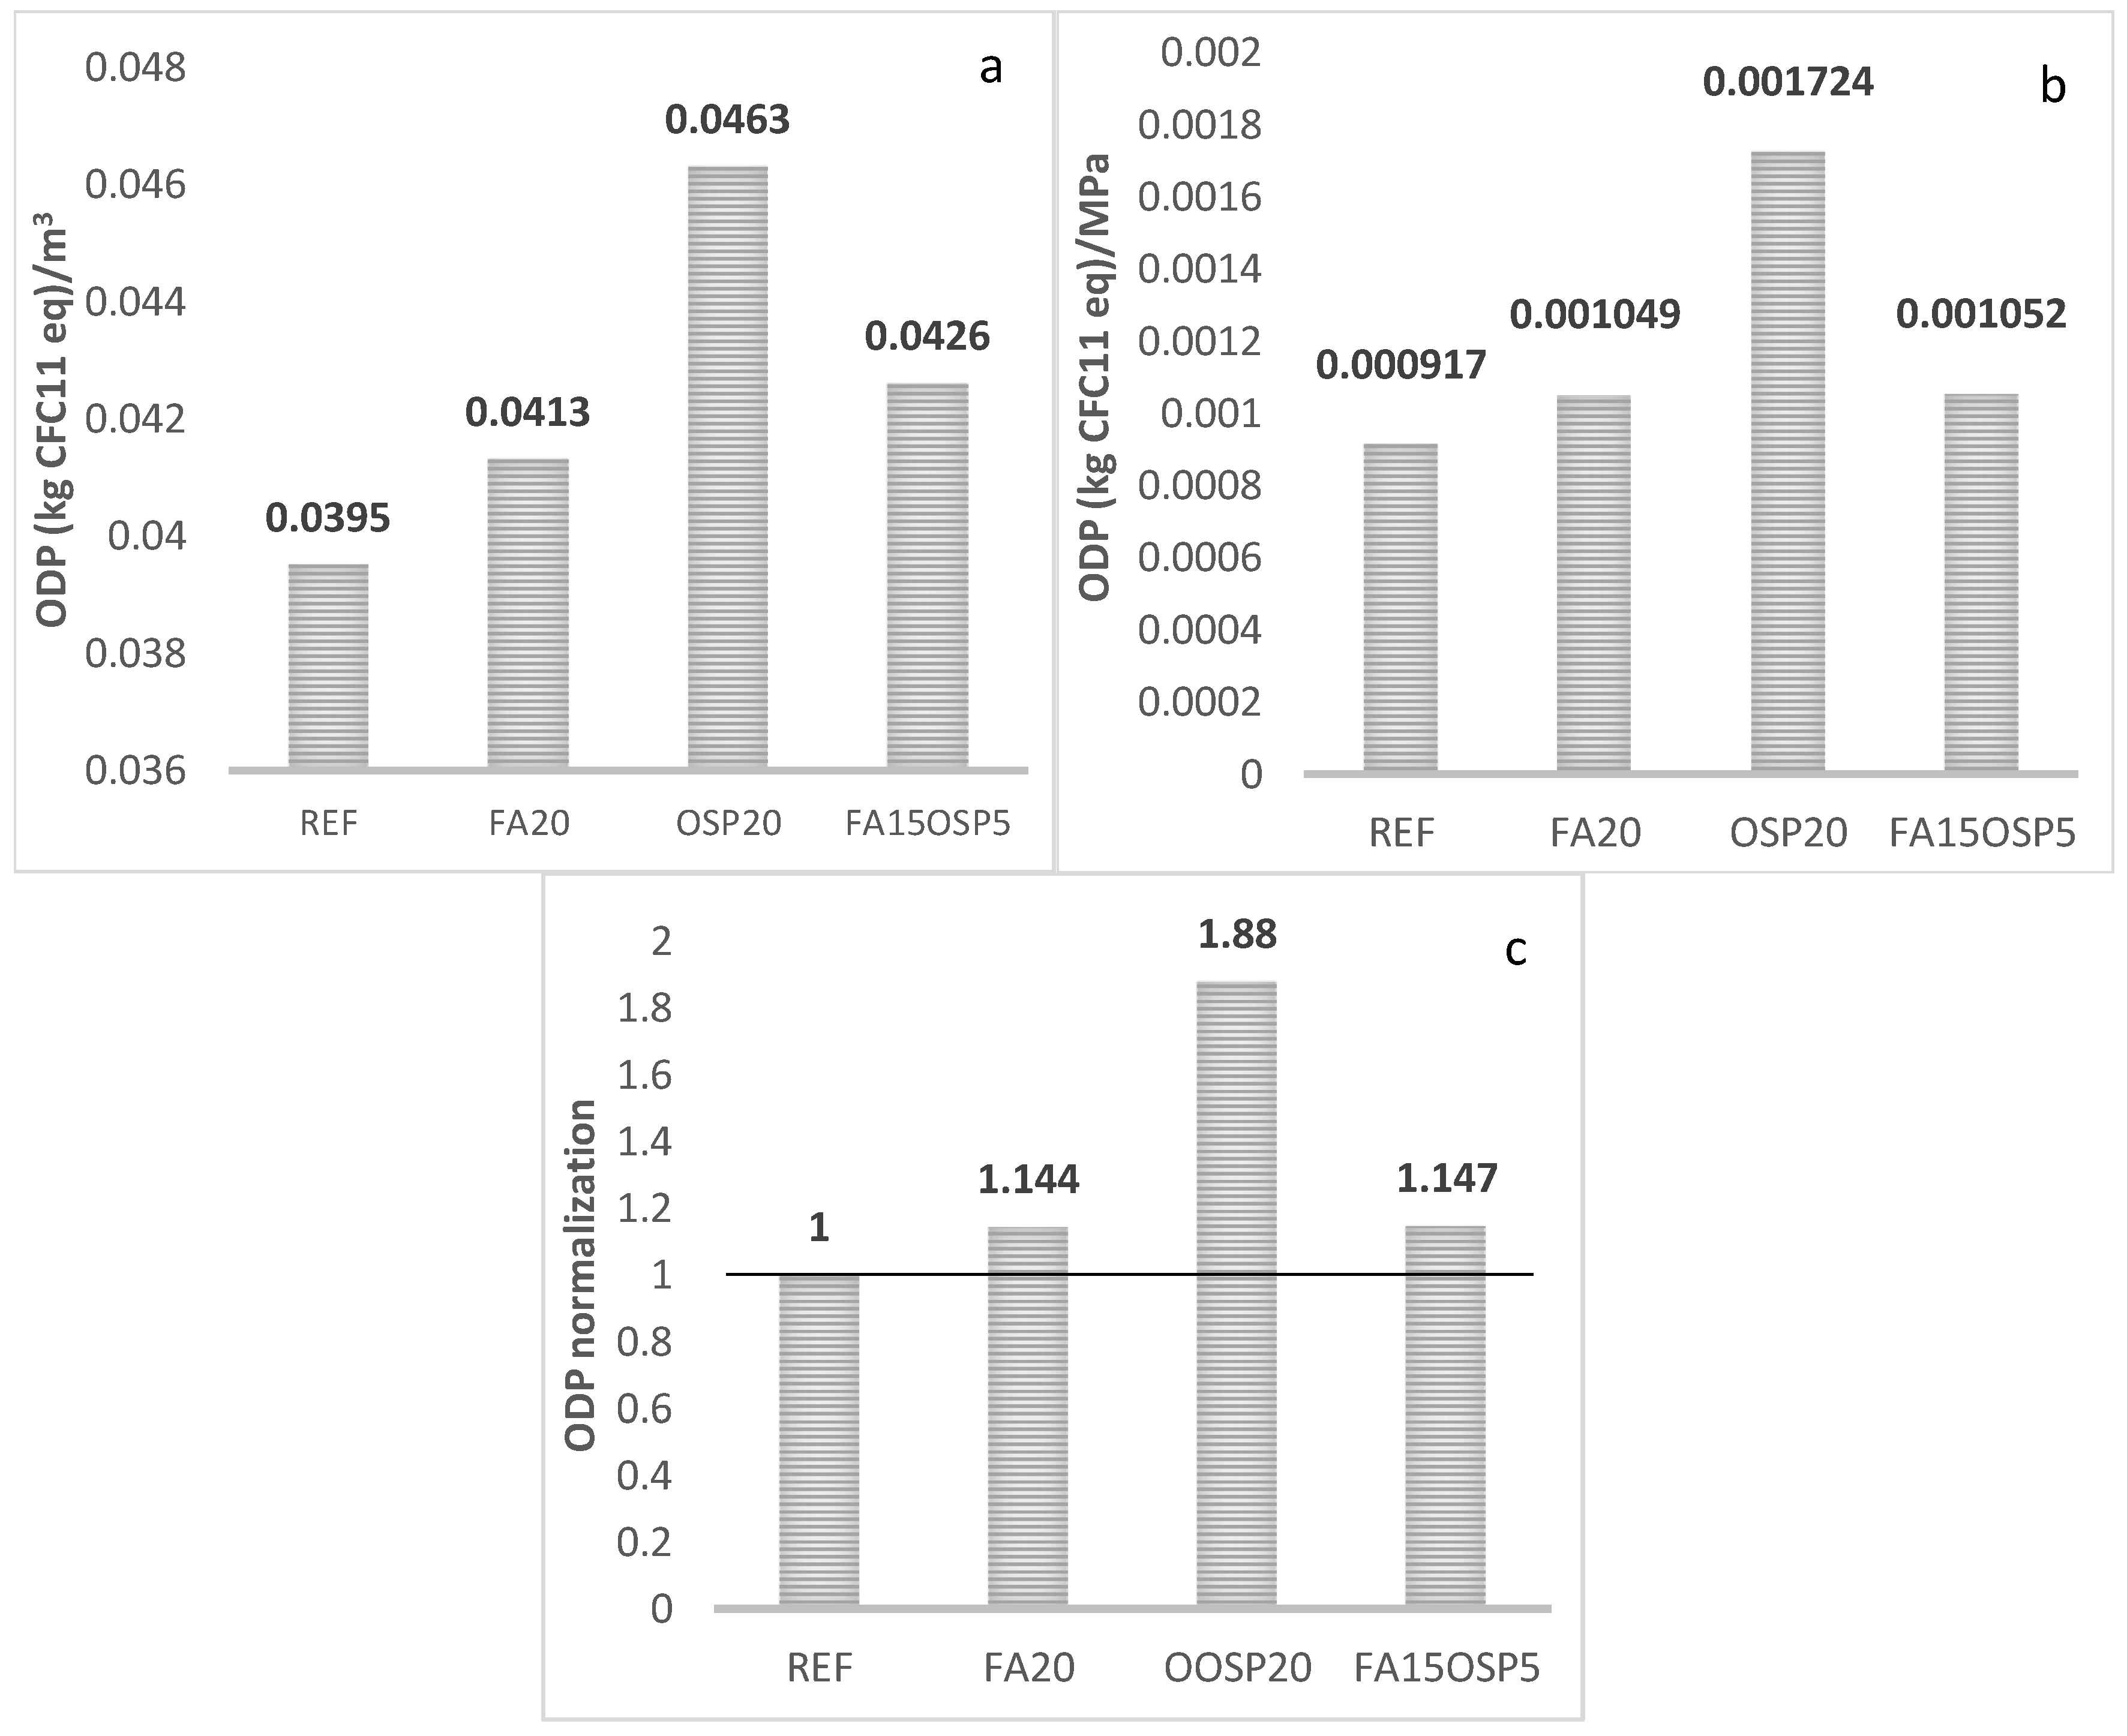
Figure 14a,b show the effects on ODP throughout the life cycle of the mixture, and Figure 14c compares the standardized percentages relative to those of the REF group. The results show that adding FA and OSP both increase the ODP of the mixture, but the effect of FA on the ODP is smaller than that of OSP on the ODP.
4.
AP
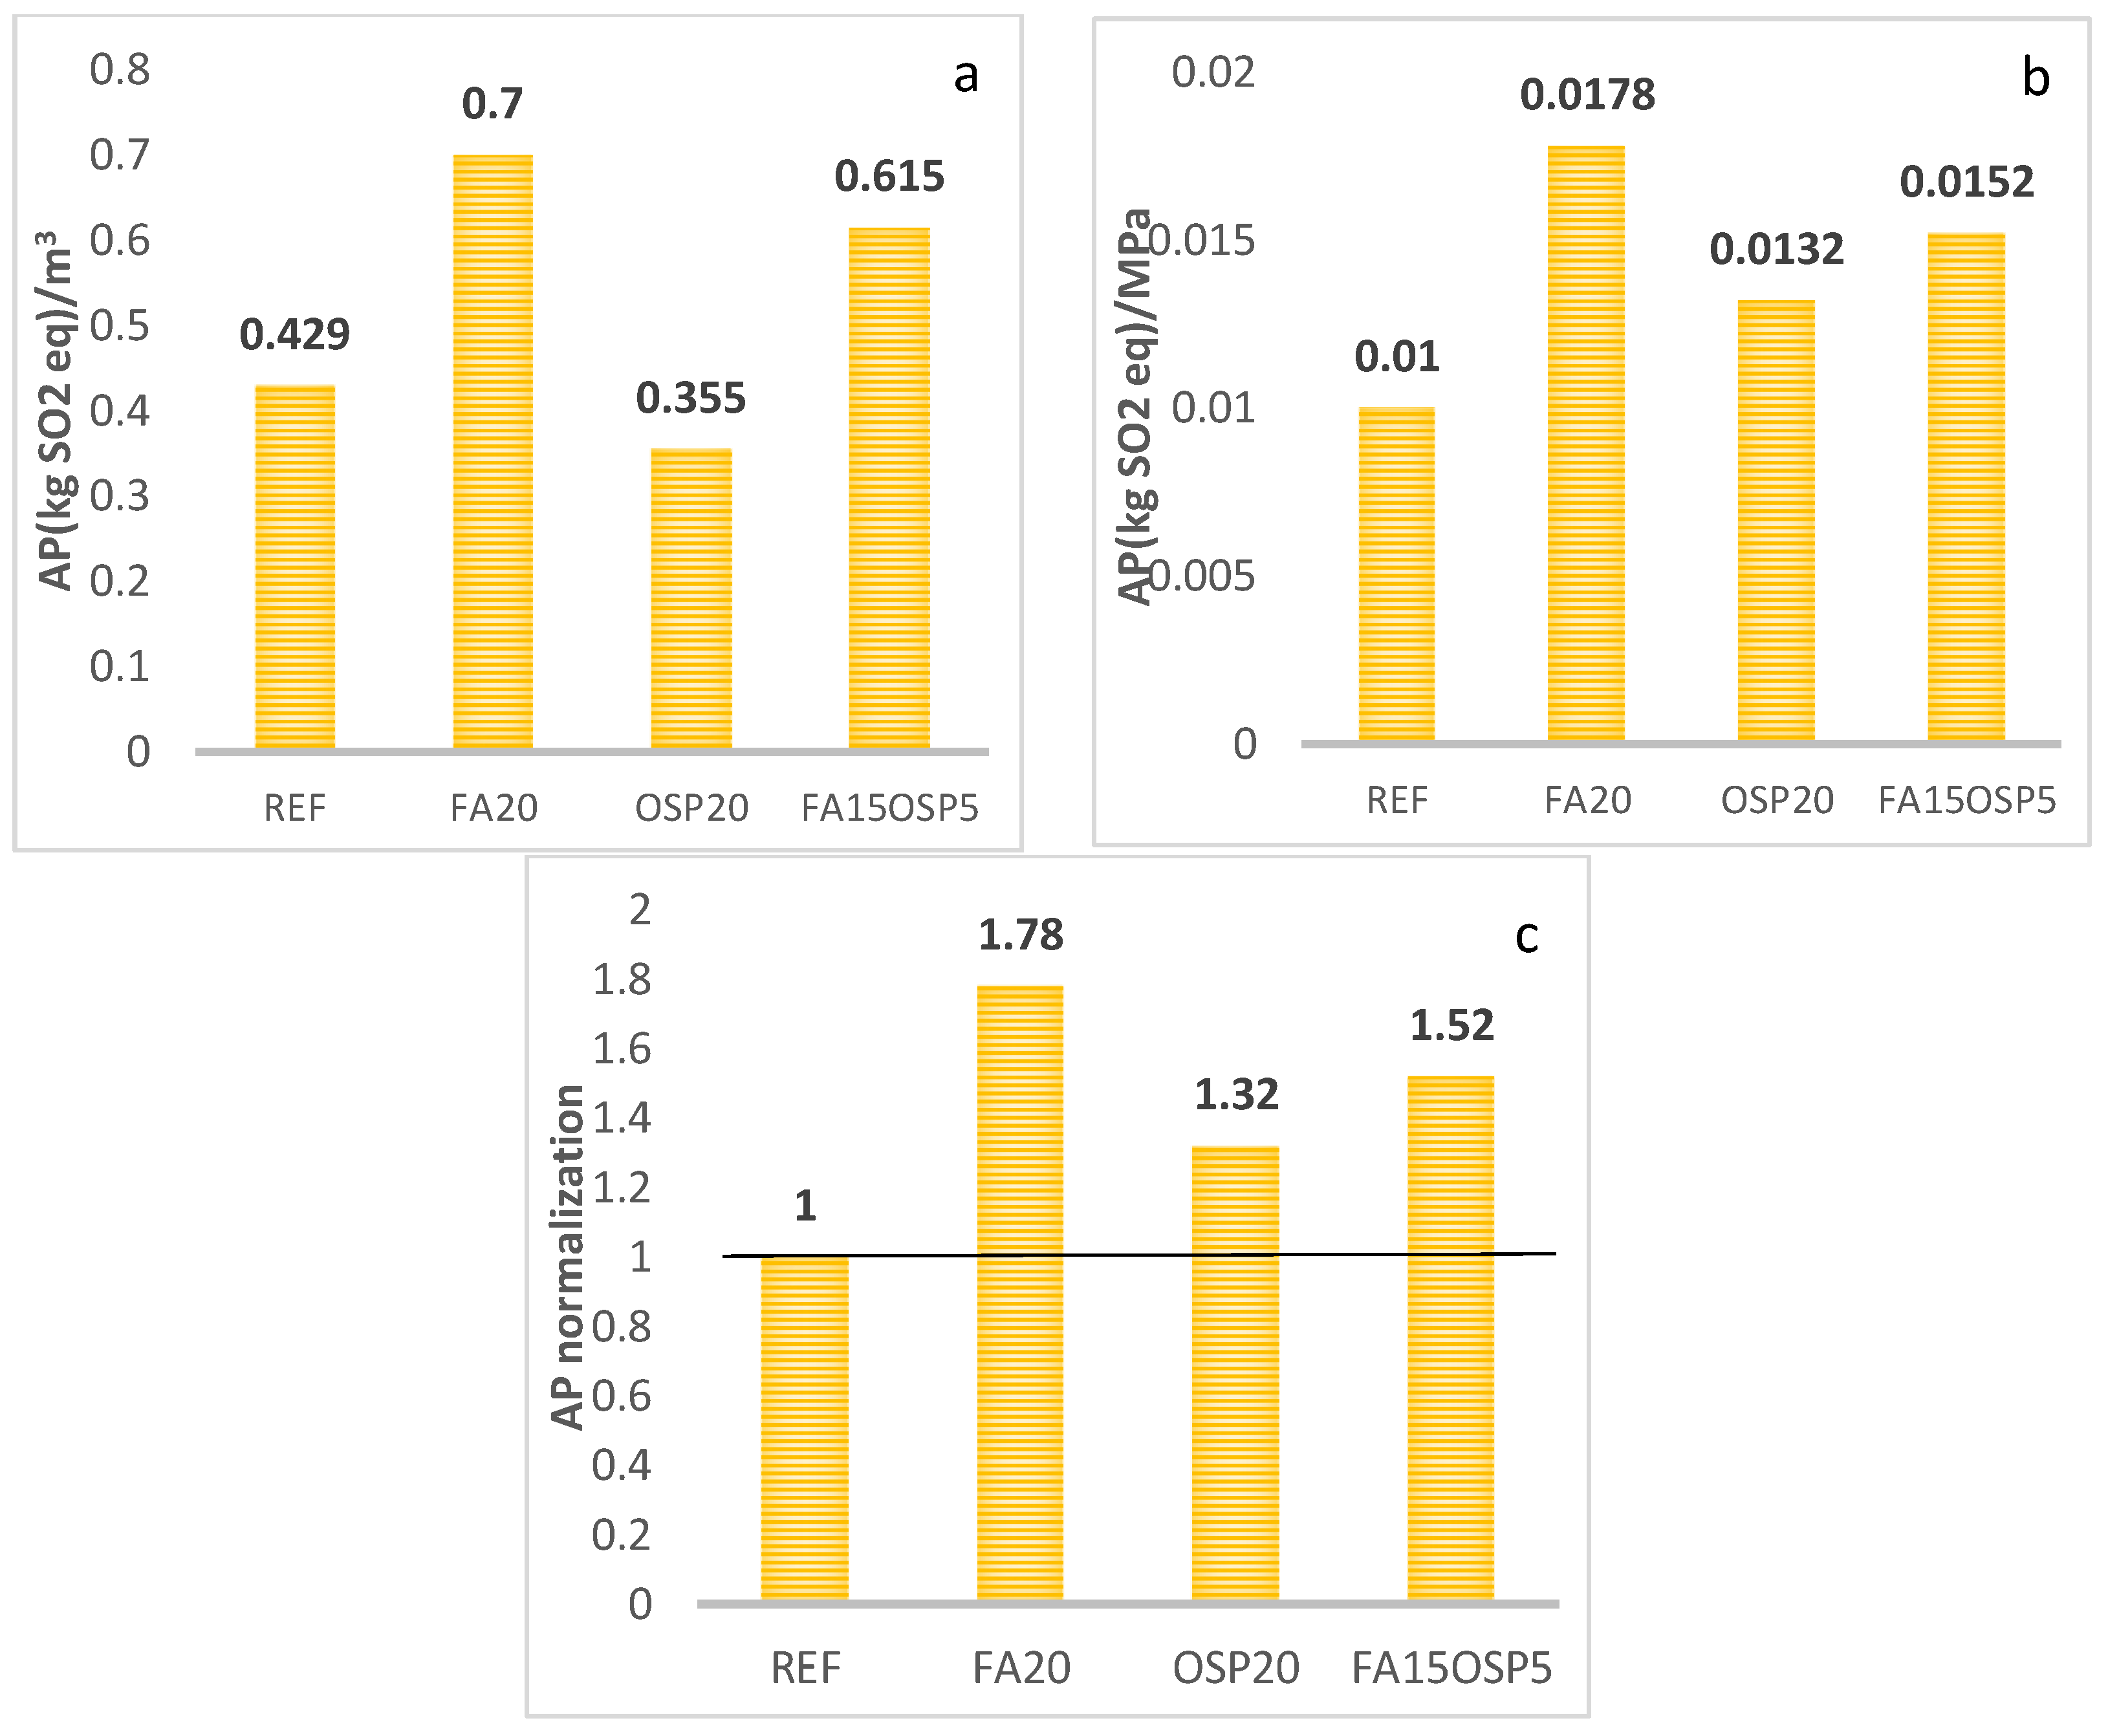
Figure 15a,b show the effects on AP throughout the life cycle of the mixture, and Figure 15c compares the standardized percentages relative to those of the REF group. The figure shows that adding FA increased the AP of the mixture, whereas adding OSP reduced the effect of the mixture on the AP.
5.
EP
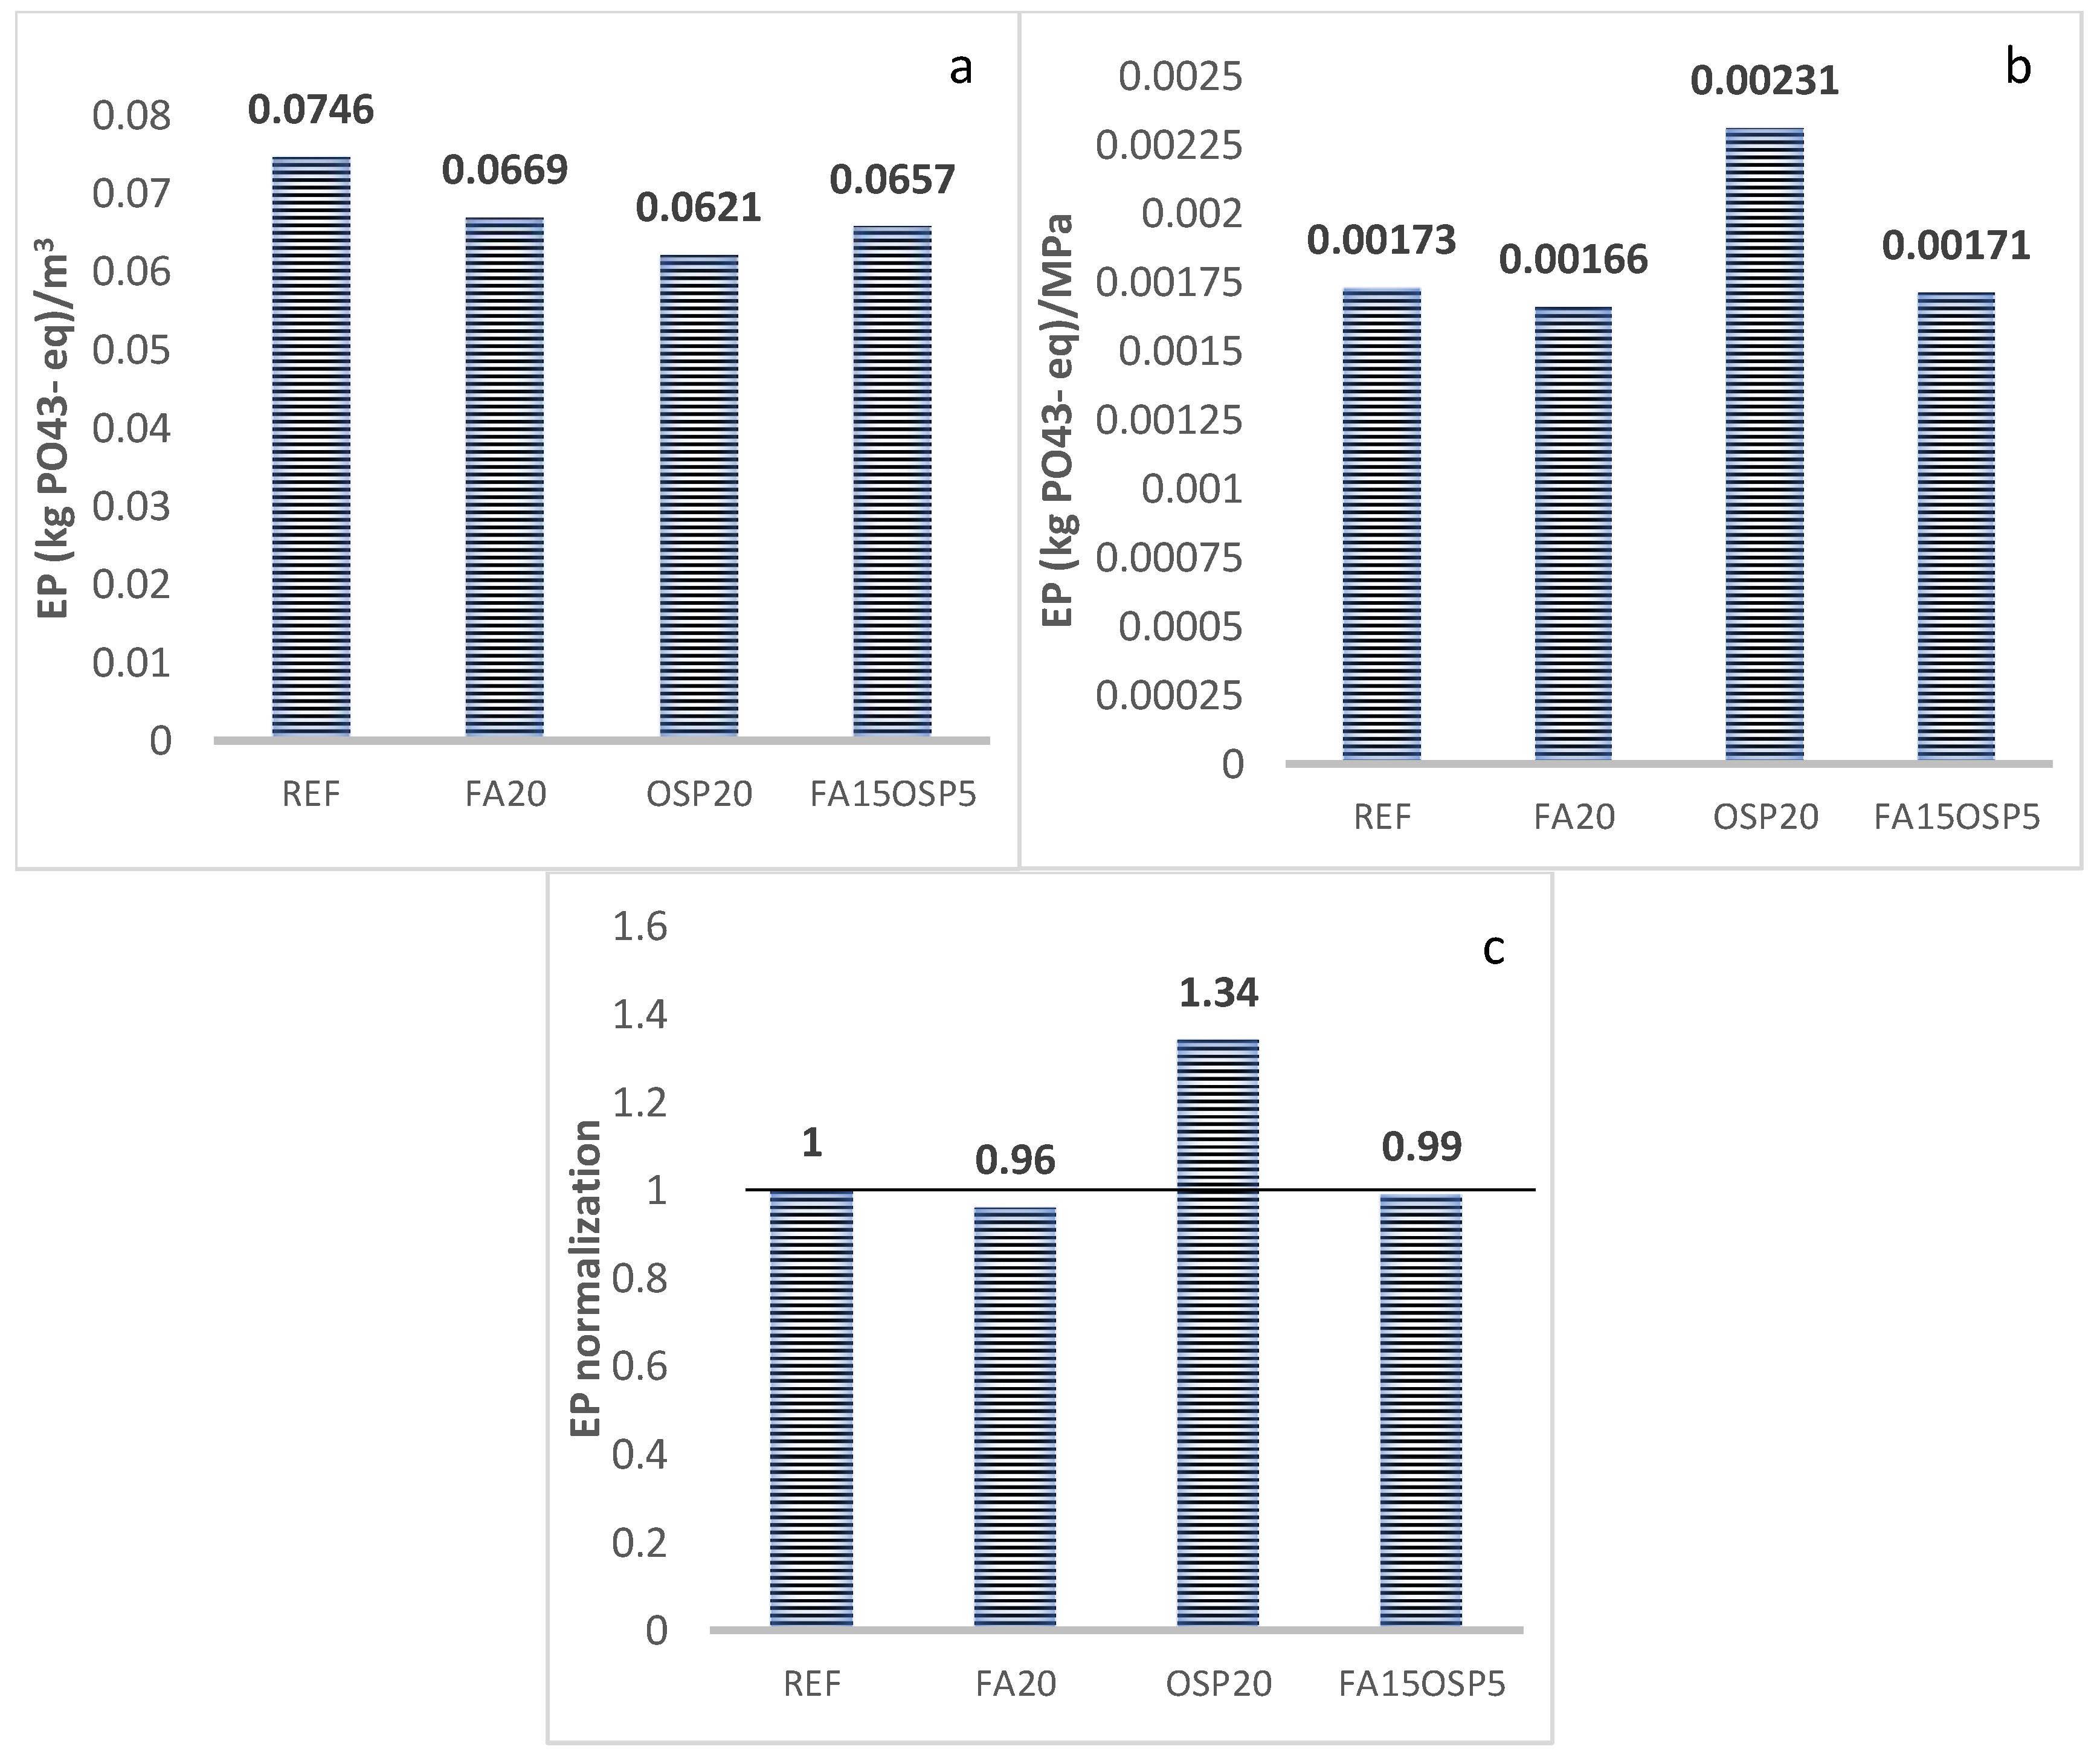
Figure 16a,b show the effects on EP throughout the life cycle of the mixture, and Figure 16c compares the standardized percentages relative to those of the REF group. Overall, adding either OSP or FA reduced the EP of the mixture, and adding OSP had a smaller effect on the EP of the mixture than adding FA.
6.
POCP
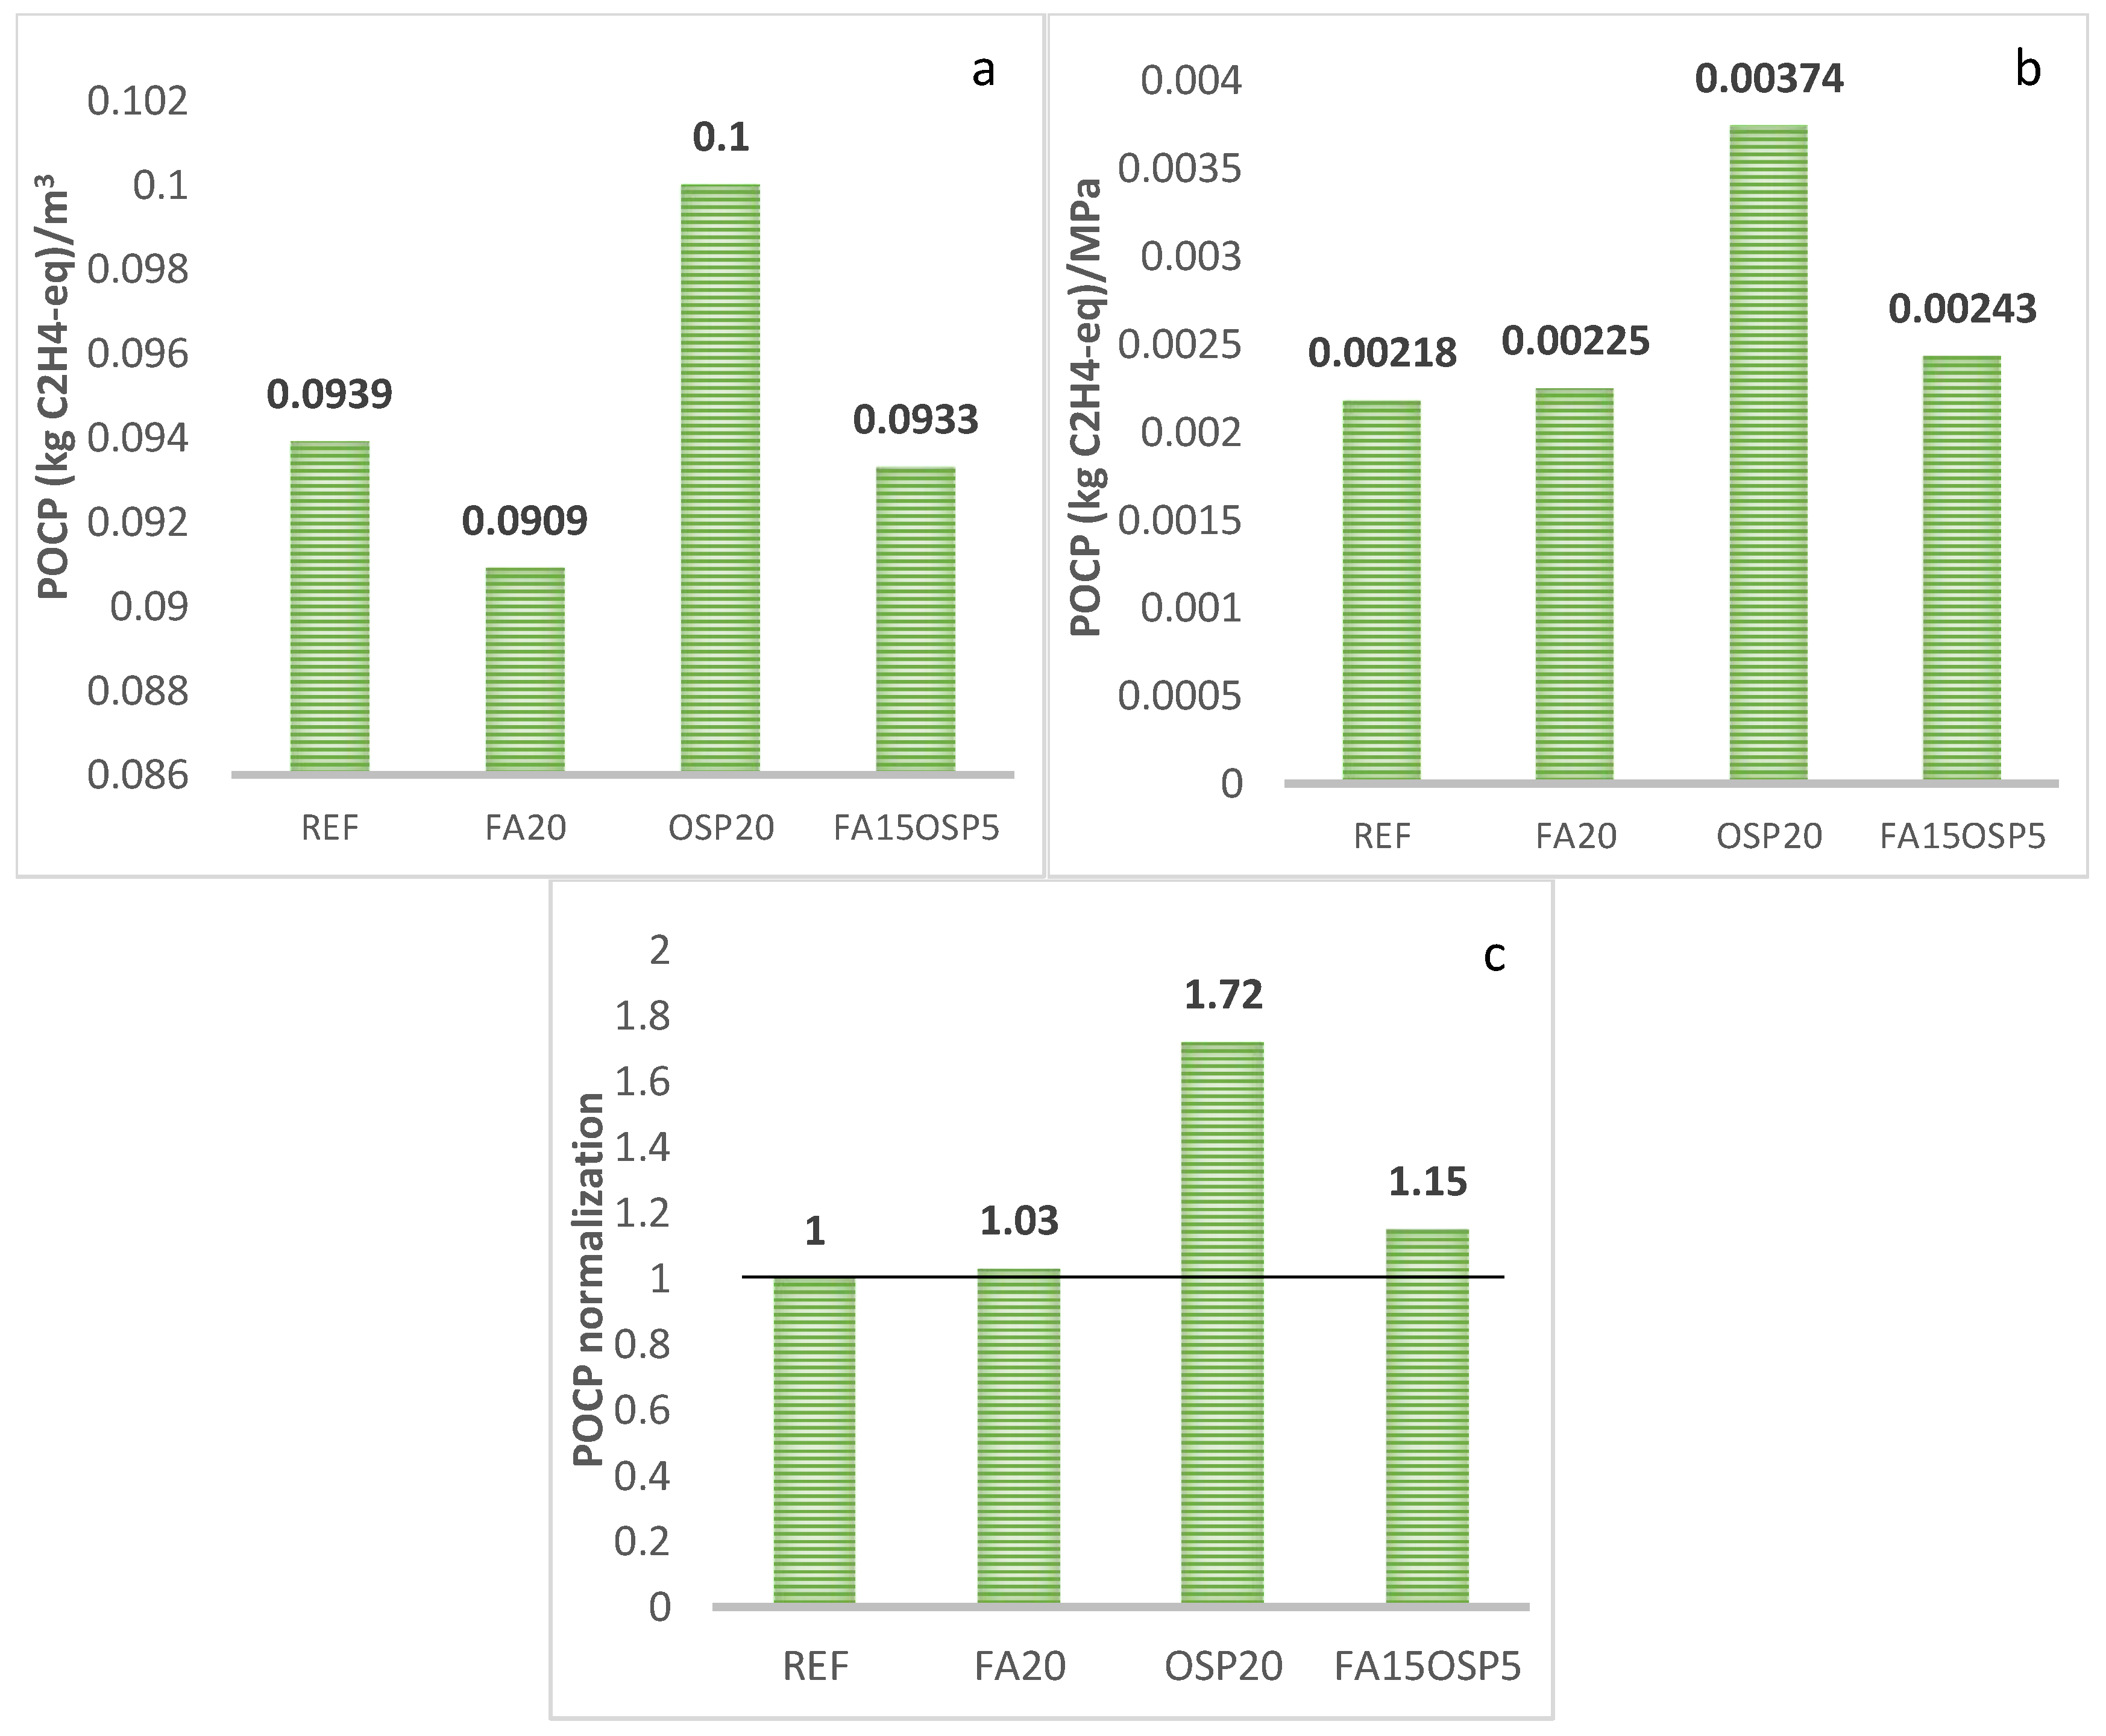
Figure 17a,b show the effects on POCP throughout the life cycle of the mixture, and Figure 17c compares the standardized percentages relative to those of the REF group. Overall, similar to the trend of AD, adding FA reduced the POCP of the mixture, while adding OSP increased the POCP of the mixture, but the effects of both additives on the POCP were relatively small.
7.
Summary of the LCA
In general, introducing FA and OSP changes the results of life cycle environmental impacts. Adding FA increases the ODP, AP, and POCP of mixtures at unit compressive strength and reduces the GWP and AD of concrete mixtures. Due to the dilution effect of OSP, adding OSP increases the environmental impact of concrete mixtures at unit compressive strength. Blending FA and OSP can reduce the GWP, EP, and AD of mixtures at unit compressive strength and can correspondingly increase the strength of concrete. The ODP, AP, and POCP of the concrete mixtures also increased. OSP is collected and ground from oyster processing plants and farms, and these steps have relatively low energy consumption, whereas FA is a byproduct of thermal power generation. Compared with the production of OPC, processing FA and OSP requires significantly less energy. The simultaneous use of FA and OSP can significantly reduce the C O 2 emissions (GWPs) of the mixture. Therefore, partially replacing OPC with FA and OSP can effectively reduce the environmental impact of concrete.

4. Discussion

This study systematically demonstrated the effects of using FA and OSP to partially replace cement on the mechanical properties of concrete, hydration dynamics, and sustainable development. Based on macro–micro experimental analysis, the mechanism of action of FA and OSP can be summarized into three effects: the nucleation effect, the dilution effect, and the synergistic effect between FA and OSP.
In terms of the hydration mechanism, FA has pozzolanic reactivity and can react with calcium hydroxide generated during the hydration process to form additional C-S-H gel, thereby improving later strength and refining the pore structure. OSP, on the other hand, mainly works through a physical dilution effect, reducing the early cement content. Although this may reduce the initial hydration rate, it helps to improve the microstructure through particle filling. The interaction of these two materials produces a synergistic effect, which can maintain early hydration dynamics while improving later performance.

4.1. Mechanism of Action

4.1.1. OSP Mechanism

The particle size of the OSP used in this study (Dv50 = 27.1) is relatively large, but the nucleation effect remains obvious, which promotes the cement hydration process. This result is reflected in the hydration heat (Figure 7) and TGA results (Figure 10). When the OSP substitution rate is 20%, the reduction in hydration heat at 7 days is 14%, less than the substitution rate of 20%. This is because the nucleation effect increases the cumulative hydration heat, and the reduction in chemically bound water at 28 days is 17%, which is approximately 20%. The reduction in resistivity at 28 days is 22%, which is also approximately equal to 20%. This shows that the dilution effect is greater than the nucleation effect. The reduction in strength at 28 days is 38%, which is far greater than 20%. This occurs because the organic impurities in OSP reduce the strength.

4.1.2. FA Mechanism

The main components of FA include silicon dioxide (SiO2), calcium oxide (CaO), and aluminum oxide (Al2O3). When the FA replacement rate is 20%, the reduction in hydration heat after 7 days is 19.2%, approximately equal to the replacement rate of 20%. This occurs because the nucleation and delay effects of FA offset each other, and the dilution effect occurs at 7 days. The reduction in chemically bound water after 28 days is 18%, which is also approximately 20%. For chemically bound water, the dilution effect is dominant, as can be proven from the TGA image (Figure 10). The increase in resistivity after 28 days is 34%, primarily due to the pozzolanic reaction of FA, which becomes more active at later ages. This reaction consumes calcium hydroxide and generates additional C-S-H, leading to pore refinement and a denser microstructure.

4.1.3. Synergistic Effects of FA and OSP

Through XRD, we found that for the three-doped sample FA15OSP5, Mc was generated at 28 days. This shows that the two react chemically and have a synergistic effect. The macroscopic manifestation of the synergistic effect is the increased strength and reduced carbon emissions per unit of compressive strength. For all the samples, FA15OSP5 has the lowest carbon emissions per unit strength, also proving its significance for sustainable development.

4.2. Significance of FA and OSP to Sustainable Development

Figure 12, Figure 13, Figure 14, Figure 15, Figure 16 and Figure 17 show the LCA evaluation results of the concrete under the four mix proportions. For a unit volume, adding FA and OSP can significantly reduce the concrete GWP and EP. For the FA20 group, the reductions in GWP and EP were 20.2% and 10.3%, respectively. For the OSP20 group, the reductions in GWP and EP were 18.5% and 16.8%, respectively. For the FA15OSP5 group, the reductions were 19.8% and 11.9%, respectively. For unit strength, adding FA and OSP can significantly reduce the GWP of concrete, with a reduction of up to 15%. This is because adding FA and OSP reduces the use of OPC, which is one of the processes with the highest C O 2 emissions and the highest energy consumption in cement production [49]. However, at the same time, introducing FA and OSP has an adverse effect on the acidification potential (AP) of the environment. The AP increases by 4.6–17.2% per unit volume because the production of FA has a greater impact on the acidification potential of the environment. In fact, even for OSP, the processing and transportation process has a greater impact on its sustainability, especially for those that require secondary treatment [50]. Moreover, using FA and OSP to make concrete instead of OPC has great economic benefits because OPC is usually the most expensive part of concrete, and reducing the use of OPC can significantly reduce the cost of concrete. Therefore, from the perspective of sustainable development and economic benefits, the potential to use FA and OSP to make concrete is considerable.

5. Conclusions

The effects of FA and OSP on the properties and microstructures of cement pastes of each age were studied via XRD, FT-IR, and TGA. Mortar samples and cement pastes were prepared using FA and OSP instead of cement. The UPV, compressive strength, surface 9resistivity, and hydration heat were tested, and the environmental impact of replacing cement with FA and OSP was calculated. Through testing, we drew the following conclusions.
  • When OSP replaced 20% of OPC, the relative compressive strength (RVS) from 1 to 28 days decreased significantly (from 0.65 to 0.62), primarily due to impurities in OSP negatively impacting the hydration process and structural density. When FA replaced 20% of OPC, the strength decreased from 1 to 7 days (0.74–0.76), but recovered to 0.94 at 28 days due to the pozzolanic reaction. For the FA + OSP ternary system, the relative strength ranged from 0.73 to 0.89 at various ages, slightly higher than the FA-only system at early ages and slightly lower at 28 days. This suggests that the nucleation and filling effects of OSP partially offset the dilution effect of FA at early ages, but may slightly inhibit the FA reaction in terms of long-term strength.
  • The UPV test results are consistent with the compressive strength trend. With increasing FA and OSP dosages, the UPV decreased slightly, reflecting a decrease in hydration products. A good power function relationship (R2 = 0.9766) was observed between strength and UPV, validating the effectiveness of UPV as a nondestructive testing indicator.
  • Due to its pozzolanic reaction, FA significantly increased the resistivity of concrete in the late hydration stage. However, in the early hydration stage, reducing the OPC dosage resulted in a slight decrease in surface resistivity. From 1 to 7 days, compressive strength and resistivity showed a strong exponential correlation (R2 = 0.9298). By 28 days, although resistivity increased significantly, the correlation with strength weakened (R2 = 0.8486), indicating that the predictive relationship weakened over time. This is because the FA reaction had a greater impact on surface resistivity than on compressive strength.
  • Hydration heat results showed that the addition of FA and OSP resulted in a dilution effect, reducing the hydration rate. OSP promoted early hydration to a certain extent, while FA had a certain inhibitory effect in the early stages. The order of C3S heat flux peak intensity was REF > OSP20 > FA15OSP5 > FA20.
  • The order of CH thermal decomposition peaks is REF > OSP20 > FA20 > FA15OSP5, consistent with the calculated CH content. The volcanic ash reaction of FA significantly consumes CH, while the effect of OSP is relatively small. The chemically bound water content in the mixed system decreases and exhibits a good power function relationship with the compressive strength (R2 = 0.891).
  • The synergistic application of FA and OSP reduces the life cycle greenhouse gas emissions (GWP) and abiotic resource depletion (AD) of the ternary system to 0.85 and 0.96, respectively, compared to the control group. However, the acidification potential (AP), ozone depletion potential (ODP), and photochemical ozone creation potential (POCP) increase to 1.52, 1.14, and 1.15, respectively, compared to the control, while the eutrophication potential (EP) remains essentially unchanged (0.99).
  • The LCA parameters used in this study are based on local Korean geographical conditions and raw material processing. Factors such as transportation distance and energy structure may differ significantly in other regions, affecting the applicability of the LCA results. It is recommended that other researchers adjust this method by combining it with local databases (such as KLCID or Ecoinvent) to improve the versatility and scientificity of the model.

Author Contributions

K.-J.W.: Writing—original draft, visualization, validation. K.-B.P.: Validation, formal analysis, methodology. X.-Y.W.: Writing—review and editing, funding acquisition, formal analysis. All authors have read and agreed to the published version of the manuscript.

Funding

This study was supported by a National Research Foundation of Korea (NRF) grant funded by the Korean Government (MSIT) (No. RS-2023-00208720). This study was partly supported by the Korea Institute of Energy Technology Evaluation and Planning, funded by the Ministry of Trade, Industry, and Energy (No. 2025-02314098) of the Republic of Korea. This research was supported by the Regional Innovation System & Education (RISE) program through the Gangwon RISE Center, funded by the Ministry of Education (MOE) and the Gangwon State (G.S.), Republic of Korea (2025-RISE-10-002).

Institutional Review Board Statement

Not applicable.

Informed Consent Statement

Not applicable.

Data Availability Statement

The data will be made available upon request.

Conflicts of Interest

The authors declare no conflicts of interest.

Appendix A

Table A1. Environmental impact factors for each raw material [25,47,51,52].
Impact FactorOPCFAOSPSandWater
GWP (kg C O 2 eq/kg)9.3 ×  10−11.98 × 10−31.96 × 10−22.6 × 10−31.68 × 10−4
EP (kg P O 4 3 eq/kg)1.146  ×  10−45.53 × 10−54.58  ×  10−71.097  ×  10−67.89  ×  10−8
ODP (kg C F C 11 eq/kg)1.189  ×  10−85.59 × 10−91.11  ×  10−91.257  ×  10−101.92  ×  10−12
AP (kg S O 2 eq/kg)7.238  ×  10−43.2 × 10−31.03  ×  10−46.286  ×  10−64.1  ×  10−7
AD (kg S b eq/kg)2.4  ×  10−33.37 × 10−43.3  ×  10-34.983  ×  10−61.39  ×  10−6
POCP (kg C 2 H 4 eq/kg)7.210  ×  10−53.22 × 10−55.55  ×  10−51.171  ×  10−61.8  ×  10−8
Table A2. Transportation distance of raw materials (km).
Raw MaterialsOPCFAOSPSandWater
Transport distance1080200800
Table A3. Environmental impact factors corresponding to trucks [53].
GWP ( kg   C O 2 eq/kg *km)AD ( kg   S b eq/kg* km)ODP ( kg   C F C 11 eq/kg* km)AP ( kg   S O 2 eq/kg* km)EP ( kg   P O 4 3 eq/kg* km)POCP ( kg C 2 H 4 eq/kg* km)
Impact Factor 1.92 × 10 4 1.22 × 10 6 3.27 × 10 7 6.68 × 10 11 5.3 × 10 8 4.2 × 10 7
Table A4. The impact factor of electric energy [47].
Impact FactorGWP (kg
C O 2 eq/kg*kWh)
AD ( kg   S b eq/kg*kWh)ODP ( kg   C F C 11 eq/kg*kWh)AP ( kg   S O 2 eq/kg*kWh)EP ( kg   P O 4 3 eq/kg*kWh)POCP ( kg   C 2 H 4 eq/kg*kWh)
Electricity4.951 × 10−13.13 × 10−31.368 ×  10−118.327 ×  10−41.558 × 10−43.526 ×  10−6

References

  1. Zhao, Y.; Wang, T.; Yi, W. Emergy-accounting-based comparison of carbon emissions of solid waste recycled concrete. Constr. Build. Mater. 2023, 387, 131674. [Google Scholar] [CrossRef]
  2. Korczak, K.; Kochański, M.; Skoczkowski, T. Mitigation options for decarbonization of the non-metallic minerals industry and their impacts on costs, energy consumption and GHG emissions in the EU—Systematic literature review. J. Clean. Prod. 2022, 358, 132006. [Google Scholar] [CrossRef]
  3. Supriya; Chaudhury, R.; Sharma, U.; Thapliyal, P.C.; Singh, L.P. Low-CO2 emission strategies to achieve net zero target in cement sector. J. Clean. Prod. 2023, 417, 137466. [Google Scholar] [CrossRef]
  4. Mamatha, B.S.; Sujatha, D.; Uday, D.N.; Kiran, M.C. Properties of flyash based wood geopolymer composite. Low-Carbon Mater. Green Constr. 2023, 1, 29. [Google Scholar] [CrossRef]
  5. Şahmaran, M.; Li, V.C. Durability properties of micro-cracked ECC containing high volumes fly ash. Cem. Concr. Res. 2009, 39, 1033–1043. [Google Scholar] [CrossRef]
  6. Thwe, K.S.; Ayawanna, J.; Mase, L.Z.; Chaiyaput, S. Utilization of ladle furnace slag and fly ash as partially replacement of cement. Clean. Eng. Technol. 2025, 25, 100910. [Google Scholar] [CrossRef]
  7. Yin, S.; Yan, Z.; Chen, X.; Wang, L. Effect of fly-ash as fine aggregate on the workability and mechanical properties of cemented paste backfill. Case Stud. Constr. Mater. 2022, 16, e01039. [Google Scholar] [CrossRef]
  8. Bhat, R.; Han, T.; Sant, G.; Neithalath, N.; Kumar, A. A comprehensive analysis of hydration kinetics and compressive strength development of fly ash-Portland cement binders. J. Build. Eng. 2024, 88, 109191. [Google Scholar] [CrossRef]
  9. Balakrishnan, B.; Maghfouri, M.; Alimohammadi, V.; Asadi, I.; Roychand, R. The acid and chloride permeability resistance of masonry cement plaster mortar incorporating high-volume fly ash content. J. Build. Eng. 2024, 86, 108783. [Google Scholar] [CrossRef]
  10. Liu, Z.; Deng, D.; Schutter, G.D.; Yu, Z. Chemical sulfate attack performance of partially exposed cement and cement + fly ash paste. Constr. Build. Mater. 2012, 28, 230–237. [Google Scholar] [CrossRef]
  11. Chen, D.; Zhang, P.; Pan, T.; Liao, Y.; Zhao, H. Evaluation of the eco-friendly crushed waste oyster shell mortars containing supplementary cementitious materials. J. Clean. Prod. 2019, 237, 117811. [Google Scholar] [CrossRef]
  12. ASTM F1736-21e1; Standard Guide for Irradiation of Shellfish for Pathogen and Spoilage Control. ASTM International: West Conshohocken, PA, USA, 2021.
  13. Mo, K.H.; Alengaram, U.J.; Jumaat, M.Z.; Lee, S.C.; Goh, W.I.; Yuen, C.W. Recycling of seashell waste in concrete: A review. Constr. Build. Mater. 2018, 162, 751–764. [Google Scholar] [CrossRef]
  14. Han, Y.; Lin, R.; Wang, X.Y. Sustainable mixtures using waste oyster shell powder and slag instead of cement: Performance and multi-objective optimization design. Constr. Build. Mater. 2022, 348, 128642. [Google Scholar] [CrossRef]
  15. Yang, B.; Han, Y.; Kong, Z.; Wang, X.Y. Effect of belite-rich cement on the micro/macro properties and sustainability of slag–oyster powder–cement-based ternary materials. Constr. Build. Mater. 2025, 468, 140460. [Google Scholar] [CrossRef]
  16. Her, S.; Im, S.; Liu, J.; Suh, H.; Kim, G.; Sim, S.; Wi, K.; Park, D.; Bae, S. Exploring the potential of pulverized oyster shell as a limestone substitute in limestone calcined clay cement (LC3) and its implications for performance. Constr. Build. Mater. 2024, 425, 135918. [Google Scholar] [CrossRef]
  17. Han, Y.; Lin, R.S.; Wang, X.Y. Compressive Strength Estimation and CO2 Reduction Design of Fly Ash Composite Concrete. Buildings 2022, 12, 139. [Google Scholar] [CrossRef]
  18. Wang, X.Y. Evaluation of the hydration heat and strength progress of cement–fly ash binary composite. J. Ceram. Process. Res. 2020, 21, 622–631. [Google Scholar] [CrossRef]
  19. Yang, B.; Han, Y.; Kong, Z.; Wang, X.Y. Effect of waste oyster shell powder on the micro- and macroproperties and sustainable performance of cement-based materials. J. Build. Eng. 2024, 92, 109800. [Google Scholar] [CrossRef]
  20. Wang, X.Y. Optimal Design of Low-Carbon Concrete Containing Fly Ash and Limestone Powder. Ceram.—Silik. 2022, 66, 202–210. [Google Scholar] [CrossRef]
  21. Xuan, M.Y.; Cho, H.K.; Wang, X.Y. Performance improvement of waste oyster-shell powder–cement binary system via carbonation curing. J. Build. Eng. 2023, 70, 106336. [Google Scholar] [CrossRef]
  22. Wang, H.Y.; Kuo, W.T.; Lin, C.C.; Po-Yo, C. Study of the material properties of fly ash added to oyster cement mortar. Constr. Build. Mater. 2013, 41, 532–537. [Google Scholar] [CrossRef]
  23. Massoumi Nejad, B.; Enferadi, S.; Andrew, R. A comprehensive analysis of process-related CO2 emissions from Iran’s cement industry. Clean. Environ. Syst. 2025, 16, 100251. [Google Scholar] [CrossRef]
  24. Sawa, D.; Yamashita, N.; Tanikawa, H.; Daigo, I.; Maruyama, I. CO2 uptake estimation in Japan’s cement lifecycle. J. Clean. Prod. 2025, 486, 144542. [Google Scholar] [CrossRef]
  25. Han, Y.; Yang, B.; Meng, L.Y.; Cho, H.K.; Lin, R.; Wang, X.Y. Optimization of the life cycle environmental impact of shell powder and slag concrete using response surface methodology. Process Saf. Environ. Prot. 2025, 194, 272–288. [Google Scholar] [CrossRef]
  26. ASTM C305-20; Standard Practice for Mechanical Mixing of Hydraulic Cement Pastes and Mortars of Plastic Consistency. ASTM International: West Conshohocken, PA, USA, 2020.
  27. ASTM-C109/C109M_21; Standard Test Method for Compressive Strength of Hydraulic Cement Mortars (Using 2-in. or [50 mm] Cube Specimens). ASTM International: West Conshohocken, PA, USA, 2021.
  28. ASTM C597-22; Standard Test Method for Ultrasonic Pulse Velocity Through Concrete. ASTM International: West Conshohocken, PA, USA, 2022.
  29. Elsener, B.; Andrade, C.; Gulikers, J.; Polder, R.; Raupach, M. Half-cell potential measurements—Potential mapping on reinforced concrete structures. Mater. Struct. Mater. Constr. 2003, 36, 461–471. [Google Scholar] [CrossRef]
  30. Lin, R.S.; Han, Y.; Wang, X.Y. Macro–meso–micro experimental studies of calcined clay limestone cement (LC3) paste subjected to elevated temperature. Cem. Concr. Compos. 2021, 116, 103871. [Google Scholar] [CrossRef]
  31. Wang, Y.S.; Wang, X.Y. Damage evolution in limestone calcined clay cement (LC3) paste containing recycled glass powder exposed to elevated temperatures. Constr. Build. Mater. 2025, 464, 140140. [Google Scholar] [CrossRef]
  32. Lin, R.S.; Lee, H.S.; Han, Y.; Wang, X.Y. Experimental studies on hydration–strength–durability of limestone-cement-calcined Hwangtoh clay ternary composite. Constr. Build. Mater. 2021, 269, 121290. [Google Scholar] [CrossRef]
  33. de Oliveira, A.M.; Oliveira, A.P.; Vieira, J.D.; Junior, A.N.; Cascudo, O. Study of the development of hydration of ternary cement pastes using X-ray computed microtomography, XRD-Rietveld method, TG/DTG, DSC, calorimetry and FTIR techniques. J. Build. Eng. 2023, 64, 105616. [Google Scholar] [CrossRef]
  34. Liao, Y.; Fan, J.; Li, R.; Da, B.; Chen, D.; Zhang, Y. Influence of the usage of waste oyster shell powder on mechanical properties and durability of mortar. Adv. Powder Technol. 2022, 33, 103503. [Google Scholar] [CrossRef]
  35. Luo, K.; Zhang, M.; Jiang, Q.; Wang, S.; Zhuo, X. Evaluation of using oyster shell as a complete replacement for aggregate to make eco-friendly concrete. J. Build. Eng. 2024, 84, 108587. [Google Scholar] [CrossRef]
  36. Zhang, J.; Jin, C.; Wang, B.; Han, J.; Guo, L.; Tang, N. Study on the micro-rheological properties of fly ash-based cement mortar. Constr. Build. Mater. 2024, 442, 137664. [Google Scholar] [CrossRef]
  37. Trtnik, G.; Kavčič, F.; Turk, G. Prediction of concrete strength using ultrasonic pulse velocity and artificial neural networks. Ultrasonics 2009, 49, 53–60. [Google Scholar] [CrossRef] [PubMed]
  38. Sathiparan, N.; Jayasundara, W.G.B.S.; Samarakoon, K.S.D.; Banujan, B. Prediction of characteristics of cement stabilized earth blocks using non-destructive testing: Ultrasonic pulse velocity and electrical resistivity. Materialia 2023, 29, 101794. [Google Scholar] [CrossRef]
  39. Mendes, S.E.S.; Oliveira, R.L.N.; Cremonez, C.; Pereira, E.; Pereira, E.; Medeiros-Junior, R.A. Electrical resistivity as a durability parameter for concrete design: Experimental data versus estimation by mathematical model. Constr. Build. Mater. 2018, 192, 610–620. [Google Scholar] [CrossRef]
  40. Feng, G.; Wang, Z.; Qi, T.; Du, X.; Guo, J.; Wang, H.; Shi, X.; Wen, X. Effect of velocity on flow properties and electrical resistivity of cemented coal gangue-fly ash backfill (CGFB) slurry in the pipeline. Powder Technol. 2022, 396, 191–209. [Google Scholar] [CrossRef]
  41. Canbek, O.; Washburn, N.R.; Kurtis, K.E. Relating LC3 microstructure, surface resistivity and compressive strength development. Cem. Concr. Res. 2022, 160, 106920. [Google Scholar] [CrossRef]
  42. Zhao, Y.; Qiu, J.; Xing, J.; Sun, X. Chemical activation of binary slag cement with low carbon footprint. J. Clean. Prod. 2020, 267, 121455. [Google Scholar] [CrossRef]
  43. Wang, Y.S.; Meng, L.Y.; Chen, L.; Wang, X.Y. An innovative strategy for CO2 conversion and utilization: Semi-wet carbonation pretreatment of wollastonite to prepare carbon-fixing products and produce LC3. Cem. Concr. Compos. 2025, 160, 106050. [Google Scholar] [CrossRef]
  44. Ylmén, R.; Jäglid, U.; Steenari, B.M.; Panas, I. Early hydration and setting of Portland cement monitored by IR, SEM and Vicat techniques. Cem. Concr. Res. 2009, 39, 433–439. [Google Scholar] [CrossRef]
  45. Wu, J.F.; Qi, F.Y.; Zhang, J.; Chen, Z.W.; Wang, H.L.; Liu, Q.F. Modeling of effect of fly ash amount on microstructure and chloride diffusivity of blended fly ash-cement systems. Constr. Build. Mater. 2024, 443, 137711. [Google Scholar] [CrossRef]
  46. Yang, K.H.; Jung, Y.B.; Cho, M.S.; Tae, S.H. Effect of supplementary cementitious materials on reduction of CO2 emissions from concrete. J. Clean. Prod. 2015, 103, 774–783. [Google Scholar] [CrossRef]
  47. Life Cycle Assessment (LCA) Data of Korea. 2025. Available online: https://www.keiti.re.kr/site/keiti/02/10202100000002023101610.jsp (accessed on 1 September 2025).
  48. Seo, J.; Park, S. Developing an official program to calculate heavy-duty vehicles CO2 emissions in Korea. Transp. Res. Part D Transp. Environ. 2023, 120, 103774. [Google Scholar] [CrossRef]
  49. Shao, S.; Zhu, H.; Guo, M.; Zhang, Y. Application of waste oyster shells in construction: Overview, constitutive modeling, and life cycle assessment. J. Build. Eng. 2024, 87, 108965. [Google Scholar] [CrossRef]
  50. Peceño, B.; Alonso-Fariñas, B.; Vilches, L.F.; Leiva, C. Study of seashell waste recycling in fireproofing material: Technical, environmental, and economic assessment. Sci. Total Environ. 2021, 790, 148102. [Google Scholar] [CrossRef]
  51. Chen, C.; Habert, G.; Bouzidi, Y.; Jullien, A.; Ventura, A. LCA allocation procedure used as an incitative method for waste recycling: An application to mineral additions in concrete. Resour. Conserv. Recycl. 2010, 54, 1231–1240. [Google Scholar] [CrossRef]
  52. Lee, M.; Tsai, W.S.; Chen, S.T. Reusing shell waste as a soil conditioner alternative? A comparative study of eggshell and oyster shell using a life cycle assessment approach. J. Clean. Prod. 2020, 265, 121845. [Google Scholar] [CrossRef]
  53. Han, Y.; Lin, R.; Lim, J.; Wang, X.Y. Enhancing the properties of alkali-activated slag through dry ice addition: Investigation of hydration products and performance characteristics. J. Mater. Res. Technol. 2023, 26, 8983–8996. [Google Scholar] [CrossRef]
Figure 1. (a) The particle size distributions of OPC, OSP, and FA. (b) Cumulative curves of OPC, OSP, and FA.
Applsci 15 11319 g001
Figure 2. The XRD patterns of OSP (a), FA (b), and OPC (c).
Applsci 15 11319 g002
Figure 3. The (a) compressive strength results and (b) percentage of compressive strength at each age of each group compared with the control group.
Applsci 15 11319 g003
Figure 4. (a) The UPV results and (b) the relationship between the UPV and strength.
Applsci 15 11319 g004
Figure 5. The surface resistivity test results.
Applsci 15 11319 g005
Figure 6. (a) The relationship between strength and surface resistivity at 1 d, 3 d, and 7 d; (b) the relationship between strength and surface resistivity at 1 d, 3 d, 7 d, and 28 d.
Applsci 15 11319 g006
Figure 7. (a) shows the hydration heat curve of the mixture, (b) shows the cumulative heat curve of the mixture, (c) shows the hydration heat curve of the mixture per gram of cement, and (d) shows the cumulative heat curve of the mixture per gram of cement.
Applsci 15 11319 g007
Figure 8. The XRD spectra of the mixed paste at 1 d and 28 d.
Applsci 15 11319 g008
Figure 9. The FT-IR spectra of the mixed paste after 1 day (a) and 28 days (b).
Applsci 15 11319 g009
Figure 10. (a) and (b) show the TGA–DTG curves of the mixed paste after 1 day and 28 days, respectively.
Applsci 15 11319 g010
Figure 11. Relationships between the amount of chemically bound water and strength.
Applsci 15 11319 g011
Figure 12. Total global warming potential (GWP) during the life cycle: (a) GWP per unit volume, (b) GWP per unit strength, and (c) GWP per unit strength as a percentage normalized to the REF group.
Applsci 15 11319 g012
Figure 13. Total abiotic resource depletion (AD) during the life cycle: (a) AD per unit volume, (b) AD per unit strength, and (c) AD per unit strength as a percentage normalized to the REF group.
Applsci 15 11319 g013
Figure 14. Total ozone depletion potential (ODP) during the life cycle: (a) ODP per unit volume, (b) ODP per unit strength, and (c) ODP per unit strength as a percentage normalized to the REF group.
Applsci 15 11319 g014
Figure 15. Total acidification potential (AP) during the life cycle: (a) AP per unit volume, (b) AP per unit strength, and (c) AP per unit strength as a percentage normalized to the REF group.
Applsci 15 11319 g015
Figure 16. Total eutrophication potential (EP) during the life cycle: (a) EP per unit volume, (b) EP per unit strength, and (c) EP per unit strength as a percentage normalized to the REF group.
Applsci 15 11319 g016
Figure 17. Total photochemical ozone creation potential (POCP) during the life cycle: (a) POCP per unit volume, (b) POCP per unit strength, and (c) POCP per unit strength as a percentage normalized to the REF group.
Applsci 15 11319 g017
Table 1. The chemical composition of OPC, OSP, and FA.
Chemical CompositionOPC
(wt%)
OSP
(wt%)
FA
(wt%)
Al2O34.640.19022.10
SiO218.800.57749.50
Fe2O32.730.6526.78
CaO62.5055.105.77
MgO2.240.5350.866
TiO20.23701.28
Na2O0.1450.7470.621
K2O0.9080.3121.23
SO33.610.5770.641
P2O50.1770.2100.431
SrO0.0820.1670.122
Other3.450.59410.31
LOI.0.48240.900.329
Table 2. The cement/mortar mass ratio.
Sample NameOPC
(%)
FA
(%)
OSP
(%)
Sand
(%)
Water
(%)
w/bSand/Binder
REF10000250500.52.5
FA2080200250500.52.5
OSP2080020250500.52.5
FA15OSP580155250500.52.5
Table 3. Component density.
OSPOPCFASandWater
ρ (kg/m3)26703150235026001000
Table 4. The cement/mortar mass mix ratio.
Mass (kg/m3)
Sample NameOPCFAOSPSandWater
REF575.2001438.1287.6
FA20451.3112.801410.4282.1
OSP20456.40114.11426.2285.2
FA15OSP5452.684.928.31414.3282.9
Table 5. The proportion of cement paste.
Sample NameOPC (%)FA (%)OSP (%)Water (%)
REF1000050
FA208020050
OSP208002050
FA15OSP58015550
Table 6. The cement/paste mass mix ratio.
Mass (kg/m3)
Sample NameOPCFAOSPWater
REF1230.800615.4
FA20944.9236.20590.6
OSP20967.40241.9604.7
FA15OSP5950.5178.259.4594.1
Table 7. The test methods and test age.
NumberTest MethodTest Age (Days)Standard Sizes/TypesPurpose
1Compressive strength13728Mortar (50 mm × 50 mm × 50 mm)Mechanical properties
2UPVMortar (40 mm × 40 mm × 160 mm)Mechanical properties
3Surface resistivityMortar (40 mm × 40 mm × 160 mm)Durability
4Heat of hydration-Pure paste (powder)Hydration kinetics
5XRD--Pure paste (powder)Phase identification
6TGA--Pure paste (powder)Phase identification
7FT-IR--Pure paste (powder)Phase identification
8LCA----Sustainability
Table 8. Chemically bound water.
Name/Day128
REF11.14%23.63%
FA208.90%19.31%
OSP209.94%19.90%
FA15OSP59.12%19.21%
Table 9. Calcium hydroxide.
Name/Day128
REF10.86%20.06%
FA208.24%16.76%
OSP208.97%16.87%
FA15OSP58.03%16.37%
Disclaimer/Publisher’s Note: The statements, opinions and data contained in all publications are solely those of the individual author(s) and contributor(s) and not of MDPI and/or the editor(s). MDPI and/or the editor(s) disclaim responsibility for any injury to people or property resulting from any ideas, methods, instructions or products referred to in the content.