1. Introduction
China’s strategic westward shift in coal mining has concentrated extraction in its principal western provinces. As a result, the combined output from three key regions (Inner Mongolia, Shanxi, and Shaanxi) now accounts for over 60% of the national total, up from approximately 40% [
1]. However, these western mining areas are characterized by a critical geomechanical challenge: thick, weakly cemented, and friable Jurassic strata overlying the coal seams. These strata exhibit low stability and are acutely sensitive to high-stress perturbations from intensive mining. This vulnerability leads to pronounced lateral and vertical overburden movement, manifesting as (i) substantial subsidence; (ii) significant discontinuous rock mass deformation, which prevents the formation of stable overlying structures [
2]; and (iii) extensive caving zones and water- or sand-conducting fracture networks. These conditions create preferential pathways for gas migration and water/sand inrushes, undermining the stability of underground roadways [
3]. In extreme instances, mining-induced fractures can propagate to the surface, leading to large-scale deformations such as ground fissures and step-like subsidence and ultimately triggering secondary geohazards [
4,
5,
6].
Surface fissures (a and b in
Figure 1) and Surface subsidence (c and d in
Figure 1) pose serious hazards to mining areas in western China, causing extensive damage to infrastructure, threatening the safety of residents’ lives, and causing serious impacts on the ecological environment. According to statistics, disasters in China have claimed a large number of lives, and the area of damaged arable land is also relatively large.
The evolution of overlying strata fractures during mining has been extensively investigated through experimental, numerical, and theoretical approaches. For instance, Gao et al. [
7] identified trapezoidal fracture zones in overlying strata after distant protective seam extraction, revealing control mechanisms for strata movement and stress distribution. Examining fracture evolution above a shallow longwall panel beneath a gully, Miao et al. [
8] concluded that mining height is the principal determinant of the water-conducting fracture zone’s height under these conditions. UDEC simulations by Wang et al. [
9] revealed that topography significantly influences overburden dynamics and fracture evolution, a process they categorized into three stages, noting that the geomechanical response beneath the gully is more pronounced than in adjacent areas. Further research by Guo et al. [
10] used numerical modeling to analyze fracture propagation during longwall mining, establishing a correlation between fracture zone height, mining depth, and seam inclination. Their work also linked gas emission rates to the dynamic evolution of fracture permeability. Integrating theoretical analysis with FLAC3D modeling and in-situ monitoring, Cao et al. [
11] studied water-conducting fracture evolution beneath a water-rich fault. They found that the fault alters the fracture zone height and subsequently proposed criteria for fault activation. Similarly, Chen et al. [
12] combined physical experiments, image recognition, and COMSOL simulations, identifying that long-term fracture evolution in goaf overburden exhibits distinct closure and migration characteristics. This led to a nonlinear mapping model correlating fracture gas conductivity with spatiotemporal scales. Additionally, modeling by Huang et al. [
13] indicated that as a working face traverses a fault, overburden fractures develop rapidly, causing significant bed separation and rock failure. Through physical simulations, Li et al. [
14] concluded that mining-induced fracture development progresses through distinct phases: an initial period of slow dimensional growth, followed by rapid acceleration, and finally stabilization during peak production.
Regarding the development of surface fractures, Liu et al. [
15] employed integrated GPS and GPR techniques combined with statistical data analysis to demonstrate that surface fissures can be classified into two main types: dynamic fissures, which develop rapidly and exhibit a high self-healing capacity, and permanent fissures, which inflict sustained damage on the ecological environment. Zhu et al. [
16] developed a two-dimensional UDEC geological model to evaluate the influence of mining factors on the types and extent of ground fissures. Their work identified step-type fissures, sliding fissures, and graben-type fissures as the primary forms of fissure development. In a related study, Li et al. [
17] utilized field monitoring coupled with numerical simulations to examine the development patterns and formation mechanisms of surface cracks under varying mining conditions. Their analysis revealed the developmental behavior and mechanical origins of four crack types: tensile, compressive, collapse, and sliding cracks. Zhou et al. [
18] analyzed the dynamic evolution of surface fractures by integrating key stratum and mining subsidence theories. They identified a bimodal, bi-cyclic “M-shaped” evolutionary process, attributing it to the combined effects of main roof caving and main key stratum instability. In the shallowly buried, deep coal seams of the Shendong mining area, He et al. [
19] investigated the formation of step-type and tensile-type fractures, the area’s predominant failure modes. They determined that step-type fractures are induced by shear failure in the overlying aeolian sand layer, triggered by the sliding instability of the main key stratum. In contrast, tensile fractures result from horizontal tensile stress exceeding the surface deformation threshold. Yang et al. [
20] utilized Integrated InSAR and FLAC3D numerical modeling to analyze stress variations in the surface soil layer resulting from groundwater extraction. Their results demonstrate that pumping activities accelerate surface subsidence, thereby leading to the development of surface fissures. By combining microseismic monitoring with fractal geometry, Liu et al. [
21] discovered that the fractal dimension of overburden fractures oscillates periodically as the mining face advances. This finding led to the development of a cubic predictive model relating fracture evolution to the face advance distance. Through a combination of field measurements, theoretical analysis, and comparative studies, Xu et al. [
22] demonstrated that in the aeolian sand region of Ordos, weak soil cohesion leads to a distinct “expansion-closure” cycle in mining-induced surface fractures, thereby clarifying their formation mechanism. Ling et al. [
23] utilized a comprehensive methodology, combining field investigations, laboratory tests, theoretical analysis, and numerical modeling, to investigate the formation and evolutionary mechanisms of mining-induced surface fractures in the shallow coal seams of the Shendong mining area. Similarly, by integrating borehole exploration, physical similarity modeling, and field measurements, it was found that in the Yushenfu mining area, a region characterized by thin bedrock and thick unconsolidated overburden, surface fractures exhibit a dynamic “opening–closing” process [
24]. This phenomenon is spatiotemporally synchronized with overburden caving and the associated redistribution of internal stress.
Extensive research employing theoretical analysis, numerical simulation, and physical similarity modeling has significantly advanced the understanding of overburden fracture evolution and surface fracture development. However, few studies have utilized numerical simulations to systematically investigate the factors governing these processes. To address this gap, this study focuses on the 12,401 working face (“1” represents the first coal seam, “2” represents the second panel area, and “401” represents the 401 working face.) in the Shendong mining area, employing Discrete Element Method (DEM) simulations. By integrating field observations and a subsidence calculation model, this approach provides an effective method for analyzing the spatial evolution of overburden fractures and the development characteristics of surface fractures under different conditions. The findings offer a theoretical basis for developing strategies to mitigate surface damage.
2. An Analysis of the Geomorphological Evolution and Its Formation Mechanisms in the Shendong Mining Area
2.1. A Classification of Surface Fissures
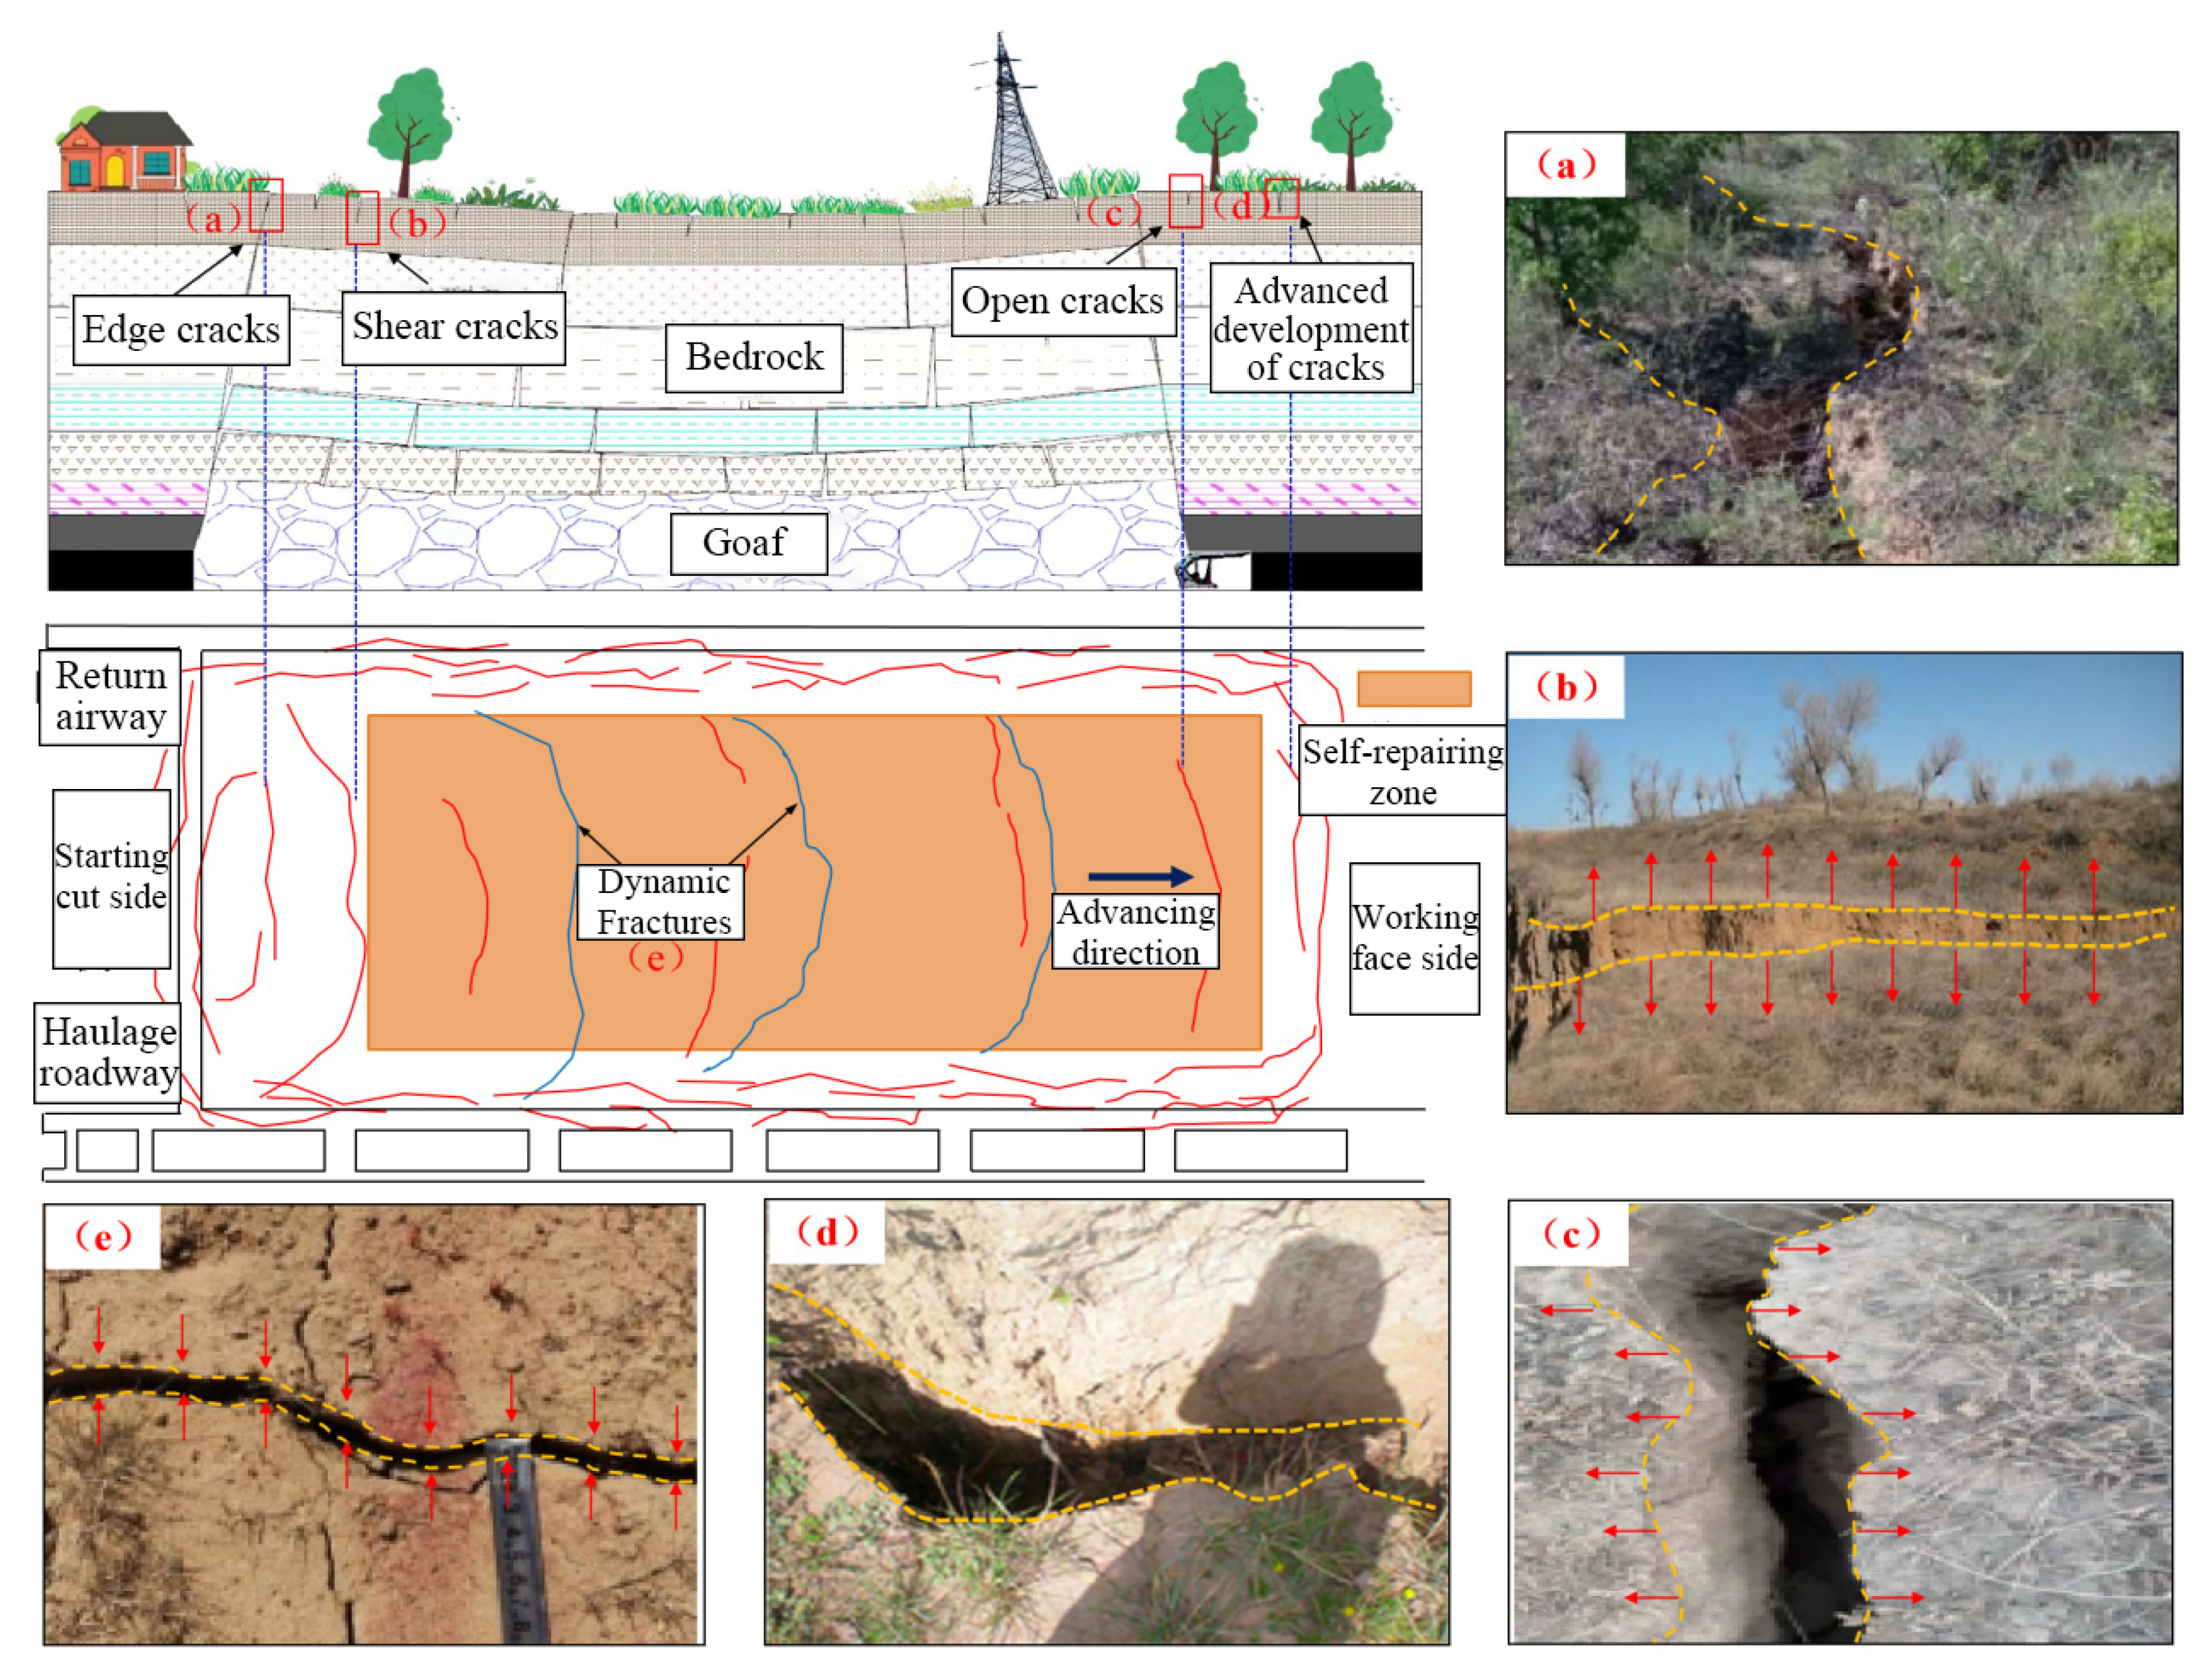
Mining-induced surface fractures constitute a typical form of non-linear mechanical damage in coal mining regions. These fractures develop when surface deformation exceeds its ultimate limit, driven by the coupled effects of overburden movement above the goaf and topsoil deformation. Based on their morphology and mechanical characteristics, they are classified into four main types: tensile, compressive, shear, and collapse fractures. As shown in
Figure 2.
- (1)
Tensile Fractures
Tensile Fractures are an imbalance that affects natural gas extraction and release, as well as a pathway for water inrush accidents, posing a serious threat to underground safety production. It occur primarily within the tensional zone of the subsidence basin and ahead of the advancing working face. Their defining morphological feature is a horizontal aperture that substantially exceeds their vertical displacement. With the advance of the working face, fracture aperture and displacement increase as they propagate to greater depths. At the edge of the subsidence basin, the downward propagation of these fractures ceases after reaching a certain depth.
- (2)
Compressive Fractures
Under the disturbance of mining stress, Compressive Fractures are easy to activate and conduct unknown water or gas leaks. It occur predominantly in the central part of the surface subsidence basin. Their defining characteristic is a closed or compressed state. Where compressive deformation exceeds the topsoil’s strength limit, dynamic fractures in this zone undergo a three-stage “initiation–expansion–closure” process. This fracture type typically poses minimal risk to surface ecology and mine safety.
- (3)
Shear Fractures
Shear fractures can directly damage the integrity and stability of the roof structure and are a direct precursor to major engineering disasters such as working face collapse and large-scale roadway roof collapse. Shear fractures develop primarily directly above the working face, over the goaf, and on the surface during uphill mining. Their morphology is defined by significant vertical displacement and minimal horizontal opening, creating a step-like feature on the surface. These fractures often extend from the surface directly to the working face.
- (4)
Collapse Fractures
Collapse Fractures may induce shock waves and surface collapse, seriously endangering the safety of surface industrial square facilities and personnel. They form primarily directly above the working face and over the goaf, lagging a certain distance behind the face. Their morphology is defined by a large central opening resulting from a collapse that connects the surface to the goaf. Towards the fracture tips (or wings), the aperture diminishes and vertical displacement becomes negligible, with the fracture morphology resembling that of a tensile fracture.
2.2. The Formation Mechanisms of Ground Fissures
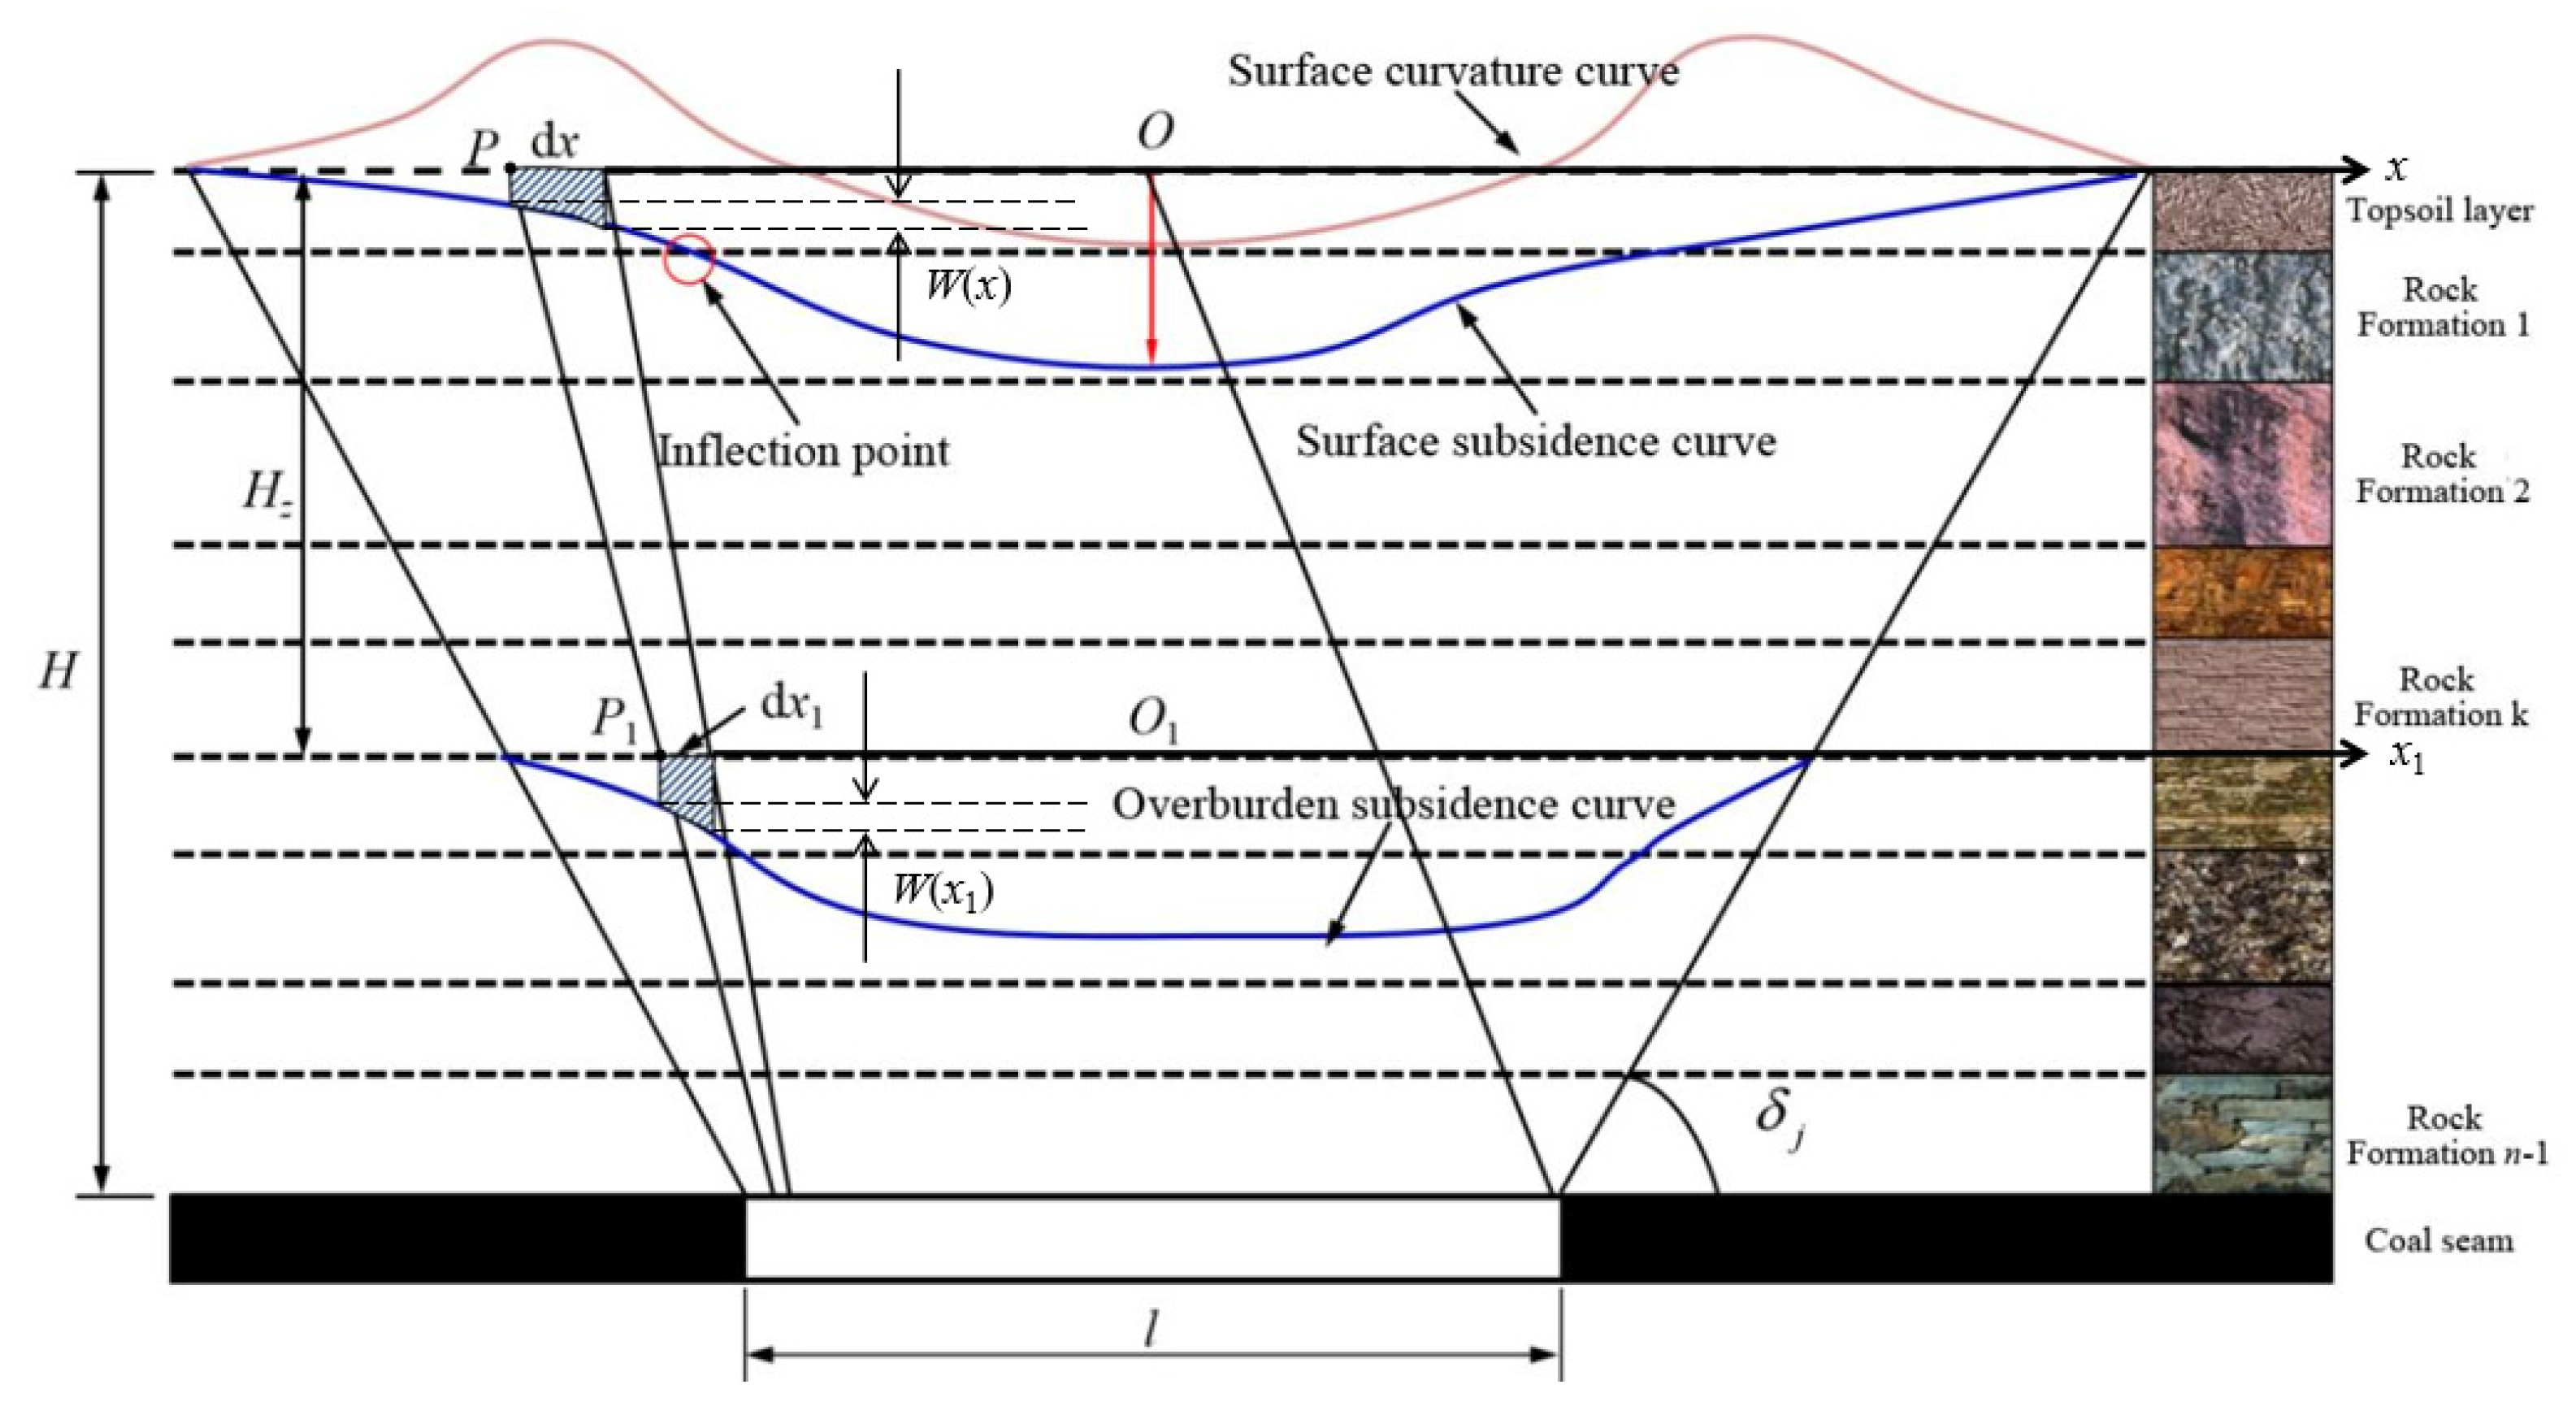
Mining-induced surface fractures result from the upward propagation of overburden failure, which is initiated by coal seam extraction. This process causes differential settlement of the overburden, which in turn induces tensional or shear stresses within the topsoil of the subsidence basin. According to the different forms of crack development and stress conditions, combined with the location of crack development and the characteristics of rock beam fracture, surface cracks are divided into two types based on the causes of stress failure: cracks caused by tensile stress and cracks caused by shear stress. As illustrated by point P in
Figure 3, the differential horizontal displacement d(x) between two adjacent surface points defines the fracture’s horizontal aperture. Similarly, the differential vertical displacement, W(x), defines its vertical offset. A fracture is classified as tensile when it is characterized by a large d(x) and a small W(x). Conversely, a fracture exhibiting a large W(x) and a small d(x) is classified as a shear fracture. Soil is most susceptible to failure under tension, followed by shear. The formation mechanisms of these fracture types can be further investigated using methods such as the probability integral method and elastic theory.
2.3. The Evolutionary Patterns of Fractures in the Shendong Mining Area
The evolution of surface fractures is directly correlated with the advance of the working face, as illustrated in
Figure 4. Based on their distribution and behavior, these fractures are classified into two main types: edge fractures and dynamic fractures.
- (1)
Edge Fractures
Edge fractures form primarily at the surface peripheries above the starting line, stopping line, and gateways, corresponding to the zone of maximum tensional strain within the subsidence basin. A few permanent fractures may also develop just beyond the goaf perimeter. These fractures are typically under tension and exhibit a distinct “opening-only” characteristic, remaining permanently open after reaching their maximum aperture. Their formation typically begins with the appearance of 3 to 5 long, arc-shaped fractures, which subsequently develop and coalesce into a dynamic “O-shaped” ring as the working face advances.
- (2)
Dynamic Fractures
Dynamic fractures are the surface expression of overburden deformation and failure, driven by the advancing working face. They undergo a characteristic “initiation–expansion–closure” process. Coal seam extraction removes support from the overlying strata, inducing their mobilization and subsequent plastic yield failure. The resulting stress imbalance propagates to the surface, causing differential subsidence. Failure occurs when horizontal surface deformation exceeds the topsoil’s ultimate strain limit, resulting in fractures that propagate from the failure plane and compromise surface integrity.
As mining progresses, the overburden directly above the working face remains intact, supported by the unmined coal, and thus experiences no downward displacement. Behind the face, however, the continuity of the overburden is disrupted as the main roof periodically fractures and collapses. This collapse generates significant vertical displacement, which can intersect existing surface fractures. At this stage, the surface fractures reach their maximum development. Simultaneously, the strata in this zone undergo tensional deformation, causing the fractures to widen and slowly extend in the direction of face advance, forming an inverted “C” shape on the surface that is concave towards the starting cut. Subsequently, as the goaf expands, the unsupported immediate roof progressively collapses, inducing further downward displacement. This process reduces the differential vertical displacement within the rock mass. When this effect propagates to the surface, the fractures enter a state of horizontal compression, and their aperture diminishes until closure. This cyclical process forms a series of dynamic fractures on the surface, typically arranged in a parallel, intermittently spaced pattern. The development of surface cracks during mining operations compromises surface infrastructure and creates pathways for surface water to infiltrate underground aquifers, resulting in water pollution and soil erosion. These effects collectively pose significant risks to both mining safety and residential well-being.
Based on the distribution of surface fractures in the Shendong mining area and established mining subsidence theory, the following conclusions and models were developed to further investigate the relationship between overburden behavior and surface subsidence: (1) Following coal seam extraction, both the overburden and the surface displace towards the goaf [
30]. (2) Assuming negligible bulking of the overlying strata from stress relief, the cross-sectional area of the main surface subsidence profile is equivalent to that of any underlying horizontal stratum [
31]. (3) The radius of major influence, determined by the movement boundary angle, can be calculated using Equation (1) [
32]:
where
is the radius of major influence for horizontal stratum
, determined by the overburden boundary angle,
(m);
is the mining depth (m);
is the burial depth of horizontal stratum
(m);
is the a lithological parameter of the overburden; and
is the surface radius of major influence, determined by the surface movement boundary angle,
(m). For analytical simplification, a linear relationship between the overburden and surface radii of major influence is assumed (with
), which implies that
. The following analysis is therefore founded on these three established principles.
With respect to the strata movement shown in
Figure 3, the radius of surface influence (
r) is defined as:
where
l is the advance distance of the working face (m).
To formalize this relationship, a coordinate system is established with its origin at the center of the surface subsidence basin (Point
). Let Point
be the location of maximum surface curvature, having coordinates
and a subsidence value
. Surface Point
corresponds to Point
, with its counterpart in a horizontal overburden stratum, along the line of movement, having coordinates
and subsidence
. The relationship between the coordinates of the surface point
and the overburden point
is then expressed as:
For an infinitesimal surface element
and its corresponding element
in the overburden, When the micro units are small enough, the corresponding surface subsidence area and overlying rock subsidence area are equal. Therefore, Formula (4) can be obtained:
Substituting the derivative of Equation (3) into Equation (5) and simplifying yields Equation (6). This equation models the relationship between the subsidence at the point of maximum surface curvature
and the movement of its corresponding overburden point
:
Equation (6) is used to estimate the value of
W(
x1), and the value of
W(
x1) at point
P1 is obtained by the corresponding value of
W(
x) sinking at point
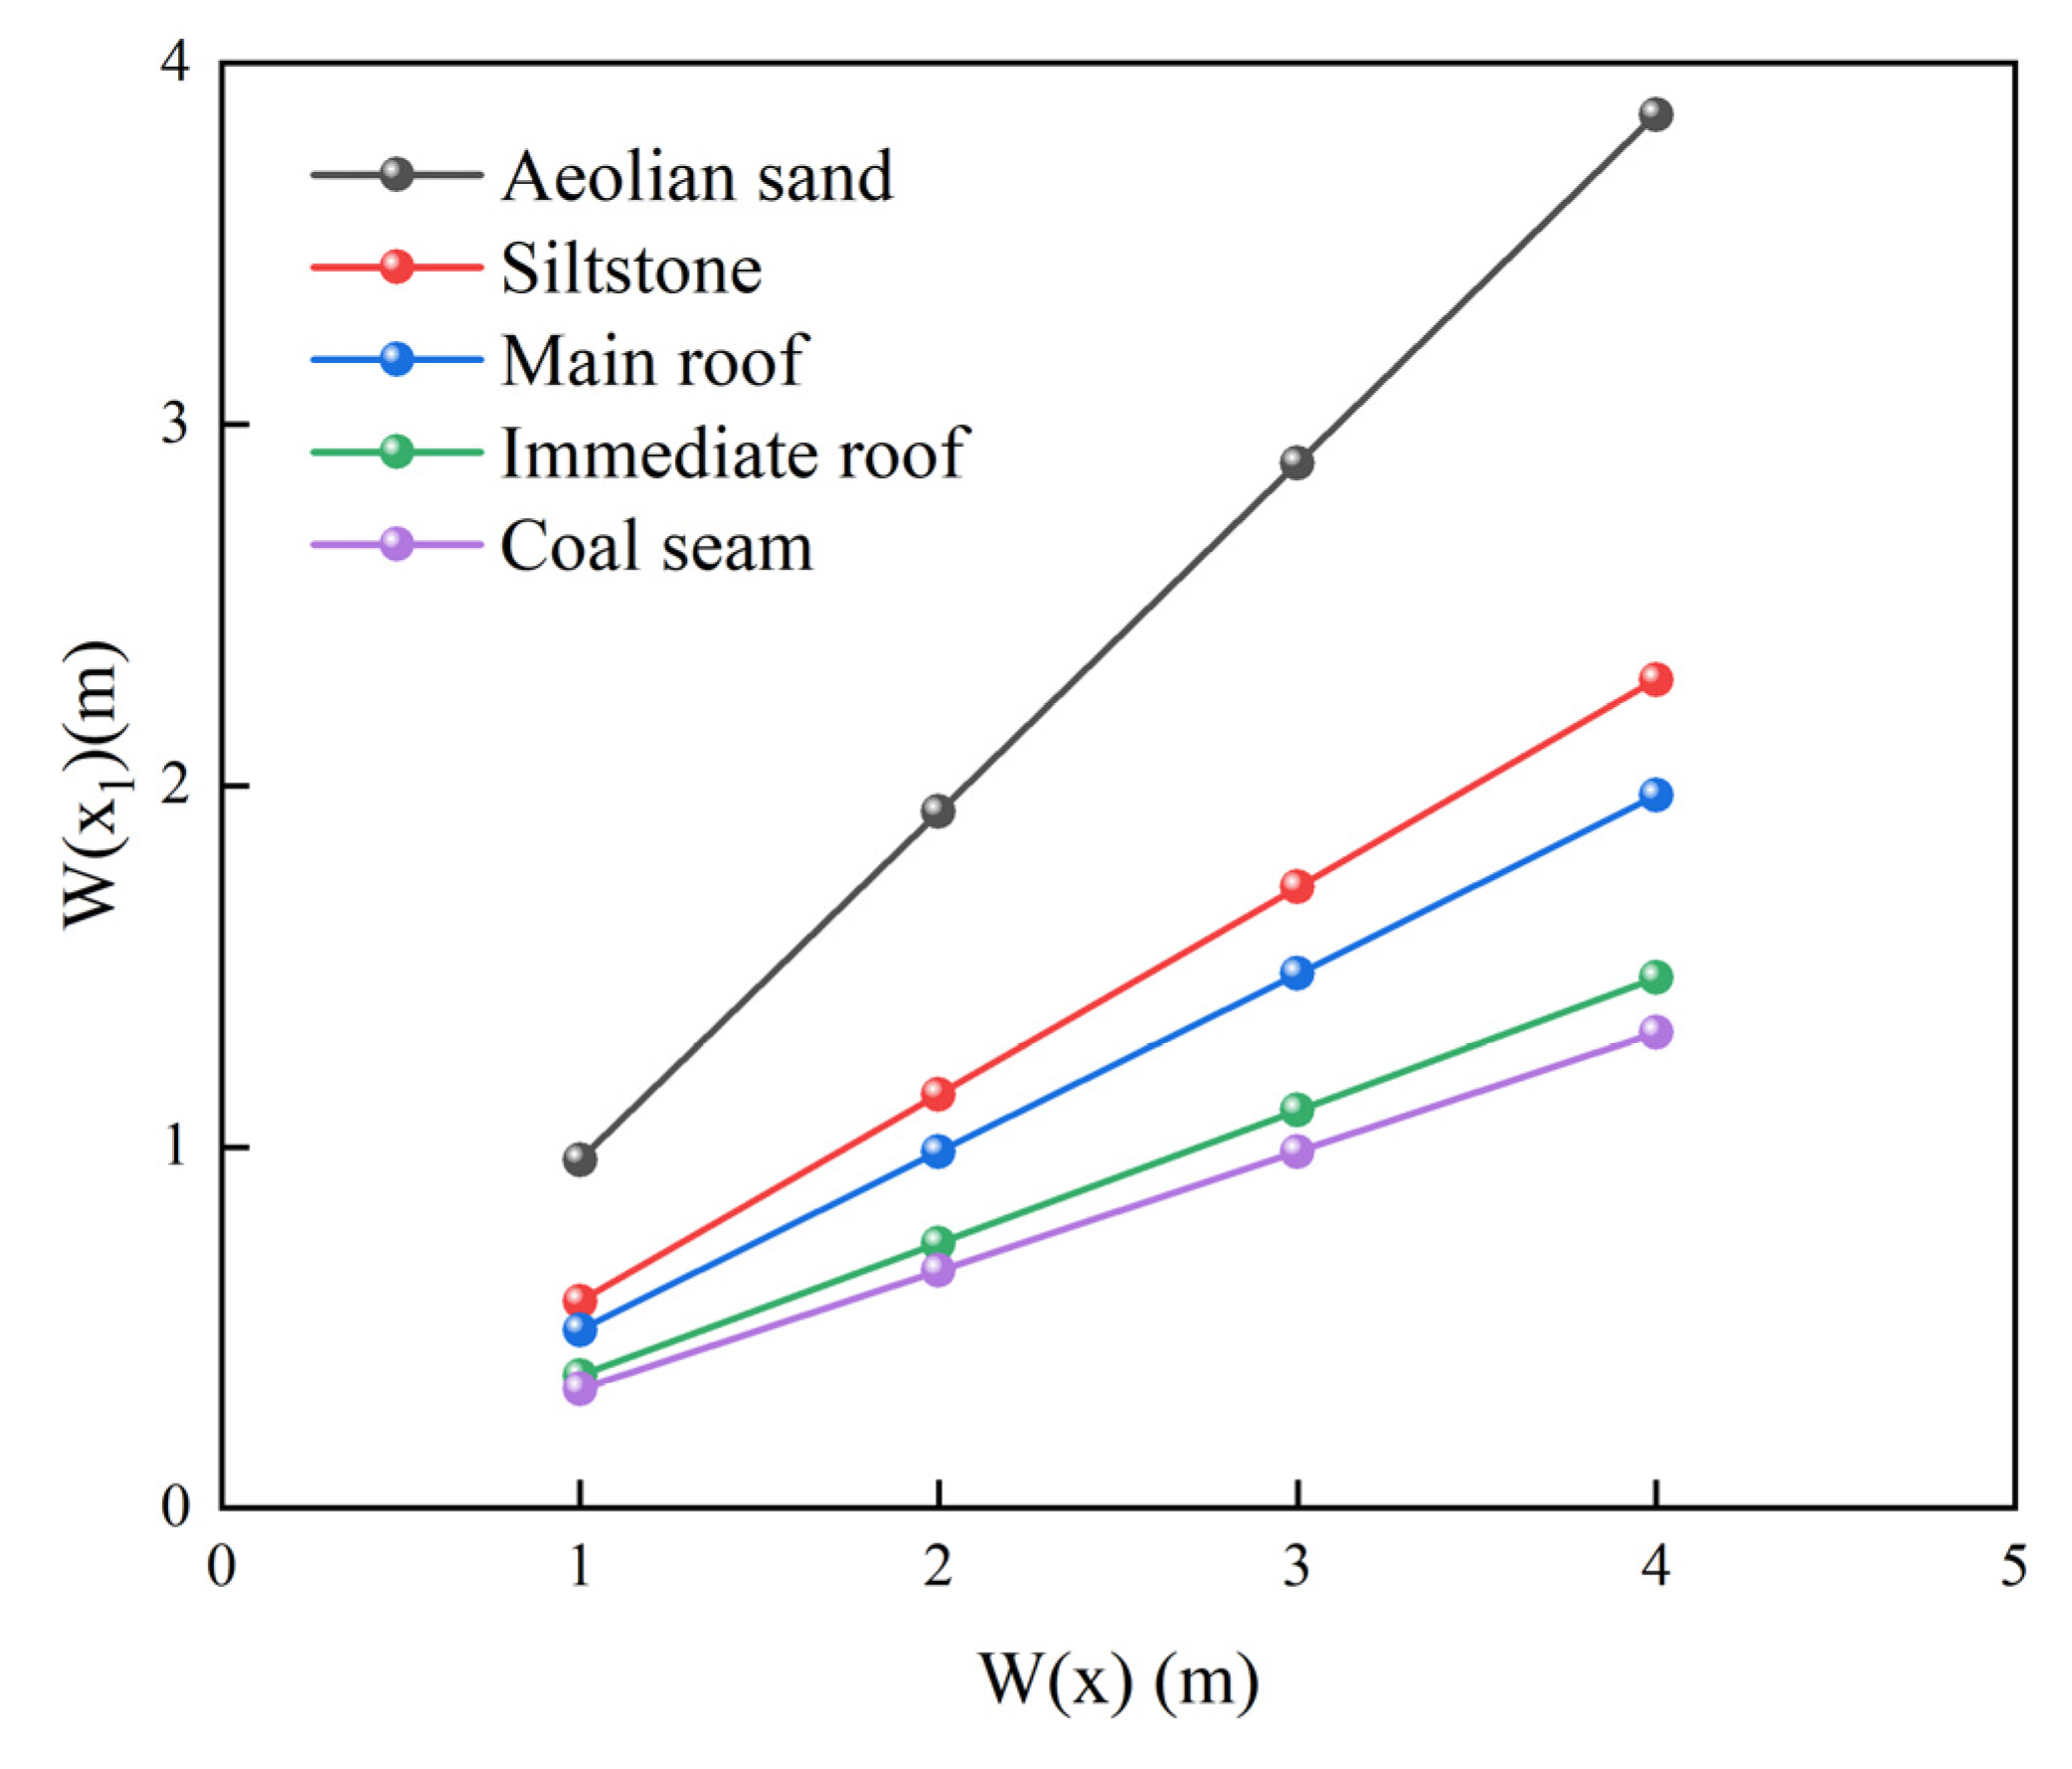
P based on surface measurements. For example, based on the sinking values of the origin and its extension points, formula (6) can be used for calculation. When the value of
W(
x) is different, the resulting value of
W(
x1) is also different, as shown in
Figure 5.
4. Numerical Modeling of the Evolution of Mining-Induced Overburden and Surface Fractures
4.1. Numerical Modeling of Panel 12,401 in the Shangwan Coal Mine
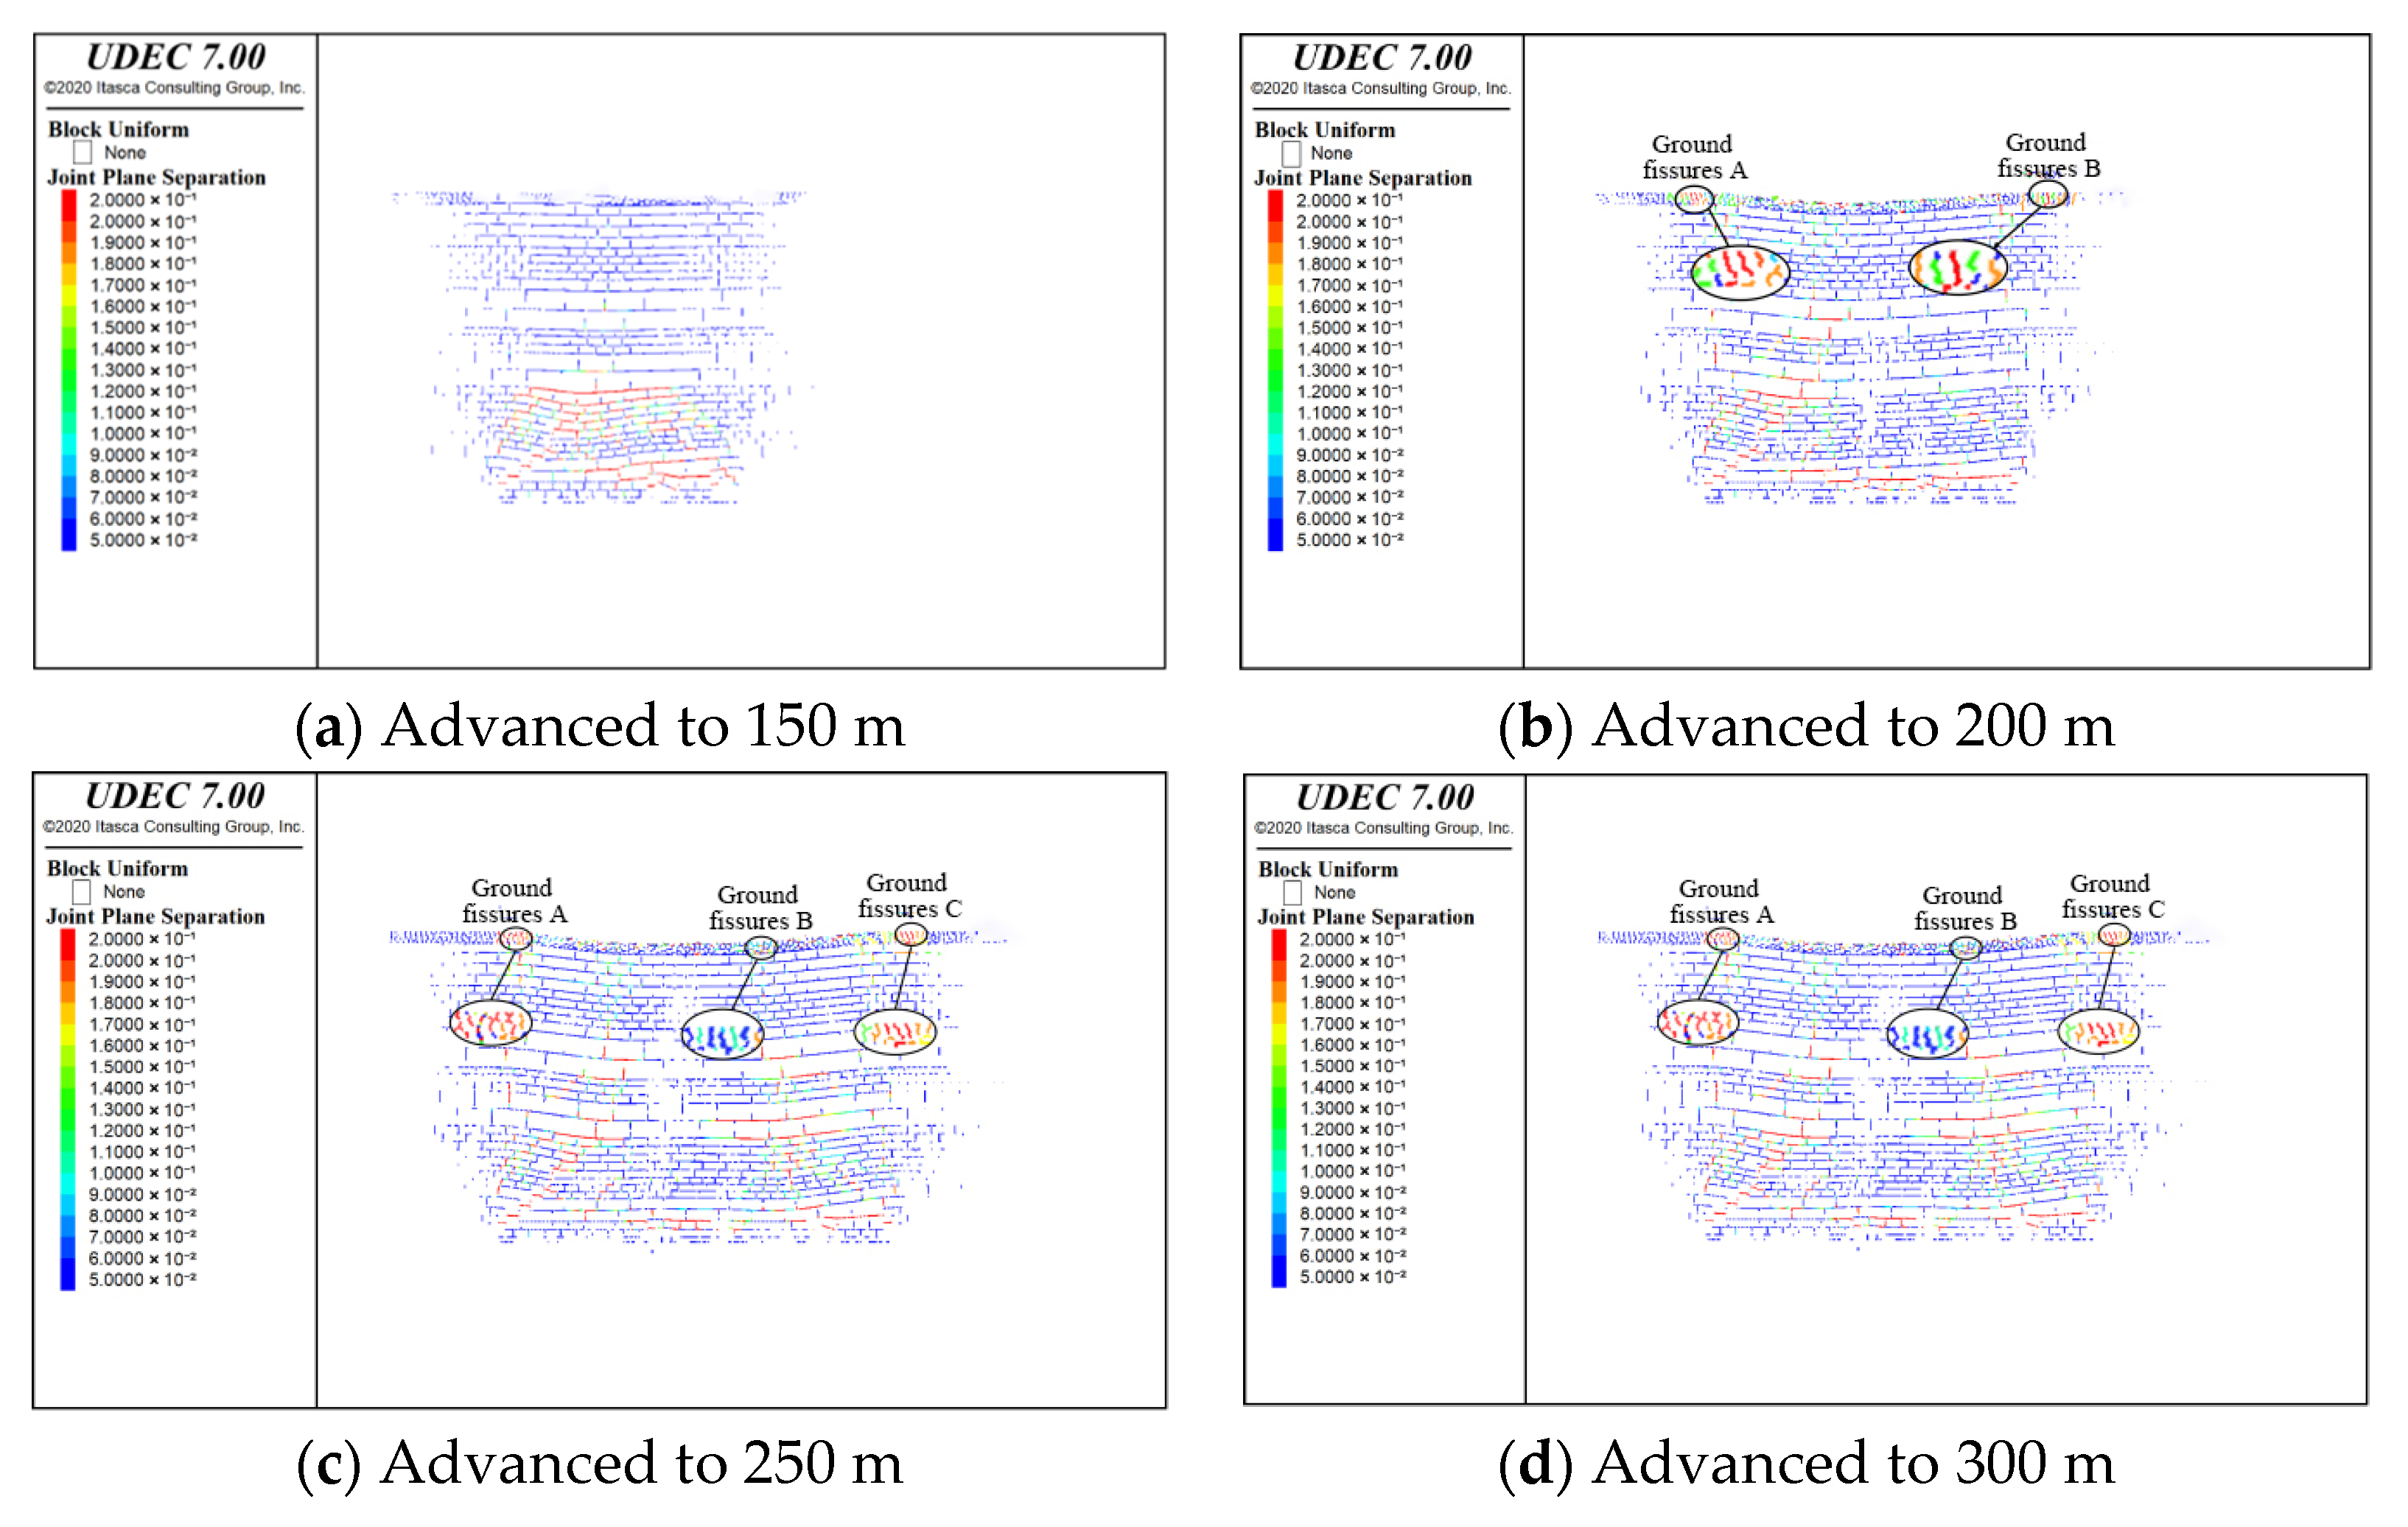
As shown in
Figure 9 and
Figure 10, In the initial stage of working face advance, the caving of the overlying strata in the goaf is not significant, and rock failure does not propagate upward to the shallower strata, leaving no space for the deformation of the surface soil. Consequently, the horizontal aperture of surface fractures remains at zero.
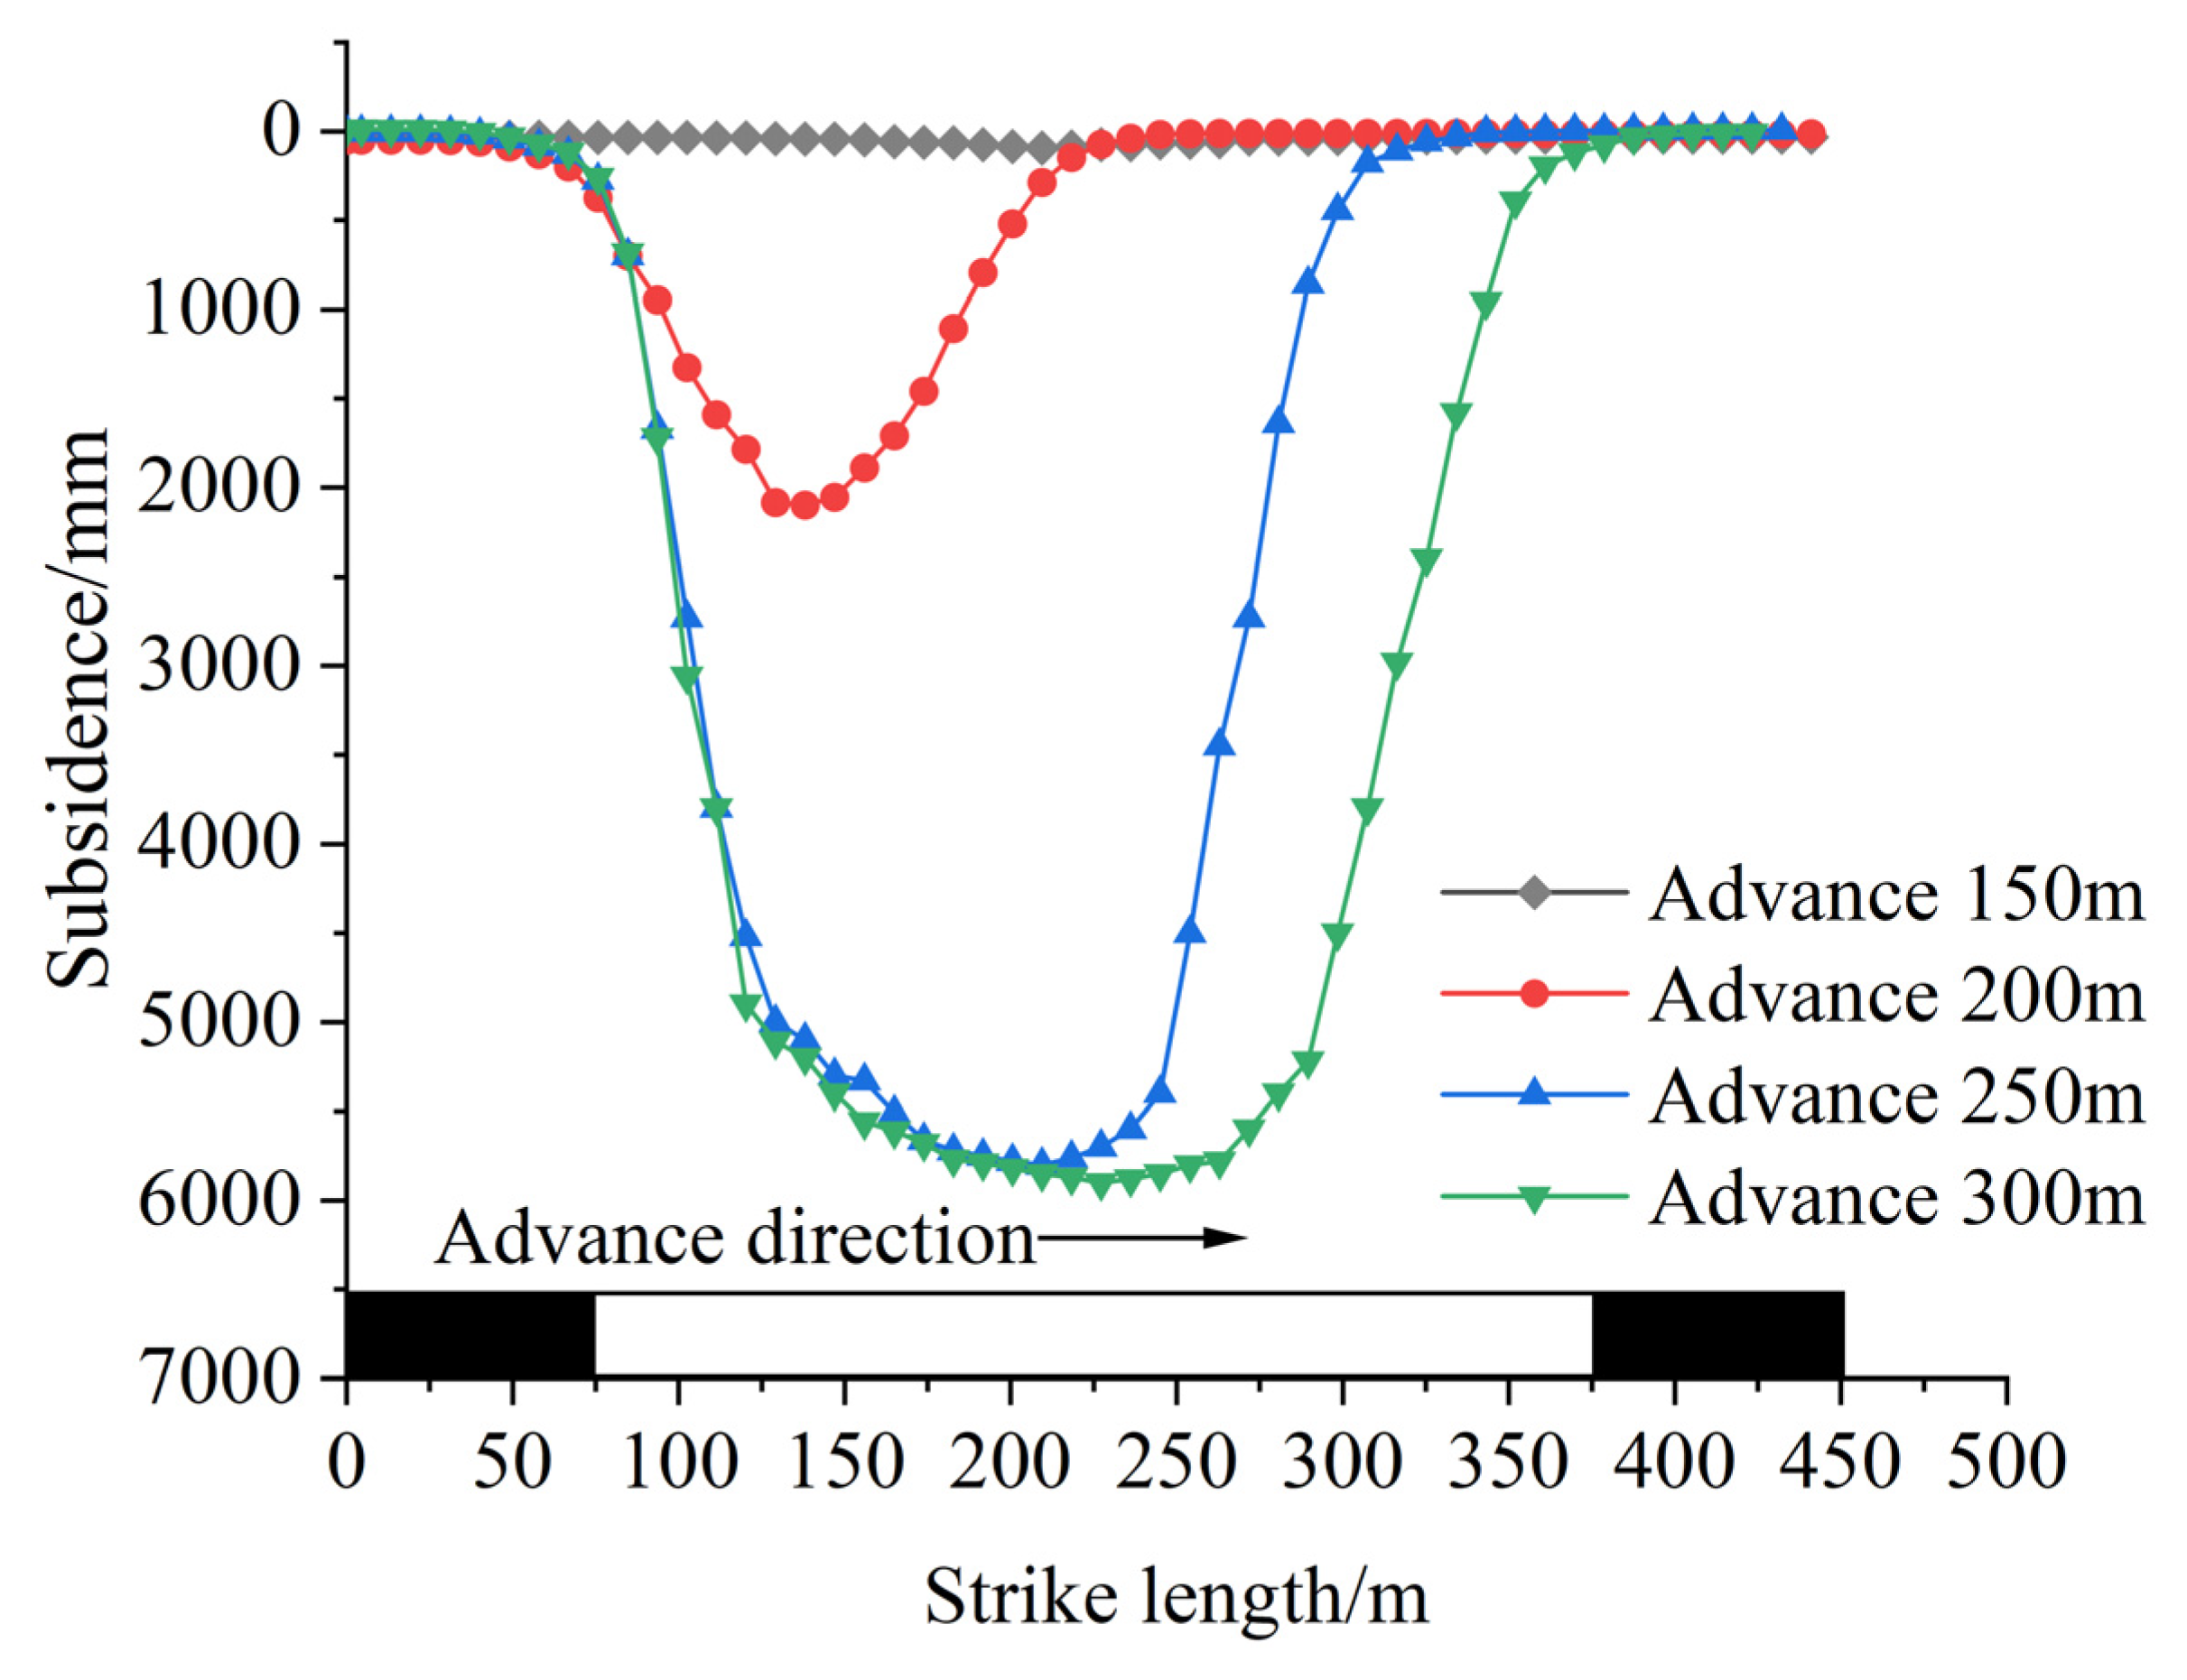
When the working face advanced to 200 m, a tension fissure formed on the surface 9 m behind the open-off cut. This location corresponded to the approximate point of maximum curvature at the margin of the surface subsidence basin. Under tensile stress directed towards the goaf, the fissure tilted discernibly in that direction. Simultaneously, mining-induced fractures in the overlying strata propagated to the surface, creating edge fissure A with a horizontal aperture of approximately 195 mm. A second ground fissure (B) also emerged approximately 11 m ahead of the working face, exhibiting the largest observed horizontal aperture at 204 mm.
As the working face advanced to 250 m, fissure A remained stationary. Positioned at the margin of the subsidence basin and thus subjected to perpetual tensile stress, its horizontal aperture progressively widened to a maximum of 215 mm. In contrast, fissure B transitioned from an initial state of tension to one of horizontal compression; its aperture consequently diminished and proceeded to close. Simultaneously, a new fissure (designated C) emerged on the surface approximately 13 m ahead of the working face, reaching a maximum horizontal aperture of approximately 210 mm.
As the working face advanced, new ground fissures continuously formed near its surface position. The aperture of fissure A remained largely unchanged, exhibiting a distinct non-closing behavior, while the dynamic evolution of fissure C was analogous to that of fissure B. After mining ceased and the model reached equilibrium, a final edge fissure (D) formed on the surface approximately 17 m ahead of the stopping line, with an aperture of about 229 mm. Within the central region of the subsidence basin, ground fissures were generated in tandem with the advancing face. Following the passage of the working face, the apertures of these central fissures progressively diminished and ultimately closed. This cyclical process produced a series of closed fissures in a parallel, intermittently spaced array across the surface. As shown in
Figure 11, the edge fissures at the margins of the subsidence basin were significantly wider and deeper than the transient fissures in the basin’s center. This dimensional disparity is attributable to greater soil deformation in these peripheral zones. Post-extraction, the apertures of most surface fissures ranged from 180 mm to 230 mm, reaching a maximum of 265 mm. These persistent and partially permanent ground fissures can damage the integrity and stability of ground infrastructure such as roads and houses, opening up fast pathways for surface pollutants to directly enter underground aquifers. At the same time, they can also damage crop yields, leading to economic losses and safety accidents.
4.2. Numerical Simulation of the Effects of Varying Mining Heights
- (1)
Effect of Mining Height on Surface Subsidence
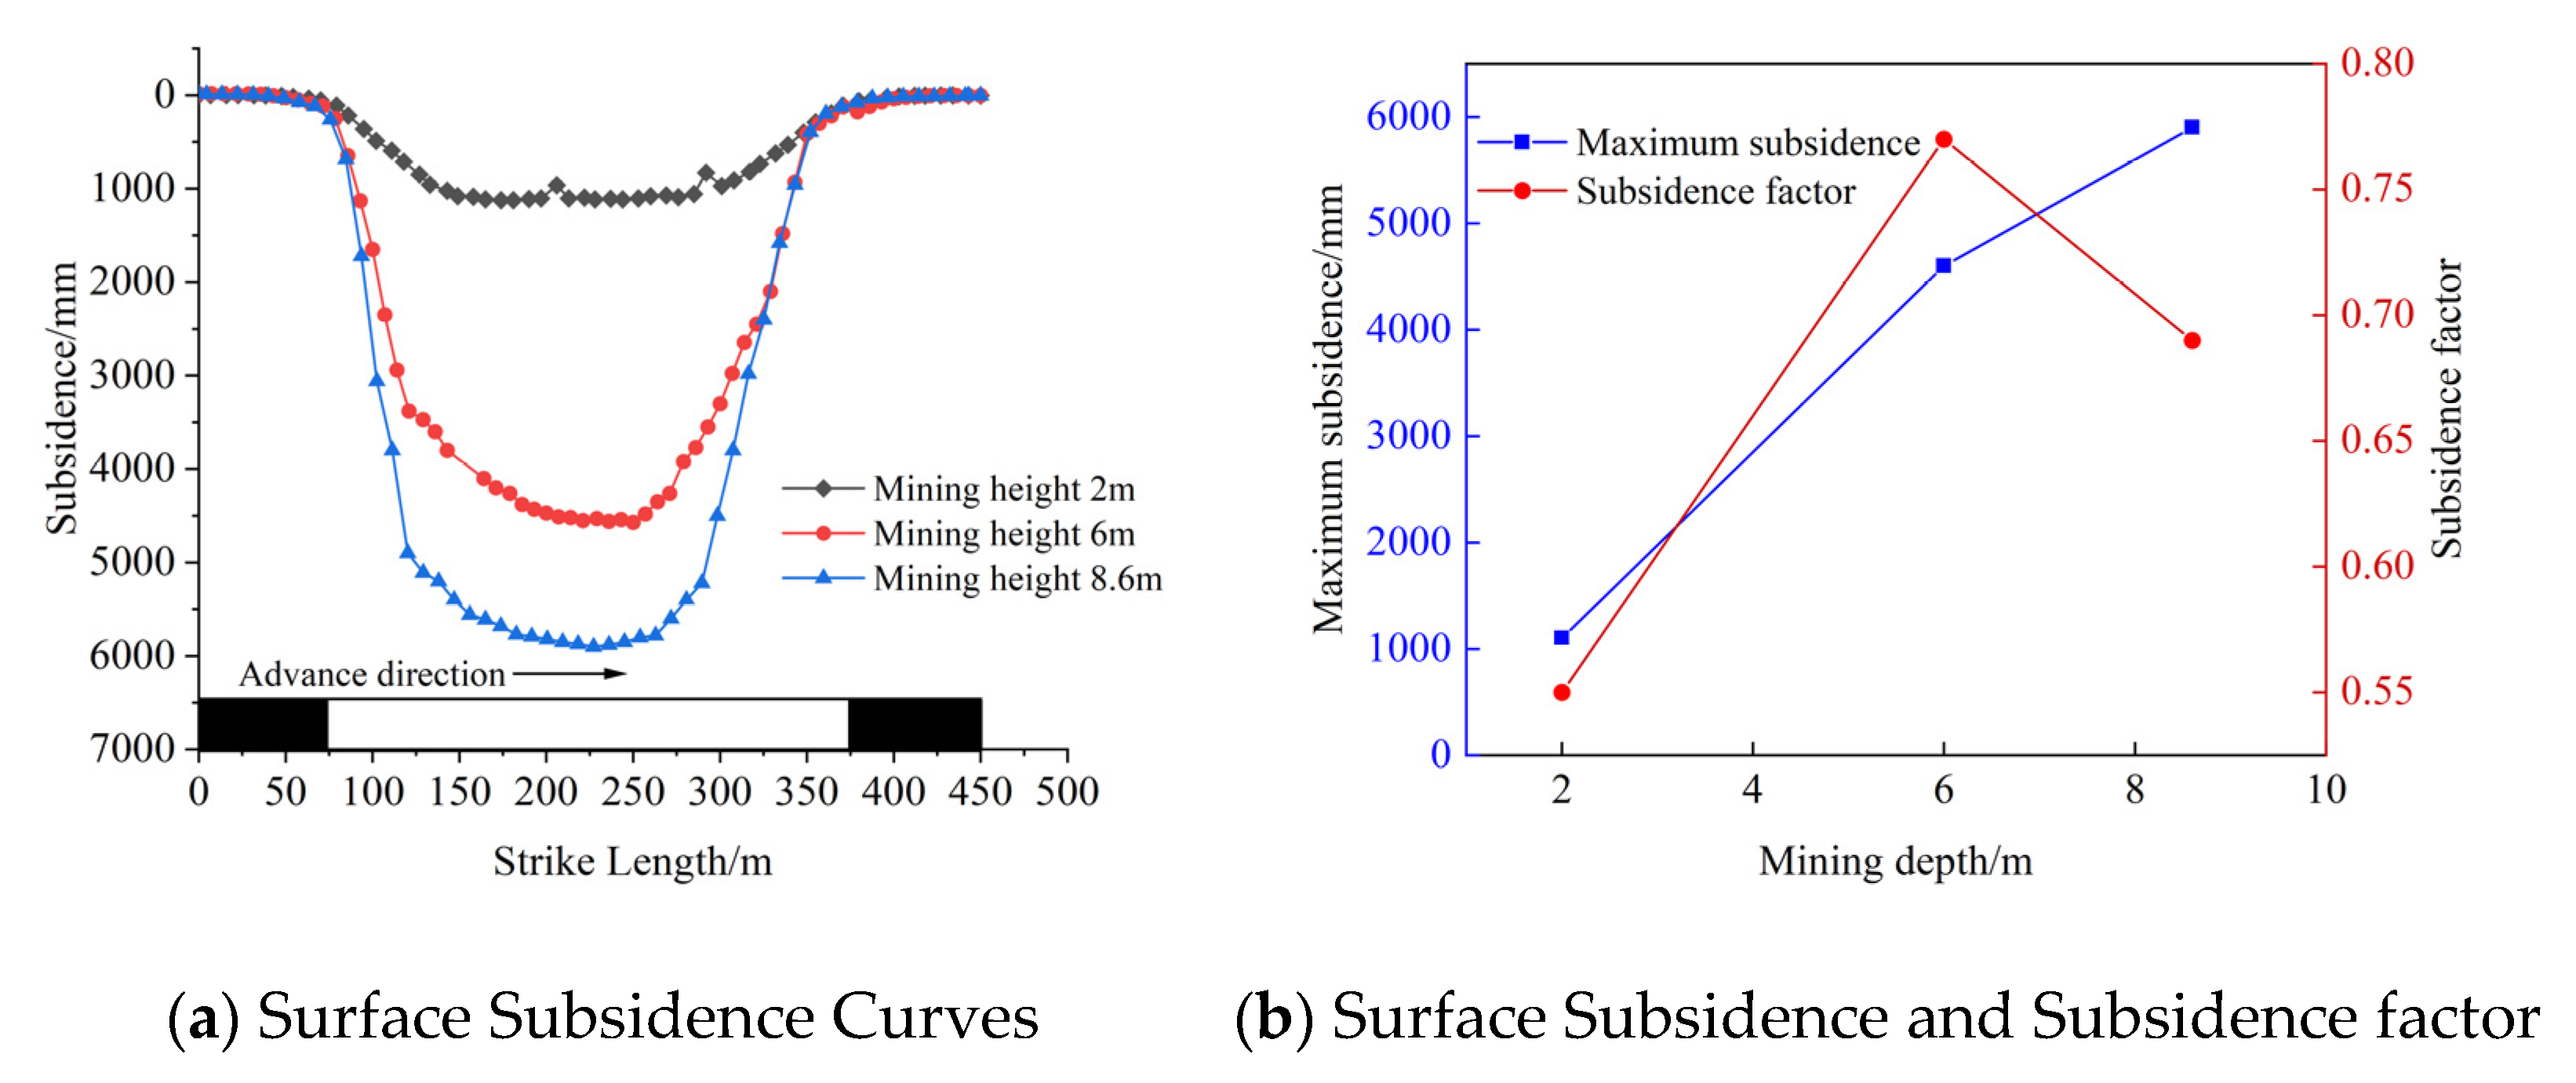
Figure 12 shows that, compared to the 2 m model, the maximum surface subsidence for the 6 m and 8.6 m mining height models increased by 318% and 436%, respectively. The corresponding subsidence coefficients were 0.55, 0.77, and 0.69. These results indicate a strong positive correlation between maximum surface subsidence and mining height, whereas the subsidence coefficient and mining height show no significant association.
- (2)
Effect of Mining Height on Surface Fissure Development
Figure 13 illustrates fracture development in the overlying strata and on the surface for various mining heights at a depth of 185 m. For a mining thickness of 8.6 m, the number and scale of surface fissures increased sharply compared to the 2 m and 6 m cases. These fissures exhibited substantial horizontal apertures, predominantly ranging from 180 mm to 230 mm. A direct positive correlation was observed between mining thickness and horizontal aperture; the maximum apertures for the 2 m, 6 m, and 8.6 m models were 140 mm, 225 mm, and 265 mm, respectively. These results suggest that in areas with complex surface topography, controlling the mining thickness is a viable strategy to suppress fissure development and mitigate surface damage.
4.3. Numerical Simulation of the Effects of Varying Mining Depths
- (1)
Effect of Mining Depth on Surface Subsidence
Figure 14 illustrates the effect of mining depth on surface subsidence. Compared to the 150 m model, maximum surface subsidence decreased by 13.2% for the 185 m depth and 23.5% for the 250 m depth. Similarly, the subsidence coefficient declined from a baseline of 0.80 to 0.69 and 0.61 for the 185 m and 250 m depths, respectively (a reduction of 13.8% and 23.8%). These results reveal a strong negative correlation between mining depth and both maximum surface subsidence and the subsidence coefficient.
- (2)
Effect of Mining Depth on Surface Fracture Development
Figure 15 illustrates the development characteristics of overburden and surface fractures for an 8.6 m thick coal seam at various mining depths. At a mining depth of 150 m, the ground surface is significantly impacted by mining activities, leading to extensive fracture development in both the overburden and at the surface. Large-scale fissures with considerable apertures are distributed at the margins and center of the subsidence basin. The maximum fracture aperture, measuring approximately 277 mm, was recorded 20 m ahead of the working face.
At a mining depth of 250 m, surface fractures were observed above the initial mining cut and the final mining line. However, compared to the models with burial depths of 150 m and 185 m, the scale of fracture development within the center of the surface subsidence basin was reduced. This reduction was manifested by a decrease in the number of fractures and a smaller overall fracture aperture than that observed in the shallower coal seams. The maximum horizontal fracture aperture was 210 mm, recorded 15 m ahead of the working face.
In summary, the horizontal aperture of surface fractures decreases as mining depth increases. This phenomenon is primarily attributed to two factors: at greater depths, the transmission of overburden failure to the surface is diminished, and the self-healing capacity of the fractures is enhanced.
4.4. Discussion
The evolution of caving-induced fractures, displacement, and stress at the 12,401 working face of the Shangwan Coal Mine was investigated using UDEC numerical modeling software. At a 200 m face advance, mining-induced fractures in the overburden propagated to the surface, forming a primary ground fissure designated ‘A’. This is essentially due to the macroscopic fracture surface formed when the tensile strain caused by mining exceeds the tensile strength of the rock and soil mass. The aperture of this fissure increased with continued face advance before stabilizing at a maximum value. By the time the face had advanced 250 m, the ground surface had reached maximum subsidence. Throughout this process, dynamic fractures were continuously generated in the center of the subsidence basin. This is due to the continuous separation and collapse of the rock layers above the middle of the goaf, resulting in the continuous expansion of the surface tensile stress zone. Upon completion of mining, these central dynamic fractures progressively closed. However, a dense network of permanent fractures remained at the basin’s margins, exhibiting a maximum aperture of approximately 265 mm. Even if mining is completed and surface cracks are closed, areas with cracks are still high-risk for population gathering and major infrastructure construction, requiring long-term monitoring and management. This danger is manifested in the occurrence of external loads or rainwater erosion, which can cause fractures again, resulting in more concealed and sudden damage.
Using the engineering parameters of the 12,401 working face (8.6 m mining height; 185 m depth) as a baseline, this study investigated the patterns of surface subsidence and fracture development under varying mining heights (2 m and 6 m) and depths (150 m and 250 m). The results show a distinct positive correlation between mining height and both maximum surface subsidence and maximum horizontal fracture aperture. The essence of its mechanics lies in the fact that an increase in mining height directly leads to an increase in the height of the caving zone and water conducting fracture zone, thereby expanding the range of overlying rock damage. However, no significant correlation was observed between the subsidence coefficient and mining height. This is because the increase in mining depth enhances the self-bearing capacity of the overlying rock layers, and the stress arch effect is more significant. Conversely, as mining depth increased, the maximum surface subsidence, the subsidence coefficient, and the horizontal fracture aperture all decreased. These findings suggest that the extent of surface damage can be mitigated by carefully controlling both mining height and depth.


