Article

Comparative Analysis of Statistical and AI-Based Methods for Livestock Monitoring in Extensive Systems

by
Marco Bonfanti
1,*,
Dominga Mancuso
2,
Giulia Castagnolo
3 and
Simona Maria Carmela Porto
2
1
Department of Veterinary Sciences, University of Messina, Viale G. Palatucci S.N., 98168 Messina, Italy
2
Department of Agriculture, Food and Environment, University of Catania, Via S. Sofia, 100, 95100 Catania, Italy
3
Department of Electric, Electronics and Computer Engineering, University of Catania, Viale A. Doria, 6, 95125 Catania, Italy
*
Author to whom correspondence should be addressed.
Appl. Sci. 2025, 15(20), 11116; https://doi.org/10.3390/app152011116
Submission received: 29 August 2025 / Revised: 6 October 2025 / Accepted: 13 October 2025 / Published: 16 October 2025

Abstract

In recent years, the research focusing on extensive farming systems has attracted considerable interest among experts in the field. Environmental sustainability and animal welfare are emerging as key elements, assuming a crucial role in global agriculture. In this context, monitoring animals is important not only to ensure their welfare, but also to preserve the balance of the land. Inadequate grazing management can in fact damage vegetation due to soil erosion. Therefore, monitoring the habits of animals during grazing is a challenging and crucial task for livestock management. Internet of Things (IoT) technologies, which allow for remote and real-time monitoring, may be a valid solution to these challenges in extensive farms where farmer-to-animal contact is not usual. In this regard, this paper examined three different methods to classify the behavioral activities of grazing cows, by using data collected with collars equipped with accelerometers. Three distinct approaches were compared: the former based on statistical methods, and the other on the use of Machine and Deep Learning techniques. From the comparison of the results obtained, strengths and weaknesses of each approach were examined, so to determine the most appropriate choice in relation to the characteristics of extensive livestock systems. In detail, Machine and Deep Learning-based approaches were found to be more accurate but highly energy-intensive. Therefore, in rural environments, the approach based on statistical methods, combined with LPWAN applications, was preferable due to its long range and low energy consumption. Ultimately, the statistical approach was found to be 64% accurate in classifying four behavioral classes.

1. Introduction

Animal monitoring and observation have long been of interest to researchers in the field of extensive farming. This activity can provide useful information about how animals move in their environment, their pasture utilization and preferred areas, behavior and social interactions within a herd, etc. [1,2,3,4].
A better understanding of the connections between grazing ruminant behavior and surrounding environment, which include elements such as vegetation or soil structural characteristics, could support the development of practices aimed at improving animal health and welfare by simultaneously reducing their environmental impact [5,6,7].
Livestock management on grazing farms presents different challenges than on intensive farming systems. In extensive grazing environments, animals graze freely in large and often rugged spaces, making it a challenging task for farmers to manage the whole herd within a pasture [8]. As a result, daily management practices, such as monitoring water availability and animal welfare, require more labor than intensive systems.
Knowledge of the spatial distribution of livestock within the grazing area is a key element of pasture management [9]. Concentration of livestock in specific grazing areas can lead to localized soil erosion, reduced plant viability, adverse effects on wildlife habitats, and deterioration of riparian areas [10,11]. The improvement of grazing uniformity can effectively support sustainable increases in livestock numbers or extended grazing periods, particularly in large areas characterized by strong non-uniformity in the spatial distribution of livestock [12].
Smart technologies used in livestock farming, better known as Precision Livestock Farming (PLF), can help farmers make better decisions especially about production, reproduction, animal health and welfare, environmental impact, etc. [13,14]. Since visual observation of animals is a laborious activity and depends on the observer subjectivity, smart technologies could be used to monitor grazing animals, consequently contributing to the development of strategies capable to optimize farm management [15,16,17].
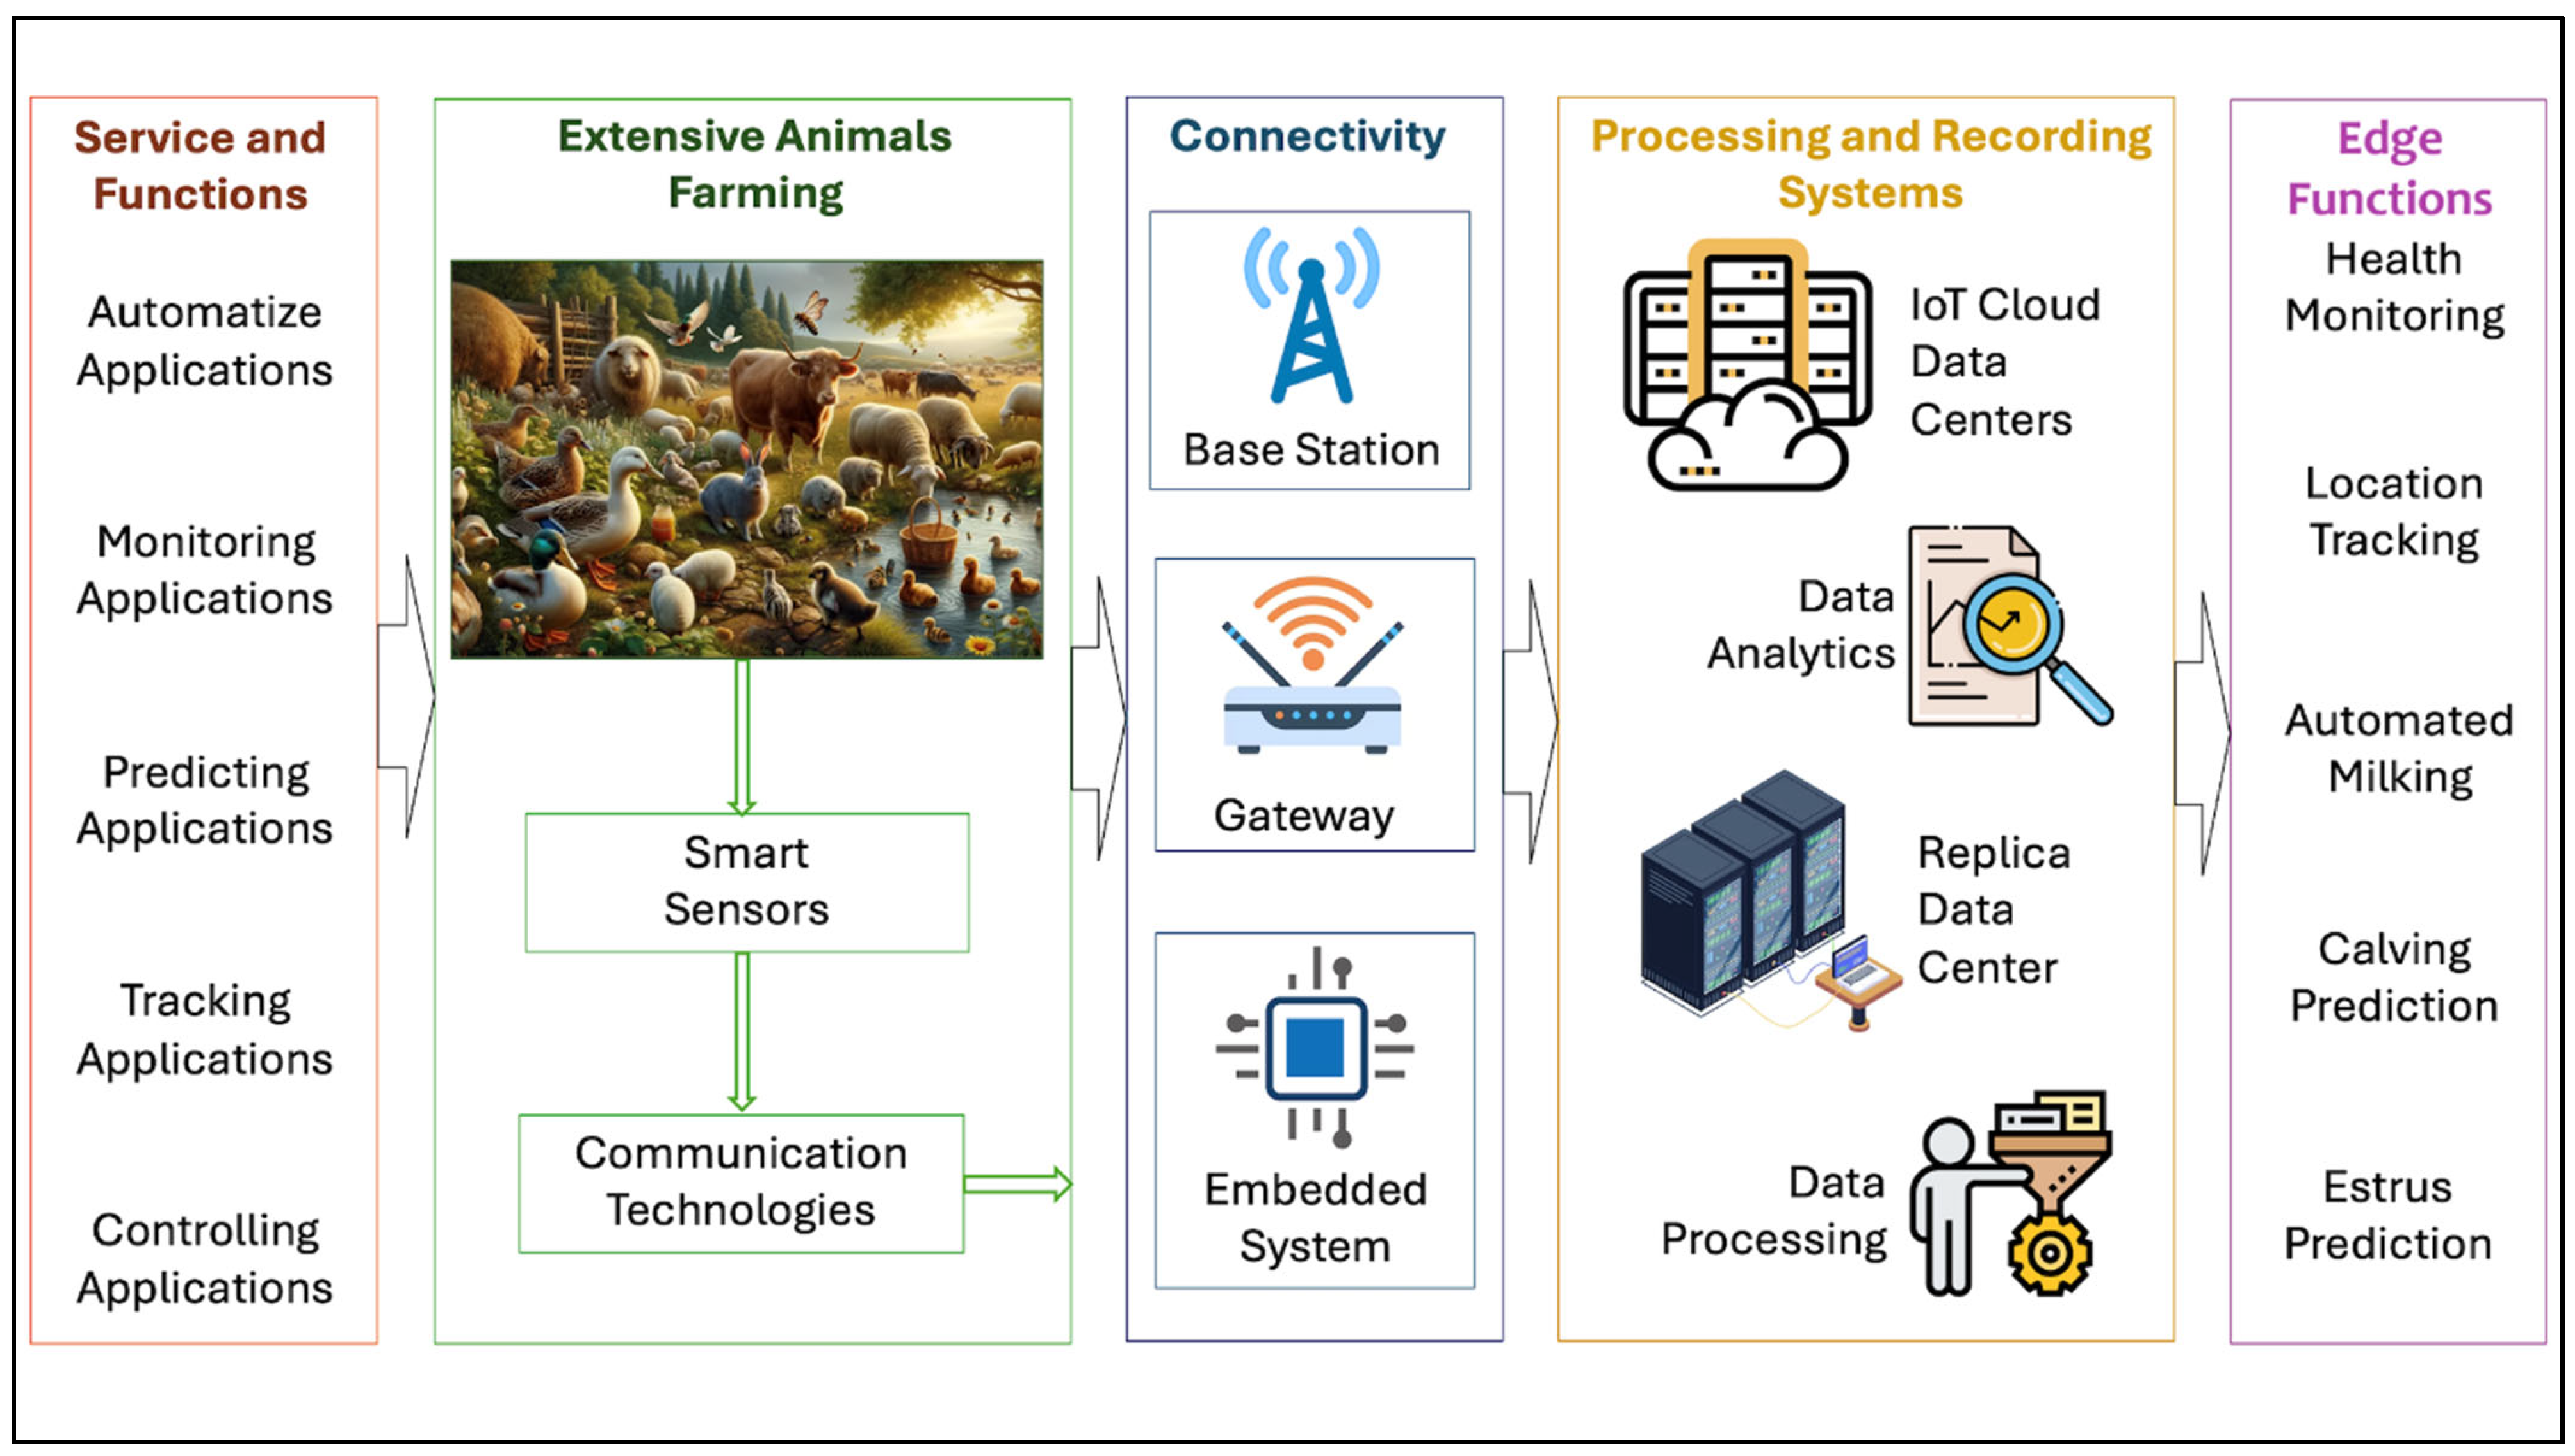
The application of the Internet of Things (IoT) paradigm in rural areas seems to be convenient, since a more comprehensive understanding of animal health and welfare could be achieved by combining data acquired from GPS with those from different types of sensors, such as inertial sensors and environmental sensors [18,19]. In the PLF framework, the IoT paradigm is a significant shift in the enhancement of the connectivity of the Internet, as IoT-based systems connect computing devices, mechanical and digital equipment, items, animals, or humans to a network and transfer data without requiring human-to-human or human-to-computer contact. Therefore, IoT enables the implementation of an approach to agriculture based on real-time data collection, analysis and processing, improving overall farm management and facilitating farmers’ decision-making [20]. Several servers in the cloud are connected to enhance IoT applications in animal husbandry, such as animal health monitoring and tracking [21]. In general, the IoT-Livestock cloud platform includes applications, smart sensors, electronic devices, communication technologies, connection gateways, and cloud data centers [22]. Figure 1 shows a typical cloud-based platform for animal health monitoring, which includes the flow of data relevant to animal health and other applications. Sensors housed within wearable devices send information to cloud data centers, via a gateway connection, for subsequent analysis and post-processing. Subsequently, the acquired data are saved in the cloud and made available to livestock managers and health specialists or can be forwarded to other processing systems. The main issue in IoT applications is the information sharing, which requires effective and efficient communication solutions. Secure and reliable communication is especially important for the real-time exchange of critical information like animal health.
In this context, most studies have focused on the use of devices embedded with GPS and accelerometers, attached to the collar of animals grazing in small pastures for short time intervals; therefore, more research studies are required to validate this technology in larger environments and for longer monitoring periods [23].
IoT animal-related data can be transmitted by using different wireless communication systems, including Wi-Fi, 3G/4G, Bluetooth, and ZigBee [24]. In this context, a first key issue that significantly limits applications in extensive farming is the lack of reliable and stable telecommunication signals [25] because the performance of IoT-based systems depends on continuous collection and transferring to cloud or external servers of data acquired by sensors. Moreover, the coverage range of such networks and the reduced life battery of the remote devices do not work well with IoT applications in large pastures, as proved by several studies [26,27,28]. In extensive livestock farming systems, long battery life is essential since direct interaction between the farmer and animals occurs infrequently during the year. Therefore, the replacement or recharge activities of the battery are problematic as they would involve significant costs and stress for both farmers and animals. With regard to network working range, although Bluetooth/ZigBee are low-energy-consumption systems, several repeaters should be installed due to their limited covered area. This solution is not always practicable in large pastures.
Low-Power Wide-Area Networks (LPWANs), e.g., SigFox and LoRa, could offer a solution for monitoring animal behavior in extensive farms because they are characterized by both wide coverage range from a single repeater and reduced energy consumption of the connected devices. However, the identification of animal behaviors in real time requires the development of classification algorithms working with a large number of data that are not always transferable through LPWANs due to their limited bandwidth. Therefore, it is necessary to develop firmware based on low-computational-cost algorithms that can be directly executed within electronic devices connected to the network.
The aim of this work is to compare three different data analysis methods for identifying the behavioral activities of grazing cows, ranging from statistical to Deep Learning-based methods, applied to the same data collection device, highlighting their strengths and weaknesses in relation to the possible application of LPWANs. The device adopted in all studies to acquire data was housed in a collar and embedded with triaxial accelerometer, required for measuring the animals’ movements, and GSM/GPRS modules. Specific algorithms are implemented and integrated into the firmware of the wearable mobile device to monitor cow behavioral activities in real time. The preliminary results of these methods were compared to each other to evaluate the possibility of carrying out onboard computing, i.e., running such algorithms directly in the devices’ firmware, which would reduce the amount of data to be transferred via LPWAN to the cloud.
The first method analyzed was proposed by Porto et al. [29] and was focused on the use of accelerometers in detecting the activities of grazing cows. It allowed identifying the acceleration components along the three axes required to statistically define thresholds for discriminating cow behavioral activities. The second method described by Castagnolo et al. [30] proposed a convolutional neural network (CNN) model capable of discriminating the behavioral activities of grazing cows using a fully automatic process. The third method under examination involves the use of a Machine Learning algorithm: the decision tree to identify the accelerometer thresholds to discriminate the behavior of the cows. Therefore, in this work, different types of data processing are analyzed which explore the use of statistical, Deep Learning, and Machine Learning methods.

2. Materials and Methods

2.1. Data Collection System and Analysis

An innovative device designed by Porto et al. [29] was employed in the three case studies (Method I, Method II and Method III) examined in this research. This device is equipped with a triaxial MEMS accelerometer (MEMSIC, Shenzhen, China), omnidirectional antennas, a powerful 32-bit Cortex microcontroller (RAKwireless Technology Limited, Shenzhen, China), quad-band GSM/GPRS modules (Semtech Corporation, Camarillo CA, USA), a high-capacity Li-SOCL2 battery (SAMSUNG, Suwon, South Korea) and flash memory.
Data were collected on a semi-natural pasture of approximately 180 hectares near Aidone, Sicily (Italy) (Figure 2). The farm uses an extensive cow–calf line breeding system, which keeps calves with their mothers until weaning (6–8 months). Data collection was carried out, from 18 to 22 May 2021 and from 27 to 30 June 2021, from 6:00 AM to 10:00 AM and from 6:00 PM to 9:00 PM. During these testing periods, the animals were confined in a fenced enclosure of approximately 2 hectares near the farmer’s house to take advantage of the shaded areas and watering trough; the rest of the time, they were free to graze. The choice of video acquisition intervals throughout the day was made to reduce the risk of sunstroke for the operator during the hottest hours. The meteorological conditions during the monitoring period were critical, due to temperature averaging around 27 °C with a peak of 41 °C recorded on 30 June 2021. The devices were set to sleep mode from 6:00 PM to 10:00 AM in order to increase battery life. The studies focused on two 19-month-old cows from a herd of ten Limousine heifers.
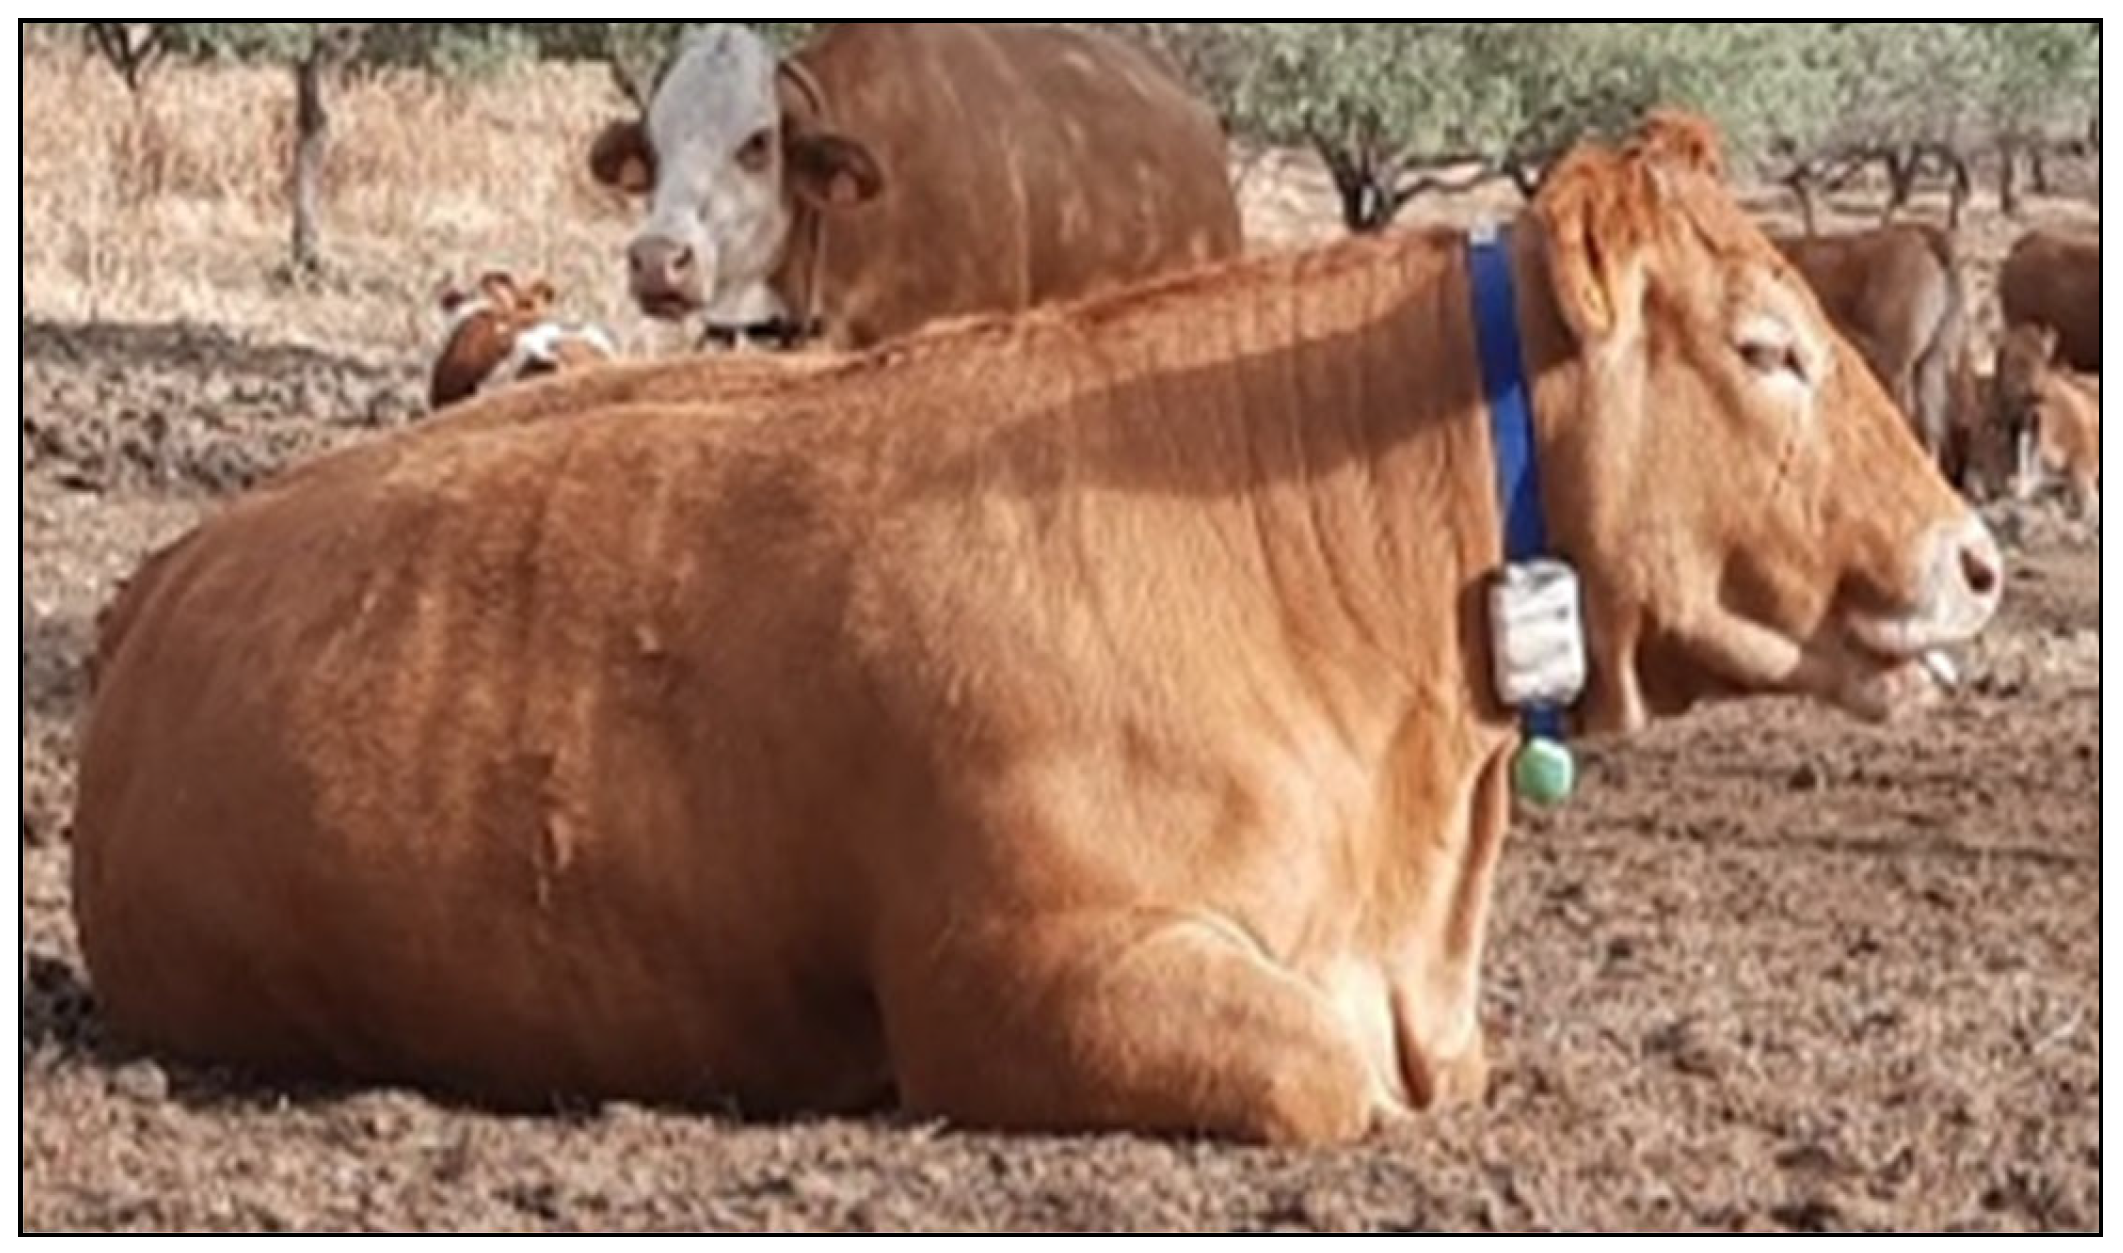
The device, housed in a plastic case, was fitted to the cow neck by using a leather-reinforced mesh collar. The attachment of the case to the collar was achieved using wire cable ties and adhesive tape. To limit unwanted rotation of the device around the cow neck, a 1 kg counterweight was applied to the collar. The distance between the device and the counterweight was appropriately chosen to detect accelerations caused by the oscillations of the jaw during the Rumination activity (Figure 3).
Accelerations along the x-, y- and z-axes were recorded at a frequency of 4 Hz and stored in the firmware of the devices. The collected data were periodically sent to a cloud via the GSM communication module, with batches of data sent every hour.
During the day, an operator recorded the cow behavioral activities and then labeled them using the video labeling method, identifying the following five behavioral classes: Feeding while Standing (F-S), Feeding while Walking (F-W), Walking (W), Lying (L), and Rumination in Lying position (R-L).
The accelerometer data were labeled by assigning a behavior label to each dataset sample based on the visual examination of the video recordings. However, several behavioral activities were noticed during the labeling phase, such as rapid movement of the ears and head and sniffing the ground, which were unrelated to the study. To reduce the number of outliers in the acceleration dataset, the acceleration values associated with these minor behavioral activities were removed.

2.2. Method I

In the work proposed by Porto et al. [29], the method used for data analysis involved descriptive statistics. First of all, the acquired acceleration data were subjected to the Kolmogorov–Smirnov test to verify their distributional correspondence fit to the Gaussian normal distribution. A level of significance (α) of 0.05 was applied to all datasets, to determine the critical value of each (from Massey’s table [31] and supplemented by Birnbaum [32]). Having established that, for each dataset, the calculated empirical value was lower than the respective critical value, the matching with the normal distribution was demonstrated. So, the mean, maximum, minimum and standard deviation values of the accelerations measured along the x-, y- and z-axes were calculated, grouped by behavioral activity and day of observation. Next, the ANOVA parametric test was applied to the data of each behavioral group considered in order to highlight statistically significant differences and to define the range of accelerations for each axis. In detail, the ANOVA test compared the median accelerations acquired in 1 s (4 Hz sampling) for each behavioral class, with a level of statistical significance (P) lower than 0.05.
Then, the Tukey test was performed to compare the behavioral activities, identifying any overlaps in acceleration intervals and which axes could be useful to discriminate each behavioral activity. This statistical analysis returned the acceleration components needed to define thresholds suitable for discerning cow behavioral activities.

2.3. Method II

In the method proposed by Castagnolo et al. [30], a one-dimensional (1D) convolutional neural network (CNN) was used to classify cow behavioral activities, using data provided by triaxial accelerometers installed in the collars. CNNs are artificial neural networks that use convolutional layers to automatically obtain discriminative characteristics from input data.
The proposed architecture, called Branched Model, is a convolutional neural network with 1D convolutions (Figure 4). The model processes input data sequences through several parallel branches, each analyzing different combinations of axial measurements organized as input feature channels. The main concept is to enable the model to learn significant features from all axes by implementing an inhibition mechanism that selectively excludes data from certain axes. This approach is inspired by preliminary experiment which indicated that for some behavioral activities, accelerations along all three axes were not necessary for recognition. Therefore, the model was designed to ensure that some of the extracted features depend solely on specific inputs [29]. Specifically, the model incorporates multiple branches of 1D convolutional layers, with each branch receiving input samples from only a subset of axes, covering all possible subsets that include at least two axes. Additionally, to account for features related to single channels, a branch with shared kernels across all channels was included to capture global relations and compel the model to learn axis-agnostic features. The final branch processed the entire input, i.e., all three channels simultaneously. Subsequently, features from all branches were concatenated and further processed by a series of convolutional layers interspersed with max pooling blocks to reduce dimensionality. Finally, the features were flattened and fed into a linear classifier.
Each convolutional layer is followed by batch normalization and the hyperbolic tangent activation function. The training techniques involve the use of Adam as optimizers and Cross-Entropy as loss functions. To address class imbalance, a weighted random sampling operation was used during training so to ensure that the model received an equal number of inputs from each class, with repetitions. The network proposed uses a combination of accelerometer data processing and Machine Learning techniques to classify the behavioral activities of cows accurately and efficiently.

2.4. Method III

The method analyzed in this paragraph involves the use of decision trees to determine the accelerometric thresholds for the identification of cow behaviors. As is known, decision trees are Machine Learning tools that help to make decisions through a hierarchical structure. Each node of the tree represents a question based on a data feature and each branch represents a possible answer that can lead to another question or to the final decision. The leaf nodes represent the final decisions. In this specific case, the input features to the decision tree are represented by the median calculated on windows of samples with duration of 5 s acquired at 4 Hz.
The dataset acquired using the device described above was pre-processed. The pre-processing phase includes removal of outliers and minor behaviors, grouping of samples in 5 s windows, and calculation of the median for each axis (x, y, z) considering windows of samples of 5 s. Once Grid Search analysis was carried out, it was found that the best depth of the decision tree is 10 as it was a good compromise between the performances of the developed model and the number of comparisons to be implemented in the device firmware. The acquired dataset presents some imbalances between the classes; therefore, it was decided to oversample the less represented classes using SMOTE 0.8.0 (Synthetic Minority Over-sampling Technique) [33]. SMOTE is a widely used method in Machine Learning for addressing class imbalance in datasets. It is particularly effective when dealing with datasets where one class (the minority class) has significantly fewer samples than the other classes (the majority class), which can lead to biased models that perform poorly on the minority class.

2.5. Software and Hardware Used

Statistical analysis and analysis of variance of the accelerometer data in Method I were performed with SAS 9.4 software.
The following libraries were used in data processing activities: Numpy 1.23, Pandas 1.4.3, Scipy 1.9. In Machine Learning methods (decision tree–Method III), Scikit-learn 1.1 was the library adopted. Scikit-learn 1.1.2 was used in validation techniques and matrix calculation. Deep Learning methods were performed by Torch 1.12 and Torchvision 0.13.
Regarding the hardware used, data processing was carried out using a workstation equipped with AMD Ryzen 9 3950 X processor, 32 GB DDR4 RAM, GeForce RTX 3060 12 GB performance-segment graphics card by NVIDIA.

3. Results and Discussion

3.1. Method I

In Porto et al. [29], ANOVA and Tukey tests were performed to determine which acceleration components can discriminate a certain behavior.
The ANOVA test provided information on the number of samples N, mean value of the acceleration Amean, standard deviation σ, and 95% confidence interval for each acceleration component as defined by the following equation:
95 %   C I   = A m e a n   ±   1.96   σ N
where 1.96, known as a z-score, is a critical value of the standard normal distribution corresponding to a level of confidence equal to 95%.
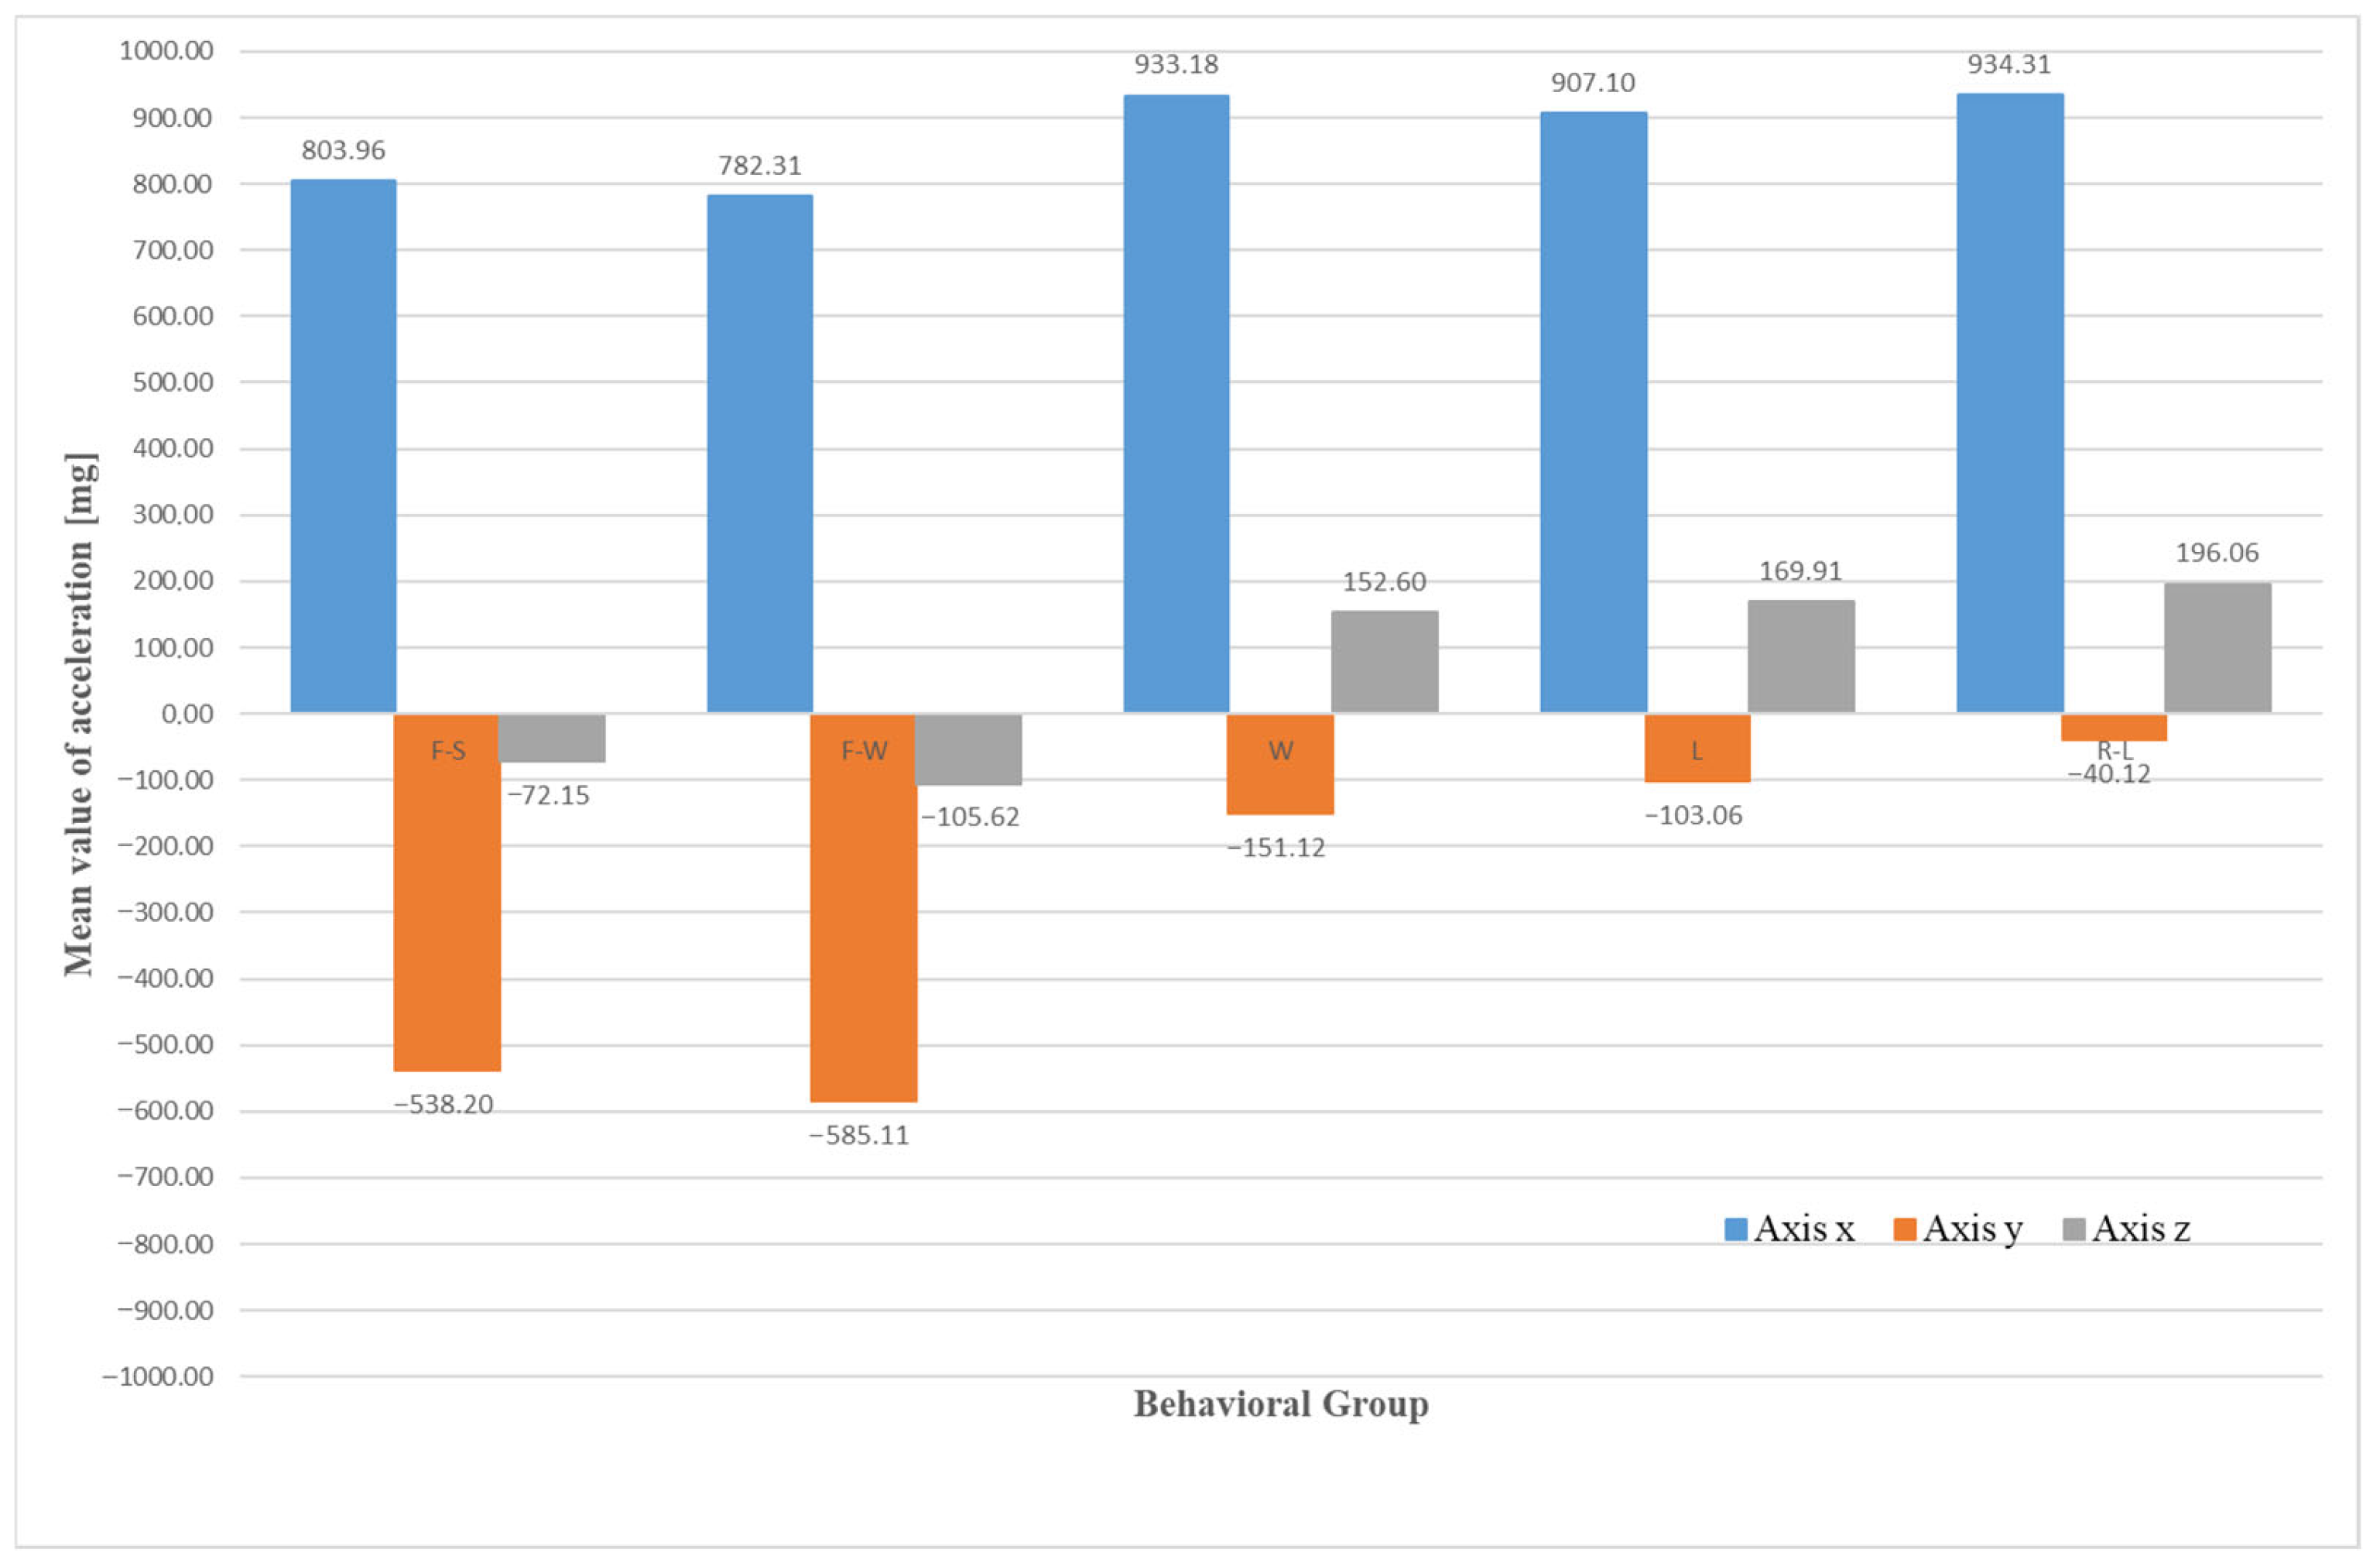
These parameters were determined for the specific axis and associated with each behavior. The accelerometer thresholds for each behavioral class were derived from their respective confidence intervals. Figure 5 shows the average acceleration values along the three axes for each behavioral group. By applying the ANOVA test to the component along the x-axis, some behavioral classes were found to overlap, such as Lying with Rumination (L-R) and Walking (W). The study found that acceleration along the x-axis can only distinguish between Feeding activities while Standing (F-S) or Walking (F-W). Similarly, acceleration along z-axis effectively distinguishes between Lying (L) and Feeding activities, whether Standing or Walking. This study found acceleration components for identifying specific cow behaviors as follows: x- and y-axes for Rumination (R); y- and z-axes for Lying with Rumination (R-L); y- and z-axes for Walking (W); and all three axes for Lying (L), Feeding while Standing (F-S), and Feeding with Walking (F-W) (Table 1 and Table 2). For clarity, in Table 2, “Required” indicates that no overlap was found for that given interval; “Not required” indicates multiple overlaps; and “Uncertain” indicates partial overlaps. This approach was validated directly in the field on a group of three cows. The overall accuracy found was 64% considering four behavioral classes (Table 3). The Feeding behaviors were merged in a single class Feeding.
As reported in Table 3, with the thresholds computed in Porto et al. [29], it is possible to recognize Feeding and Rumination in Lying with an accuracy, respectively, of 74% and 70%. The accuracy for Walking and Lying behaviors is low—respectively, 42% and 50%.

3.2. Method II

As reported in the study carried out by Castagnolo et al. [30], the pre-processed dataset contained a variety of behavioral activities, with the majority being Rumination while Lying and the least being Lying (Table 4). Two trials were carried out, one involving all classes (five-class scenario) and the other combining Feeding activities into a single class (four-class scenario). Tenfold cross-validation was applied. The Branched Model was compared to two basic neural network architectures: a one-dimensional CNN model that processes data from all axes and a multi-layer perceptron (MLP).
The results found that all models performed better in the four-class scenario than in the five-class scenario, and the Branched Model performed worse for Feeding activities in the five-class scenario, which might be attributed to the similarity of the acceleration values observed for the two behavioral classes (Table 5 and Table 6). In particular, in Table 5, F1 Score is the harmonic mean of precision and recall:
F 1   s c o r e =   2 p r e c i s i o n r e c a l l p r e c i s i o n + r e c a l l
where the precision is the ratio between True Positive (correctly predicted positive cases) and the sum of True Positive and False Positive (incorrectly predicted positive cases), and the recall is the ratio between True Positive and the sum of True Positive and False Negative (incorrectly predicted negative cases). So, while the precision measures how many of the predicted positive cases are actually correct, the recall measures how many of the actual positive cases the model can correctly identify.
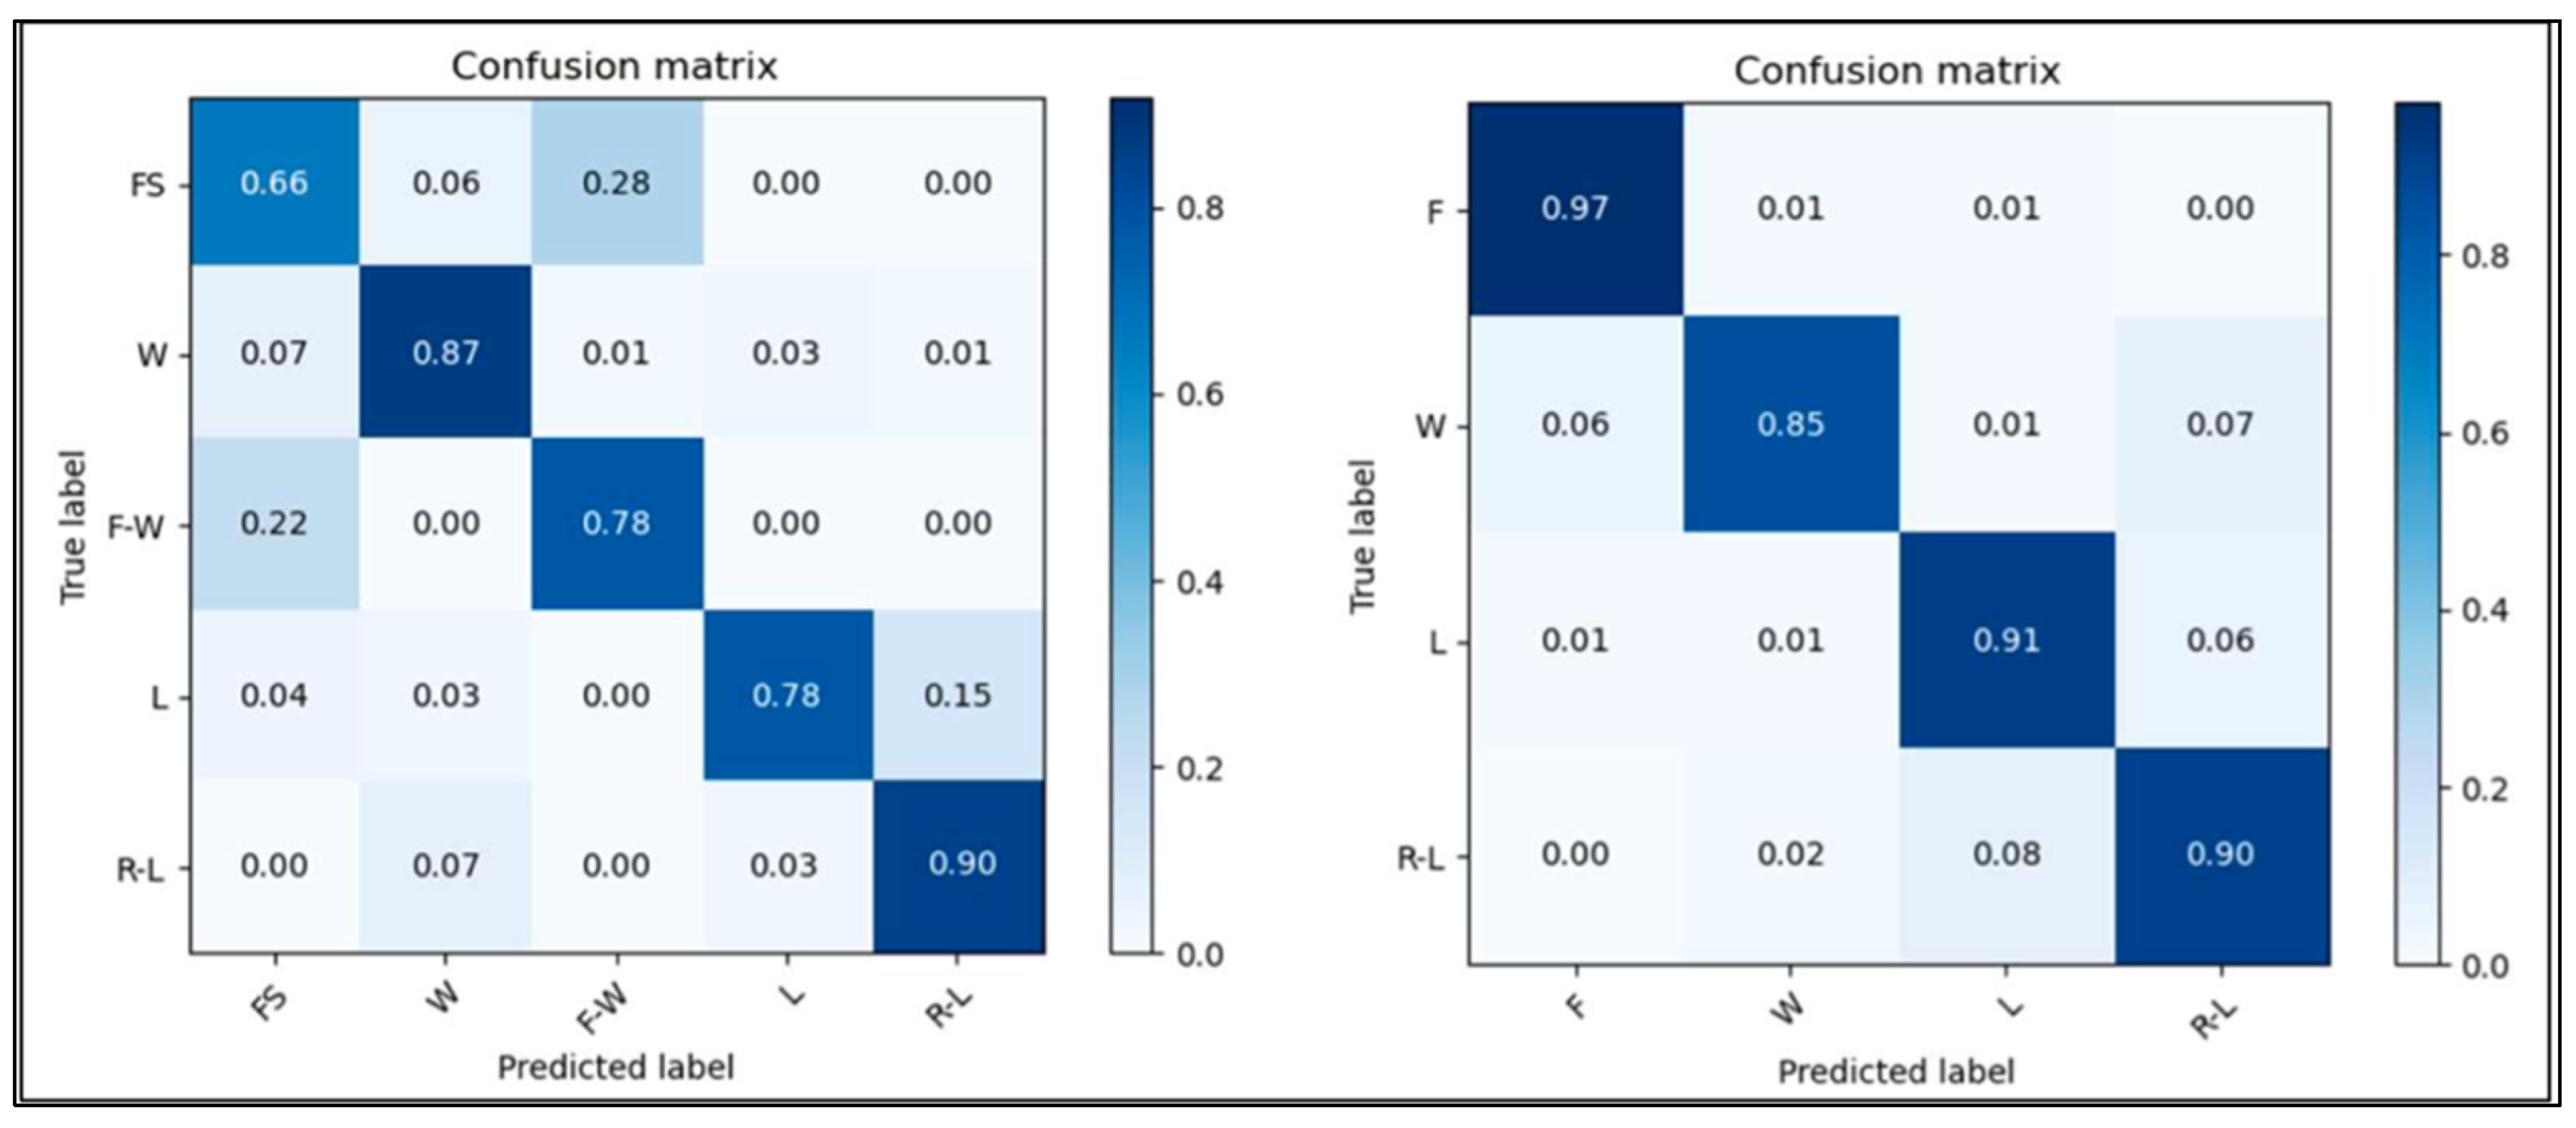
The confusion matrix showed that the model source of indecision related to the Feeding while Walking and Feeding in Standing position classes, and the model accuracy in recognizing Feeding activity increased significantly when the two classes were combined (Figure 6).

3.3. Method III

The data processed using decision trees are the same as in the previous paragraph. Also in this case, as in the previous one, cross-validation was carried out on 10 folds. Furthermore, two scenarios were also considered in this case (five-class scenario and four-class scenario). In Table 7 and Table 8, the obtained results are shown.
For the five-class scenario, the decision tree showed high precision for the F-S group, indicating that most predictions for this class were correct. However, slightly lower recall suggests that some F-S examples were not identified. Overall, high precision balanced by moderate recall reflects an accurate but not exhaustive classification of this group. The precision for the F-W group is significantly low, indicating that many predictions for this class were false. The higher recall suggests that the model was able to identify a good portion of the F-W examples, but at the cost of numerous False Positives. The metrics for the W group show moderate performance. Precision and recall are balanced, suggesting that the model has reasonably good classification ability for this class, but not outstanding. The moderate F1 Score indicates that there is room for improvement. For group L, the recall is relatively high, suggesting that the model is able to identify most of the examples of this class. However, the precision is lower, indicating that there are many False Positives. This reflects a good sensitivity of the model but an improved specificity. The R-L group shows high precision and good recall, suggesting that the model is very effective in correctly classifying this class. The high F1 Score reflects a positive balance between precision and recall, indicating a solid performance of the model for this group.
For the four-class scenario, the decision tree reached better results in discriminating Feeding, compared to the previous case. This suggests that the model is very effective at recognizing this combined class, reducing errors that occurred when the classes were separated. The metrics decrease slightly compared to the five-class scenario, with an F1 Score of 55.88%, precision of 48.56%, and recall of 65.80%, indicating that the model continues to have moderate difficulty with this class. As for L and R-L, the model maintains good performance, and the results are comparable with the previous scenario. As with Method II, in this case too, by combining the two classes relating to Feeding, there were significant improvements.
Also in this case, the confusion matrix showed that the model accuracy in recognizing Feeding activity increased significantly when the two classes were combined (Figure 7).
In this study, three distinct methodologies for classifying the behaviors of grazing cattle were examined: statistical methods, neural networks, and decision trees. Each method offers specific advantages and disadvantages, which must be carefully considered, particularly in relation to the technological and energy constraints typical of rural environments.
Deep Neural Networks (DNNs) are renowned for their high accuracy in classifying animal behaviors. Due to their ability to learn complex representations from data, they can effectively distinguish between different activities of grazing cattle, such as Walking, Feeding and Lying. However, implementing Neural Networks on microcontrollers requires advanced hardware with higher computational power and memory capacity, leading to a significant increase in costs. Additionally, neural networks demand high energy consumption due to the large number of computational operations needed for inference. This is problematic in rural settings where frequent battery recharging is impractical. Therefore, although the neural network approach could lead to higher accuracy in recognizing different behavioral activities, the need to transfer a large amount of raw data to a data processing unit limits its practical application. Moreover, performing edge computing of classification behavioral algorithms in wearable devices is not a real solution because it would increase energy consumption due to the computational costs of neural networks, reducing battery life.
An alternative approach involves transmitting accelerometric raw data to an external server for remote processing. This method leverages the computational power of the cloud to execute complex Machine Learning algorithms, including Deep Learning. However, continuous data transmission necessitates telecommunications networks with high bandwidth capacity, resulting in high energy consumption to maintain connectivity. Furthermore, in grazing areas, 4G and 5G network coverage may be insufficient or entirely lacking, limiting the reliability and feasibility of this approach. In the study conducted by Arcidiacono et al. [34], it emerged that by adopting Bluetooth Low-Energy (BLE) communication and transmitting the raw data measured by a triaxial accelerometer (raw data), the overall power consumption would be acceptable. In fact, it was found that, by operating at a sending frequency of 10 Hz, the power consumption is about 160 µA. By reducing the frequency, the consumption would be further reduced (10 µA at a frequency of 0.2 Hz). However, as reported in Mancuso et al. [26], the range covered by BLE is short; therefore in large grazing areas that characterize extensive livestock systems, this solution is not feasible. Certainly, by using repeaters, gateways, and antennas, the range of action can be extended; however, the feasibility of using this communication technique depends on the size of the area to be covered and the availability of a reliable electrical network.
LPWANs could overcome the limits of short-range communication systems for monitoring animal behavior in extensive farms because they can cover large grazing areas (up to 10 km) by using a single repeater while preserving the battery life of wearable devices. However, due to the reduced bandwidth, classification models based on neural networks are not applicable because of the large amount of data that needs to be transmitted.
In contrast, the use of accelerometric thresholds, which can be calculated using both statistical methods and Machine Learning algorithms such as decision trees, represents a more practical and sustainable solution. These methods can be implemented directly in the firmware of microcontrollers, drastically reducing the need to transmit real-time data. Consequently, energy consumption is significantly lower, extending the battery life of the devices. For example, decision trees can be executed with a reduced number of computational operations compared to neural networks, allowing for efficient classification with less powerful and less energy-demanding hardware. Based on research carried out by the authors of this work, statistical methods with classifiers implemented within wearable devices could be suitable to work with LPWANs. Preliminary tests using a prototype of a cows’ behavior monitoring system operating through a LoRa network proved its feasibility, thanks to its low energy consumption. From preliminary tests, operating at a 4 Hz frequency, the energy consumption was found to be nearly 180 µA. Using a high-capacity 6600 mAh Li-SOCL2 battery, this consumption should lead to a battery life of at least 2 years, making the system suitable for the purpose.
However, the use of accelerometric thresholds has certain limitations compared to neural networks. The accuracy of behavior classification can be lower, as these methods tend to rely on less complex features of the data. Moreover, they may not capture the variability and complexity of animal behaviors’ as effectively as neural networks, which can model nonlinear relationships between data features. Another critical aspect to consider is the need for access to a wide variety of data to develop robust and reliable accelerometric thresholds. Unfortunately, access to such data is not always guaranteed, which can limit the ability to generalize models to different grazing conditions and animal behaviors.
In summary, as schematized in Table 9, while neural networks offer the highest accuracy in classifying grazing cattle behavior, technological and energy constraints make their implementation challenging in rural contexts. Methods based on accelerometric thresholds and Machine Learning, although less accurate, provide a better balance between energy efficiency, cost, and practicality, making them a more suitable solution for analyzing animal behavior in resource-limited environments. Environmental sustainability aspects must be given due consideration. Indeed, as stated by Primi et al. [35], research attention to the role of ruminant farming in promoting sustainability has grown in recent years. The increasing use of artificial intelligence tools, combined with the development of GPS tracking techniques, enables continuous monitoring and contributes to improving management practices, especially in the case of grazing livestock. Then, the choice of the most appropriate method should consider the specific operational conditions, the available technological resources, and the availability of sufficiently diverse and representative data to train robust models.
In general, by combining inertial sensors with GPS tracking units, the accuracy of animal grazing behavior classification could be significantly increased (Herlin et al. [36]). For instance, Cabezas et al. [37] found a weighted accuracy of 0.93 in classifying behavioral activities for grazing cows through collars instrumented with low-cost 3D accelerometers and GPS sensors. These accuracy values are comparable with those obtained using the neural network approach.
In any case, as stated by Bernabucci et al. [38], by measuring the time animals spend in each behavioral activity, it is possible to obtain indications of their well-being. In fact, unusual behaviors, excessive rest, abnormal gaits, and the absence of neck movements can indicate illness or stress in the animal.
4. Conclusions

The introduction of IoT into PLF, aimed at facilitating livestock management, faces practical challenges such as limited battery life and unreliable telecommunication signals.
This study investigated three different methods for identifying the behavioral activities of grazing cows using data acquired by accelerometers placed in collars. The three approaches, statistical, Deep Learning and Machine Learning, were evaluated to highlight the advantages and drawbacks.
Although the neural network-based method offers better adaptability to variable conditions and higher accuracy in classifying cow behavioral activities, its training constitutes an operational complexity that requires the transfer of a large amount of raw data to an external data processing unit. On the other hand, its high computational costs discourage any edge computing solution aimed at the classification of cow behaviors. Furthermore, its application is incompatible with LPWANs, characterized by a wide coverage range but a small bandwidth.
For this purpose, the application of the statistical method based on accelerometer thresholds seems more suitable, if it operates with LPWANs, specifically designed for combining a moderate energy consumption with a low bit rate, allowing operation in large spaces without connectivity.
In summary, although neural networks offer greater accuracy, to determine the behavioral activities of grazing livestock in real time, it is more convenient to use the method based on the statistical definition of accelerometer thresholds for implementing specific firmware that can be installed on the collars, taking advantage of the long working range (from 100 m to 10 km), the low energy consumption, and the low bit rate of LPWANs such as LoRa or Sigfox.

Author Contributions

S.M.C.P. provided important contributions to supervision, project administration and funding acquisition. M.B. supervised the writing/review and editing, the development of the various proposed methods, and data curation. D.M. and G.C.’s contribution to the work focused mainly on experimental testing and data labeling. Conceptualization, M.B. and S.M.C.P.; methodology, M.B.; software, D.M. and G.C.; validation, M.B.; formal analysis, M.B. and S.M.C.P.; investigation, M.B.; resources, M.B. and S.M.C.P.; data curation, M.B. and G.C.; writing—original draft preparation, D.M.; writing—review and editing, M.B.; visualization, M.B., D.M., G.C. and S.M.C.P.; supervision, S.M.C.P.; project administration, S.M.C.P.; funding acquisition, S.M.C.P. All authors have read and agreed to the published version of the manuscript.

Funding

The research study was funded by the European Union—Next Generation EU for Research Projects of Relevant National Interest (PRIN PNRR 2022). Grant number 2022S4X9Y2. “INstructions from PLF Data Analysis to improve the CATtle farming (INDACAT)”; and by European Union (NextGenerationEU), through the MUR-PNRR project SAMOTHRACE (ECS00000022).

Institutional Review Board Statement

Not applicable.

Informed Consent Statement

Not applicable.

Data Availability Statement

The data presented in this study are available on request from the corresponding author. The data are not publicly available due to company policy.

Conflicts of Interest

The authors declare no conflicts of interest. The funders had no role in the design of the study; in the collection, analyses, or interpretation of data; in the writing of the manuscript; or in the decision to publish the results.

References

  1. Maroto-Molina, F.; Navarro-García, J.; Príncipe-Aguirre, K.; Gómez-Maqueda, I.; Guerrero-Ginel, J.E.; Garrido-Varo, A.; Pérez-Marín, D.C. A low-cost IOT-based system to monitor the location of a whole herd. Sensors 2019, 19, 2298. [Google Scholar] [CrossRef]
  2. Senneke, S.L.; Macneil, M.D.; Van Vleck, L.D. Effects of sire misidentification on estimates of genetic parameters for birth and weaning weights in Hereford cattle. Anim. Sci. 2004, 82, 2307–2312. Available online: https://academic.oup.com/jas/article/82/8/2307/4790576 (accessed on 31 October 2023). [CrossRef] [PubMed]
  3. Turner, L.; Udal, M.; Larson, B.; Shearer, S. Monitoring cattle behavior and pasture use with GPS and GIS. Can. J. Anim. Sci. 2000, 80, 405–413. [Google Scholar] [CrossRef]
  4. Veissier, I.; Boissy, A.; Nowak, R.; Orgeur, P.; Poindron, P. Ontogeny of social awareness in domestic herbivores. Appl. Anim. Behav. Sci. 1998, 57, 233–245. [Google Scholar] [CrossRef]
  5. De, P.C.; Carvalho, F.; Carvalho, P.C.F. Harry Stobbs Memorial Lecture: Can grazing behavior support innovations in grassland management? Trop. Grassl.—Forrajes Trop. 2013, 1, 137–155. Available online: www.tropicalgrasslands.info (accessed on 20 January 2024).
  6. Dumont, B.; Fortun-Lamothe, L.; Jouven, M.; Thomas, M.; Tichit, M. Prospects from agroecology and industrial ecology for animal production in the 21st century. Animal 2013, 7, 1028–1043. [Google Scholar] [CrossRef]
  7. Riaboff, L.; Couvreur, S.; Madouasse, A.; Roig-Pons, M.; Aubin, S.; Massabie, P.; Chauvin, A.; Bédère, N.; Plantier, G. Use of predicted behavior from accelerometer data combined with GPS data to explore the relationship between dairy cow behavior and pasture characteristics. Sensors 2020, 20, 4741. [Google Scholar] [CrossRef]
  8. Bailey, D.W.; Trotter, M.G.; Knight, C.W.; Thomas, M.G. Use of GPS tracking collars and accelerometers for rangeland livestock production research. Transl. Anim. Sci. 2018, 2, 81–88. [Google Scholar] [CrossRef]
  9. Rook, A.; Tallowin, J.; Rook, A.J.; Tallowin, J.R.B. Grazing and pasture management for biodiversity benefit. Anim. Res. 2003, 52, 181–189. [Google Scholar] [CrossRef]
  10. Blackburn, W.H. Livestock grazing impacts on watersheds. Rangelands 1983, 5, 123–125. Available online: http://hdl.handle.net/10150/638430 (accessed on 6 February 2024).
  11. Kauffman, J.B.; Krueger, W.C. Livestock Impacts on Riparian Ecosystems and Streamside Management Implications. A Review. J. Range Manag. 1984, 37, 430. [Google Scholar] [CrossRef]
  12. Tanaka, J.A.; Rimbey, N.R.; Torell, L.A.; Taylor, D.; Bailey, D.; Delcurto, T.; Walburger, K.; Welling, B. Grazing Distribution: The Quest for the Silver Bullet. Rangelands 2007, 29, 38–46. [Google Scholar] [CrossRef]
  13. Hassan-Vásquez, J.A.; Maroto-Molina, F.; Guerrero-Ginel, J.E. GPS Tracking to Monitor the Spatiotemporal Dynamics of Cattle Behavior and Their Relationship with Feces Distribution. Animals 2022, 12, 2383. [Google Scholar] [CrossRef] [PubMed]
  14. Monteiro, A.; Santos, S.; Gonçalves, P. Precision agriculture for crop and livestock farming—Brief review. Animals 2021, 11, 2345. [Google Scholar] [CrossRef] [PubMed]
  15. Mancuso, D.; Castagnolo, G.; Porto, S.M.C. Cow Behavioural Activities in Extensive Farms: Challenges of Adopting Automatic Monitoring Systems. Sensors 2023, 23, 3828. [Google Scholar] [CrossRef]
  16. Rivero, M.J.; Grau-Campanario, P.; Mullan, S.; Held, S.D.E.; Stokes, J.E.; Lee, M.R.F.; Cardenas, L.M. Factors affecting site use preference of grazing cattle studied from 2000 to 2020 through GPS tracking: A review. Sensors 2021, 21, 2696. [Google Scholar] [CrossRef]
  17. Porto, S.M.C.; Bonfanti, M.; Midolo, G.; Castagnolo, G.; Valenti, F.; Arcidiacono, C.; Cascone, G. Preliminary outcomes of a low-power cow oestrus detection system in dairy farms. In Proceedings of the 10th ECPLF, Vienna, Austria, 29 August–2 September 2022; Available online: https://www.scopus.com/inward/record.uri?eid=2-s2.0-85159732314&partnerID=40&md5=7ad5c10517ddb7edea4c9ce4633f24cd (accessed on 10 September 2023).
  18. Brennan, J.; Johnson, P.; Olson, K. Classifying season long livestock grazing behavior with the use of a low-cost GPS and accelerometer. Comput. Electron. Agric. 2021, 181, 105957. [Google Scholar] [CrossRef]
  19. Navarro, J.; De Diego, I.M.; Fernández-Isabel, A.; Ortega, F. Fusion of GPS and accelerometer information for anomalous trajectories detection. In Proceedings of the ICSLT’19: Proceedings of the 5th International Conference on e-Society, e-Learning and e-Technologies, Vienna, Austria, 10–12 January 2019. [Google Scholar] [CrossRef]
  20. Köksal, O.; Tekinerdogan, B. Architecture design approach for IoT-based farm management information systems. Precis. Agric. 2019, 20, 926–958. [Google Scholar] [CrossRef]
  21. Vivek, G.V.; Sunil, M.P. Enabling IOT services using WIFI—ZigBee gateway for a home automation system. In Proceedings of the IEEE—ICRCICN 2015 (2016), Kolkata, India, 20–22 November 2015. [Google Scholar] [CrossRef]
  22. Alonso, R.S.; Sittón-Candanedo, I.; García, Ó.; Prieto, J.; Rodríguez-González, S. An intelligent Edge-IoT platform for monitoring livestock and crops in a dairy farming scenario. Ad Hoc Networks 2020, 98, 102047. [Google Scholar] [CrossRef]
  23. Riaboff, L.; Poggi, S.; Madouasse, A.; Couvreur, S.; Aubin, S.; Bédère, N.; Goumand, E.; Chauvin, A.; Plantier, G. Development of a methodological framework for a robust prediction of the main behaviours of dairy cows using a combination of machine learning algorithms on accelerometer data. Comput. Electron. Agric. 2020, 169, 105179. [Google Scholar] [CrossRef]
  24. Farooq, M.S.; Sohail, O.O.; Abid, A.; Rasheed, S. A Survey on the Role of IoT in Agriculture for the Implementation of Smart Livestock Environment. IEEE Access 2022, 10, 9483–9505. [Google Scholar] [CrossRef]
  25. Nobrega, L.; Tavares, A.; Cardoso, A.; Goncalves, P. Animal monitoring based on IoT technologies. In Proceedings of the IoT Vertical and Topical Summit on Agriculture, Tuscany, Italy, 8–9 May 2018. [Google Scholar] [CrossRef]
  26. Mancuso, D.; Castagnolo, G.; Parlato, M.C.M.; Valenti, F.; Porto, S.M.C. Low-power networks and GIS analyses for monitoring the site use of grazing cattle. Comput. Electron. Agric 2023, 210, 107897. [Google Scholar] [CrossRef]
  27. Schieltz, J.M.; Okanga, S.; Allan, B.F.; Rubenstein, D.I. GPS tracking cattle as a monitoring tool for conservation and management. Afr. J. Range Forage Sci. 2017, 34, 173–177. [Google Scholar] [CrossRef]
  28. Van Beest, F.M.; Loe, L.E.; Mysterud, A.; Milner, J.M. Comparative Space Use and Habitat Selection of Moose Around Feeding Stations. J. Wildl. Manage. 2010, 74, 219–227. [Google Scholar] [CrossRef]
  29. Porto, S.M.C.; Castagnolo, G.; Mancino, M.; Mancuso, D.; Cascone, G. On the determination of acceleration thresholds for the automatic detection of cow behavioural activities in extensive livestock systems. In Proceedings of the 6th International Conference on Structural Integrity and Durability (ICSID 2022), Dubrovnik, Croatia, 20–23 September 2022; Available online: https://www.scopus.com/inward/record.uri?eid=2-s2.0-85127637709&doi=10.1007%2f978-3-030-98092-4_12&partnerID=40&md5=80bd432ad7b27c3779e0c3ad047685c6 (accessed on 15 January 2024).
  30. Castagnolo, G.; Mancuso, D.; Palazzo, S.; Spampinato, C.; Porto, S.M.C. Cow behavioural activities classification by convolutional neural networks. In Proceedings of the 10th ECPLF, Vienna, Austria, 29 August–3 September 2022; Available online: https://www.scopus.com/inward/record.uri?eid=2-s2.0-85153959816&partnerID=40&md5=25d39cf4b1fb71b5d2e1ca3c2cea4709 (accessed on 24 September 2023).
  31. Massey, F.J. The Kolmogorov-Smirnov test for goodness of fit. J. Am. Stat. Assoc. 1951, 46, 68–78. [Google Scholar] [CrossRef]
  32. Birnbaum, Z.W. Numerical tabulation of the distribution of Kolmogorov statistic for finite sample size. J. Am. Stat. Assoc. 1952, 47, 425–441. [Google Scholar] [CrossRef]
  33. Chawla, N.V.; Bowyer, K.W.; Hall, L.O.; Kegelmeyer, W.P. SMOTE: Synthetic minority over-sampling technique. J. Artif. Gen. Intell. 2002, 16, 321–357. [Google Scholar] [CrossRef]
  34. Arcidiacono, C.; Mancino, M.; Porto, S.M.C.; Bloch, V.; Pastell, M. IoT device-based data acquisition system with on-board computation of variables for cow behaviour recognition. Comput. Electron. Agric 2021, 191, 106500. [Google Scholar] [CrossRef]
  35. Primi, R.; Bernabucci, G.; Evangelista, C.; Viola, P.; Girotti, P.; Spina, R.; Compagnucci, S.; Ronchi, B. Ecosystem Services Linked to Extensive Sheep and Goat Farming in Mountain Areas: A Global Literature Analysis Using Text Mining and Topic Analysis. Animals 2025, 15, 350. [Google Scholar] [CrossRef]
  36. Herlin, A.; Brunberg, E.; Hultgren, J.; Hogberg, N.; Rydberg, A.; Skarin, A. Animal welfare implications of digital tools for monitoring and management of cattle and sheep on pasture. Animals 2021, 11, 829. [Google Scholar] [CrossRef]
  37. Cabezas, J.; Yubero, R.; Visitacion, B.; Navarro-Garcıa, J.; Algar, M.J.; Cano, E.L.; Ortega, F. Analysis of accelerometer and GPS data for cattle behaviour identification and anomalous events detection. Entropy 2022, 24, 336. [Google Scholar] [CrossRef]
  38. Bernabucci, G.; Evangelista, C.; Girotti, P.; Viola, P.; Spina, R.; Ronchi, B.; Bernabucci, U.; Basiricò, L.; Turini, L.; Mantino, A.; et al. Precision livestock farming: An overview on the application in extensive systems. Ital. J. Anim. Sci. 2025, 24, 859–884. [Google Scholar] [CrossRef]
Figure 1. Typical cloud-based platform for animal health monitoring.
Applsci 15 11116 g001
Figure 2. Experimental site.
Applsci 15 11116 g002
Figure 3. Cow collar device.
Applsci 15 11116 g003
Figure 4. Architecture of the proposed model (Castagnolo et al. [30]).
Applsci 15 11116 g004
Figure 5. Mean values of acceleration along x-, y-, z-axes as the behavioral group changes from ANOVA test (F-S = Feeding while Standing; F-W = Feeding while Walking; W = Walking; L = Lying; R-L = Lying with Rumination).
Applsci 15 11116 g005
Figure 6. Confusion matrix for Branched Model in 5-class scenario and 4-class scenario (Castagnolo et al. [30]).
Applsci 15 11116 g006
Figure 7. Confusion matrix for decision tree in 5-class scenario and in 4-class scenario.
Applsci 15 11116 g007
Table 1. CI of 95% for each axis, grouped by behavior group, from ANOVA test (Porto et al. [29]).
x-axis [mg]y-axis [mg]z-axis [mg]
F-S799.89–808.03−545.87–−530.53−78.19–−66.10
F-W779.83–784.78−589.77–−580.45−109.29–−101.95
W929.15–937.20−158.70–−143.54146.63–158.58
L902.05–912.15−122.58–−93.55162.41–177.41
R-L930.10–938.52−48.50–−32.30189.82–202.31
Table 2. Tukey test outcomes (Porto et al. [29]).
Acceleration Components
x-axisy-axisz-axis
F-Srequiredrequiredrequired
F-Wrequiredrequiredrequired
Wnot requiredrequiredrequired
Lrequiredrequiredrequired
R-Lnot requiredrequireduncertain
Table 3. Results obtained in the field with thresholds computed in Porto et al. [29].
Behavioral ActivityAccuracy
F74.78%
W42.00%
L50.00%
R-L70.00%
Weighted64.00%
Table 4. Number of samples acquired for each behavioral activity.
Behavioral ActivityNumber of SamplesPercentage [%]
F-S12,18515.17
F-W16,22220.19
W15,49819.30
L919411.45
R-L27,22033.89
Total80,319100
Table 5. Test performance of the Branched Model in 5- and 4-class scenarios considering 10-folds.
5-Class Scenario4-Class Scenario
Behav. GroupsF1 Score (%)Precision (%)Recall (%)F1 Score (%)Precision (%)Recall (%)
F-S62.00 ± 6.8765.75 ± 7.0858.75 ± 7.5095.25 ± 0.5095.50 ± 0.5795.00 ± 0.81
F-W76.75 ± 4.1173.75 ± 4.0180.25 ± 3.94
W84.20 ± 2.3883.75 ± 2.2185.75 ± 3.4085.00 ± 3.7084.75 ± 3.6085.00 ± 4.01
L78.50 ± 5.3274.00 ± 8.6083.75 ± 1.5081.25 ± 4.0079.25 ± 2.5083.25 ± 4.50
R-L86.25 ± 3.5092.50 ± 2.0888.75 ± 2.5090.25 ± 2.7591.50 ± 3.0290.00 ± 2.16
Weighted average81.50 ± 1.2981.00 ± 0.8180.75 ± 0.9590.01 ± 1.4990.10 ± 1.2089.89 ± 0.91
Table 6. Test performance of both scenarios proposed considering 10-fold (Castagnolo et al. [30]).
ModelsScenariosF1 Score (%)Precision (%)Recall (%)
Branched Model5-class81.50 ± 1.2981.00 ± 0.8180.75 ± 0.95
Simple 1D CNN5-class78.96 ± 0.9779.01 ± 1.0278.93 ± 1.06
MLP5-class74.76 ± 1.2675.11 ± 1.1474.42 ± 1.32
Branched Model4-class90.01 ± 1.4990.10 ± 1.2089.89 ± 0.91
Simple 1D CNN4-class87.26 ± 0.3587.21 ± 0.7587.32 ± 0.62
MLP4-class84.79 ± 0.6585.13 ± 1.1084.45 ± 1.36
Table 7. Test performance, per class, of both scenarios proposed considering 10-fold for decision tree.
5-Class Scenario4-Class Scenario
Behav. GroupsF1 Score (%)Precision (%)Recall (%)F1 Score (%)Precision (%)Recall (%)
F-S79.80 ± 0.0290.28 ± 0.0171.02 ± 0.0193.39 ± 0.0696.37 ± 0.0690.61 ± 0.02
F-W47.53 ± 0.0236.20 ± 0.0269.17 ± 0.02
W57.56 ± 0.0251.01 ± 0.0266.15 ± 0.0355.88 ± 0.0448.56 ± 0.0265.80 ± 0.03
L62.66 ± 0.0254.76 ± 0.0473.61 ± 0.0561.39 ± 0.0454.05 ± 0.0371.25 ± 0.04
R-L78.56 ± 0.0186.96 ± 0.0271.71 ± 0.0378.73 ± 0.0285.35 ± 0.0173.08 ± 0.02
Weighted average72.83 ± 0.0177.39 ± 0.0171.02 ± 0.0182.47 ± 0.0284.28 ± 0.0181.53 ± 0.01
Table 8. Test performance of both scenarios proposed considering 10-fold for decision tree.
ModelsScenariosF1 Score (%)Precision (%)Recall (%)
Decision Tree5-class72.83 ± 0.0177.39 ± 0.0171.02 ± 0.01
Decision Tree4-class82.47 ± 0.0284.28 ± 0.0181.53 ± 0.01
Table 9. Schematic comparison among the three classification criteria analyzed.
MethodBenefitsDrawbacks
StatisticalImplementable on firmware, LPWAN benefits, acceptable power consumption (180 µA at 4 Hz)Medium-level accuracy (64%)
Neural NetworkHigh flexibility, very high accuracy (until 90%)High computational power, high memory capacity required
Decision TreeHigh computing powerHigh computational power, high energy consumption for connectivity
Disclaimer/Publisher’s Note: The statements, opinions and data contained in all publications are solely those of the individual author(s) and contributor(s) and not of MDPI and/or the editor(s). MDPI and/or the editor(s) disclaim responsibility for any injury to people or property resulting from any ideas, methods, instructions or products referred to in the content.