Article

Biomass Additives Enhance Continuous Production of Biogenic Methane from Coal

by
Liu Zhu
1,2,
Wangjie Diao
1,2,*,
Haihan Wang
1,
Peilin Zhu
1 and
Zeguang Tang
1
1
School of Mines, China University of Mining & Technology, Xuzhou 221116, China
2
Yunlong Lake Laboratory of Deep Underground Science and Engineering, Xuzhou 221116, China
*
Author to whom correspondence should be addressed.
Appl. Sci. 2025, 15(20), 11068; https://doi.org/10.3390/app152011068
Submission received: 18 September 2025 / Revised: 12 October 2025 / Accepted: 14 October 2025 / Published: 15 October 2025

Abstract

Microbial coal gasification technology is a new, efficient, and clean method for coal resource mining; however, its commercial application remains limited by gasification efficiency and cost. To examine the impact of biomass on microbial coal gasification processes, improve gas production efficiency, and identify economically viable nutrient supplements with broad availability, this study employed culture medium (CM), sawdust (SD), and blue-green algae (BA) as nutritional additives. An anaerobic fermentation experiment with three-stage nutrient supplementation was conducted using a fed-batch reactor. The comparison of gas and liquid compositions within reactors throughout the reaction process demonstrated that key nutrient supplementation could reactivate methane production in reactors in which gas generation had ceased. Gas composition analysis revealed that under identical conditions, BA supplementation achieved the highest methane yield (24.49 ± 1.31 mL/g), followed by SD (1.56 ± 0.1 mL), representing 24.13-fold and 1.53-fold increases, respectively, compared with the yield in CM control group. Analysis of 16S rRNA sequencing indicated that nutrient supplementation induced microbial community differentiation, with dominant bacterial genera (Herbinix, Proteiniborus) shifting according to the organic composition of the liquid environment. A positive feedback relationship between microbial life activities and functional performance further confirmed the dominance of these superior strains. This study advances the understanding of substrate degradation characteristics in microbial coal degradation systems and provides theoretical support for the clean and efficient coal exploitation.

1. Introduction

With the transformation of economic structures in emerging economies and developing countries, the continuous consumption of traditional energy sources and shallow-depth mineral resources has increased annually, exerting significant pressure on energy security and stability. Coalbed methane (CBM) is an unconventional natural gas that plays a vital role in optimizing the energy supply stability and facilitating the transition to clean energy. Its development and utilization are inevitable outcomes of the future diversification of the energy industry. The genesis of CBM is generally classified into biogenic, thermogenic, and mixed origins [1,2,3]. Approximately 20% of global natural gas resources may be biogenic [4], with Permian coals in the Bowen Basin and Jurassic Walloon coal measures in the Surat Basin still actively generating biogenic methane [5,6]. Extensive research has been conducted on the factors and mechanisms that influence biogenic methane production from coal [7,8,9,10].
In recent years, researchers have successively proposed the concept of microbially enhanced coalbed methane (MECBM) [11,12]. This technology, based on anaerobic fermentation theory, aims to degrade organic components in coal through specialized metabolic pathways and biological enzyme systems of indigenous coal seam microorganisms, generating methane, CO2, and light hydrocarbons. MECBM holds considerable potential for improving coal mining and utilization efficiency. However, coal biomethanation is a multistep process in which methane production is influenced by factors such as coal rank, liquid environment, and microbial characteristics [13,14,15,16]. Accordingly, researchers have optimized anaerobic fermentation processes from multiple perspectives. For instance, supplementing nutrients such as nitrogen, phosphorus, cobalt, nickel, and iron can stimulate methanogen growth and enhance biological enzyme-mediated degradation efficacy [17,18,19]. Concurrently, some studies have utilized coal as the sole nutrient source for microbial screening and directional domestication [20,21]. Since individual strains typically fail to achieve efficient coal methanation [22,23,24], constructing synthetic microbial consortia by combining domesticated microbial communities [25] provides a novel approach for CBM enhancement. Additionally, coal pretreatment strategies—including physical methods (e.g., pulverization, hydraulic fracturing) to increase specific surface area and chemical methods (e.g., alkali treatment, bio-oxidation, etc.) to promote coal molecular depolymerization—offer innovative pathways for advancing microbial coal gasification.
Methanogens, as a group of strictly anaerobic archaea, exhibit highly specialized metabolic capabilities. They are generally restricted to utilizing simple molecules such as acetate, hydrogen, carbon dioxide, formate, and methanol. This gives rise to various methanogenic pathways, including hydrogenotrophic, acetoclastic, and methylotrophic types [26,27,28,29]. These archaea lack the extensive enzymatic systems found in many other microorganisms; they cannot independently hydrolyze or ferment complex organic compounds like proteins, polysaccharides, or lipids into simpler substrates. Consequently, their survival in natural environments depends on close syntrophic interactions with hydrolytic and fermentative bacteria. This consequently implies that the efficiency of coal biodegradation depends not only on consortium structural parameters (such as richness and diversity) but, more critically, on the functional adaptive capacity of the microbial community. That is, under environmental influences, the population structure undergoes dynamic succession and adjusts its metabolic strategies—for example, the methanogenic pathways shifting from solely acetoclastic to a versatile mix of multiple pathways—to efficiently respond to variations in substrate composition and concentration, thereby maintaining the stability of system function [30,31]. Furthermore, in situ coal biodegradation for methane production faces efficiency limitations owing to the availability of water-soluble compounds, aggregation of structures, and nutrient scarcity in geological formations.
Most studies have focused on the conversion of coal into methane in batch reactors [32,33]. While batch systems facilitate better control of initial conditions, easier replication, and lower costs, microbial processes may terminate due to substrate depletion or the accumulation of inhibitory byproducts [34]. Intriguingly, coal remains bioavailable even after methane production ceases [35], with substrate limitations primarily linked to nitrogen and phosphate availability, as evidenced by methane production reactivation following supplementation of these critical nutrients. However, microbial coal gasification technology has not been widely implemented due to limitations in gasification costs and efficiency. Therefore, developing a low-cost, high-efficiency, and widely distributed catalyst for coal biomethanation has become a critical research priority.
This study employed a fed-batch reactor system to conduct anaerobic fermentation experiments of coal. Following the complete cessation of gas production in all reactors, the control group was supplemented with culture medium while the experimental group received biomass supplementation. The gas production characteristics (mixed gas, CO2, and methane) after nutrient supplementation were systematically analyzed to evaluate the feasibility of biomass-mediated reactivation of anaerobic degradation processes in reactors and their gas generation performance. Through comprehensive characterization of microbial communities within reactors, comparative analysis of microbial population differences under distinct nutrient supplementation conditions was performed to identify key microorganisms governing methane production. These findings establish a theoretical foundation for sustainable biomethane production from coal and provide strategic guidance for enhancing coal-to-methane conversion efficiency.

2. Materials and Methods

2.1. Sample Collection and Preparation

The coal samples (BYH) were collected from the Baiyinhua Coal Mine in Inner Mongolia, China. After drying, the coal samples were passed through a 200-mesh sieve. Industrial analysis was performed using the 5E-MAG6700 fully automatic industrial analyzer, with each sample tested three times. The results of the industrial and elemental analyses of the coal samples are shown in Table 1 and Table 2, respectively.

2.2. Enrichment and Cultivation of Methanogens

Microbial consortia for gas generation from coal via fermentation can be mesogenic in coal and mine water and exogenous strains. Native strains are advantageous due to their habitat in coal seams and because they can quickly adapt to the environment when activated. However, there is a limited number of native strains, and they often do not involve the crucial conversion of macromolecules in coal to small molecules. Therefore, exogenous strains are preferred because of the associated high cell density and the abundance of strains. These strains can adapt to coal seam environments after targeted domestication. In this study, multiple strains were extracted from sludge under anaerobic conditions and utilized for enrichment experiments.
The cultures were prepared in 250 mL/L serum bottles, and each liter of the medium [based on a liter of distilled and deionized water (DDW)] contained 985 mL/L of the mineral solution, 5 mL/L of a trace metal solution, and 10 mL/L of vitamins. The mineral solution comprised the following: 0.8, 1, 0.1, 0.1, 0.165, and 0.04 g of NaHCO3, NH4Cl, KH2PO4, KCl, MgCl2·6H2O, and CaCl2·2H2O, respectively. The trace metal nutrient solution contained the following: 2, 0.88, 0.41, 0.2, 0.08, 0.02, 0.02, 0.02, 0.02, 0.02, and 0.02 g of aminotriacetic acid, MnCl2·H2O, FeCl2·6H2O, CoCl2·6H2O, ZnCl2, CuCl2·2H2O, NiCl2·6H2O, Na2MoO4·2H2O, Na2SeO3, NaWO4·6H2O, and NaWO4·6H2O, respectively. The vitamin solution included the following: 10, 5, 5, 5, 5, 5, 5, 5, 5, 2, and 2 mg of pyridoxine HCl, mine HCl, riboflavin, calcium pantothenate 5 mg, thioctic acid, p-aminobenzoic acid, nicotinic acid, vitamin B12, mercaptoethanesulfonic acid (MESA), biotin, and folic acid, respectively. During the anaerobic enrichment, 2 g of yeast extract and 2 g of tryptone were added per liter of culture.

2.3. Batch Gas Production Experiment

In this experiment, 250 mL saline bottles were used as reactors, and Xilingol lignite was used as the coal sample. Culture medium (CM), sawdust (SD), and blue-green algae (BA) were used as supplementary nutrient sources. The difference in the inoculated strains was that the inoculation was carried out during the gas production stop stage in the process of enriching the composite strains. At this stage, the nutrients in the reactor were completely consumed, ensuring that no other carbon sources were present in the inoculation solution. Eighteen fermentation bottles were prepared. Among them, nine fermentation bottles, containing coal powder, formed the experimental group and were labeled Exp-1 to Exp-9. The remaining nine fermentation bottles, without any added carbon source, served as the control group and were labeled Ctr-1 to Ctr-9. T-shaped rubber stoppers were used to seal the anaerobic operation box, and after sealing, aluminum caps were crimped onto the bottles. The fermentation bottles were shaken evenly and placed in a water bath at 35 °C. The gas generated in the reactor was discharged through a syringe needle, a one-way valve, and a hose to maintain atmospheric pressure inside the reactor at the same level as that on the outside. The experimental setup is shown in Figure 1. The experiment was conducted in three stages. In the first stage, 20 g of coal powder was added to the experimental group, while no coal powder was supplemented in the control group; both groups were fermented separately. Upon stabilization of the gas production curves, the second stage was initiated, in which different nutrient sources were added to monitor the resumption of gas production. After the gas production curves stabilized again, the third stage was carried out. To account for the consumption of available substances in coal and to evaluate the effect of nutrient reduction on methane production, nutritional supplementation in the third stage was reduced fivefold. The feeding strategies for the fermentation bottles at different periods are summarized in Table 3.

2.4. Instruments and Methods

2.4.1. Determination of Gas Production Components

The main components of the gas produced by fermentation were CH4, CO2, and H2. The composition of the gas was determined using a Zhejiang Fuli 9790plus gas chromatograph. Both CH4 and CO2 were detected using a Thermal Conductivity Detector (TCD), and CO2 and N2 were also detected with a TCD. Argon (99.999%) was used as the carrier gas. The flow rates of hydrogen and air were 30 and 300 mL/min, respectively. The temperatures of the syringe injection port, column oven, first TCD, and second TCD were set to 120 °C, 100 °C, 200 °C, and 130 °C, respectively. The standard gas mixture consisted of 1% each of CH4, CO2, and H2, with 97% N2. A 1 mL gas sample was drawn from the reactor using a 1 mL sampler and injected into the gas chromatograph for analysis.

2.4.2. Molecular Biology Tests

Microorganisms in the fermentation broth were enriched using a 0.22-micron filter and a vacuum filtration device. Polymerase chain reaction (PCR) was used to detect microbial communities in the fermentation broth before and after the reaction. For bacterial amplification, 338F and 806R primers were used, producing an amplicon of 468 bp. For archaea, 524F and 958R primers were used, producing an amplicon of 434 bp. PCR products from the same sample were pooled and analyzed using 2% agarose gel electrophoresis. Based on the electrophoresis results, the TruSeq DNA Sample Prep Kit was used to construct the MiSeq library.

3. Results

3.1. Gas Production

3.1.1. CH4 Production

The results of methane production are presented in Figure 2. The experiment indicates that during the stage when the reaction stabilizes, supplementing the degradation substrate can promote further methane production. Compared to the experimental group, the control group exhibited lower total mixed gas production. The overall gas production curves of the CM and BA groups were relatively moderate, while the SD group showed similar gas production trends between its control and experimental groups. After supplementing the reactor with materials, the gas production curve of the experimental group showed three stages: slow increase, rapid increase, and a tendency to moderate. This may be because methanogenesis can only occur under a specific CO2 concentration. Under the conditions of the first and second nutritional supplements, key time points, such as the initial gas production point, peak gas production rate point, and stable gas production point, were similar. However, during the third feed supplementation, owing to the exhaustion of nutrients in the initial carbon source, the influence of the supplemented nutrient source was amplified, and the variations in its physical and chemical properties led to significant differences in the curve. In the control group, when SD was used as the feed supplement, a small amount of methane was produced during the second and third nutritional supplements, whereas methane production in the rest of the control group remained close to 0. During the first feed supplementation, cumulative methane production in each experimental group ranged between 10 and 20 mL. During the subsequent feed supplementation stages, BA showed the strongest promoting effect, with average cumulative methane production of 0.66 ± 0.08 mL/g, 13.99 ± 0.62 mL/g, and 9.37 ± 0.31 mL/g, during the first, second and third nutritional supplements, respectively. This was followed by SD (0.83 ± 0.12 mL/g, 1.01 ± 0.08 mL/g, 0.05 ± 0.01 mL/g), while the CM had the weakest promoting effect (0.74 ± 0.14 mL/g, 0.31 ± 0.1 mL/g, 0.01 ± 0.003 mL/g).

3.1.2. CO2 Production

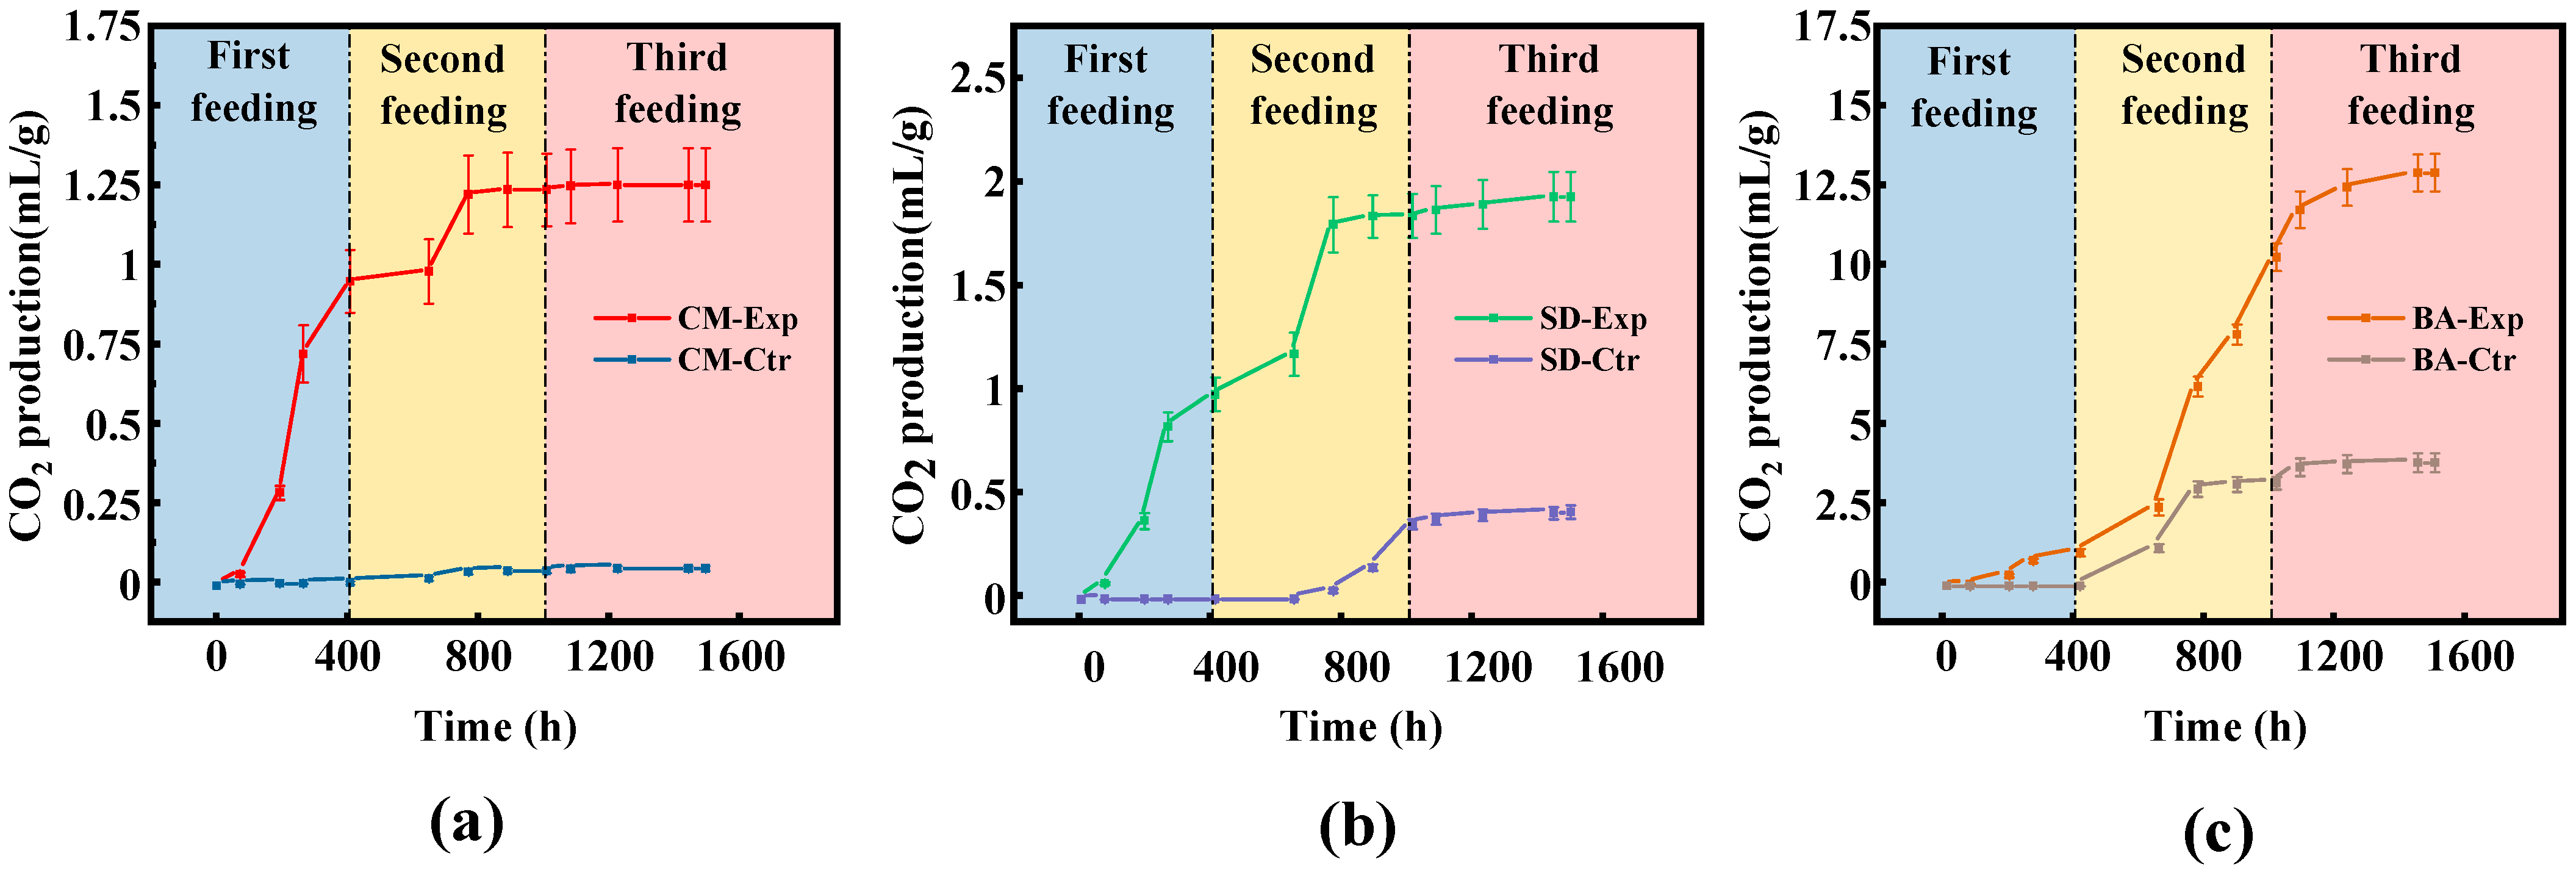
The CO2 production results during the feeding experiment are shown in Figure 3. The experiment indicates that during the stabilization stage of the reaction, supplementing the degradation substrate promotes further CO2 production. A correlation was observed between CO2 and methane production, with their production curves exhibiting certain similarities in shape, trend, and variation. After adding the feed supplement, the CO2 production rate began to increase before stabilizing as the reaction progressed. No preparatory stage occurred, possibly because CO2 was a direct byproduct of organic matter degradation. In most experimental and control groups, the durations of the high and stable gas production periods during the first and second nutritional supplements were similar. Notably, during the second feed supplementation experiment with SD, the control group produced less CO2 than the experimental group, but the production rate did not decrease. This suggests that SD has good potential for CO2 production. In the third feed supplementation, the effect of the feed supplement was more pronounced, leading to significant differences in the curves. As the number of feedings increased, CO2 production in the control group gradually decreased. When the feed was supplemented for the first time, average CO2 production in the experimental group ranged from 15 to 25 mL. In subsequent feed supplementation experiments, BA still had a stronger promoting effect than the other supplements, with average cumulative CO2 production of 1.41 ± 0.12 mL/g, 9.24 ± 0.43 mL/g and 2.64 ± 0.58 mL/g during the first, second and third nutritional supplements, respectively. This was followed by SD (0.98 ± 0.08 mL/g, 0.86 ± 0.11 mL/g, 0.13 ± 0.09 mL/g), while CM had the weakest promoting effect (0.95 ± 0.1 mL/g, 0.29 ± 0.11 mL/g, 0.11 ± 0.01 mL/g).

3.2. Microbial Community Diversity

The Venn diagrams (Figure 4) analyzed the changes in core species within the reactor. Feed supplementation significantly affected the composition and function of microorganisms in the reactor. Specifically, the number of unique species varied across different reactors. At the genus level, 1293 operational taxonomic units (OTUs) were identified for bacteria, with common species accounting for 11.21%. For archaea, 1293 OTUs were obtained, with common species accounting for 46.67%.
In Principal Component Analysis (PCA), shorter distances between points indicate smaller differences in community structure. For bacteria, the two axes in Figure 5a show 81.91% of the variance. No overlap is observed among different samples, and the bacterial community of the BA group was the farthest from the other samples. For archaea, the two axes in Figure 5c show 88.33% of the variance. The samples from the CM and SD groups had a high degree of overlap and were closest to each other.
To study the similarities or differences in the community structures of different samples, cluster analysis was performed on the community distance matrix of bacterial samples from different reactors, and a hierarchical clustering tree was constructed. The length between different branches represents the distance between the samples. As shown in Figure 5b, the homology among bacterial groups was poor. For archaea (Figure 5d), samples from the CM and BA groups were relatively close, indicating that the addition of SD changed the composition of the archaeal community to a certain extent.

3.3. Microbial Community Structure

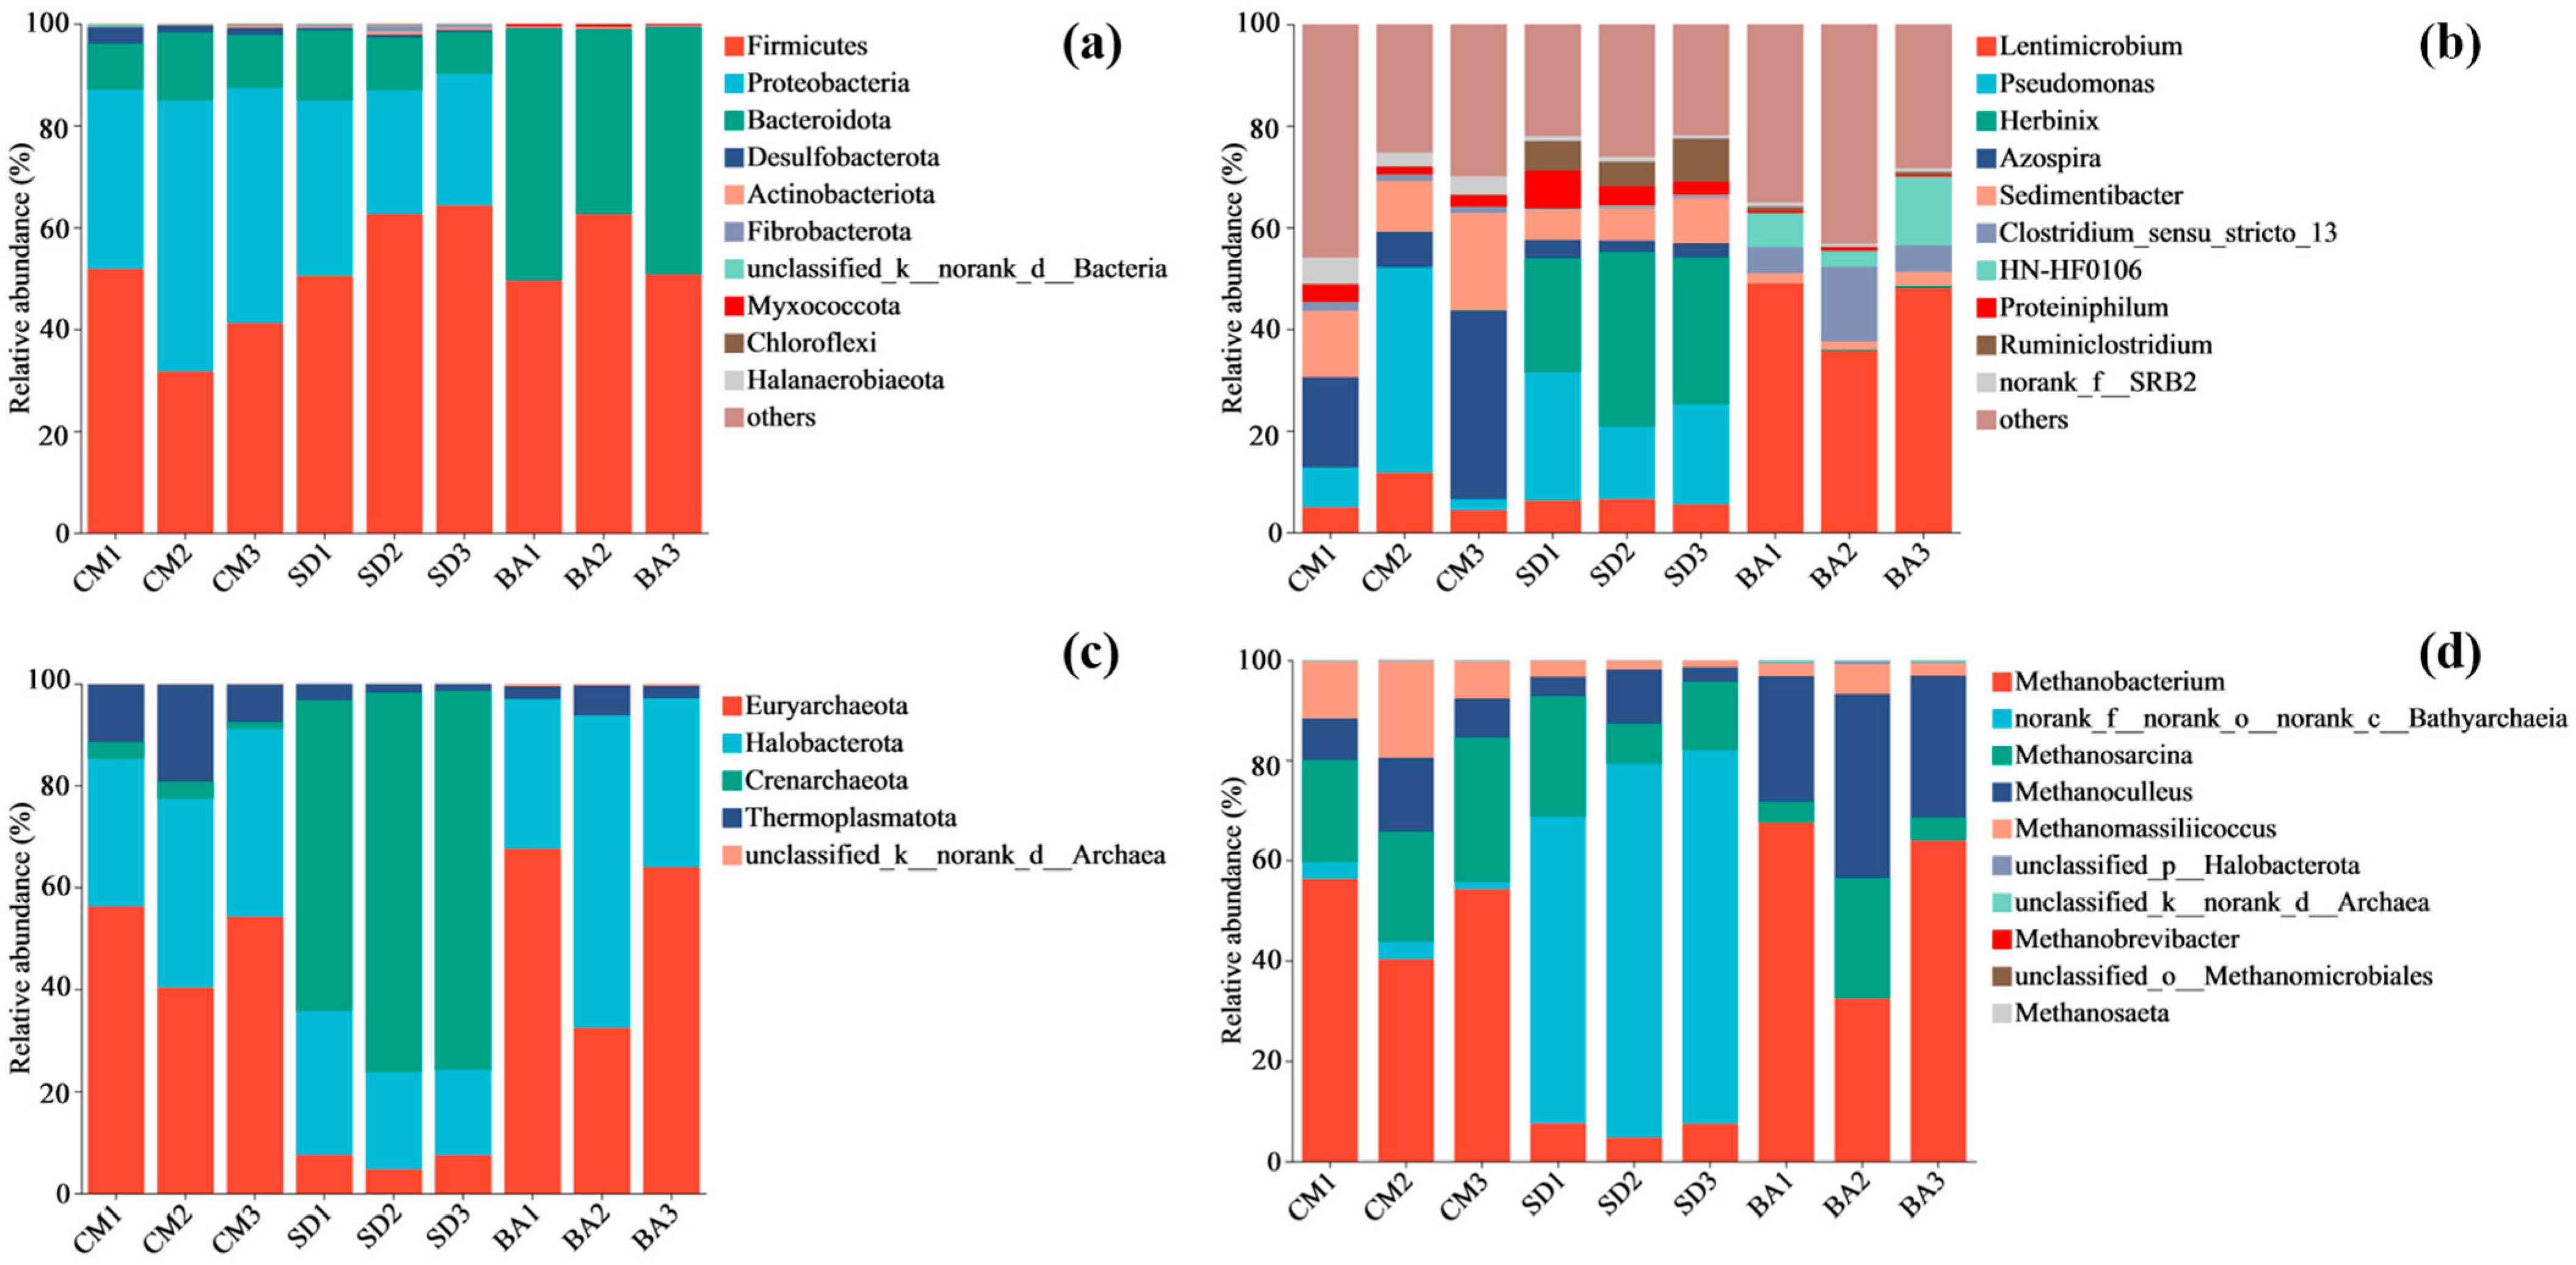
Comparative analysis revealed that dominant bacterial species differed under different nutrient supplementation conditions (Figure 6a,b). In the CM group, Firmicutes (31.19–51.73%), Proteobacteria (36.71–54.65%), and Bacteroidota (9.32–13.28%) were the dominant bacterial phyla. Among them, Azospira (7.41–36.89%) and Pseudomonas (2.71–40.29%) in the Proteobacteria were the dominant genera. The dominant phyla in the SD and CM groups were identical. However, the abundance of Firmicutes (50.71–64.29%) increased and was higher than that of Proteobacteria (25.71–26.36%). The dominant genera included Pseudomonas (15.26–26.52%) and Herbinix (21.78–34.29%), both belonging to the Proteobacteria. Almost no Proteobacteria were detected in the reactor in the BA group. Firmicutes (49.10–62.22%) and Bacteroidota (36.14–40.46%) were the dominant bacterial phyla. The dominant genera were mainly Proteiniphilum (35.21–48.36%) in Bacteroidota and Clostridium sensu stricto 13 (5.13–15.65%) in Proteobacteria.
For archaea, the CM group was similar to the BA group. Euryarchaeota (40.12–56.81%) and Halobacterota (29.12–37.85%) we the dominant archaeal phyla in the CM group. Compared with the CM group, the average contents of Euryarchaeota (31.93–67.44%) and Halobacterota (30.03–33.21%) in the BA group were higher, and the community structure was simpler. In the SD group, Crenarchaeota (17.65–27.94%) and Halobacterota (60.29–73.95%) were the dominant phyla. At the genus level, Methanosarcina, Methanobacterium, and Methanoculleus were the dominant genera. Notably, nutrient supplementation altered the microbial environment. Due to the methanogenesis pathway, the types of dominant genera in each experimental group were similar, but their abundances differed significantly. Additionally, when SD was used as a nutrient supplement, the abundance of unknown genera under Bathyarchaeia (62.13–75.32%) was relatively high (Figure 6c,d).

4. Discussion

4.1. Differences in Gas Production Performance of Different Supplements

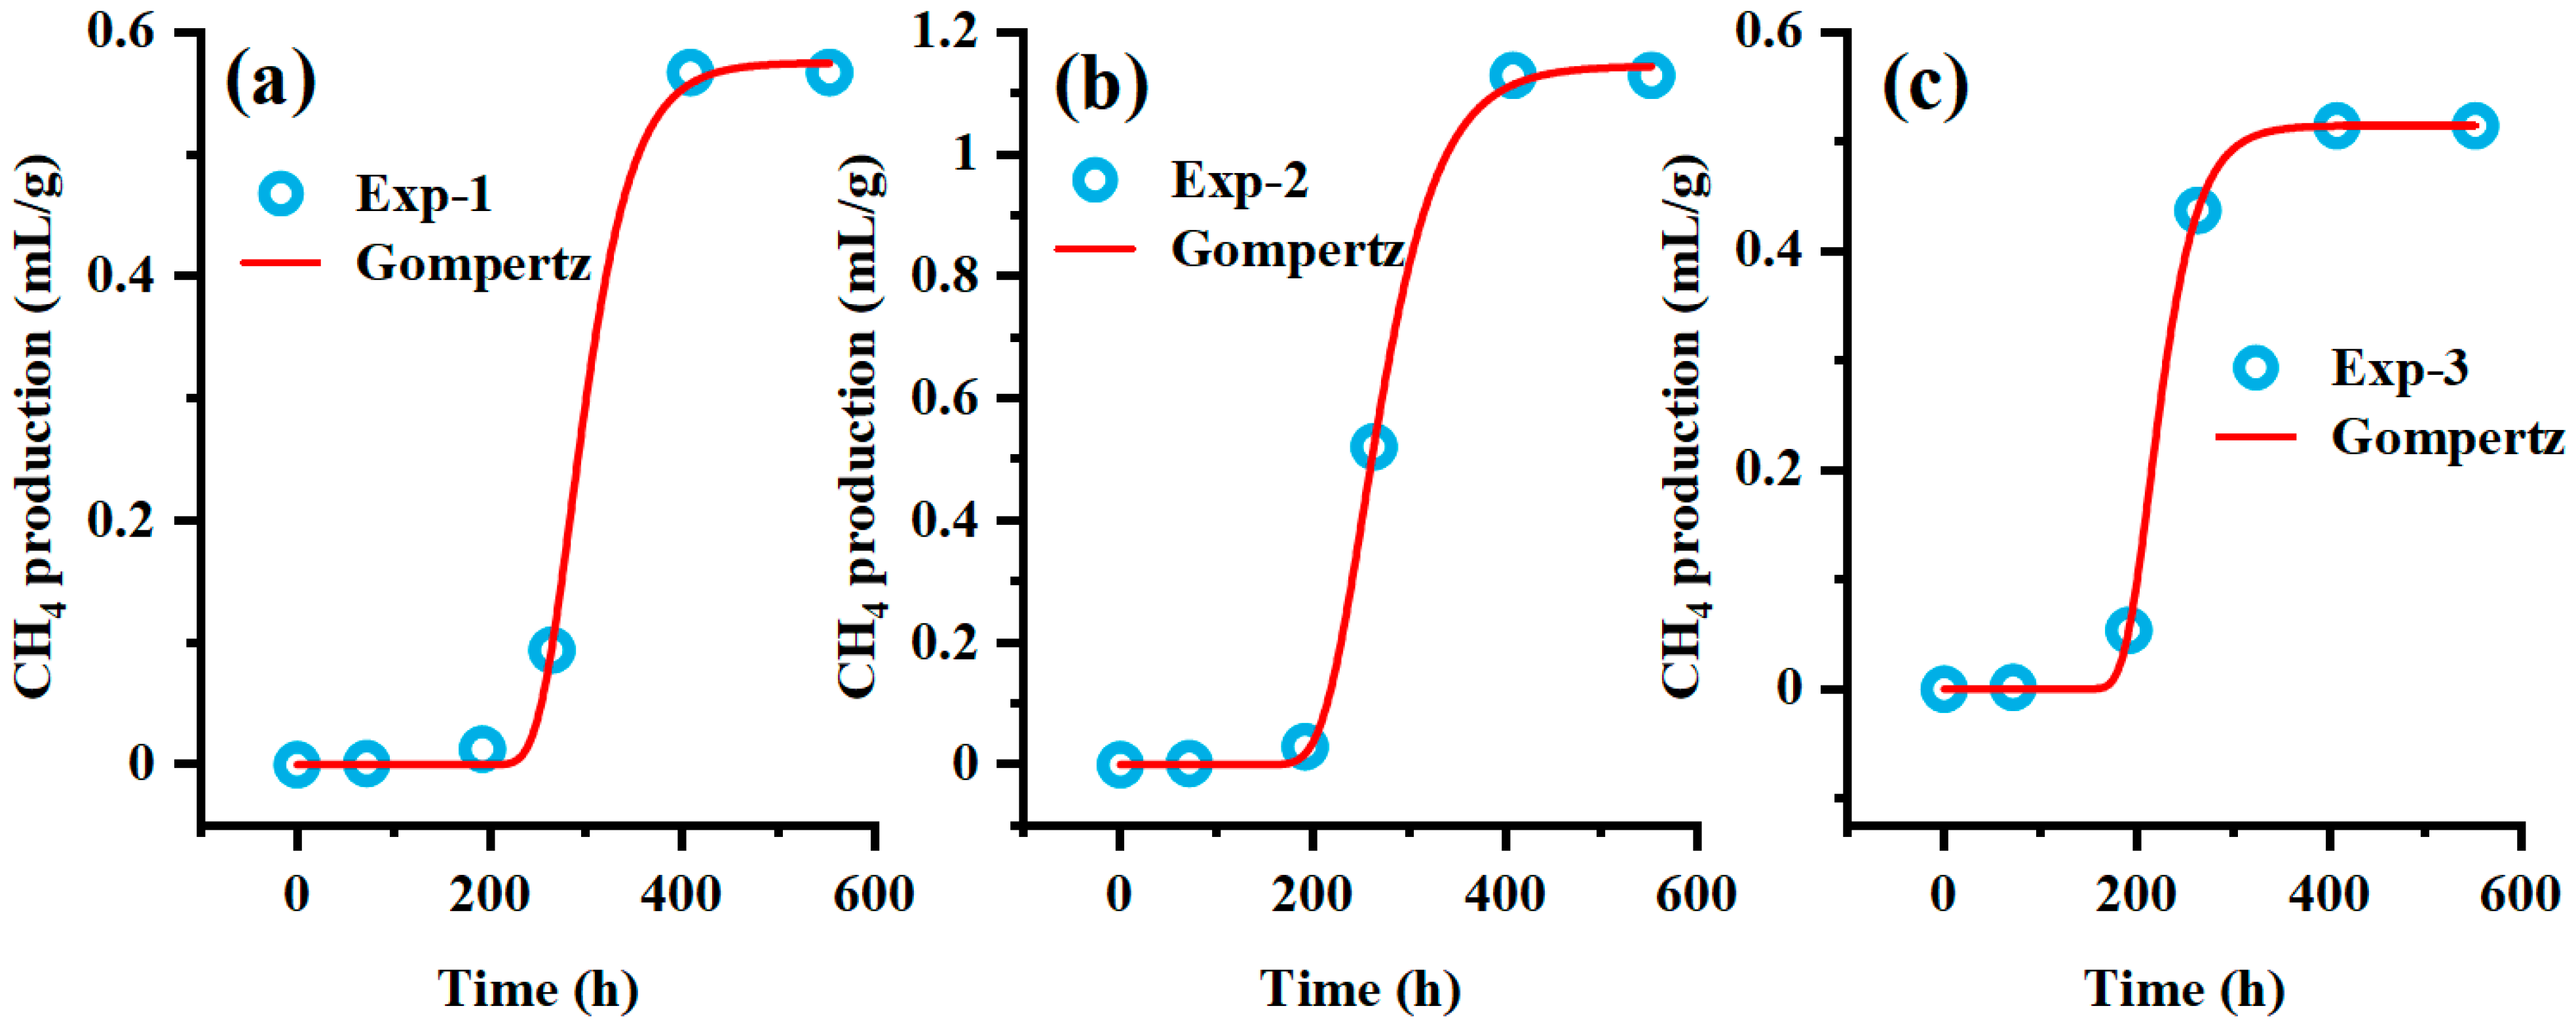
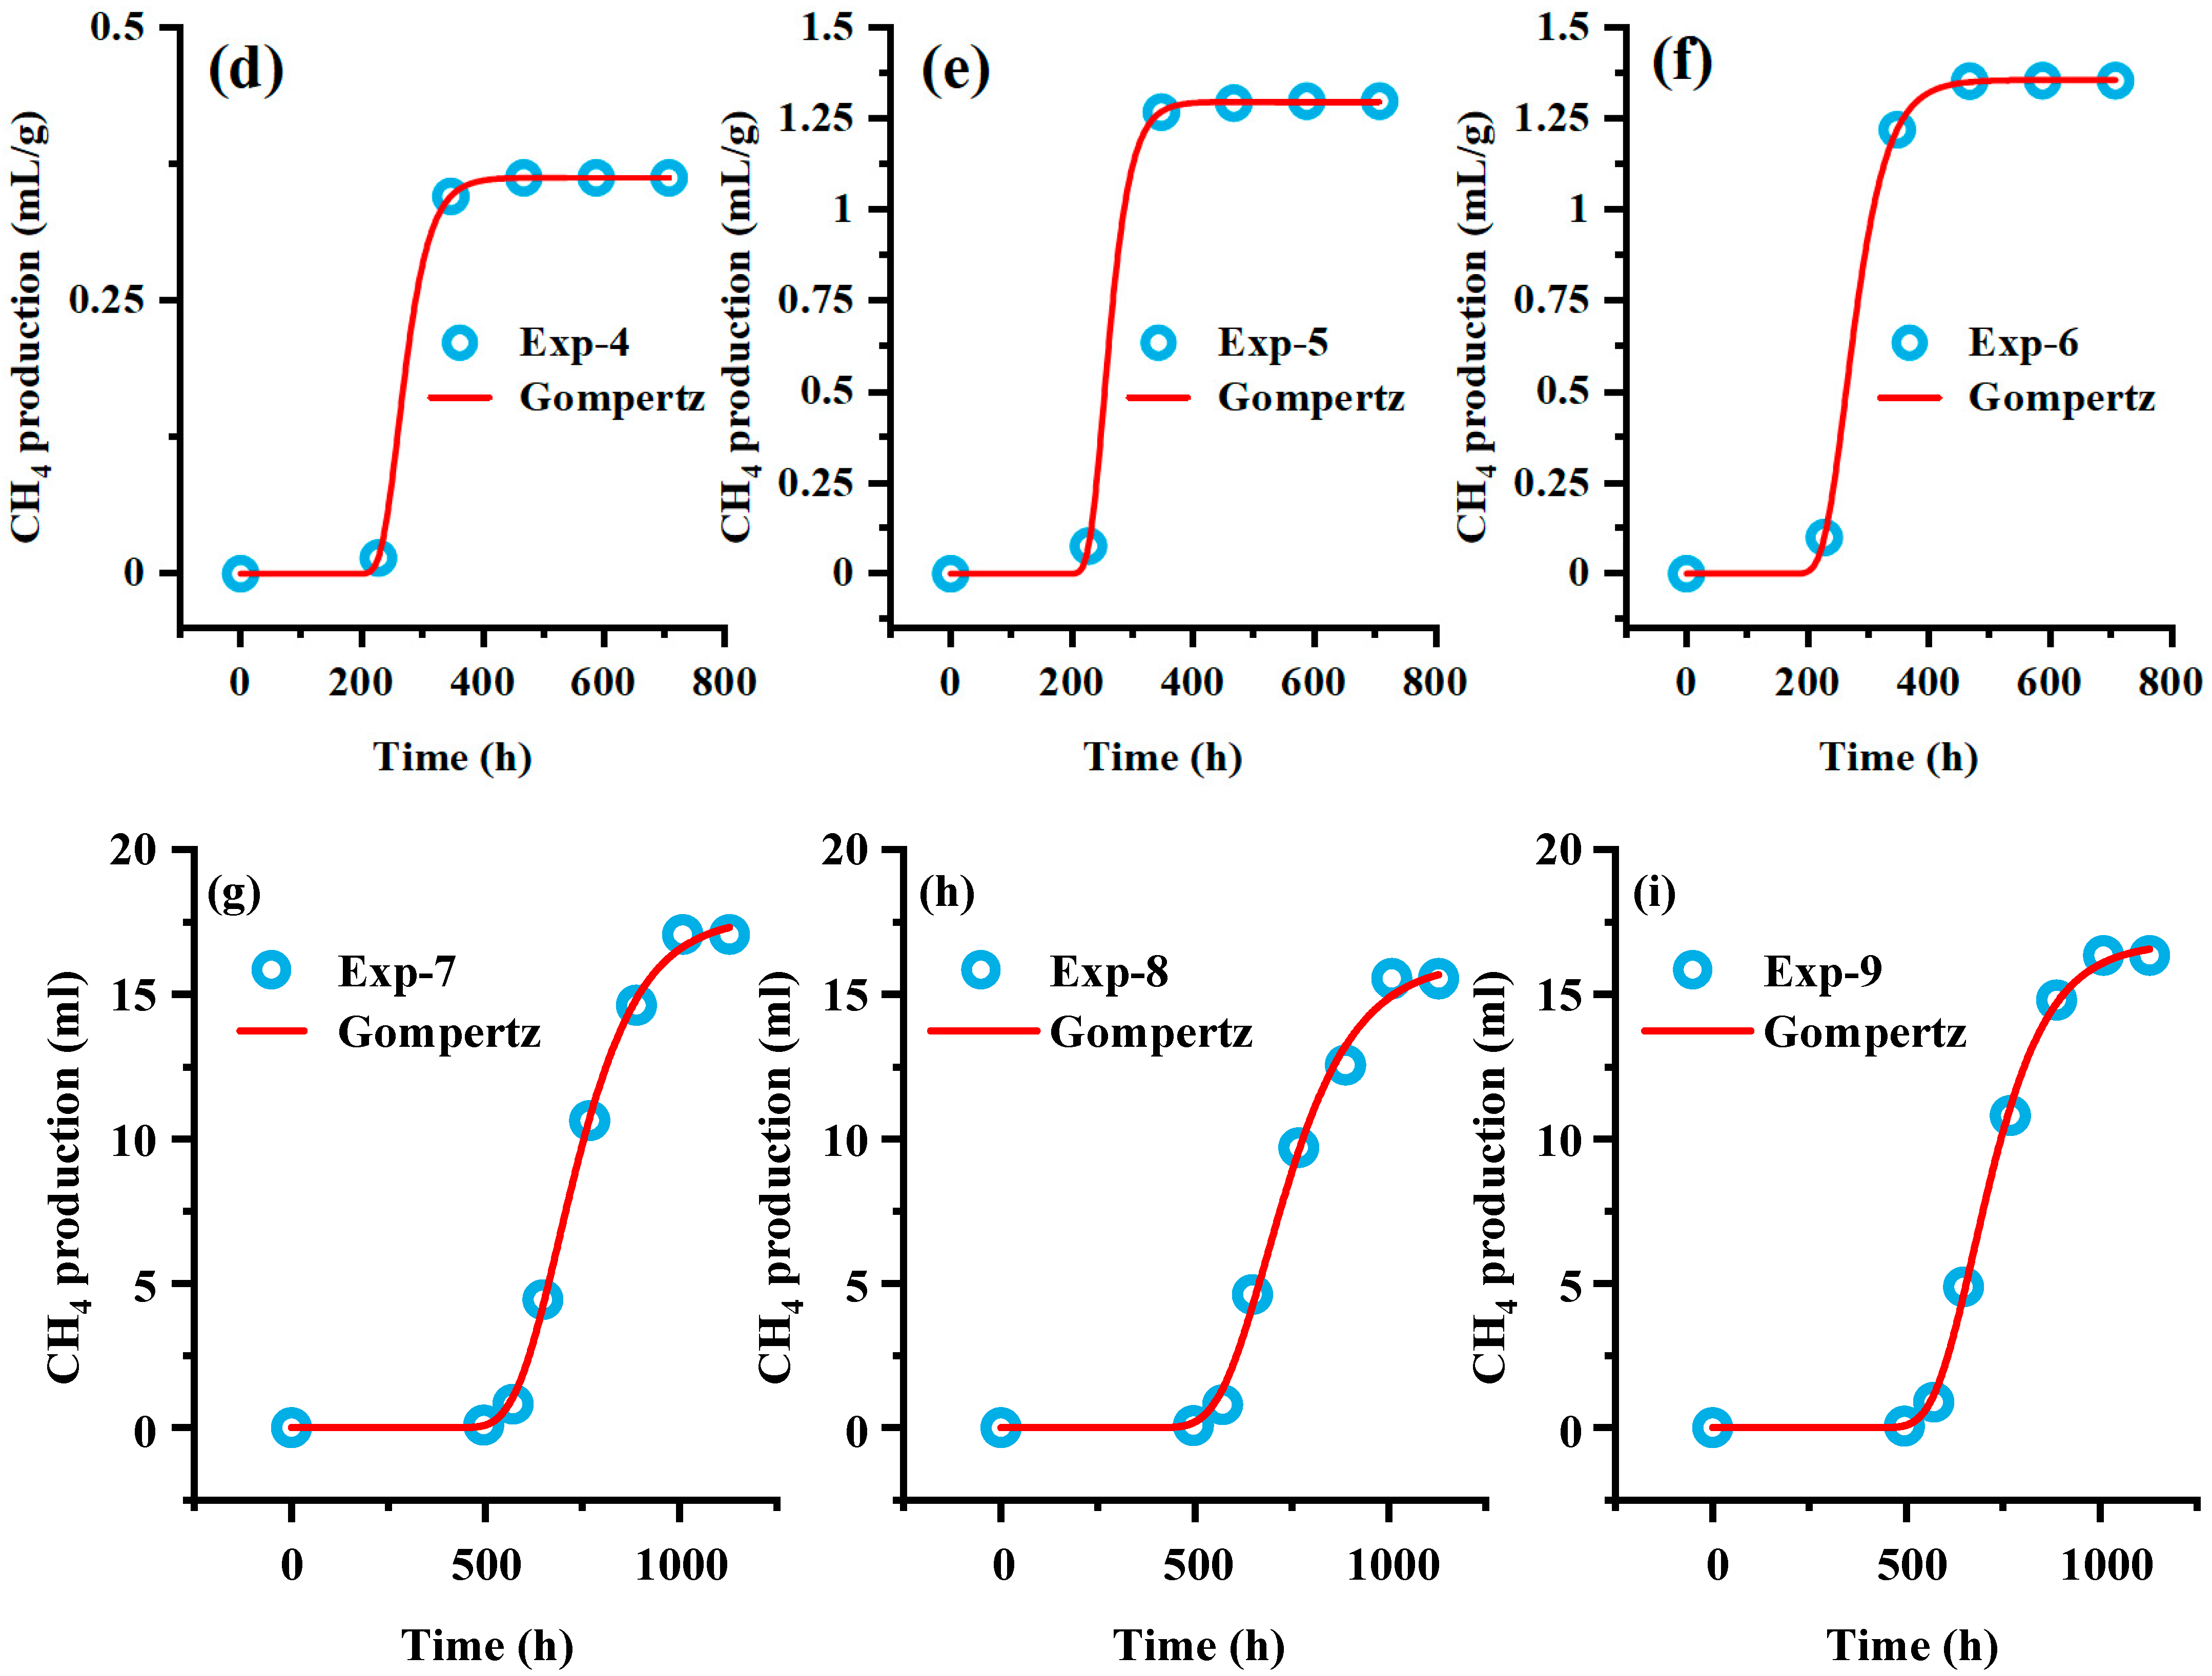
Supplementation with key nutrients can restart the anaerobic digestion (AD) of coal in the fed-batch reactor, and the supplementation of BA can greatly promote methane production. The Gompertz model was applied to fit the methane production curve after the second nutrient supplementation, describing the exponential gas production rate in the curve and the relationship between methane production and time during the lag phase (Figure 7). The regression fit shows strong and statistically sound results, with a 95% confidence level and coefficients of determination (R2) all greater than 0.99. The fitting parameters are presented in Table 4. AE represents cumulative methane production, while μm represents the instantaneous methane production rate at the inflection point of the methane production kinetic curve, corresponding to the theoretical maximum methane production potential. This parameter directly reflects the metabolic activity intensity of methanogenic archaeal communities. Since methanogens lack the ability to directly degrade macromolecular organic matter and must rely on syntrophic metabolic relationships with hydrolytic and fermentative bacteria, μm also indirectly indicates the structural complexity of the substrate composition, the efficiency of collaborative operation between microbial communities, as well as the extent to which environmental factors influence microbial methane generation. The BA group showed the highest methane production, likely because BA enhances microbial activity by providing essential nutrients for hydrolytic and fermentative bacteria, thereby stimulating methane production [36,37]. Compared with BA, wood chips are mainly composed of lignocellulose, an aromatic polymer with a three-dimensional network structure, making it considerably resistant to degradation [38,39]. λ represents the lag phase. During this period, the response of microorganisms to environmental changes is delayed, and the substrate is mainly used for vital activities of the microorganisms themselves. The lag phase reflects the adaptability of microorganisms to the environment. After feed supplementation, the λ values of the CM group and SD group were relatively close, whereas the BA group had λ value approximately 2.5 times higher than that of the other experimental groups. Thus, after supplementation with BA, the microbial adaptability to the environment declined. Based on the fitting results, we speculate that after supplementing feed with citations, the carbon-to-nitrogen ratio (C/N) in the liquid environment decreased, resulting in a decrease in the proportion of organic matter and a short-term ammonia inhibition effect [40,41,42]. After selection, dominant bacterial species are retained and participate in the anaerobic degradation of the substrate.

4.2. Microbial Community Features

The Venn analysis results demonstrated significant divergence in microbial composition within reactors under different nutrient supplementation conditions, suggesting that nutrient supplementation induced habitat modification and consequently led to distinct differentiation in microbial community structures. Notably, microbial community alterations following nutrient addition have been extensively observed in various Microbially Enhanced Coal Bed Methane (MECBM) approaches in recent years. For instance, during anaerobic coal degradation, substances such as algae and lignocellulose are added to supply nutrients for biodegradation and stimulate microbial activity [43,44,45,46]. In the CM group (coal-only group), Azospira, a denitrifying bacterium widely used for wastewater nitrogen removal [47], and Pseudomonas, which mediates heterotrophic nitrification-aerobic denitrification to convert NH4+-N compounds into bioavailable nitrate [48] dominated the microbial community. In contrast, the SD and BA groups exhibited higher abundances of coal-degrading genera. This discrepancy likely arose because microorganisms in the CM group, lacking external nutrients, prioritized survival by extracting limited bioavailable elements directly from lignite, restricting functional diversity in anaerobic degradation. The bacterial community composition revealed that competitive dominance of Azospira and Pseudomonas in the CM group inhibited other degradative microorganisms, thereby restricting the breakdown of complex organic compounds in coal and limiting anaerobic degradation processes, which collectively explains its minimal methane production. However, since anaerobic degradation constitutes a multi-stage process, determining which specific reaction step became rate-limiting due to the reduced degradative microbial population in the CM group requires further investigation.
When SD was added, Pseudomonas and Herbinix became dominant. Herbinix is a cellulose-degrading bacterium. Because SD contains large amounts of cellulose, increased cellulose-degrading bacteria enable the decomposition of cellulose-like components in coal. Consequently, the content of available carbon sources in the reactor increased [49]. Notably, PCA and Venn analyses indicated higher bacterial community similarity between the CM and SD groups than between the CM and BA groups, suggesting that SD-induced preliminary degradation modified dominant taxa while maintaining partial overlap in final degradation products with CM. The bacterial community structure in the BA group was relatively simple. Blue-green algae, used as a nutrient supplement, contain large amounts of protein, which Proteiniphilum can utilize as a carbon source, decomposing it into acetic acid, ethanol, and carbon dioxide [50,51]. Clostridium sensu stricto 13 is involved in carbon metabolism, producing small molecular compounds such as acetic acid and propionic acid and potentially ethanol [52,53]. In this process, the diversity of methane synthesis pathways determines the product diversity. Moreover, life activities and functional implementation of the products of dominant genera are interdependent and closely linked, with a positive feedback effect between the two. Therefore, despite high bacterial community diversity in the BA group, dominant genera were still extremely prominent. Among them, the introduction of nutrients may also be accompanied by other components (such as trace elements, etc.), and the effects of these components on the anaerobic degradation of coal are not clear. Therefore, in the subsequent research process, specific functional genes or metabolic fluxes can be analyzed to further explain the relationship between different metabolic pathways.
Regardless of the type of nutrient supplement used, Methanosarcina, which participates in multiple methanogenic pathways, as well as hydrogenotrophic methanogens such as Methanobacterium and Methanoculleus [54,55], were present in the reactors of each group. In the CM group, archaeal communities were predominantly composed of Methanosarcina and Methanobacterium, indicating that lignite degradation involves a complex process mediated by diverse methanogenic pathways. Compared with the CM group, the SD group exhibited a higher abundance of an unclassified genus within Bathyarchaeia, but lower abundances of other methanogenic archaea. Given that Bathyarchaeia plays a significant role in carbon cycling within methane-rich tropical coastal ecosystems, and considering the higher methane production in the SD group than in the CM group, it is hypothesized that this unclassified genus may adapt to the co-fermentation environment of coal and SD, contributing to methanogenesis. As illustrated by the PCA and Venn diagrams (Figure 3 and Figure 4), BA and CM groups exhibited similar archaeal community structures, with the distinction in the dominance of hydrogenotrophic Methanobacterium and Methanoculleus in the BA group. This distinction may be attributed to the higher abundance of Proteiniphilum, which facilitated more efficient protein degradation from BA, resulting in reduced acetate production and increased CO2 and H2 levels. These conditions provided sufficient substrates for hydrogenotrophic methanogenesis, consistent with the findings of Hahnke et al. [56].

4.3. Factors Contributing to the Cessation of Gas Production

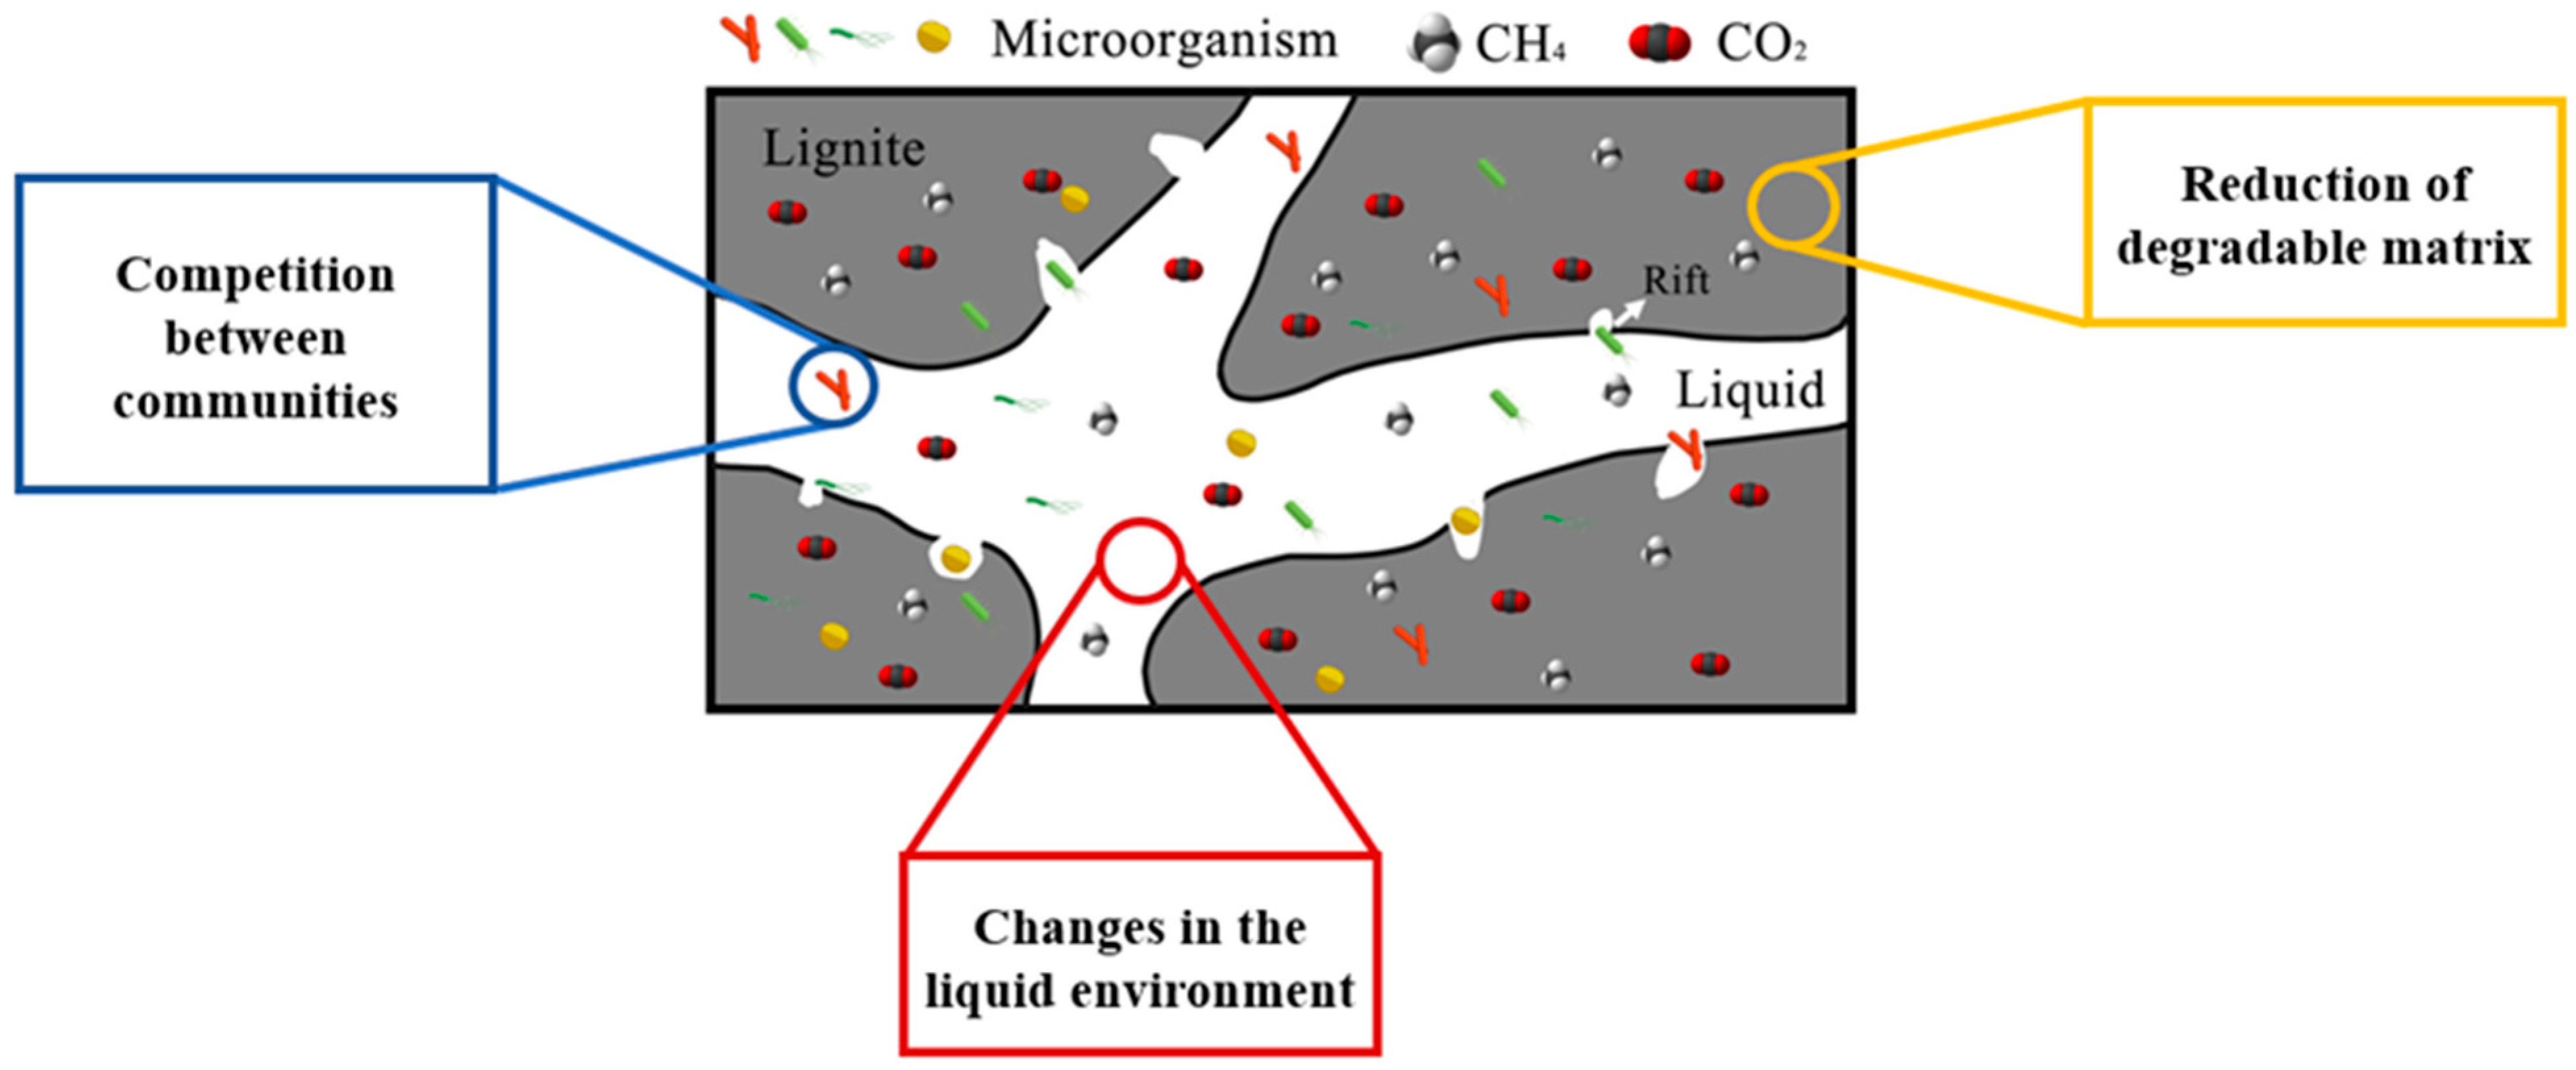
The cessation of coal biomethanation could be attributed to the coupling effects of multiple factors (Figure 8). In reactors, utilizable components within the degrading matrix are non-renewable. Although bacterial catabolic systems are highly efficient [57], when available substrate content falls below the metabolic threshold, substrate limitation effects hinder enzymatic reactions, leading to a near-zero biocatalytic efficiency [58,59]. Anaerobic degradation systems inherently contain self-inhibitory factors, such as free ammonia and volatile fatty acids. When any inhibitory factor exceeds the minimum inhibitory concentration [60,61], microbial stress response mechanisms are triggered, resulting in altered cell membrane permeability, inactivation of key metabolic enzymes, and prolonged population lag phases [59]. Notably, when pH drops below 4.0 or exceeds 10.0, methane production inhibition reaches 100% compared to neutral conditions [62]. Metagenomic analyses revealed that the micro-ecosystem within the reactors comprised multi-trophic functional microbial communities, including hydrolytic bacteria, oxidizing bacteria, and methanogenic archaea. Environmental stressors that reduce microbial abundance or inactivate the metabolism of these key functional microbes disrupt interspecies electron transfer chains, causing abrupt declines in reaction rates. Importantly, substrate competition between sulfate-reducing bacteria and methanogens may induce preferential substrate metabolism, while sulfide (HS−) generated by this process irreversibly inhibits methanogenic archaea by suppressing critical enzyme systems [63,64]. Additionally, nutrient metabolism dysregulation is a critical factor in process termination. The C/N exerts a significant regulatory effect on microbial metabolism. Previous studies indicate a positive coupling relationship between the carbon and nitrogen cycles during AD [65]. The optimal C/N for anaerobic degradation ranges from 20 to 30, under which methanogens and denitrifying bacteria synergistically promote organic carbon generation, enhance system acid tolerance, and enable the expression of methane-critical genes (e.g., mcrA) [66,67]. Deviations from this range (either excessively high or low C/N) may induce acidification or ammonia inhibition, thereby restricting methane production.

4.4. Reasons for Differences in Gas Production

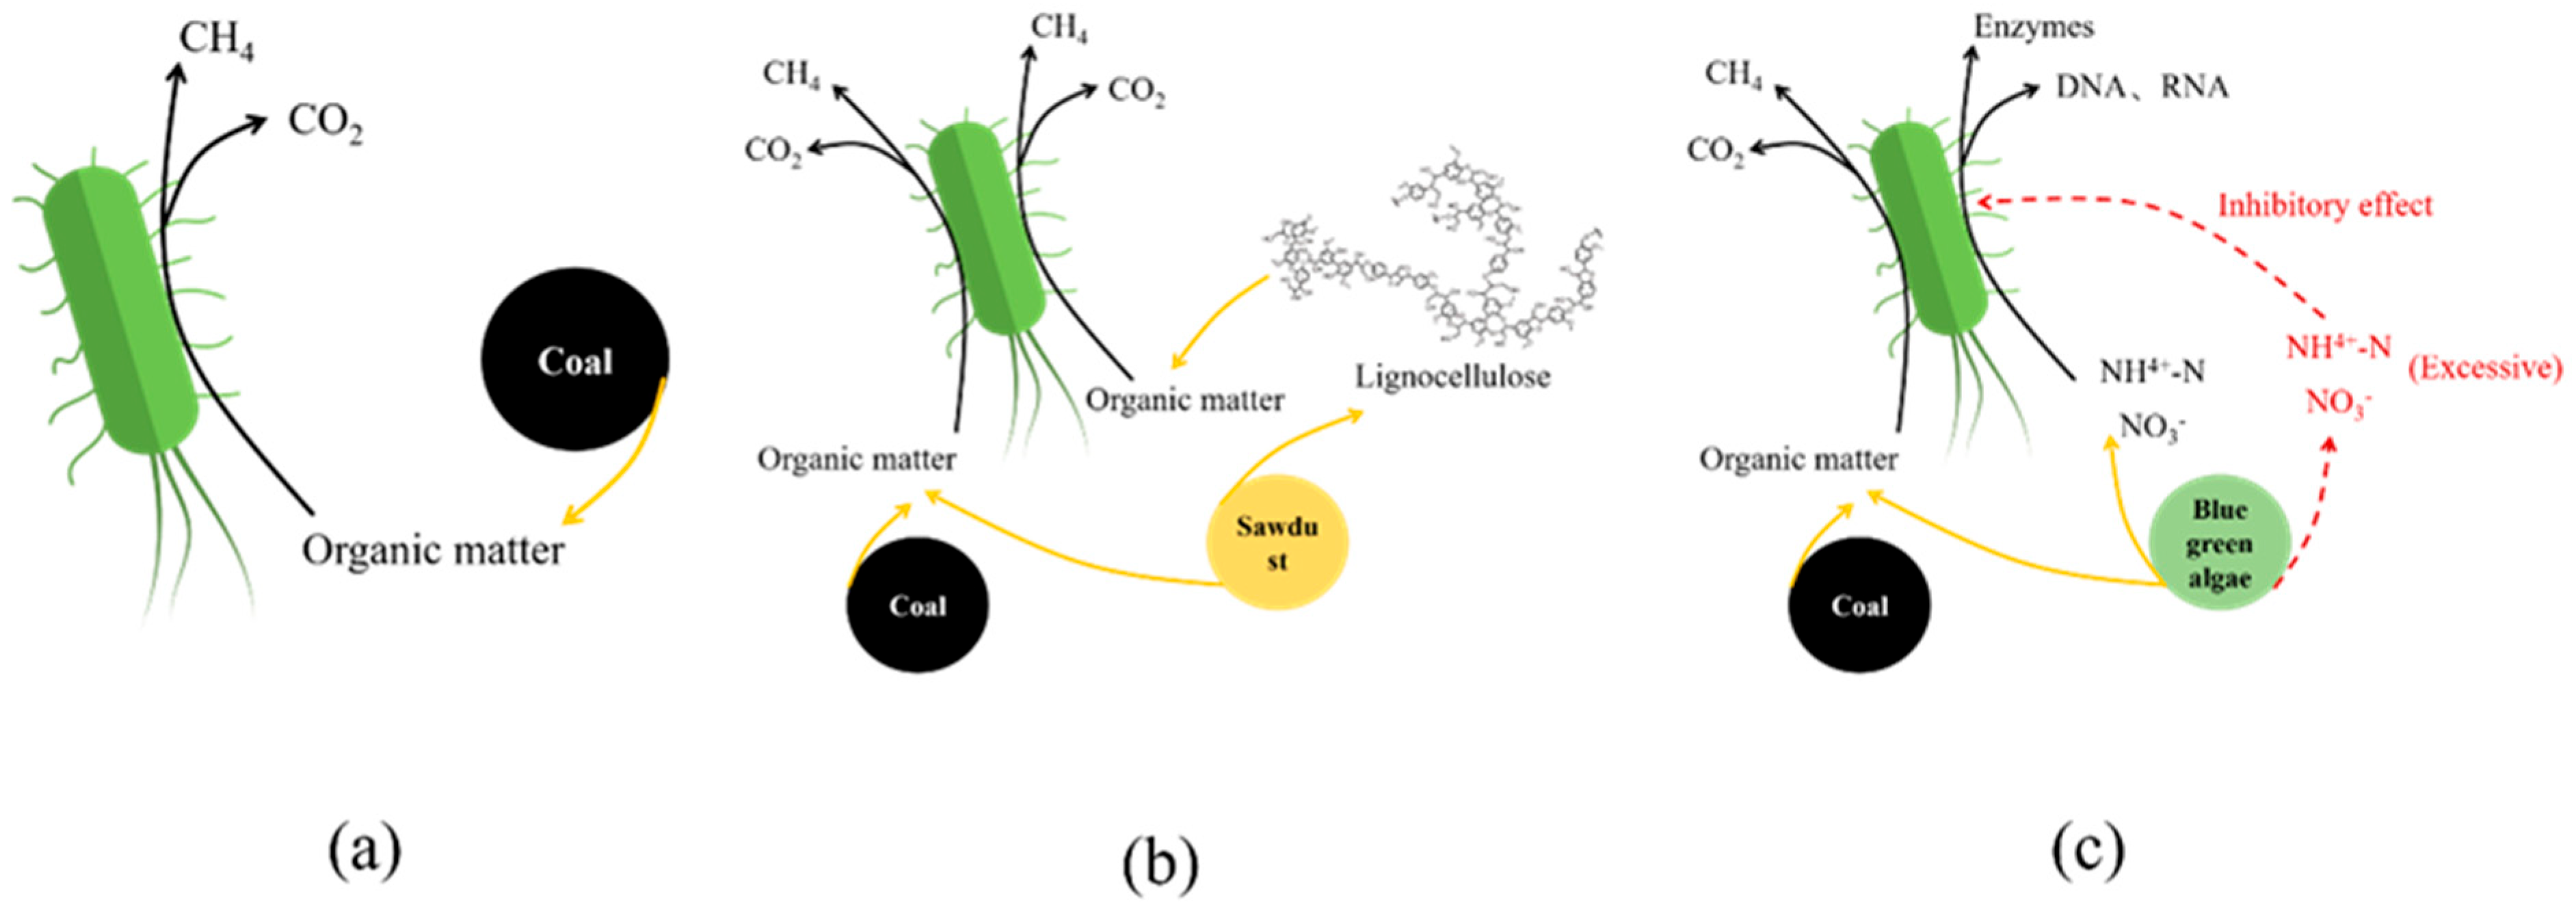
The feeding material significantly influences the reaction termination time. Figure 9 illustrates the metabolic pathways of substrate degradation in reactors with different feeding supplements. When BA served as a supplement, the reaction duration substantially exceeded the stipulated time while achieving the highest methane production. As a potential nutrient source, BA exhibits a high nitrogen content. Nitrogen, a critical element for cellular protein and nucleic acid synthesis, is essential for microbial growth. Elevated nitrogen levels enhance the abundance of specific methanogens in anaerobic degradation [68,69]. This suggests that nitrogen enrichment in the BA group promotes microbial activity and population growth related to anaerobic degradation, thereby sustaining and optimizing lignite decomposition. Clostridium sensu stricto 13, the dominant species associated with carbon metabolism in the BA group, supports this hypothesis. During nitrogen-rich substrate degradation, amino groups from proteins and nitrogenous bases from nucleic acids may release ammonia nitrogen [70,71], a process corroborated by the presence and functional mechanisms of Proteiniphilum. The acetate degradation pathway is highly sensitive to ammonia during AD [72]. Excessive ammonia inhibits methyl-CoM reductase expression in Methanosaeta, suppressing acetate metabolism, while shifting microbial communities toward Methanosarcina dominance. Concurrently, methane production transitions to the syntrophic acetate oxidation–hydrogenotrophic methanogenesis pathway [73], which is consistent with our microbial community analysis results.
When wood chips (SD group) served as the supplement, methane production, initial reaction time, and reaction duration after the first feeding were comparable to those of the CM group but remained significantly lower than those of the BA group. The reaction time after the second feeding was relatively prolonged, approaching that of the BA group, demonstrating that the SD group exhibited a higher methanogenic potential than the CM group. The presence of Herbinix indicated the existence of a certain amount of utilizable lignocellulosic biomass in the wood chips. Lignocellulosic biomass is primarily composed of cellulose (38–50%), hemicellulose (23–32%), and lignin (10–25%) [74]. Cellulose consists of linear glucose polymers interconnected via β-1,4-glycosidic bonds. The glucose units form crystalline structures through hydrogen bonding. Coupled with the recalcitrant nature of β-1,4-glycosidic bonds, cellulose exhibits high stability and mechanical strength [74,75]. Hemicellulose, a heteropolysaccharide, has more branched and intricate structures than cellulose. This complexity necessitates the use of diverse enzymatic systems that act on distinct glycosidic bonds and monosaccharide residues [76]. Lignin is typically a three-dimensional network polymer formed by phenylpropane units linked via ether and carbon–carbon bonds, characterized by high complexity and irregularity. Owing to its complex structure, high chemical bond energy, and tight association with carbohydrates, lignin creates physicochemical barriers that drastically reduce enzymatic hydrolysis rates [77,78]. Consequently, the limited availability of effective substrates from wood chips during microbial lignite degradation effectively explains why methane production in the SD group was comparable to that in the CM group but significantly lower than that in the BA group.
During anaerobic degradation, partial organic matter in coal is dissolved owing to microbial activity. Bacteria in the fermentation solution secrete hydrolytic enzymes that facilitate the decomposition of organic polymers into long-chain (C10–C36) alkanes, long-chain fatty acids, and monocyclic aromatic hydrocarbons. These soluble organic compounds serve as electron donors for degradation, producing CO2, while H+ acts as an electron acceptor [79]. In this process, the aromatic and aliphatic regions of lignin in the SD can be depolymerized by removing the corresponding side chain groups. These components subsequently participate in methane production, which is consistent with our finding that partial organic matter utilization in SD moderately enhanced methanogenesis, resulting in a slightly higher methane yield in the SD group than in the CM group. Proteins, lipids, and carbohydrates in BA are depolymerized into small-molecular compounds such as aromatic hydrocarbons, esters, and alcohols. Notably, lignin has been identified in the cell walls of certain algae species [80,81,82], suggesting that BA may partially substitute SD to promote anaerobic degradation. However, the structural complexity of lignocellulosic biomass substantially limits its degradation efficiency when conventional methods are used [83,84]. Although bacterial extracellular lytic enzymes can degrade these materials [85], the lignocellulose content remains a critical factor influencing degradation rates. This mechanism effectively explains the observed differences in CO2 production among the experimental groups after substrate supplementation: constrained by organic matter composition/structure and microbial abundance/activity, both the SD and CM groups exhibited lower CO2 production than the BA group.

4.5. Correlation Analysis

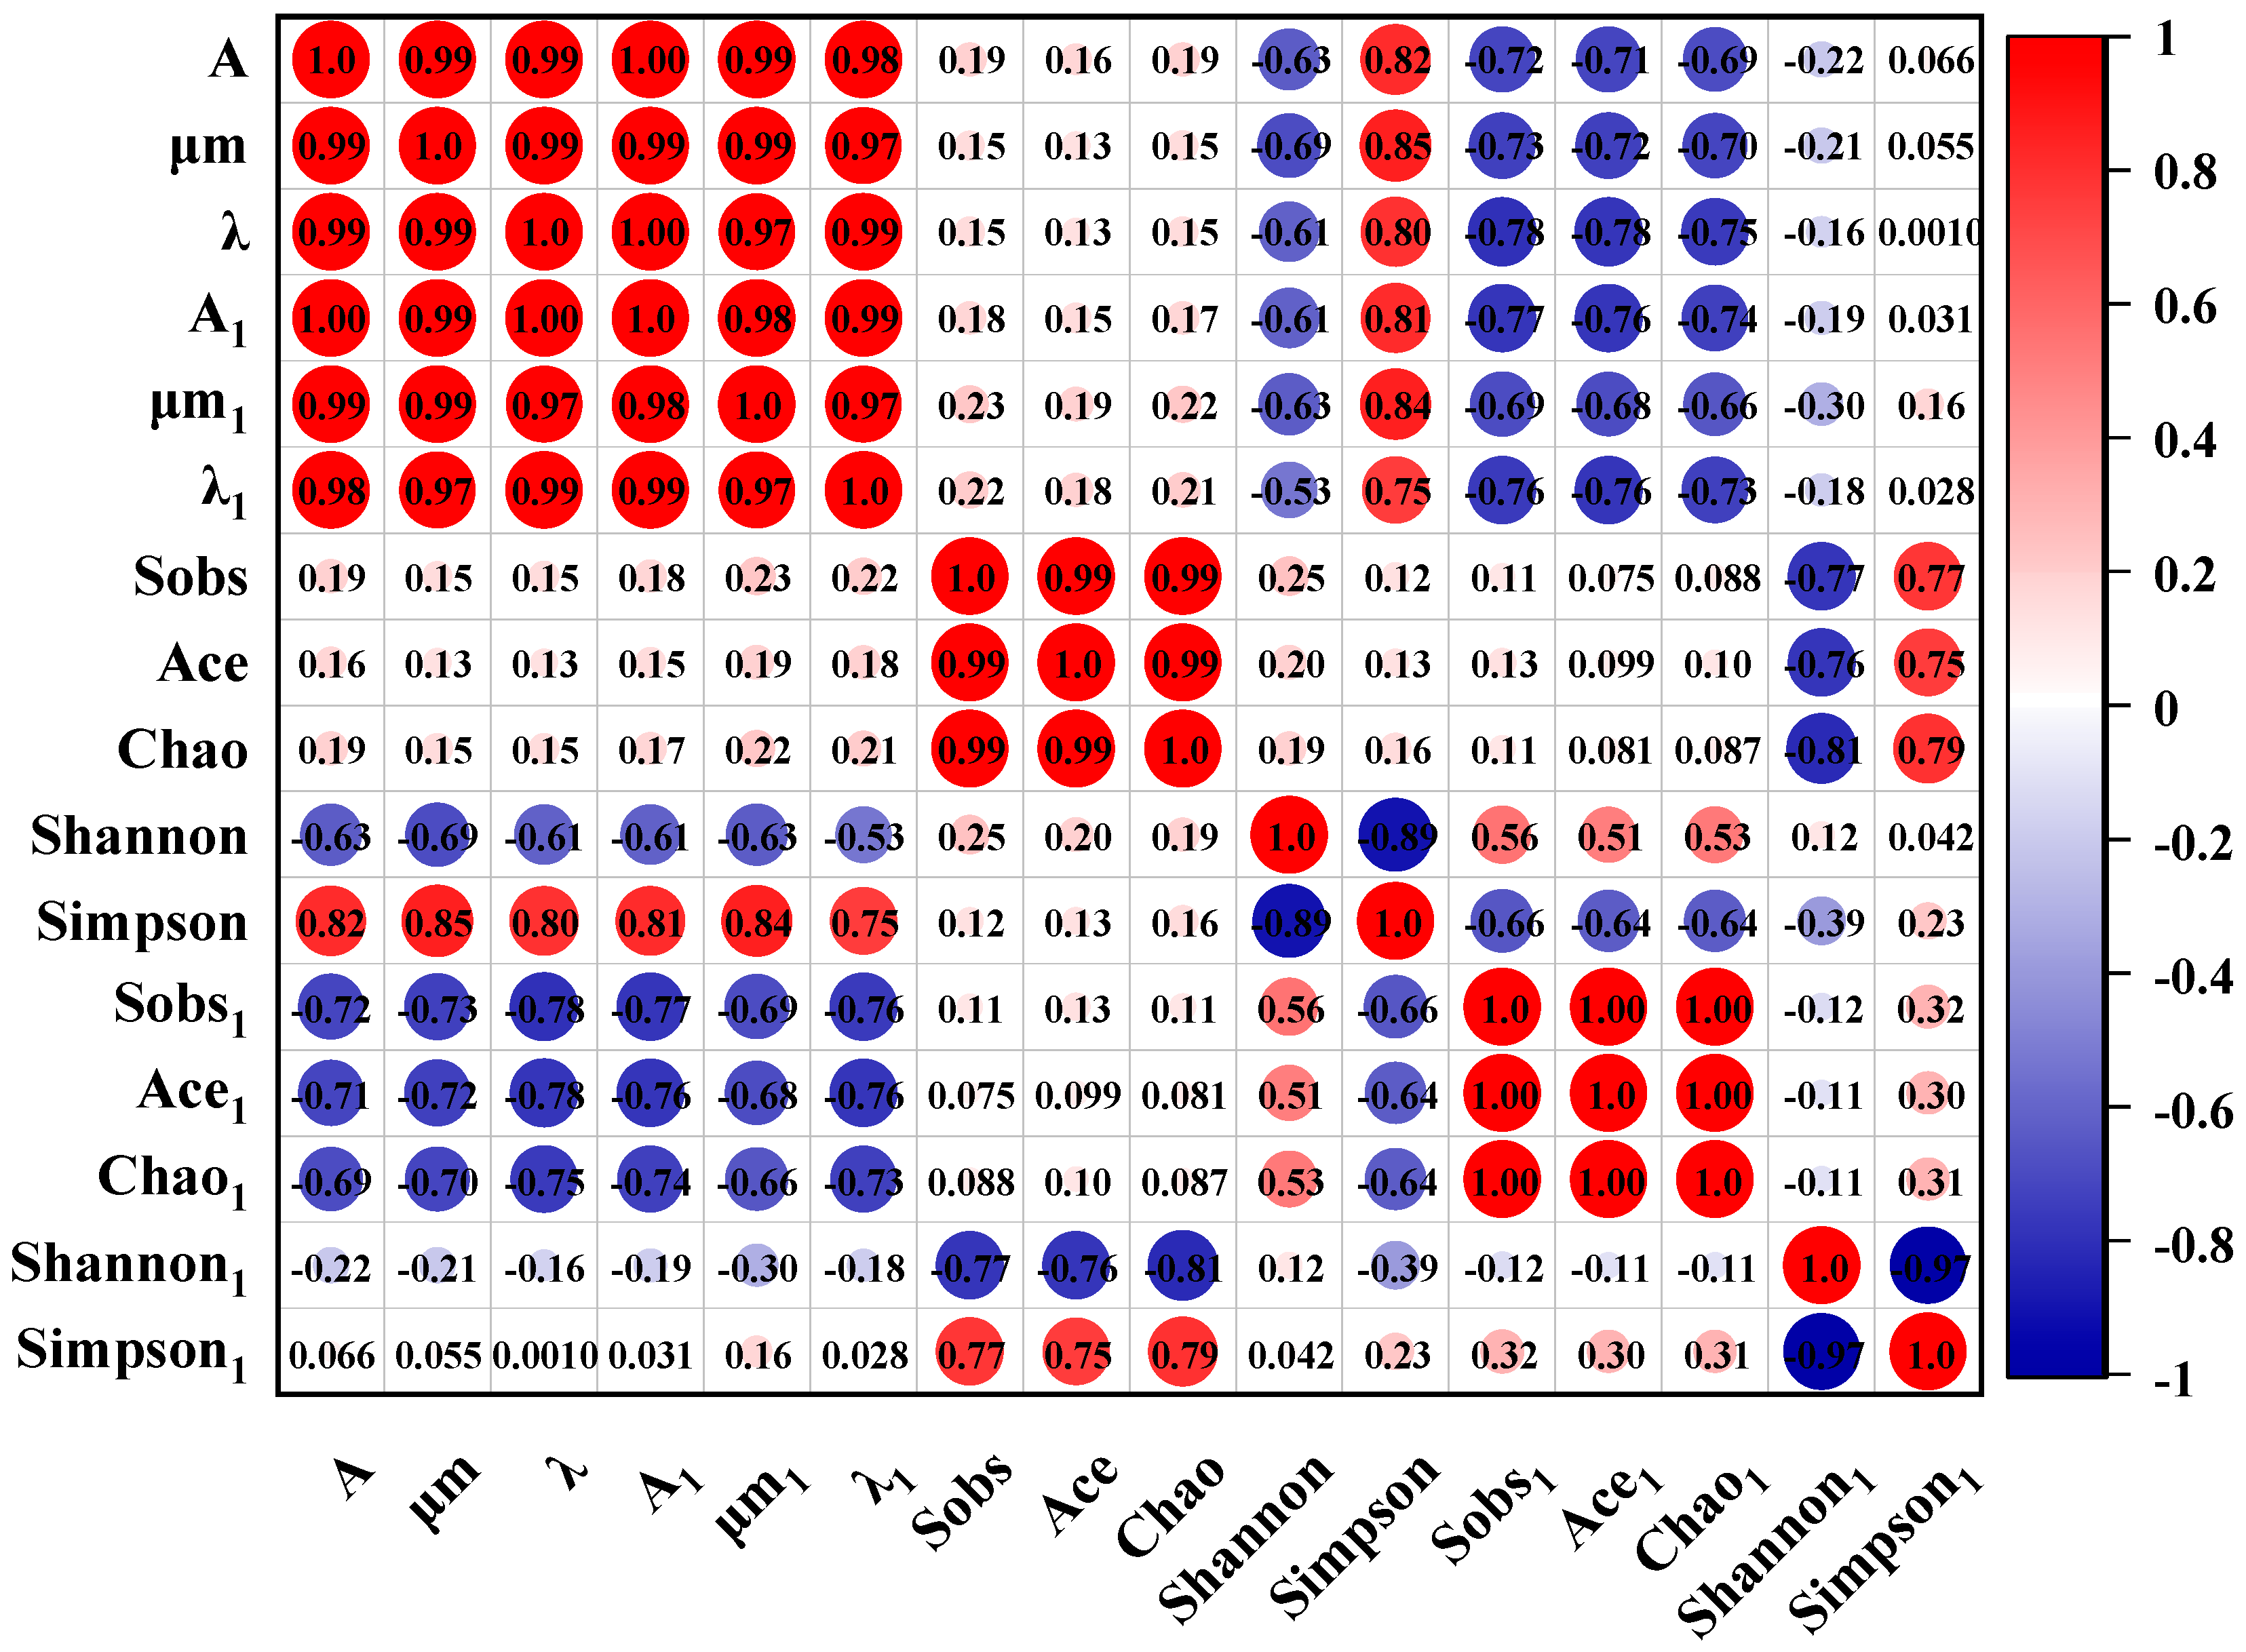
The improved Gompertz model was employed to investigate the fitting of CO2 and CH4 production during anaerobic fermentation before the third substrate supplementation. The Pearson correlation coefficient method was used to calculate the eigenvalues of the correlation matrix between the normalized raw variables to elucidate the intrinsic relationships among the stochastic variables. The results of the correlation analysis are presented in Figure 10. Quantitative analysis of nine parameters was conducted, including kinetic parameters (A, μm, and λ) (Table 5) and microbial diversity indices (Sobs, Ace, Chao, Shannon, and Simpson) (Table 6). The Pearson coefficient is particularly suitable for assessing correlations between continuous variables [86,87].
The experimental data revealed significant correlations between the CO2 and CH4 kinetic parameters (r > 0.9), consistent with the gas production trends. This phenomenon may be related to the following biochemical reaction:
1/8CO2 + H+ + e→1/8CH4 + 1/4H2O
CO2 is reduced to methane as an electron acceptor, accompanied by a decrease in entropy and changes in methane production parameters. These mechanisms effectively explain the synchronized trends in the CO2 and CH4 production curves. Alpha diversity indices indicated comparable richness and diversity of archaeal communities across the groups. For bacterial communities, the Sobs, Ace, and Chao indices (indicators of species richness) demonstrated the highest species abundance in the SD group and the lowest in the CM group, with similar bacterial evenness across the nutrient supplementation groups. The BA group exhibited the highest species richness. Bacterial richness indices showed negligible correlations with gas production kinetic parameters (r < 0.3), suggesting that CH4 and CO2 production was associated with specific bacterial subpopulations rather than with overall richness. Archaeal richness indices displayed negative correlations with gas production parameters (r < −0.5), potentially due to competitive interactions among different methanogenic pathways. Higher archaeal diversity may introduce functional redundancy, where increased methanogen species compete for nutrients without enhancing gas production efficiency, suppressing CH4 and CO2 yields.
The Simpson and Shannon indices primarily reflect species diversity. For bacterial communities, no significant differences in diversity were observed among groups. The Simpson index showed strong correlations with gas production kinetic parameters (r > 0.7), whereas the Shannon index exhibited inverse correlations (r < −0.5). This suggests that greater species diversity and community evenness enhance the likelihood of competitive exclusion, thereby diminishing the dominance of gas-producing species. For archaeal communities, both Simpson and Shannon indices showed negligible correlations with gas production parameters (r ≈ 0). Combined with the archaeal Venn diagram analysis, this implies that the gas production processes are predominantly governed by a few key species. As long as the number and activity of key species remain stable, the kinetic parameters of gas production do not fluctuate significantly.

4.6. Feasibility of Industrial Application

In this study, a preliminary economic analysis was conducted to evaluate the economic feasibility of anaerobic degradation reactors with nutrient recirculation. The primary objective was to enhance methane production using additives, thereby improving economic returns. At an industrial scale, economies of scale from large-scale equipment would reduce methane production costs [88]. All economic evaluation parameters were determined based on the experimental data and real-world conditions, using an RMB/USD exchange rate of 0.14 (January 2025). The input–output relationships are illustrated in Figure 11.
Nevertheless, subsequent evaluations should incorporate capital expenditure (e.g., equipment procurement, installation, and maintenance costs) and operational costs (e.g., labor, energy expenses) into the economic assessment framework. Advanced evaluation methodologies should be adopted to further substantiate the comparative advantages of different supplements during in situ applications [89]. For instance, the Discounted Cash Flow valuation method [90], which involves forecasting future cash flows and calculating their present values using predetermined discount rates, can be employed for economic analysis. Furthermore, Life Cycle Assessment [91] should be implemented to comprehensively evaluate the environmental impacts across all stages, from supplement production, transportation, and storage to utilization in gasification processes and subsequent waste management. By integrating economic analysis with a monetized approach, this methodology quantifies the costs throughout the microbial coal gasification cycle, thereby providing robust evidence for determining the relative merits of different supplements.
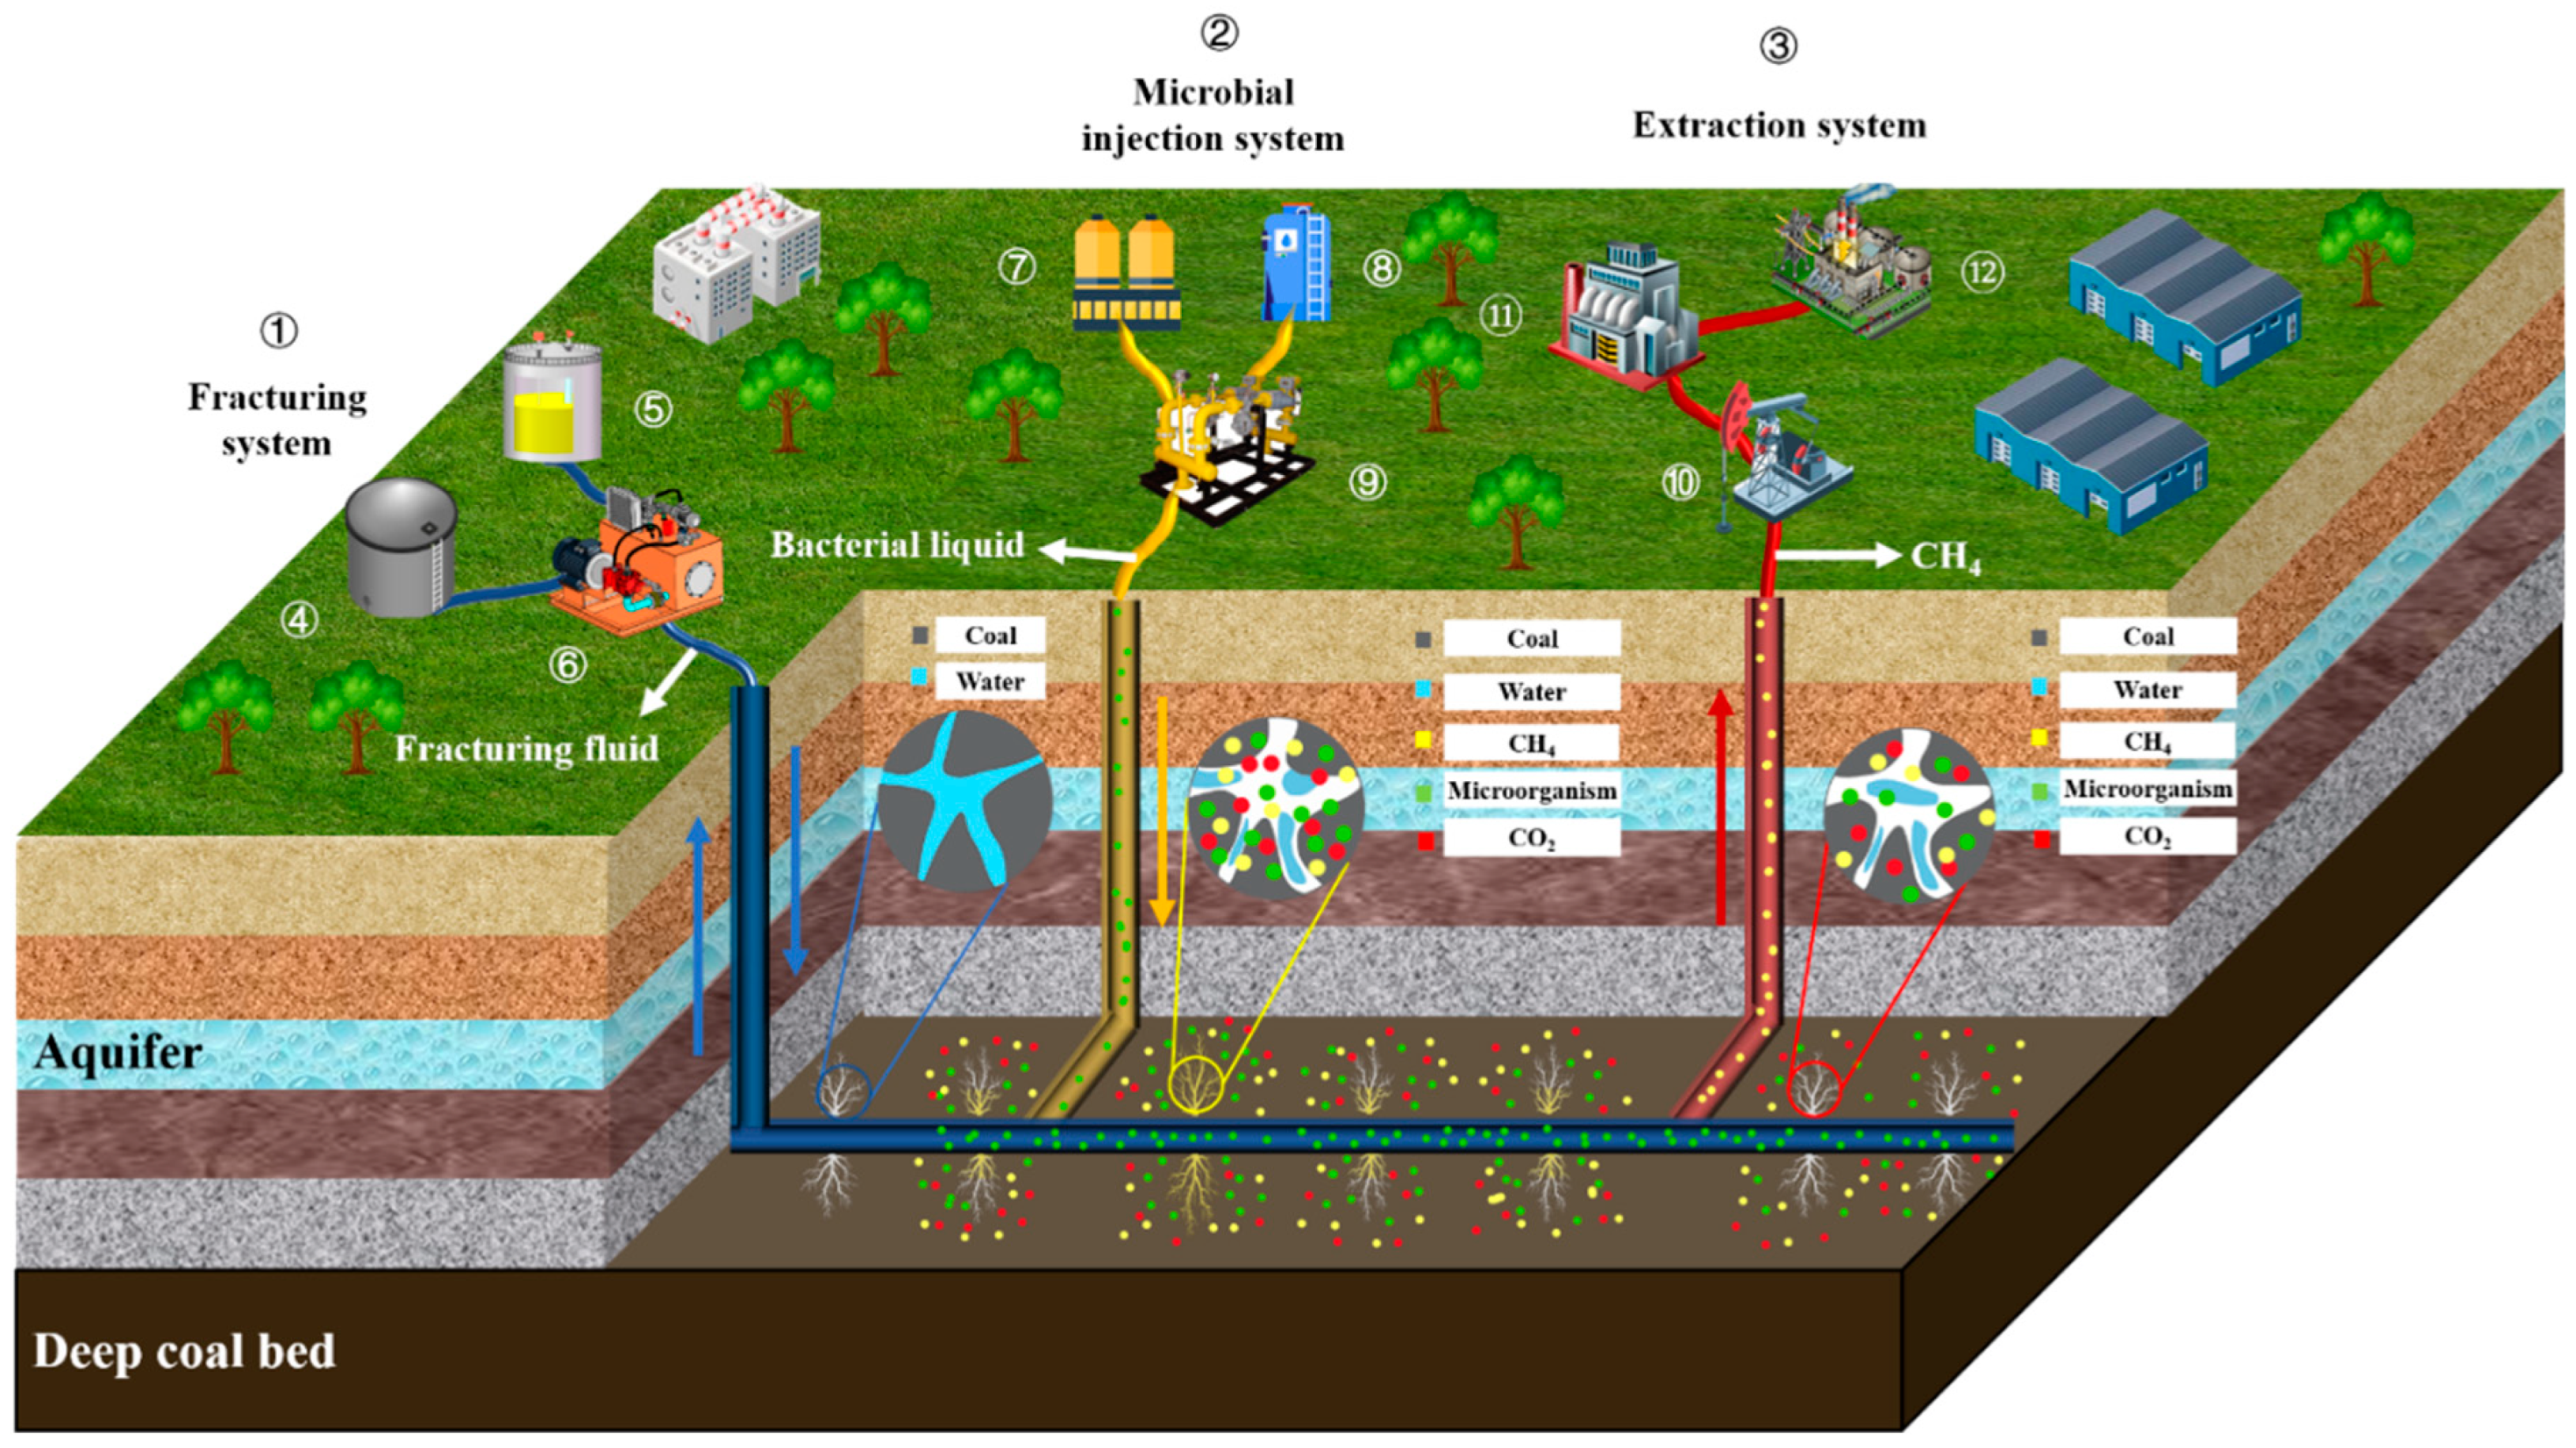
As a novel approach to green coal utilization, in situ microbial coal gasification holds significant potential for deep coal resource exploitation. However, two critical challenges persist: (1) insufficient understanding of multiphase reaction processes in deep coal seam microbial gasification, complicating long-term process stability control, and (2) extreme deep-seam conditions (high-stress, high-salinity, and high-temperature environments) posing substantial barriers to microbial growth and metabolism. Consequently, most proposed solutions remain in preliminary developmental stages. Based on the experimental findings, this study proposes an in situ microbial coal gasification methodology, as illustrated in Figure 12.
Hydraulic fracturing is performed on coal seams, with bacterial inoculum and nutrients configured in surface systems. The mixture is transported via pipelines to coal seams, where it is combined with the fracturing fluid to execute hydraulic fracturing operations. Following fracturing, microorganisms infiltrate coal seam fractures and participate in microbial coal degradation. The generated methane is extracted through gas recovery pipelines via these fractures, serving as gas migration channels, and is ultimately transported to the surface for collection and utilization.
The development of microbial coal gasification technology has the following significant implications: (1) enhanced utilization of coal resources, (2) CO2 utilization through microbial-mediated carbon cycling, and (3) clean, efficient, and low-carbon energy utilization. However, challenges persist owing to geological variability, and parameters including rock fracture porosity and permeability coefficients substantially influence anaerobic fermentation processes, while maintaining microbial activity in deep geological strata presents technical difficulties. Consequently, critical research priorities involve creating adaptive conditions for diverse microbial communities, improving the physiological stability of in situ reactor systems, and optimizing high-efficiency CH4 production.

5. Conclusions

This study investigated the critical role of nutrient supplementation in reactivating coal biomethanation. By establishing fed-batch reactors and conducting batch anaerobic fermentation experiments using CM, SD, and BA as nutritional additives, gas production characteristics and microbial communities across three-stage supplementation were analyzed. The key findings are as follows:
(1)
Nutritional supplementation promoted the reactivation of methanogenic reactions, with BA achieving the highest methane production. During the initial supplementation, methane accumulation showed minimal differences among the experimental groups. In the second and third supplementation stages, the BA group demonstrated optimal gas production, with average methane accumulations of 0.66 ± 0.08 mL/g, 13.99 ± 0.62 mL/g, and 9.37 ± 0.31 mL/g,, respectively, followed by the SD group (0.83 ± 0.12 mL/g, 1.01 ± 0.08 mL/g, 0.05 ± 0.01 mL/g), while the CM group exhibited negligible enhancement (0.74 ± 0.14 mL/g, 0.31 ± 0.1 mL/g, 0.01 ± 0.003 mL/g).
(2)
Distinct microbial community differentiation occurred depending on nutritional additives. The bacterial genera Herbinix and Proteiniborus emerged as dominant degraders in the SD and BA groups, respectively, due to their capacity to decompose complex macromolecular compounds in the supplements, thereby promoting subsequent substrate degradation.
(3)
Nutrient supplementation stimulated microbial population activity. Compared with the CM group, both SD and BA groups developed positive feedback relationships between microbial life activities and functional performance, significantly enhancing lignite degradation. The BA group showed pronounced increases in anaerobic degradation-related microbial activity and abundance, owing to the nitrogen-rich substrates and biodegradable organics present in BA. Conversely, limited by the structural stability of lignocellulose, the SD group exhibited smaller improvements in microbial activity and abundance, despite receiving additional degradable substrates.
(4)
Biomass supplementation enhances methane production efficiency; however, intermediate products from coal-biomass co-fermentation remain unidentified, necessitating advanced analytical techniques to elucidate the coal conversion processes. Furthermore, while this study focused on reactor microecology, the microbial interaction mechanisms involved in composite substrate degradation remain unclear. Future research should employ multi-omics approaches to elucidate the mechanisms underlying biomass-enhanced coal biomethanation.

Author Contributions

L.Z.: Writing—original draft, Formal analysis, Funding acquisition and Conceptualization. W.D.: Methodology, Data curation and Conceptualization. H.W.: Visualization, Data curation, and Methodology. P.Z.: Methodology and Conceptualization. Z.T.: Methodology and Visualization. All authors have read and agreed to the published version of the manuscript.

Funding

This research was funded by the Yunlong Lake Laboratory of Deep Underground Science and Engineering Project (No. 104024003), the National Natural Science Foundation of China (No. 52404149), the Natural Science Foundation of Jiangsu Provincial Basic Research Program (No. BK20220024), the Jiangsu Funding Program for Excellent Postdoctoral Talent (No. 2024ZB177) and the Postdoctoral Fellowship Program of CPSF (No. GZC20241927).

Institutional Review Board Statement

Not applicable.

Informed Consent Statement

Not applicable.

Data Availability Statement

Dataset available on request from the authors.

Conflicts of Interest

The authors declare that they have no competing financial interests or personal relationships that may have influenced the work reported in this paper.

Abbreviations

The following abbreviations are used in this manuscript:
MMoisture
AdAsh (dry basis)
VdVolatile Matter (dry basis)
FcdFixed Carbon (dry basis)
DDensity
VVolatile Matter
VdafVolatile Matter (dry ash-free basis)
FCFixed Carbon
FCdafFixed Carbon (dry ash-free basis)
C/NCarbon–nitrogen ratio
C/HCarbon–hydrogen ratio
ADanaerobic digestion
CMculture medium group
SDsawdust group
BAblue-green algae group
GC-MSGas Chromatography–Mass Spectrometry
PCRpolymerase chain reaction
OTUoperational taxonomic unit

References

  1. Li, L.; Liu, D.; Cai, Y.; Wang, Y.; Jia, Q. Coal Structure and Its Implications for Coalbed Methane Exploitation: A Review. Energy Fuels 2021, 35, 86–110. [Google Scholar] [CrossRef]
  2. Gao, L.; Mastalerz, M.; Schimmelmann, A. 1a–The origin of coalbed methane. In Coal Bed Methane, 2nd ed.; Thakur, P., Schatzel, S.J., Aminian, K., Rodvelt, G., Mosser, M.H., D’Amico, J.S., Eds.; Elsevier: Amsterdam, The Netherlands, 2020; pp. 3–34. [Google Scholar] [CrossRef]
  3. Liang, W.; Yan, J.; Zhang, B.; Hou, D. Review on Coal Bed Methane Recovery Theory and Technology: Recent Progress and Perspectives. Energy Fuels 2021, 35, 4633–4643. [Google Scholar] [CrossRef]
  4. Rice, D.D.; Claypool, G.E. Generation, Accumulation, and Resource Potential of Biogenic Gas1. AAPG Bull. 1981, 65, 5–25. [Google Scholar] [CrossRef]
  5. Faiz, M.; Hendry, P. Significance of microbial activity in Australian coal bed methane reservoirs—A review. Bull. Can. Pet. Geol. 2006, 54, 261–272. [Google Scholar] [CrossRef]
  6. Papendick, S.L.; Downs, K.R.; Vo, K.D.; Hamilton, S.K.; Dawson, G.K.W.; Golding, S.D.; Gilcrease, P.C. Biogenic methane potential for Surat Basin, Queensland coal seams. Int. J. Coal Geol. 2011, 88, 123–134. [Google Scholar] [CrossRef]
  7. Harris, S.H.; Smith, R.L.; Barker, C.E. Microbial and chemical factors influencing methane production in laboratory incubations of low-rank subsurface coals. Int. J. Coal Geol. 2008, 76, 46–51. [Google Scholar] [CrossRef]
  8. Feng, X.; Zhang, Z.; Guo, H.; Li, Z.; Huang, Z.; Urynowicz, M. Enhancement of biogenic methane production from coal using supercritical CO2. J. Supercrit. Fluids 2023, 201, 106023. [Google Scholar] [CrossRef]
  9. Zhu, L.; Yao, Q.; Diao, W.; Huang, Z.; Li, X. Bioelectrochemically enhanced biomethane production from low-rank coal using multiple microbial strains. J. Clean. Prod. 2024, 442, 141028. [Google Scholar] [CrossRef]
  10. Zhu, L.; Yao, Q.; Huang, Z.; Li, X.; Ma, Z. Biogenic methane generation from lignite coal at different temperatures. Gas Sci. Eng. 2023, 117, 205016. [Google Scholar] [CrossRef]
  11. Budwill, K.; Beaton, A.; Bustin, M.; Muehlenbachs, K.; Gunter, W.D. Methanogenic activity on coal and sequestered CO2 for enhanced coalbed methane recovery. In Proceedings of the 6th International Conference on Greenhouse Gas Control Technologies, Kyoto, Japan, 1–4 October 2002; pp. 697–702. [Google Scholar] [CrossRef]
  12. Wang, X.; Chen, B.; Chen, L.; Dong, G.; Csernica, T.; Zhang, N.; Liu, J.; Shuai, Y.; Liu, C.-Q.; Xu, Z.; et al. Biogenic methane clumped isotope signatures: Insights from microbially enhanced coal bed methane. Fuel 2024, 365, 131307. [Google Scholar] [CrossRef]
  13. Zhang, J.; Liang, Y.; Pandey, R.; Harpalani, S. Characterizing microbial communities dedicated for conversion of coal to methane in situ and ex situ. Int. J. Coal Geol. 2015, 146, 145–154. [Google Scholar] [CrossRef]
  14. Wang, Y.; Bao, Y.; Hu, Y. Recent progress in improving the yield of microbially enhanced coalbed methane production. Energy Rep. 2023, 9, 2810–2819. [Google Scholar] [CrossRef]
  15. Guo, H.; Li, Y.; Wang, Q.; Zhao, W.; Jia, J.; Lv, J.; Liu, S.; Xia, D. Feasibility analysis of the in situ conversion of biomethane in surface weathered coal. Fuel 2020, 268, 117273. [Google Scholar] [CrossRef]
  16. Malik, A.Y.; Ali, M.I.; Jamal, A.; Farooq, U.; Khatoon, N.; Orem, W.H.; Barnhart, E.P.; SanFilipo, J.R.; He, H.; Huang, Z. Coal biomethanation potential of various ranks from Pakistan: A possible alternative energy source. J. Clean. Prod. 2020, 255, 120177. [Google Scholar] [CrossRef]
  17. Zhang, J.; Qu, Y.; Qi, Q.; Zhang, P.; Zhang, Y.; Tong, Y.W.; He, Y. The bio-chemical cycle of iron and the function induced by ZVI addition in anaerobic digestion: A review. Water Res. 2020, 186, 116405. [Google Scholar] [CrossRef]
  18. Mai, Y.; Liang, Y.; Cheng, M.; He, Z.; Yu, G. Coupling oxidation of acid volatile sulfide, ferrous iron, and ammonia nitrogen from black-odorous sediment via autotrophic denitrification-anammox by nitrate addition. Sci. Total Environ. 2021, 790, 147972. [Google Scholar] [CrossRef]
  19. Zhao, J.; Guan, D.; Zhong, Z.; Abdullah Al-Dhabi, N.; Li, B.; Sun, Y.; Zhang, D.; Tang, W.; Wang, D. Cobalt-modified digestate-derived biochar enhances kitchen waste anaerobic dry digestion: Performance, microbial mechanisms, and metabolic pathways. Biochem. Eng. J. 2024, 499, 155951. [Google Scholar] [CrossRef]
  20. Nimonkar, Y.S.; Kajale, S.; Dake, M.; Ranade, D.R.; Yadav, K.K.; Kumar, R.; Prakash, O. A culture-based and culture-independent approach to the study of landfill leachate bacterial and archaeal communities. Anaerobe 2022, 77, 102626. [Google Scholar] [CrossRef] [PubMed]
  21. Linsong, H.; Lianhua, L.; Ying, L.; Changrui, W.; Yongming, S. Bioaugmentation with methanogenic culture to improve methane production from chicken manure in batch anaerobic digestion. Chemosphere 2022, 303, 135127. [Google Scholar] [CrossRef]
  22. He, H.; Zhan, D.; Chen, F.; Huang, Z.; Huang, H.-Z.; Wang, A.-K.; Huang, G.-H.; Muhammad, I.A.; Tao, X.-X. Microbial community succession between coal matrix and culture solution in a simulated methanogenic system with lignite. Fuel 2020, 264, 116905. [Google Scholar] [CrossRef]
  23. Pytlak, A.; Jaromin-Gleń, K.; Sujak, A.; Szafranek-Nakonieczna, A. Interactions between surface properties of pristine coals and the intrinsic microbial communities involved in methane formation. Int. J. Coal Geol. 2024, 282, 104422. [Google Scholar] [CrossRef]
  24. Wang, B.; Ndayisenga, F.; Zhang, G.; Yu, Z. Deciphering the initial products of coal during methanogenic bioconversion: Based on an untargeted metabolomics approach. GCB Bioenergy 2021, 13, 967–978. [Google Scholar] [CrossRef]
  25. Wang, A.; Shao, P.; Lan, F.; Jin, H. Organic chemicals in coal available to microbes to produce biogenic coalbed methane: A review of current knowledge. J. Nat. Gas Sci. Eng. 2018, 60, 40–48. [Google Scholar] [CrossRef]
  26. Ray, S.; Kuppam, C.; Pandit, S.; Kumar, P. Biogas Upgrading by Hydrogenotrophic Methanogens: An Overview. Waste Biomass Valorization 2023, 14, 537–552. [Google Scholar] [CrossRef]
  27. Tongco, J.V.; Jannat, M.A.H.; Kim, S.; Park, S.H.; Hwang, S. Process Performance and Biogas Output: Impact of Fluctuating Acetate Concentrations on Methanogenesis in Horizontal Anaerobic Reactors. Energies 2025, 18, 3120. [Google Scholar] [CrossRef]
  28. Chang, H.H.; Yin, Q.D.; He, K.; De Vrieze, J.; Wu, G.X. Feeding regime selectively enriching acetoclastic methanogens to enhance energy production in anaerobic digestion systems. Biochem. Eng. J. 2025, 220, 109764. [Google Scholar] [CrossRef]
  29. Dong, W.; Zhou, J.; Zhang, C.-J.; Yang, Q.; Li, M. Methylotrophic substrates stimulated higher methane production than competitive substrates in mangrove sediments. Sci. Total Environ. 2024, 951, 175677. [Google Scholar] [CrossRef]
  30. Shan, T.; Bao, Y.; Li, D.; Hu, Y.L.; Chen, X.R. Synergistic mechanism between coal organic matter and microbial community during bituminous coal biogasification. Fuel 2025, 399, 135630. [Google Scholar] [CrossRef]
  31. Liu, D.; Jiang, Z.; Feng, W.; Zhao, Y.; Tang, P.; Cui, J.; Zhao, Z.; Lu, Q. Dual role of multistage inoculation in manipulating bacterial community assembly patterns to improve degradation of lignocellulose during rice or corn straw composting. Chem. Eng. J. 2025, 505, 159283. [Google Scholar] [CrossRef]
  32. Ripoll, V.; Agabo-García, C.; Solera, R.; Perez, M. Anaerobic digestion of slaughterhouse waste in batch and anaerobic sequential batch reactors. Biomass Convers. Biorefinery 2023, 13, 11457–11468. [Google Scholar] [CrossRef]
  33. Deng, Z.; Muñoz Sierra, J.; Ferreira, A.L.M.; Cerqueda-Garcia, D.; Spanjers, H.; van Lier, J.B. Effect of operational parameters on the performance of an anaerobic sequencing batch reactor (AnSBR) treating protein-rich wastewater. Environ. Sci. Ecotechnol. 2024, 17, 100296. [Google Scholar] [CrossRef]
  34. Zhang, Y.; Wang, X.; Zhu, W.; Zhao, Y.; Wang, N.; Gao, M.; Wang, Q. Anaerobic fermentation of organic solid waste: Recent updates in substrates, products, and the process with multiple products co-production. Environ. Res. 2023, 233, 116444. [Google Scholar] [CrossRef]
  35. Zhang, J.; Liang, Y. Evaluating approaches for sustaining methane production from coal through biogasification. Fuel 2017, 202, 233–240. [Google Scholar] [CrossRef]
  36. Barnhart, E.P.; Ruppert, L.F.; Hiebert, R.; Smith, H.J.; Schweitzer, H.D.; Clark, A.C.; Weeks, E.P.; Orem, W.H.; Varonka, M.S.; Platt, G.; et al. In Situ Enhancement and Isotopic Labeling of Biogenic Coalbed Methane. Environ. Sci. Technol. 2022, 56, 3225–3233. [Google Scholar] [CrossRef] [PubMed]
  37. Davis, K.J.; Barnhart, E.P.; Fields, M.W.; Gerlach, R. Biogenic Coal-to-Methane Conversion Efficiency Decreases after Repeated Organic Amendment. Energy Fuels 2018, 32, 2916–2925. [Google Scholar] [CrossRef]
  38. Li, K.; Fu, M.; Ma, L.; Yang, H.; Li, Q. Zero-valent iron drives the passivation of Zn and Cu during composting: Fate of heavy metal resistant bacteria and genes. Chem. Eng. J. 2023, 452, 139136. [Google Scholar] [CrossRef]
  39. Li, K.; Xu, H.; Liu, Y.; Zhong, W.; Jin, Y.; Wu, W. Exploring the relationship between lignin structure and antioxidant property using lignin model compounds. Int. J. Biol. Macromol. 2024, 282, 136786. [Google Scholar] [CrossRef]
  40. Zheng, Y.; Wang, P.; Yang, X.; Lin, P.; Wang, Y.; Cheng, M.; Ren, L. Process Performance and Microbial Communities in Anaerobic Co-digestion of Sewage Sludge and Food Waste with a Lower Range of Carbon/Nitrogen Ratio. BioEnergy Res. 2022, 15, 1664–1674. [Google Scholar] [CrossRef]
  41. Arelli, V.; Mamindlapelli, N.K.; Begum, S.; Juntupally, S.; Anupoju, G.R. Solid state anaerobic digestion of food waste and sewage sludge: Impact of mixing ratios and temperature on microbial diversity, reactor stability and methane yield. Sci. Total Environ. 2021, 793, 148586. [Google Scholar] [CrossRef]
  42. Dai, X.; Li, X.; Zhang, D.; Chen, Y.; Dai, L. Simultaneous enhancement of methane production and methane content in biogas from waste activated sludge and perennial ryegrass anaerobic co-digestion: The effects of pH and C/N ratio. Bioresour. Technol. 2016, 216, 323–330. [Google Scholar] [CrossRef]
  43. Smith, H.J.; Schweitzer, H.D.; Barnhart, E.P.; Orem, W.; Gerlach, R.; Fields, M.W. Effect of an algal amendment on the microbial conversion of coal to methane at different sulfate concentrations from the Powder River Basin, USA. Int. J. Coal Geol. 2021, 248, 103860. [Google Scholar] [CrossRef]
  44. Barnhart, E.P.; De León, K.B.; Ramsay, B.D.; Cunningham, A.B.; Fields, M.W. Investigation of coal-associated bacterial and archaeal populations from a diffusive microbial sampler (DMS). Int. J. Coal Geol. 2013, 115, 64–70. [Google Scholar] [CrossRef]
  45. Khan, S.; Deng, Z.; Wang, B.; Yu, Z. Coal-straw co-digestion-induced biogenic methane production: Perspectives on microbial communities and associated metabolic pathways. Sci. Rep. 2024, 14, 26554. [Google Scholar] [CrossRef]
  46. Guo, H.; Zhang, M.; Dong, Z.; Wang, Q.; Xia, D.; Lv, J.; Yu, H. The mechanisms of biogenic methane metabolism by synergistic biodegradation of coal and corn straw. Bioresour. Technol. 2020, 298, 122577. [Google Scholar] [CrossRef] [PubMed]
  47. Li, Y.; Wu, X.; Wang, Y.; Gao, Y.; Li, K. A microbial flora with superior pollutant removal efficiency and its fermentation process optimization. AMB Express 2023, 13, 113. [Google Scholar] [CrossRef] [PubMed]
  48. Hu, X.; Su, J.; Ali, A.; Wang, Z.; Wu, Z. Heterotrophic nitrification and biomineralization potential of Pseudomonas sp. HXF1 for the simultaneous removal of ammonia nitrogen and fluoride from groundwater. Bioresour. Technol. 2021, 323, 124608. [Google Scholar] [CrossRef]
  49. Koeck Daniela, E.; Maus, I.; Wibberg, D.; Winkler, A.; Zverlov Vladimir, V.; Liebl, W.; Pühler, A.; Schwarz Wolfgang, H.; Schlüter, A. Complete Genome Sequence of Herbinix luporum SD1D, a New Cellulose-Degrading Bacterium Isolated from a Thermophilic Biogas Reactor. Genome Announc. 2016, 4, 10–1128. [Google Scholar] [CrossRef]
  50. Niu, L.; Song, L.; Dong, X. Proteiniborus ethanoligenes gen. nov., sp. nov., an anaerobic protein-utilizing bacterium. Int. J. Syst. Evol. Microbiol. 2008, 58, 12–16. [Google Scholar] [CrossRef]
  51. Hahnke, S.; Langer, T.; Koeck, D.E.; Klocke, M. Description of Proteiniphilum saccharofermentans sp. nov., Petrimonas mucosa sp. nov. and Fermentimonas caenicola gen. nov., sp. nov., isolated from mesophilic laboratory-scale biogas reactors, and emended description of the genus Proteiniphilum. Int. J. Syst. Evol. Microbiol. 2016, 66, 1466–1475. [Google Scholar] [CrossRef]
  52. Liu, T.; Zuo, J.; Shen, Z.; Zhou, Y. Inhibition of biological acidification and mechanism of crotonaldehyde removal with glucose cometabolism. J. Environ. Manag. 2022, 303, 114090. [Google Scholar] [CrossRef]
  53. Li, C.-J.; Zhang, Z.; Zhan, P.-C.; Lv, A.-P.; Li, P.-P.; Liu, L.; Li, W.-J.; Yang, L.-L.; Zhi, X.-Y. Comparative genomic analysis and proposal of Clostridium yunnanensesp. nov., Clostridium rhizosphaerae sp. nov., and Clostridium paridis sp. nov., three novel Clostridium sensu stricto endophytes with diverse capabilities of acetic acid and ethanol production. Anaerobe 2023, 79, 102686. [Google Scholar] [CrossRef]
  54. Beckmann, S.; Lueders, T.; Krueger, M.; von Netzer, F.; Engelen, B.; Cypionka, H. Acetogens and Acetoclastic Methanosarcinales Govern Methane Formation in Abandoned Coal Mines. Appl. Environ. Microbiol. 2011, 77, 3749–3756. [Google Scholar] [CrossRef]
  55. Su, X.; Zhao, W.; Xia, D. The diversity of hydrogen-producing bacteria and methanogens within an in situ coal seam. Biotechnol. Biofuels 2018, 11, 245. [Google Scholar] [CrossRef]
  56. Hahnke, S.; Langer, T.; Klocke, M. Proteiniborus indolifex sp. nov., isolated from a thermophilic industrial-scale biogas plant. Int. J. Syst. Evol. Microbiol. 2018, 68, 824–828. [Google Scholar] [CrossRef] [PubMed]
  57. Jackson, B.E.; McInerney, M.J. Anaerobic microbial metabolism can proceed close to thermodynamic limits. Nature 2002, 415, 454–456. [Google Scholar] [CrossRef] [PubMed]
  58. Johnson, K.A.; Goody, R.S. The Original Michaelis Constant: Translation of the 1913 Michaelis-Menten Paper. Biochemistry 2011, 50, 8264–8269. [Google Scholar] [CrossRef]
  59. Alberty, R.A. The Relationship between Michaelis Constants, Maximum Velocities and the Equilibrium Constant for an Enzyme-catalyzed Reaction. J. Am. Chem. Soc. 1953, 75, 1928–1932. [Google Scholar] [CrossRef]
  60. Lambert, R.J.W.; Pearson, J. Susceptibility testing: Accurate and reproducible minimum inhibitory concentration (MIC) and non-inhibitory concentration (NIC) values. J. Appl. Microbiol. 2000, 88, 784–790. [Google Scholar] [CrossRef]
  61. Michael, A.; Kelman, T.; Pitesky, M. Overview of Quantitative Methodologies to Understand Antimicrobial Resistance via Minimum Inhibitory Concentration. Animals 2020, 10, 1405. [Google Scholar] [CrossRef]
  62. Qiu, S.; Zhang, X.; Xia, W.; Li, Z.; Wang, L.; Chen, Z.; Ge, S. Effect of extreme pH conditions on methanogenesis: Methanogen metabolism and community structure. Sci. Total Environ. 2023, 877, 162702. [Google Scholar] [CrossRef]
  63. Oude Elferink, S.J.W.H. Sulfate-Reducing Bacteria in Anaerobic Bioreactors. Ph.D. Thesis, Wageningen University, Wageningen, The Netherlands, 1998. [Google Scholar]
  64. Stams, A.J.M.; Plugge, C.M.; de Bok, F.A.M.; van Houten, B.; Lens, P.; Dijkman, H.; Weijma, J. Metabolic interactions in methanogenic and sulfate-reducing bioreactors. Water Sci. Technol. 2005, 52, 13–20. [Google Scholar] [CrossRef] [PubMed]
  65. Percheron, G.; Bernet, N.; Moletta, R. Interactions between methanogenic and nitrate reducing bacteria during the anaerobic digestion of an industrial sulfate rich wastewater. FEMS Microbiol. Ecol. 1999, 29, 341–350. [Google Scholar] [CrossRef]
  66. Wu, X.; Wang, C.; Wang, D.; Huang, Y.-X.; Yuan, S.; Meng, F. Simultaneous methanogenesis and denitrification coupled with nitrifying biofilm for high-strength wastewater treatment: Performance and microbial mechanisms. Water Res. 2022, 225, 119163. [Google Scholar] [CrossRef]
  67. Chen, Y.; Dai, X.; Wang, H.; Liu, X.; Gu, L. Insights into the mitigative effects of microbial electrolysis cell on anaerobic digestion under high ammonia condition. Chem. Eng. J. 2023, 474, 145760. [Google Scholar] [CrossRef]
  68. Zhu, Y.; Chen, X.; Yang, Y.; Xie, S. Impacts of cyanobacterial biomass and nitrate nitrogen on methanogens in eutrophic lakes. Sci. Total Environ. 2022, 848, 157570. [Google Scholar] [CrossRef] [PubMed]
  69. Schwarz, J.I.K.; Eckert, W.; Conrad, R. Response of the methanogenic microbial community of a profundal lake sediment (Lake Kinneret, Israel) to algal deposition. Limnol. Oceanogr. 2008, 53, 113–121. [Google Scholar] [CrossRef]
  70. Cai, Y.; Zheng, Z.; Wang, X. Obstacles faced by methanogenic archaea originating from substrate-driven toxicants in anaerobic digestion. J. Hazard. Mater. 2021, 403, 123938. [Google Scholar] [CrossRef]
  71. Peng, X.; Zhang, S.; Li, L.; Zhao, X.; Ma, Y.; Shi, D. Long-term high-solids anaerobic digestion of food waste: Effects of ammonia on process performance and microbial community. Bioresour. Technol. 2018, 262, 148–158. [Google Scholar] [CrossRef]
  72. Buhlmann, C.H.; Mickan, B.S.; Jenkins, S.N.; Tait, S.; Kahandawala, T.K.A.; Bahri, P.A. Ammonia stress on a resilient mesophilic anaerobic inoculum: Methane production, microbial community, and putative metabolic pathways. Bioresour. Technol. 2019, 275, 70–77. [Google Scholar] [CrossRef]
  73. Zhang, H.; Yuan, W.; Dong, Q.; Wu, D.; Yang, P.; Peng, Y.; Li, L.; Peng, X. Integrated multi-omics analyses reveal the key microbial phylotypes affecting anaerobic digestion performance under ammonia stress. Water Res. 2022, 213, 118152. [Google Scholar] [CrossRef]
  74. Sawatdeenarunat, C.; Surendra, K.C.; Takara, D.; Oechsner, H.; Khanal, S.K. Anaerobic digestion of lignocellulosic biomass: Challenges and opportunities. Bioresour. Technol. 2015, 178, 178–186. [Google Scholar] [CrossRef]
  75. Wilson, D.B. Microbial diversity of cellulose hydrolysis. Curr. Opin. Microbiol. 2011, 14, 259–263. [Google Scholar] [CrossRef]
  76. Azelee, N.I.W.; Mahdi, H.I.; Cheng, Y.-S.; Nordin, N.; Illias, R.M.; Rahman, R.A.; Shaarani, S.M.; Bhatt, P.; Yadav, S.; Chang, S.W.; et al. Biomass degradation: Challenges and strategies in extraction and fractionation of hemicellulose. Fuel 2023, 339, 126982. [Google Scholar] [CrossRef]
  77. Hu, F.; Ragauskas, A. Pretreatment and Lignocellulosic Chemistry. Bioenergy Res. 2012, 5, 1043–1066. [Google Scholar] [CrossRef]
  78. Erfani Jazi, M.; Narayanan, G.; Aghabozorgi, F.; Farajidizaji, B.; Aghaei, A.; Kamyabi, M.A.; Navarathna, C.M.; Mlsna, T.E. Structure, chemistry and physicochemistry of lignin for material functionalization. SN Appl. Sci. 2019, 1, 1094. [Google Scholar] [CrossRef]
  79. Lankiewicz, T.S.; Choudhary, H.; Gao, Y.; Amer, B.; Lillington, S.P.; Leggieri, P.A.; Brown, J.L.; Swift, C.L.; Lipzen, A.; Na, H.; et al. Lignin deconstruction by anaerobic fungi. Nat. Microbiol. 2023, 8, 596–610. [Google Scholar] [CrossRef]
  80. Martone, P.T.; Estevez, J.M.; Lu, F.; Ruel, K.; Denny, M.W.; Somerville, C.; Ralph, J. Discovery of Lignin in Seaweed Reveals Convergent Evolution of Cell-Wall Architecture. Curr. Biol. 2009, 19, 169–175. [Google Scholar] [CrossRef] [PubMed]
  81. Alzate-Gaviria, L.; Maldonado, J.; Chablé-Villacis, R.; Olguin Maciel, E.; Leal-Bautista, R.; Canché-Escamilla, G.; Caballero-Vázquez, J.; Hernández-Zepeda, C.; Barredo-Pool, F.; Tapia-Tussell, R. Presence of Polyphenols Complex Aromatic “Lignin” in Sargassum spp. from Mexican Caribbean. J. Mar. Sci. Eng. 2020, 9, 6. [Google Scholar] [CrossRef]
  82. Fuertes-Rabanal, M.; Rebaque, D.; Largo-Gosens, A.; Encina, A.; Mélida, H. Cell walls: A comparative view of the composition of cell surfaces of plants, algae, and microorganisms. J. Exp. Bot. 2024, 76, 2614–2645. [Google Scholar] [CrossRef] [PubMed]
  83. Yadav, V.K.; Gupta, N.; Kumar, P.; Dashti, M.G.; Tirth, V.; Khan, S.H.; Yadav, K.K.; Islam, S.; Choudhary, N.; Algahtani, A.; et al. Recent Advances in Synthesis and Degradation of Lignin and Lignin Nanoparticles and Their Emerging Applications in Nanotechnology. Materials 2022, 15, 953. [Google Scholar] [CrossRef]
  84. Zhu, D.; Zhang, P.; Xie, C.; Zhang, W.; Sun, J.; Qian, W.-J.; Yang, B. Biodegradation of alkaline lignin by Bacillus ligniniphilus L1. Biotechnol. Biofuels 2017, 10, 44. [Google Scholar] [CrossRef] [PubMed]
  85. Grgas, D.; Rukavina, M.; Beslo, D.; Stefanac, T.; Crnek, V.; Sikic, T.; Habuda-Stanic, M.; Dragicevic, T.L. The Bacterial Degradation of Lignin-A Review. Water 2023, 15, 1272. [Google Scholar] [CrossRef]
  86. Li, D.; Bao, Y.; Liu, X.; Li, Z.; Chen, X. Constraints and dynamic assessment of biomethane generation from cyclically nutrients stimulation. J. Clean. Prod. 2024, 451, 141728. [Google Scholar] [CrossRef]
  87. Deng, Z.; Xia, A.; Huang, Y.; Zhu, X.; Zhu, X.; Liao, Q. The correlation between the physicochemical properties and enzymatic hydrolyzability of hydrothermal pretreated wheat straw: A quantitative analysis. Bioresour. Technol. 2022, 359, 127475. [Google Scholar] [CrossRef]
  88. Bhatt, A.H.; Tao, L. Economic Perspectives of Biogas Production via Anaerobic Digestion. Bioengineering 2020, 7, 74. [Google Scholar] [CrossRef] [PubMed]
  89. Zhang, H.; Yao, Y.; Deng, J.; Zhang, J.-L.; Qiu, Y.; Li, G.; Liu, J. Hydrogen production via anaerobic digestion of coal modified by white-rot fungi and its application benefits analysis. Renew. Sustain. Energy Rev. 2022, 157, 112091. [Google Scholar] [CrossRef]
  90. Al-Wahaibi, A.; Osman, A.I.; Al-Muhtaseb, A.a.H.; Alqaisi, O.; Baawain, M.; Fawzy, S.; Rooney, D.W. Techno-economic evaluation of biogas production from food waste via anaerobic digestion. Sci. Rep. 2020, 10, 15719. [Google Scholar] [CrossRef]
  91. Aziz, N.I.H.A.; Hanafiah, M.M.; Gheewala, S.H. A review on life cycle assessment of biogas production: Challenges and future perspectives in Malaysia. Biomass Bioenergy 2019, 122, 361–374. [Google Scholar] [CrossRef]
Figure 1. Schematic diagram of the experimental setup for batch fermentation.
Applsci 15 11068 g001
Figure 2. CH4 production characteristics of the reactor under different nutrient feeding conditions (35 °C, 101 kPa). Each experimental group consists of three parallel experimental groups, with the error bars representing standard errors. (a) CM group; (b) SD group; (c) BA group.
Applsci 15 11068 g002
Figure 3. CO2 production characteristics of the reactor under different nutrient feeding conditions (35 °C, 101 kPa). Each experimental group consists of three parallel experimental groups, with the error bars representing standard errors. (a) CM group; (b) SD group; (c) BA group.
Applsci 15 11068 g003
Figure 4. Quantitative analysis of microbial communities. (a) bacterial Venn diagrams; (b) archaeal Venn diagrams.
Applsci 15 11068 g004
Figure 5. Community composition analysis. (a) Principal Component Analysis (PCA) of bacterial communities; (b) operational taxonomic Unit (out)-based hierarchical clustering tree of bacterial communities; (c) PCA of archaeal communities; (d) OTU-based hierarchical clustering tree of archaeal communities.
Applsci 15 11068 g005
Figure 6. Composition of microbial communities in the reactor under different feeding regimes. (a) Bacterial composition at the phylum level; (b) bacterial composition at the genus level; (c) archaeal composition at the phylum level; (d) archaeal composition at the genus level.
Applsci 15 11068 g006
Figure 7. Fitting results of methane production characteristics under different nutrient supplementation conditions (35 °C, 101 kPa). (a) Exp-1; (b) Exp-2; (c) Exp-3; (d) Exp-4; (e) Exp-5; (f) Exp-6; (g) Exp-7; (h) Exp-8; (i) Exp-9.
Applsci 15 11068 g007aApplsci 15 11068 g007b
Figure 8. Causes of microbial degradation cessation of coal.
Applsci 15 11068 g008
Figure 9. Metabolic pathways of substrate degradation in the reactors. (a) CM group; (b) SD group; (c) BA group.
Applsci 15 11068 g009
Figure 10. Pearson correlation coefficient matrix among various factors in the anaerobic degradation process.
Applsci 15 11068 g010
Figure 11. Economic benefit analysis of coal microbial degradation: (a) cost of experimental medicines; (b) cost of raw materials used; (c) benefits of methane production from different feedstock; (d) profit and loss rate.
Applsci 15 11068 g011
Figure 12. Field application of coal microbial gas production: ① fracturing system; ② microbial injection system; ③ extraction system: ④ fracturing fluid; ⑤ proppant; ⑥ pressure pump; ⑦ strains; ⑧ nutrient solution; ⑨ pressure pump; ⑩ pumping rig; ⑪ mobile phone station; ⑫ coal-fired power plant.
Applsci 15 11068 g012
Table 1. Industrial analysis of coal samples.
SampleM (%)Ad (%)Vd (%)Fcd (%)D (%)V (%)Vdaf (%)FC (%)FCdaf (%)
BYH116.439.5935.5938.3911.4742.5948.1145.9451.89
BYH216.449.5935.3538.6211.4842.3147.7946.2152.21
BYH316.429.6235.4838.4811.5142.4547.9746.0452.03
Table 2. Elemental analysis of coal samples.
SampleN (%)C (%)H (%)S (%)C/N C/H
BYH1.0946.743.930.9942.8811.89
Table 3. Experimental scheme.
Type of FeedExperimental GroupFeeding Measures
First FeedingSecond FeedingThird Feeding
CMCtr-1/Extract 100 mL of fermentation liquid and add 100 mL of nutrient solutionExtract 20 mL of fermentation liquid and add 20 mL of nutrient solution
Ctr-2
Ctr-3
Exp-120 g coal
Exp-2
Exp-3
SDCtr-4/5 g sawdust1 g sawdust
Ctr-5
Ctr-6
Exp-420 g coal
Exp-5
Exp-6
BACtr-7/5 g blue-green algae1 g blue-green algae
Ctr-8
Ctr-9
Exp-720 g coal
Exp-8
Exp-9
Table 4. Fitting parameters of methane production characteristics under different nutrient supplementation conditions.
SampleNutritional SupplementsAE/mL·g−1A/mL·g−1μm/mL·g−1·h−1λ/hR2Error
Exp-1Culture medium0.567 0.575 0.006 249.4910.998670.071
Exp-21.130 1.145 0.010 210.4020.999320.067
Exp-30.515 0.515 0.007 187.0060.999990.002
Exp-4Sawdust0.363 0.363 0.005 231.84710.001
Exp-51.299 1.298 0.020 228.0550.999990.006
Exp-61.357 1.358 0.014 225.4630.999990.004
Exp-7Blue-green algae17.072 17.689 0.057 574.6240.998610.181
Exp-815.543 16.152 0.048 560.0880.994410.196
Exp-916.337 16.784 0.059 569.8590.998740.137
Table 5. Dynamic parameters of gas production in reactors under different feeding conditions.
SampleCO2CH4
AμmλA1μm1λ1
Exp-13.760.030.0011.500.12249.49
Exp-235.130.160.0022.890.20210.40
Exp-319.990.110.0010.290.14187.00
Exp-421.600.090.007.260.09231.84
Exp-547.410.160.0025.950.39228.05
Exp-641.440.130.0027.150.27225.46
Exp-7245.330.62428.00353.781.14574.62
Exp-8224.210.57422.82323.030.95560.08
Exp-9226.270.67443.84335.681.17569.85
Table 6. α diversity indices of microbial communities in reactors under different feeding conditions.
BacteriaArchaea
SobsAceChaoShannonSimpsonSobs1Ace1Chao1Shannon1Simpson1
Exp-1360.00382.77368.633.600.062525.37251.310.38
Exp-2289.00332.53311.483.050.112627.2326.251.550.26
Exp-3284.00325.47322.892.810.182526.1225.171.230.38
Exp-4399.00452.20422.263.310.092930.0729.171.150.44
Exp-5366.00395.48380.083.200.133233.423310.57
Exp-6386.00429.21411.503.270.112829.0928.170.90.58
Exp-7421.00459.11434.942.890.252222.55220.960.52
Exp-8298.00331.39326.213.010.162323.8423.51.420.29
Exp-9368.00406.03387.222.720.252121.56210.980.49
Disclaimer/Publisher’s Note: The statements, opinions and data contained in all publications are solely those of the individual author(s) and contributor(s) and not of MDPI and/or the editor(s). MDPI and/or the editor(s) disclaim responsibility for any injury to people or property resulting from any ideas, methods, instructions or products referred to in the content.