Article

Enzymatic Hydrolysis of Polysaccharide from Houttuynia cordata and Structure Characterization of the Degradation Products and Their α-Glucosidase Inhibitory Activity

1
Key Laboratory of Environment Correlative Dietology (Ministry of Education), Huazhong Agricultural University, Wuhan 430070, China
2
Hubei Key Laboratory of Fruit & Vegetable Processing & Quality Control, Huazhong Agricultural University, Wuhan 430070, China
3
College of Food Science and Technology, Huazhong Agricultural University, Wuhan 430070, China
*
Author to whom correspondence should be addressed.
Appl. Sci. 2025, 15(20), 11057; https://doi.org/10.3390/app152011057
Submission received: 26 September 2025 / Revised: 9 October 2025 / Accepted: 14 October 2025 / Published: 15 October 2025

Abstract

This study aimed to enhance the α-glucosidase inhibitory activity of Houttuynia cordata polysaccharide (HCP) and investigate the structure of derivatives. Under optimal conditions (amylase derived from Aspergillus oryzae loading of 15 U/mL, 60 °C, and pH 6.1), the enzymatic hydrolysates of HCP (EHCP) demonstrated significantly higher α-glucosidase inhibition than non-enzymatically treated HCP (NEHCP). At a 6 mg/mL concentration, the α-glucosidase inhibition rates of EHCP and NEHCP were 77.32% and 52.92%, respectively. Molecular weight analysis revealed that EHCP was a homogeneous polysaccharide of 338.7 kDa, lower than that of NEHCP (504.6 kDa). The monosaccharide composition was Galacturonic acid/Glucuronic acid/Galactose/Rhamnose/Mannose/Fucose/Xylose/Arabinose/Glucose = 77.42:3.78:8.04:2.12:3.16:2.48:0.75:0.17:2.08 molar ratio. Infrared and nuclear magnetic resonance analyses confirmed pyranose rings and both α- and β-glycosidic linkages. Compared with NEHCP, EHCP demonstrated improved solubility, decreased crystallinity, and morphological changes from dense rod-like to loose flaky structures.

1. Introduction

With the socioeconomic development and improved living standards in China, dietary patterns have shifted toward higher sugar consumption. Long-term exposure to elevated glucose levels can cause hyperglycemia and metabolic disorders, posing significant health risks [1]. α-Glucosidase, a major digestive enzyme, catalyzes oligosaccharide breakdown into glucose in the small intestine, resulting in postprandial hyperglycemia [2]. Clinically used α-glucosidase inhibitors, including acarbose, effectively reduce postprandial blood glucose levels by inhibiting enzymatic activity. However, synthetic inhibitors, including acarbose, are associated with adverse effects, including hepatotoxicity and hypoglycemia [3,4]. Therefore, discovering natural alternatives demonstrating minimal side effects is now a key research priority [5].
Houttuynia cordata Thunb., belonging to the Saururaceae family, is a dual-use plant valued for both medicinal and culinary purposes [6]. It is broadly distributed throughout Asia, particularly in China, Japan, Korea, and Southeast Asia [7]. Pharmacological studies have confirmed that Houttuynia cordata (H. cordata) possesses various bioactive properties, including antioxidant, anti-inflammatory, antiviral, antibacterial, immunomodulatory, antitumor, gut-protective, hypoglycemic, and anti-allergic effects [8]. Polysaccharides represent one of its key bioactive constituents. Houttuynia cordata polysaccharide (HCP), an acidic heteropolysaccharide, mainly comprises mannose (Man), arabinose (Ara), glucose (Glc), glucuronic acid (GlcA), galactose (Gal), and galacturonic acid (GalA), with minor amounts of rhamnose (Rha), xylose (Xyl), and fucose (Fuc) [7]. HCP exhibits several bioactivities, including antioxidant, anti-inflammatory, and immunomodulatory effects [7]. Furthermore, existing studies have reported that at a 6 mg/mL concentration, HCP exhibits α-glucosidase inhibition rates of 44.68–69.58%, which is significantly lower than that of acarbose (80.83%; p < 0.05) [9]. Similarly, polysaccharides extracted from H. cordata stems demonstrated an 18.43% inhibition rate at 10 mg/mL [10]. These findings suggest that HCP holds promise as a hypoglycemic agent; however, its activity necessitates further improvement.
The inherent characteristics and functional behavior of polysaccharides are fundamentally governed by their structure, encompassing molecular weight, monosaccharide composition, and configuration [11]. Research has consistently demonstrated that degraded polysaccharides exhibit reduced molecular weight and improved biological activity, despite their monosaccharide composition and key structural features, including functional groups, frequently showing little change before and after the process [12,13,14]. Conventional polysaccharide depolymerization strategies include chemical (acid hydrolysis and oxidative cleavage), physical (ultrasonication, irradiation, and microwave degradation), and biological (enzymatic hydrolysis) methods [14,15]. Enzymatically catalyzed hydrolysis has become an innovative pathway for polysaccharide modification, gaining significant research interest. Enzymatic methods offer advantages, including environmental friendliness, substrate specificity, and mild reaction conditions, compared with physicochemical depolymerization. Wu et al. [14] examined enzymatic modification of Auricularia polysaccharides, showing enhanced antioxidant capacity post-treatment. Similarly, Hu et al. [16] demonstrated that enzymatic depolymerization decreased the molecular weight distribution, surface tension, and apparent viscosity of Morus alba leaf polysaccharides and enhanced in vitro antioxidant efficacy. However, an excessive depolymerization-induced decrease in polysaccharide molecular weight may prevent bioactive tertiary structure formation, thereby diminishing therapeutic efficacy. Therefore, during polysaccharide degradation processes, attention should be directed toward monitoring biological activity rather than solely concentrating on the extent of structural breakdown.
Using α-glucosidase inhibition efficacy as the primary optimization criterion, this study systematically optimized enzymatic processing parameters to obtain derivatives with better activity. A comprehensive analytical approach, encompassing Fourier-transform infrared spectroscopy (FT-IR), gas chromatography (GC), X-ray diffraction (XRD), scanning electron microscopy (SEM), and nuclear magnetic resonance (NMR) spectroscopy, was employed to elucidate the structural characteristics of the enzymatically degraded HCP. Furthermore, the inhibitory effects and mechanism of action of the degraded polysaccharides against α-glucosidase were investigated.

2. Materials and Methods

2.1. Materials and Chemicals

α-Glucosidase was purchased from Sigma-Aldrich (St. Louis, MO, USA). 4-Nitrophenyl α-D-glucopyranoside, acarbose, amylase (derived from Aspergillus oryzae), and HPD-400 macroporous resin were acquired from Shanghai Yuanye Bio-Technology Co., Ltd. (Shanghai, China). Unless otherwise specified, all other chemicals were of analytical grade. H. cordata was cultivated in Lianghe Town, Dangyang City, Yichang, Hubei Province, provided by Hubei Aolilong Food Co., Ltd. (Yichang, China), and authenticated by the School of Pharmacy at Hubei University of Chinese Medicine.

2.2. HCP Preparation

Dried H. cordata stems and leaves were pulverized and sieved through a 60-mesh screen. The resulting powder was soaked overnight in 95% ethanol, followed by ethanol removal and air-drying of the residual material. Subsequently, the pretreated material was mixed with deionized water at a solid-to-liquid ratio of 1:20. Aqueous extraction was performed twice at 95 °C, each for 2 h. The resulting extracts were centrifuged and subsequently concentrated via rotary evaporation. To precipitate polysaccharides, four volumes of anhydrous ethanol were added, and the mixture was incubated at 4 °C overnight. The resulting precipitate was dried under low-temperature conditions and redissolved in water to a final concentration of 8 mg/mL. This solution subsequently underwent dynamic adsorption chromatography on an HPD-400 macroporous resin column (1 bed volume [BV]/h, 4 BV loading). The eluent was collected, concentrated, and lyophilized to yield HCP for subsequent enzymatic hydrolysis experiments.

2.3. HCP Enzymatic Hydrolysis

2.3.1. Single-Factor Design

The α-glucosidase inhibitory activity was used as the primary metric for enzymatic hydrolysis process evaluation. Single-factor experiments were conducted to investigate the impact of the following parameters: hydrolysis time (6, 9, 12, 14, and 16 h), pH (4, 5, 6, 7, 8, and 9), temperature (40 °C, 50 °C, 60 °C, and 70 °C), and enzyme dosage (5, 10, 15, 20, and 30 U/mL). All other variables were held constant in each single-factor experiment. The following baseline conditions were used: enzyme dosage, 20 U/mL; hydrolysis time, 12 h; pH, 6.0; temperature, 50 °C.
The procedure was as follows: HCP was dissolved in water to create a 5 mg/mL solution, which then underwent enzymatic hydrolysis. Following the reaction, the enzyme was inactivated by a 10 min boiling water bath, after which the solution was cooled and adjusted to pH 7.0. Subsequently, the resulting mixture was centrifuged (10,000 r/min, 10 min), and the supernatant was collected for α-glucosidase inhibitory activity determination.

2.3.2. Response Surface Test

Based on the results of single-factor experiments, the enzymatic hydrolysis time was held constant at 12 h. To optimize the enzymatic hydrolysis process, a Box–Behnken design (BBD) was employed, with enzymatic hydrolysis pH (A), temperature (B), and enzyme dosage (C) as independent variables, and α-glucosidase inhibitory activity as the response variable. The levels of each factor used in the response surface methodology (RSM) design are summarized in Table 1.

2.3.3. Response Surface Model Verification Test

After optimizing enzymatic hydrolysis conditions for HCPs, validation experiments were meticulously conducted in triplicate under the determined optimal conditions to ensure the robustness and reproducibility of the experimental findings.

2.3.4. α-Glycosidase Inhibition Assay

The α-glucosidase inhibitory activity of the enzymatic hydrolysate was evaluated following a previously established protocol [17], employing acarbose as a positive control. The reaction system comprised phosphate-buffered saline (PBS, 0.2 M, pH 6.8), enzyme solution, and substrate (pNPG). Subsequently, the inhibitory rate was calculated using Equation (1):
Inhibition   rate ( % ) = 1 A 1 A 2 A 3 A 0 × 100 ,
where A0 = absorbance of the blank control (PBS + pNPG); A1 = absorbance of the test sample (sample + α-glucosidase + pNPG); A2 = absorbance of the sample background (sample + pNPG); and A3 = absorbance of the enzyme control (PBS + α-glucosidase + pNPG).

2.4. Preparation of Enzymatic Hydrolysates of HCP (EHCP)

HCP was dissolved in water to prepare a 5 mg/mL solution, which was then reacted with an enzyme loading of 15 U/mL in a shaking water bath (120 r/min) at 60 °C and pH 6.1 for 12 h. Following the reaction, the enzyme was deactivated via a 10 min incubation in boiling water. The supernatant was collected via centrifugation and dialyzed against a 500 Da dialysis bag for 48 h, followed by concentration and lyophilization to obtain EHCP. An HCP solution that underwent direct dialysis without enzymatic hydrolysis served as the non-enzymatically treated HCP (NEHCP) control.

2.5. Inhibitory Effects on α-Glucosidase

2.5.1. Inhibition Rate on α-Glucosidase

The α-glucosidase inhibitory activity of EHCP and NEHCP (1–6 mg/mL) was determined using the method described in Section 2.3.4.

2.5.2. α-Glucosidase Inhibition Kinetics

Enzyme kinetics studies were conducted to determine the kinetic mechanism of α-glucosidase inhibition by EHCP and NEHCP. Different EHCP and NEHCP concentrations (0, 2, 3, 4, and 5 mg/mL) were mixed with 0.25 U/mL α-glucosidase and incubated at 37 °C for 15 min. Subsequently, different pNPG concentrations (0.75–2.0 mM) were added, and the absorbance of the reaction system was measured at 405 nm for 10 min at 10 s intervals. The Lineweaver–Burk plot was constructed using Equation (2):
1 V = K m V m a x K m V m a x 1 [ S ] + 1 V m a x
where [S] is the substrate concentration; Km is the Michaelis constant; and Vmax is the maximum reaction rate.

2.6. Physicochemical Properties

2.6.1. Chemical Composition Analysis and Solubility

The neutral sugar content of the polysaccharide was determined using the phenol–sulfuric acid method with glucose as the standard [18]. The uronic acid content was determined using the m-hydroxydiphenyl method with GalA as the standard [19]. The protein content was determined using the Bradford method with bovine serum albumin as the standard [20]. The reducing sugar content was determined using the 3,5-Dinitrosalicylic acid (DNS) method with glucose as the standard [14]. Solubility determination was modified on the basis of the method described by He et al. [17]. Specifically, 60 mg of the sample was dissolved in 4 mL of distilled water, followed by centrifugation at 4000 rpm for 10 min. The resulting precipitate was washed with a small amount of water and transferred to a pre-dried and pre-weighed weighing bottle. The weighing bottle was subsequently placed in a 105 °C oven for drying. Following drying, the total mass of the weighing bottle and the precipitate was accurately weighed. The solubility of each polysaccharide was calculated using Equation (3):
s o l u b i l i t y = M 1 M 3 M 2 4 ,
where M1 = mass of the sample; M2 = mass of the weighing bottle; and M3 = total mass of the weighing bottle and the precipitate after drying.

2.6.2. Molecular Weight

The molecular weight was determined using the GPC–MALS–RI system, incorporating the Shodex-OHpak SB-806 HQ column and TSK gel PWxL guard column. Before injection, the sample was prepared at a 1 mg/mL concentration in a 0.1 M NaNO3 solution and filtered through a 0.45 µm filter. The mobile phase comprised a 0.1 M NaNO3 solution, delivered at a 0.4 mL/min flow rate.

2.6.3. Monosaccharide Composition

The monosaccharide composition of the samples was determined following the modified version of the method described by Yu et al. [21]. Briefly, 10 mg of purified polysaccharide was hydrolyzed with 1 mL of 2 M trifluoroacetic acid (TFA) in a sealed ampule at 110 °C for 4 h. Subsequently, the hydrolyzed product was evaporated to dryness under a stream of nitrogen to remove the TFA. This step was followed by repeated addition of methanol (2 mL) and nitrogen blowing to eliminate any residual TFA. Following complete acid and methanol removal, 1 mL of pyridine, 10 mg of hydroxylamine hydrochloride, and 2 mg of inositol (internal standard) were added to the residue. The mixture was then heated in a 95 °C water bath for 30 min. Acetic anhydride was subsequently added, and the mixture was acetylated at 95 °C for 30 min. Following solvent evaporation, the acetylated monosaccharide derivatives were obtained and dissolved in chloroform for gas chromatographic analysis. Standard monosaccharides (Fuc, Rha, Ara, Gal, Glc, Xyl, Man, GalA) were derivatized similarly. GC-FID was performed using an Agilent 6890N with an HP-5 column (30 m × 0.32 mm × 0.25 μm). The oven temperature was programmed from 120 °C (3 min) to 250 °C at 5 °C/min, held for 4 min. Injector and detector temperatures were 250 °C and 280 °C, respectively. Nitrogen, hydrogen, and air flow rates were 25, 45, and 350 mL/min. Monosaccharides were identified by retention times and quantified using internal standard calibration with correction factors.

2.7. Structural Characterization

2.7.1. FT-IR Spectrum Analysis

Lyophilized EHCP and NEHCP were mixed with KBr, ground into a fine powder, and pressed into pellets. The pellets were subsequently analyzed using a Fourier-transform infrared spectrometer (Thermo Fisher Scientific, Waltham, MA, USA).

2.7.2. 1H NMR Analysis

For NMR analysis, lyophilized EHCP and NEHCP underwent two cycles of deuterium exchange using D2O, followed by repeated lyophilization. Approximately 50 mg of each sample was dissolved in 1 mL of D2O and transferred to an NMR tube. 1H-NMR spectra were acquired using a fully digital superconducting NMR spectrometer (Avance 3600 MHz, Bruker, Billerica, MA, USA), with minor modifications to the method described by Yang et al. [22].

2.7.3. Congo Red

To analyze the triple-helical structure, 2 mL of polysaccharide solution (2.5 mg/mL) was mixed with 2 mL of Congo red solution (80 µmol), following a modified version of the method described by Zheng et al. [23]. Different NaOH solution concentrations were subsequently gradually added to the mixture to achieve final NaOH concentrations of 0, 0.1, 0.2, 0.3, 0.4, and 0.5 M. Subsequently, the mixtures were scanned in the wavelength range of 400–600 nm to obtain UV-Vis spectra.

2.7.4. XRD

The crystal structure of HCP was investigated using an X-ray diffractometer (XRD, D8 Advance X-ray diffractometer, Burker, Germany). The analysis was performed with a 40 kV working voltage and a 40 mA current, over a diffraction angle range of 5–55°, with a 5°/min scanning rate.

2.7.5. SEM

The morphology of lyophilized EHCP and NEHCP was observed using SEM (JEOL JSM − 6390 LV, Oxford instruments, Abingdon, UK). The samples were adhered to the sample stage, sputter-coated with gold, and subsequently observed under a 10 kV accelerating voltage, with images acquired at 100× and 1000× magnifications.

2.8. Statistical Analysis

All experiments were performed at least in triplicate, and data were presented as means ± standard deviations. Statistical analysis was performed using one-way analysis of variance (ANOVA) and Student’s t test in GraphPad Prism 8.4 software, with p < 0.05 indicating statistically significant differences. RSM design and analysis were conducted using Design-Expert 13.0 software. NMR, FT-IR, GPC, and XRD data, as well as Lineweaver–Burk plots, were generated using Origin 2025 software. All other graphs were plotted using GraphPad Prism 8.4 software.

3. Results and Discussion

3.1. HCP Enzymatic Hydrolysis

3.1.1. Single-Factor Test Results

To define the experimental ranges for key variables (enzyme dosage, hydrolysis time, pH, temperature), single-factor experiments were performed before the RSM optimization.
The α-glucosidase inhibition rate of the HCP hydrolysate increased in a concentration-dependent manner with increasing amylase dosage, reaching a maximum of 53.96% at 15 U/mL (Figure 1A). A slight decrease in inhibitory capacity was observed beyond this point. The phenomenon likely results from the following opposing mechanisms: (1) at optimal concentrations, moderate enzymatic degradation releases bioactive polysaccharide fragments through controlled cleavage of glycosidic bonds, whereas (2) excessive enzyme loading causes over-depolymerization, compromising the tertiary structure crucial for α-glucosidase inhibition. Therefore, the inflection point at 15 U/mL represents the equilibrium between productive catalysis and structural integrity preservation.
The α-glucosidase inhibitory activity progressively increased with temperature elevation from 40 °C to 60 °C during enzymatic hydrolysis (Figure 1B). This enhancement possibly stems from increased molecular mobility and improved substrate accessibility, which accelerate catalytic efficiency through enhanced enzyme–polysaccharide interactions. However, exceeding optimal temperatures can compromise enzymatic activity as excessive thermal energy disrupts molecular structures through secondary bond breakdown. This structural denaturation results in reduced catalytic capacity or complete enzyme inactivation, consequently reducing degradation efficiency [14,24]. Therefore, 60 °C was identified as the optimal temperature for amylase-mediated degradation of HCP.
The pH of a solution can affect enzymatic activity and structural integrity by modulating the ionization states of essential groups within the enzyme’s active site, consequently influencing catalytic efficiency. Maximal α-glucosidase inhibitory efficacy was achieved at pH 6.0 (Figure 1C). This experimental evidence establishes pH 6.0 as the optimal condition for amylase-mediated HCP degradation.
Figure 1D delineates that the α-glucosidase inhibitory rate exhibits a biphasic pattern during the 6–16 h hydrolysis period, peaking at 12 h before subsequently declining. Statistical analysis revealed no statistically significant differences (p > 0.05) in inhibitory efficacy across evaluated time points (6, 9, 12, 14, and 16 h). This temporal pattern may be attributed to the progressive saturation of enzyme–substrate binding interactions, ultimately reaching equilibrium conditions. Consequently, based on kinetic performance metrics, the optimal enzymatic hydrolysis duration for amylase-mediated HCP degradation was empirically established as 12 h.

3.1.2. Response Surface Test Results and Analysis

Based on single-factor experiments, this study utilized RSM for optimizing the enzymatic hydrolysis modification of HCP. BBD was employed, comprising 17 experimental runs, including 5 center point replicates and 12 factorial points, to determine the optimal combination of factors. The hydrolysis time was fixed at 12 h. The experimental design and corresponding response values are presented in Table 2.
Second-order polynomial regression analysis was performed using Design-Expert 13 statistical software. The response surface fitting yielded a mathematical model describing the association between the process parameters and the α-glucosidase inhibition rate. The following is the quadratic multiple regression equation for α-glucosidase inhibition rate (Y) as a function of hydrolysis pH (A), hydrolysis temperature (B), and enzyme dosage (C): Y = 50.85 + 2.98A − 2.32B − 2.03C − 0.545AB − 1.39AC − 3.29BC − 14.37A2 − 11.77B2 − 15.83C2 (p < 0.0001, R2 = 0.9850). ANOVA of the regression equation (Table 3) revealed that the model was highly significant (p < 0.0001), and the lack-of-fit test was nonsignificant (p = 0.1082 > 0.05), indicating that the model effectively analyzes and predicts the effect of enzymatic hydrolysis conditions on the α-glucosidase inhibitory activity of HCP hydrolysates.
The effects of hydrolysis pH (A), hydrolysis temperature (B), and enzyme dosage (C) on the α-glucosidase inhibition rate were analyzed (Table 3). Specifically, the linear terms (A, C), quadratic terms (A2, B2, C2), and interaction term (BC) significantly influenced the inhibition rate, with the quadratic terms exhibiting highly significant effects (p < 0.01). This finding indicates a nonlinear relationship between the experimental factors and the response. The F-value analysis ranked the factors’ influence on α-glucosidase inhibition as A > B > C. The regression model showed a high determination coefficient (R2 = 0.9850), adjusted R2 = 0.9658, predicted R2 = 0.8148, and a low coefficient of variation (CV = 8.20% < 10%), demonstrating high reliability and good reflection of actual values. In summary, the quadratic regression equation delivers a good fit to the data, and the model is appropriate for predicting and analyzing α-glucosidase inhibition rates.
The three-dimensional response surface plots generated using Design-Expert 13 software, illustrating the association between the α-glucosidase inhibition rate and the enzyme dosage, hydrolysis temperature, and hydrolysis pH, are depicted in Figure 2. The slope of these response surfaces reflects the strength of the interaction between factor pairs [25]. As shown in Figure 2, as hydrolysis temperature (B) and enzyme dosage (C) increase, the α-glucosidase inhibition rate initially increases and subsequently decreases. The steep slope of the response surface indicates that the interaction term BC significantly influenced the results (p < 0.005), demonstrating a strong interaction. Other interaction terms (AC and AB) had relatively smaller effects on the inhibition rate, with the influence ranked as BC > AC > AB.

3.1.3. Response Surface Test Verification Test

Using the α-glucosidase inhibition rate as the key evaluation criterion, RSM guided the optimization of enzymatic hydrolysis. The following were the optimized conditions: enzyme dosage, 14.7 U/mL; hydrolysis temperature, 59.07 °C; and pH, 6.11. Under these conditions, the model predicted an α-glucosidase inhibition rate of 51.1769%. To account for practical considerations, the operational parameters were refined to: enzyme dosage, 15 U/mL; hydrolysis temperature, 60 °C; and pH, 6.1. Three independent experiments performed under these adjusted conditions generated an α-glucosidase inhibition rate of 50.9207% ± 2.77% (n = 3). This experimental value closely aligns with the model’s prediction (51.1769%), exhibiting a minimal relative error and confirming the accuracy and robustness of the predictive model.

3.2. Inhibitory Effects on α-Glucosidase

3.2.1. Inhibition Rate on α-Glucosidase

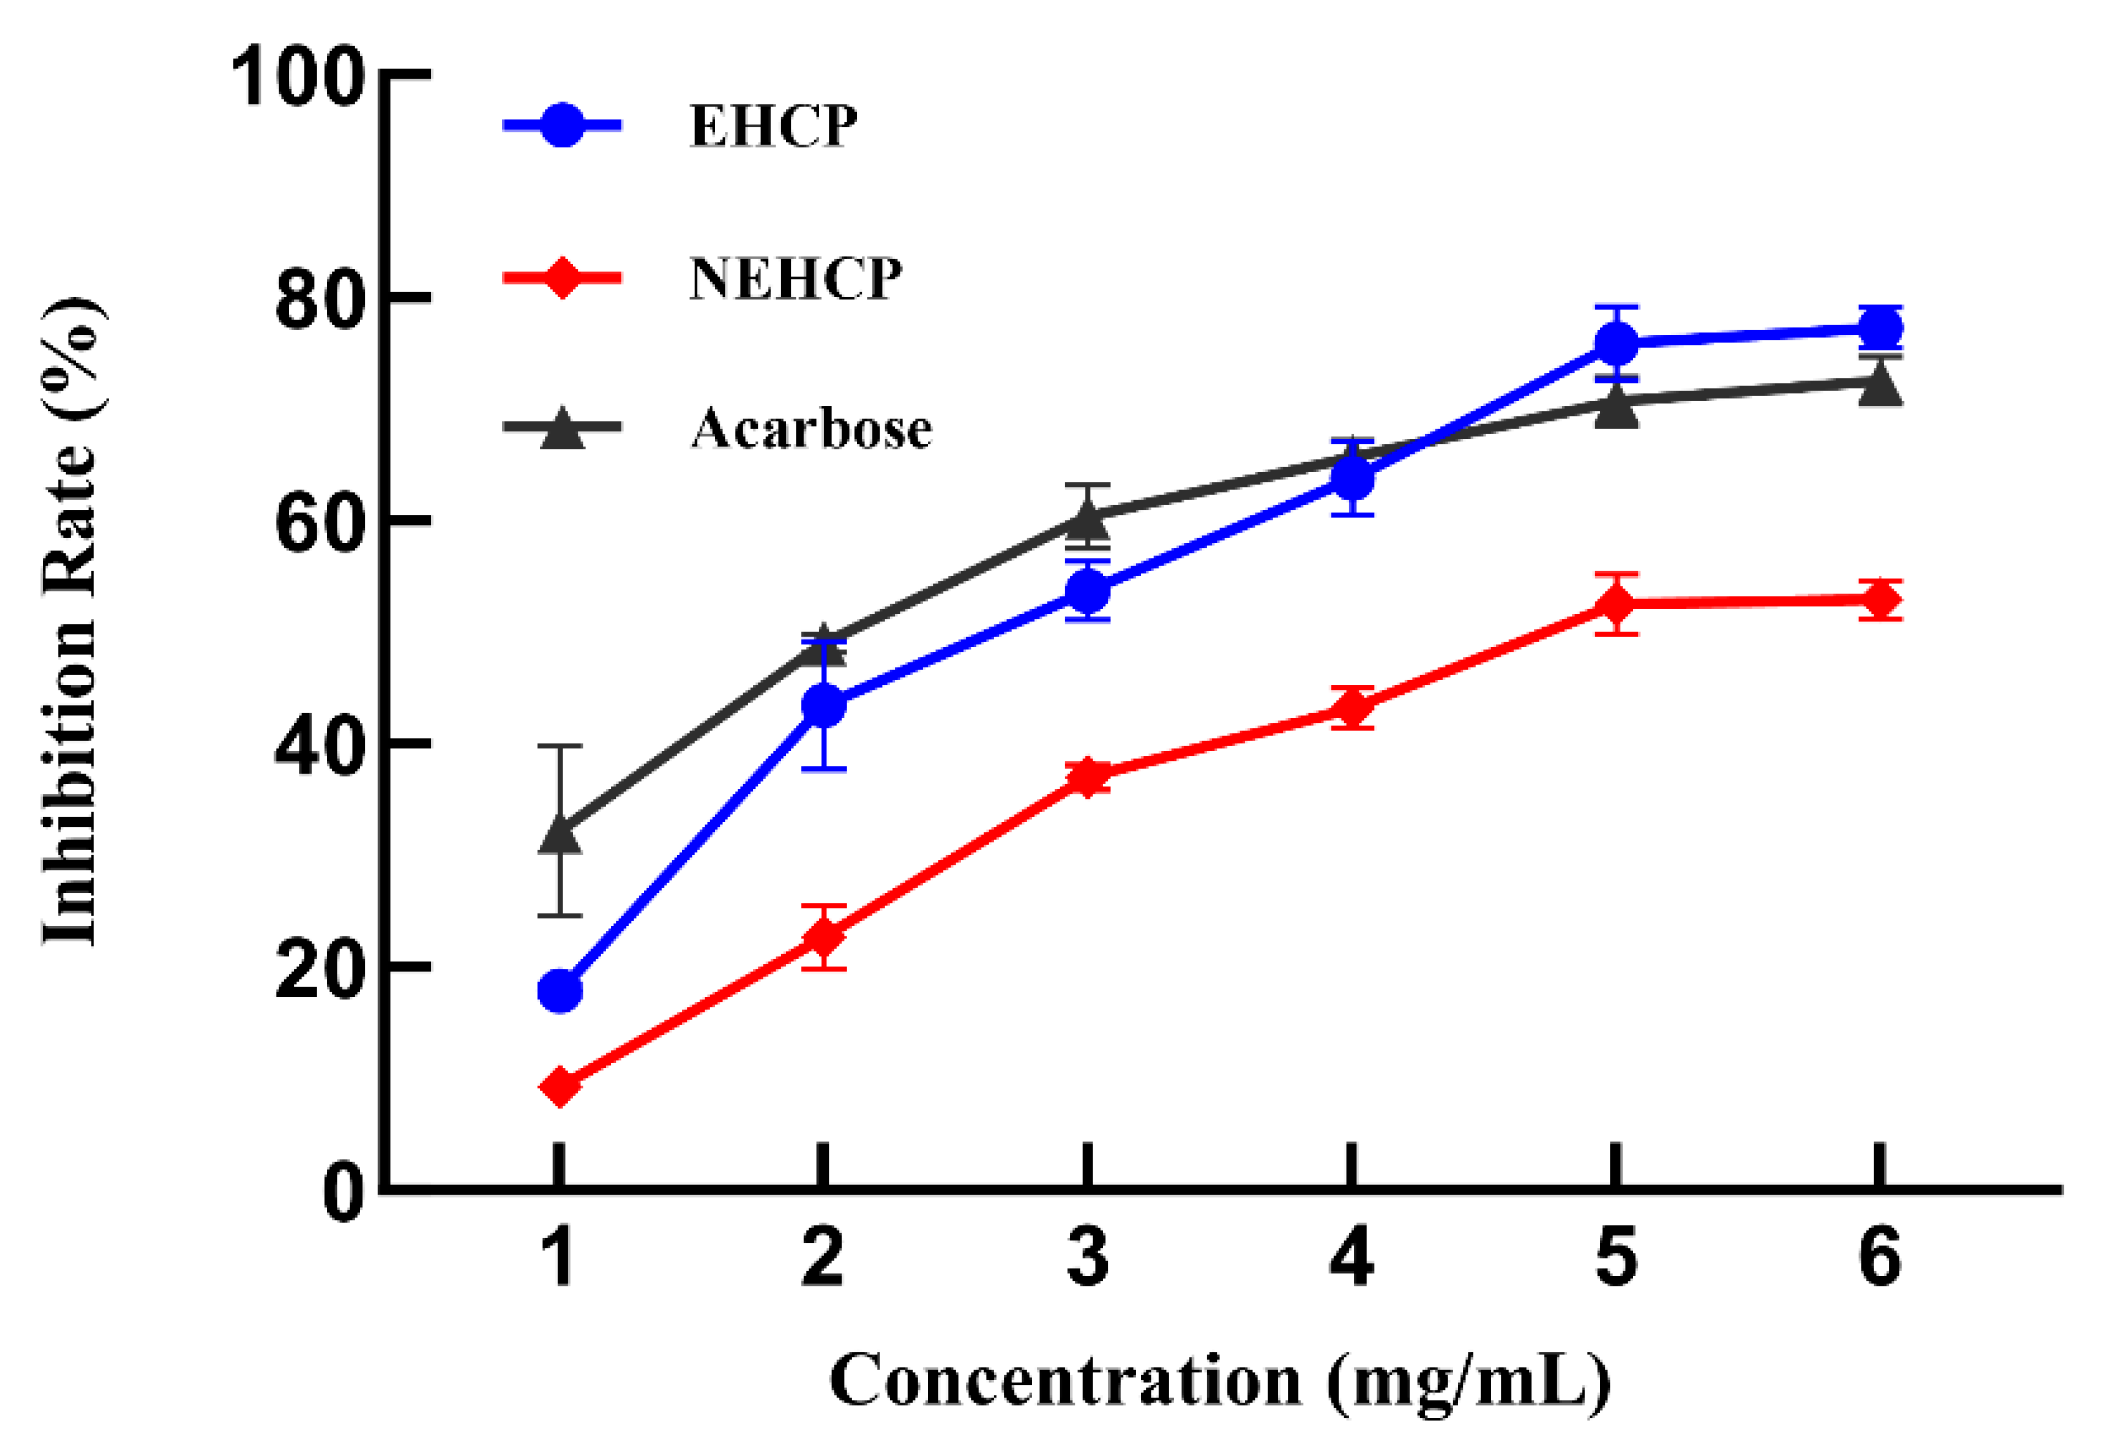
In this study, EHCP and NEHCP inhibitory activities were assessed using an in vitro assay. As shown in Figure 3, the α-glucosidase inhibition rates of EHCP, NEHCP, and the positive control acarbose demonstrate distinct dose-dependent responses. Under equivalent concentration conditions, EHCP revealed a significantly higher α-glucosidase inhibitory activity than NEHCP (p < 0.05). Furthermore, at 2–6 mg/mL concentrations, EHCP and acarbose showed comparable inhibitory effects, indicating no statistically significant difference (p > 0.05). At 6 mg/mL, the α-glucosidase inhibition rates of EHCP, NEHCP, and acarbose were 77.32%, 52.92%, and 72.56%, respectively. These findings suggest that enzymatic modification substantially improves the α-glucosidase inhibitory potency of HCP. This conclusion aligns with previous findings reported by Liang et al. [26] and Jia et al. [12], who confirmed that polysaccharide degradation via sulfuric acid hydrolysis or ultrasonic treatment significantly enhances their functional bioactivities. Specifically, Liang et al. [26] noted that sulfuric acid hydrolysis of black garlic polysaccharide increased its antioxidant and melanin inhibition activities, with negative correlations observed between antioxidant capacity and molecular weight. Similarly, Jia et al. [12] reported that ultrasonic degradation of corn silk polysaccharide significantly reduced molecular weight and enhanced α-glucosidase inhibitory activity.

3.2.2. α-Glucosidase Inhibition Kinetics

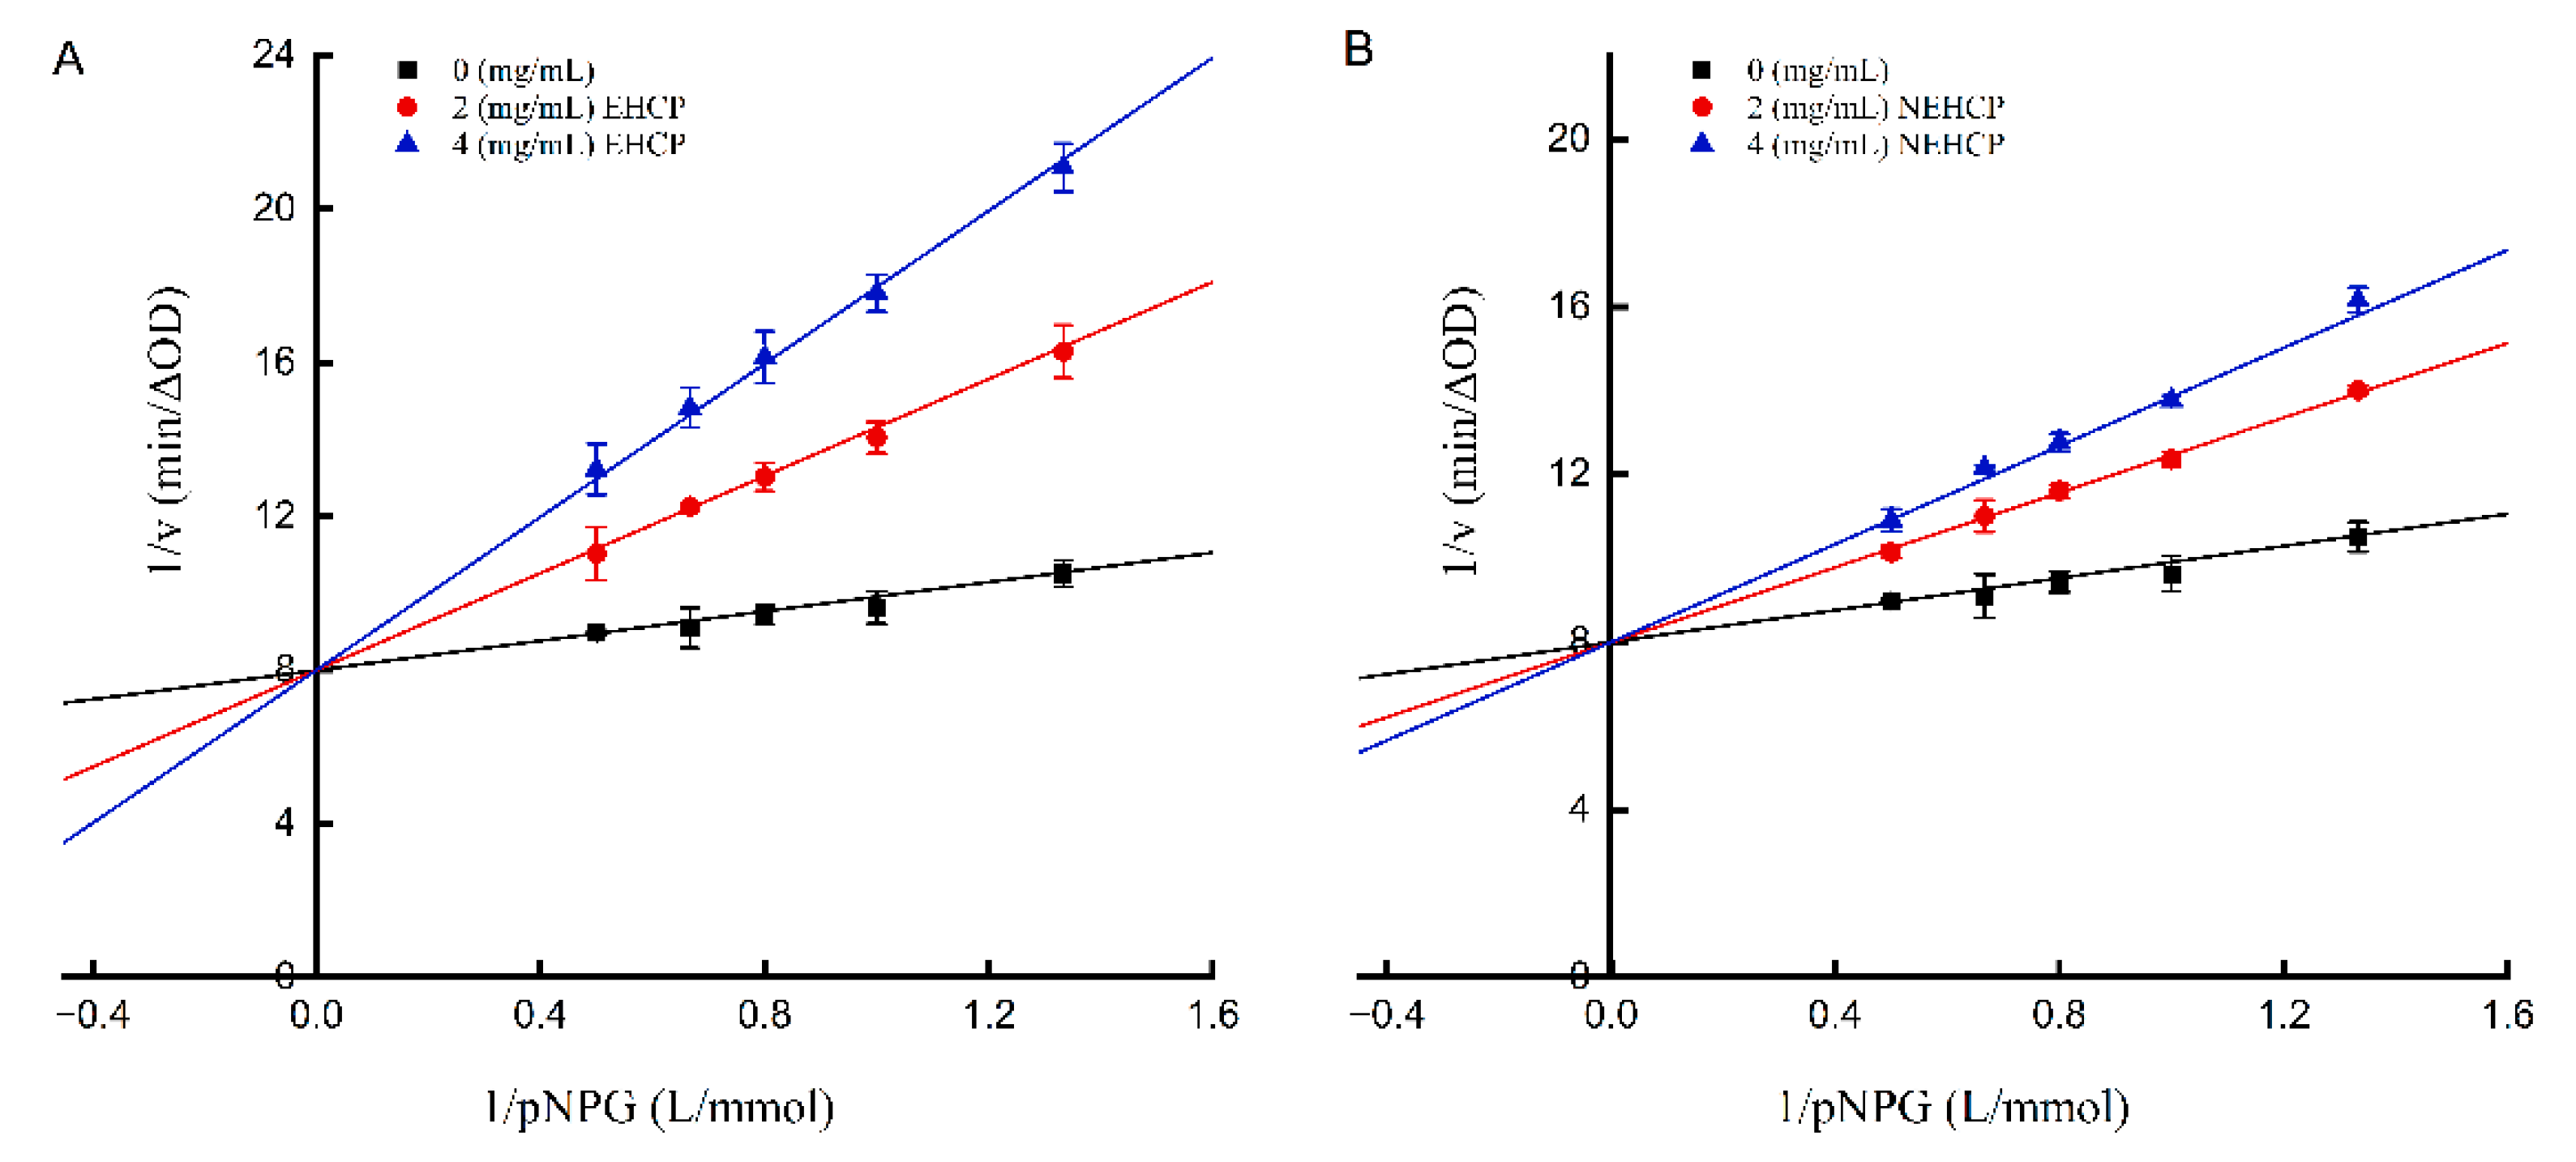
As depicted in Figure 4 and Table 4, the Lineweaver–Burk plots of all tested samples closely intersect at the y-axis, indicating that the maximum reaction velocity (Vmax) remains unchanged, whereas the Michaelis constant (Km) increases with the inhibitor concentration. These kinetic parameters confirm that EHCP and NEHCP function as competitive inhibitors of α-glucosidase [5]. Polysaccharide molecules are inferred to competitively bind to the enzyme’s active site with higher affinity than the substrate, thereby reducing enzymatic activity and inhibiting substrate conversion to product [27]. Furthermore, the inhibition constant (Ki) denotes the dissociation constant for enzyme–inhibitor complexes; diminished Ki values signify enhanced binding affinity and inhibitory potency. The calculated Ki values for EHCP and NEHCP were 0.92 and 1.92 mg/mL, respectively, indicating that EHCP demonstrates a stronger interaction with α-glucosidase than NEHCP, consistent with the α-glucosidase inhibitory activity assay results.

3.3. Physicochemical Properties of the Polysaccharides

3.3.1. Total Polysaccharide, Uronic acid Content, and Solubility

EHCP exhibited significantly elevated levels of neutral sugars, reducing sugars, and solubility compared with NEHCP (Table 5). This finding suggests that enzymatic hydrolysis effectively cleaved glycosidic bonds, resulting in an increased exposure of reducing hydroxyl groups within the EHCP structure [14]. The enhanced EHCP solubility may be attributed to the reduced polysaccharide molecular weight resulting from the enzymatic treatment [28]. Similarly, Hu et al. [29] reported increased reducing sugar content and solubility in Gastrodia elata polysaccharides following α-amylase degradation.

3.3.2. Molecular Weight

Using gel permeation chromatography (GPC), the purity and molecular weight distributions of EHCP and NEHCP were characterized. As depicted in Figure 5, both polysaccharides exhibit a single symmetrical peak indicative of homogeneous polysaccharides with narrow distributions and low dispersity. The molecular weights for NEHCP and EHCP were 504.6 and 338.7 kDa, respectively (Table 5). This reduced HCP molecular weight following enzymatic hydrolysis agrees with the observed increase in reducing sugar content in the chemical composition analysis, further confirming the ability of amylase to cleave glycosidic bonds and induce HCP degradation. Moreover, extensive research has indicated that molecular weight is a crucial factor influencing polysaccharide bioactivity; generally, lower molecular weights are correlated with enhanced activity [30]. The reduced EHCP molecular weight possibly contributes to its superior α-glucosidase inhibitory activity. Correspondingly, Lin et al. [31] demonstrated that wolfberry leaf polysaccharide degradation with an ascorbic acid/H2O2 system caused molecular weight reduction from 46.3 to 34.5 kDa, accompanied by a significantly enhanced anticoagulant activity, particularly antiplatelet activity (p < 0.05).

3.3.3. Monosaccharide Composition

The monosaccharide composition and molar ratios of EHCP and NEHCP are presented in Table 5. EHCP comprised the following: GalA:GlcA:Gal:Rha:Man:Fuc:Xyl:Ara:Glc = 77.42:3.78:8.04:2.12:3.16:2.48:0.75:0.17:2.08. The predominant monosaccharide was GalA (>70%), classifying them as acidic polysaccharides, a finding consistent with previous studies [9,32]. Moreover, two polysaccharides shared an identical set of nine monosaccharide constituents with slight variations in their molar ratios. Specifically, EHCP demonstrated a decreased Glc proportion compared with NEHCP. Conversely, EHCP exhibited slightly increased proportions of GlcA and neutral monosaccharides (Gal, Rha, Man, and Fuc). Consistent with our results, Ma et al. [13] reported that enzymatic hydrolysis of Dioscorea opposita Thunb. polysaccharide caused alterations to the monosaccharide ratios while preserving the constituent monosaccharide identity. Moreover, monosaccharide composition and relative abundance influence polysaccharide bioactivity [1]. Hypoglycemic polysaccharides typically contain varying Gal, Glu, Ara, and Xyl proportions, accompanied by insignificant amounts of Rha and Fuc [3]. Gong et al. [33] reported that Siraitia grosvenorii polysaccharides enriched in Gal and Man demonstrated marked in vitro hypoglycemic effects. Zhong et al. [34] isolated three polysaccharide fractions (Up-3, Up-4, and Up-5) from the seaweed Undaria pinnatifida with identical monosaccharide compositions but differing molar ratios; Up-3 and Up-4 exhibited stronger α-glucosidase inhibition, potentially due to their higher GlcA content. Similarly, Jia et al. [35] revealed that polysaccharides comprising Rha, Gal, Ara, Man, and GalA possessed enhanced α-glucosidase inhibitory activity. Collectively, these findings suggest that polysaccharides containing higher Gal, Rha, Man, and GlcA proportions display stronger α-glucosidase inhibitory effects, partly explaining the superior activity of EHCP.

3.4. Structural Characterization

3.4.1. FT-IR Spectrum Analysis

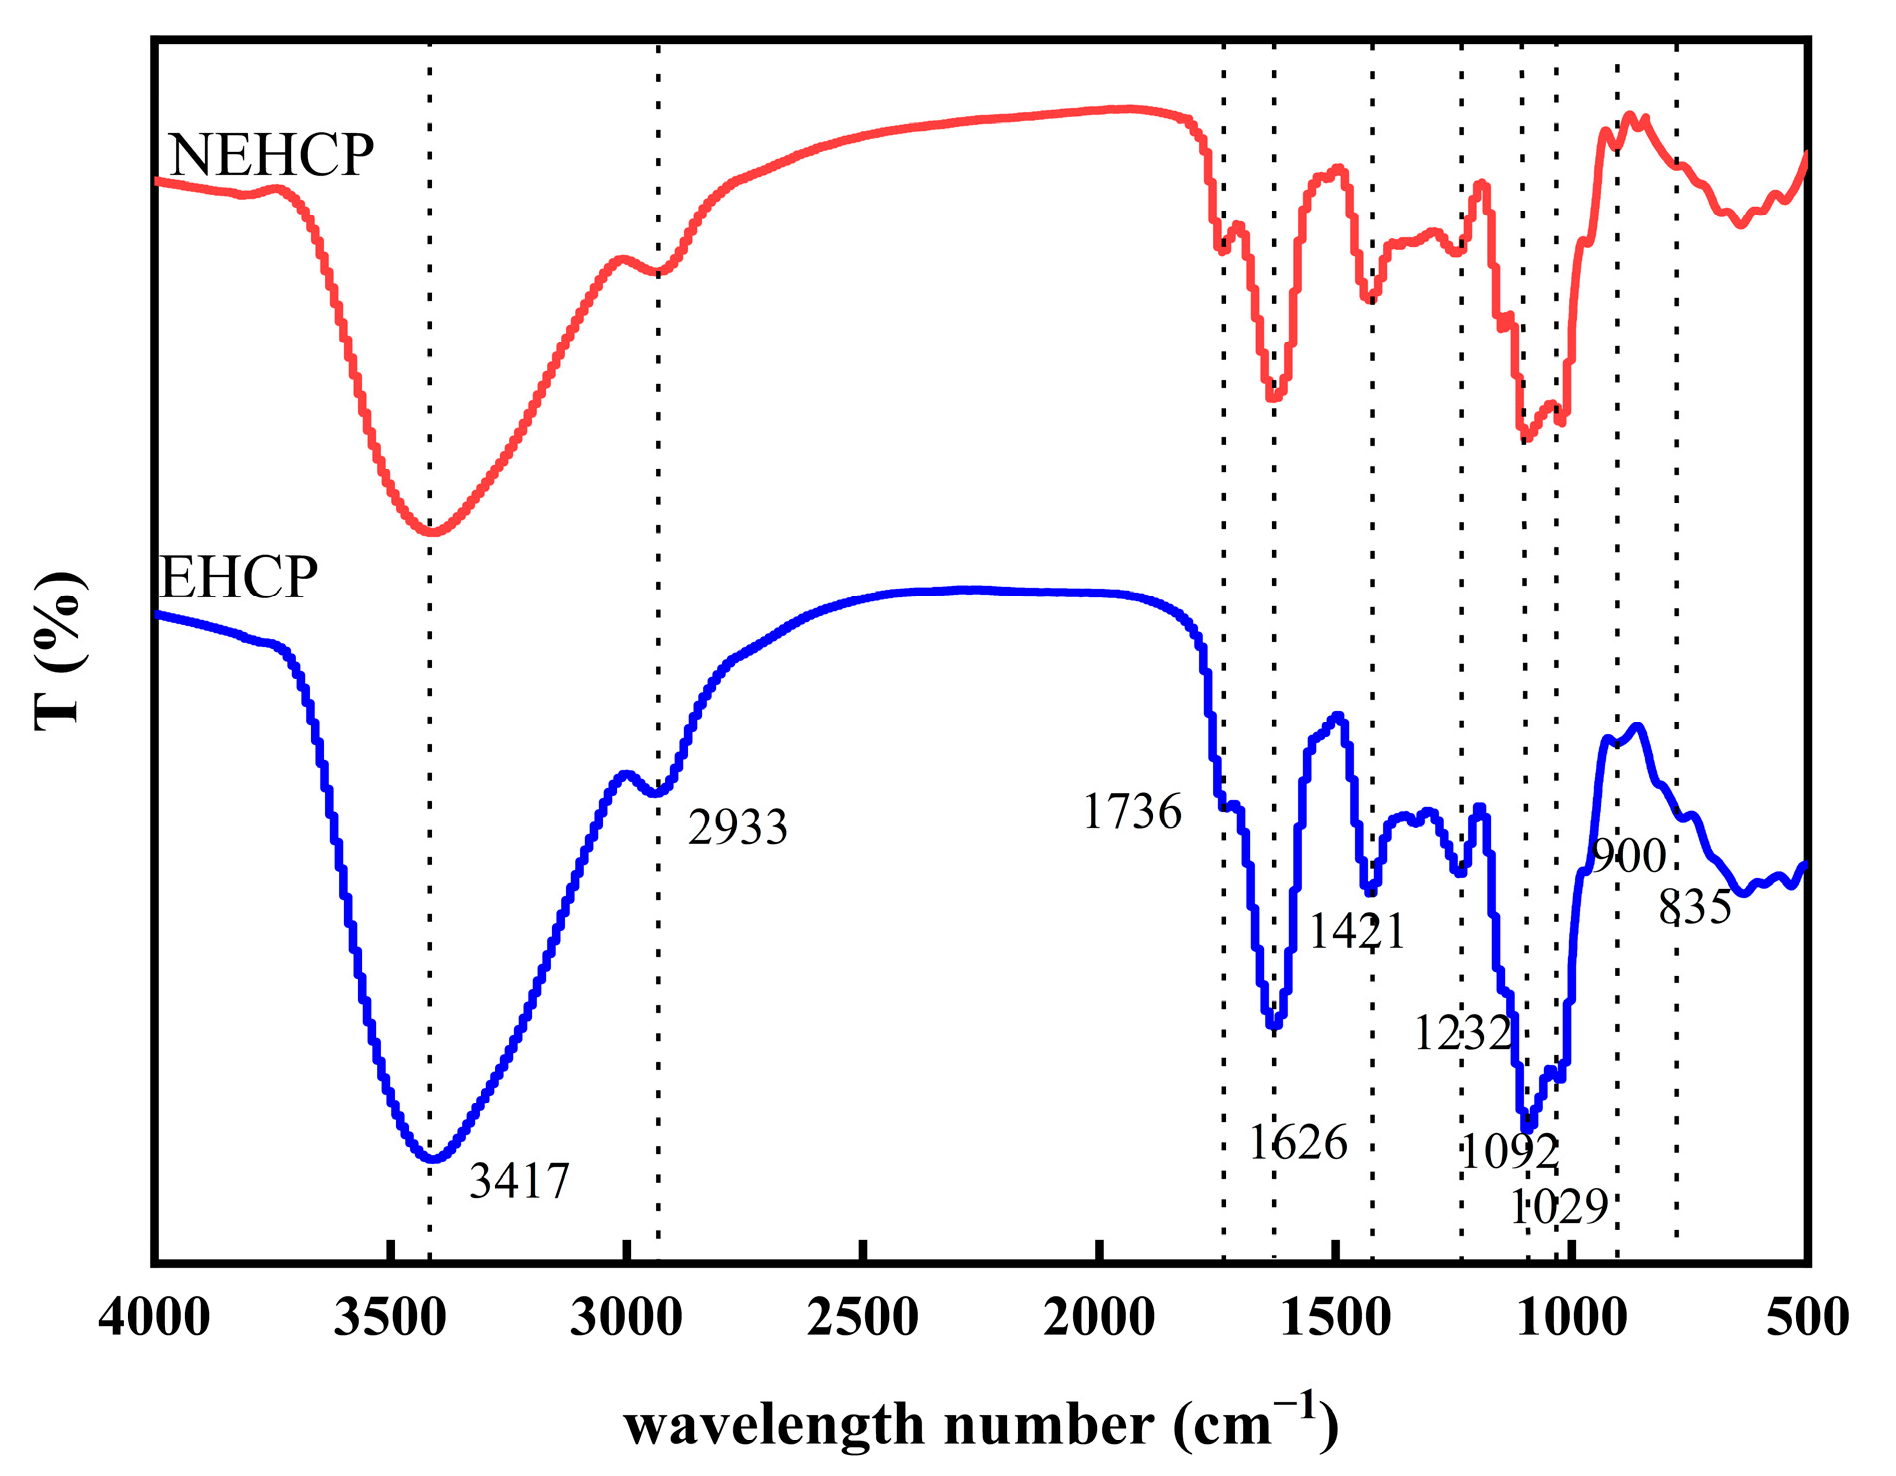
The FT-IR spectra of EHCP and NEHCP are displayed in Figure 6. The spectra of both polysaccharides exhibited largely similar absorption peaks, suggesting that enzymatic modification did not significantly alter the primary structure of HCP. A prominent and broad peak observed at 3417 cm−1, a hallmark of polysaccharides, is attributed to the O–H stretching vibration of the hydroxyl groups [36]. The peaks near 2933 and 1421 cm−1 originate from C–H stretching and bending vibrations, respectively, indicating a saturated carbon–hydrogen framework within the sugar ring and its side chains [37]. A strong peak at 1736 cm−1 corresponds to the C=O stretching vibration of esterified carboxylic acids (–COOR) or unionized carboxylic acids (–COOH), whereas the absorption signal at approximately 1626 cm−1 is attributed to –COO–. These two peaks confirm the polysaccharide structure contains uronic acid [38], aligning with the high GalA content detailed in Table 4. The characteristic absorption peak at approximately 1092 cm−1 is assigned to the C–O–C asymmetric stretching and C–O–H deformation vibrations within the pyranose ring, confirming its presence in the polysaccharide [39]. The peak at 1029 cm−1 is characteristic of the glycosidic linkages within the polysaccharide. Furthermore, vibrations at 835 and 900 cm−1 show the presence of α- and β-glycosidic bonds in both polysaccharides [39].
The FT-IR spectra of both polysaccharide forms demonstrated essentially identical absorption peaks, indicating that enzymatic modification did not significantly alter the primary structure of HCP. Cellulase-degraded Auricularia auricula-judae polysaccharides and their native counterparts share identical characteristic peaks [14], consistent with our findings.

3.4.2. 1H NMR Analysis

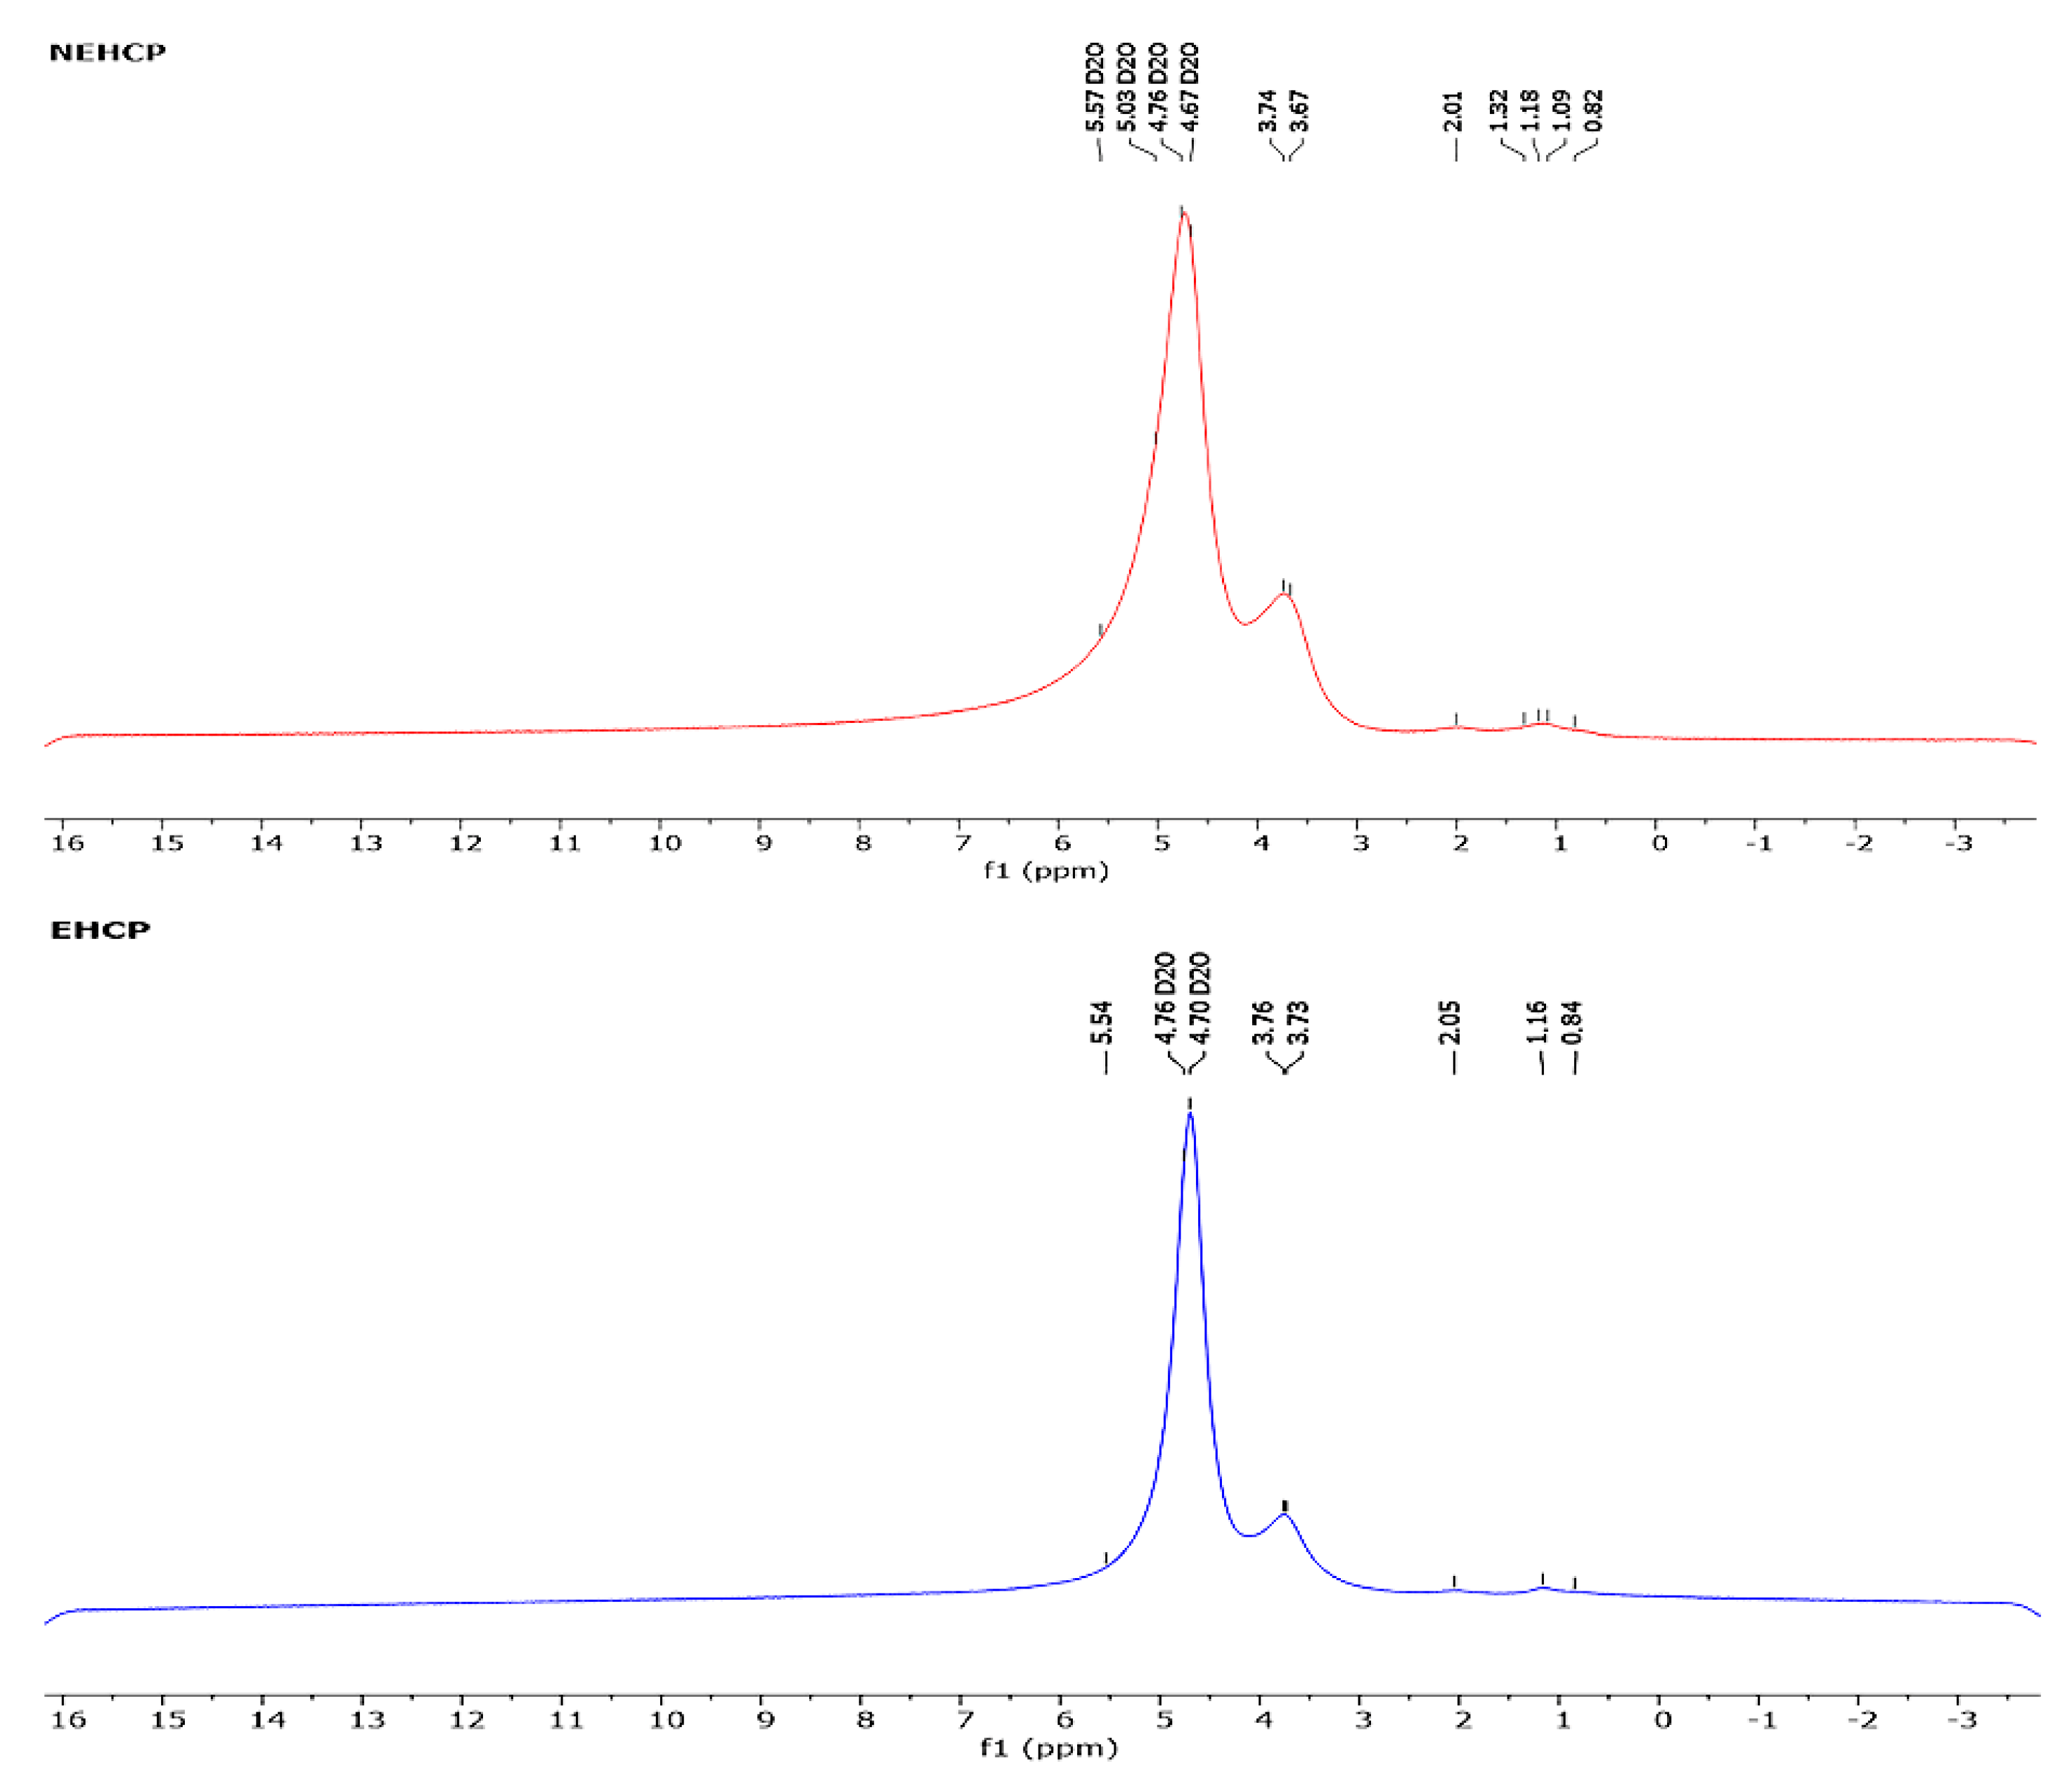
1H NMR spectroscopy is a valuable technique for elucidating the glycosidic bond configurations within polysaccharide molecules. Typically, anomeric proton signals indicative of α-glycosidic linkages appear in the δ 5.0–5.8 ppm range, whereas signals for β-glycosidic linkages are noted between δ 4.3 and 5.0 ppm [14]. The 1H NMR spectra of NEHCP and EHCP, acquired following D2O exchange, exhibited anomeric signals clustered at δ 5.57, 5.03, 4.76, 4.67, and δ 5.54, 4.76, and 4.70 ppm, respectively (Figure 7). This pattern indicates the presence of α- and β-glycosidic linkages in both NEHCP and EHCP, corroborating the findings obtained from FT-IR analysis. Similarly to our findings, Wu et al. [14] reported that native and cellulase-degraded Auricularia auricula-judae polysaccharides preserved α- and β-glycosidic bonds.

3.4.3. Congo Red

Intermolecular hydrogen bonding is significantly involved in stabilizing the helical conformation of polysaccharides, and alterations in the strength of this network can directly affect the secondary structure integrity of polysaccharides [40]. As shown in Figure 8, both EHCP and NEHCP form complexes with Congo red that exhibit a red shift in their maximum absorption wavelengths compared with that of the Congo red solution alone. The maximum absorption wavelengths for the EHCP–Congo red and NEHCP–Congo red complexes were 513 and 508 nm, respectively, indicating the presence of triple-helical structures in both polysaccharides [41]. Although enzymatic degradation may disrupt the triple-helical structures by cleaving glycosidic bonds, its impact on the hydrogen bonding network responsible for stabilizing the helical structure in NEHCP appears to be minimal [42]. Therefore, our results suggest that amylase hydrolysis did not significantly disrupt the triple-helical conformation of NEHCP. This finding aligns with those of Xiong et al. [43], who described that enzymatic hydrolysis had minimal impact on the triple-helical structure of passion fruit peel polysaccharides, corroborating the results of our infrared spectroscopy analysis, which indicated that enzymatic hydrolysis did not considerably alter the fundamental structure of the original polysaccharide (NEHCP).

3.4.4. XRD

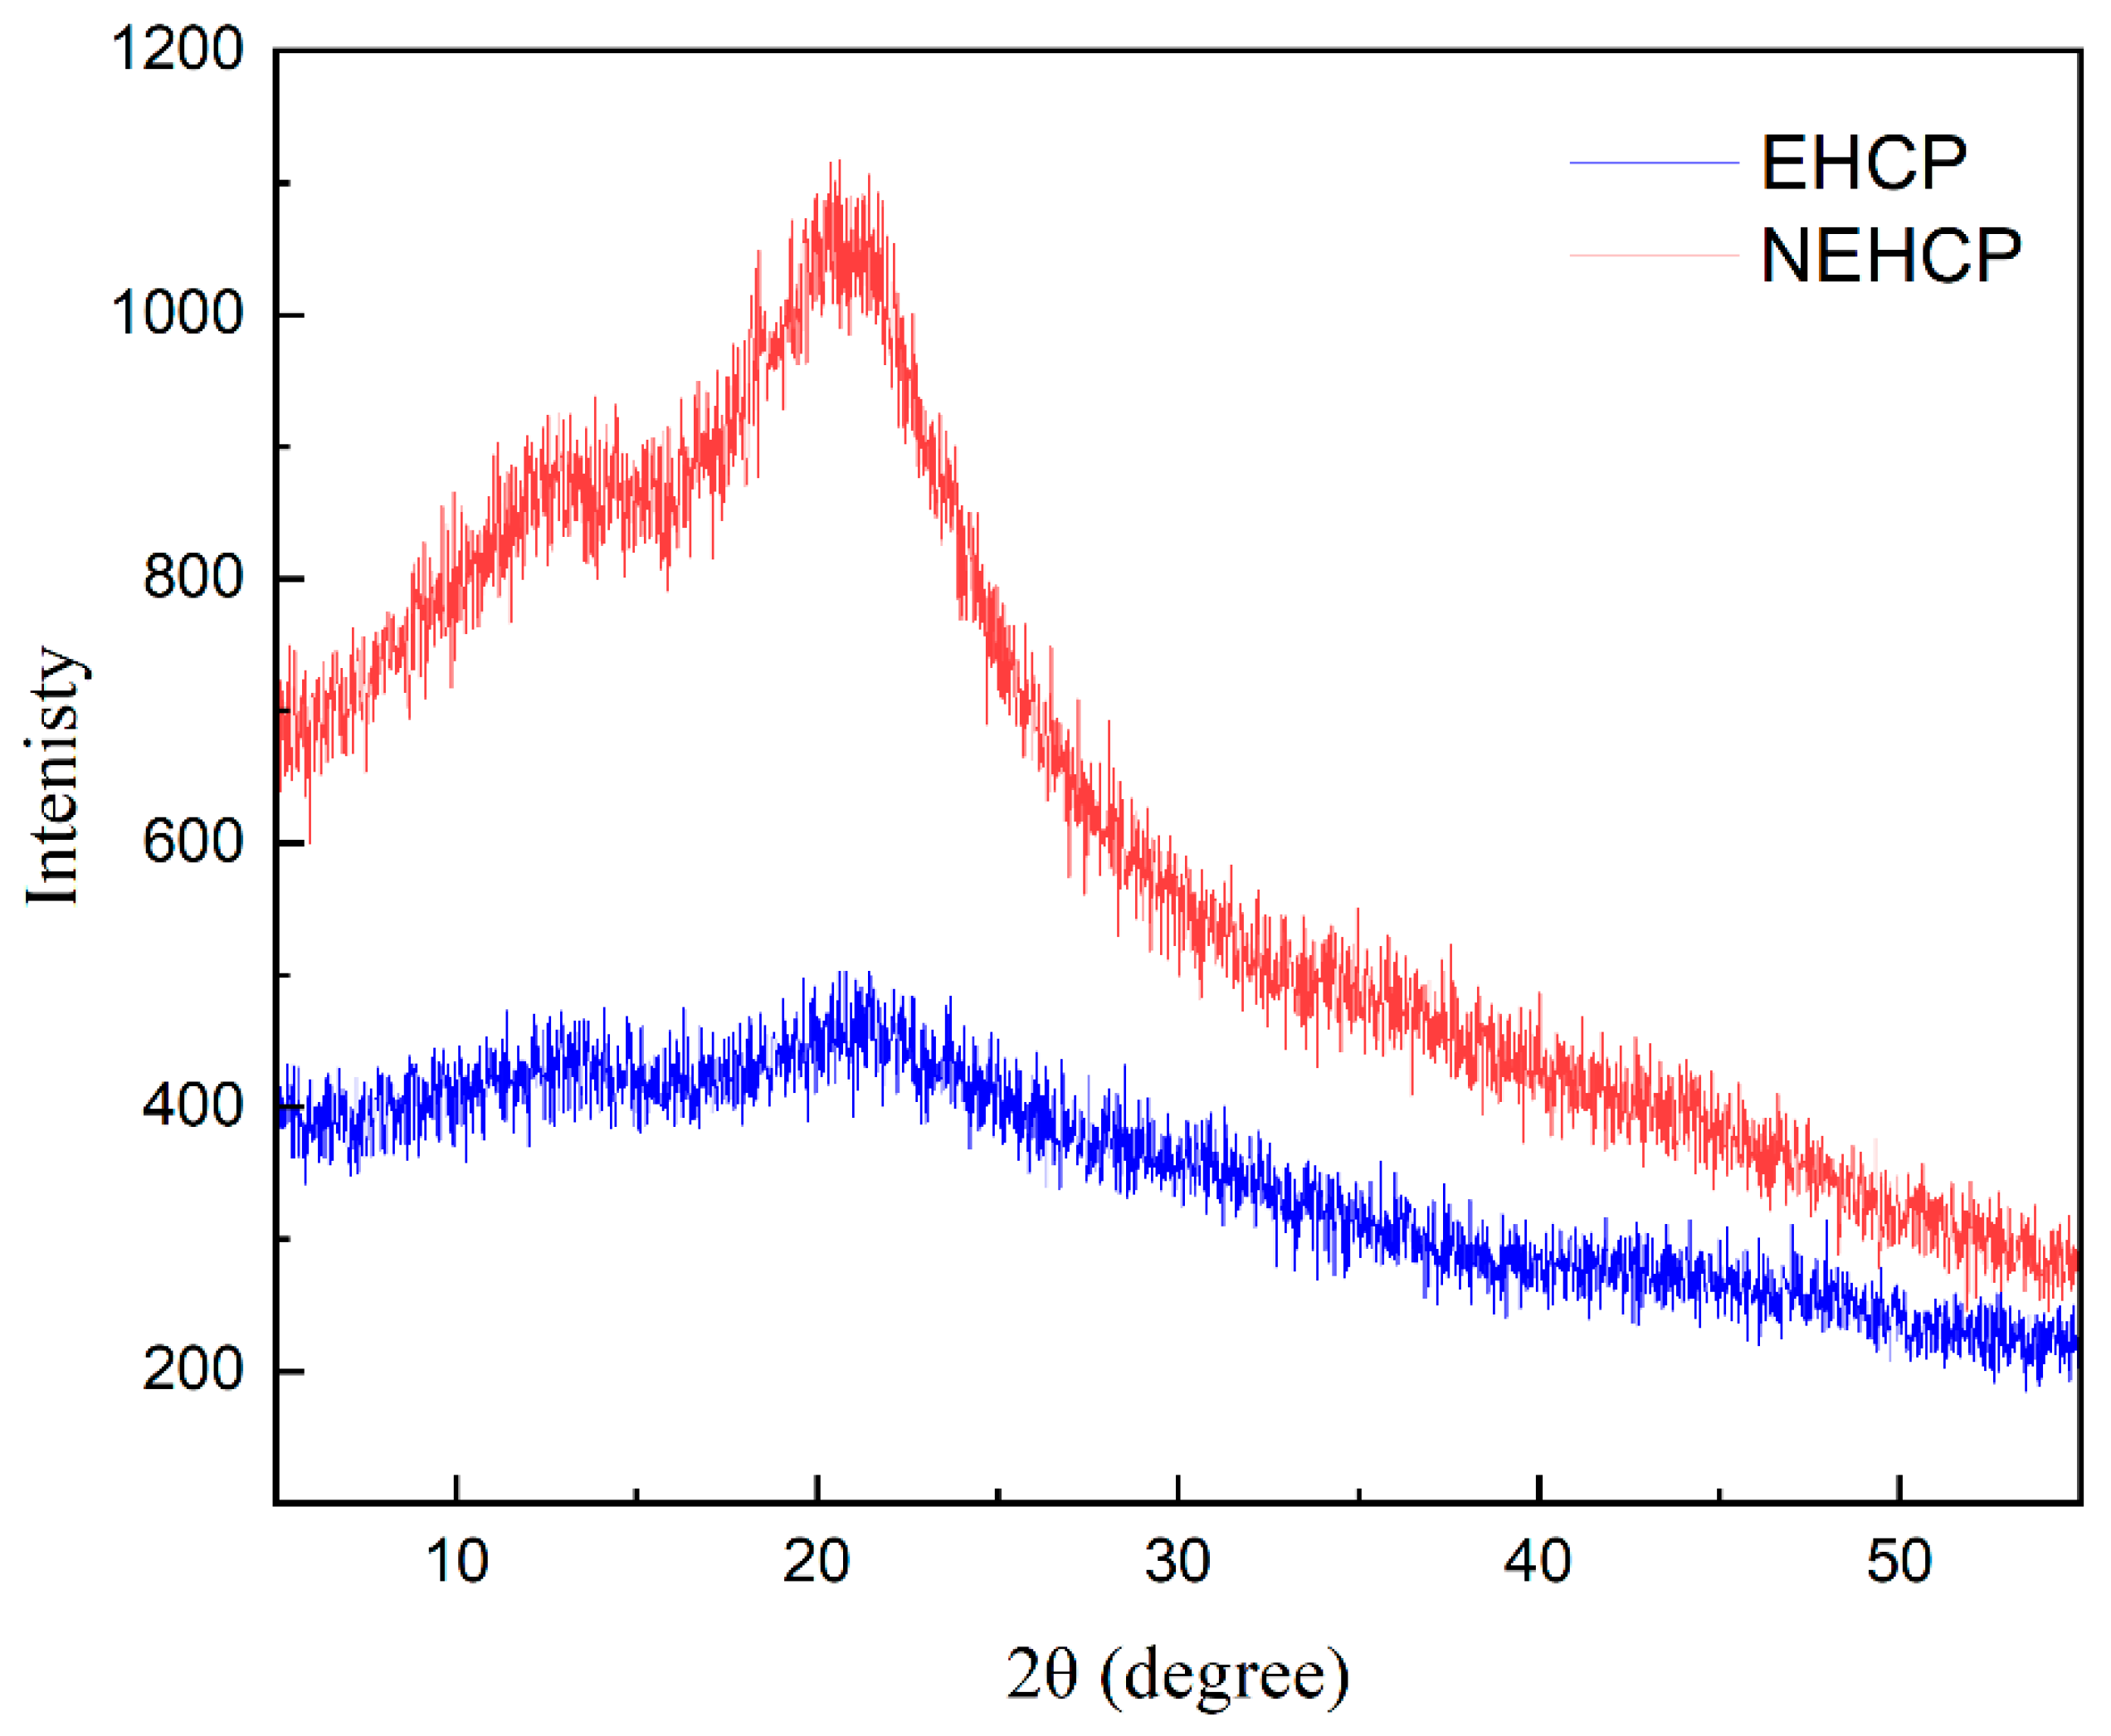
The structure of the substance determines the XRD pattern [44]. The XRD patterns of EHCP and NEHCP (Figure 9) show that both have blunt and broad “envelope” diffraction peaks at 2θ = 12° and 20°, indicating that both are amorphous polymer structures. The intensity of the two peaks weakened following amylase-induced degradation, demonstrating that the crystal structure and orderliness decreased. Moreover, NEHCP has higher diffraction intensity than EHCP, indicating that NEHCP has higher moisture crystallinity. This phenomenon can be attributed to differences in sample preparation methods (drying methods) and the molecular structure itself [45]. Excluding the influence of sample preparation methods, enzymatic hydrolysis affects the polysaccharide structure. Comprehensive analysis results show that the structures of the two polysaccharides primarily exist in an amorphous form, and enzymatic modification reduces HCP crystallinity.

3.4.5. SEM

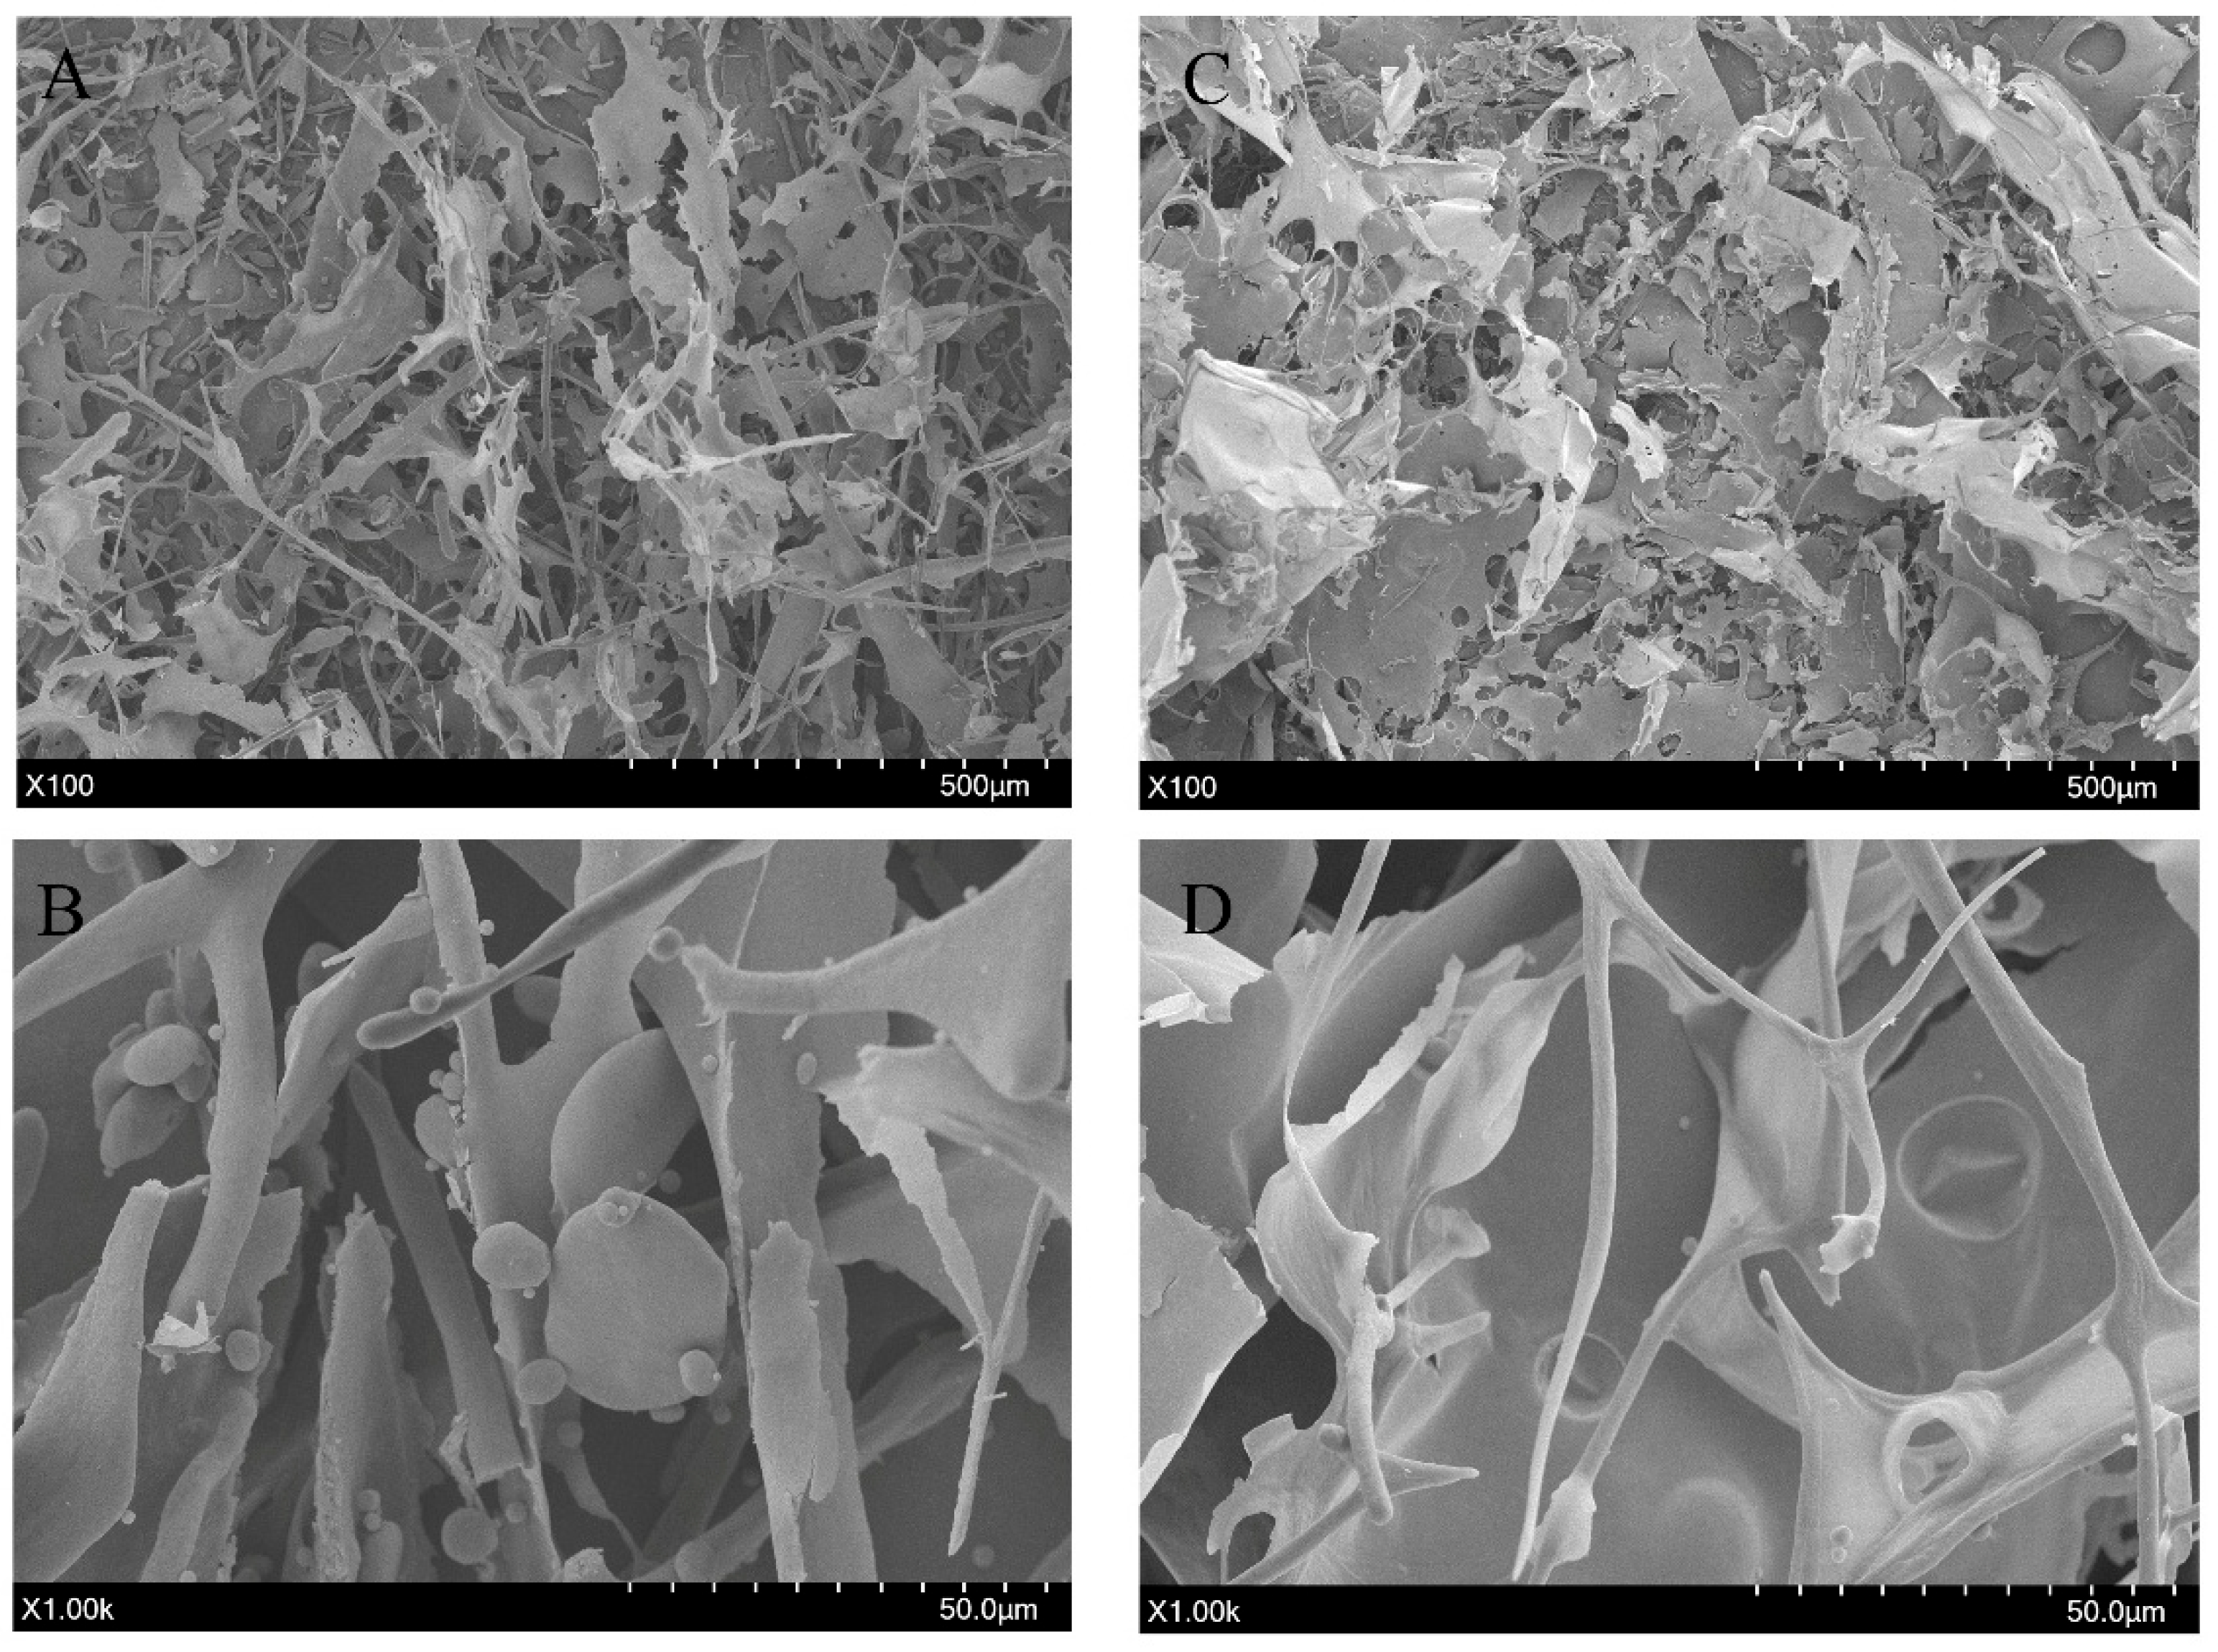
To elucidate the surface morphologies of EHCP and NEHCP, SEM was employed. As depicted in Figure 10, discernible differences in surface architecture are noted between the two polysaccharides. NEHCP exhibited a predominantly smooth and dense rod-like microstructure, characterized by interconnected or aggregated arrangements, with some adherent spherical structures. However, EHCP, post-enzymatic treatment, presented a markedly reduced prevalence of sparse rod-like structures. The interconnected or aggregated formations underwent fragmentation, leading to a looser layered structure punctuated by irregular pore. Furthermore, the spherical structures observed on the surface of the residual rod-like regions were less abundant and diminished in size than those of NEHCP. These findings align with XRD analyses, which indicated a reduction in the ordered structure of the polysaccharide following enzymatic modification. Similarly, Dou et al. [46] revealed that the tightly packed rod-like structure of blackberry fruit polysaccharide underwent degradation during ultrasonic radiation, ultimately fracturing into a layered morphology. This structural transition can be attributed to enzymatic hydrolysis, which cleaves molecular chains, causing decreased molecular weight and polysaccharide chain rigidity. Consequently, short-chain polysaccharides exhibit greater conformational flexibility, hindering the maintenance of the original long-range ordered arrangement (e.g., the rod-like structure of NEHCP), and instead promoting layered aggregate formation through short-range interactions. Collectively, these findings demonstrate that enzymatic modification can significantly disrupt the HCP microstructure, highlighting the efficacy of amylase as an agent for HCP degradation. Furthermore, Chen et al. [47] revealed that polysaccharides with a multi-porous and flaky conformation facilitate greater exposure of active sites. Consequently, the looser flaky microstructure of EHCP may improve its binding efficiency to α-glucosidase, thereby enhancing inhibitory activity.
This study demonstrates EHCP’s bioactivity through in vitro α-glucosidase inhibition assays, although further in vivo validation via animal models and clinical trials is required to confirm these findings. While the focus was on its hypoglycemic effect, exploring other biological activities, such as antioxidant potential, could provide a more comprehensive understanding of EHCP’s bioactivity. Additionally, important practical considerations for their use as functional food ingredients, including safety, stability during processing and storage, and the impact of residual enzymes from hydrolysis, warrant further investigation. Future work will address these aspects to fully assess the potential of EHCP.

4. Conclusions

In this study, using the RSM, the optimal enzymatic hydrolysis conditions for HCP were established as follows: amylase dosage, 15 U/mL; temperature, 60 °C; pH, 6.1; and hydrolysis time, 12 h. Under these conditions, the α-glucosidase inhibition rate of the enzymatic hydrolysate reached 50.92%. GPC analysis revealed that EHCP and NEHCP are homogeneous polysaccharides with molecular weights of 338.7 and 504.6 kDa, respectively. XRD and SEM showed reduced EHCP crystallinity, accompanied by a morphological transformation from a dense rod-like structure of NEHCP to a looser flaky architecture. These findings indicate that enzymatic hydrolysis effectively promotes polysaccharide degradation. EHCP and NEHCP share an identical set of monosaccharide components with slight variations in their molar ratios and contain pyranose rings, α- and β-glycosidic linkages, and triple helix conformations. Furthermore, HCP solubility improved following enzymatic treatment. Notably, compared with NEHCP, EHCP demonstrated significantly enhanced α-glucosidase inhibitory activity. At 6 mg/mL, the α-glucosidase inhibition rates for EHCP, NEHCP, and acarbose were 77.32%, 52.92%, and 72.56%, respectively. These findings indicate that enzymatic hydrolysis is an environmentally friendly and effective strategy to polysaccharide degradation that can significantly improve the α-glucosidase inhibitory activity of HCP. Its efficacy, however, requires further validation in vivo.

Author Contributions

Conceptualization, L.Z. and X.X.; Methodology, L.Z.; Software, L.Z.; Validation, X.X.; Formal analysis, L.Z.; Investigation, L.Z.; Data curation, L.Z. and T.W.; Writing—original draft, L.Z.; Writing—review & editing, L.Z., Z.Y., Y.Y., M.M., T.W., S.P. and X.X.; Visualization, L.Z.; Supervision, X.X.; Project administration, X.X.; Funding acquisition, X.X. All authors have read and agreed to the published version of the manuscript.

Funding

This work was supported by the Key Research and Development Program of Hubei Province “Green Manufacturing Technologies for Plant-Derived Functional Food Ingredients” (2024BBB029), the Innovation Team Project of Hubei Province “Agricultural Products Processing and Comprehensive Utilization” Team (2024-620-000-001-027), Hubei Provincial Key R&D Program: “Research on Key Technologies for Sustainable Processing of Plant-Based Flavor-Functional Food Ingredients” (2024BBB028) and National Key Research and Development Program of China: “Development and Application Demonstration of Key Technologies for Sustainable Processing and High-Value Utilization of Seed Oil and Seed Protein-Based Ingredients” (2022YFD2100804-3).

Data Availability Statement

The original contributions presented in this study are included in the article. Further inquiries can be directed to the corresponding author.

Conflicts of Interest

The authors declare no conflict of interest.

Abbreviations

The following abbreviations are used in this manuscript:
HCPHouttuynia cordata polysaccharide
EHCPEnzymatic Hydrolysates of Houttuynia cordata Polysaccharides
NEHCPNon-enzymatically treated Houttuynia cordata polysaccharides

References

  1. Xue, H.; Hao, Z.; Gao, Y.; Cai, X.; Tang, J.; Liao, X.; Tan, J. Research progress on the hypoglycemic activity and mechanisms of natural polysaccharides. Int. J. Biol. Macromol. 2023, 252, 126199. [Google Scholar] [CrossRef]
  2. Ma, W.; Xiao, L.; Liu, H.; Hao, X. Hypoglycemic natural products with in vivo activities and their mechanisms: A review. Food Sci. Hum. Wellness 2022, 11, 1087–1100. [Google Scholar] [CrossRef]
  3. Ji, X.; Guo, J.; Cao, T.; Zhang, T.; Liu, Y.; Yan, Y. Review on mechanisms and structure-activity relationship of hypoglycemic effects of polysaccharides from natural resources. Food Sci. Hum. Wellness 2023, 12, 1969–1980. [Google Scholar] [CrossRef]
  4. Golovinskaia, O.; Wang, C.-K. The hypoglycemic potential of phenolics from functional foods and their mechanisms. Food Sci. Hum. Wellness 2023, 12, 986–1007. [Google Scholar] [CrossRef]
  5. Fu, X.; Yang, H.; Ma, C.; Li, X.; Li, D.; Yang, Y.; Xu, Y.; Wang, L. Characterization and inhibitory activities on α-amylase and α-glucosidase of the polysaccharide from blue honeysuckle berries. Int. J. Biol. Macromol. 2020, 163, 414–422. [Google Scholar] [CrossRef]
  6. Li, J.-J.; Chen, G.-D.; Fan, H.-X.; Hu, D.; Zhou, Z.-Q.; Lan, K.-H.; Zhang, H.-P.; Maeda, H.; Yao, X.-S.; Gao, H. Houttuynoid M, an Anti-HSV Active Houttuynoid from Houttuynia cordata Featuring a Bis-houttuynin Chain Tethered to a Flavonoid Core. J. Nat. Prod. 2017, 80, 3010–3013. [Google Scholar] [CrossRef]
  7. Liu, J.; Zou, J.; Wang, J.; Wang, R.; Zhai, S.; Chang, X.; Zhang, X.; Sun, J.; Luan, F.; Shi, Y. Extraction, purification, structural features, and pharmacological properties of polysaccharides from Houttuynia cordata: A review. Int. J. Biol. Macromol. 2024, 279, 135230. [Google Scholar] [CrossRef]
  8. Wei, P.; Luo, Q.; Hou, Y.; Zhao, F.; Li, F.; Meng, Q. Houttuynia Cordata Thunb.: A comprehensive review of traditional applications, phytochemistry, pharmacology and safety. Phytomedicine 2024, 123, 155195. [Google Scholar] [CrossRef] [PubMed]
  9. He, M.; Dong, Z.; Zhang, L.; Wu, T.; Pan, S.; Xu, X. Structure characterization and biological activity of polysaccharides from different parts of Houttuynia cordata Thunb. J. Chin. Inst. Food Sci. Technol. 2024, 24, 276–286. [Google Scholar]
  10. Liu, X.; Tian, J.; Pan, Y.; Li, Z.; Zhou, Z.; Pan, Z.; Tai, H.; Xing, Y. Structural Characterization and Biological Activity of Polysaccharides from Stems of Houttuynia cordata. Foods 2022, 11, 3622. [Google Scholar] [CrossRef] [PubMed]
  11. Ling, N.; Tian, H.; Wang, Q.; Gao, M.; Xu, G.; Sun, Y.; Song, D.; Li, W.; Ji, C. Advance in Hippophae rhamnoides polysaccharides: Extraction, structural characteristics, pharmacological activity, structure-activity relationship and application. Int. J. Biol. Macromol. 2024, 270, 132420. [Google Scholar] [CrossRef]
  12. Jia, Y.; Lu, Y.; Wang, Y.; Zhang, M.; He, C.; Chen, H. Spheroidization of ultrasonic degraded corn silk polysaccharide to enhance bioactivity by the anti-solvent precipitation method. J. Sci. Food Agric. 2022, 102, 53–61. [Google Scholar] [CrossRef]
  13. Ma, F.; Wang, D.; Zhang, Y.; Li, M.; Qing, W.; Tikkanen-Kaukanen, C.; Liu, X.; Bell, A.E. Characterisation of the mucilage polysaccharides from Dioscorea opposita Thunb. with enzymatic hydrolysis. Food Chem. 2018, 245, 13–21. [Google Scholar] [CrossRef]
  14. Wu, Q.; Qin, D.; Cao, H.; Bai, Y. Enzymatic hydrolysis of polysaccharide from Auricularia auricula and characterization of the degradation product. Int. J. Biol. Macromol. 2020, 162, 127–135. [Google Scholar] [CrossRef]
  15. Xu, Y.; Shen, M.; Chen, Y.; Lou, Y.; Luo, R.; Chen, J.; Zhang, Y.; Li, J.; Wang, W. Optimization of the polysaccharide hydrolysate from Auricularia auricula with antioxidant activity by response surface methodology. Int. J. Biol. Macromol. 2018, 113, 543–549. [Google Scholar] [CrossRef]
  16. Hu, T.-G.; Zou, Y.-X.; Li, E.-N.; Liao, S.-T.; Wu, H.; Wen, P. Effects of enzymatic hydrolysis on the structural, rheological, and functional properties of mulberry leaf polysaccharide. Food Chem. 2021, 355, 129608. [Google Scholar] [CrossRef]
  17. He, M.; Tang, S.; Xu, T.; Yuan, Y.; Wu, T.; Pan, S.; Xu, X. Acetylation of the polysaccharide from Houttuynia cordata rhizome and their α-glucosidase inhibition mechanism. J. Food Sci. 2024, 89, 2672–2683. [Google Scholar] [CrossRef]
  18. DuBois, M.; Gilles, K.A.; Hamilton, J.K.; Rebers, P.A.; Smith, F. Colorimetric Method for Determination of Sugars and Related Substances. Anal. Chem. 1956, 28, 350–356. [Google Scholar] [CrossRef]
  19. Filisetti-Cozzi, T.M.C.C.; Carpita, N.C. Measurement of uronic acids without interference from neutral sugars. Anal. Biochem. 1991, 197, 157–162. [Google Scholar] [CrossRef] [PubMed]
  20. van Wilgenburg, M.G.M.; Werkman, E.M.A.; van Gorkom, W.H.; Soons, J.B.J. Criticism of the Use of Coomassie Brilliant Blue G-250 for the Quantitative Determination of Proteins. Cclm 1981, 19, 301–304. [Google Scholar] [CrossRef] [PubMed]
  21. Yu, X.-H.; Liu, Y.; Wu, X.-L.; Liu, L.-Z.; Fu, W.; Song, D.-D. Isolation, purification, characterization and immunostimulatory activity of polysaccharides derived from American ginseng. Carbohydr. Polym. 2017, 156, 9–18. [Google Scholar] [CrossRef]
  22. Yang, N.; Li, Y.; Xing, F.; Wang, X.; Li, X.; Li, L.; Yang, J.; Wang, Y.; Zhang, M. Composition and structural characterization of pectin in micropropagated and conventional plants of Premma puberula Pamp. Carbohydr. Polym. 2021, 260, 117711. [Google Scholar] [CrossRef]
  23. Zheng, Q.; Jia, R.-B.; Ou, Z.-R.; Li, Z.-R.; Zhao, M.; Luo, D.; Lin, L. Comparative study on the structural characterization and α-glucosidase inhibitory activity of polysaccharide fractions extracted from Sargassum fusiforme at different pH conditions. Int. J. Biol. Macromol. 2022, 194, 602–610. [Google Scholar] [CrossRef]
  24. Liu, J.; Wang, Y.; Wang, B.; Zhang, W.; Ren, X.; Zhang, Y.; Jiang, L.; Dong, C.; Zhao, G. Optimization of Black Garlic Protein Extraction Process and Exploration of Its Properties and Functions with Enzymatic Hydrolysis Products. Molecules 2025, 30, 125. [Google Scholar] [CrossRef]
  25. Acosta, O.; Víquez, F.; Cubero, E. Optimisation of low calorie mixed fruit jelly by response surface methodology. Food Qual. Prefer. 2008, 19, 79–85. [Google Scholar] [CrossRef]
  26. Liang, J.; Zhao, Y.; Yang, F.; Zheng, L.; Ma, Y.; Liu, Q.; Cai, L.; Gong, W.; Wang, B. Preparation and structure-activity relationship of highly active black garlic polysaccharides. Int. J. Biol. Macromol. 2022, 220, 601–612. [Google Scholar] [CrossRef]
  27. Peng, X.; Zhang, G.; Liao, Y.; Gong, D. Inhibitory kinetics and mechanism of kaempferol on α-glucosidase. Food Chem. 2016, 190, 207–215. [Google Scholar] [CrossRef] [PubMed]
  28. Ji, Y.-H.; Liao, A.-M.; Huang, J.-H.; Thakur, K.; Li, X.-L.; Wei, Z.-J. Physicochemical and antioxidant potential of polysaccharides sequentially extracted from Amana edulis. Int. J. Biol. Macromol. 2019, 131, 453–460. [Google Scholar] [CrossRef] [PubMed]
  29. Hu, Y.; Zhou, D.; Zeng, Q.; He, J.; Zhao, M.; Tang, Y. Optimization of enzymatic hydrolysis process, structural characterization and antioxidant activity analysis of Gastrodia elata polysaccharide. Sci. Technol. Food Ind. 2025, 46, 205–214. [Google Scholar]
  30. Xi, L.; Weibing, X.; Shuyong, F.; Sheng-Hua, L.; Xiong, F.; Chin-Ping, T.; Ping-Ping, W.; Zu-Man, D.; Chun, C. The effect of the molecular weight of blackberry polysaccharides on gut microbiota modulation and hypoglycemic effect in vivo. Food Funct. 2024, 15, 8586–8603. [Google Scholar] [CrossRef] [PubMed]
  31. Lin, S.; Al-Wraikat, M.; Niu, L.; Zhou, F.; Zhang, Y.; Wang, M.; Ren, J.; Fan, J.; Zhang, B.; Wang, L. Degradation enhances the anticoagulant and antiplatelet activities of polysaccharides from Lycium barbarum L. leaves. Int. J. Biol. Macromol. 2019, 133, 674–682. [Google Scholar] [CrossRef]
  32. Cheng, B.-H.; Chan, J.Y.-W.; Chan, B.C.-L.; Lin, H.-Q.; Han, X.-Q.; Zhou, X.; Wan, D.C.-C.; Wang, Y.-F.; Leung, P.-C.; Fung, K.-P.; et al. Structural characterization and immunomodulatory effect of a polysaccharide HCP-2 from Houttuynia cordata. Carbohydr. Polym. 2014, 103, 244–249. [Google Scholar] [CrossRef]
  33. Gong, P.; Guo, Y.; Chen, X.; Cui, D.; Wang, M.; Yang, W.; Chen, F. Structural Characteristics, Antioxidant and Hypoglycemic Activities of Polysaccharide from Siraitia grosvenorii. Molecules 2022, 27, 4192. [Google Scholar] [CrossRef]
  34. Zhong, Q.-W.; Zhou, T.-S.; Qiu, W.-H.; Wang, Y.-K.; Xu, Q.-L.; Ke, S.-Z.; Wang, S.-J.; Jin, W.-H.; Chen, J.-W.; Zhang, H.-W.; et al. Characterization and hypoglycemic effects of sulfated polysaccharides derived from brown seaweed Undaria pinnatifida. Food Chem. 2021, 341, 128148. [Google Scholar] [CrossRef]
  35. Jia, X.; Hu, J.; He, M.; Zhang, Q.; Li, P.; Wan, J.; He, C. α-Glucosidase inhibitory activity and structural characterization of polysaccharide fraction from Rhynchosia minima root. J. Funct. Foods 2017, 28, 76–82. [Google Scholar] [CrossRef]
  36. Bu, Y.; Yin, B.; Qiu, Z.; Li, L.; Zhang, B.; Zheng, Z.; Li, M. Structural characterization and antioxidant activities of polysaccharides extracted from Polygonati rhizoma pomace. Food Chem. X 2024, 23, 101778. [Google Scholar] [CrossRef]
  37. Wu, J.; Wang, X.; He, Y.; Li, J.; Ma, K.; Zhang, Y.; Li, H.; Yin, C.; Zhang, Y. Stability evaluation of gardenia yellow pigment in presence of different phenolic compounds. Food Chem. 2022, 373, 131441. [Google Scholar] [CrossRef]
  38. Li, Y.; Duan, X.; Wang, Y.; Deng, Y.; Zhang, J. Structural characterization and in vitro hepatoprotective activity of an acidic polysaccharide from Dendrobium nobile Lindl. flower. Int. J. Biol. Macromol. 2025, 284, 138100. [Google Scholar] [CrossRef] [PubMed]
  39. Zou, M.; Hu, X.; Wang, Y.; Wang, J.; Tang, F.; Liu, Y. Structural characterization and anti-inflammatory activity of a pectin polysaccharide HBHP-3 from Houttuynia cordata. Int. J. Biol. Macromol. 2022, 210, 161–171. [Google Scholar] [CrossRef] [PubMed]
  40. Gong, P.-X.; Wu, Y.-C.; Liu, Y.; Lv, S.-Z.; You, Y.; Zhou, Z.-L.; Chen, X.; Li, H.-J. Structure and hypoglycemic effect of a neutral polysaccharide isolated from sea cucumber Stichopus japonicus. Int. J. Biol. Macromol. 2022, 216, 14–23. [Google Scholar] [CrossRef] [PubMed]
  41. Tan, X.; Chen, P.; Xiao, L.; Gong, Z.; Qin, X.; Nie, J.; Zhu, H.; Zhong, S. Extraction, purification, structural characterization, and anti-inflammatory activity of a polysaccharide from Lespedeza formosa. Int. J. Biol. Macromol. 2025, 300, 140154. [Google Scholar] [CrossRef] [PubMed]
  42. Zhang, Y.; Xu, X.; Zhang, L. Dynamic viscoelastic behavior of triple helical Lentinan in water: Effect of temperature. Carbohydr. Polym. 2008, 73, 26–34. [Google Scholar] [CrossRef]
  43. Xiong, F.; Li, X.; Zheng, L.; Hu, N.; Cui, M.; Li, H. Characterization and antioxidant activities of polysaccharides from Passiflora edulis Sims peel under different degradation methods. Carbohydr. Polym. 2019, 218, 46–52. [Google Scholar] [CrossRef]
  44. Qian, J.-Y.; Chen, W.; Zhang, W.-M.; Zhang, H. Adulteration identification of some fungal polysaccharides with SEM, XRD, IR and optical rotation: A primary approach. Carbohydr. Polym. 2009, 78, 620–625. [Google Scholar] [CrossRef]
  45. Nuerxiati, R.; Wei, L.; Mutailifu, P.; Abuduwaili, A.; Paierhati, P.; Lei, C.; Zhiyan, Y.; Yufan, W.; Yili, A. The structural characteristic of acidic-degraded polysaccharides from seeds of Plantago ovata Forssk and its biological activity. Int. J. Biol. Macromol. 2024, 262, 129494. [Google Scholar] [CrossRef]
  46. Dou, Z.; Chen, C.; Fu, X. The effect of ultrasound irradiation on the physicochemical properties and α-glucosidase inhibitory effect of blackberry fruit polysaccharide. Food Hydrocoll. 2019, 96, 568–576. [Google Scholar] [CrossRef]
  47. Chen, N.; Jiang, T.; Xu, J.; Xi, W.; Shang, E.; Xiao, P.; Duan, J.-A. The relationship between polysaccharide structure and its antioxidant activity needs to be systematically elucidated. Int. J. Biol. Macromol. 2024, 270, 132391. [Google Scholar] [CrossRef] [PubMed]
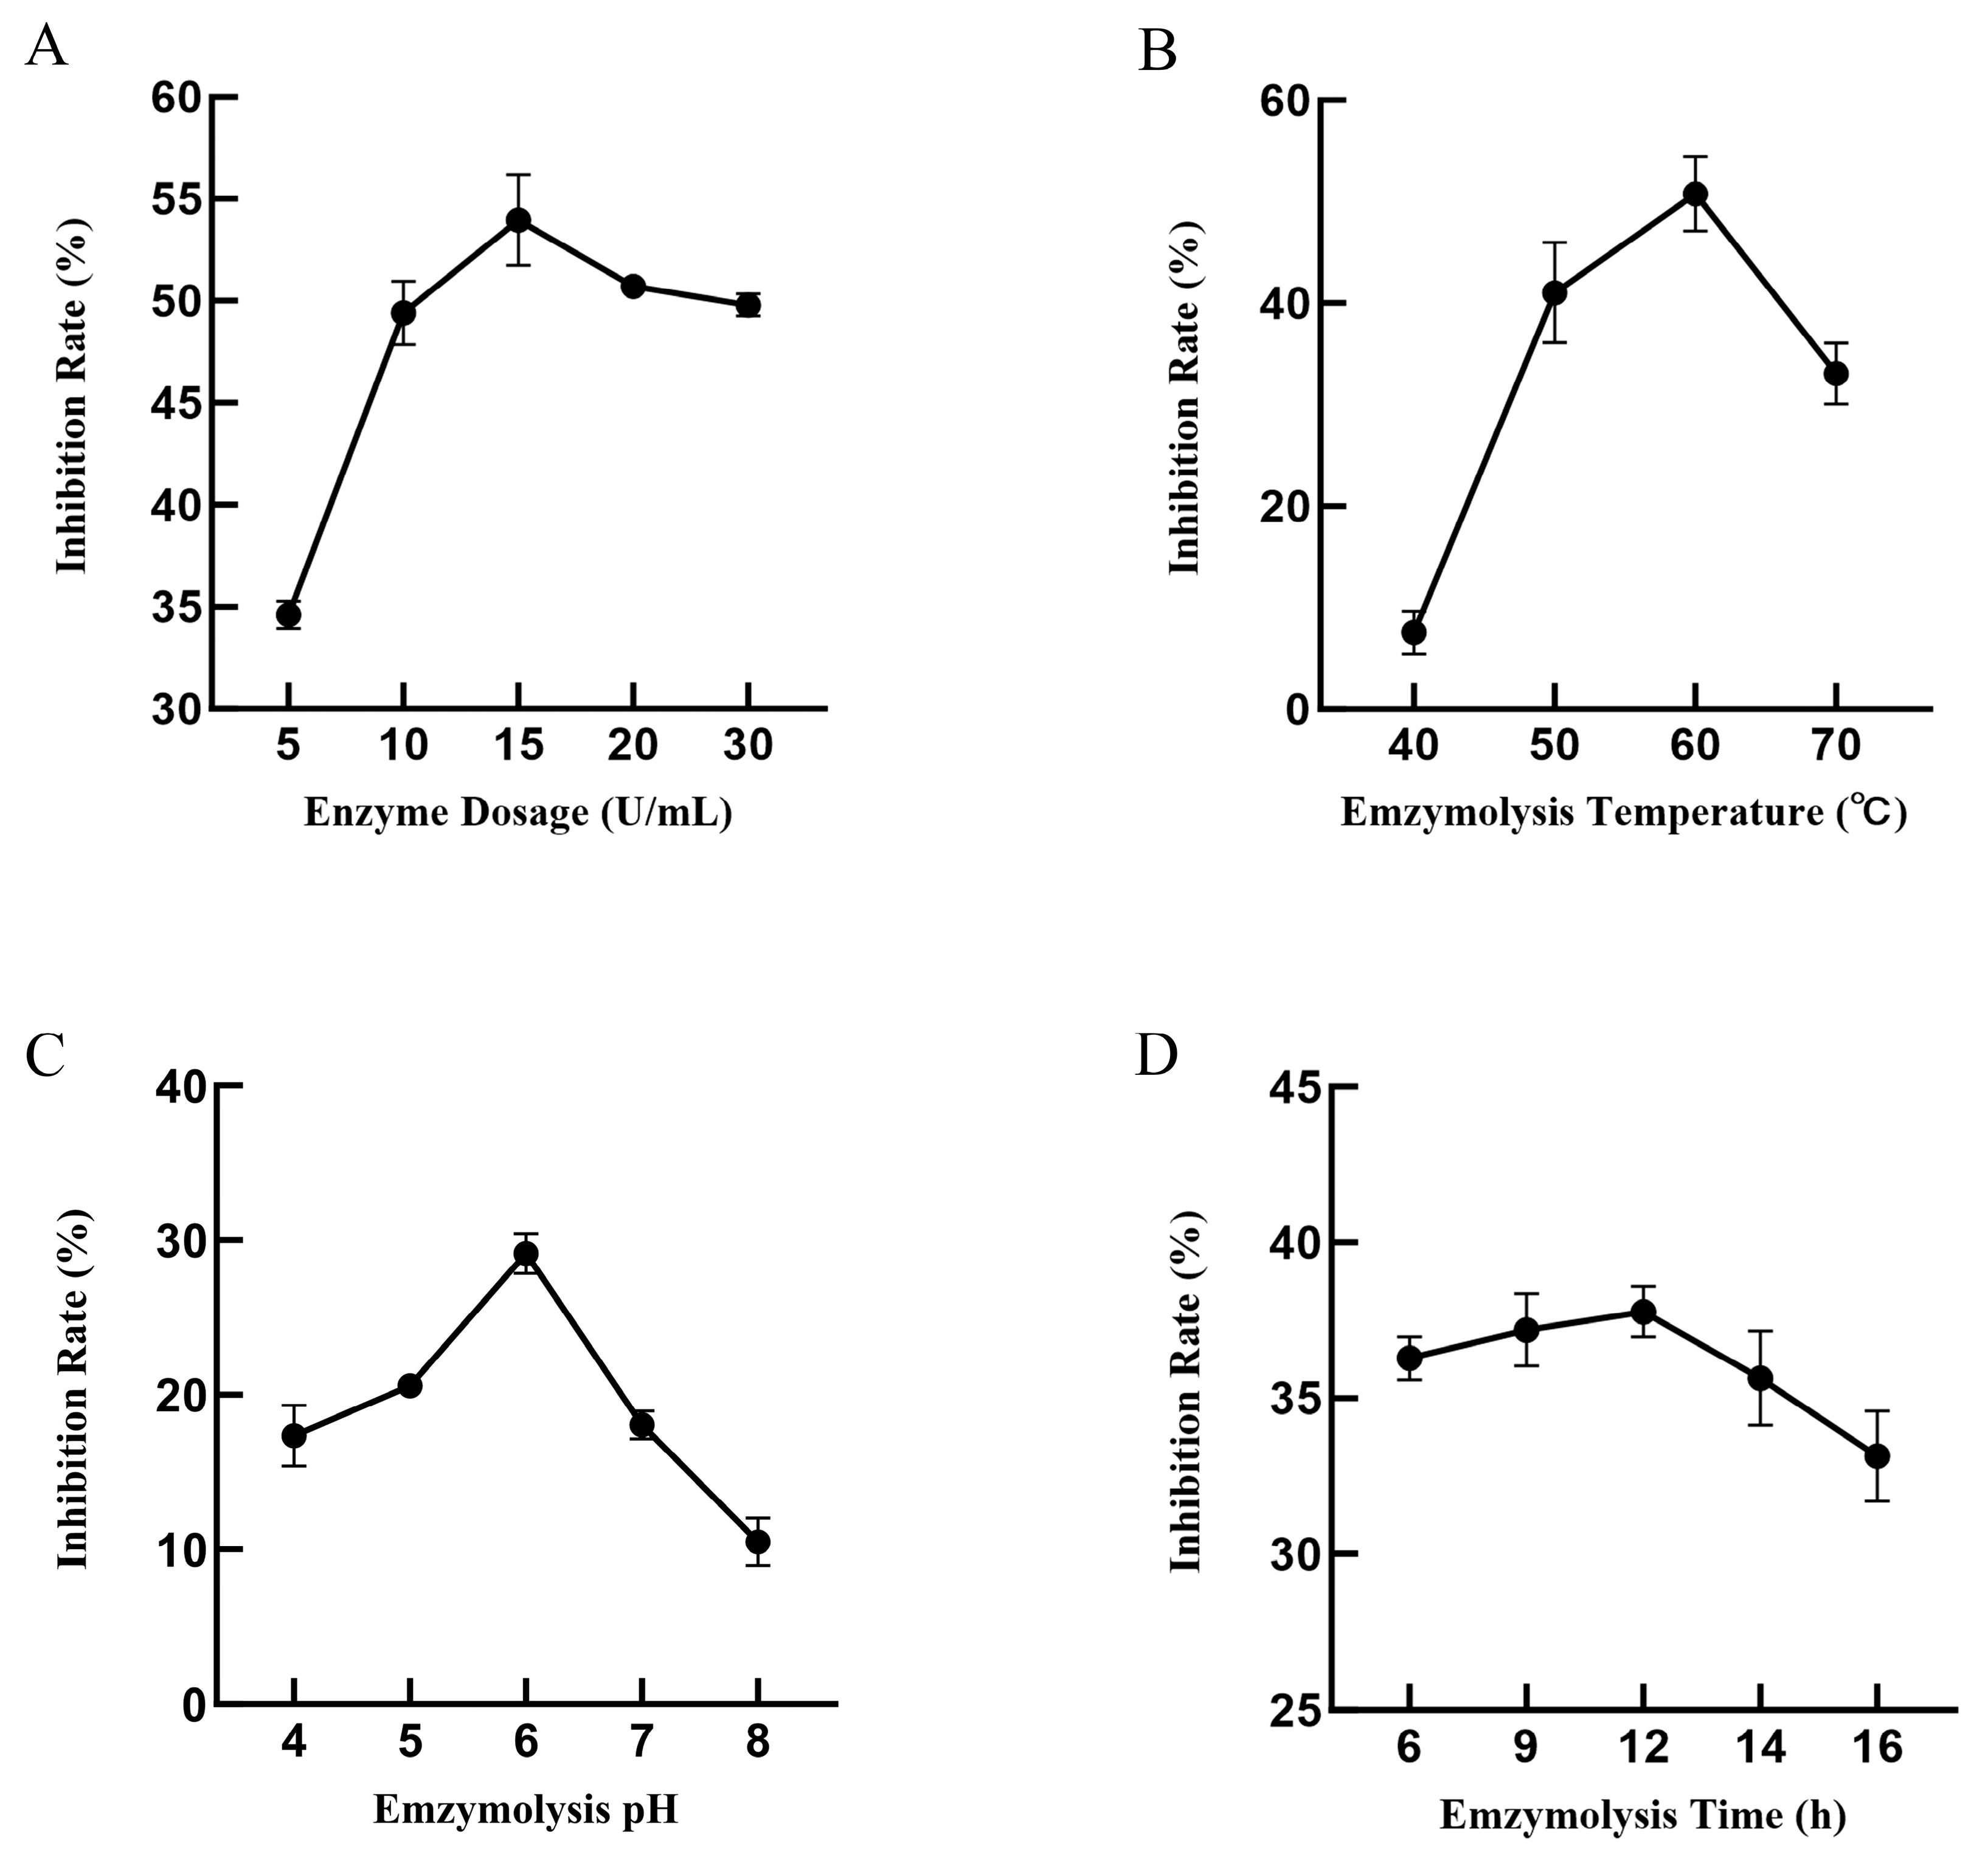
Figure 1. Effects of enzymatic hydrolysis parameters (Enzyme dosage (A), Temperature (B), pH (C), Time (D)) on α-glucosidase inhibitory activity in HCP hydrolysate. Fixed parameters: 20 U/mL enzyme dosage, 12 h hydrolysis time, pH 6.0, and 50 °C.
Applsci 15 11057 g001
Figure 2. Results of RSM, (A): enzymolysis temperature and enzymolysis pH on α-glucosidase inhibitory rate, (B): enzymolysis dosage and enzymolysis pH on α-glucosidase inhibitory rate, (C): enzymolysis dosage and enzymolysis temperature on α-glucosidase inhibitory rate.
Applsci 15 11057 g002
Figure 3. α-glucosidase inhibitory activity of EHCP and NEHCP.
Applsci 15 11057 g003
Figure 4. Inhibition type of EHCP(A) and NEHCP (B) to α-glucosidase.
Applsci 15 11057 g004
Figure 5. GPC spectra of EHCP and NEHCP.
Applsci 15 11057 g005
Figure 6. FT-IR spectra of EHCP and NEHCP.
Applsci 15 11057 g006
Figure 7. 1H NMR spectra of EHCP and NEHCP.
Applsci 15 11057 g007
Figure 8. Maximum absorption wavelength of Congo red-polysaccharide complexes.
Applsci 15 11057 g008
Figure 9. XRD spectrum of EHCP and NEHCP.
Applsci 15 11057 g009
Figure 10. Scanning electron micrographs of NEHCP (100× (A), 10,000× (B)) and EHCP (100× (C), 1000× (D)).
Applsci 15 11057 g010
Table 1. Factor level table.
LevelsIndependent Variables
A Enzymolysis pHB Enzymolysis Temperature (°C)C Enzyme Dosage (U/mL)
−155010
066015
177020
Table 2. Response surface optimization design and results.
Exp NoA-Enzymolysis pHB-Enzymolysis Temperature
(°C)
C-Enzyme Dosage (U/mL)Y-α-Glucosidase
Inhibition Rate (%)
17601028.30 ± 0.88
26601549.26 ± 1.54
36601553.47 ± 1.03
46601551.33 ± 1.43
55601020.56 ± 0.72
66501021.58 ± 1.74
77501532.04 ± 1.26
86601549.51 ± 1.84
96702018.34 ± 1.90
105701518.48 ± 1.19
117602017.97 ± 1.57
126601550.67 ± 1.76
136502027.61 ± 0.98
147701524.36 ± 1.33
155602015.80 ± 1.45
165501523.98 ± 1.07
176701025.49 ± 1.52
Table 3. Analysis of variance of response surface results.
SourceSum of SquaresdfMean SquareF-Valuep-ValueSignificance
Model2994.619332.7351.17<0.0001**
A71.1171.110.930.013*
B42.97142.976.610.037*
C32.84132.845.050.0594
AB1.1911.190.18270.6819
AC7.7617.761.190.3108
BC43.43143.436.680.0362*
A2868.871868.87133.62<0.0001**
B2583.091583.0989.67<0.0001**
C21054.4611054.46162.16<0.0001**
Residual45.5276.5
Lack of Fit34.07311.363.970.1082
Pure Error11.4542.86
Cor Total3040.1316
RAdj2 = 0.9658
RPre2 = 0.8148
Adeq Precision = 18.0148
C.V.% = 8.20%
Significantly different, * p < 0.05, ** p < 0.01.
Table 4. Inhibition dynamics analysis of EHCP and NEHCP.
Concentration
(mg/mL)
Vmax
(ΔOD/min)
Km
(mg/mL)
Ki
(mg/mL)
Inhibition Type
EHCP00.130.240.92competitive
20.130.79
40.131.25
NEHCP00.130.241.92competitive
20.130.52
40.130.73
Note: Vmax denotes the maximum enzyme reaction rate; Km represents the Michaelis constant; and Ki refers to the dissociation constant for the binding of an enzyme inhibitor to the free enzyme.
Table 5. Physiochemical properties of EHCP and NEHCP.
PropertyEHCPNEHCP
Neutral sugar content (%)48.29 ± 1.37 a43.50 ± 1.65 b
Uronic acid content (%)41.18 ± 1.03 a39.03 ± 1.48 a
Protein content (%)1.95 ± 0.10 a1.93 ± 0.17 a
Reducing sugar content (%)7.26 ± 0.18 a2.81 ± 0.56 b
Solubility13.54 ± 0.81 a10.74 ± 0.21 b
Molecular weight (kDa)338.7504.6
Monosaccharide composition (%)
Rha2.12 ± 0.12 a1.78 ± 0.03 b
Fuc2.48 ± 0.13 a1.79 ± 0.16 b
Xyl0.75 ± 0.07 a0.79 ± 0.02 a
Ara0.17 ± 0.09 a0.18 ± 0.03 a
GlcA3.78 ± 0.20 a2.98 ± 0.22 b
GalA77.42 ± 2.75 a78.96 ± 3.50 a
Man3.16 ± 0.23 a2.49 ± 0.02 b
Glc2.08 ± 0.42 a5.24 ± 0.50 b
Gal8.04 ± 0.08 a5.77 ± 1.72 b
The superscript different letters in each row indicate significant difference (p < 0.05). (Abbreviations: Ara, arabinose; Fuc, fucose; Gal, galactose; GalA, galacturonic acid; Glc, glucose; GlcA, glucuronic acid; Man, mannose; Rha, rhamnose; Xyl, xylose).
Disclaimer/Publisher’s Note: The statements, opinions and data contained in all publications are solely those of the individual author(s) and contributor(s) and not of MDPI and/or the editor(s). MDPI and/or the editor(s) disclaim responsibility for any injury to people or property resulting from any ideas, methods, instructions or products referred to in the content.