Article

Quantitative Evaluation of Paper Chromatography Spots in Correlation with Physicochemical Properties of Engine Oils

Department of Quality and Safety of Industrial Products, Cracow University of Economics, Sienkiewicza 4, 30-033 Kraków, Poland
Appl. Sci. 2025, 15(20), 11023; https://doi.org/10.3390/app152011023
Submission received: 16 September 2025 / Revised: 4 October 2025 / Accepted: 10 October 2025 / Published: 14 October 2025
(This article belongs to the Section Green Sustainable Science and Technology)

Abstract

This study explores the potential of paper chromatography for evaluating the condition of used engine oils. A set of 25 oil samples was collected from vehicles operated under real driving conditions and analyzed using both laboratory methods (FTIR spectroscopy, viscosity measurements) and commercial paper test kits. The aim was to quantitatively assess chromatographic spot parameters and investigate their relationships with physicochemical changes in the oil. Refined indicators based on diffusion and contamination zones were proposed and compared with parameters such as oxidation, sulfonation, nitration, and viscosity. The results showed mostly moderate correlations, with only partial consistency between chromatographic and laboratory-derived data. Nevertheless, the analysis highlights that paper chromatography may provide rapid and accessible additional insights for oil condition monitoring, although it cannot substitute standard laboratory testing.

1. Introduction

Engine oil plays a fundamental role in the operation of internal combustion engines, directly influencing their performance, durability, fuel efficiency, and emissions. Despite the anticipated transition away from combustion engines due to environmental concerns and potential regulatory bans on new vehicle production, engine oil remains a relevant and necessary research area—especially in the context of sustainable development and existing vehicle fleets [1,2].
Modern engine oils are formulated to meet the demanding requirements of advanced engine designs that operate under extreme thermal and mechanical conditions. Their base oils are enriched with additives that enhance performance and protect components—ranging from surface protectants (e.g., friction modifiers, anti-wear and extreme pressure agents) to antioxidants and rheology modifiers [3,4]. However, during engine operation, both the base oil and additive package undergo gradual degradation under thermal, oxidative, and mechanical stress. Chemical and tribochemical reactions lead to oxidation, polymerization, and additive depletion [5,6], forming high-molecular compounds such as varnishes, resins [7], and sludge [8], which impair lubrication and accelerate wear.
The degradation process is further complicated by contaminants such as fuel, soot, and combustion by-products. Reactive compounds including organic acids, aldehydes, and ketones promote corrosion and exacerbate wear [9]. Externally observable signs of oil aging include darkening, loss of fluidity, specific odors, and sedimentation [10,11]. On the molecular level, changes are visible through Fourier transform infrared (FTIR) spectroscopy, which enables identification of oxidation, nitration, and sulfonation by monitoring specific absorbance bands [12,13,14,15].
Kinematic viscosity is another key parameter affected by oil aging. The accumulation of oxidation products and contaminants increases viscosity, which, in turn, hinders the formation of an effective lubricating film. This leads to metal-to-metal contact, higher friction, and increased mechanical wear [16]. Thus, regular monitoring of physicochemical properties is essential to ensure optimal engine operation, particularly under strict environmental and operational requirements [17].
Routine oil analysis is a critical tool in predictive maintenance strategies [18]. It enables detection of anomalies, supports oil replacement decisions, and reduces unnecessary oil changes, contributing to environmental protection and cost reduction [19]. Comprehensive diagnostics should include evaluation of additive depletion, contamination levels, and changes in viscosity and oxidation markers. Analytical methods range from classical laboratory testing (e.g., FTIR, viscosity) to more advanced statistical approaches such as neural networks and principal component analysis [20,21].
One of the underexplored but promising methods for assessing the engine oil condition is paper chromatography. Although commercial kits are available, their interpretation is typically qualitative and relies on subjective visual assessment [22]. Paper chromatography has the advantage of being low-cost, rapid, and suitable for field conditions, requiring only small sample volumes. Yet, its diagnostic potential remains limited by the lack of standardization and quantitative analysis [23]. Recent studies have emphasized the importance of rapid and low-cost methods for monitoring engine oil quality. Molenda et al. (2023) demonstrated that paper chromatography, especially with extended separation times, enables correlations with viscosity parameters and provides a practical basis for decisions on oil replacement [24]. Similar efforts to adapt diagnostics to real operating conditions were reported by Bulauka et al. (2023), who proposed a mobile application based on paper chromatography drop tests for individual motorists [25]. Other approaches have focused on sensor-based solutions: Gryazin et al. (2018) developed a universal sensor for monitoring lubricants directly in operating machinery without modifications, while Fygueroa et al. (2009) reviewed rapid, low-cost methods such as blotter spot analysis, dielectric constant, and oil crepitation tests, highlighting their applicability in predictive maintenance [26,27]. Together, these studies underline the ongoing development of non-invasive, accessible tools for oil condition assessment.
In this context, the present study addresses the research gap by proposing a quantitative approach to evaluating chromatographic spot patterns derived from paper chromatography of used engine oils. A set of 25 oil samples collected from vehicles under real-world conditions was analyzed using both laboratory methods (FTIR spectroscopy, kinematic viscosity) and paper chromatography kits. The study introduces refined indicators based on the geometry of diffusion and contamination zones and explores their correlation with oxidation, nitration, sulfonation, and viscosity changes. Sample metadata—including vehicle model, engine type, and usage profile—were also incorporated into the analysis.
Unlike previous studies, which relied mainly on qualitative and subjective visual interpretation of chromatographic stains, this work introduces refined quantitative indicators (Wdd1, Wdd2, Wzm) based on stain geometry and systematically compares them with laboratory parameters (FTIR, viscosity). This approach represents a novel step toward standardizing paper chromatography as a diagnostic tool for engine oil evaluation. By integrating traditional and chromatographic assessment techniques, this study aims to enhance the diagnostic resolution of oil condition monitoring and explore the potential of paper chromatography as a practical, fast, and accessible complementary method in engine maintenance. The proposed approach represents an advancement over purely qualitative evaluations, contributing to more informed decisions regarding oil replacement and engine health assessment.

2. Materials and Methods

2.1. Test Vehicles

The research material consisted of engine oils analyzed across 25 cases. The samples were collected during routine vehicle maintenance inspections, and interviews with vehicle owners provided data on the oil service life, including the mileage covered and the duration of use in months (Appendix A, Table A1). The analysis also included the nature of vehicle usage, categorized into urban and extra-urban operation. Detailed information regarding the characteristics of the vehicles, engines, and operational conditions is available in the appendix.

2.2. Research Equipment

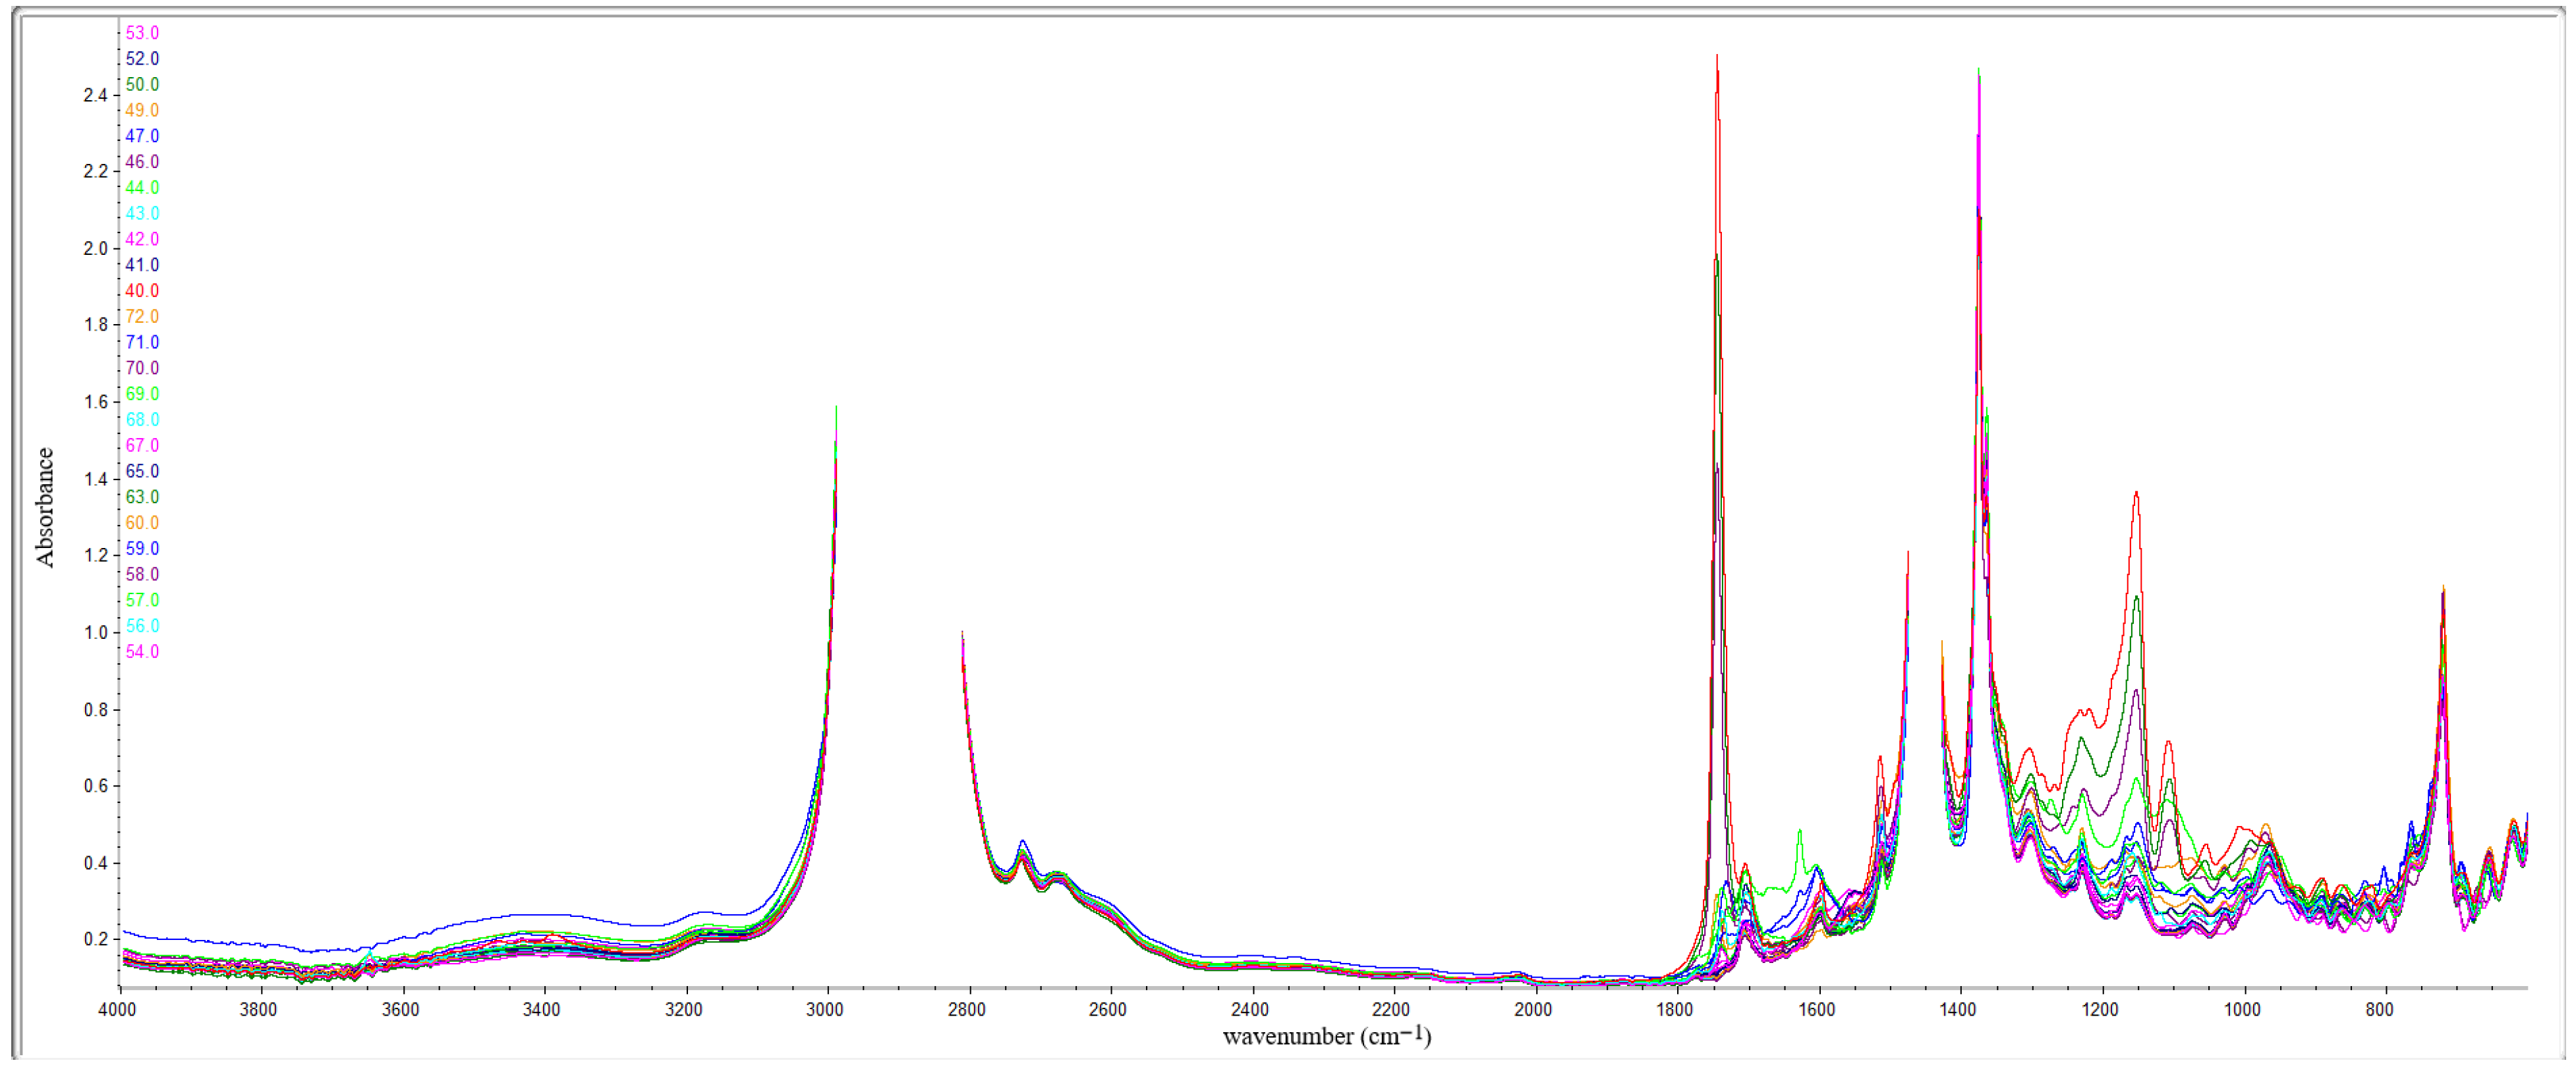
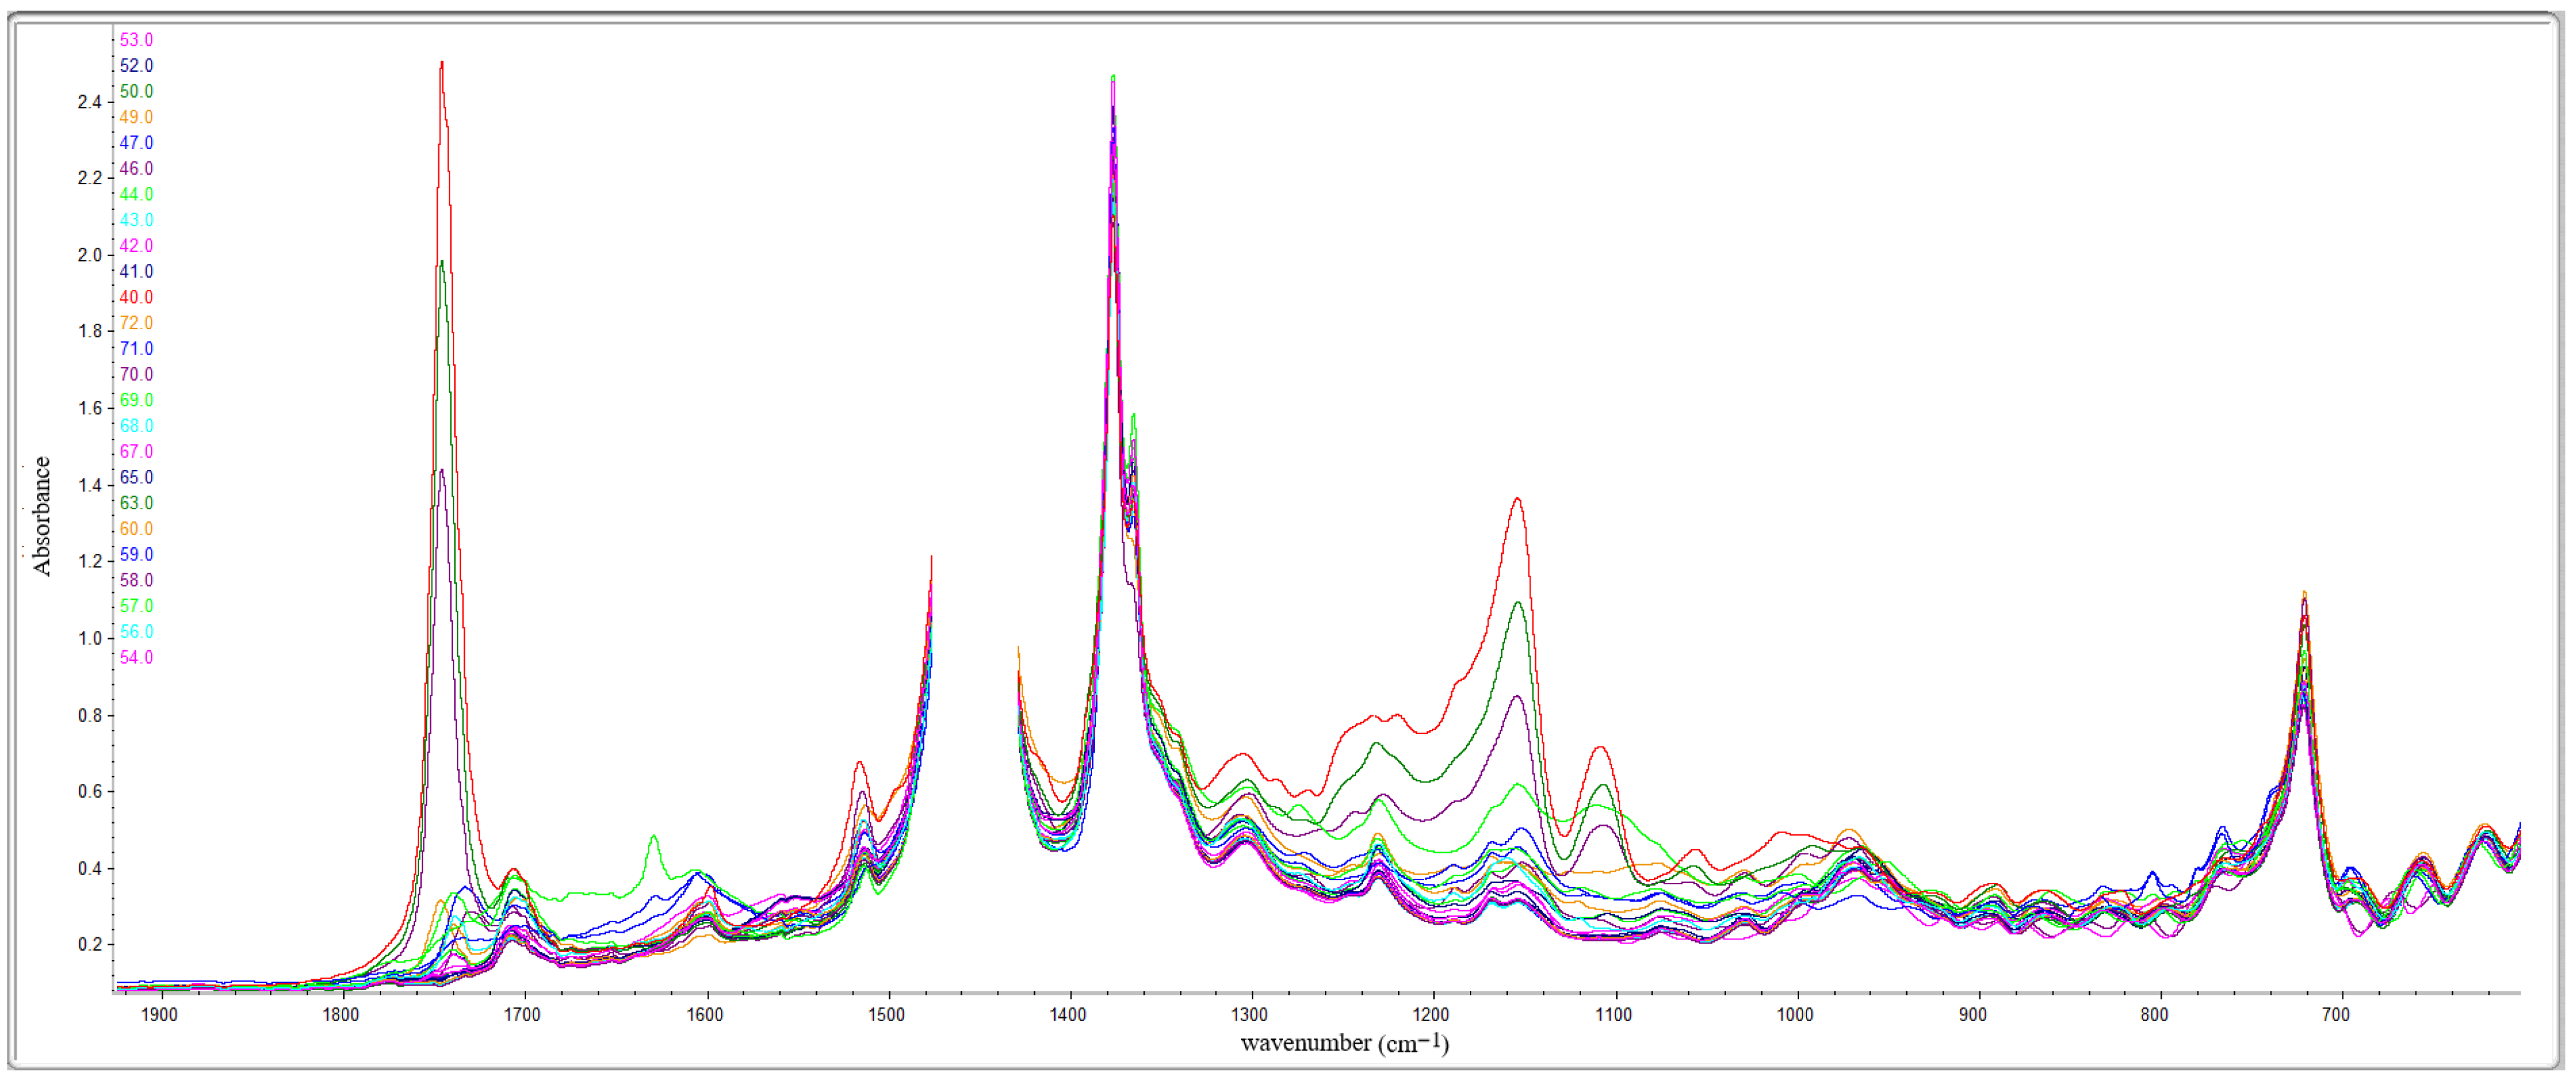
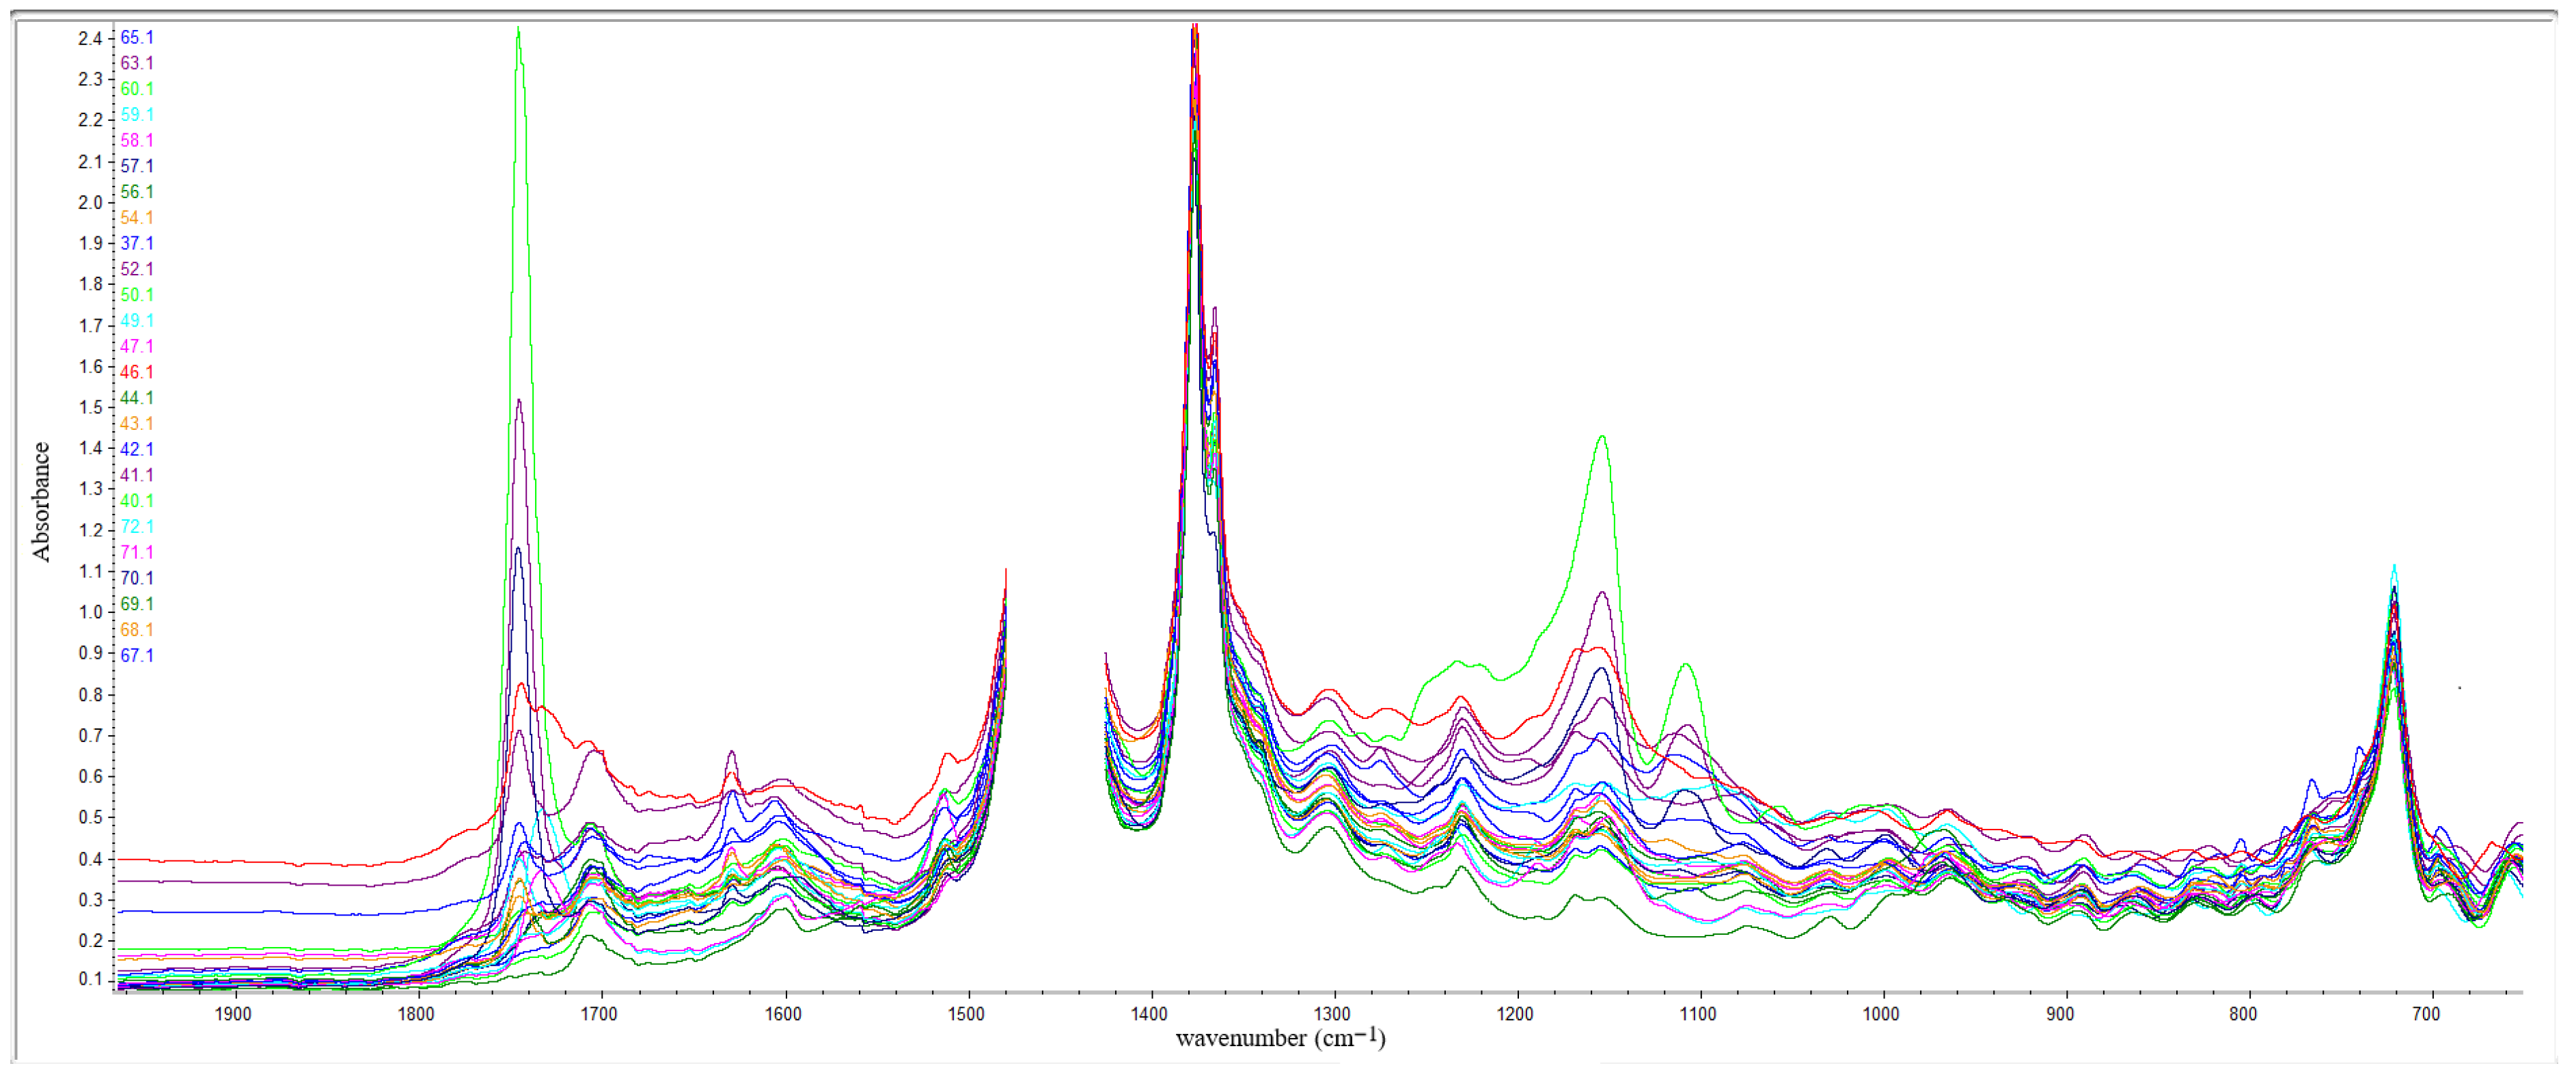
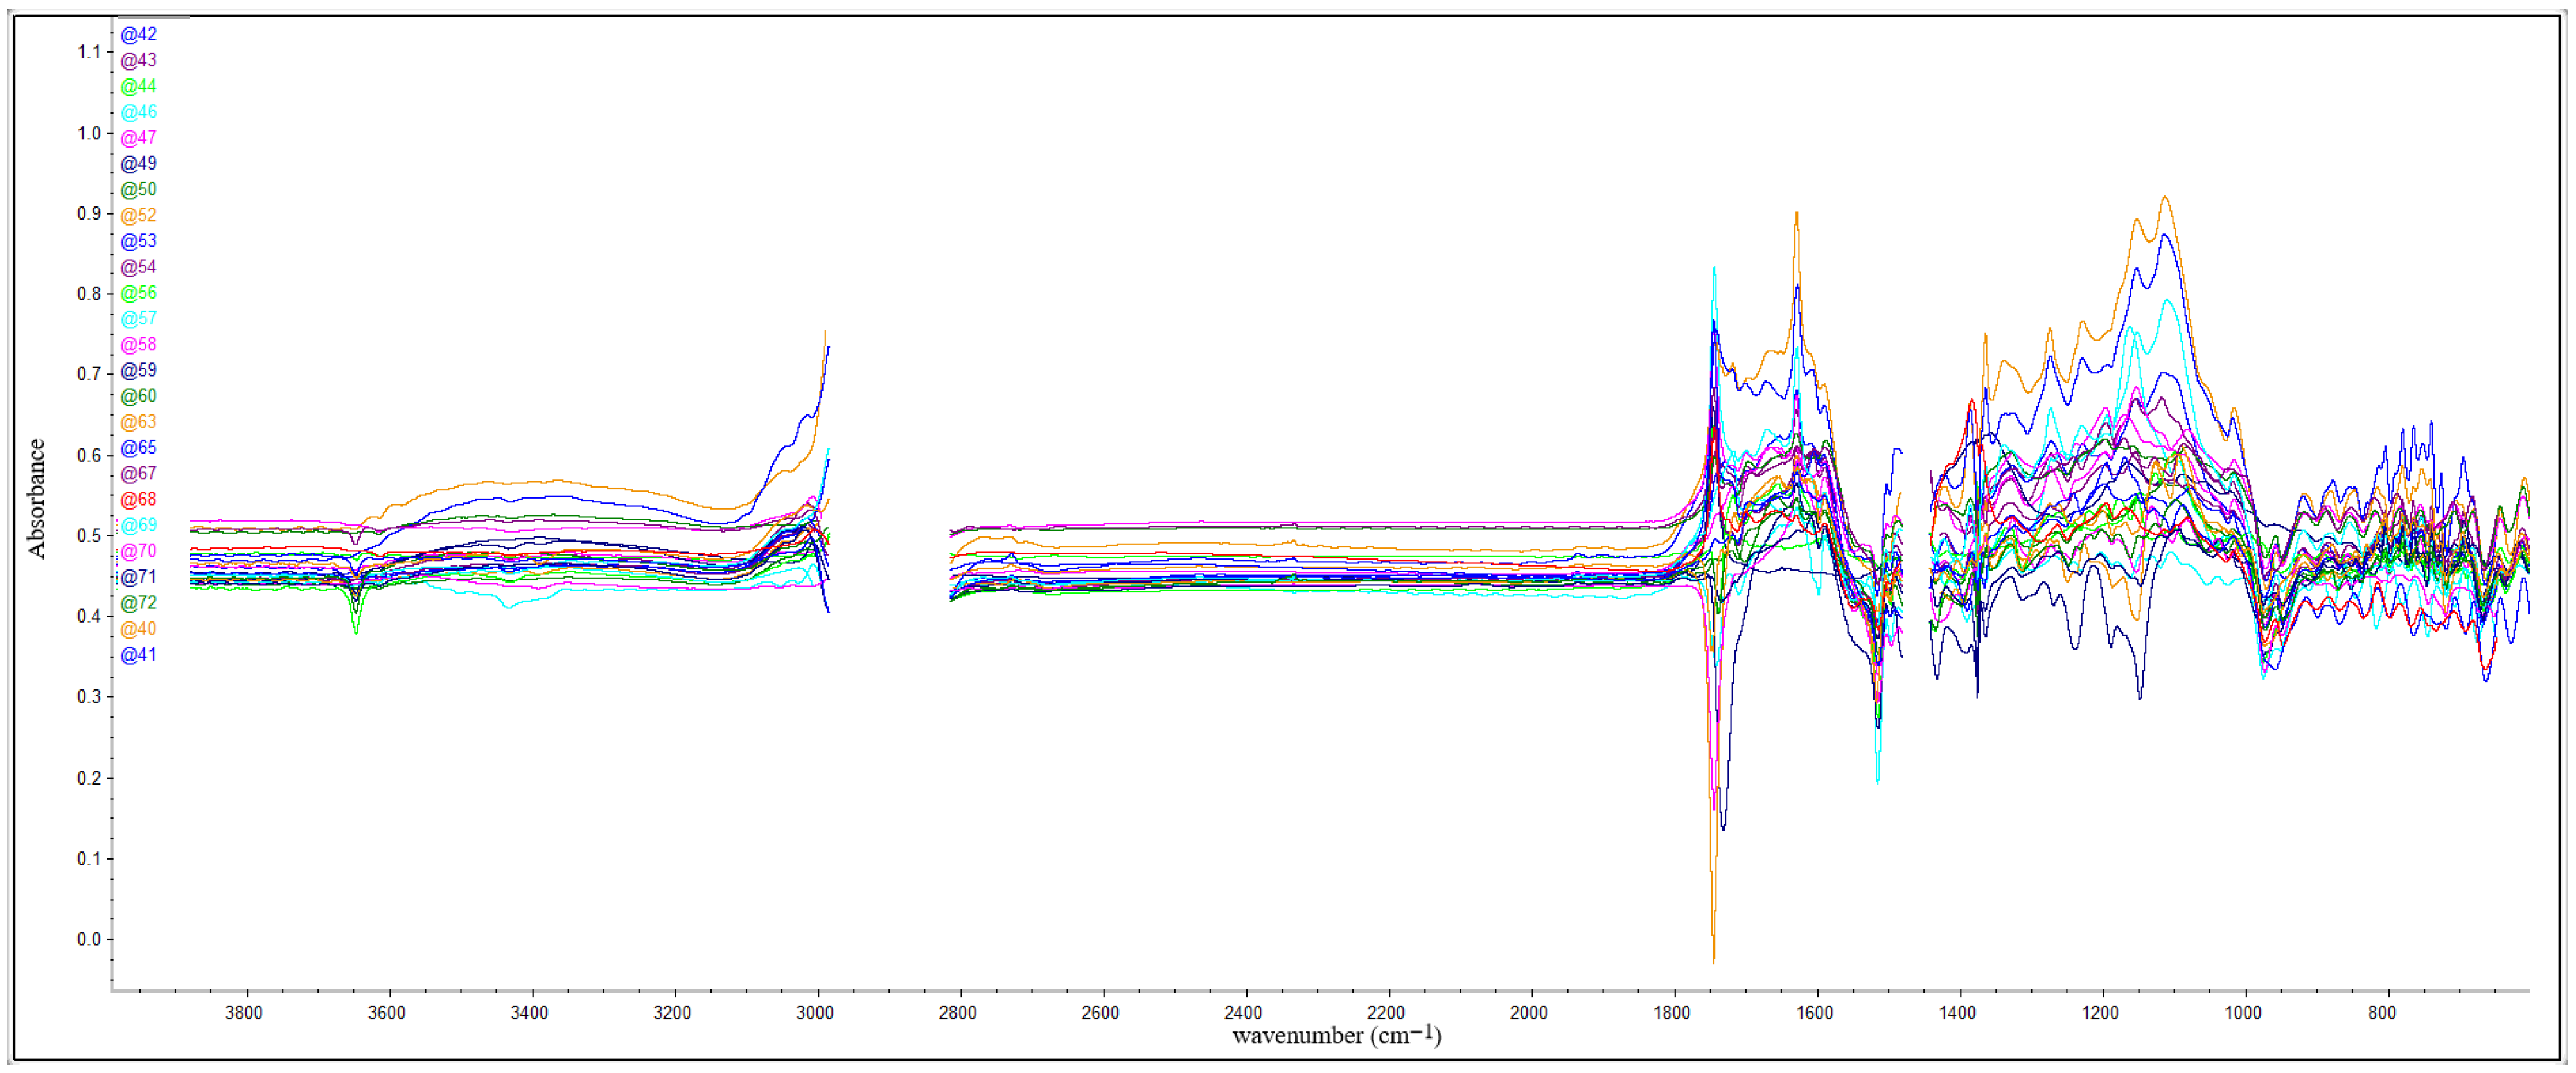
The degradation of various engine oil components, including antioxidants, additive packages, and contaminants such as fuel or debris, was assessed using Fourier Transform Infrared Spectroscopy (FTIR), using a Thermo Nicolett IS5 apparatus (Thermo Fisher Scientific, Waltham, MA, USA) based on the ASTM E2412-23A standard [28]. Differences in the intensity of individual bands for used oils were determined in relation to the spectrum of fresh oil. A ZnSe cuvette with a 0.1 mm light-path was used. Spectral analysis was conducted in the range of 600 to 3700 cm−1, with interpretation based on characteristic absorption bands observed in used oil samples. Oxidation was evaluated in the range of 1695–1730 cm−1, while nitration was detected near 1630 cm−1 (calculated in two variants: using a baseline of 1900–2000 cm−1 and using local minima as the baseline, denoted as nitration_v2). Sulfonation-related compounds were identified in the 1129–1172 cm−1 region. Additive degradation was monitored in several areas, including 950–976 cm−1 (additive functional groups), 1520 cm−1 (possibly linked to deteriorated additive structures), and 1747 cm−1 (viscosity modifier breakdown). A broad peak at approximately 3650 cm−1 was associated with the depletion of antioxidants. Fuel contamination was indicated by a distinct peak at 1590 cm−1. The presence of insoluble debris was reflected in two absorption regions: 3000–3100 cm−1 (Debris_v2) and 3150–3700 cm−1 (Debris), corresponding to oxidized or polymerized contaminants. This method provided a detailed insight into the chemical transformations and contaminants present in the engine oil samples, allowing for a comprehensive assessment of oil degradation processes.
To measure the kinematic viscosity of oils at 40 °C and 100 °C, an automatic kinematic viscometer SVM 3001 was used (Anton Paar GmbH, Graz, Austria) according to the ASTM D7042-21A standard [29].

2.3. Data Analysis Methods

All statistical analyses were performed using Statistica 13.3 (TIBCO Software Inc., Palo Alto, CA, USA, 2017) and IBM SPSS Statistics PRO 9.0 (IBM Corp., Armonk, NY, USA). Due to the lack of normal distribution for most variables, non-parametric methods were applied. Spearman’s rho was used to assess correlations between chromatographic parameters and physicochemical oil properties. Given the relatively small sample size (N = 25), all statistical analyses should be regarded as exploratory. The results provide an indication of potential relationships and grouping patterns, but they cannot be considered fully generalizable. Larger and more homogeneous datasets would be required to validate these findings with parametric methods and to improve the robustness of clustering outcomes.
Additionally, k-means clustering was used to identify groups of oils with similar degradation profiles. Hierarchical clustering (dendrograms) was also applied separately for chromatographic and laboratory parameters to compare their classification effectiveness.

2.4. Characteristics of Rapid Paper Tests

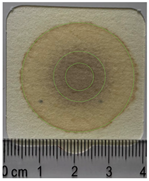
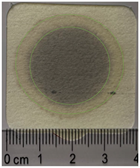
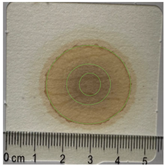
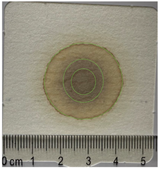
Among the wide array of rapid paper tests available commercially, a German-manufactured product was selected (engine oil test, MOTORcheckUP GmbH, Cologne, Germany; available at https://motorcheckup.com (accessed on 10 September 2025)). The MOTORcheckUP method is an advanced and user-friendly diagnostic tool for assessing the condition of engine oil. It adheres to rigorous industry standards, including ASTM D7899, which governs paper chromatography for engine oil fractionation [30]. The test provides a quick and efficient way to evaluate the oil’s dispersing properties and detect contaminants such as soot, fuel, or coolant. The results are visually interpreted by observing color changes in specific areas on the test paper, which are compared against standardized reference charts. This method offers a reliable and straightforward approach for monitoring engine health without the need for specialized laboratory equipment. The interpretation method recommended by the suppliers of paper chromatography tests is presented in Table 1.
It is important to note that the evaluation of engine oil quality is predominantly based on the color of the dispersion area, which darkens with prolonged usage. Factors contributing to color change include intense oxidation, engine overheating, low oil levels, incorrect oil grade selection for the specific engine type, and poor-quality oil filters.

2.5. Procedure for an In-Depth Analysis of Chromatographic Separations on Paper Tests

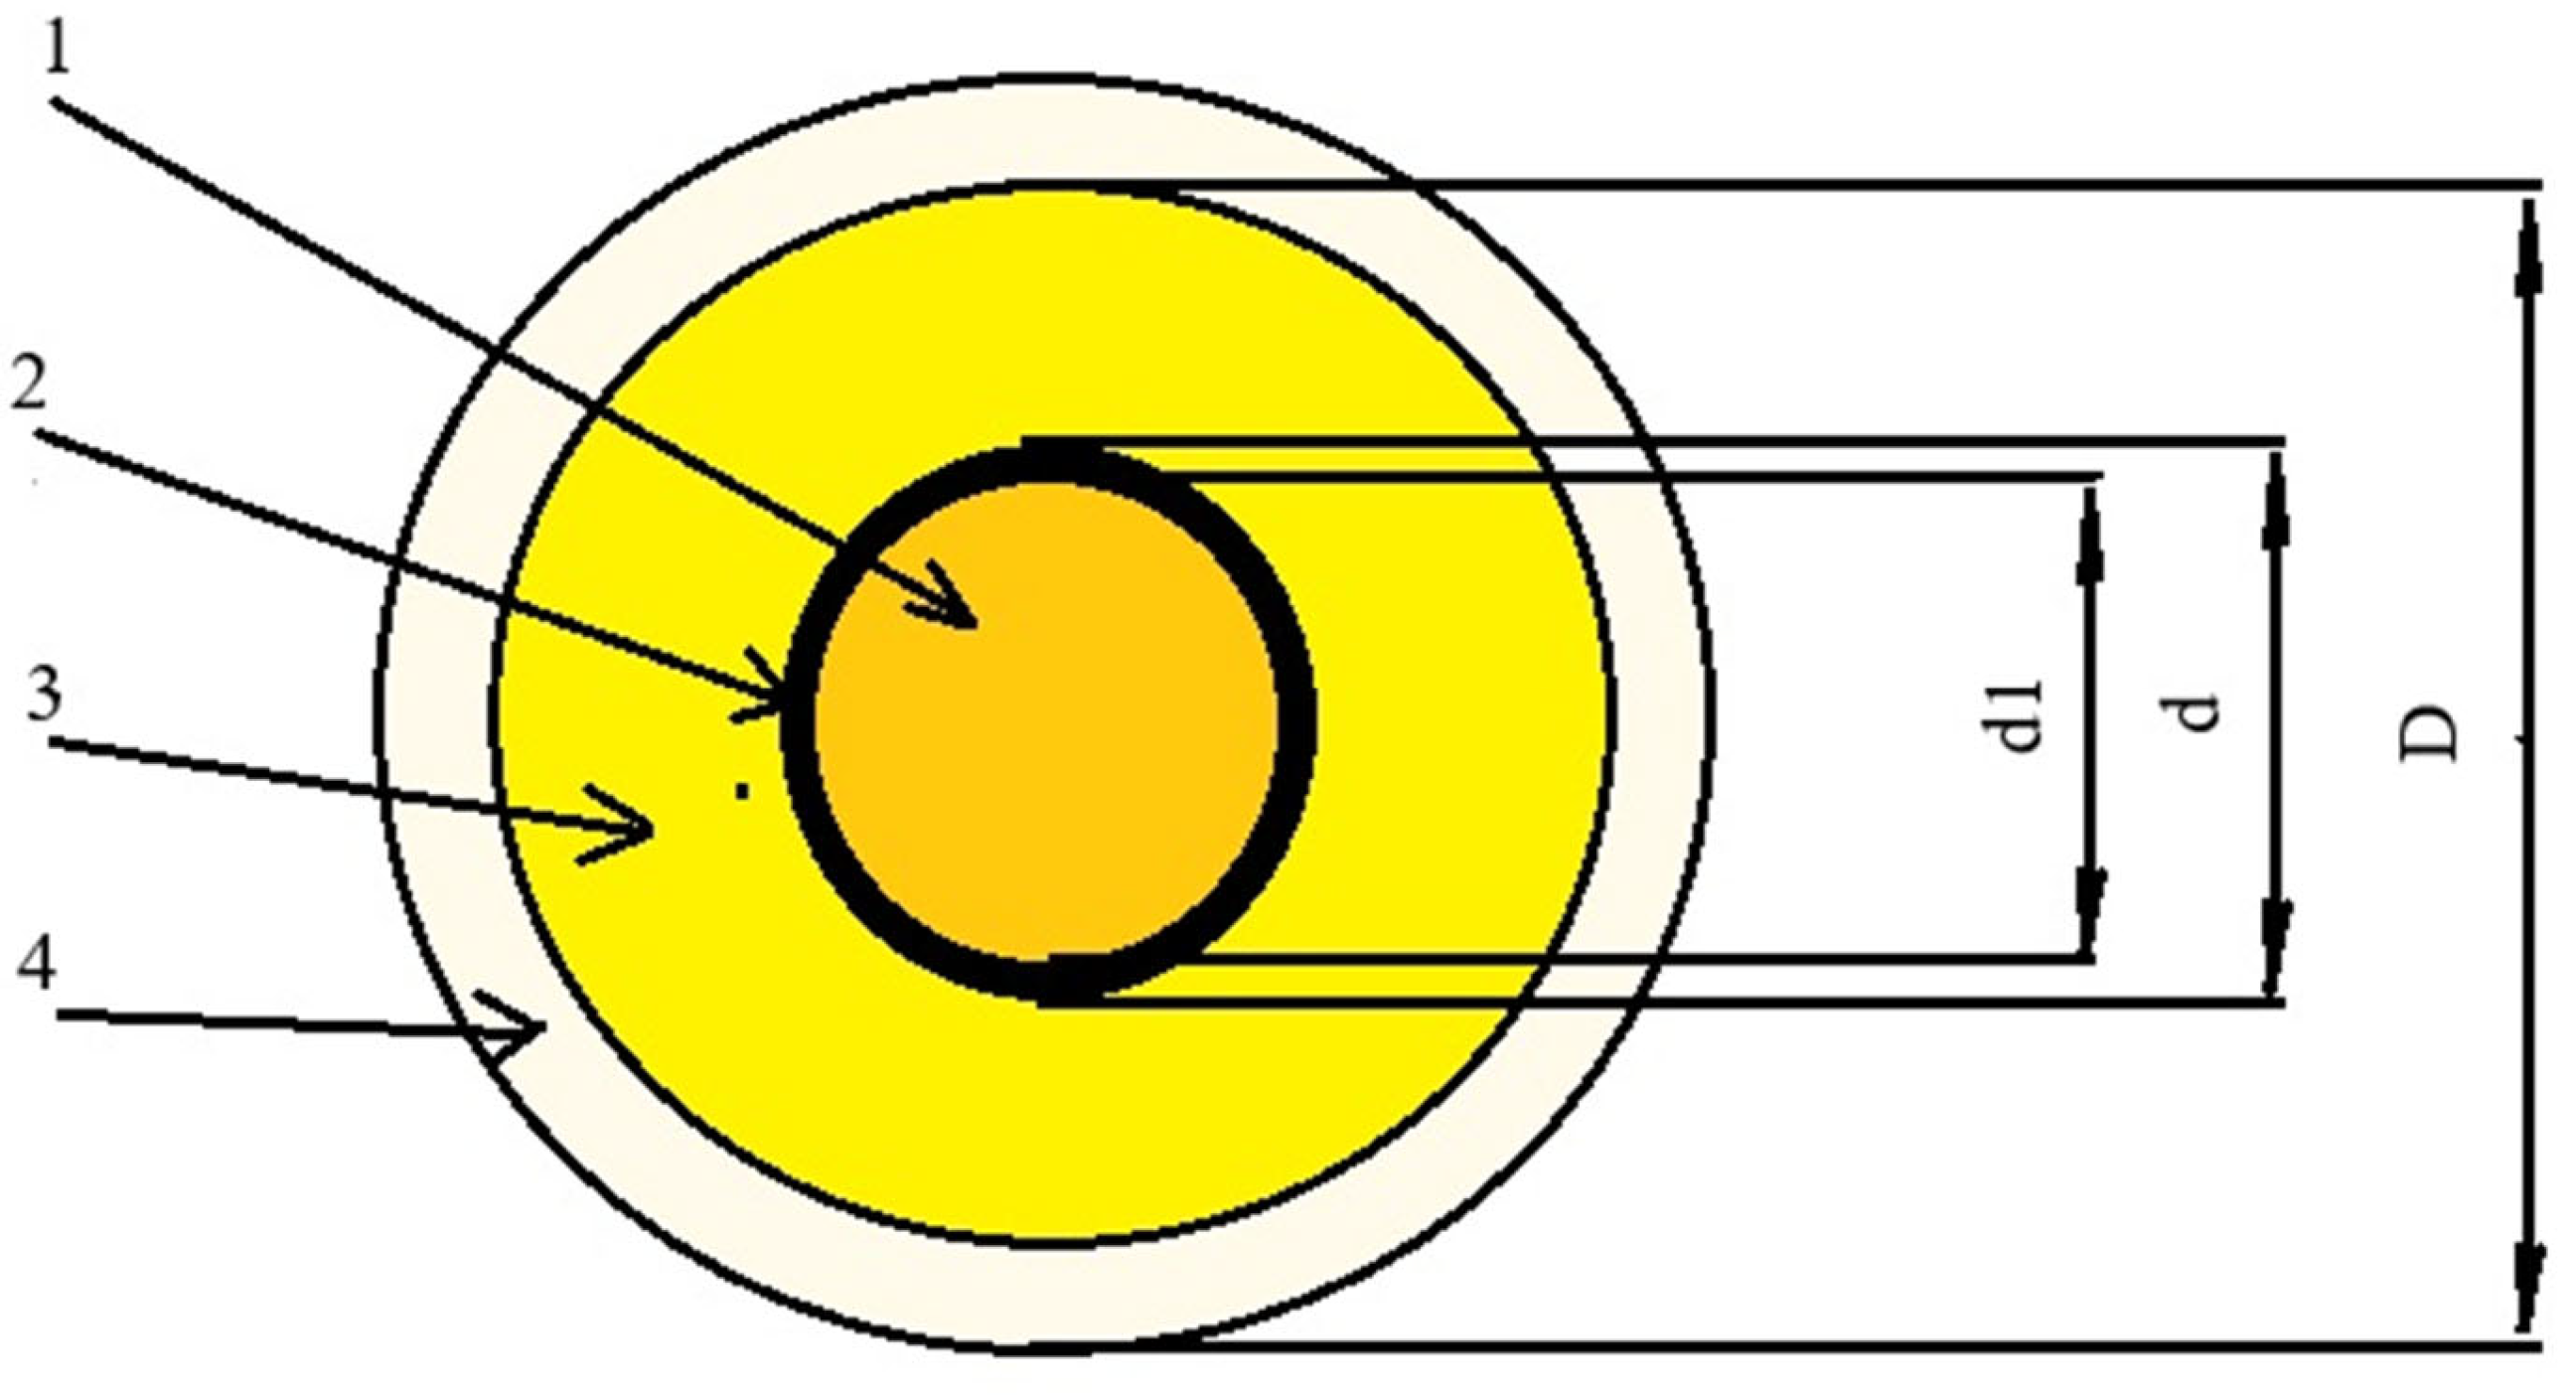
The analysis of oil stains using paper tests focused on several key aspects: the color and shape of the stains after a set period, as well as the presence of a marginal zone (denoted as “d”) (Figure 1). The diameter of the diffusion zone was labeled “D,” and the core of the oil droplet was marked as “d1.” The detergent–dispersant properties coefficient was calculated using two formulas:
Wdd1 = 1 − d2/D2
Wdd2 = D/d
The mechanical contamination coefficient (“Wzm”) was determined by the formula:
Wzm = d1/d
The approach to interpreting chromatographic parameters such as Wdd1, Wdd2, and Wzm is based on previously developed methodologies described in instructional and popular scientific works by Dunayev Gosniti, Keldyshev (educational manual), and Pasechnikov & Khmelevoy (USSR Certificate No. 201768, MPK 7 G01N 31/05), which emphasize the diagnostic potential of drop tests for evaluating detergent–dispersant properties of engine oils. Based on the developed methodology, specific threshold values were defined to interpret the diagnostic significance of the calculated chromatographic indicators. An oil that fulfills its function from the perspective of detergent–dispersant properties is characterized by Wdd1 values between 0.5 and 1.1. Values between 0.3 and 0.5 indicate a warning level, suggesting progressive degradation of dispersant additives. Values below 0.3 represent a critical condition, in which the oil no longer effectively suspends contaminants and should be replaced.
For the Wdd2 indicator, a threshold value of 1.65 was defined. Values above this threshold indicate sufficient detergent–dispersant action, while values below suggest diminished performance and the need for oil replacement.
In the case of the mechanical contamination coefficient (Wzm), the threshold was set at 0.44. Values below this point indicate excessive accumulation of insoluble debris, which may result from extended use, poor filtration, or severe engine wear, and signal the need for immediate oil change.
Although the indicators Wdd1, Wdd2, and Wzm were originally proposed in earlier manuals and a patent, their construction relies on stain geometry (core, marginal, and diffusion zones) that remains directly linked to dispersancy and insoluble loading. This geometry-based logic is consistent with contemporary implementations of the blotter/paper test, where stain area, ring structure and contrast are quantified by imaging to assess dispersancy and contamination. Notably, ASTM D7899 formalizes the blotter spot method for in-service oils, and camera-assisted systems (e.g., DT100) automate measurement of spot features for objective evaluation. These developments support the continued relevance of geometry-based indices and motivate our use of Wdd1/Wdd2/Wzm as transparent, reproducible metrics that can be compared against laboratory markers (FTIR, viscosity).
Prior to dimensional analysis, inclusion and exclusion criteria were defined to ensure reliable measurement of chromatographic spots. Samples were included only if all three zones (core, marginal, diffusion) could be visually distinguished with sufficient contrast to allow accurate dimensioning. Samples were excluded if no visible core or marginal zones were present, or if excessive darkening and saturation made the zone boundaries indistinguishable. These predefined rules aimed to prevent spurious results and to ensure reproducibility of calculated coefficients (Wdd1, Wdd2, Wzm).
The expansion of the marginal zone (d) is associated with a progressive loss of additive functionality. As detergent and dispersant additives degrade, increasing amounts of insoluble deposits accumulate, which causes the marginal zone to widen outward. By measuring the relative proportions between the stain’s core (d1), marginal zone (d), and the full diffusion area (D), this method provides a reliable indication of the oil’s condition based on stain morphology (Figure 1).
To position these legacy metrics within the present state of the art, we note that recent evaluations of rapid paper chromatography for engine-oil diagnostics arrive at similar conclusions regarding its utility and limitations in field screening and its complementarity to laboratory methods. Our study extends this direction by quantifying stain geometry and testing its association with FTIR/viscosity across 25 real-world samples, thereby bridging visual, qualitative practice and standardized imaging-based assessments.
This approach allowed for a detailed evaluation of the oil stains after the specified period (24 h), as this interval provided the most significant insights according to preliminary studies. The method enabled a clear differentiation of chromatographic patterns, enhancing the precision of the oil quality assessment. The observed details were influenced not only by capillary action but also by the interactions between chemical compounds in the used oil and the cellulose structures of the test paper, offering a comprehensive evaluation of the oil’s condition.
The samples were photographed in a well-lit room, ensuring consistent lighting conditions across all samples to maintain repeatability and reliability of the photographic documentation.
In addition, dimensions of individual areas distinguished during oil fractionation, differing in color, were measured (the radius of the core of the stain and the diffusion zone were measured, according to the diagram shown in Figure 1).
Table 2 presents the calculated indicators derived from these measurements.

3. Results

3.1. Results of Physico-Chemical Properties of Tested Oils

Table 3 presents the results of kinematic viscosity at 40 °C and 100 °C, as well as the viscosity index (VI), for the used engine oil samples. The corresponding results for the fresh oils, together with the calculated percentage changes, are provided in the Appendix A (Table A2).
The analysis indicates that in most cases, a decrease in viscosity at 40 °C was observed. This reduction falls within the range of −2% to −34%, with an average decline between −10% and −20%. Similarly, viscosity measurements at 100 °C generally showed a decrease, with reductions ranging from −5% to −27%. Although these reductions are less severe compared to those at 40 °C, they still suggest a thinning of the oil, possibly as a result of additive depletion or exposure to contaminants such as fuel. In a few instances, minimal or no change in viscosity was recorded, which may indicate that the oil’s high-temperature stability was maintained under certain conditions or that effective viscosity improvers were still active. The viscosity index (VI) exhibited minor variations, mostly ranging from −15% to +9%. In most samples, the VI remained relatively stable, indicating that despite a reduction in absolute viscosity values, the oil’s temperature-dependent behavior did not change drastically. This stability suggests the presence of active viscosity modifiers that help maintain performance across temperature variations. However, negative changes in the VI in some cases imply that oil degradation processes, such as oxidation or contamination, have impacted the oil’s ability to maintain consistent viscosity across different temperatures.
Table 4 presents the results for oxidation, nitration, and sulfonation levels of the examined oils, all determined using a baseline in the 2000–1900 cm−1 region. Other FTIR parameters were also evaluated: negative bands at 1000–900 cm−1 indicated EP additive transformation, the 890–700 cm−1 region reflected fuel dilution (aromatic bands at 890–740 cm−1 and aliphatic effects near 720 cm−1), while antioxidant depletion was assessed at ~3650 cm−1 and soot presence from the uniform elevation of the differential spectrum baseline. Contaminants were further analyzed in the 3100–3000 cm−1 range (aromatic and unsaturated structures) and in the 3100–3600 cm−1 region based on the integrated band area. These complementary results are provided in Appendix A (Table A3).
The results show that in many samples, negative values indicate a decrease in certain components, such as antioxidants, additives, and base oil quality. This decline suggests oxidative and chemical degradation processes that occur during the oil’s service life, leading to reduced efficiency and protective properties of the oil. Debris levels vary significantly across samples, with values ranging from minimal (0.00) to higher concentrations (up to 17.59). This variation indicates the degree of contamination and particulate accumulation in the engine, which correlates with the engine’s condition and usage patterns. Notably, in some cases, debris levels show substantial increases, suggesting severe contamination and wear. Sulfonation and nitration levels also vary, with sulfonation typically showing positive values around 0.04 to 0.43, indicating an accumulation of sulfur compounds. Nitration measurements, with values such as 0.02 to 0.41, provide insights into the formation of nitrogen-based compounds, which are often linked to high-temperature combustion and oil degradation.
Oxidation levels, observed in ranges like ~1695–1730, exhibit both positive and negative values. Some samples show increases in oxidation levels, signaling progressive oil aging, while others remain stable or decrease slightly. These changes are indicative of the oil’s exposure to high temperatures and oxygen, leading to chemical breakdown. The analysis of viscosity modifiers and fuel contamination demonstrates fluctuations, with some oils retaining their viscosity-modifying capabilities, while others show significant losses. Fuel contamination is particularly variable, with some oils showing increases, indicating fuel dilution—a common issue in engines that can lead to reduced oil viscosity and performance.

3.2. Results of Chromatographical Properties of Tested Oils

Table 5 presents the numerical characterization results from paper chromatography, providing a quantitative evaluation of the oil samples. Key parameters such as the diameter of the core stain (“d1”), the marginal zone (“d”), and the diffusion zone diameter (“D2”) were measured for each sample. These parameters were used to calculate various coefficients, including “Wdd1” and “Wdd2,” which indicate the detergent–dispersant properties, and “Wzm,” which measures the level of mechanical contamination.
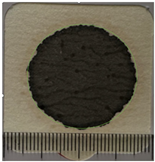
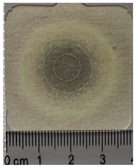
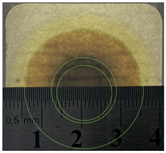
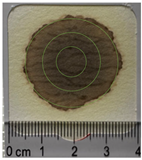
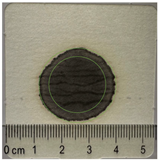
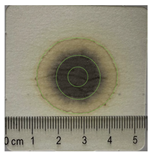
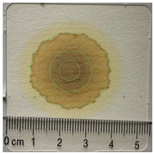
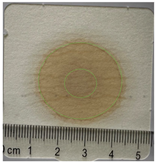
Table 6 provides a graphical representation of the chromatographic spots, with circles superimposed on the stains to clearly indicate which zones were considered in the calculations.
The results reveal considerable variation across the oil samples in terms of stain geometry and the derived diagnostic coefficients. The values of the central zone diameter (“d1”) range from 0.00 to 1.60, while the marginal zone (“d”) spans from 0.80 to 2.90, and the diffusion zone (“D2”) from 2.20 to 3.45. These parameters, alongside coefficients such as Wdd1, Wdd2, and Wzm, are intended to reflect differences in additive effectiveness, dispersibility, and contamination levels. However, at this stage, it is important to acknowledge a fundamental limitation of the method. The absence of a visible central ring (“d1 = 0”) can lead to conflicting interpretations: in some cases, it may indicate a completely uncontaminated (fresh) oil sample; in others, it may suggest such a high level of insoluble contamination (e.g., soot) that the central zone becomes indistinguishable from the rest of the stain. Consequently, relying on numerical parameters alone may result in misleading conclusions. Therefore, the first and necessary step in using paper chromatography effectively should be a visual assessment of the stain’s shape, color, and structural features. Bright, uniform stains with well-defined edges and no central darkening typically reflect clean or minimally used oil and do not require quantitative dimensioning—such a procedure would be redundant. On the other hand, excessively dark, opaque, or saturated stains should also be flagged at the preliminary evaluation stage and excluded from further dimensional analysis, as their morphology prevents meaningful interpretation. Based on the current sample set, it is recommended that samples 41, 44, 46, 50, 57, 60, 70, and 71 be excluded from numerical processing. In these cases, either the morphology does not allow for reliable measurement or the appearance suggests that dimensional coefficients would not accurately reflect the oil’s condition.

4. Statistical Analysis

4.1. Results of Statistical Analysis—Clustering

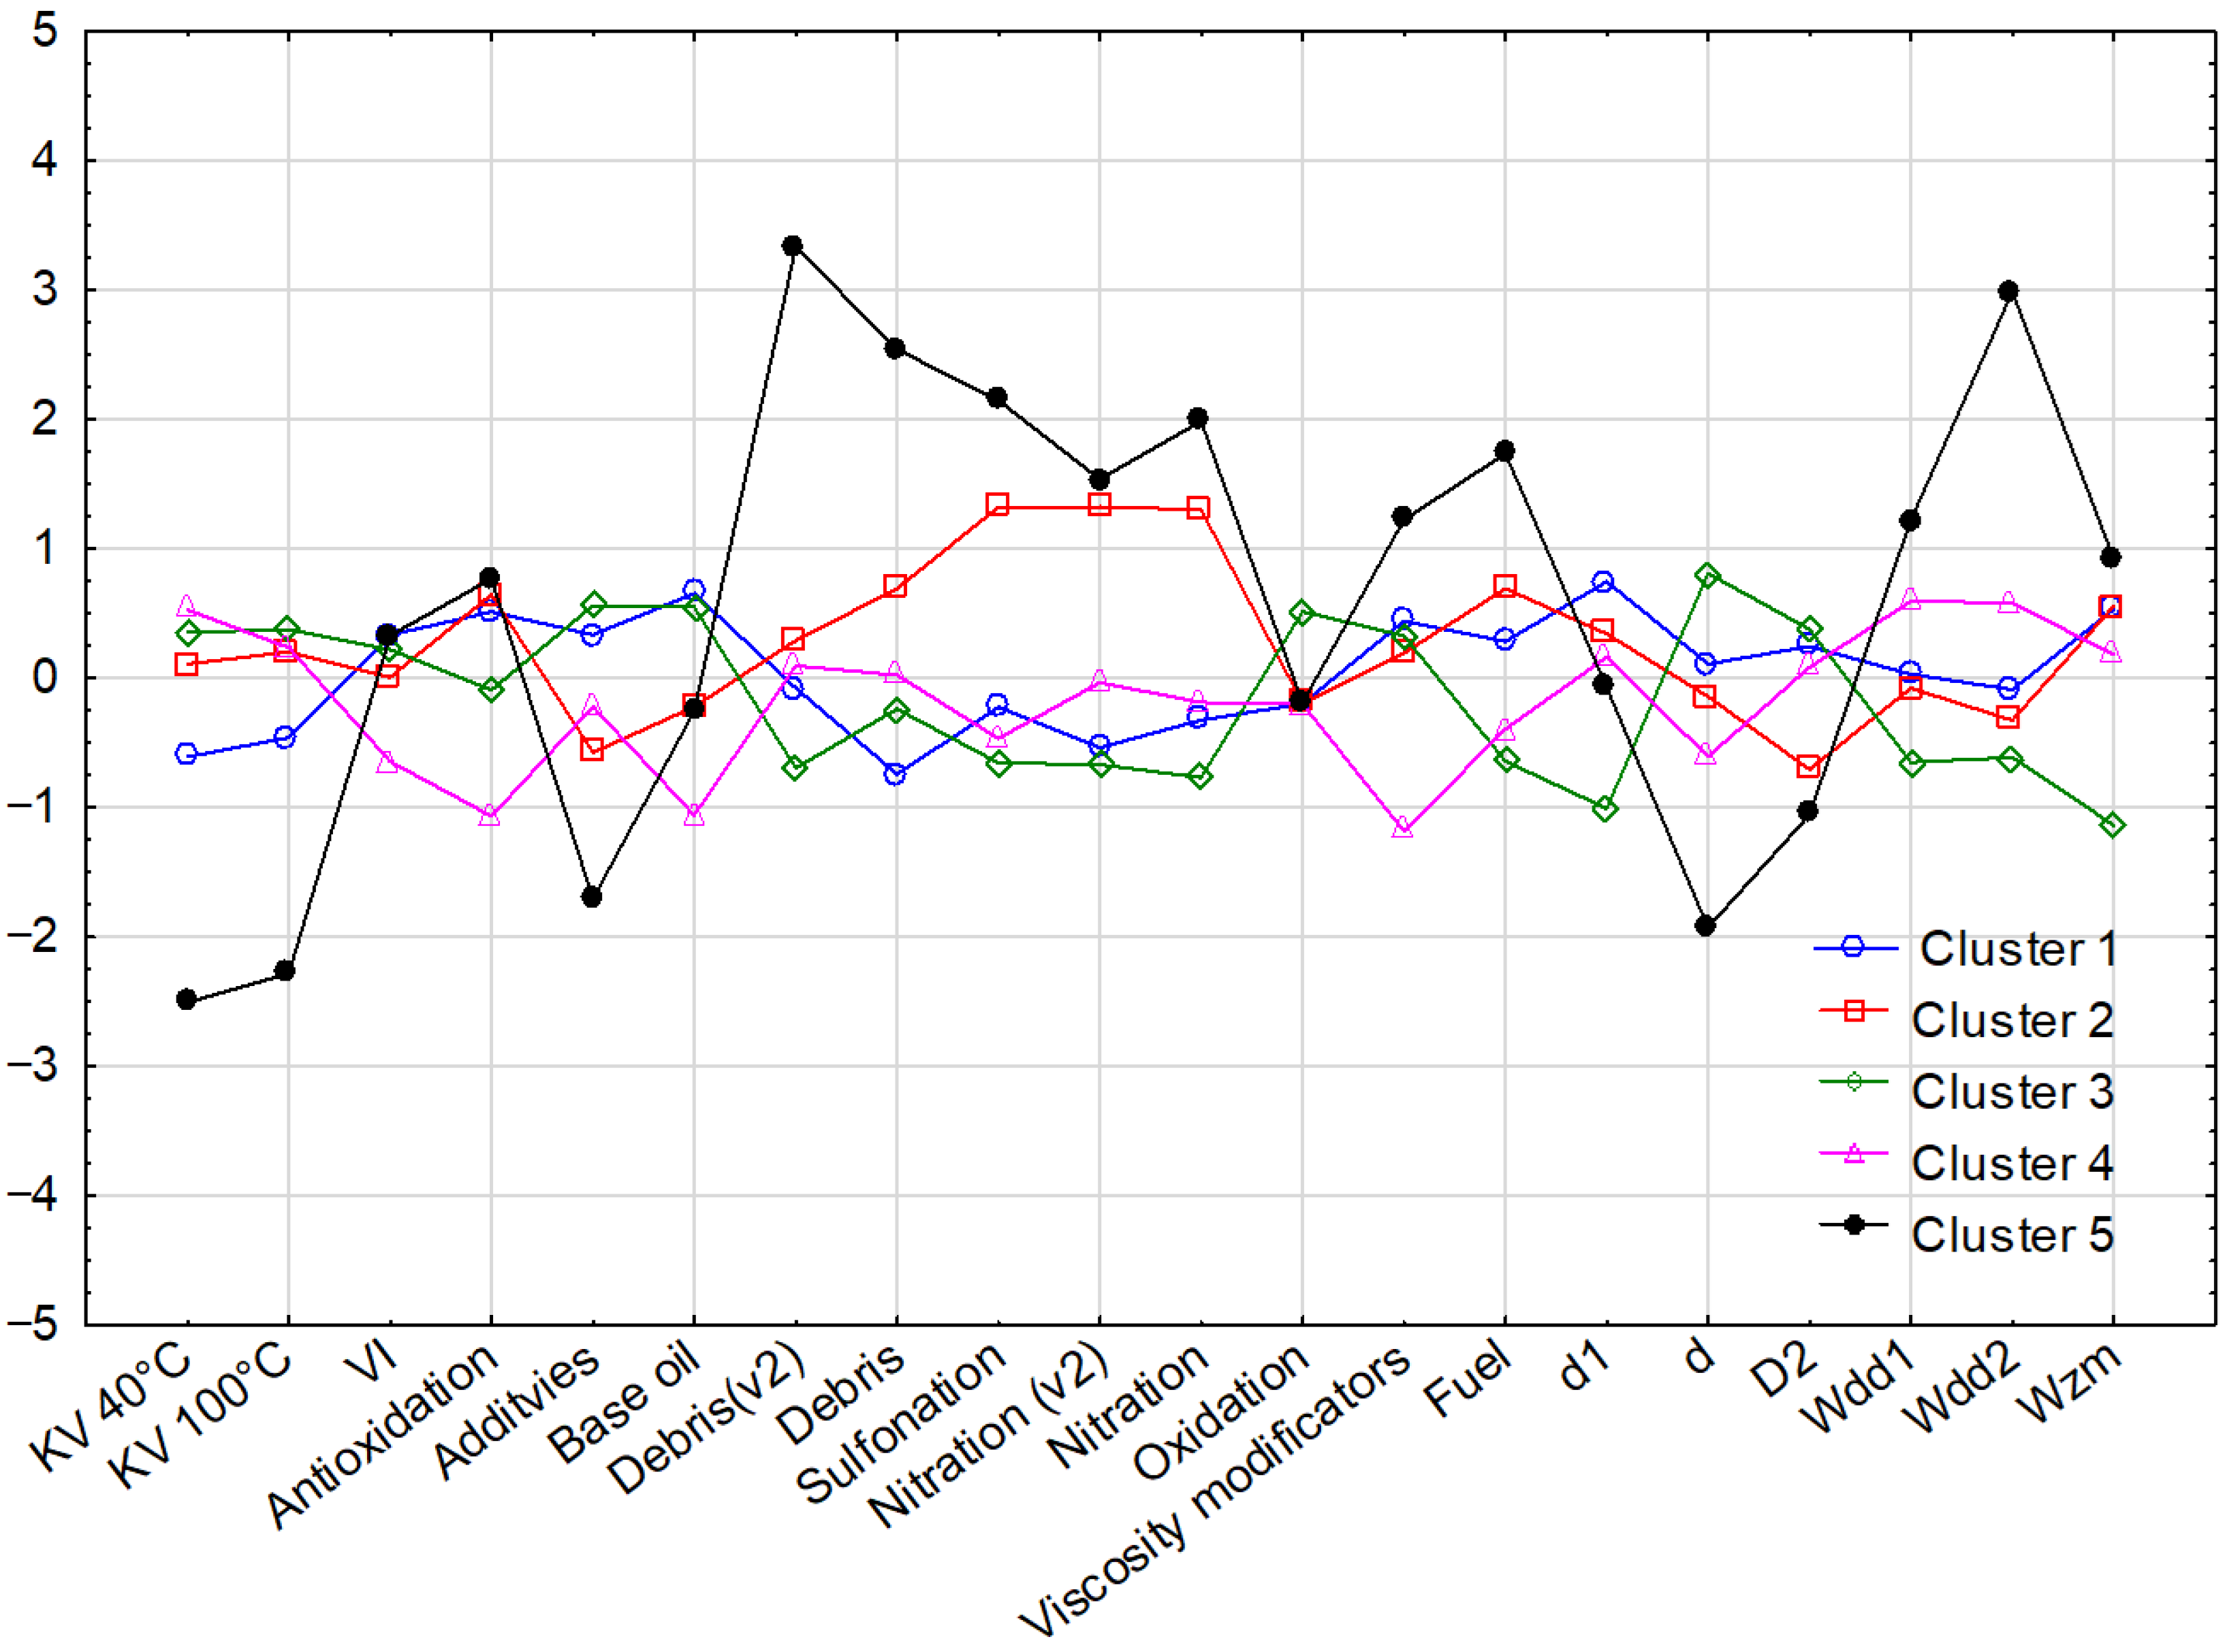
Statistical analyses began with the k-means clustering method, a crucial technique in data analysis that partitions observations into distinct clusters based on their similarity (Figure 2). This method is particularly important as it allows for the identification of patterns and grouping characteristics within complex datasets, providing insights into which variables significantly contribute to differentiation. The five clusters should be regarded as an exploratory grouping rather than a definitive classification of oils. Their practical significance lies in illustrating that paper chromatography spot geometry contains structured information: samples with similar dispersancy and contamination levels tend to cluster together. In real-world diagnostics, such grouping could help practitioners quickly recognize whether an oil exhibits a typical aging pattern (falling into a common cluster) or shows atypical features that warrant laboratory confirmation. At the same time, the diversity of cluster membership underlines the limitation of paper chromatography as a sole diagnostic method, reinforcing the need to integrate it with physicochemical analyses such as FTIR and viscosity.
In this study, the primary goal of using the k-means method is to determine which parameters most effectively distinguish the oil samples and which exhibit low variability across the dataset. By clustering the data, it becomes possible to identify patterns in the chemical and physical properties of the oils, highlighting the parameters that are critical for assessing oil quality and those that may be less informative due to minimal variation. This approach is essential for refining the evaluation criteria used in oil analysis and optimizing monitoring strategies.
The oils marked with numbers 50, 49, 54, 65, 68, and 58 form Cluster 1. Oils numbered 43, 69, 42, 52, and 47 are grouped in Cluster 2. Oils marked with numbers 44, 71, 41, 60, 67, 57, and 46 constitute Cluster 3. Oils numbered 63, 59, 72, 40, 70, and 56 make up another cluster. Additionally, Cluster 5 contains a single sample, number 53.
Figure 2 shows the k-means clustering of the oil samples based on combined chromatographic and physicochemical parameters. Sample 53 forms a separate cluster (Cluster 5), indicating the greatest divergence from all other groups, with distinct differences observed in both laboratory and blotter test results. Cluster 2 (samples 43, 69, 42, 52, and 47) is mainly differentiated by elevated nitration, oxidation, and sulfonation levels, although the blotter test dimensions remain relatively consistent. In contrast, Cluster 3 (samples 63, 59, 72, 40, 70, and 56) shows clearer differences in blotter spot geometry compared to other clusters, while the physicochemical variations are less pronounced. Overall, the analyzed clusters differ most significantly in terms of contamination level, sulfonation, nitro-oxidation, and the blotter parameters “d” and “Wdd2.” The results particularly highlight that Clusters 4 and 5 stand out from the others, reflecting higher variability and more extreme values of these parameters, which may indicate distinct chemical compositions or degradation patterns. In the next step, the grouping of the analyzed oils was conducted using the dendritic (hierarchical) clustering method. Two separate approaches were applied: the first option utilized only physicochemical parameters, while the second option focused exclusively on parameters derived from paper chromatography. This approach allows for the assessment of how each set of parameters independently contributes to the differentiation and clustering of the oil samples, providing insights into the effectiveness and relevance of these distinct analytical methods.
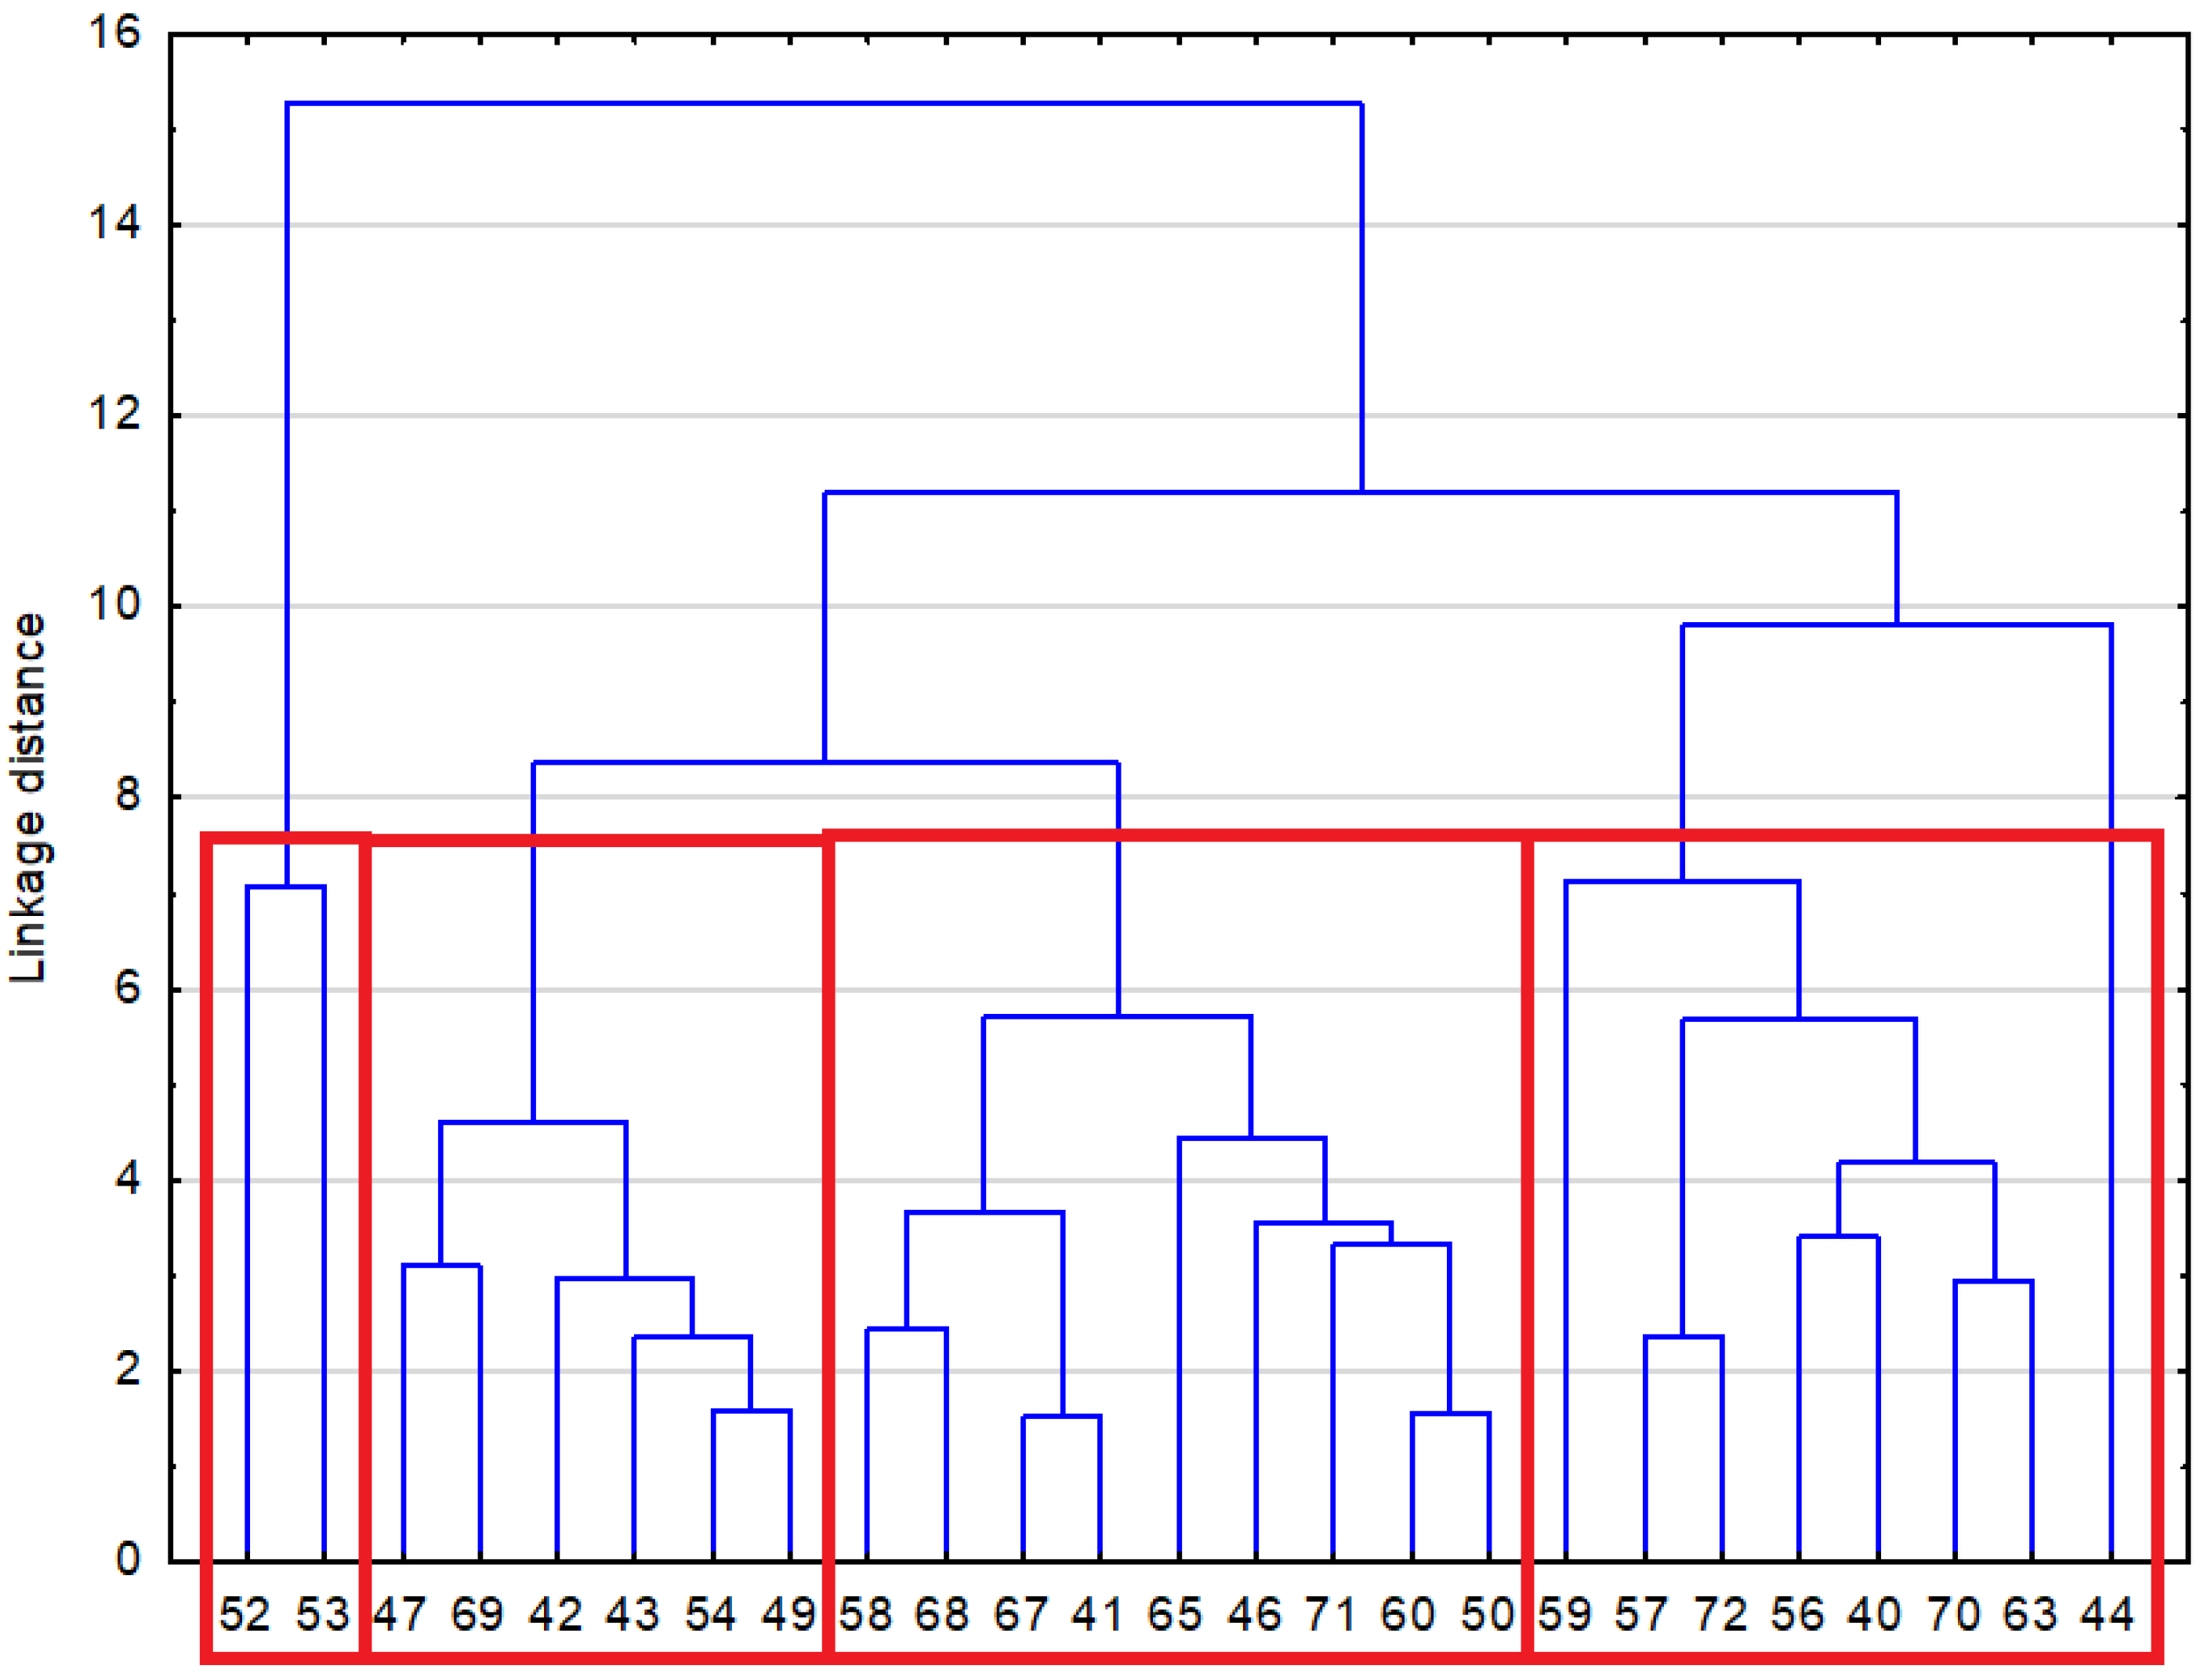
Cluster analysis based on physicochemical parameters, performed using Ward’s method with Euclidean distance, allowed for the identification of several groups of samples with similar property profiles (Figure 3). The closest pair of samples was 67 and 41, to which 58 and 68 were subsequently joined, forming the first distinct cluster. Another group consisted of 60 and 50, characterized by a very small linkage distance, followed by 71, 46, and 65. The third cluster included 54, 49, 42, and 43, along with the pair 47 and 69. Another cluster was formed by 57 and 72, together with 56, 40, 70, and 63. Outliers were identified in sample 44, as well as in the pair 52 and 53, which did not show strong connections with any of the main groups.
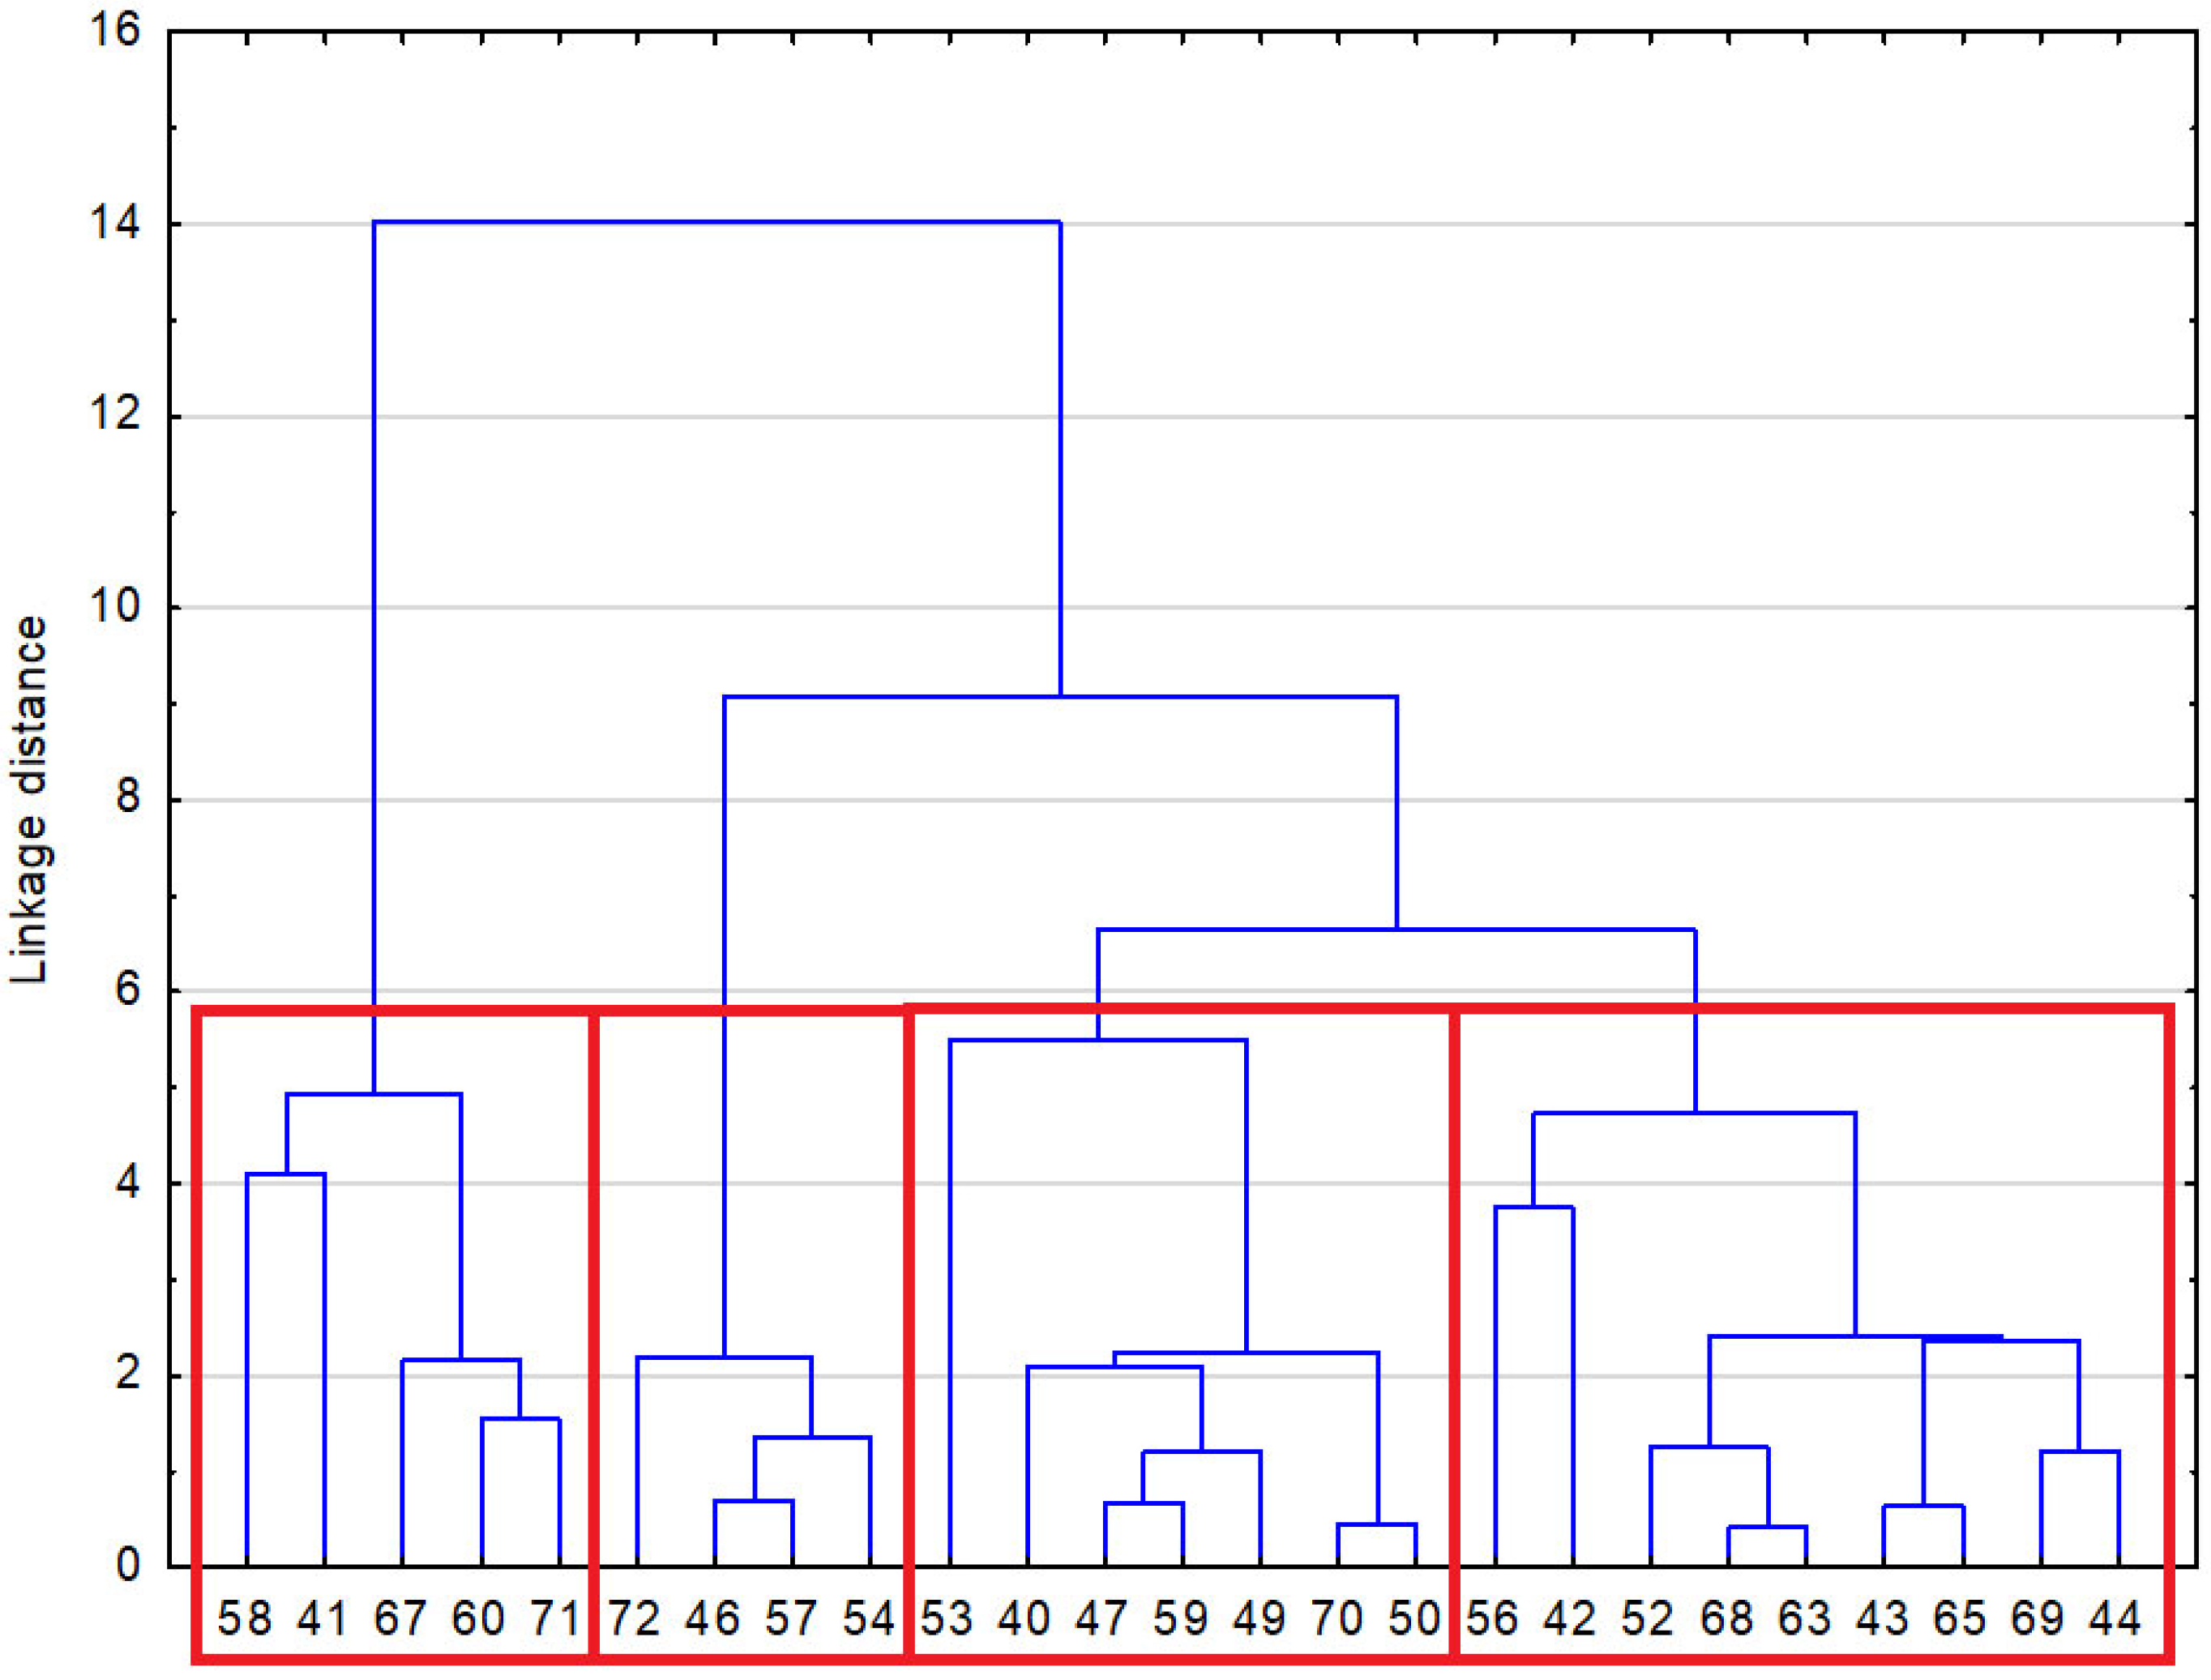
Cluster analysis based on the dimensioned paper chromatography spots revealed a somewhat different sample distribution (Figure 4). The first cluster comprised 46, 57, 54, and 72, while the second included 47, 59, 49, 70, 50, and 40. The third cluster was formed by 68, 63, 52, 43, 65, 69, and 44, whereas the fourth included 60, 67, and 71. Samples 58 and 41 appeared the least similar to the others, forming a loosely connected group.
The comparison of clustering results based on physicochemical parameters and those derived from paper chromatography spots reveals several notable consistencies, but also clear differences in the grouping of samples. Sample 52, for instance, was assigned to a larger cluster in the chromatographic analysis, whereas in the physicochemical approach it appeared as an outlier, highlighting the distinct conclusions that may arise from different methods. In contrast, sample 53 remained consistently separated from the rest in both analyses, serving as a good example of convergence between the two approaches. A degree of consistency was also observed for samples 60 and 71, which clustered closely together in both cases, as well as for samples 72 and 57. However, samples 46 and 54, which formed a joint cluster in the chromatographic analysis, were classified into different groups in the physicochemical one. Similarly, samples 49 and 47 appeared in related neighborhoods in both analyses, indicating partial agreement. For the majority of other samples; however, the overlap between clustering solutions was limited, demonstrating that the two methods capture different aspects of the studied oils.
Overall, the dimensional analysis of paper chromatography spots does not provide an easy or unambiguous classification tool. Its agreement with groupings obtained from physicochemical parameters is only moderate. At this stage, the method may serve as an additional source of diagnostic information but cannot replace standard laboratory analyses. The comparison further indicates that distinct groupings of samples emerge depending on the chosen parameter set. Physicochemical data reflect the oils’ chemical and physical properties, while chromatographic data highlight changes in their behavior during separation, making the two approaches complementary rather than interchangeable.

4.2. Results of Statistical Analysis—Correlation

Spearman’s rho coefficient was applied in the statistical analysis since the examined variables did not exhibit features of a normal distribution. Most correlations were within the range of approximately ±0.4, indicating relationships of moderate strength. Although some of these were statistically significant, their fit to the trend line was generally weak, suggesting that several of the observed associations may be spurious.
Against this background, correlations related to the share of urban driving stand out. For the detergent–dispersant coefficients Wdd1 and Wdd2, the correlation values reached r = 0.558 and r = 0.582, respectively, while for the marginal zone diameter (d), the correlation was r = −0.573 (Figure 5, Figure 6 and Figure 7). These consistent relationships indicate that with an increasing share of urban driving, the marginal zone diameter decreases, while the importance of detergent–dispersant properties becomes more pronounced. This effect is likely linked to the specific conditions of urban operation, such as short trips, frequent starts, and higher fuel dilution of the oil, which increase the demand for dispersant additives.
Other relationships, such as mileage versus marginal zone diameter (ρ = 0.486) or viscosity index versus diffusion zone diameter (ρ = −0.467), showed poor model fit and are likely to represent coincidental associations. Given the limited sample size (N = 25) and the presence of outliers, further studies on larger and more homogeneous datasets are required. This constraint also affects the interpretation of the clustering results, which should be treated primarily as an illustration of methodological potential rather than a conclusive classification of oils. Therefore, the present statistical outcomes should be viewed as preliminary, serving to demonstrate the feasibility of linking chromatographic indicators with laboratory parameters. Nevertheless, the relationships associated with urban driving appear the most consistent and may serve as a valuable reference point for future investigations.

5. Discussion

The results obtained in this study demonstrate both the potential and the limitations of paper chromatography as a complementary tool for assessing engine oil condition. A consistent decrease in viscosity was observed in most samples, with reductions at 40 °C often exceeding 10%. These changes suggest the influence of multiple degradation processes, including thermal stress, additive depletion, and fuel dilution. While the Results Section presented only the numerical trends, here it is important to note that viscosity alone cannot reliably capture the complex chemical transformations of oils. This reinforces the need to combine viscosity measurements with spectroscopic data and chromatographic spot analysis to obtain a more complete diagnostic picture.
The quantitative evaluation of chromatographic stains using indicators Wdd1, Wdd2, and Wzm provides a structured means of comparing blotter test outcomes with laboratory parameters. This numerical approach highlights specific ambiguities in interpretation—for example, the absence of a visible core (d1 = 0) may reflect either very clean oil or severe accumulation of insoluble contaminants. Such cases confirm that numerical indices should always be interpreted in the broader context of visual stain assessment and complementary laboratory data.
Cluster analyses indicated that samples could be grouped into sets with similar chromatographic features, although the overlap with physicochemical groupings was limited. This outcome illustrates that paper chromatography captures certain aspects of dispersancy and contamination, but not the full spectrum of chemical changes detectable by FTIR or viscosity measurements. The diversity of grouping patterns underscores the supportive rather than standalone role of chromatography in oil diagnostics.
Correlation analysis revealed moderate associations, with the most consistent relationships linked to the share of urban driving. In field-based studies such as the present one, it is difficult to isolate the influence of a single factor. Vehicle age, mileage, and engine type interact with operating profile, meaning that observed correlations—such as those with urban driving share—reflect the combined outcome of several variables rather than the exclusive impact of one. Therefore, the identified relationships should be regarded as indicative and exploratory, requiring further confirmation on larger and more homogeneous datasets.
Overall, this study offers an initial framework for integrating paper chromatography with laboratory oil diagnostics. The use of quantitative indicators allows a more systematic evaluation than traditional visual interpretation, but interpretation remains context-dependent, exploratory, and sensitive to sample heterogeneity. Future research should prioritize larger datasets and standardized protocols to further assess the diagnostic value of quantitative blotter spot indices in real-world applications. From a practical perspective, the proposed indices could complement existing oil monitoring protocols as a rapid and inexpensive screening method. Their role should be limited to preliminary assessment, with atypical results verified by laboratory analyses. For wider applicability, standardized procedures and validation on larger datasets are required.

6. Conclusions

This study assessed the diagnostic potential of paper chromatography in comparison with established physicochemical methods (viscosity and FTIR) for used engine oils. The proposed quantitative indicators (Wdd1, Wdd2, Wzm) showed only moderate correlations with laboratory parameters, which means that they cannot serve as reliable stand-alone substitutes for viscosity or FTIR analysis. Nevertheless, they reflect important aspects of oil condition, particularly dispersancy and contamination, and consistent associations with the share of urban driving confirm that stain-based indices are able to capture selected operational influences. Paper chromatography therefore proves most useful in field conditions, where rapid and low-cost diagnostics are required and where it can indicate atypical oil behavior that merits further laboratory verification. At the same time, the dimensional analysis of stains faces limitations such as the absence of visible cores or excessive saturation, which reduce reproducibility and underline the need for standardized protocols and refined measurement criteria. Overall, paper chromatography should be considered a complementary rather than alternative tool to laboratory analyses, with its future usefulness depending on validation with larger and more homogeneous datasets.

7. Limitations

Due to the limited number of observations compared to the number of variables studied, many statistical and econometric analyses, such as data clustering or linear regression, are not feasible. The subject is particularly challenging because both apparent and certain correlations need to be examined in terms of their chemical properties. Future research should prioritize increasing the sample size, which would not only allow for the application of more advanced analysis methods but also improve the accuracy of the analyses already conducted. With a larger number of observations, it is more likely that the studied variables and parameters will exhibit a normal distribution, enabling the use of more precise parametric tests.

Funding

The publication/article presents the results of Project nr 018/ZJB/2025/DOS financed from the subsidy granted to the Krakow University of Economics.

Institutional Review Board Statement

Not applicable.

Informed Consent Statement

Not applicable.

Data Availability Statement

All essential data are included in the article. Additional details are available on request from the corresponding author due to privacy protection related to vehicle owners.

Acknowledgments

The author would like to thank Filip Morzyk and Tomasz Masłowski for their engagement and valuable support in exploring this research topic.

Conflicts of Interest

The author declares no conflicts of interest.

Appendix A

Table A1. Selected parameters of research vehicles.
Oil Sample No.Car BrandCar ModelYear of ProductionEngine Displacement [cm3]Engine Power [HP]Fuel Type (Petrol/Diesel/LPG/Hybrid)Particulate Filter (DPF/GPF)-YES/NOVehicle Mileage
40HondaCivic X. gen.20171500182BNo60,600
41BMWX3 E8320072000150DYes293,500
42HondaCivic1998140090BNo228,000
43KiaSportage20201600132BYes14,100
44Mercedes-BenzE W21220113000271D No306,000
46Peugeot308 SW T920162000150DYes250,000
47BMWE92 330i20093000272BNo331,740
49AudiA720143000500BNo174,000
50FordFocus mk420181500182BNo87,000
52FiatPunto II2009124260BNo132,990
53FordKa mk22009124268BNo117,735
54HondaCR-V20132000155BNo65,000
56SkodaOctavia20211498150BYes16,700
57ToyotaPrius2012180099B/H/LPGNo317,000
58BMWE6020042993218DYes373,000
59ToyotaCorolla20191200116BNo65,700
60VolkswagenPassat B520001900116DNo367,500
63VolkswagenPassat B820161798180BNo147,840
65MazdaCX-320192000120BNo33,600
67SkodaOctavia20211968150DYes37,660
68VolvoV70 III20072400220DYes375,407
69FiatBravo20091368150BNo160,000
70SubaruImpreza20061998160B/LPGNo207,800
71ToyotaCorolla TS 20221987152B/HYes19,500
72SkodaSuperb20211988190BYes20,500
Table A2. Viscosity Parameters and Their Percentage Changes.
Oil Sample No.Viscosity at 40 °C [mm2/s]Viscosity at 100 °C [mm2/s]Viscosity Index [VI]Viscosity at 40 °C [mm2/s]Viscosity at 100 °C [mm2/s]Viscosity Index [VI]Viscosity at 40 °C [mm2/s]Viscosity at 100 °C [mm2/s]Viscosity Index [VI]
Fresh OilUsed OilPercentage Changes
4059.810.5165.451.79.5169.1−13%−9%2%
4167.411.8172.558.111.1187.5−14%−6%9%
4277.212.9168.069.412.3176.2−10%−5%5%
4358.410.5171.245.58.9180.8−22%−15%6%
4460.411.8195.861.512.1199.12%3%2%
4653.110.5191.049.39.8191.0−7%−6%0%
4785.614.2171.874.212.6169.5−13%−11%−1%
4988.714.2166.470.612.2172.2−20%−14%3%
5046.98.5160.541.27.8164.0−12%−8%2%
5280.713.4169.483.714.4166.94%7%−1%
5388.514.6172.658.010.7177.8−34%−27%3%
5456.510.5178.747.79.3182.9−16%−11%2%
5667.211.9175.463.711.5176.5−5%−4%1%
5741.98.0165.738.97.8177.3−7%−2%7%
5888.614.4169.665.711.7175.5−26%−19%3%
5936.88.6222.430.56.8189.3−17%−21%−15%
6088.314.5171.376.412.9170.3−14%−11%−1%
6365.111.7176.459.710.9176.4−8%−7%0%
6557.010.2167.744.78.6172.2−21%−16%3%
6739.87.9176.034.27.3187.9−14%−7%7%
6867.411.1156.958.110.1163.2−14%−9%4%
6984.513.8168.268.711.8168.0−19%−15%0%
7079.212.9164.574.812.4163.7−6%−5%0%
7131.06.9193.325.95.9181.6−16%−15%−6%
7243.78.2164.643.18.2170.1−2%1%3%
Table A3. Chemical parameters of engine oils.
Oil Sample No.Antioxidation DegradationEP DegradationAdditives/Base Oil~1520Debris ~3000–3100Debris ~3150–3700Sulfonation LevelNitration LevelOxidation LevelViscosity Modificators ~1747Fuel ~1590
abs/0.1mmIntegrated Area (abs·cm−1)abs/0.1mm
40−0.02−0.08−0.174.123.390.130.120.07−0.120.08
41−0.02−0.12−0.082.000.000.170.140.000.320.11
42−0.01−0.06−0.093.403.120.240.220.140.000.14
430.00−0.13−0.094.467.850.200.200.130.150.14
44−0.01−0.03−0.010.000.000.070.010.000.160.02
460.00−0.01−0.030.362.610.040.050.030.110.02
470.00−0.13−0.100.844.200.220.220.120.000.09
490.00−0.10−0.083.590.000.150.170.080.080.16
500.00−0.09−0.052.803.660.120.100.040.030.09
520.00−0.17−0.075.5516.330.430.410.230.260.20
530.00−0.16−0.0911.8417.590.370.330.210.270.18
540.00−0.07−0.073.855.540.150.160.080.180.15
56−0.05−0.14−0.142.674.400.140.150.11−0.110.07
57−0.03−0.06−0.061.184.550.030.09−0.02−0.110.05
58−0.01−0.05−0.062.38−1.100.140.090.090.250.08
59−0.03−0.10−0.135.9810.740.040.12−0.300.000.06
600.00−0.08−0.050.006.320.100.120.080.090.11
63−0.02−0.12−0.094.154.130.150.160.08−0.530.11
65−0.01−0.070.054.772.610.100.140.080.040.15
67−0.02−0.11−0.081.233.750.110.100.070.170.10
68−0.01−0.09−0.070.21−4.940.110.080.080.180.07
690.00−0.07−0.085.239.620.330.280.150.000.10
700.00−0.09−0.110.000.000.100.160.00−0.290.14
71−0.02−0.05−0.064.467.390.060.070.000.000.09
72−0.05−0.06−0.073.396.350.070.100.050.000.05
Figure A1. FTIR spectra of the fresh oils (600–4000 cm−1).
Applsci 15 11023 g0a1
Figure A2. FTIR spectra of the fresh oils (600–2000 cm−1).
Applsci 15 11023 g0a2
Figure A3. FTIR spectra of the used oils (600–2000 cm−1).
Applsci 15 11023 g0a3
Figure A4. FTIR spectra of the used oils (600–4000 cm−1).
Applsci 15 11023 g0a4
Figure A5. The differential spectra for the examined oils cover the range of 600–2000 cm−1.
Applsci 15 11023 g0a5
Figure A6. The differential spectra for the examined oils cover the range of 600–4000 cm−1.
Applsci 15 11023 g0a6

References

  1. Furch, J.; Konečný, V.; Krobot, Z. Modelling of Life Cycle Cost of Conventional and Alternative Vehicles. Sci. Rep. 2022, 12, 10661. [Google Scholar] [CrossRef] [PubMed]
  2. Apicella, B.; Catapano, F.; Di Iorio, S.; Magno, A.; Russo, C.; Sementa, P.; Tregrossi, A.; Vaglieco, B.M. Comprehensive Analysis on the Effect of Lube Oil on Particle Emissions through Gas Exhaust Measurement and Chemical Characterization of Condensed Exhaust from a DI SI Engine Fueled with Hydrogen. Part 2: Effect of Operating Conditions. Int. J. Hydrogen Energy 2024, 48, 22277–22287. [Google Scholar] [CrossRef]
  3. Nassar, A.M.; Ahmed, N.S.; Abdel-Hameed, H.S.; El-Kafrawy, A.F. Synthesis and Utilization of Non-Metallic Detergent/Dispersant and Antioxidant Additives for Lubricating Engine Oil. Tribol. Int. 2016, 93, 297–305. [Google Scholar] [CrossRef]
  4. Leonor, F.; Borda, G.; Jos, S.; Oliveira, D.; Maria, L.; Monteiro, S.; Jose, A.; Kalab, L. Experimental Investigation of the Tribological Behavior of Lubricants with Additive Containing Copper Nanoparticles. Tribol. Int. 2018, 117, 52–58. [Google Scholar] [CrossRef]
  5. Dörr, N.; Brenner, J.; Ristić, A.; Ronai, B.; Besser, C.; Pejaković, V.; Frauscher, M. Correlation Between Engine Oil Degradation, Tribochemistry, and Tribological Behavior with Focus on ZDDP Deterioration. Tribol. Lett. 2019, 67, 62. [Google Scholar] [CrossRef]
  6. Agocs, A.; Nagy, A.L.; Ristic, A.; Tabakov, Z.M.; Raffai, P.; Besser, C.; Frauscher, M. Oil Degradation Patterns in Diesel and Petrol Engines Observed in the Field—An Approach Applying Mass Spectrometry. Lubricants 2023, 11, 404. [Google Scholar] [CrossRef]
  7. Nguele, R.; Al-Salim, H.S.; Mohammad, K. Modeling and Forecasting of Depletion of Additives in Car Engine Oils Using Attenuated Total Reflectance Fast Transform Infrared Spectroscopy. Lubricants 2014, 2, 206–222. [Google Scholar] [CrossRef]
  8. Zając, G.; Gołębiowski, W.; Szczepanik, M.; Wolak, A.; Sejkorová, M. Analysis of Changes in Soot Content in Engine Oils under Operating Conditions. Lubricants 2023, 11, 89. [Google Scholar] [CrossRef]
  9. Al Sheikh Omar, A.; Motamen Salehi, F.; Farooq, U.; Morina, A.; Neville, A. Chemical and Physical Assessment of Engine Oils Degradation and Additive Depletion by Soot. Tribol. Int. 2021, 160, 107054. [Google Scholar] [CrossRef]
  10. Johnson, M.D.; McCabe, R.W.; Hubbard, C.P.; Riley, M.J.; Kirby, C.W.; Ball, D.J.; Tripp, G.; McDonnell, T.F.; Lam, W.Y. Effects of Engine Oil Formulation Variables on Exhaust Emissions in Taxi Fleet Service; In Proceedings of the SAE Technical Papers; SAE International: Troy, Turkey, 2002. [Google Scholar]
  11. Macián, V.; Tormos, B.; Olmeda, P.; Gómez, Y.A. Findings from a Fleet Test on the Performance of Two Engine Oil Formulations in Automotive CNG Engines. Lubr. Sci. 2015, 27, 15–28. [Google Scholar] [CrossRef]
  12. Wolak, A.; Krasodomski, W.; Zając, G. FTIR Analysis and Monitoring of Used Synthetic Oils Operated under Similar Driving Conditions. Friction 2019, 8, 995–1006. [Google Scholar] [CrossRef]
  13. Shinde, H.M.; Bewoor, A.K. Evaluating Petrol Engine Oil Deterioration through Oxidation and Nitration Parameters by Low-Cost IR Sensor. Appl. Petrochemical Res. 2020, 10, 83–94. [Google Scholar] [CrossRef]
  14. Shalygin, M.; Vashchishin, S.; Vashchishina, A. Study of Physico-Chemical and anti-wear properties of motor oils at the end of operation. Transp. Eng. 2024, 12–19. [Google Scholar] [CrossRef]
  15. Dörr, N.; Agocs, A.; Besser, C.; Ristić, A.; Frauscher, M. Engine Oils in the Field: A Comprehensive Chemical Assessment of Engine Oil Degradation in a Passenger Car. Tribol. Lett. 2019, 67, 68. [Google Scholar] [CrossRef]
  16. Agocs, A.; Nagy, A.L.; Tabakov, Z.; Perger, J.; Rohde-Brandenburger, J.; Schandl, M.; Besser, C.; Dörr, N. Comprehensive Assessment of Oil Degradation Patterns in Petrol and Diesel Engines Observed in a Field Test with Passenger Cars—Conventional Oil Analysis and Fuel Dilution. Tribol. Int. 2021, 161, 107079. [Google Scholar] [CrossRef]
  17. Gołębiowski, W.; Wolak, A.; Zając, G. Definition of Oil Change Intervals Based on the Analysis of Selected Physicochemical Properties of Used Engine Oils. Combust. Engines 2018, 172, 1–7. [Google Scholar] [CrossRef] [PubMed]
  18. Amrani, M.A.; Haddad, Y.; Abdulhameed, M.; Hyder, O.S.; Saif, A.; Ghaleb, A.M.; Mejjaouli, S. A Lubricating Oil-Based Maintenance for Diesel Engines at the End-User: An Effective Predictive Approach. Jordan J. Mech. Ind. Eng. 2022, 16, 689–700. [Google Scholar]
  19. Buses, U.; Raposo, H.; Farinha, T.; Ferreira, L.A. Condition Monitoring with Prediction Based on Diesel Engine Oil Analysis: A Case Study for urban buses. Actuators 2019, 8, 14. [Google Scholar] [CrossRef]
  20. Rodrigues, J.; Costa, I.; Farinha, J.T.; Mendes, M.; Margalho, L. Predicting Motor Oil Condition Using Artificial Neural Networks and Principal Component Analysis. Eksploat. I Niezawodn. 2020, 22, 440–448. [Google Scholar] [CrossRef]
  21. Zhu, X.; Zhong, C.; Zhe, J. Lubricating Oil Conditioning Sensors for Online Machine Health Monitoring—A Review. Tribol. Int. 2017, 109, 473–484. [Google Scholar] [CrossRef]
  22. Vasanthan, B.; Devaradjane, G.; Shanmugam, V. Online Condition Monitoring of Lubricating Oil on Test Bench Diesel Engine & Vehicle. J. Chem. Pharm. Sci. 2015, 4, 315–320. [Google Scholar]
  23. Zhang, R.; Howard, K.; Kirkman, P.; Browne, D.; Lu, Z.; He, S.; Boger, T. A Study into the Impact of Engine Oil on Gasoline Particulate Filter Performance through a Real-World Fleet Test; In Proceedings of the SAE Technical Papers; SAE International: Troy, Turkey, 2019. [Google Scholar]
  24. Molenda, J.; Wolak, A.; Zając, G.; Cieloch, P.; Chudy, D. Assessment of the Suitability of Paper Chromatography for Quick Diagnostics of the Operating Condition of Engine Oil. Eksploat. I Niezawodn. 2023, 25, 162912. [Google Scholar] [CrossRef]
  25. Bulauka, Y.; Mialeshka, A. Analysis of the Efficiency of Rapid-Tests to Determine the Time to Replace Used Engine oil. Her. Polotsk State Univ. Ser. B Ind. Appl. Sci. 2023, 1, 100–107. [Google Scholar] [CrossRef]
  26. Gryazin, V.; Bagautdinov, I.; Kozlov, K.; Belogusev, V. Tool for Quality Control of Lubricants. In Proceedings of the Engineering for Rural Development, Jelgava, Latvia, 23–25 May 2018. [Google Scholar]
  27. Fygueroa, S.; Serrano, M.; Moreno, G. Engine Predictive Maintenance Thru Oil Analisys. Rev. Colomb. Tecnol. Av. 2009, 1, 91–96. [Google Scholar]
  28. ASTM E2412; Standard Practice for Condition Monitoring of Used Lubricants by Trend Analysis Using Fourier Transform Infrared (FT-IR) Spectrometry. ASTM International: West Conshohocken, PA, USA, 2019.
  29. ASTM D7042; Standard Test Method for Dynamic Viscosity and Density of Liquids by Stabinger Viscometer (and the Calculation of Kinematic Viscosity). ASTM International: West Conshohocken, PA, USA, 2013.
  30. ASTM D7899-19; Standard Test Method for Measuring the Merit of Dispersancy of In-Service Engine Oils with Blotter Spot Method. ASTM International: West Conshohocken, PA, USA, 2019.
Disclaimer/Publisher’s Note: The statements, opinions and data contained in all publications are solely those of the individual author(s) and contributor(s) and not of MDPI and/or the editor(s). MDPI and/or the editor(s) disclaim responsibility for any injury to people or property resulting from any ideas, methods, instructions or products referred to in the content.
Figure 1. Diagram of the names of individual zones of chromatographic separation of oil on a filter tissue. Explanations of the numbered zones are provided in Table 2.
Applsci 15 11023 g001
Figure 2. K-means clustering method.
Applsci 15 11023 g002
Figure 3. Dendritic (hierarchical) clustering method—physicochemical parameters.
Applsci 15 11023 g003
Figure 4. Dendritic (hierarchical) clustering method—chromatographic method.
Applsci 15 11023 g004
Figure 5. Correlation between Wdd1 and Urban Driving (%).
Applsci 15 11023 g005
Figure 6. Correlation between Wdd2 and Urban Driving (%).
Applsci 15 11023 g006
Figure 7. Correlation between d and Urban Driving (%).
Applsci 15 11023 g007
Table 1. Interpretation of the oil fractionation method during paper chromatography as recommended by test manufacturers.
Type of Engine Oil ContaminationExample of a Paper Chromatography Test After An Oil TestDescription of the Observation
FuelApplsci 15 11023 i001A pale ring will form around the outermost edge that can be observed after just 1 min from the application of oil to the test paper.
Soot and/or solidsApplsci 15 11023 i002The particles will form a black stain marking the deposition site (in the center). If the dispersing additives are working properly, fine soot particles will easily penetrate toward the outside of the applied droplet, blurring the boundaries between individual fraction areas.
WaterApplsci 15 11023 i003Ragged edges form on one of the inner circles.
Source: www.motorcheckup.com (accessed on 10 September 2025).
Table 2. Markings of the analyzed parameters of individual zones of chromatographic separations on tissue filters.
DesignationDescription
1, d1 (core zone)The central part of the stain, referred to as the core, contains heavy contaminants that are poorly soluble in the oil. It is characterized by the smallest diameter (d1) and typically appears as the darkest and most concentrated area.
2, d (marginal zone)The marginal zone surrounds the core and has a larger diameter (d). As oil additives degrade during engine operation, an increasing amount of insoluble deposits forms, causing the marginal zone to expand outward. The diameter of this zone (d) is always greater than that of the core (d1), and its presence is indicative of the accumulation of suspended impurities that are no longer effectively dispersed.
3, D diffusion (or dispersion) zoneThis zone contains contaminants that are easily soluble in the oil and migrate further outward due to capillary action. It is characterized by a lighter coloration and represents the widest distinct ring of the stain, typically forming a smooth gradient from the center.
4 (clean oil zone)In some cases, an additional outer zone may be visible, corresponding to clean oil. However, this zone is not always present. When fuel contamination occurs, the visual signal of clean oil may overlap with that of fuel presence, or a separate, most external ring may emerge, indicating fuel dilution within the sample.
Table 3. Viscosity Parameters.
Oil Sample No.Viscosity at 40 °C [mm2/s] Viscosity at 100 °C [mm2/s]Viscosity Index [VI]
Used Oil
4051.79.5169.1
4158.111.1187.5
4269.412.3176.2
4345.58.9180.8
4461.512.1199.1
4649.39.8191.0
4774.212.6169.5
4970.612.2172.2
5041.27.8164.0
5283.714.4166.9
5358.010.7177.8
5447.79.3182.9
5663.711.5176.5
5738.97.8177.3
5865.711.7175.5
5930.56.8189.3
6076.412.9170.3
6359.710.9176.4
6544.78.6172.2
6734.27.3187.9
6858.110.1163.2
6968.711.8168.0
7074.812.4163.7
7125.95.9181.6
7243.18.2170.1
Table 4. FTIR differential spectra analysis (oxidation, nitration, sulfonation level).
Oil Sample No.Oxidation LevelNitration LevelSulfonation Level
cm−1abs/0.1 mmcm−1abs/0.1 mmcm−1abs/0.1 mm
40~17200.07~16300.12~11500.13
410.000.140.17
420.140.220.24
430.130.200.20
440.000.010.07
460.030.050.04
470.120.220.22
490.080.170.15
500.040.100.12
520.230.410.43
530.210.330.37
540.080.160.15
560.110.150.14
57−0.020.090.03
580.090.090.14
59−0.300.120.04
600.080.120.10
630.080.160.15
650.080.140.10
670.070.100.11
680.080.080.11
690.150.280.33
700.000.160.10
710.000.070.06
720.050.100.07
Table 5. Numerical Characterization from Paper Chromatography.
Oil Sample No.d1dD2Wdd1Wdd2Wzm
401.351.353.250.832.411.00
410.002.902.900.001.000.00
421.001.652.200.441.330.61
430.701.352.700.752.000.52
440.401.552.850.701.840.26
460.001.753.450.741.970.00
471.151.603.100.731.940.72
491.351.652.950.691.790.82
500.901.453.200.792.210.62
521.001.853.000.621.620.54
530.550.802.700.913.380.69
540.351.503.400.812.270.23
560.001.152.400.772.090.00
570.001.553.350.792.160.00
581.602.603.150.321.210.62
591.151.653.300.752.000.70
600.002.403.250.451.350.00
630.751.603.050.721.910.47
650.901.452.800.731.930.62
670.002.102.800.441.330.00
680.801.703.150.711.850.47
690.001.603.050.721.910.47
700.801.453.300.812.280.55
710.002.053.450.651.680.00
720.001.203.050.852.540.00
Table 6. Summary of the results of paper chromatography.
Applsci 15 11023 i004
#40
Applsci 15 11023 i005
#41
Applsci 15 11023 i006
#42
Applsci 15 11023 i007
#43
Applsci 15 11023 i008
#44
Applsci 15 11023 i009
#46
Applsci 15 11023 i010
#47
Applsci 15 11023 i011
#49
Applsci 15 11023 i012
#50
Applsci 15 11023 i013
#52
Applsci 15 11023 i014
#53
Applsci 15 11023 i015
#54
Applsci 15 11023 i016
#56
Applsci 15 11023 i017
#57
Applsci 15 11023 i018
#58
Applsci 15 11023 i019
#59
Applsci 15 11023 i020
#60
Applsci 15 11023 i021
#63
Applsci 15 11023 i022
#65
Applsci 15 11023 i023
#67
Applsci 15 11023 i024
#68
Applsci 15 11023 i025
#69
Applsci 15 11023 i026
#70
Applsci 15 11023 i027
#71
Applsci 15 11023 i028
#72
# indicates sample numbering.