Article

Prediction of Spatial Distribution of Soil Heavy Metal Pollution Using Integrated Geochemistry and Three-Dimensional Electrical Resistivity Tomography

1
Ecology Geological Survey and Monitoring Institute of Hunan Province, Changsha 410119, China
2
School of Geosciences and Info-Physics, Central South University, Changsha 410083, China
*
Author to whom correspondence should be addressed.
Appl. Sci. 2025, 15(20), 10969; https://doi.org/10.3390/app152010969
Submission received: 30 August 2025 / Revised: 4 October 2025 / Accepted: 8 October 2025 / Published: 13 October 2025

Abstract

Soil heavy metal contamination poses a serious threat to soil ecosystems and human health. Geochemistry is often used in soil heavy metal contamination research to identify pollution sources, identify elemental cycling mechanisms, and assess the spatial distribution and risk of contamination. However, it is difficult to directly reflect the spatial continuity and deep distribution patterns of contamination. Three-dimensional electrical resistivity tomography (3D ERT) technology often indirectly predicts the distribution of soil contamination by leveraging the electrical structure of the subsurface medium. However, many factors influence this electrical structure, leading to biased predictions. This paper combines geochemistry with 3D ERT technology. A nonlinear statistical model is established based on the geochemical analysis results and resistivity of soil samples. A 3D ERT model is then constructed. This model is used to further investigate the spatial distribution patterns of soil heavy metal contamination and assess the extent of contamination. This study investigated soil sample collection and chemical analysis of heavy metal content at a heavy metal contaminated site in Hunan Province. Antimony contamination was particularly severe in the soil. The 3D ERT data collection and inversion imaging were performed in the soil sample collection area. A 3D ERT model was established to analyze and evaluate the distribution range and extent of antimony contamination in the area. Comparing the antimony content predicted by the model with the actual test data, the results show that the error range is 0.6–16.6%, and the average error is 5.8%. The model has high accuracy, achieving good overall prediction and evaluation results.

1. Introduction

Soil is an important component of the Earth’s surface system, carrying key functions for agricultural production, ecological balance, and human health. However, with the accelerated advancement of industrialization, urbanization, and agricultural intensification, soil heavy metal pollution has become a global environmental problem. Heavy metals (such as copper (Cu), zinc (Zn), nickel (Ni), antimony (Sb), thallium (Tl), cadmium (Cd), lead (Pb), etc.) pose a serious threat to soil ecosystems and human health due to their strong toxicity, difficulty in degradation, and bioaccumulation [1]. Especially for the heavy metal Sb, it is a global pollutant that is transported over long distances and is already widely present in the soil environment. However, compared with other toxic metals (such as Cd, Pb, Hg, etc.), there are relatively few studies on Sb [2]. The spatial distribution of heavy metal pollution in soil is highly heterogeneous and is affected by geological background, land use patterns, and pollution sources (such as mines, factories, and pesticide application) [3]. Traditional geochemical methods have been widely used in the study of heavy metal pollution in soil. Some studies focus on tracing pollution sources and element circulation mechanisms [4,5]. Some studies focus more on the spatial distribution and risk assessment of pollution [6]. However, geochemical methods mostly rely on large-scale sampling and laboratory analysis, which have problems such as high cost, low efficiency, and insufficient spatial resolution [7,8,9]. The discrete point element data provided struggle to reflect the spatial continuity and deep distribution patterns of pollution [10].
As a non-invasive geophysical detection technology, three-dimensional electrical resistivity tomography (3D ERT) can effectively characterize soil physical properties and pollution distribution by measuring the surface electric field distribution and inverting the resistivity structure of the underground medium [11], making it an ideal tool for depicting the spatial distribution of pollution. The technology used for 3D ERT has developed rapidly in the field of environmental geophysics and is widely used in groundwater pollution, landfill leakage, and soil salinization monitoring [12]. Binley et al. (2019) used 3D ERT combined with chemical analysis to successfully depict the three-dimensional distribution of heavy metal pollution clusters in groundwater at a contaminated site in the UK [13]. Han Mingzhe et al. (2023) applied 3D ERT in a chemical park in East China, combined with soil sampling, to identify the deep extension path of Cr and Ni pollution [14]. However, 3D ERT still faces challenges in inversion accuracy and integration with chemical data in the study of soil heavy metal pollution. The inversion results of a single 3D ERT can only be interpreted qualitatively and need to be combined with geochemical analysis data for quantitative research [15].
The combined application of geochemistry and 3D ERT is still in the exploratory stage. Some researchers have tried to combine the two. For example, Caterina et al. (2021) constructed a three-dimensional pollution model of a contaminated site in Belgium by jointly inverting 3D ERT and geochemical data [16]. In general, research in this area mainly focuses on simple overlay analysis and lacks a systematic technical system [17].
The combination of comprehensive geochemistry and 3D ERT tomography provides a new approach to predicting the spatial distribution of heavy metal pollution in soil. This study focuses on the spatial distribution characteristics of heavy metal pollution in soil under complex geological conditions and examines the following three aspects: (1) Geochemical sample collection and testing: using a “surface + deep” stratified sampling system, combined with ICP-MS, AFS and pH determination, we obtained the concentrations of heavy metals such as Cu, Zn, Ni, Sb, Tl, Cd, Pb, Hg, as well as soil physical and chemical indicators, to provide data support for pollution source analysis. (2) 3D ERT: by optimizing electrode layout and inversion algorithm [18], we constructed a three-dimensional distribution model of soil resistivity to reveal the spatial morphology of pollution clusters. (3) Statistical model construction and analysis: using multivariate statistical methods, we integrated geochemical and resistivity data, and predicted the spatial distribution of heavy metal pollution through field verification and application.
High-precision heavy metal concentration data are obtained through geochemical analysis and combined with ERT to reveal the three-dimensional electrical structure of pollution. The two complement each other’s advantages [19], and a technical framework of “stratified sampling + multi-method joint inspection + three-dimensional resistivity imaging” is constructed. A prediction method combining comprehensive geochemistry and three-dimensional resistivity tomography is proposed, which can realize the characterization of pollution characteristics from point to three-dimensional space, significantly improve the efficiency and accuracy of pollution monitoring, and provide a scientific basis for the control of soil heavy metal pollution. This multidisciplinary method has important application value in environmental monitoring, pollution control, and risk assessment [20].

2. Geochemical Sample Collection and Testing

Crucial for revealing the spatial distribution of heavy metal contamination in soil, this study addresses the need for multi-target pollution monitoring under complex geological conditions by developing a “stratified sampling + multi-method joint testing” technical framework. By systematically optimizing sampling strategies and testing processes, high-precision quantitative analysis of heavy metal elements and pollution source tracing are achieved. This chapter focuses on differentiated collection strategies for surface and deep samples and multi-dimensional testing methods, providing a reliable data foundation for subsequent 3D ERT.

2.1. Sample Collection Method

2.1.1. Sampling Point Layout

Sampling was conducted at a heavy metal-contaminated site in Hunan. The site’s historical use included a solid waste disposal area for antimony products covering a total area of 8002.2 m2, including a key contaminated area of approximately 1700 m2. Geological Overview: The upper portion of the site consists of Quaternary (Q) miscellaneous fill and sandy clay, while the underlying bedrock is sandy slate of the Banxi Group (Pt) (Figure 1).
Combined with the geological map of the study area, the current land use map, and the distribution characteristics of pollution sources, random sampling was carried out in the key contaminated area. Nineteen sampling sites were located, with an average sampling density greater than 1 site per 100 m2. Fourteen sites collected surface samples only, numbered T1, T2, T7, T8, T9, T10, T11, T12, T13, T14, T15, T16, T17, and 1c01. In order to facilitate comparative analysis of geological profiles, 5 points were selected to collect surface and deep samples, numbered 1b01, 1b02, 1b03, 1c02, and 1c03. Deep sampling was conducted at two to three depth gradients along the vertical profile, with an average vertical sampling spacing of approximately 3 m (Figure 2).

2.1.2. Surface Sample Collection Technology

Equipment configuration: Equipped with a 1.5 m long wooden-handled shovel, a wooden shovel (made of dry hardwood), a polyethylene sampling bag (cleanliness reaches food grade), a label printer, and a handheld GPS locator.
Operational procedures: ① Clean the surface: With the sampling point as the center, remove vegetation debris, gravel and topsoil within a radius of 50 cm, with the removal depth ≥ 40 cm. ② Vertical cutting: Use a shovel to cut into the soil in the vertical direction to a depth of 50 cm, keeping the cut surface flat and free of extrusion and deformation. ③ Surface peeling: Use a wooden shovel to scrape off the disturbed layer (about 2–3 mm thick) in contact with the metal tool, and retain the original soil core [21]. ④ Packaging and storage: Collect 1 kg of sample and place it in a double-layer PE bag, and deliver it to the laboratory within 48 h.
Quality control: A total of 3 parallel samples were set up.

2.1.3. Deep Sample Collection Technology

Drilling system: XY-100 hydraulic impact drill rig equipped with Φ110 mm diamond drill bit and PVC double-layer casing [22].
Sampling technology: After collecting surface samples at −0.5 m, deep samples are collected. Casing is followed throughout the entire process, and the drill bit is replaced every 3 m. Near the depth where the drill bit is replaced, samples are collected at the specified depth, with sampling depths of −3 m, −6.5 m, and −9 m.
Quality control: Set up one parallel sample for each sampling depth and check the cleanliness of the drill tool before each sampling.

2.2. Multi-Dimensional Testing Method

2.2.1. Air Drying and Grinding

Air drying conditions: Lay flat in a clean fume hood (thickness ≤ 5 mm), keep away from light and at a constant temperature (25 ± 2 °C), and turn over every 12 h.
Grinding conditions: Grinding medium: zirconia balls (5 mm diameter); ball-to-material ratio: 5:1 (mass ratio); grinding time: single cycle no more than 3 min to prevent heating.
Grinding process: After coarse grinding, the sample is passed through a 2 mm nylon sieve; all the sieved samples are placed on a colorless polyethylene film and thoroughly stirred. Then, two portions are taken using the quartering method, one for pH testing and the other for further fine grinding: the agate mortar is gradually ground to 100 mesh (particle size < 149 μm) for heavy metal element detection.

2.2.2. Inductively Coupled Plasma Mass Spectrometry (ICP-MS)

Sample digestion: Weigh 0.1 g (accurate to 0.1 mg) of sample into a microwave digestion jar, drip a small amount of experimental water along the inner wall to moisten the sample, add 9 mL of nitric acid and 3 mL of hydrochloric acid, mix thoroughly and react smoothly, then tighten the lid and place the digestion jar into the microwave digestion instrument. Perform microwave digestion according to the heating program in Table 1 [23]. After digestion, cool to room temperature.
Mass spectrometer parameters: RF power: 1550 W; sampling cone and skimmer cone material: Pt; carrier gas flow rate: 0.96 L/min; cooling gas flow rate: 15 L/min; detection mode: peak skipping, automatic measurement 3 times.
Calibration curve: Standard solution series: 0, 1, 5, 10, 20, 50 μg/L; internal standard elements: Rh (10 μg/L), Re (10 μg/L); mass number selection: Cu(63), Zn(66), Ni(60), Sb(121), Tl(205), Cd(111), and Pb(208).
Quality control: Blank < detection limit. Detection limits: Cu (0.7 mg/kg), Zn (5 mg/kg), Ni (2 mg/kg), Sb (0.3 mg/kg), Tl (0.02 mg/kg), Cd (0.03 mg/kg), and Pb (1 mg/kg). The certified reference materials number is GBW07387, with certified values and uncertainties: Cu (37 ± 2 mg/kg), Zn (104 ± 3 mg/kg), Ni (41 ± 3 mg/kg), Tl (0.70 ± 0.03 mg/kg), Cd (0.34 ± 0.02 mg/kg), and Pb (28 ± 3 mg/kg). The certified reference materials number is GBW07406, with certified values and uncertainties: Sb (60 ± 7 mg/kg). The quality control samples of certified reference materials are within the uncertainty range.

2.2.3. Atomic Fluorescence Spectrometry (AFS)

Sample digestion: Weigh 0.2 g (accurate to 0.2 mg) of sample into a stoppered colorimetric tube, add 10 mL of aqua regia (a mixture of 3 parts of concentrated hydrochloric acid and 1 part of concentrated nitric acid), stopper the tube and shake well, digest in a boiling water bath for 2 h, remove and cool to room temperature [24].
Atomic fluorescence spectrophotometer instrument parameters: Negative high voltage: 280 V; heating temperature: 200°; A channel lamp current: 35 mA; observation height: 8 mm; carrier gas flow rate: 300 mL/min; measurement repetition number: 2 times.
Calibration curve: Standard solution series: 0.0, 0.2, 0.4, 0.8, 1.2, 2.0, 4.0 μg/L,
Quality control: Blank < detection limit. Detection limit: Hg (0.002 mg/kg). The certified reference materials number is GBW07387, with certified values and uncertainties: Hg (0.081 ± 0.009 mg/kg). The quality control samples of certified reference materials are within the uncertainty range.

2.2.4. Potentiometric Determination of pH

pH meter instrument parameters: Stirring rate: 120 rpm; standing time: 30 min; temperature compensation: automatic correction to 25 °C [25].
Quality control: Three replicates were measured for each batch of samples; standard buffer verification (pH 4.01, 6.86, 9.18); electrode slope check (>95%). The certified reference materials number is GBW07415a, with certified values and uncertainties: pH (6.08 ± 0.06). The quality control samples of certified reference materials are within the uncertainty range.
The geochemical samples adopted a “shallow + deep” stratified sampling system, and combined detection technologies for sample detection: ICP-MS, AFS and potentiometric determination complement each other’s advantages to achieve efficient detection of 8 heavy metals + 1 physical and chemical index. A “sampling-detection” full-chain quality control system was established to ensure the reliability of the data and provide a solid data foundation for subsequent three-dimensional resistivity imaging and pollution prediction.

3. 3D ERT Methods and Technologies

3.1. Data Collection Method

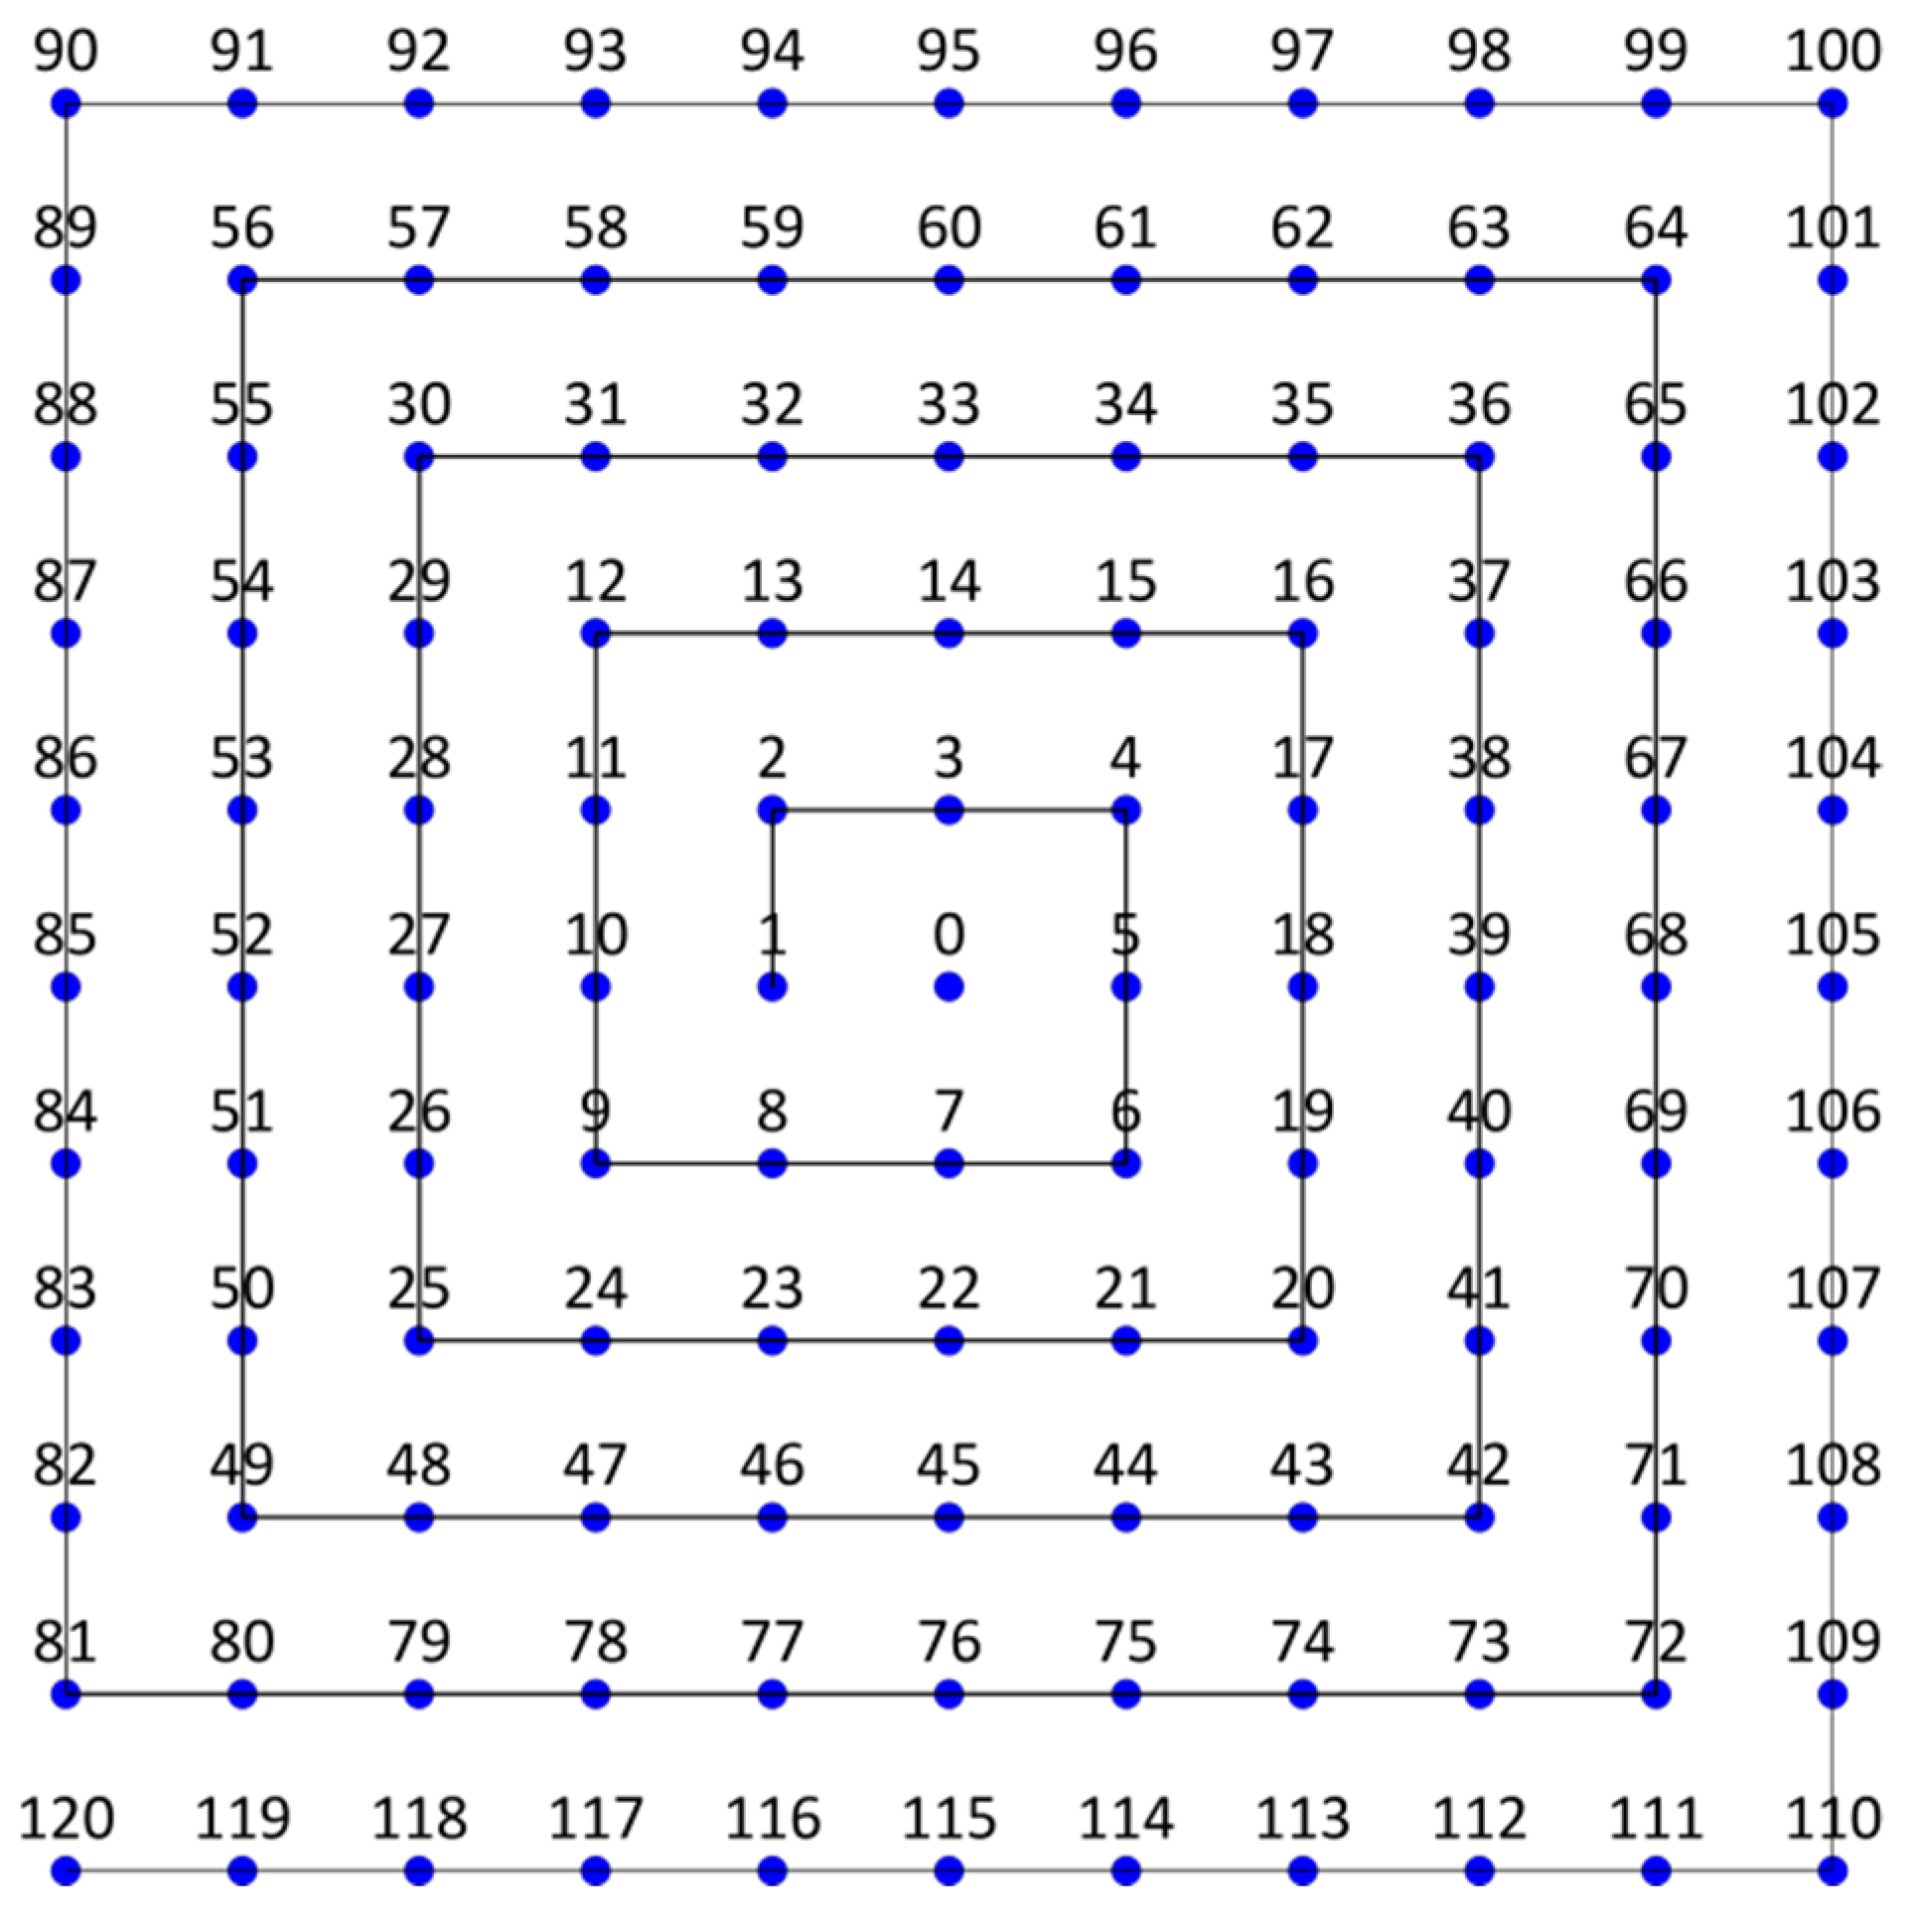
To obtain electrical information in the three-dimensional underground space, an electrode array is laid out in a planar pattern on the surface. Data collection utilizes a three-pole observation setup. The following illustrates the data collection method using a 120-electrode array. First, the 120 electrodes are laid out in a spiral pattern on the surface at 2-m intervals. Electrode 0, serving as the reference electrode for potential measurement, is located in the center of the electrode array, as shown in Figure 3. The negative power supply electrode, B, is positioned further away as the infinity pole. The transmitting system A i   ( i = 1 , 2 , , 120 ) supplies power to the ground through the positive power supply electrode and records the transmitted current in real time. The receiving system sequentially collects the potential difference signals M j M 0   ( j = 1 , 2 , , 120 , j i ) between the electrode pairs. The total number of observation data points is 119 × 120 = 14,280.
Electrode array configuration: A total of 120 stainless steel electrodes arranged in a 10 × 10 grid (2 m spacing), covering an area of 20 m × 20 m (Figure 3). The negative power supply electrode, B, was 300 m from the array boundary.

3.2. 3D Resistivity Inversion

In 3D resistivity inversion, in order to ensure the stability of the inversion process, it is necessary to impose smoothness and background constraints on the geoelectric model and construct the objective function of resistivity inversion in the sense of least squares [26,27,28]:
Φ = d a d c 2 2 + λ s C m 2 2 + λ b I m m b 2 2
where d a is the observed data vector; d c is the simulated data vector; m is the model parameter vector; m b is the background or known model parameter vector; C is the smoothness matrix; I is the identity matrix; and λ c and λ b are the regularization factors for the smoothness and background constraints, respectively.
By taking the derivative of both ends of m Equation (1) and setting it equal to zero, we can get the linear equation for resistivity inversion:
J T J + λ c C T C + λ b I Δ m = J T Δ d λ c C T C m + λ b I m b m
where J is the partial derivative matrix and Δ m is the model correction vector.
The least squares conjugate gradient method is used to solve Equation (2) [29] to obtain the model correction value Δ m , which is substituted into the model parameter update formula
m k + 1 = m k + Δ m
The new model parameter vector m k + 1 is obtained, in which k is the iteration number. After multiple iterations, until the number of iterations or the data fitting error meets the termination condition, the m k + 1 inverted resistivity model is obtained.
During the inversion of this measured data, the initial smoothness constraint factor λ c = 0.5 , the background constraint factor λ b = 0.05 , and the inversion iterations were repeated six times as the termination condition. The model’s horizontal grid cells were set to 1 m × 1 m, with 0.5 m vertical grid cells at depths of 0–5 m and 1 m vertical grid cells at depths of 5–10 m. The maximum detection depth was set to 10 m.

4. Statistical Model Construction and Analysis

4.1. Site Pollution Level Assessment

4.1.1. Chemical Test Results

pH test results of the samples were all greater than 5.5. The heavy metal test results of the surface samples are shown in Table 2. According to the “Soil Environmental Quality Agricultural Land Soil Pollution Risk Control Standard” [30], when the pH of the sample is greater than 5.5, the soil pollution risk screening value is as follows: Copper(Cu) ≤ 50 mg/kg, Zinc(Zn) ≤ 200 mg/kg, Nickel(Ni) ≤ 70 mg/kg, Antimony (Sb) ≤ 180 mg/kg, Thallium(Tl) ≤ 1 mg/kg, Cadmium(Cd) ≤ 0.3 mg/kg, Mercury(Hg) ≤ 1.8 mg/kg, and Lead(Pb) ≤ 90 mg/kg. Therefore, the heavy metals copper, zinc, nickel, thallium, cadmium, mercury, and lead in the site did not exceed the screening value, and the heavy metal antimony exceeded the screening value.

4.1.2. Pollution Degree Assessment

Single factor pollution assessment can determine the pollution degree of major heavy metal pollutants. The evaluation formula is as follows:
P i = C i S i
where Pi is the heavy metal pollution index, Ci is the heavy metal content, and Si is the risk screening value.
According to the specification of land quality geochemical assessment [31], the classification indicators for pollution assessment are shown in Table 3.
According to the above evaluation indicators, the following focuses on the heavy metal Sb that exceeds the screening value, and other heavy metals that do not exceed the screening value will not be discussed further. The antimony (Sb) pollution evaluation in this project is shown in Table 4, among which slight pollution accounts for 5.2%, moderate pollution accounts for 31.6%, and severe pollution accounts for 63.2%. The average pollution index is 6.6, which is severe pollution.

4.2. Geochemical and 3D ERT Characteristics Analysis

4.2.1. 3D ERT Results

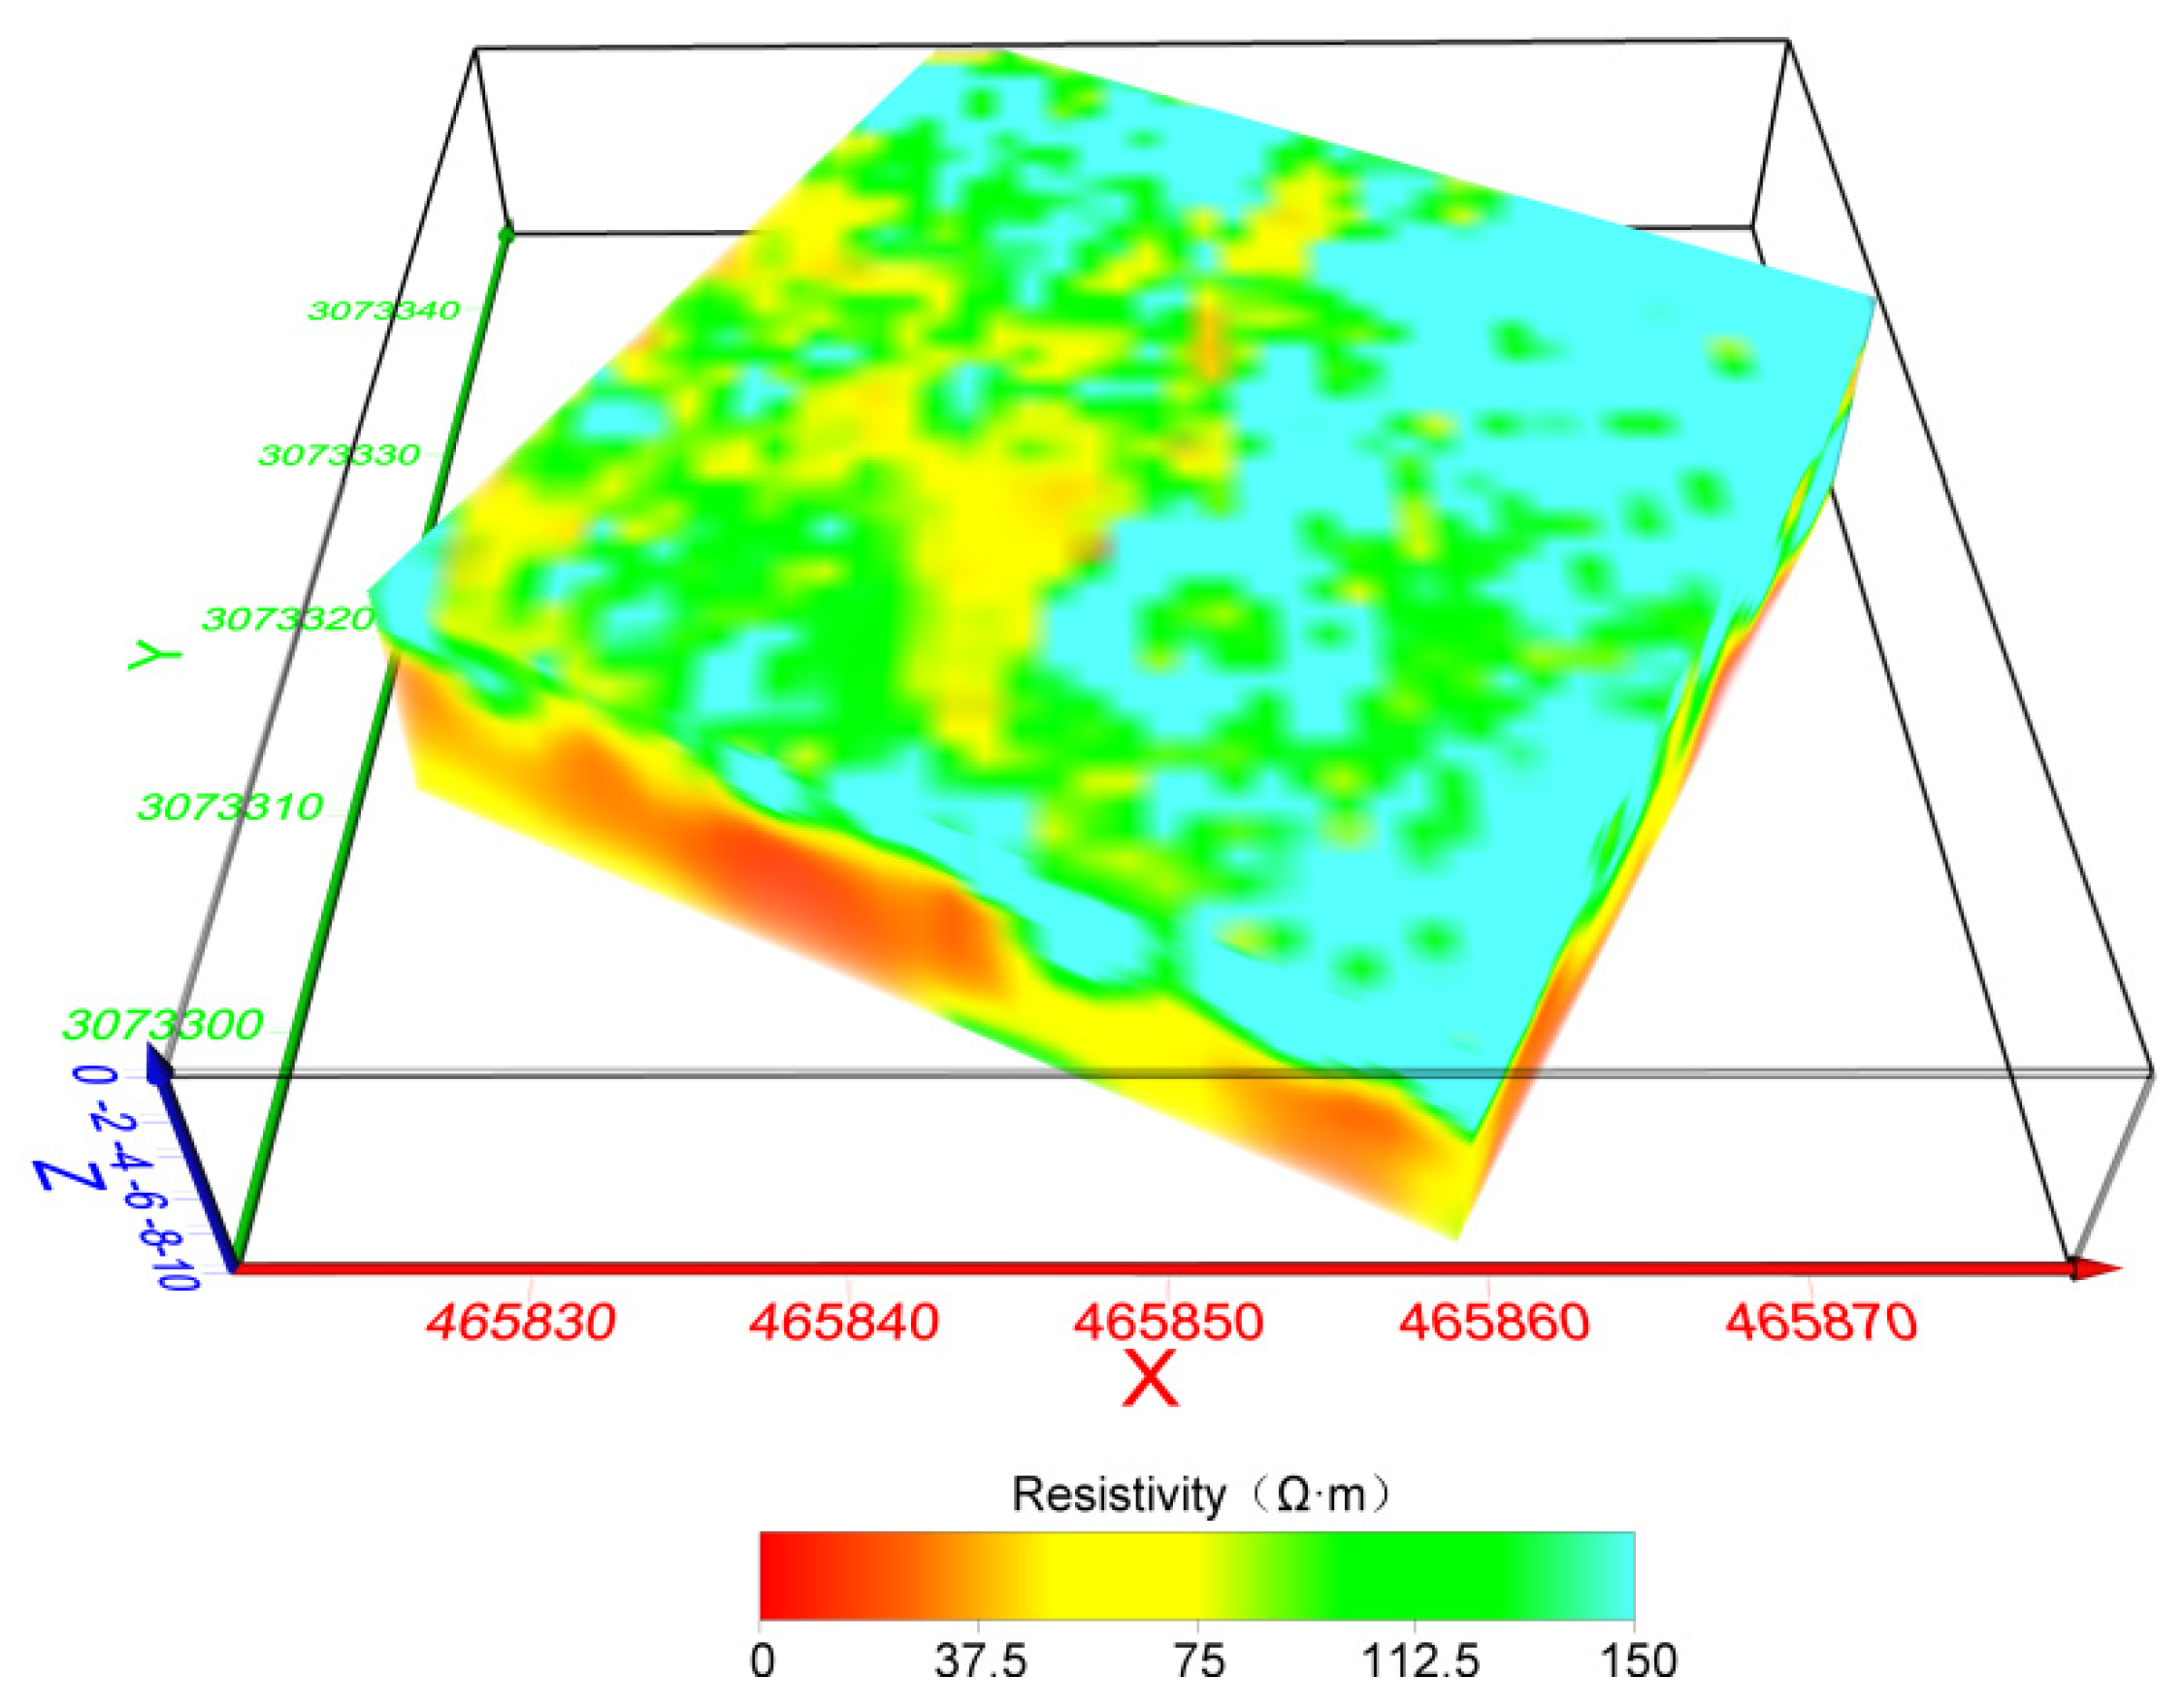
According to the analysis of the 3D ERT results (Figure 4), the resistivity on the northwest side of the site is relatively low in the plane, and it is inferred that the antimony content in the shallow northwest side is relatively high. There is a northeast-trending low-resistance anomaly zone in the surface layer, and it is inferred that the shallow soil cracks near this location are relatively developed, and the shallow part is rich in antimony content. In the vertical direction, with the increase of depth, the resistivity in some areas gradually decreases, showing a high–low trend, and in some areas it decreases and then increases, showing a high-low-high trend. It is inferred that the antimony content in some areas gradually increases with depth, and in some areas shows an increase–decrease trend.
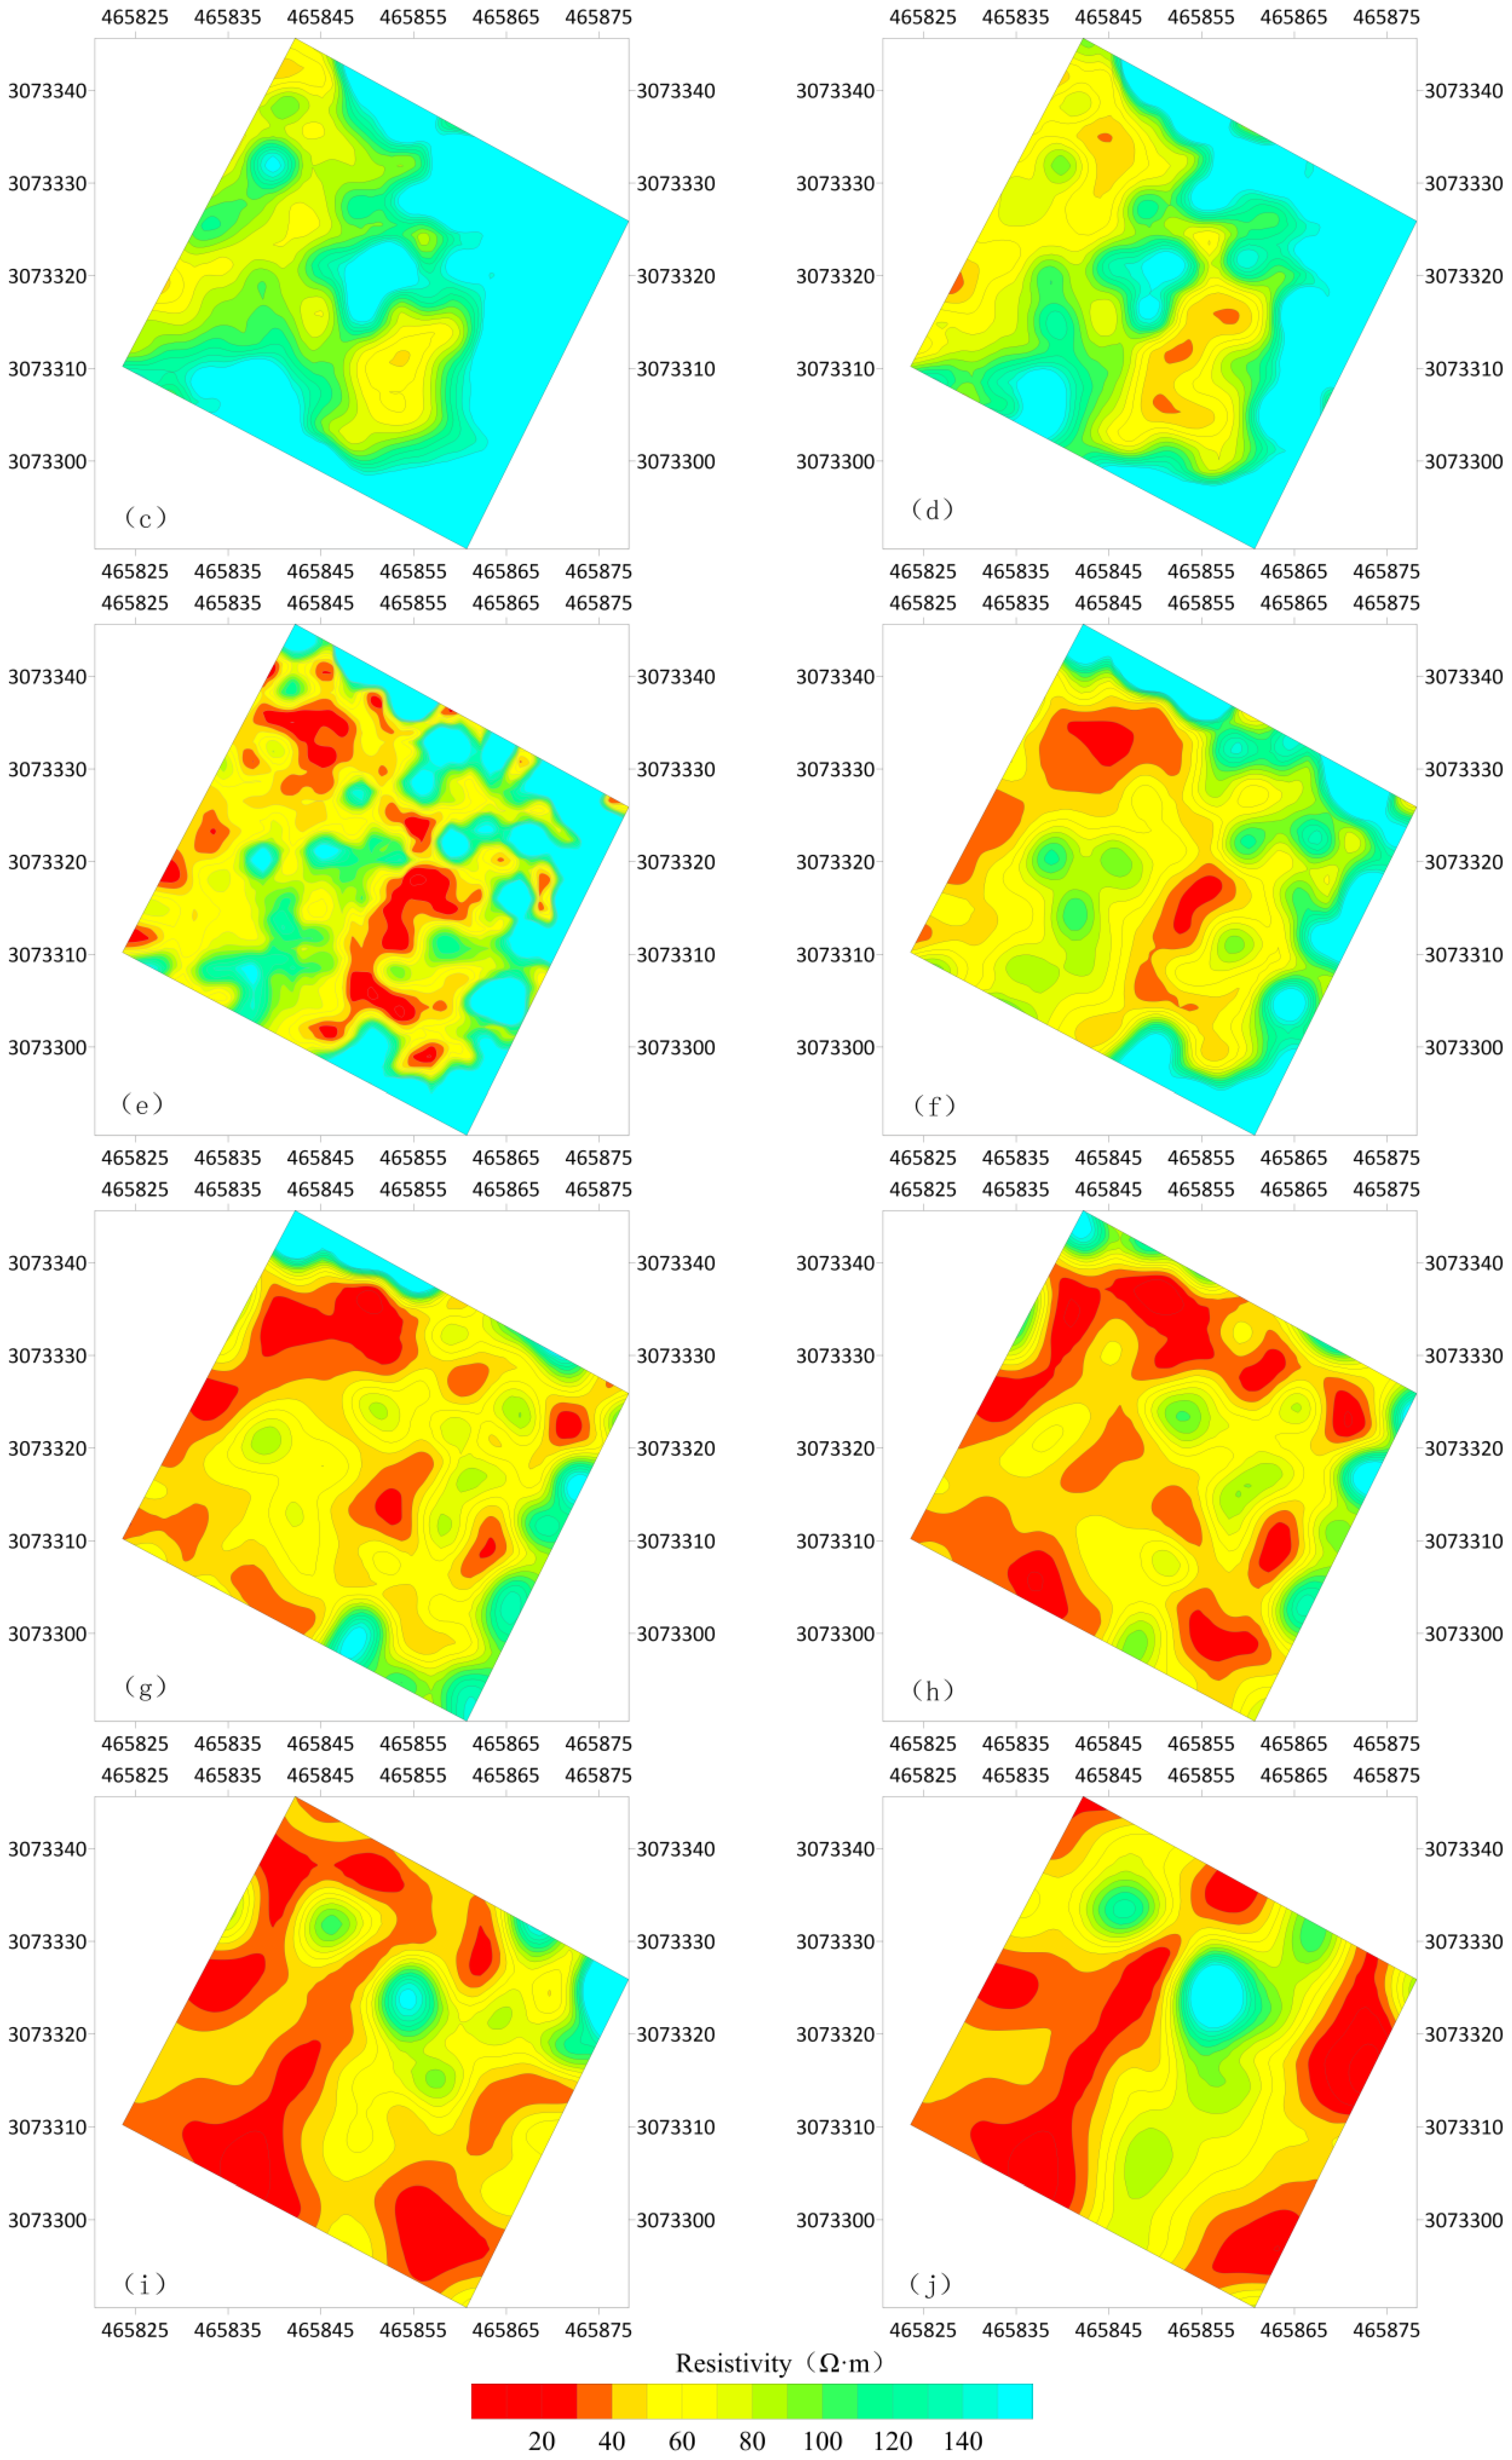
The following comes from the analysis of the 3D ERT slices map at different depths (Figure 5): (1) From the surface to the depth of −3 m, the resistivity morphology is similar in planar distribution, and gradually decreases with depth. The resistivity near the surface is mainly 130–150 Ω·m, and locally less than 80 Ω·m. At the depth of −3 m, the resistivity is mainly 40–80 Ω·m, and locally greater than 100 Ω·m. It is inferred that the antimony content gradually increases from the surface to the depth of −3 m. (2) From the depth of −3 m to −5 m, the resistivity decreases significantly. The resistivity value is less than 40 Ω·m near the north side and the surrounding areas of the site, and the increase in the middle is relatively weak, mainly 40–80 Ω·m. It is inferred that the antimony content increases significantly from the depth of −3 m to −5 m, especially in the north side and the surrounding areas of the site. (3) Within the depth range of −5 to −9 m, the resistivity in some areas shows a gradual increase, and the resistivity gradually becomes a northeast-trending band, with obvious differentiation. The low-resistivity area is less than 40 Ω·m, and the high-resistivity area is greater than 100 Ω·m. It is speculated that within the depth range of −5 to −9 m, the antimony content in some areas shows a decreasing trend. The northeast-trending band is a relatively developed fracture area, and the antimony element is enriched.

4.2.2. Analysis of Antimony Pollution Plane Characteristics

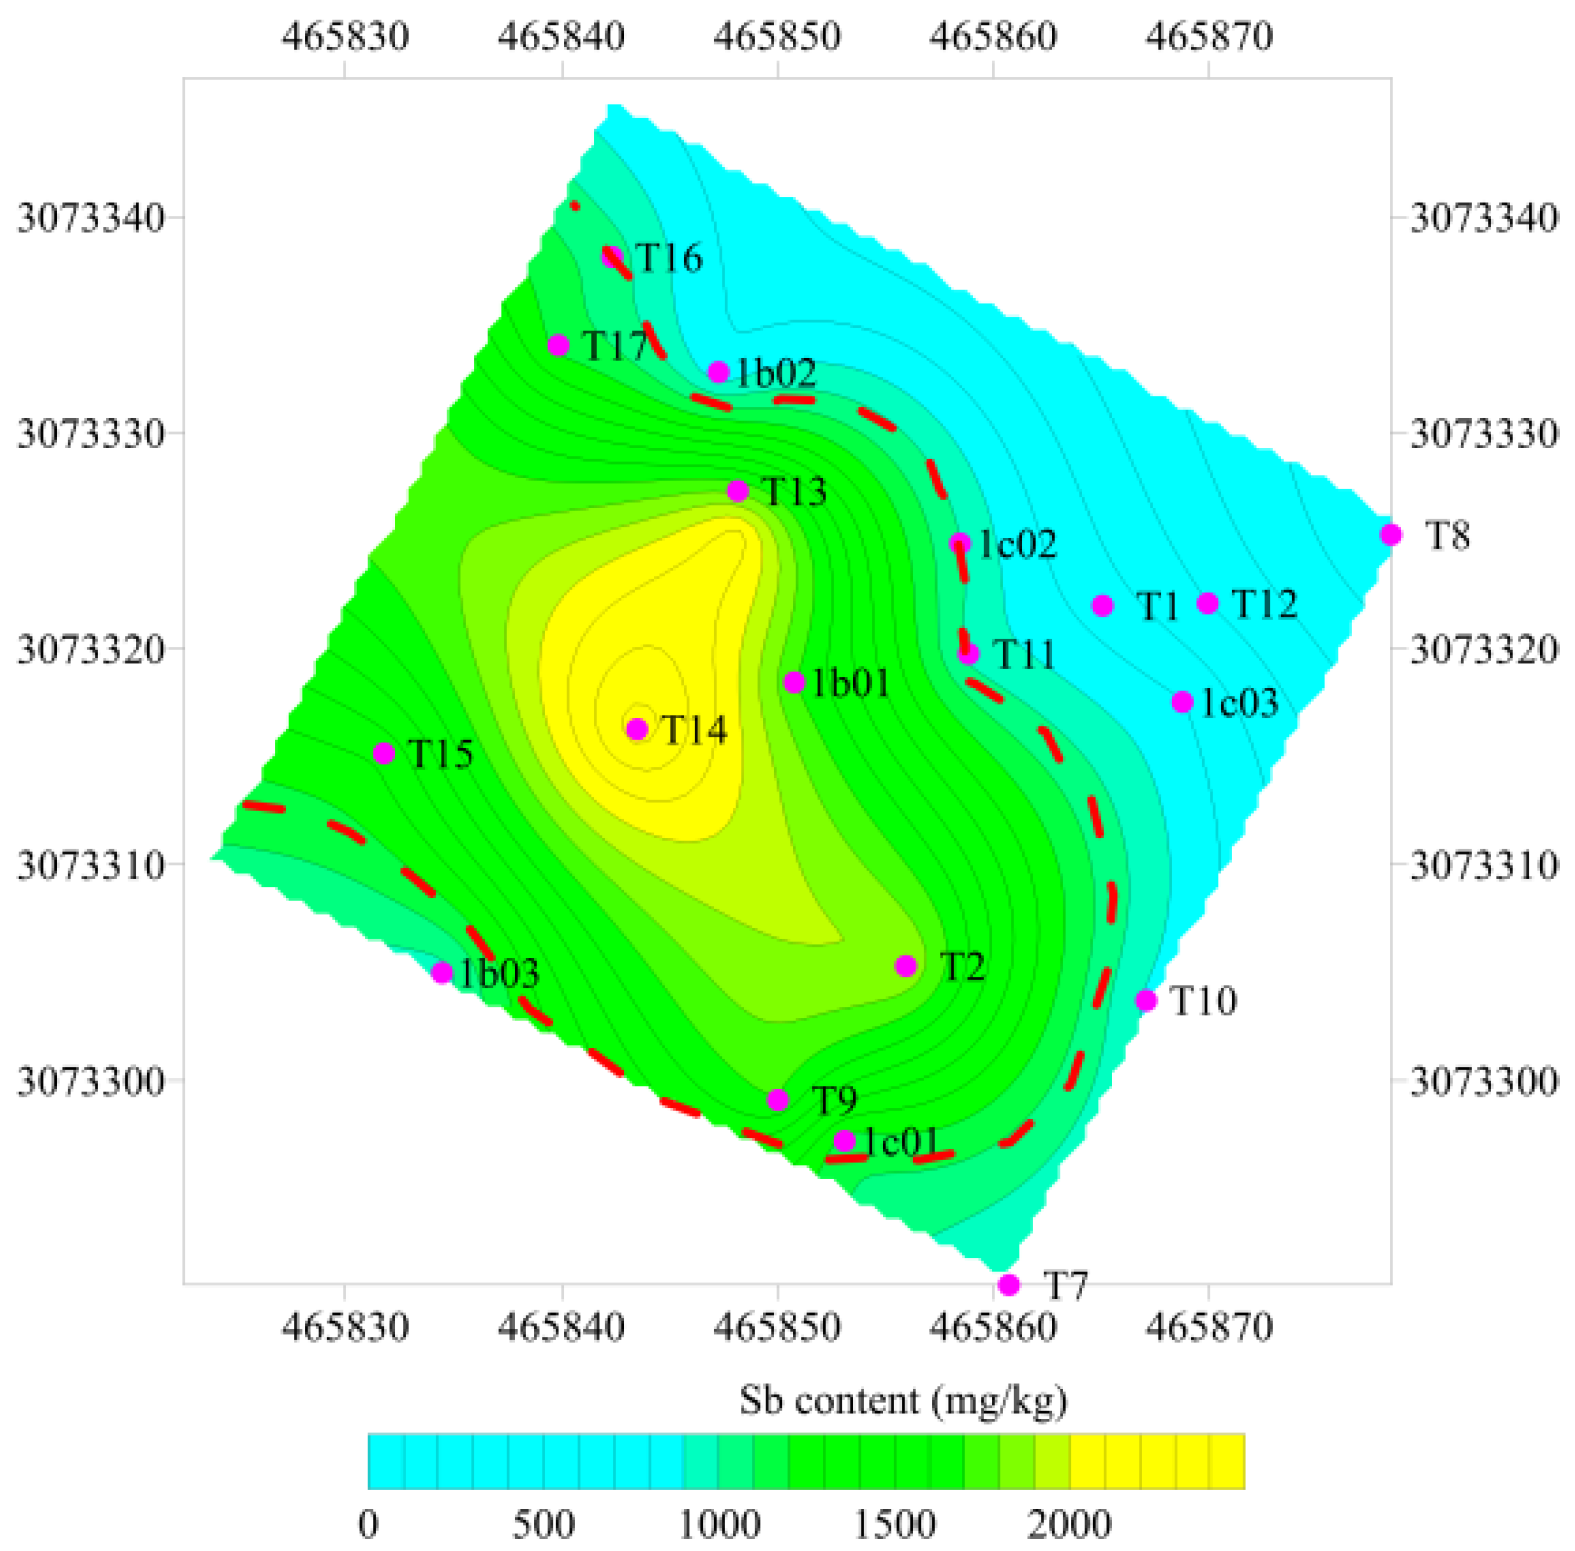
The detection data of excessive heavy metal antimony (Sb) were interpolated using Kriging with a linear variation function (slope = 10,129.9, Aniso = 1.0) to draw an Sb content distribution map (Figure 6), which was compared with the three-dimensional resistivity results (−0.5 m) slice map (Figure 7): the distribution range of antimony (Sb) content exceeding 1000 mg/kg (red dotted line) basically corresponds to the distribution range of resistivity values below 130 Ω·m (red dotted line); lower resistivity values correspond to higher antimony content to the west of the center of the site.

4.2.3. Analysis of Antimony Pollution Profile Characteristics

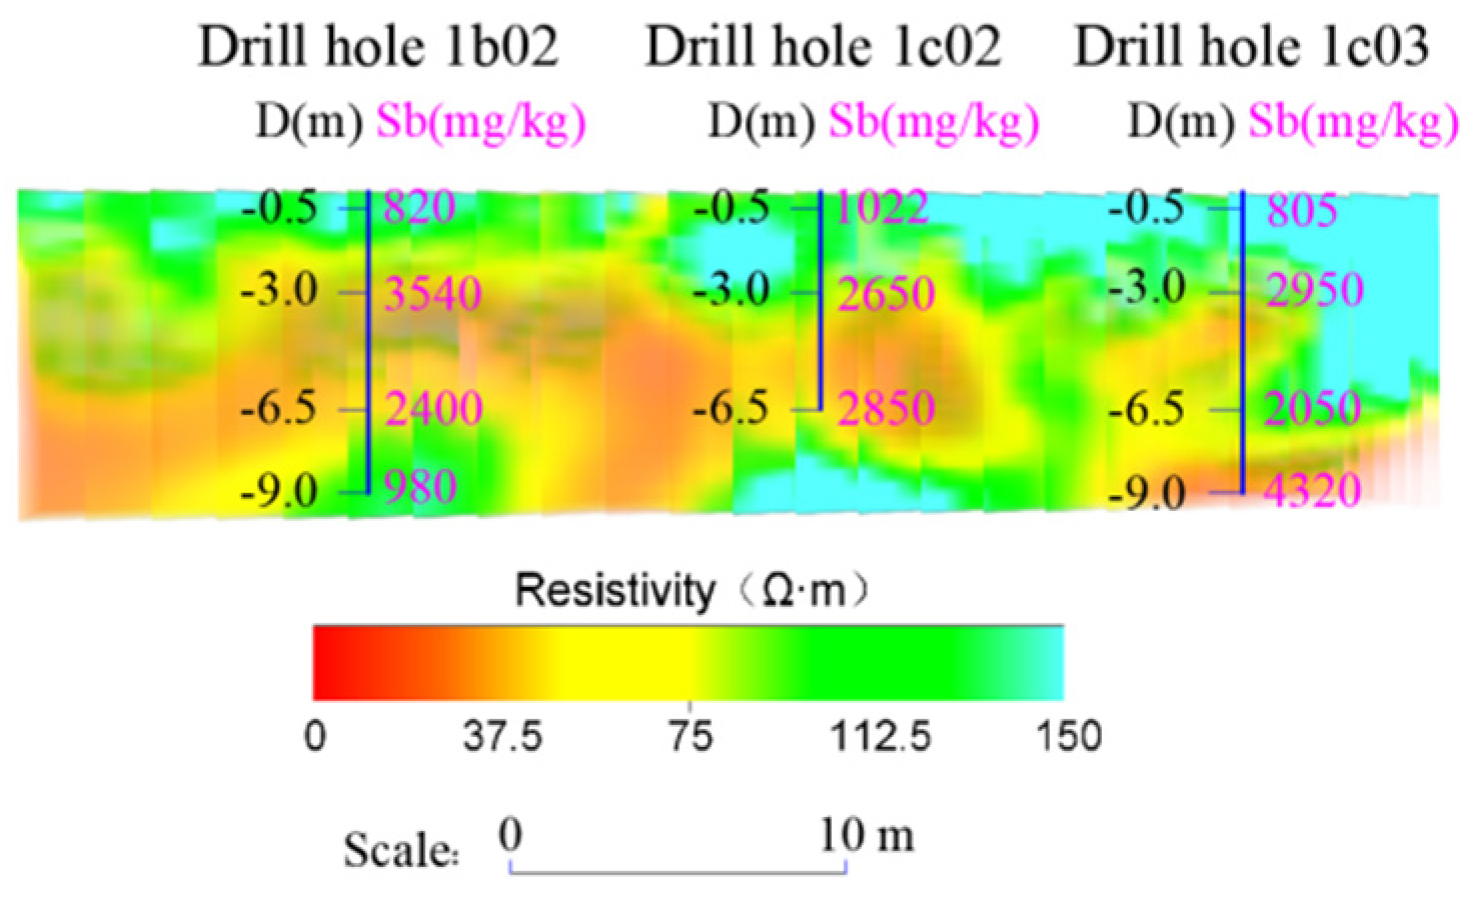
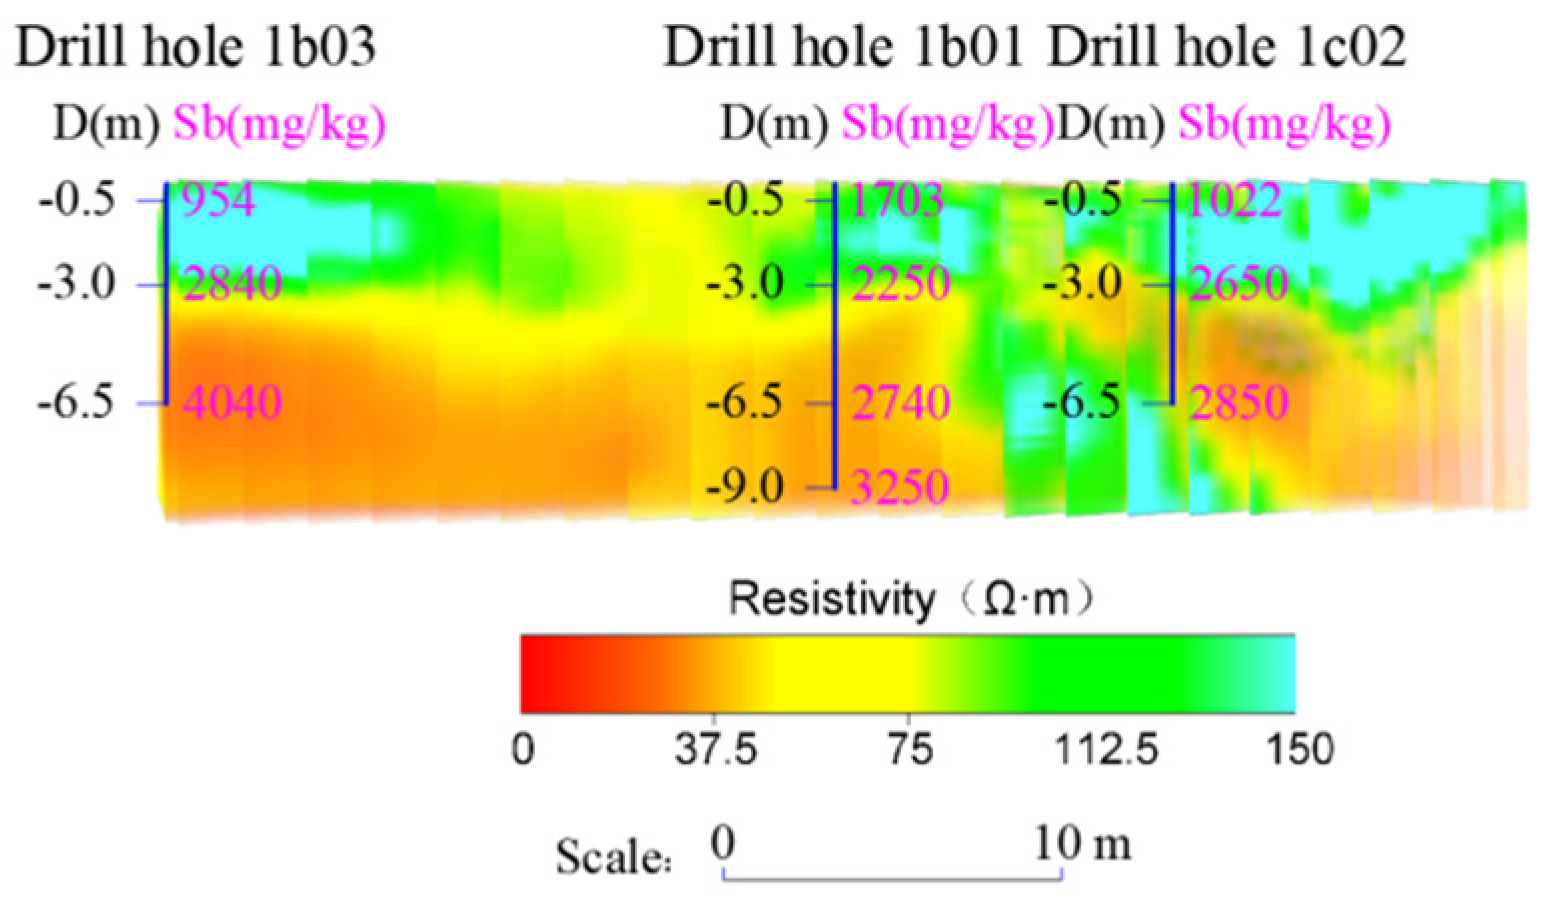
The light blue area in the shallow part (mainly shallower than −1 m) in the 3D ERT result map (Figure 8 and Figure 9) has a resistivity of >130 Ω·m, corresponding to a heavy metal content of antimony Sb ≤ 1000 mg/kg; the heavy metal content of 1000 mg/kg < antimony Sb ≤ 2000 mg/kg corresponds to the green area in the 3D ERT result map, with a resistivity of 80–130 Ω·m; the heavy metal content of 2000 mg/kg < Sb ≤ 3000 mg/kg corresponds to the yellow area in the 3D ERT result map, with a resistivity of 40–80 Ω·m; and the heavy metal content of >3000 mg/kg corresponds to the red area in the 3D ERT result map, with a resistivity of 0–40 Ω·m.

4.3. Three-Dimensional Pollution Model

4.3.1. Mathematical Model of Resistivity and Antimony Content

Antimony data from 32 geochemical tests and the 3D ERT resistivity values at the corresponding locations are statistically analyzed, and the results are in Table 5:
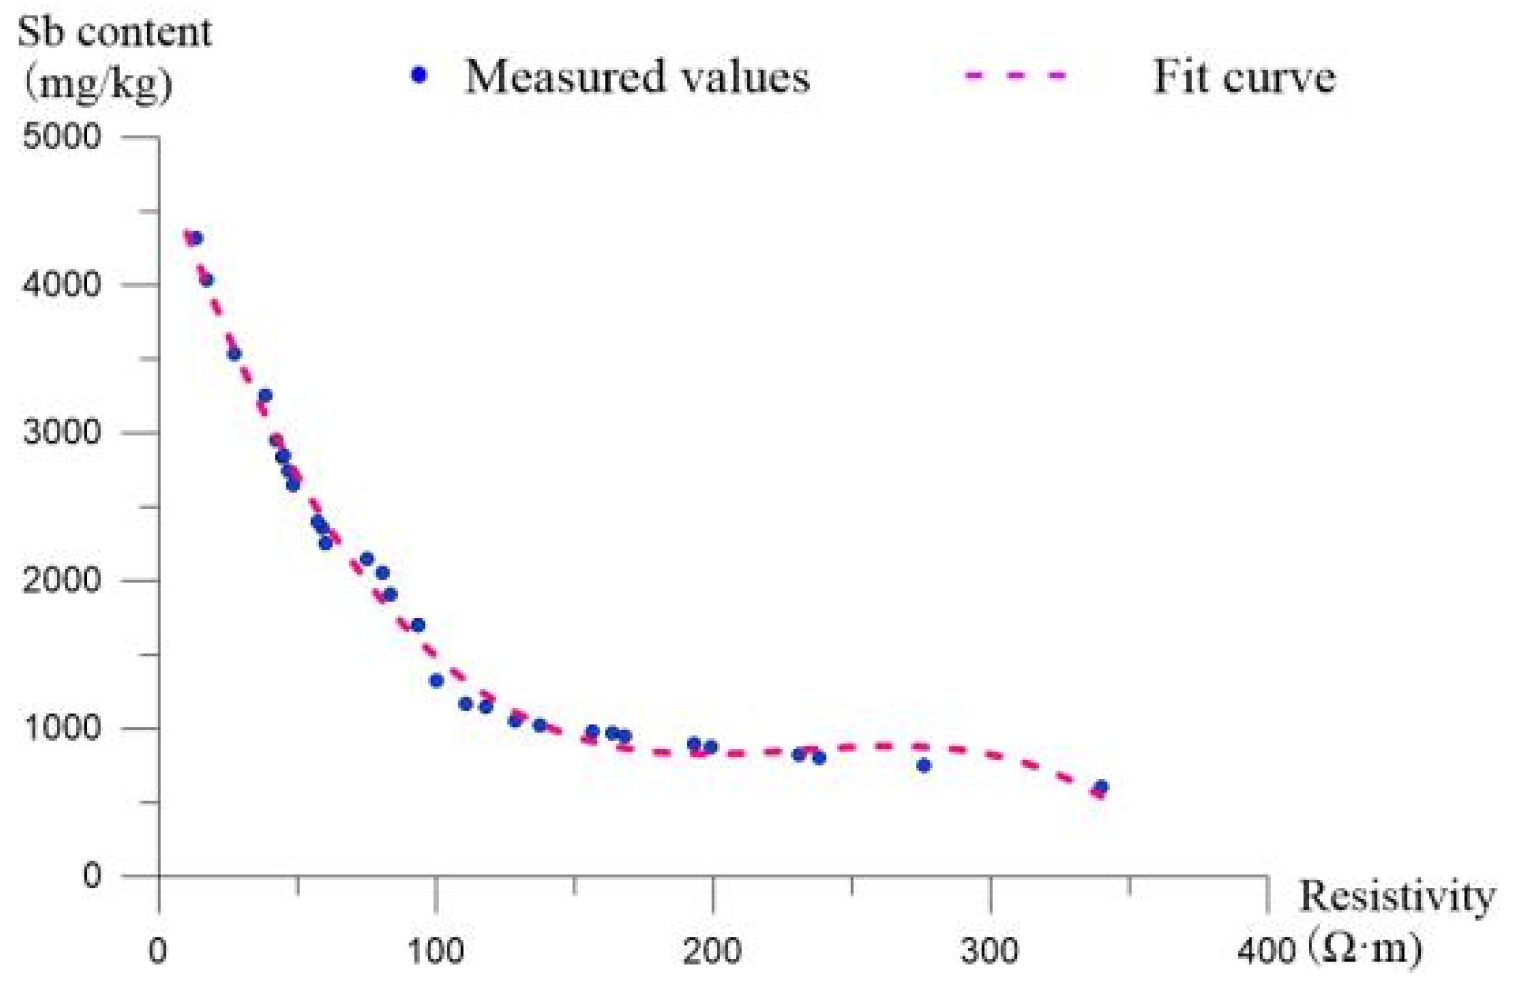
According to the table above, the average value of the 32 resistivity values is 141.5 Ω·m, and the resistivity value of T8 is 1041.5 Ω·m. The large deviation should be removed. The remaining 31 data are fitted with a polynomial. The fitting correlation coefficient R between resistivity and heavy metal antimony content is 0.99, indicating an excellent fitting effect (Figure 10). Based on 31 sets of valid data (excluding the abnormal point T8), the cubic polynomial regression equation of resistivity (ρ) and antimony content (Sb) is as follows:
Sb = 1299 . 702 13 . 56075 ρ + 0 . 1237955 ρ 2 0 . 0003465506 ρ 3
where Sb is the antimony (Sb) content (mg/kg) and ρ is the 3D ERT resistivity value (Ω·m). The resistivity data are derived from the inversion model results.
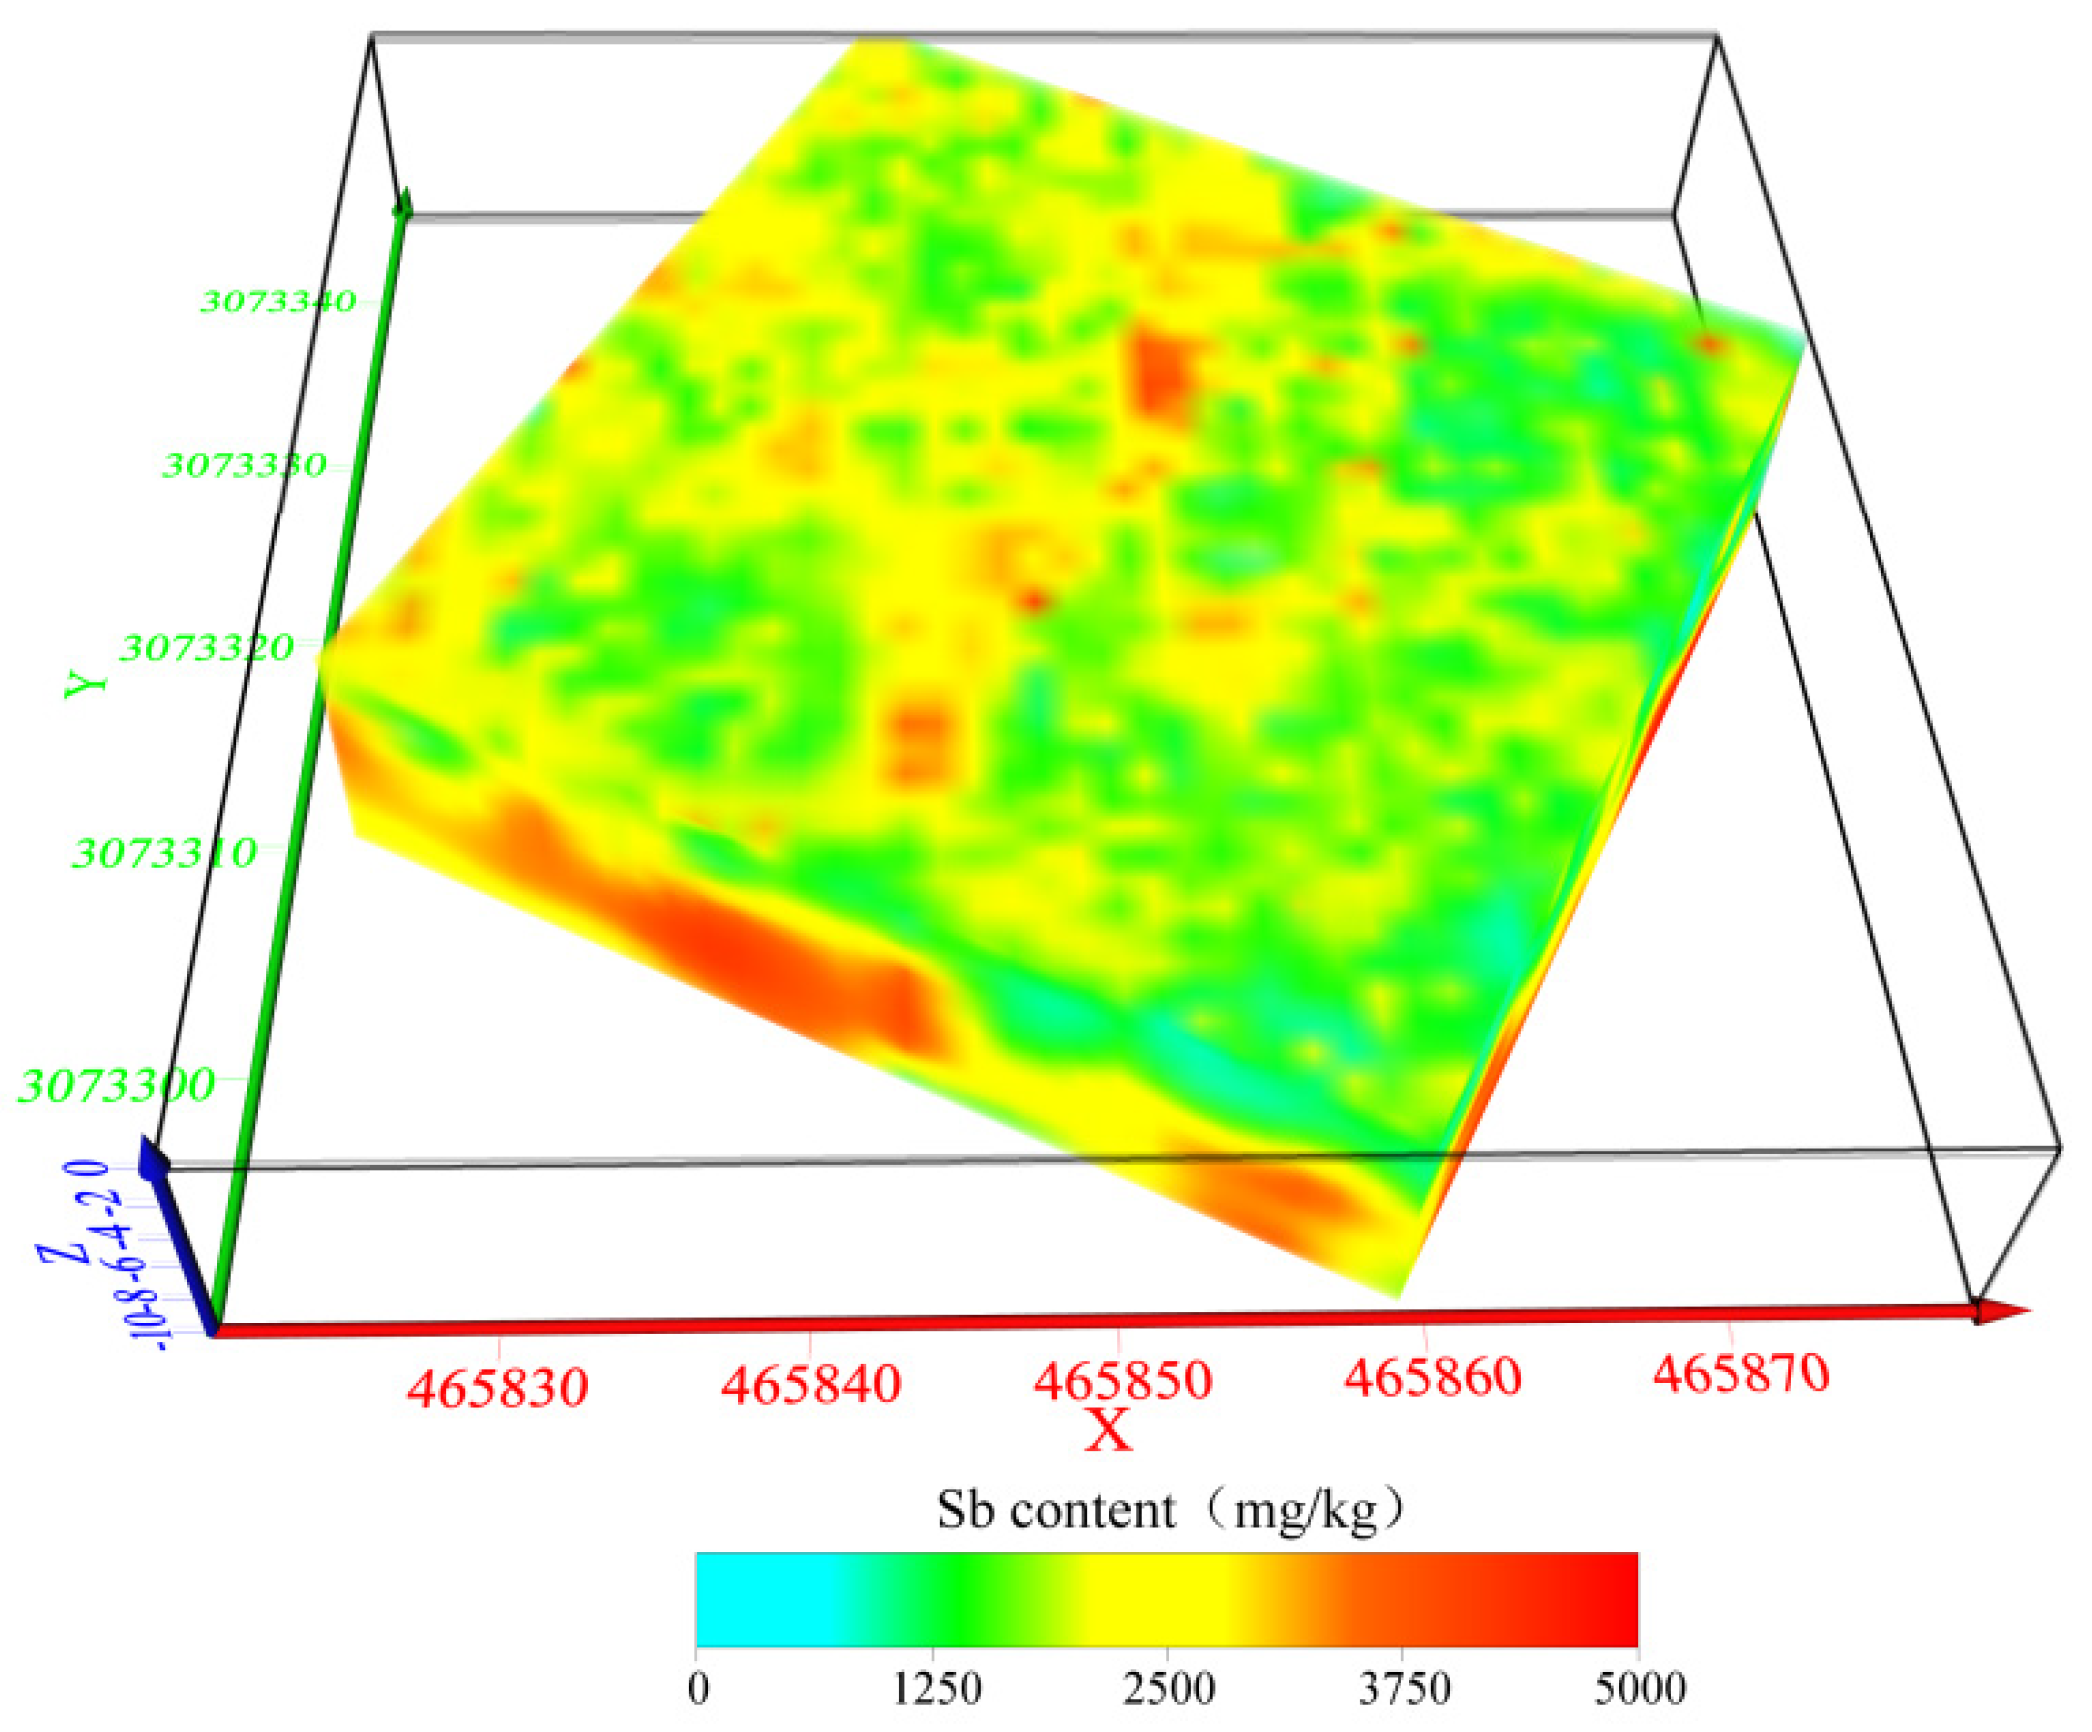
Based on the above fitting formula, all resistivity values of the 3D ERT were converted into antimony content values and generate a three-dimensional pollution model of antimony (Sb) in the site. This model mainly considers the relationship between resistivity and heavy metal antimony content, and does not consider the influence of resistivity on various factors such as soil moisture, porosity and clay content.
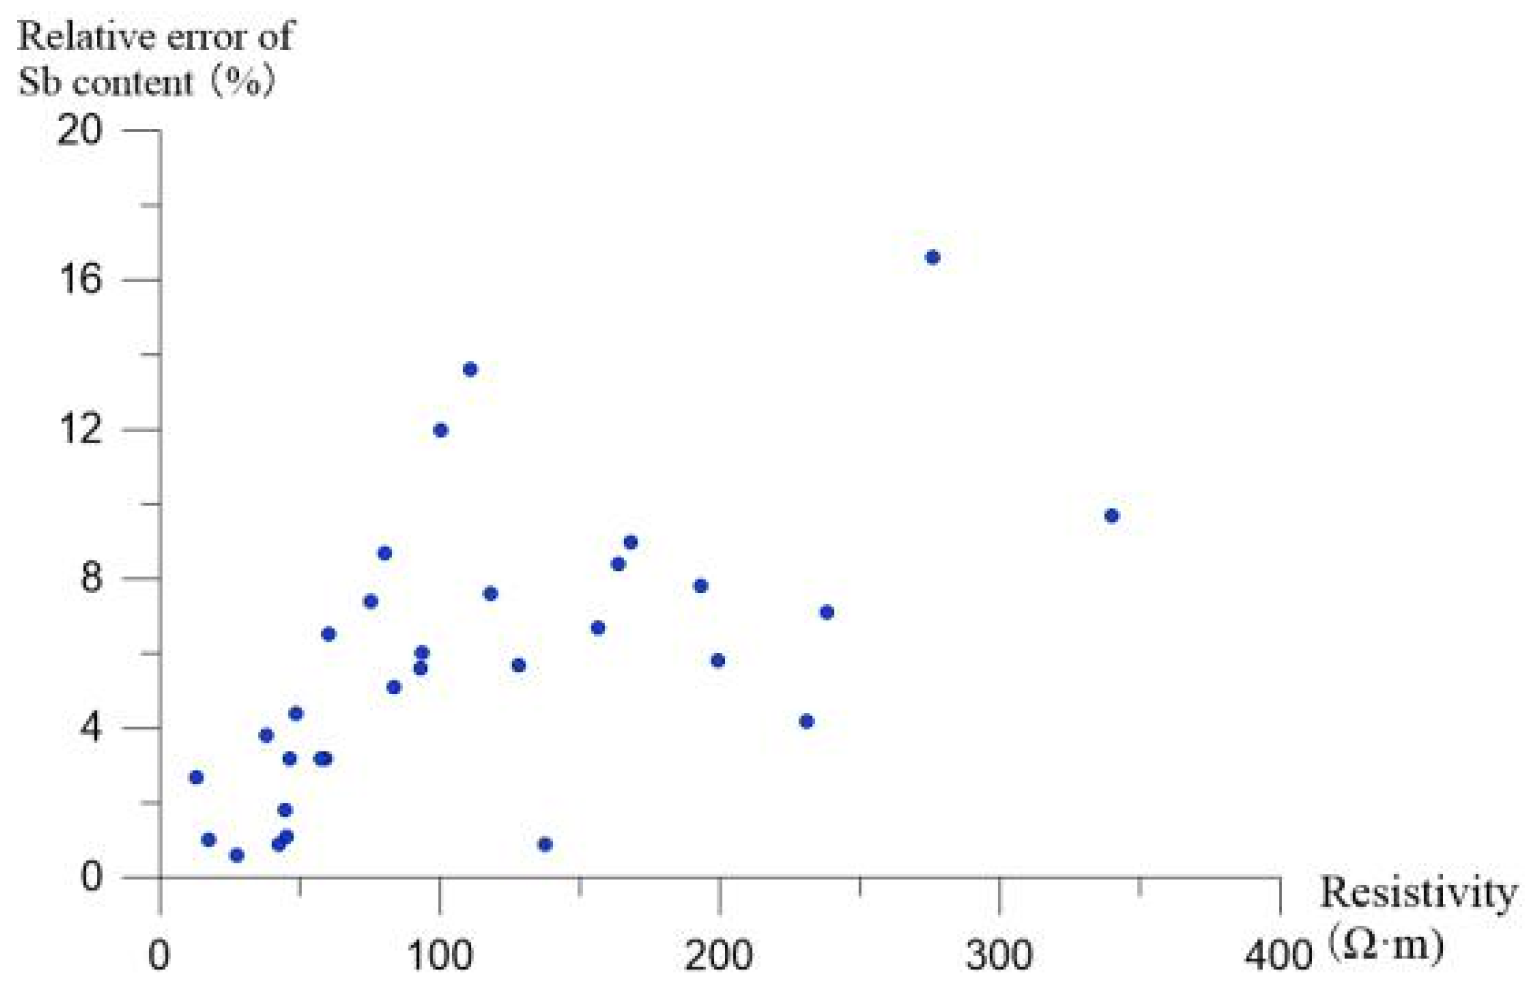
To verify the accuracy of the three-dimensional contamination model, the model’s predicted antimony concentrations were compared with actual test data. The relative error between the predicted and measured values was calculated for 31 sampling locations (Figure 11). The results showed that the prediction errors ranged from 0.6% to 16.6%, with an average error of 5.8%. This indicates that the model has high accuracy and can be used as an assessment model for antimony contamination at this site.

4.3.2. Analysis of the Three-Dimensional Model of Antimony Pollution on the Site

According to the three-dimensional antimony content results (Figure 12), the antimony content is relatively high in the northwest of the site. With increasing depth, the antimony content tends to increase. There is a northeast-trending high-value zone in the middle of the surface layer, which is rich in antimony content. It is speculated that the shallow soil layer near this location has more developed cracks.
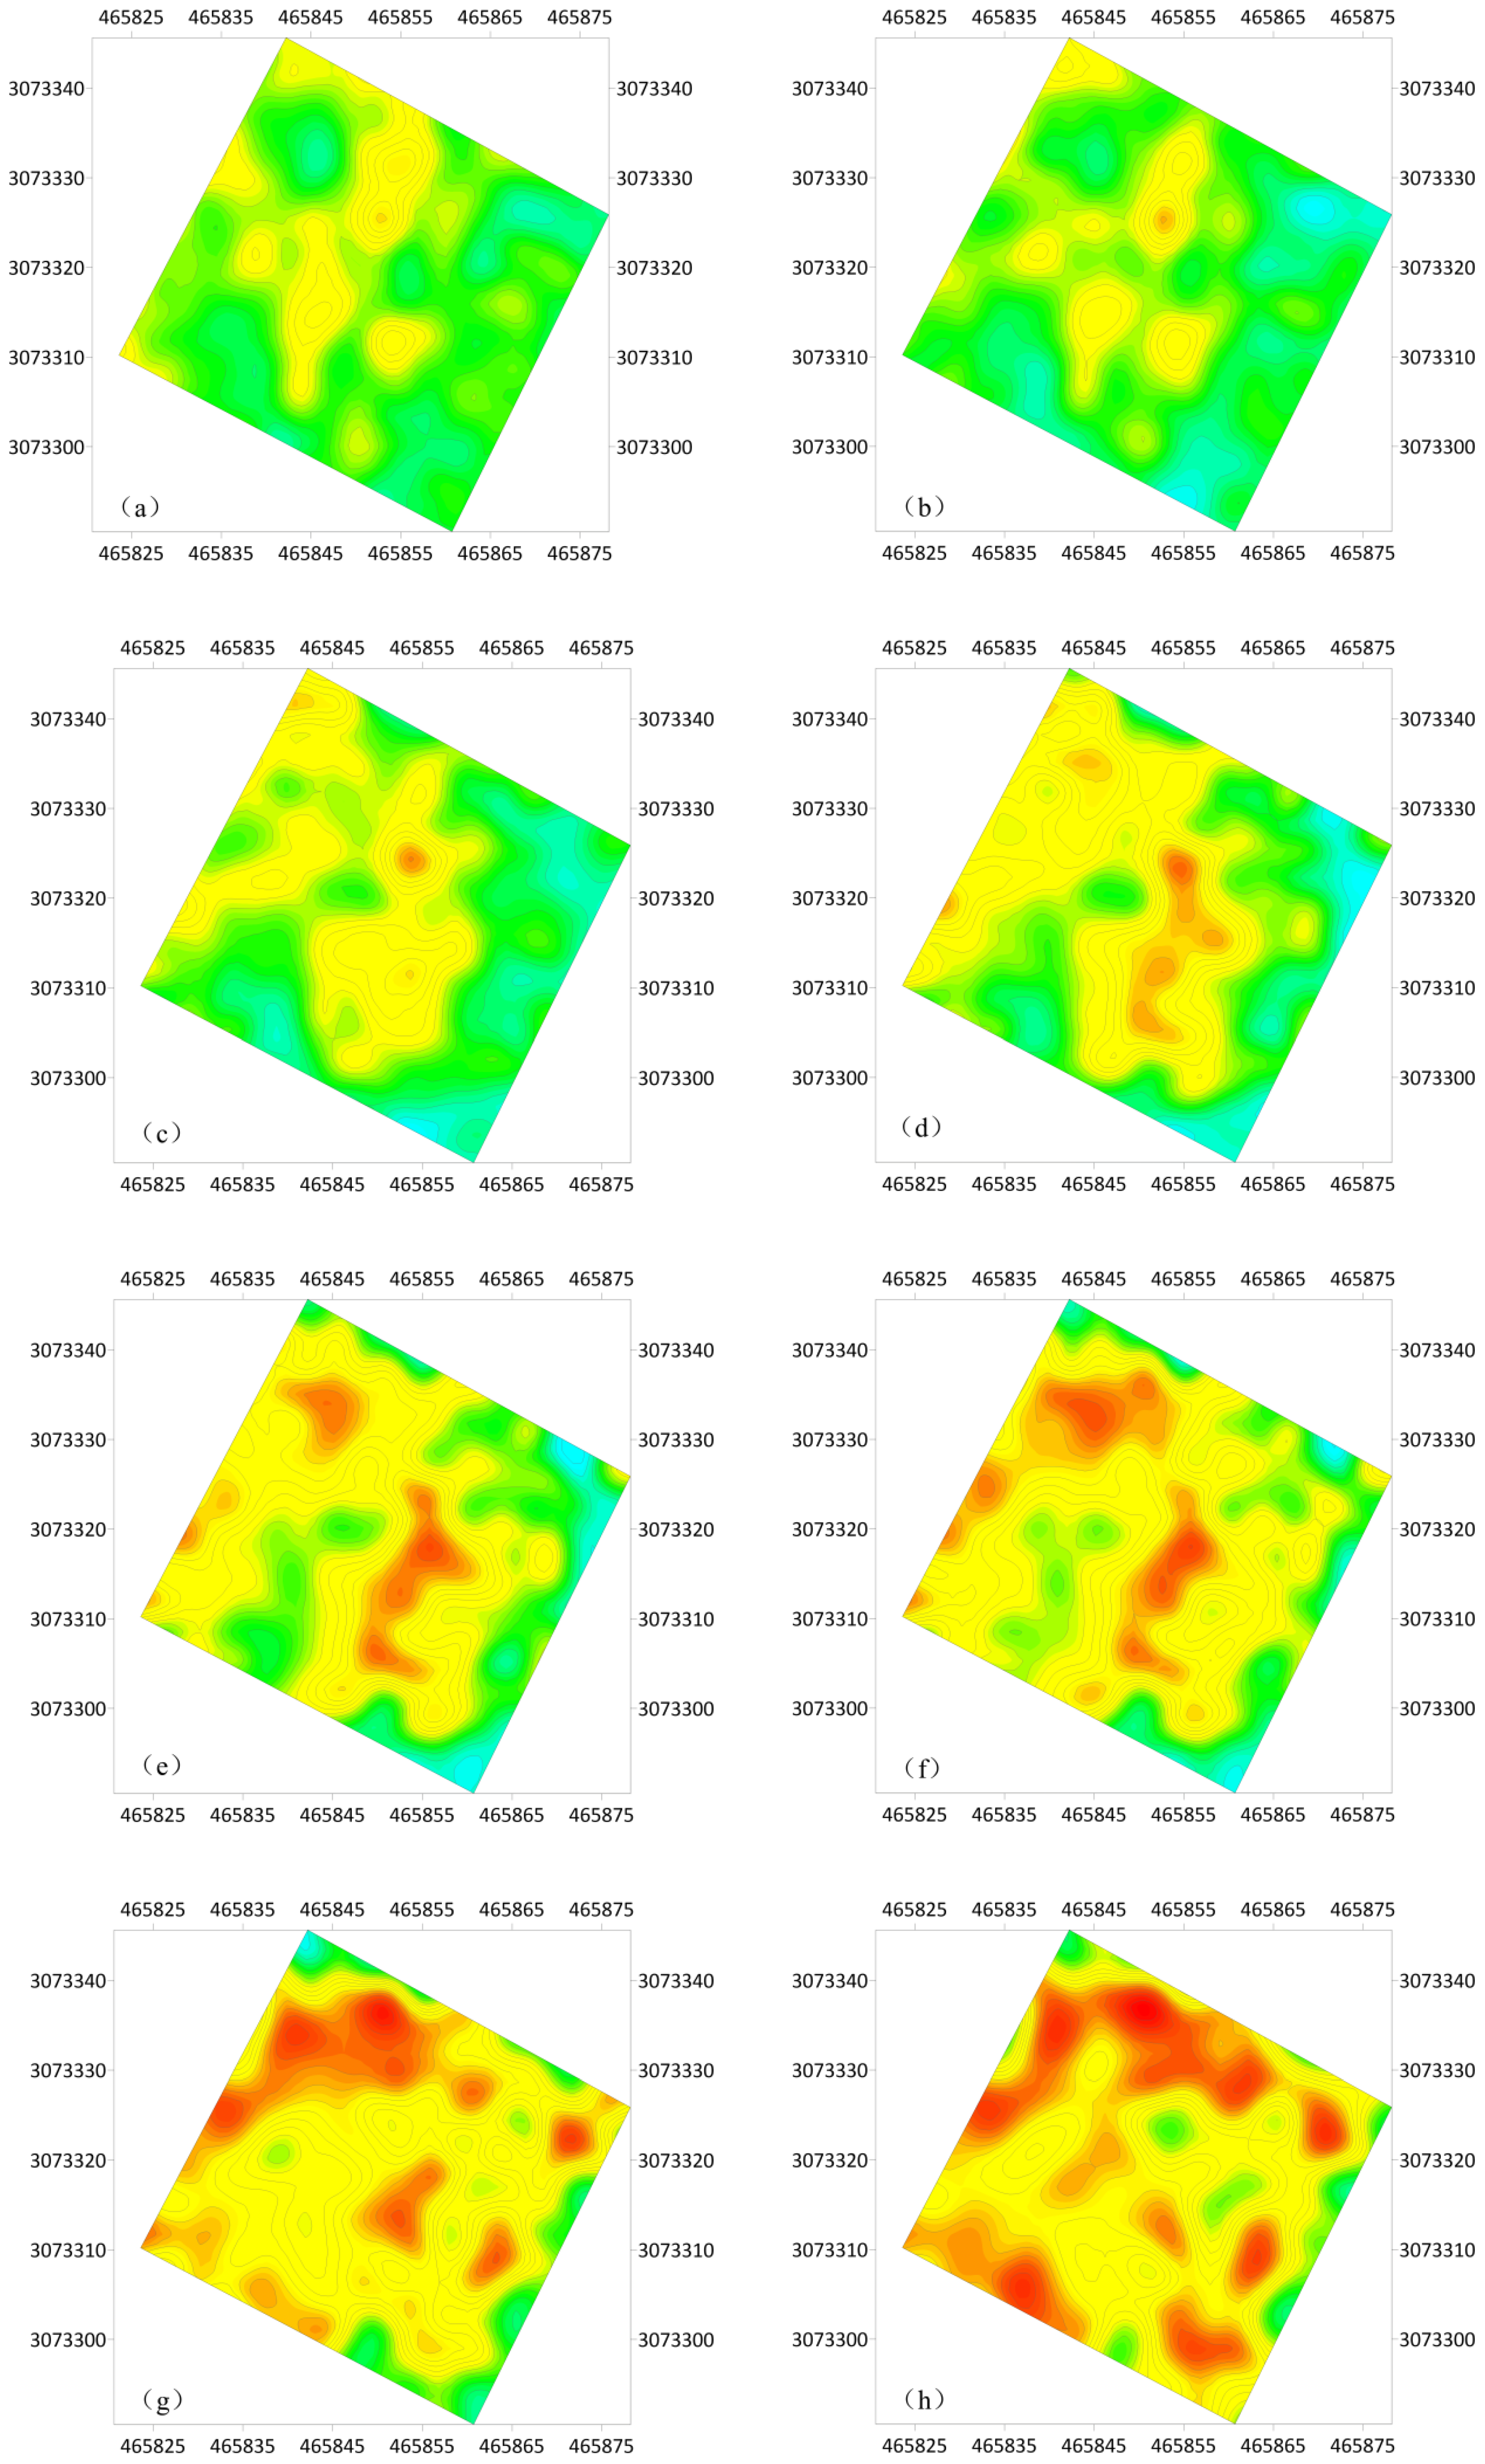
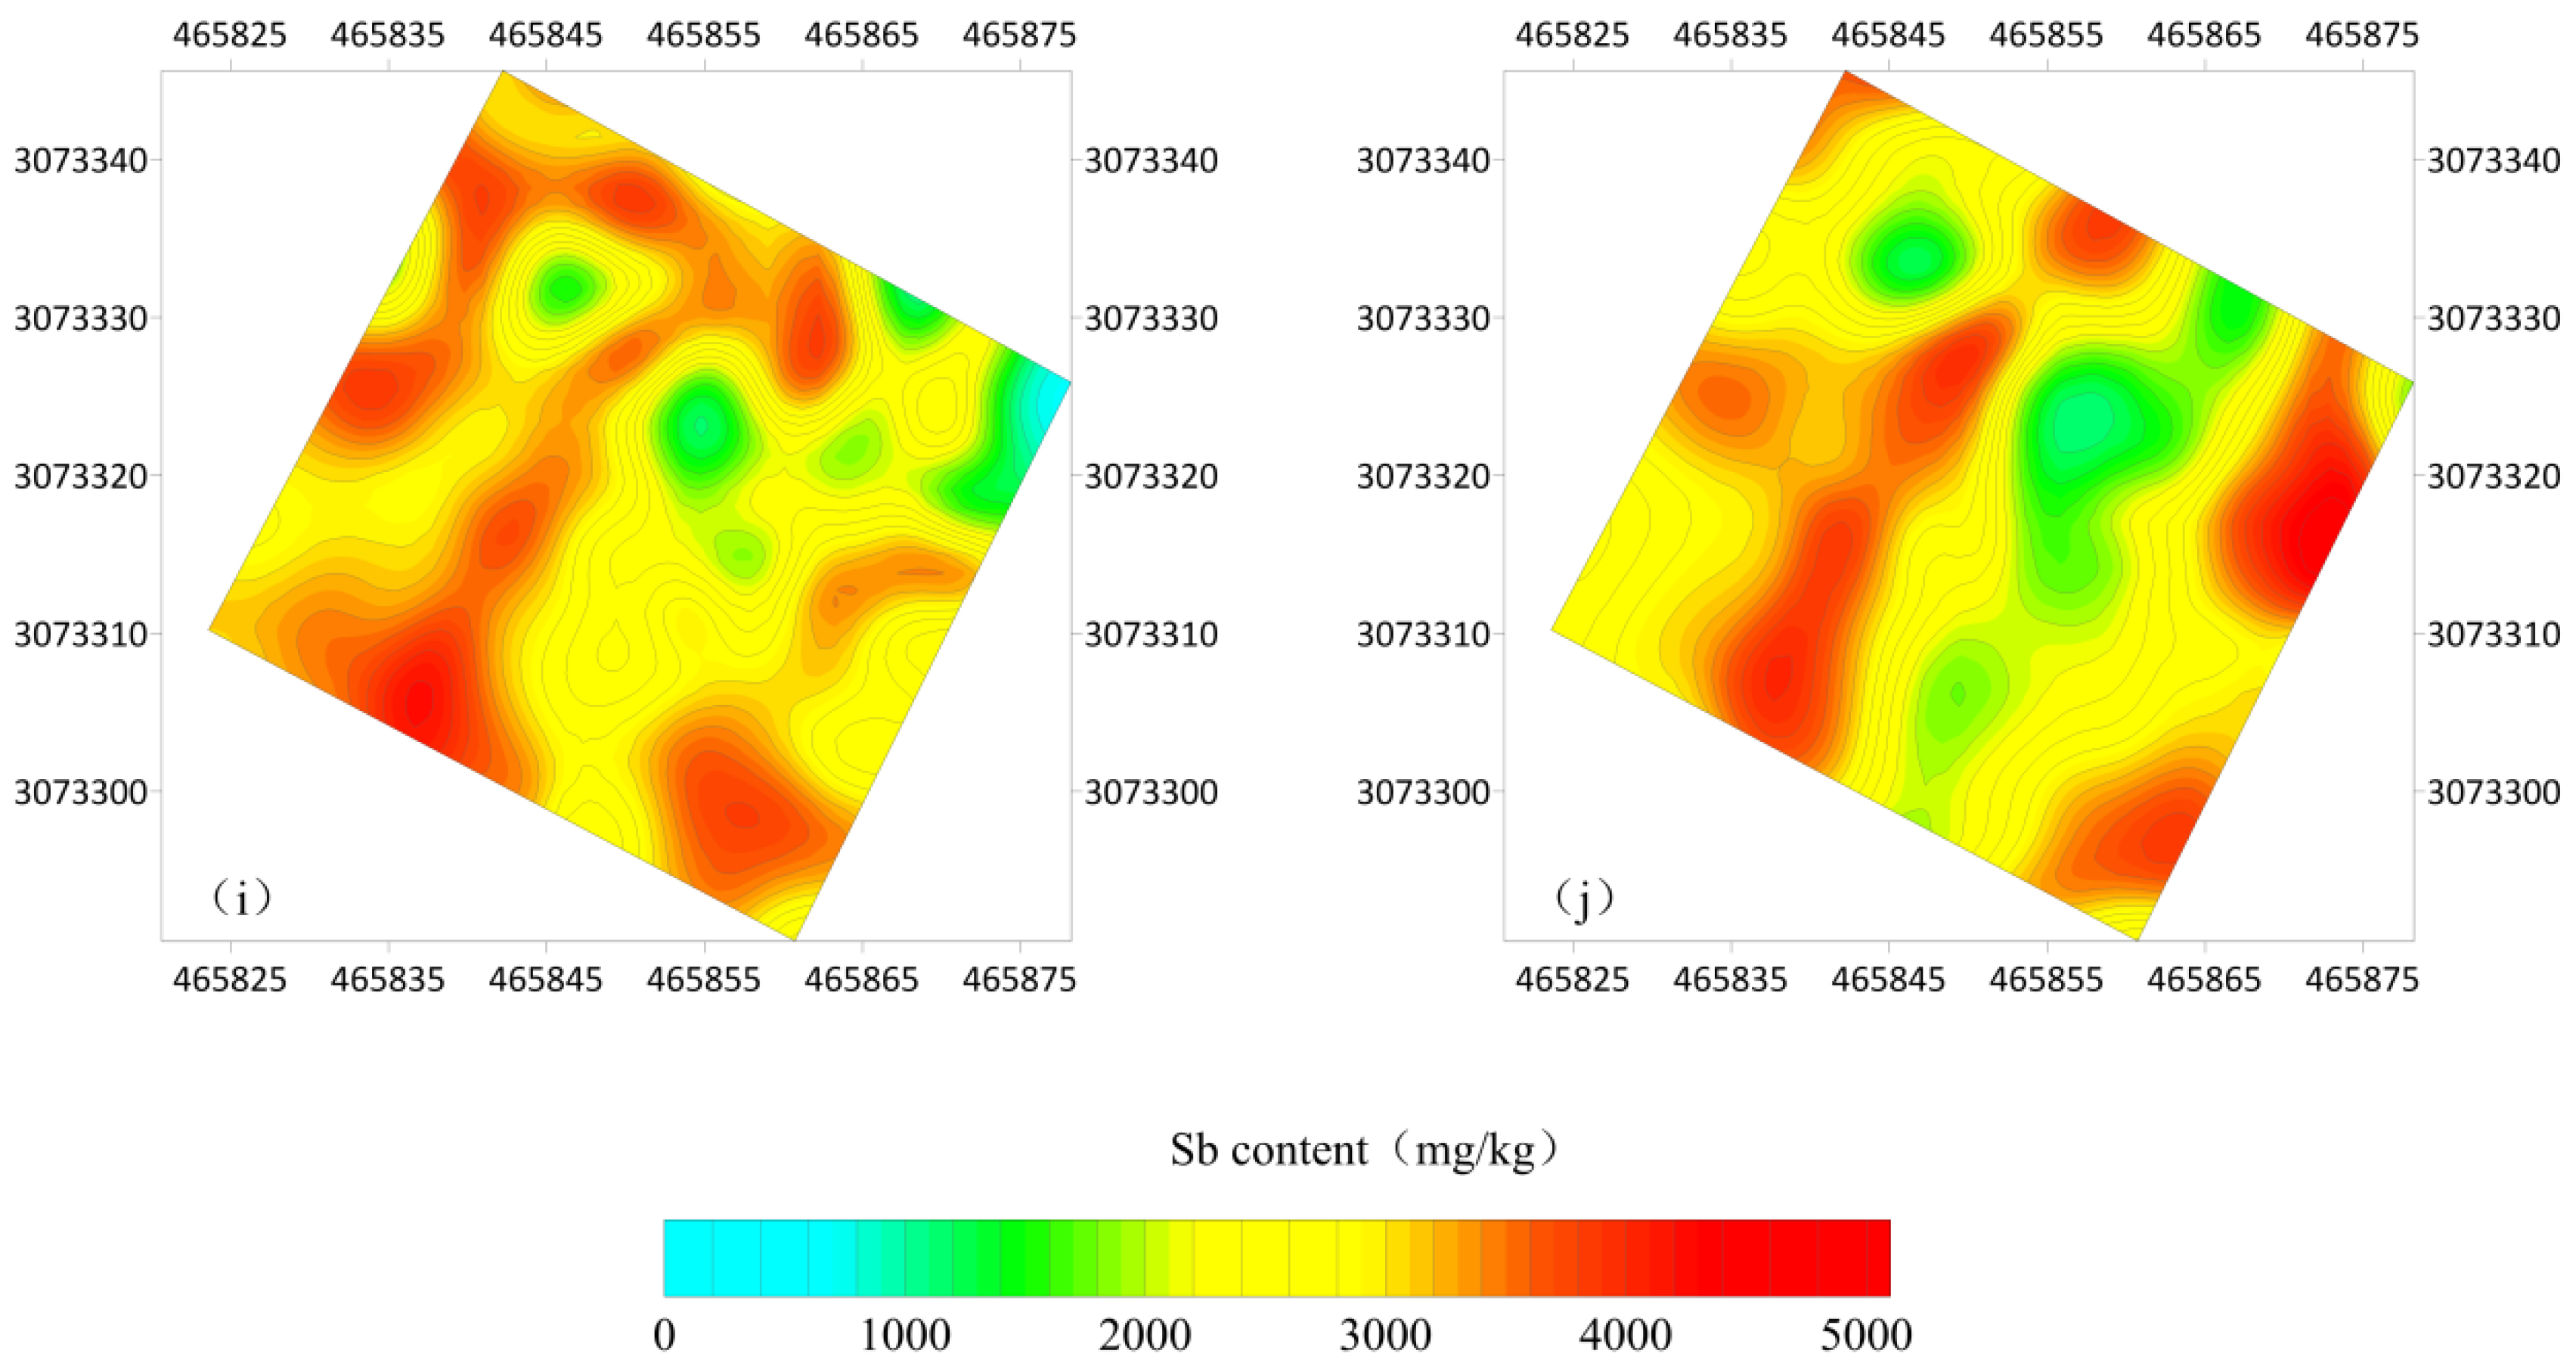
From the three-dimensional slice results of antimony content (Figure 13), the following analysis is made: (1) Within the depth range from below the surface to −3 m, the antimony content has a similar distribution in the plane, and gradually increases with depth. Antimony content near the surface is generally less than 1000 mg/kg, and locally greater than 2000 mg/kg. At the depth of −3 m, the antimony content is mainly 2000 mg/kg–3000 mg/kg, and locally less than 1500 mg/kg. (2) Within the depth range from −3 m to −5 m, the antimony content increases significantly. The antimony content is greater than 3000 mg/kg on the north side and around the site, and the increase in the middle is relatively weak, mainly 2000 mg/kg–3000 mg/kg. (3) Within the depth range from −5 to −9 m, the antimony content in some areas shows a gradual decrease trend, and the antimony enrichment gradually presents a northeast-oriented strip shape, with obvious differentiation. The high value area is greater than 3000 mg/kg, and the low value area is less than 1500 mg/kg.

5. Conclusions

In the investigation of heavy metal pollution in soil, traditional geochemical methods rely on large-scale sampling and analysis, which has disadvantages such as high cost and limited coverage. However, 3D ERT can achieve large-scale and continuous pollution distribution prediction through non-invasive detection [32]. This study combines geochemistry with 3D ERT to construct a high-precision three-dimensional model of heavy metal pollution in soil. Combined with statistical analysis and model verification, it reveals the spatial distribution pattern of heavy metal Sb pollution and provides precise targeted guidance for pollution control [33,34,35].
This study has achieved certain results, but there are still limitations [36,37]. For example, resistivity is affected by factors such as soil moisture, porosity, and clay content. Although this study has clarified the relationship between resistivity and heavy metal antimony content, it has not fully considered the interference of other factors.
By integrating geochemistry and three-dimensional resistivity tomography technology into the research on heavy metal pollution prediction, a reference can be provided for the investigation and remediation of similar contaminated sites. In the future, through optimization of models, integration of multi-source data, and dynamic monitoring research, the accuracy and efficiency of heavy metal pollution prediction and management can be further improved, contributing to the improvement of soil environmental quality and sustainable development.

Author Contributions

Conceptualization, W.L.; methodology, H.L. and W.L.; geochemical sample collection and testing, M.L. and B.Z.; validation, S.Y. and Y.Z.; model construction and analysis, W.L. and H.L.; investigation, H.L. and D.Z.; resources, S.Y.; data curation, Y.Z. and X.X.; writing—original draft preparation, W.L. and H.L.; writing—review and editing, H.L. and W.L.; visualization, D.Z.; supervision, S.Y.; project administration, H.L.; funding acquisition, W.L. and H.L. All authors have read and agreed to the published version of the manuscript.

Funding

This work was supported by the National Natural Science Foundation of China (grant No.41774149), Research Fund of the Geological Bureau of Hunan Province Research (HNGSTP202433), and Research Fund of the Ecology and Environment Department of Hunan (HBKYXM-2023032).

Institutional Review Board Statement

Not applicable.

Informed Consent Statement

Not applicable.

Data Availability Statement

The original contributions presented in this study are included in the article; further inquiries can be directed to the corresponding author.

Conflicts of Interest

The authors declare no conflicts of interest.

References

  1. Alloway, B.J. Heavy Metals in Soils: Trace Metals and Metalloids in Soils and their Bioavailability, 3rd ed.; Springer: Dordrecht, The Netherlands, 2013. [Google Scholar] [CrossRef]
  2. Zhou, J.W.; Wen, B.; Zhou, A.G.; Liu, C.F.; Li, X.Q. Review of antimony pollution and antimony isotopic tracer in the environment. Chin. J. Nat. 2017, 39, 120–130. [Google Scholar] [CrossRef]
  3. Tang, H.; Cheng, Z.; Li, N.; Mao, S.; Ma, R.; He, H.; Niu, Z.; Chen, X.; Xiang, H. Spatial heterogeneity of heavy metal pollution in soils: A review. Environ. Pollut. 2020, 267, 115630. [Google Scholar] [CrossRef]
  4. Xu, W.; Zhou, X.Y.; Zhang, Y.; Zhou, J.F.; Sun, Y.Y.; Shi, H.D.; Bai, L. Research status and progress of soil heavy metal emission inventory. J. Agric. Environ. Sci. 2024, 43, 2472–2486. (In Chinese) [Google Scholar] [CrossRef]
  5. Smith, K.S.; Graham, M.C.; Hamilton, E.M. Isotopic signatures distinguish natural vs. anthropogenic Pb sources in contaminated soils. Environ. Sci. Technol. 2020, 54, 6508–6517. [Google Scholar]
  6. Han, J.J.; Wu, D.P.; Zhang, T. Pollution Characteristics and risk assessment of heavy metal contamination in soils of a gold mining area in Beijing. Urban Geol. 2021, 16, 424–431. (In Chinese) [Google Scholar] [CrossRef]
  7. Dong, H.B.; Wang, C.L. Development and application of high-density electrical method. Earth Sci. Front. 2003, 10, 171–176. (In Chinese) [Google Scholar] [CrossRef]
  8. Lu, H.J.; Deng, Y.R.; Deng, D.Y.; Liu, L.L.; Zhao, Y.J.; Li, Z.H. Analysis of heavy metal contamination in urban land soils using electromagnetic induction and high-density resistivity methods. J. South China Norm. Univ. 2021, 53, 15–23. (In Chinese) [Google Scholar] [CrossRef]
  9. Liu, W.H.; Qiao, C.P.; Suo, K.; Wang, B.L.; Zhao, Y. Application of integrated geophysical methods in the detection of zinc-contaminated sites. J. North China Univ. Water Resour. Electr. Power 2022, 43, 1–7. (In Chinese) [Google Scholar] [CrossRef]
  10. Reimann, C.; Birke, M.; Demetriades, A.; Filzmoser, P.; O’Connor, P. Limitations of conventional geochemical sampling for environmental studies. Sci. Total Environ. 2012, 426, 308–316. [Google Scholar]
  11. Bi, X.X.; Guo, X.J.; Sun, J.T.; Guo, E.Y. Fine characterization and quantitative analysis of leakage plumes in oil storage areas of gas stations using three-dimensional cross-hole resistivity tomography. Prog. Geophys. 2025, 40, 398–408. (In Chinese) [Google Scholar] [CrossRef]
  12. Binley, A.; Slater, L.D.; Hubbard, S.S. ERT for environmental applications: State of the art. J. Appl. Geophys. 2019, 160, 186–200. [Google Scholar] [CrossRef]
  13. Binley, A.; Slater, L.D.; Hubbard, S.S.; Robinson, J.; Day-Lewis, F.D.; Tiedeman, C.R.; Johnson, C.D.; Lane, J.W.; Imbrigiotta, T.E.; Lacombe, P.; et al. 3D ERT mapping of contaminant plumes in fractured bedrock. Water Resour. Res. 2019, 55, 7329–7348. [Google Scholar]
  14. Han, M.Z.; Li, S.; Wang, X.; Chen, L. Deep migration of Cr and Ni in a chemical park via ERT and geochemistry. Environ. Sci. Pollut. Res. 2023, 30, 45678–45692. [Google Scholar]
  15. Revil, A.; Karaoulis, M.; Johnson, T.C.; Kemma, A. Quantitative interpretation of ERT data: Challenges and solutions. Geophys. J. Int. 2022, 231, 58–77. [Google Scholar] [CrossRef]
  16. Caterina, R.; Flores Orozco, A.; Nguyen, F.; Hermans, T. Joint inversion of geochemical and ERT data for 3D contaminant mapping. J. Contam. Hydrol. 2021, 243, 103912. [Google Scholar] [CrossRef]
  17. Zhang, L.X.; Wang, J.G.; Li, Z.Q.; Zhang, Y.F.; Zhang, Z.H.; Liu, J.H.; Zhang, Y.L.; Zhang, Y. Current status and prospects of integrated geophysical and geochemical exploration. Adv. Earth Sci. 2022, 37, 512–525. (In Chinese) [Google Scholar]
  18. Yang, L.; Zhang, Q.; Wang, S.; Jin, W.; Shang, Y. Effects on the resolution of high-density electrical method by electrodes array deploying. Prog. Geophys. 2019, 34, 172–178. (In Chinese) [Google Scholar] [CrossRef]
  19. Auken, E.; Christiansen, A.V.; Kirkegaard, C.; Fiandaca, G. Advantages of integrating geophysical and geochemical data. Surv. Geophys. 2021, 42, 1421–1445. [Google Scholar] [CrossRef]
  20. Keesstra, S.; Mol, G.; de Leeuw, J.; Okx, J.; Molenaar, C.; de Cleen, M.; Visser, S. Soil-related sustainable development goals: Four solutions. Sustainability 2024, 16, 56. [Google Scholar]
  21. HJ 25.2-2019; Ministry of Ecology and Environment. Technical Guidelines for Monitoring during Risk Control and Remediation of Soil Contamination of Land for Construction. China Environmental Publishing Group: Beijing, China, 2019.
  22. HJ 166-2021; Ministry of Ecology and Environment. Technical Specification for Soil Environment Monitoring. China Environmental Publishing Group: Beijing, China, 2021.
  23. HJ 1315-2023; Ministry of Ecology and Environment. Soil and Sediment-Determination of 19 Total Metal Elements-Inductively Coupled Plasma Mass Spectrometry. China Environmental Publishing Group: Beijing, China, 2023.
  24. HJ 680-2013; Ministry of Environmental Protection. Soil and Sediment-Determination of Mercury, Arsenic, Selenium, Bismuth, Antimony-Microwave Dissolution/Atomic Fluorescence Spectrometry. China Environmental Science Press: Beijing, China, 2013.
  25. HJ 962-2018; Ministry of Ecology and Environment. Determination of Soil pH by Potentiometry. China Environmental Publishing Group: Beijing, China, 2018.
  26. Liu, H.F.; Liu, J.X.; Guo, R.W.; Deng, X.K.; Ruan, B.Y. Efficient inversion of 3D IP data for continuous model with complex geometry. J. Jilin Univ. 2011, 41, 1212–1218. (In Chinese) [Google Scholar]
  27. Liu, H.F.; Guo, Z.W.; Liu, J.X.; Guo, R.W.; Ma, C.Y. 3D DCIP inversion using the finite-element approach with variable elements. Near Surf. Geophys. Environ. Prot. 2014, 27, 697–706. [Google Scholar]
  28. Liu, H.F.; Zhao, Y.J.; Zhang, Y.H.; Li, X.Q.; Zhu, D.W. Research on three-dimensional resistivity imaging for non-conventional electrode arrays in restricted exploration area. Appl. Sci. 2025, 15, 68. [Google Scholar] [CrossRef]
  29. Liu, H.F.; Ruan, B.Y.; Liu, J.X. The conjugate gradient algorithm of variational damping and its capability analysis. Prog. Geophys. 2008, 23, 89–93. (In Chinese) [Google Scholar]
  30. GB 15618-2018; Soil Environmental Quality Agricultural Land Soil Pollution Risk Control Standard. China Environmental Publishing Group: Beijing, China, 2018.
  31. DZ/T 0295-2016; Specification of Land Quality Geochemical Assessment. The Geological Publishing House: Beijing, China, 2016.
  32. Wu, X.P.; Wang, T.T. Progress of Study on 3D Resistivity Inversion Method. Prog. Geophys. 2002, 17, 156–162. (In Chinese) [Google Scholar] [CrossRef]
  33. Tian, S.B.; Song, M.X.; Mei, R.; Dai, X.Q. Numerical simulation of high-density resistivity method in contaminated sites. Comput. Tech. Geophys. Geochem. Explor. 2025, 47, 253–271. (In Chinese) [Google Scholar] [CrossRef]
  34. Di, Q.Y.; Wang, M.Y. Three-dimensional resistivity imaging using integral method. Chin. J. Geophys. 2001, 44, 843–851. (In Chinese) [Google Scholar] [CrossRef]
  35. Guo, X.J.; Zhang, Z.Y.; Liang, W.J. A new method of three-dimensional resistivity imaging and its application. J. Jilin Univ. 2005, 35, 123–128. (In Chinese) [Google Scholar] [CrossRef]
  36. Zhou, Y.; Wang, L.; Chen, X.; Zhang, H. Numerical simulation analysis of high-density resistivity method based on contaminated site modeling. J. Geophys. Eng. 2025, 22, 1–12. (In Chinese) [Google Scholar]
  37. Cao, E.W.; Ye, P.; Liu, L.Q.; Liu, Z.; Zhao, X.R.; Liu, Z.B. Application progress of ERT technology in environmental pollution investigation. Environ. Prot. Chem. Ind. 2025, 45, 11–18. (In Chinese) [Google Scholar] [CrossRef]
Figure 1. Geological map of the site area. 1—Banxi Group, 2—fault, 3—formation occurrence, 4—drainage system, 5—solid waste disposal area, 6—key contaminated area.
Applsci 15 10969 g001
Figure 2. Schematic diagram of sample point layout.
Applsci 15 10969 g002
Figure 3. Three-dimensional electrode observation array.
Applsci 15 10969 g003
Figure 4. 3D ERT results.
Applsci 15 10969 g004
Figure 5. 3D ERT slices map at different depths (a) −0.5 m; (b) −1 m; (c) −1.5 m; (d) −2 m; (e) 2.5 m; (f) −3 m; (g) −4 m; (h) −5 m; (i) −7 m; (j) −9 m.
Applsci 15 10969 g005aApplsci 15 10969 g005b
Figure 6. Planar distribution of antimony (Sb) content.
Applsci 15 10969 g006
Figure 7. Resistivity distribution at a depth of −0.5 m.
Applsci 15 10969 g007
Figure 8. Comparison of resistivity and antimony contamination in the profile of borehole 1b02-1c02-1c03.
Applsci 15 10969 g008
Figure 9. Comparison of resistivity and antimony contamination in the profile of borehole 1b03-1b01-1c02.
Applsci 15 10969 g009
Figure 10. Relationship between resistivity and antimony content.
Applsci 15 10969 g010
Figure 11. Relative error of predicted antimony content.
Applsci 15 10969 g011
Figure 12. Three-dimensional results of antimony content.
Applsci 15 10969 g012
Figure 13. Slice diagram of three-dimensional results of antimony (Sb) content (depth: (a) −0.5 m; (b) −1 m; (c) −1.5 m; (d) −2 m; (e) −2.5 m; (f) −3 m; (g) −4 m; (h) −5 m; (i) −7 m; (j) −9 m).
Applsci 15 10969 g013aApplsci 15 10969 g013b
Table 1. Microwave digestion heating program design.
StageTemperature (°C)Heating Time (min)Holding Time (min)
1Room temperature—12073
2120–16053
3160–180525
Table 2. Sampling test analysis results.
Point NumberCu
(mg/kg)
Zn (mg/kg)Ni (mg/kg)Sb (mg/kg)Tl (mg/kg)Cd (mg/kg)Hg (mg/kg)Pb (mg/kg)
T127.611019.17520.5110.1660.16227.6
T226.810621.819050.6020.2250.19340.1
T733.610424.39000.5510.1940.04722.6
T836.411221.53010.4960.2110.08425.4
T932.414720.717030.6420.1820.05937.3
T1035.815922.88800.5510.1510.05530.9
T1137.116225.39650.5640.2420.08130.5
T1233.215520.86000.5630.2210.06428.3
T1338.715419.521500.5330.2640.07733.2
T1441.914220.523600.5350.2310.09334.9
T1538.313220.213260.4910.2330.12341.2
T1631.116035.110550.5620.1940.09223.3
T1721.415035.811660.5540.1110.04315.6
1b0131.512130.817030.5140.2170.06618.7
1b0246.314333.88200.5390.2250.07817.5
1b0337.213631.49540.4540.2410.05820.9
1c0128.414626.211440.4690.2040.09323.9
1c0232.711822.310220.5370.2210.05730.4
1c0334.615223.18050.5060.1960.05230.4
Table 3. Pollution Assessment Classification.
Pollution LevelPollution IndexPollution Level
Pi ≤ 1clean
1 < Pi ≤ 2Slightly polluted
III2 < Pi ≤ 3Light pollution
IV3 < Pi ≤ 5Moderate pollution
Pi > 5Severe pollution
Table 4. Evaluation criteria for single-factor pollution of heavy metals in soil.
Sampling Point NumberPollution Index (Pi)Pollution Level
T14.2Moderate pollution
T210.6Severe pollution
T75.0Moderate pollution
T81.7Slightly polluted
T99.5Severe pollution
T104.9Moderate pollution
T115.4Severe pollution
T123.3Moderate pollution
T1311.9Severe pollution
T1413.1Severe pollution
T157.4Severe pollution
T165.9Severe pollution
T176.5Severe pollution
1b019.5Severe pollution
1b024.6Moderate pollution
1b035.3Severe pollution
1c016.4Severe pollution
1c025.7Severe pollution
1c034.5Moderate pollution
average value6.6Severe pollution
Table 5. Corresponding statistics of antimony content and 3D ERT resistivity values in geochemical tests.
Sampling Point NumberDepth (m)Resistivity (Ω·m)Sb (mg/kg)
T10.5276.1752
T20.583.41905
T70.5192.9900
T80.51041.5301
T90.593.31703
T100.5199.4880
T110.5163.4965
T120.5339.9600
T130.575.42150
T140.558.92360
T150.5100.21326
T160.5128.31055
T170.5110.71166
1b010.593.71703
1b020.5230.9820
1b030.5168.3954
1c010.5117.81144
1c020.5137.71022
1c030.5237.9805
1b01360.22250
1b016.546.62740
1b01938.33250
1b02327.43540
1b026.557.52400
1b029156.3980
1b03344.82840
1b036.517.54040
1c02348.42650
1c026.545.12850
1c03342.42950
1c036.580.52050
1c03913.24320
Disclaimer/Publisher’s Note: The statements, opinions and data contained in all publications are solely those of the individual author(s) and contributor(s) and not of MDPI and/or the editor(s). MDPI and/or the editor(s) disclaim responsibility for any injury to people or property resulting from any ideas, methods, instructions or products referred to in the content.