Article

Behavior of the Vault in Column-Free Large-Span Metro Stations Under Asymmetric Loading

1
College of Civil Engineering, Tongji University, Shanghai 200092, China
2
Shanghai Mechanized Construction Group Co., Ltd., Shanghai 200072, China
*
Author to whom correspondence should be addressed.
Appl. Sci. 2025, 15(20), 10944; https://doi.org/10.3390/app152010944
Submission received: 8 September 2025 / Revised: 28 September 2025 / Accepted: 30 September 2025 / Published: 11 October 2025
(This article belongs to the Special Issue New Challenges in Urban Underground Engineering)

Abstract

To explore the application of precast concrete construction methods in underground stations, a combined precast and cast in situ construction method was adopted for a long-span column-free underground subway station. To study the stability of large-span underground arch structures under asymmetric loading, a full-scale test was conducted using the displacement-force control method. Steel blocks were used to simulate the overlying soil and additional loads on the upper surface of the arch, while the displacement of the arch foot was applied by adjusting the tension of the cables. The maximum tensile stress and maximum compressive stress of the steel bars appeared at the midpoints of the left and right arches, which were less than the yield stress of the steel bars. The results show that the structural stability meets the design requirements and provides a considerable safety margin. A comprehensive analysis of the arch structure under asymmetric loading was carried out through on-site monitoring, numerical simulation, and analytical solutions. The results are in good agreement: compared with the experimental results, the calculated values increase the maximum deflection of the arch by 13.67%, which verifies the reliability of the numerical simulation and analytical solution methods under the same boundary conditions. However, restricted by test conditions, the loading in this study was only applied on one side of the arch crown, which differs from the actual working condition involving full loading first followed by unloading on one side.

1. Introduction

A large-span column-free metro station refers to a station with a wide span and no columns in the public area, typically designed as an island-type two-story underground station, in contrast to the traditional two-story, three-span column-supported station [1,2]. The public area of such stations is open and exhibits a distinctive architectural style. At present, most large-span column-free metro stations employ traditional flat roofs. By incorporating haunches or adopting variable cross-section designs, the station as a whole forms a large-span column-free box frame structure, which reduces the bending moment at mid-span and enhances the roof’s load-bearing capacity.
In addition to the common box-frame structure, other structural forms have occasionally been adopted in large-span underground stations. For instance, arch structures have been applied in some metro stations [3,4]. The appeal of the arch lies in its capacity to bear loads primarily through axial compression. Currently, metro stations are mainly constructed by open-cut or cut-and-cover methods. To ensure the stability of large-span underground spaces, several countries have developed concrete arch pre-support systems (CAPS), rib-shaped underground structures consisting of arch beams and concrete piles on both sides, and umbrella-arch systems, as seen in Iran [5], Austria [6], Türkiye [7], and China [8]. Based on soil conditions and limited construction space, Guo et al. [9] proposed a method for large-span underground excavation stations combining the shaft method with the arch-cover method. This approach reduced construction procedures and saved space. Most of these engineering cases adopted underground excavation methods. However, as reinforced concrete arches were cast on site, the use of curved formwork proved inefficient and costly. Furthermore, at least one structural column was typically reserved in the middle of these arched stations, impeding passenger flow.
To address these limitations, a combined precast and cast in situ construction method for large-span underground arches was proposed. This technique was applied in practice at the Wuzhong Road Metro Station in Shanghai [10,11], which was constructed using the open-cut method. The vault consisted of two parts: a precast layer and a cast in situ layer. As a permanent bottom formwork, the prefabricated arch shell solves the complexity and time-consuming problems of curved formwork construction, significantly improving construction efficiency and shortening the construction period by 50%. Meanwhile, the cast in situ part ensures the structural integrity: under the working condition of full-span dead load, the cast in situ concrete provides higher stability, and the maximum bending moment of the arch crown member is reduced by 40%. Compared with traditional methods, the combined prefabricated and cast in situ approach optimizes the construction process while enhancing structural stability [10,12,13]. Owing to the structural characteristics of the arch, no columns were required in the ticket hall, which increased the usable space of the station. Similar arch lining construction technologies have also been adopted in metro projects such as the Changchun Metro [14,15] and the Shenzhen Metro [16,17].
Therefore, it is necessary to analyze the stability of this new type of column-free long-span superimposed arch under various working conditions in underground engineering [18,19]. The internal force of the arch crown may be affected by the distribution of overlying load. When subjected to external factors such as pavement reconstruction or pipeline installation, the vault may experience lateral displacement, resulting in unbalanced stresses in the arch structure. Pi et al. [20] analyzed the influence of load location on the buckling modes of arches. Lu et al. [21] solved the nonlinear equilibrium of clamped shallow arches under local loading based on similarity theory. Beyond theoretical research and numerical methods, some studies have been carried out through experimental approaches. Stevens [22], for example, demonstrated that the experimentally determined ultimate bearing capacity of circular arches under concentrated loads closely matched the results obtained through rigid–plastic model analysis. Lu et al. [23] investigated the in-plane ultimate bearing capacity of circular arches with elastic supports and rigid connections using experimental methods.
Previous studies on the combined precast and cast in situ construction method for long-span underground arch bridges have been restricted to the working condition of full-span dead load [10], and there is a lack of research on how this method performs under half-span loads. The half-span load condition comes from the fact that during the station’s service period, pavement reconstruction or pipeline installation may exert half-span overlying load on the arch. To address this issue, this paper explores the mechanical behavior of the arch crown under asymmetric loads and conducts a full-scale model test. In this test, steel blocks were placed on the upper surface of the arch to simulate ground pressure caused by the overburden soil and additional loads. The aim was to analyze the internal forces and deformation of the stacked arch and to verify the reliability of the structure under half-span loading. For structural analysis of the vault, both the classical elastic center method and numerical simulation were employed to evaluate the internal forces of the circular arch under asymmetric loading, and the results were compared with experimental monitoring data. The analytical solutions based on the linear theory of circular arches greatly facilitated the structural analysis of underground vaults.

2. Engineering Background

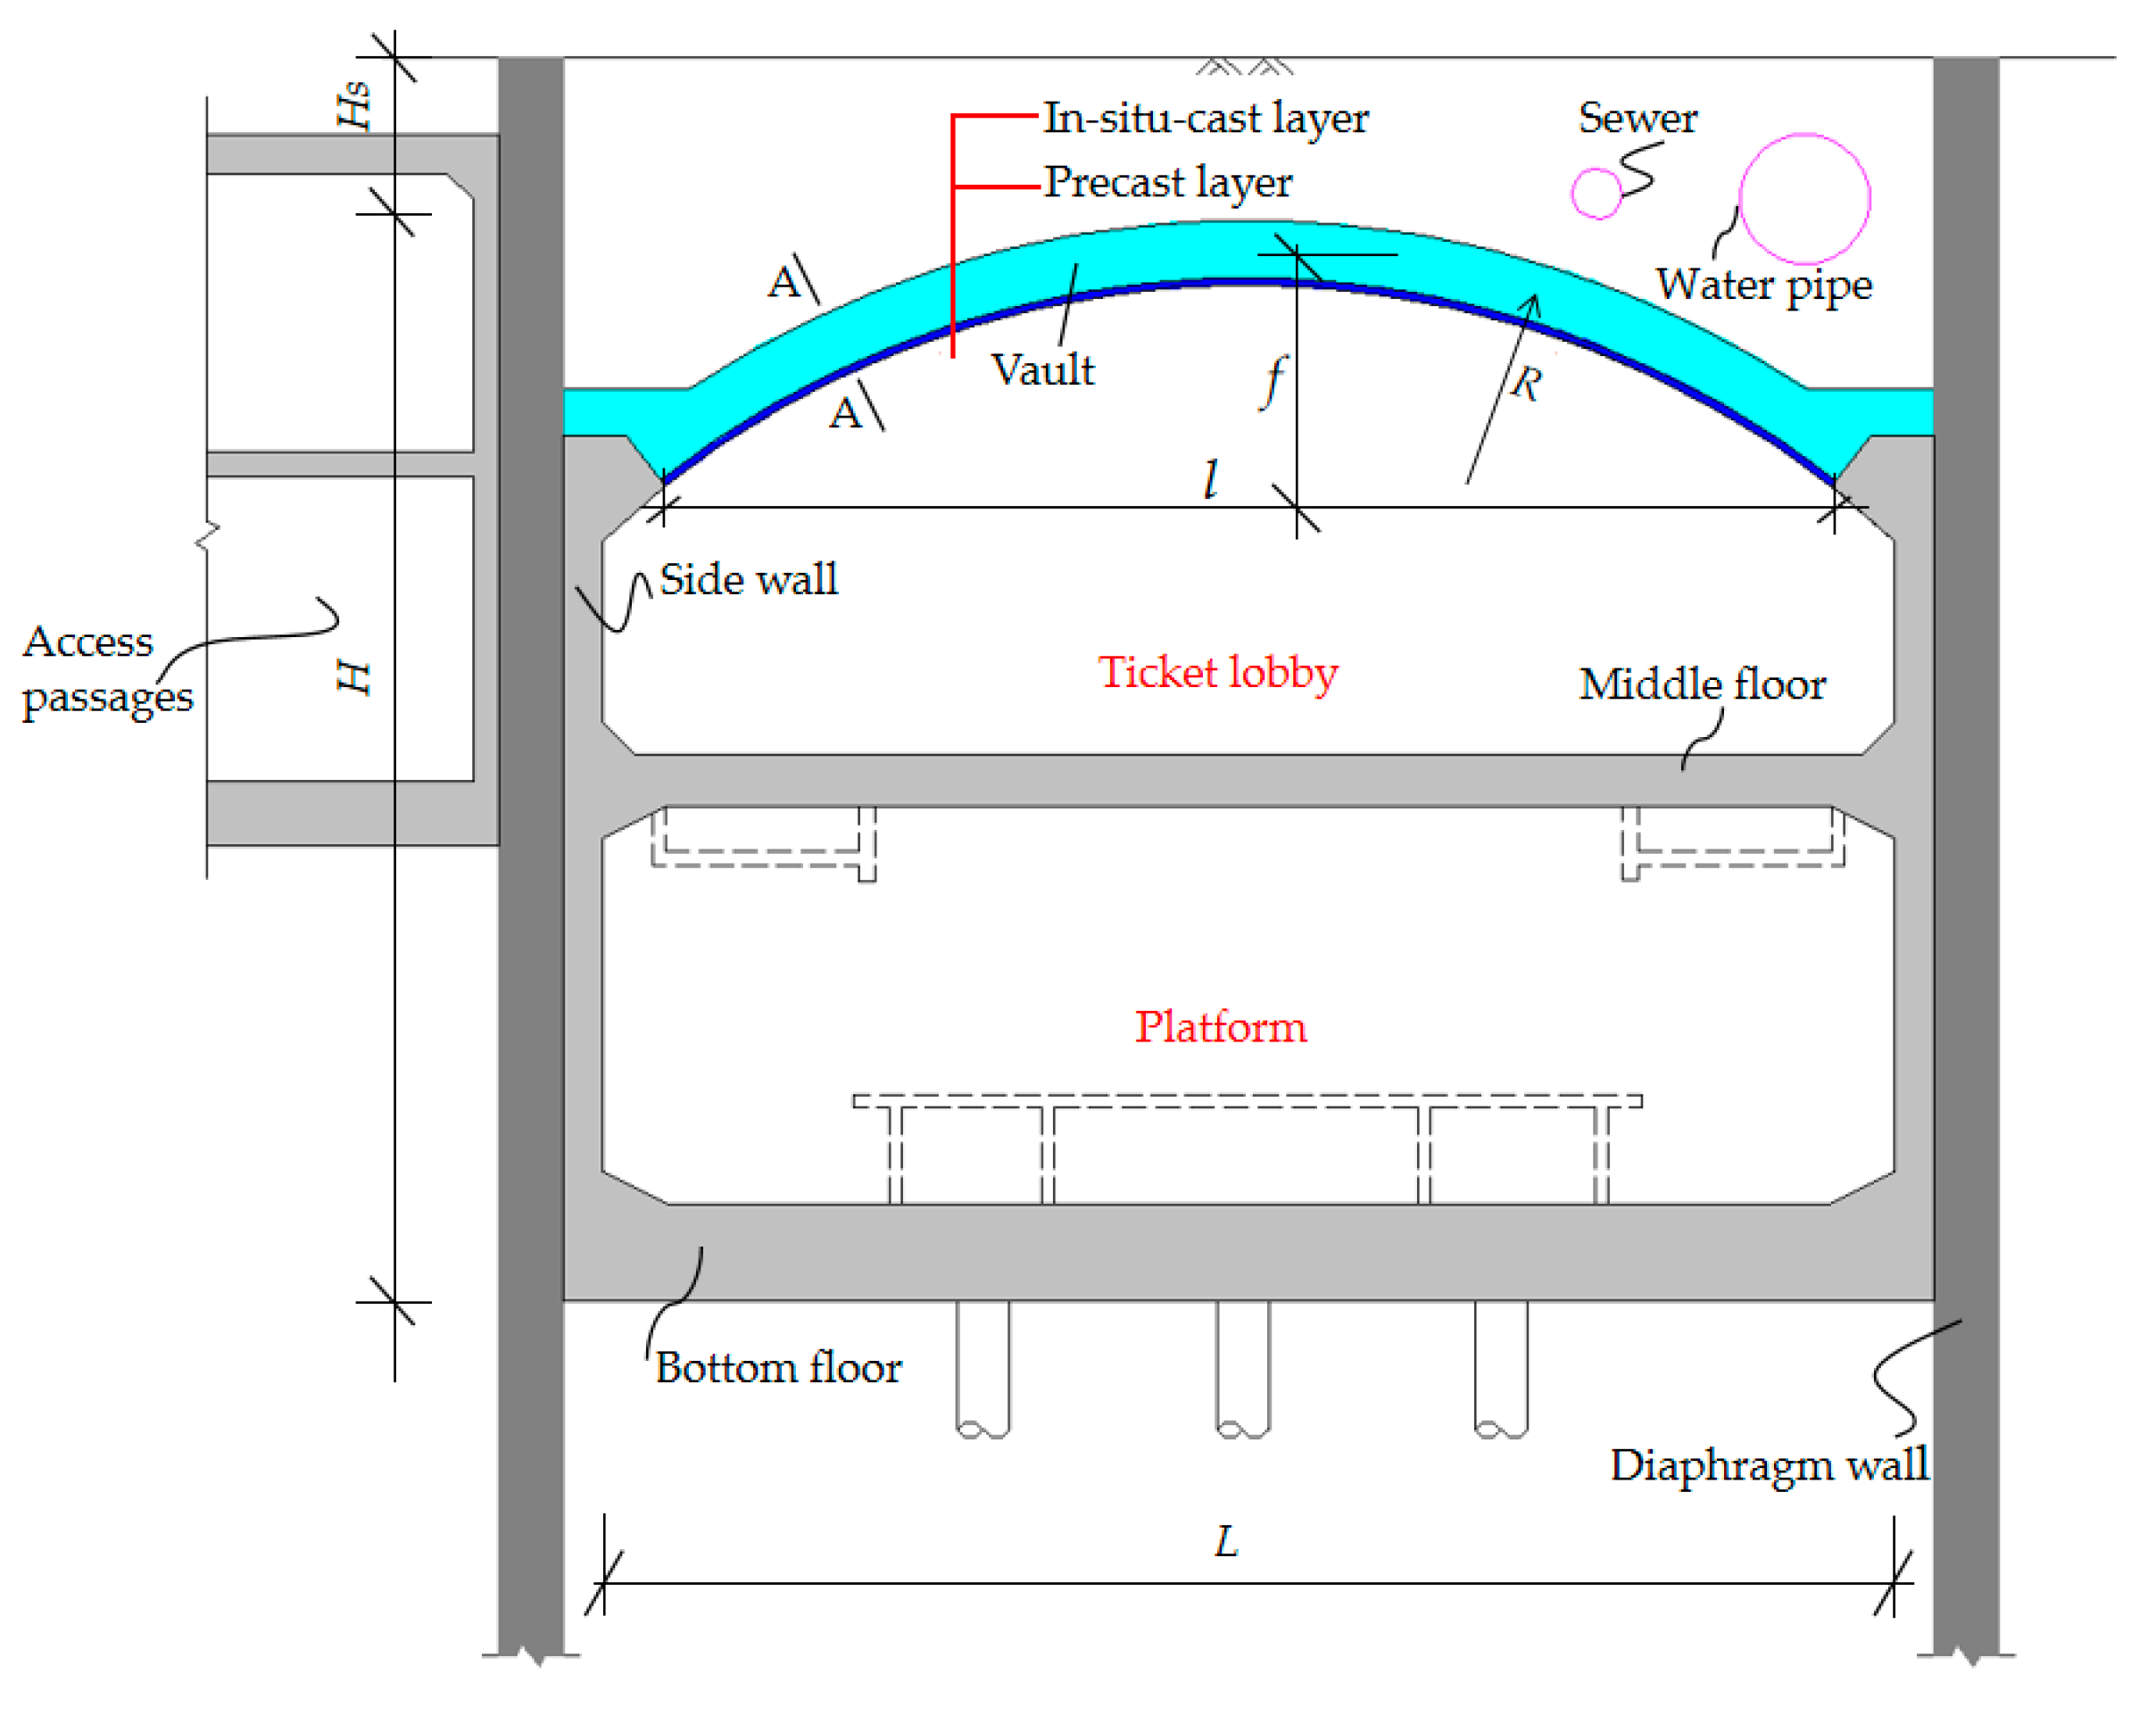
The vault of the Wuzhong Road Metro Station on Line 15 in Shanghai, China, is a composite structure consisting of precast and cast in situ layers. As shown in Figure 1, the station is located near the intersection of Guilin Road and Wuzhong Road, with its north side adjacent to Wuzhong Road. The station measures 170 m in length and 20 m in width, and is designed as a two-story column-free structure. The vault comprises two layers—the precast layer and the cast in situ layer—as illustrated in Figure 2. This study focuses primarily on the structural analysis of the vault.
The prefabricated structure consists of two segments, as shown in Figure 3a. Segments A and B are upper double-ribbed sections (Figure 3b), which enhance the bending stiffness of the precast layer and increase the contact area with the cast in situ concrete [24]. The total longitudinal length of the precast arch segments is 93.6 m. The composite arch is assembled from 62 components, with each component having a width of w = 2.95 m. This dimension meets the requirements for standardized precast components, facilitating transportation and assembly, and conforms to the transportation and installation requirements of precast components, which helps improve construction efficiency and reduce project costs. The thicknesses of the precast arch segments (tp) and the integral arch (ti) are 0.1 m and 1 m, respectively. The rib height (hr) and width (br) of the precast segments are 0.5 m and 0.25 m, respectively [10]. Stirrups at the ribs and partially embedded truss rebars in the prefabricated structure improve the superposition effect with the cast in situ concrete [25,26].
The vault is designed as a clamped circular arch with radius R = 15.1 m, span l = 18.6 m, and rise f = 3.2 m. The arch concrete is of strength class C40. The covering soil above the crown of the arch has a height Hs = 2.65 m, with an additional overload of p0 = 20 kPa. The soil unit weight is 20 KN/m3. The elastic modulus of concrete (Ec) is 32.5 GPa, while that of reinforcement (Es) is 200 GPa. The overall station structure has a height H = 17 m, and its width L ranges from 19.8 m to 21.6 m.
The segments were prefabricated in a factory and transported to the construction site. After installation, two precast arch shells formed a three-hinged arch. Reinforcement bars and cast in situ concrete were then placed on the bottom formwork of the cast in situ layer. Upon concrete hardening, the three-hinged arch was transformed into a clamped integral arch.

3. Experimental Method and Results

To study the impact of asymmetric loading on the column-free long-span subway station arch crown, a full-scale model of a 2.95 m isolated segment was selected as the transverse representative unit in this paper, and the impact of loads on its interface was analyzed. Before conducting the test, the key installation procedures for the precast arch segments are arranged as follows:
  • Arch segments A and B were precast in a factory. After reaching the required concrete strength, they were transported to the construction site.
  • The precast segments were assembled on site to form a three-hinged arch, as shown in Figure 3a. Cast in situ concrete was then placed on top of the precast layer to form an integral arch.
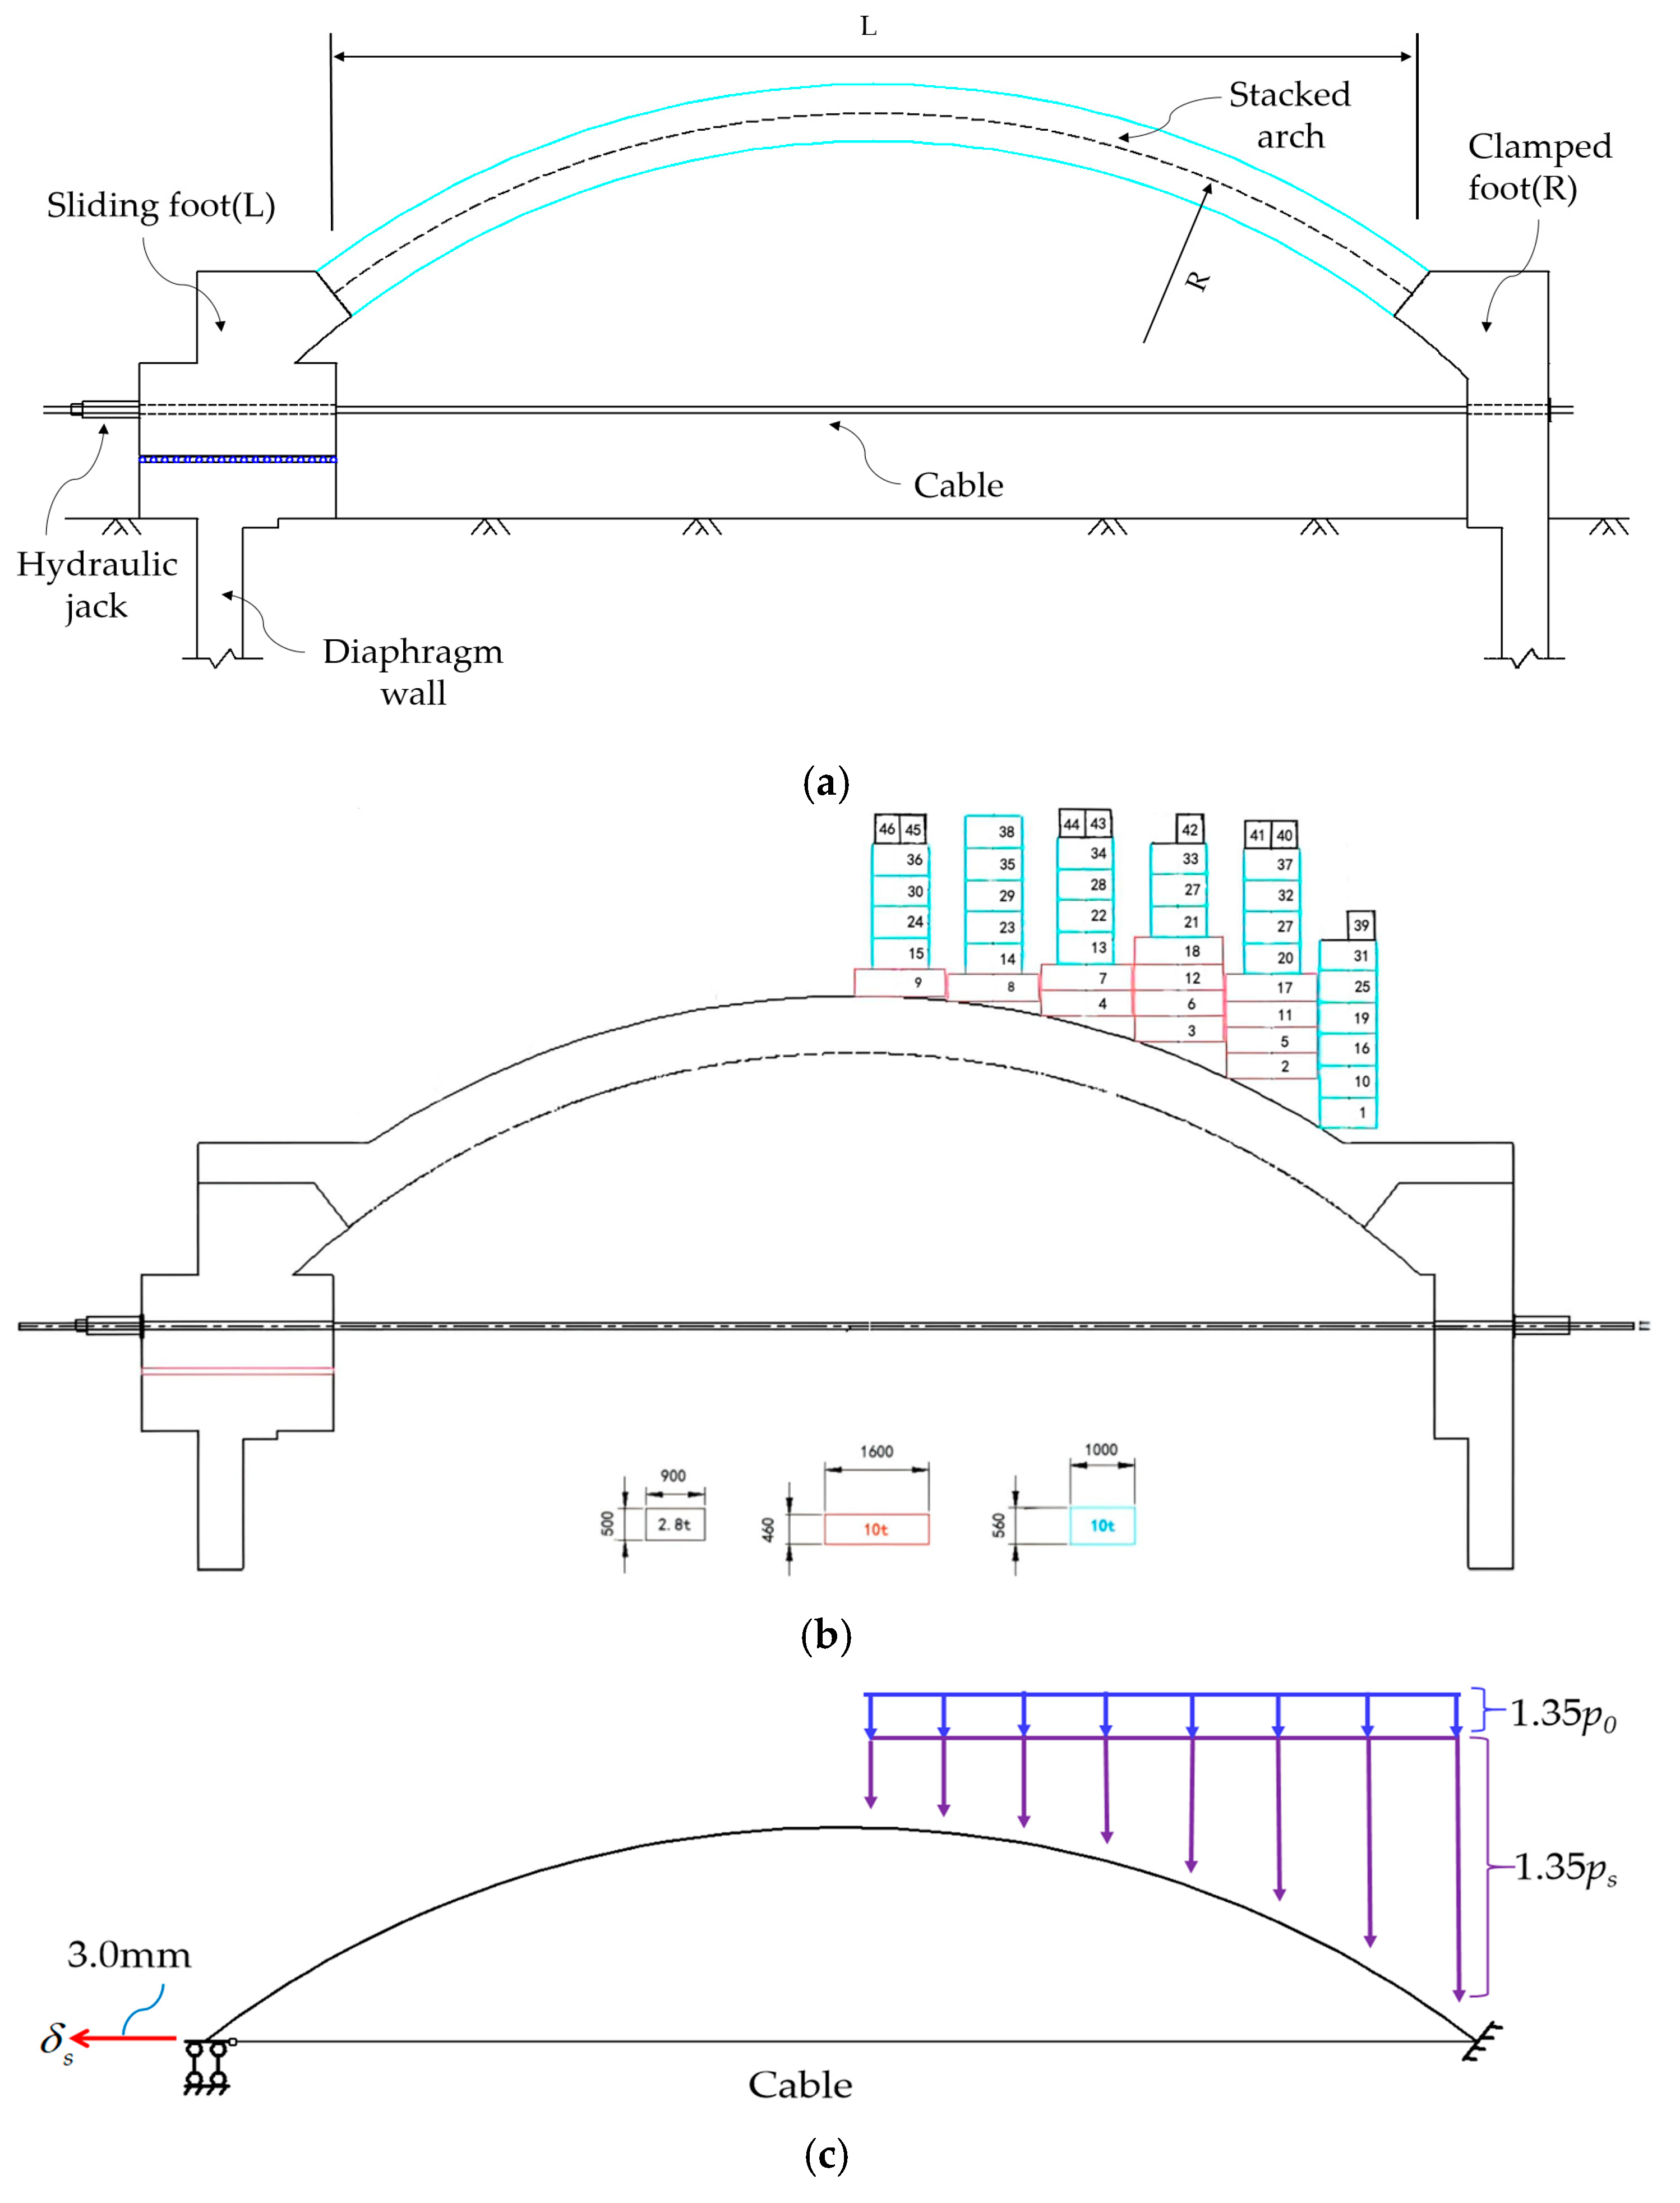
  • The test was carried out using a force–displacement hybrid control method [27]. In this test, the horizontal ground pressure was set to zero, while the vertical ground pressure was increased by a safety factor of 1.35. A total of 46 iron blocks were placed on the upper surface of the arch to simulate vertical ground pressure, as illustrated in Figure 4c. By adjusting both the applied load and the prescribed displacement, the internal forces and deformations of the stacked arch were analyzed.

3.1. Test Scheme

Since boundary conditions have a significant impact on the response of the arch crown structure, they must be strictly controlled during the test. In underground structures, the displacement of the arch feet is usually constrained by the side walls. However, even with such constraints, a certain degree of displacement still occurs at the arch feet when a load is applied to the arch crown; thus, the load and displacement take place simultaneously. To more realistically simulate the impact of asymmetric loading on the arch crown of a column-free long-span subway station and considering the operability of the experiment, the load application and arch foot displacement were divided into two steps in the experimental design of this study, and the sliding displacement method was adopted at the arch feet: before the completion of loading, the displacement of the arch feet was controlled within a specific range, with only the impact of the load on the structure considered; after the completion of loading, the corresponding displacement of the arch feet was then controlled.
The half-span loading scheme of this study is specifically divided into three main steps: first, applying half-span (south half-span, close to the fixed support) stacking load; second, controlling the support sliding; and finally, performing unloading. In each step, the sliding distance of the support was strictly controlled to ensure the accurate limitation of boundary conditions during the test. The specific implementation methods are as follows:
  • A crane was used to stack 46 iron blocks in sequence from the fixed arch foot to the arch crown according to the numbering (see Figure 4b for the stacking order). By adjusting the jack load, the displacement of the sliding support was controlled to remain within the range of 1 mm from the initial position during the reloading process until the half-span stacking load was completed.
  • After the completion of the half-span stacking load, the horizontal sliding of the left arch foot was achieved by controlling the jack, with an average speed of 0.3 mm per loading level, and the total displacement could reach 3 mm (see Figure 4b). The right arch foot was clamped. The sliding displacement was applied by adjusting the cable tension. Finally, the sliding arch foot was fixed with a restraint, marking the completion of the experiment.
  • The counterweight blocks were unloaded in the reverse order of the stacking order, and the support displacement was adjusted back to the initial position.

3.2. Test Equipment

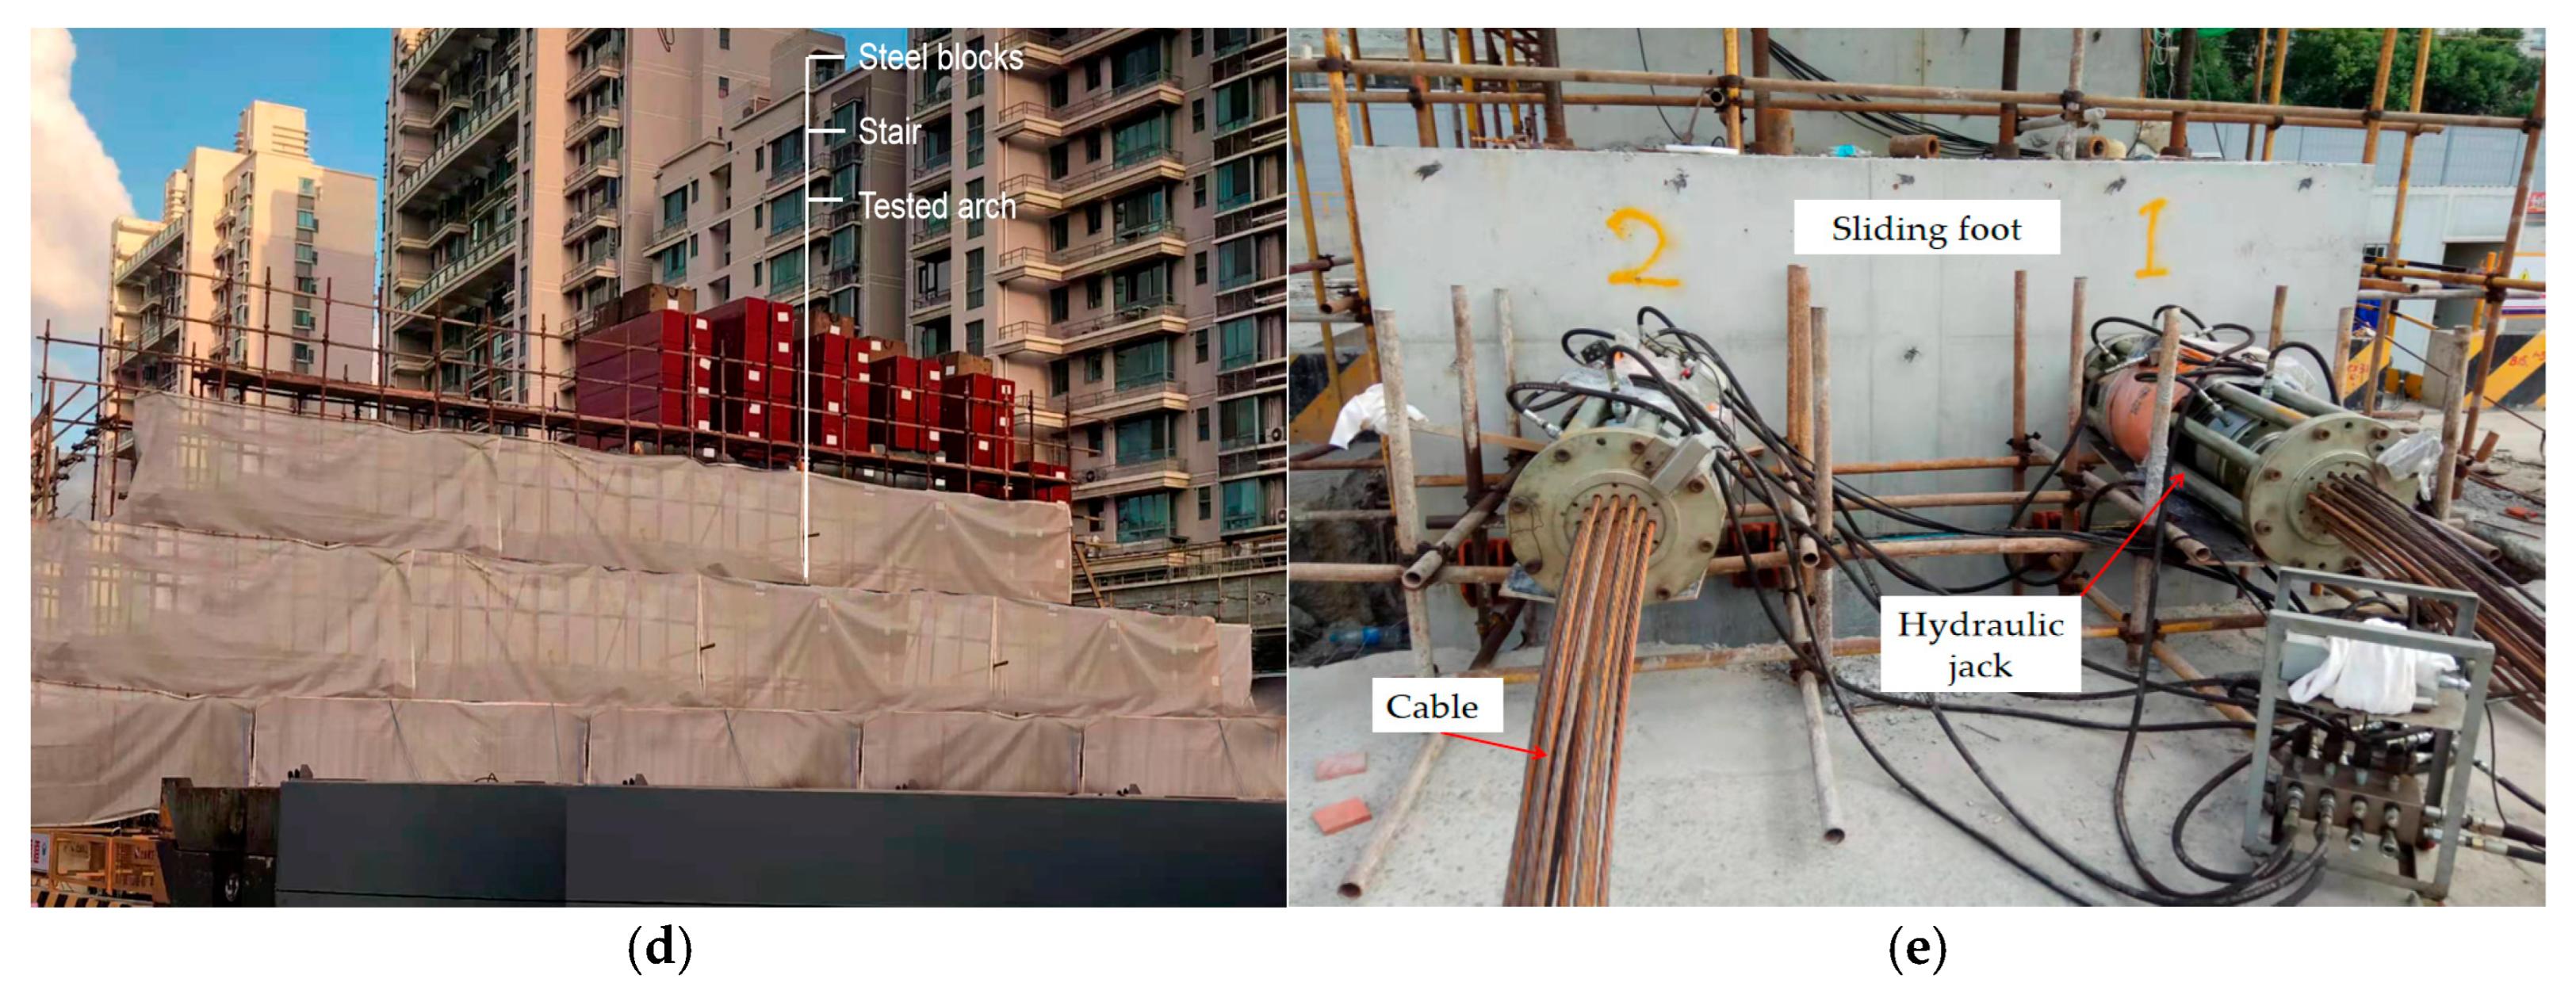
The experimental set-up consisted of the stacked arch, clamped foot, sliding foot, cables, hydraulic jack, stairs, and steel blocks, as illustrated in Figure 4a,d. Three different specifications of steel blocks were used to simulate vertical ground pressure. Their dimensions and weights are as follows: Specification 1: Dimensions of 2.84 m × 1.0 m × 0.56 m, weight of 10 t, with a total of 26 blocks used; Specification 2: Dimensions of 2.5 m × 1.6 m × 0.46 m, weight of 10 t, with a total of 12 blocks used; and Specification 3: Dimensions of 0.9 m × 0.9 m × 0.516 m, weight of 2.8 t, with a total of 8 blocks used. The arrangement of these steel blocks is shown in Figure 4c. As shown in Figure 4e, the tension of the cable was adjusted by controlling the load applied through a hydraulic jack at one end of the sliding foot, thereby modifying the boundary constraint of the arch foot.

3.3. Monitoring Items

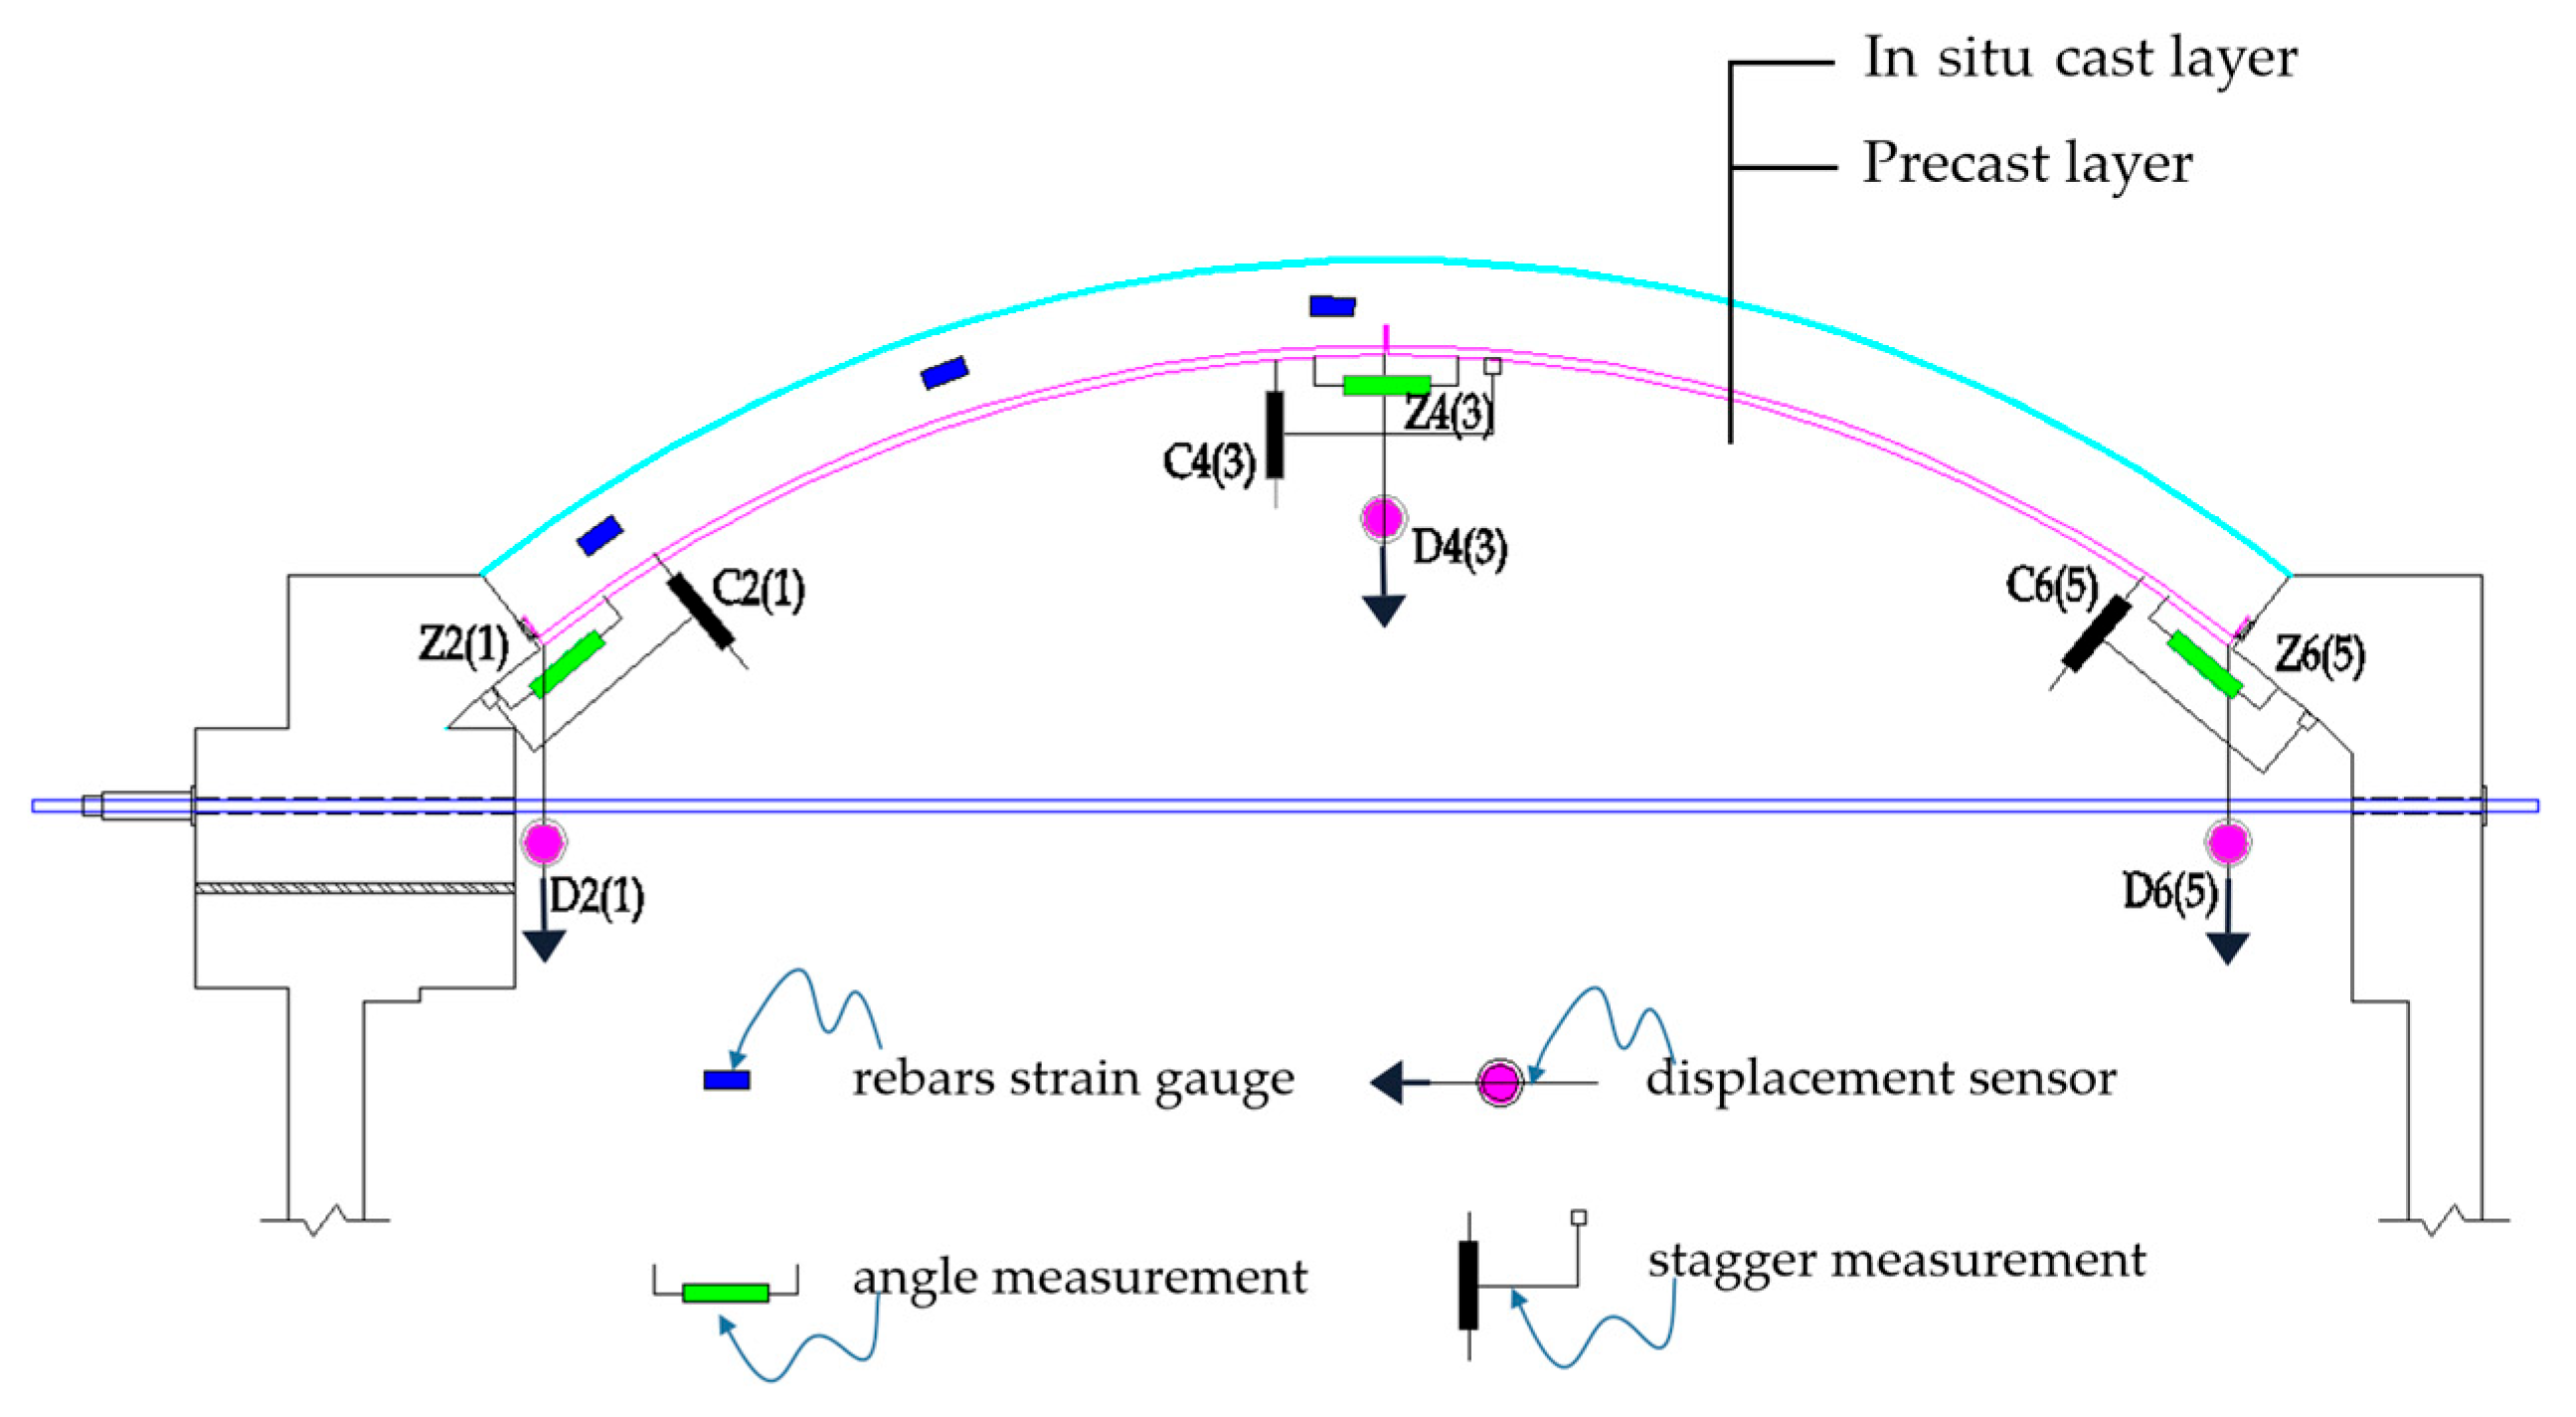
To study the structural behavior under half-span loading, key positions such as the arch feet, arch crown, and sliding interface were selected for displacement measurement. During the test, data on vertical displacement, stagger, and joint opening were recorded. At each selected position of the arch, two instruments of the same type were installed, numbered starting from the left side of the arch structure. Along the entire span, 6 cross-sections were selected for steel bar strain measurement. The left and right sides of the arch were arranged symmetrically, as shown in Figure 5. The monitored parts were located at the arch crown, arch feet, and quarter points of the entire arch. Among the monitoring instruments, the measurement precision of deflection, stagger, and displacement sensors was 0.001 mm, and the effective data precision adopted in this study was 0.01 mm, both of which were within the measurement precision range of the sensors.

3.4. Structural Deformation

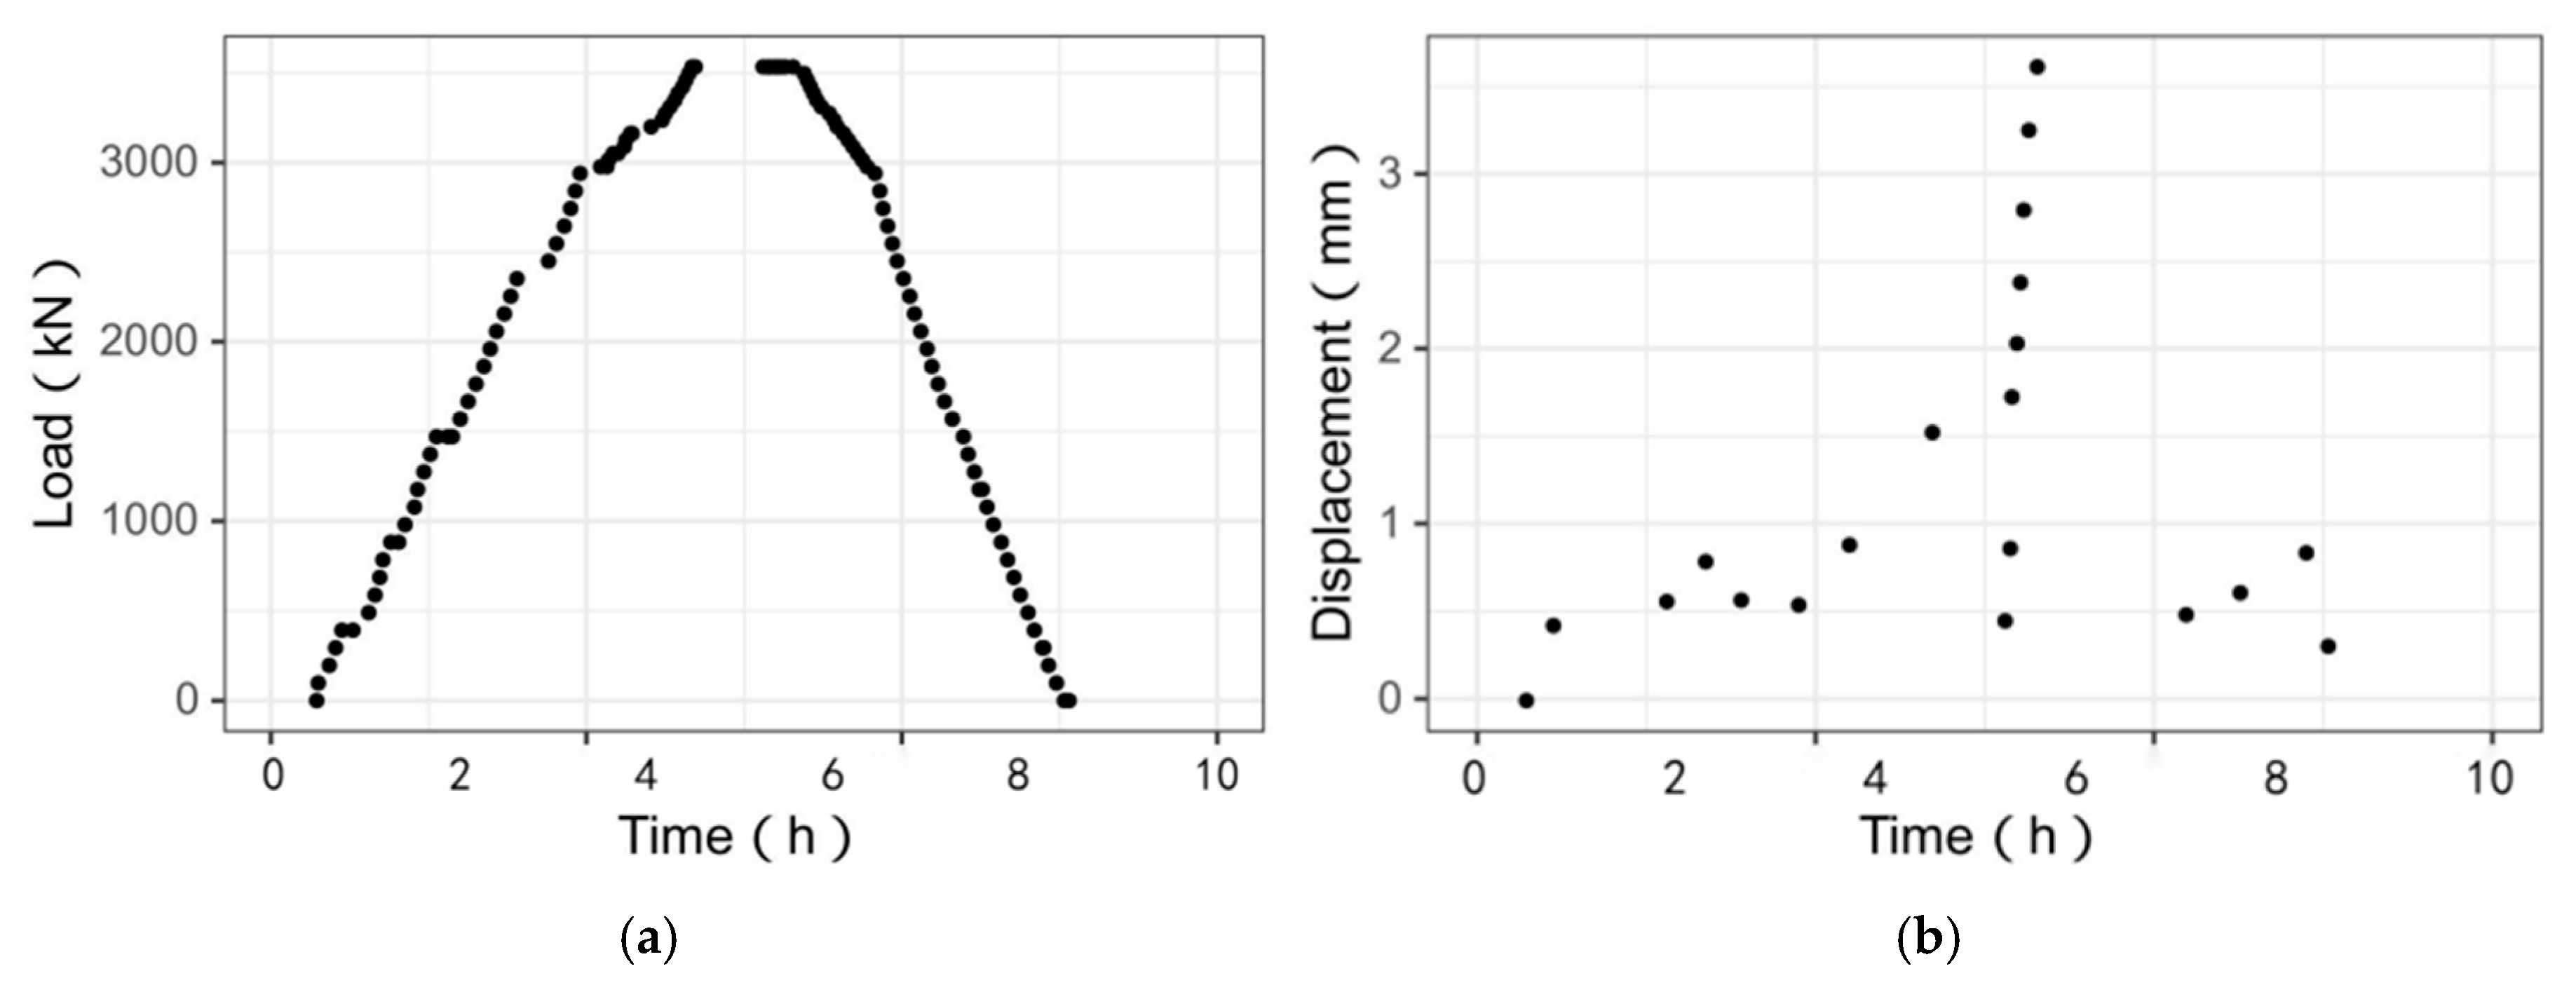
To simulate the real underground load on the arch crown member, jacks and loading blocks were used to adjust its stress state, while the displacement at the arch springing was strictly controlled; after the completion of loading, the arch springing was moved by controlling the jacks, and unloading was carried out once the specified distance was reached. The loading process and the arch springing displacement process are shown in Figure 6a,b, respectively: loading was completed at the 4.45th hour, support adjustment was finished at the 5.2nd hour (at this point, the stacking load was terminated, the release of support displacement was initiated, the support displacement was 0.445 mm, and the arch springing displacement was maintained within 1 mm throughout this period), the release of the support was completed at the 5.5th hour (with a support displacement of 3.613 mm, and unloading was started at this moment), and finally, the unloading of the loading blocks was completed at the 8.4th hour, with the support displacement reaching 0.3 mm.
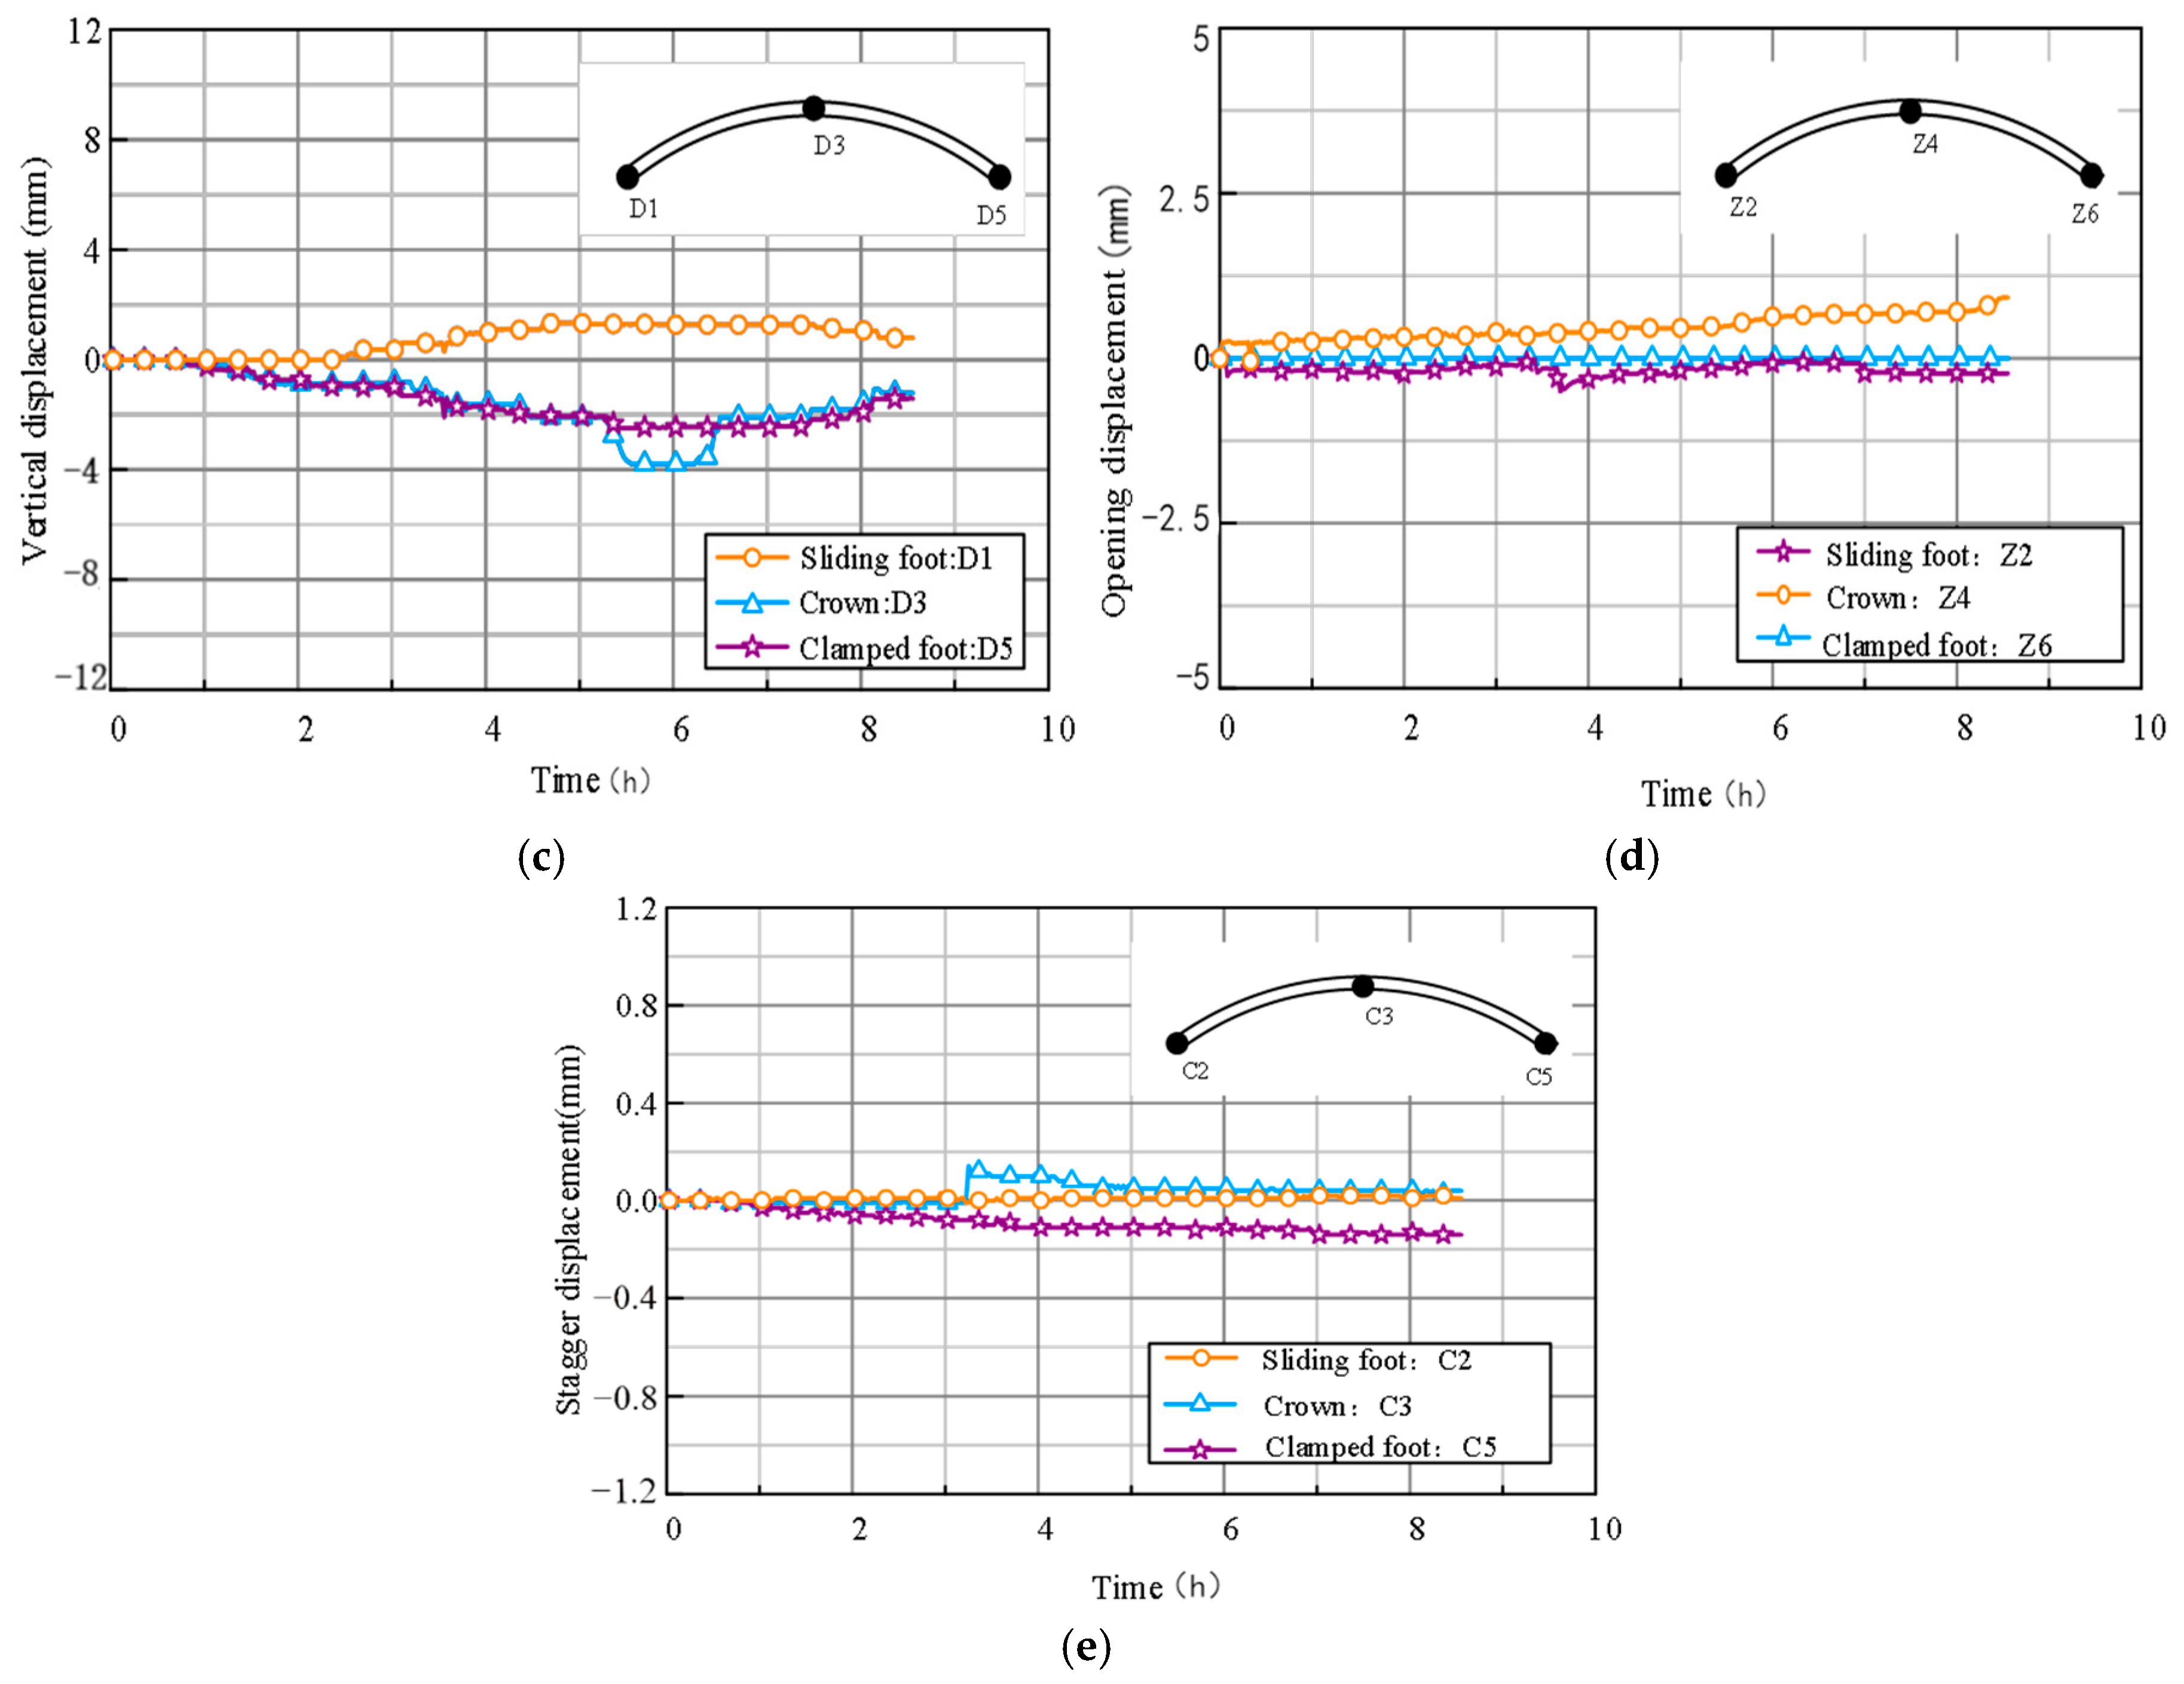
As shown in Figure 6c, the test began at 0 h and unloading was completed at 8.37 h. Loading commenced at 0.48 h with an initial deflection of 0 mm. At 4.26 h, when the load reached 1.35 times the ground pressure, the maximum deflection increment at the crown was −1.61 mm. During this stage, the crown exhibited a downward displacement trend, though the magnitude was small, indicating that the stacked vault possesses high bending stiffness. When displacement control of the sliding foot started at 5.23 h, the crown deflection reached −2.09 mm. As the displacement of the sliding foot increased, the crown deflection showed a linear relationship with the sliding foot movement. At 5.51 h, when the sliding foot displacement reached 3 mm, the test was terminated, and the maximum crown deflection increment was −3.79 mm. Unloading began at 5.62 h and concluded at 8.37 h. Notably, the maximum deflection of 3.79 mm corresponded to only 0.02% of the vault span.
Before 5.23 h, the effect of half-span loading on the crown deflection was evident; however, the loading operation had little influence on the vertical displacement of the two arch feet, as shown in Figure 6c. After 5.23 h, as the sliding foot displacement was gradually increased, the arch axis became slightly flatter and its radius of curvature increased, resulting in downward movement at all points. By geometric relation, the maximum vertical displacement occurred at the crown. The vertical displacements of both arch feet also increased with the bearing displacement, though their maximum values remained similar and below 3 mm.
Throughout the test, the joint opening and stagger values remained small. The opening displacements at the arch crown and feet are shown in Figure 6d, with final measured values below 1 mm. The stagger displacements are presented in Figure 6e, with final values below 0.2 mm. These results demonstrate that once the concrete hardened, the three-hinged precast arch segments, cast in situ layer, and side walls formed an integral structure. Consequently, the joint connections exhibited good performance, and the side walls provided strong constraints on the deformation of the precast arch structure. Therefore, the stacked arch demonstrated excellent stiffness and structural integrity under asymmetric loading.

3.5. Structural Stresses

3.5.1. Precast Layer

After completion of the half-span loading test, the strain in the bottom-row reinforcement near the mid-span of the precast layer was close to zero, indicating that the maximum bending moment occurred near the left and right arch waists. According to the test results, the maximum tensile strain and maximum compressive strain in the reinforcement of the loaded right half-span were 250 με and −100 με, corresponding to reinforcement stresses of 50 MPa and −20 MPa, respectively. A preliminary assessment suggests that the mid-span section of the right half-arch was subjected to positive bending moment, whereas the mid-span section of the left half-arch experienced negative bending moment. At the clamped arch foot, the maximum compressive strain of the bottom-row reinforcement in the precast layer was −150 με, and the calculated compressive stress in the concrete was about 4.8 MPa, which is below the compressive strength of the C40 precast concrete. Therefore, the precast concrete layer did not fracture, and the arch foot joint remained safe under load.
As the sliding foot displacement increased, the stress in the bottom-row reinforcement near the mid-span showed a positive trend, indicating tension. However, the tensile stress increment was small (approximately 21 με), corresponding to an equivalent concrete tensile stress of 0.68 MPa, which is lower than the tensile strength of concrete. Thus, cracking at the arch bottom did not occur. At the clamped arch foot, the bottom-row reinforcement of the precast layer was gradually compressed, though the compressive stress increment remained small, with a value of about 7.6 MPa. At the sliding foot, the stress in the bottom reinforcement exhibited a slight increase in compressive stress, though the increment was negligible, and the final trend indicated a shift toward tension.

3.5.2. Cast In Situ Layer

During the first 4.26 h of the test, when the structure was primarily subjected to vertical loading, the internal force of the composite arch was dominated by axial force [28]. As shown in Figure 4b, under half-span loading, all sections of the cast in situ layer remained in compression, and the tensile and compressive stress increments in the reinforcement were both small, ranging between −30 MPa and 20 MPa.
When the sliding foot displacement reached 3 mm, the clamped arch foot remained under compression, and the compressive stress increment of the cast in situ reinforcement at this location was small. The maximum increment, about 5 MPa, was observed in the bottom reinforcement. The stresses in the rebars at the sliding foot essentially remained unchanged. Throughout the test, the total stress values in the reinforcement of the composite arch remained far below the yield stress.

4. Structural Analysis

4.1. Deflection Analysis of the Arch Element

The boundary conditions and ground pressure of the tested arch differed from those of the vault element in the metro station. The boundary conditions of the validation case were described in Section 3.1.
To verify the reliability of the finite element calculation results, the crown deflections obtained from numerical simulations were compared with those measured in the experiment. Notably, the simulated deflections were slightly larger than the experimental values, as summarized in Table 1. This difference can be attributed to the presence of concrete stairs for placing the steel blocks on the top surface of the tested arch, as well as the supporting platforms, both of which increased the cross-sectional stiffness of the vault. As a result, the maximum simulated deflection exceeded the experimental value by 13.67%. Nevertheless, the finite element calculation results were considered reliable, and the verification method was deemed acceptable.

4.2. Analytical Solution of the Clamped Circular Arch Under Asymmetric Loads

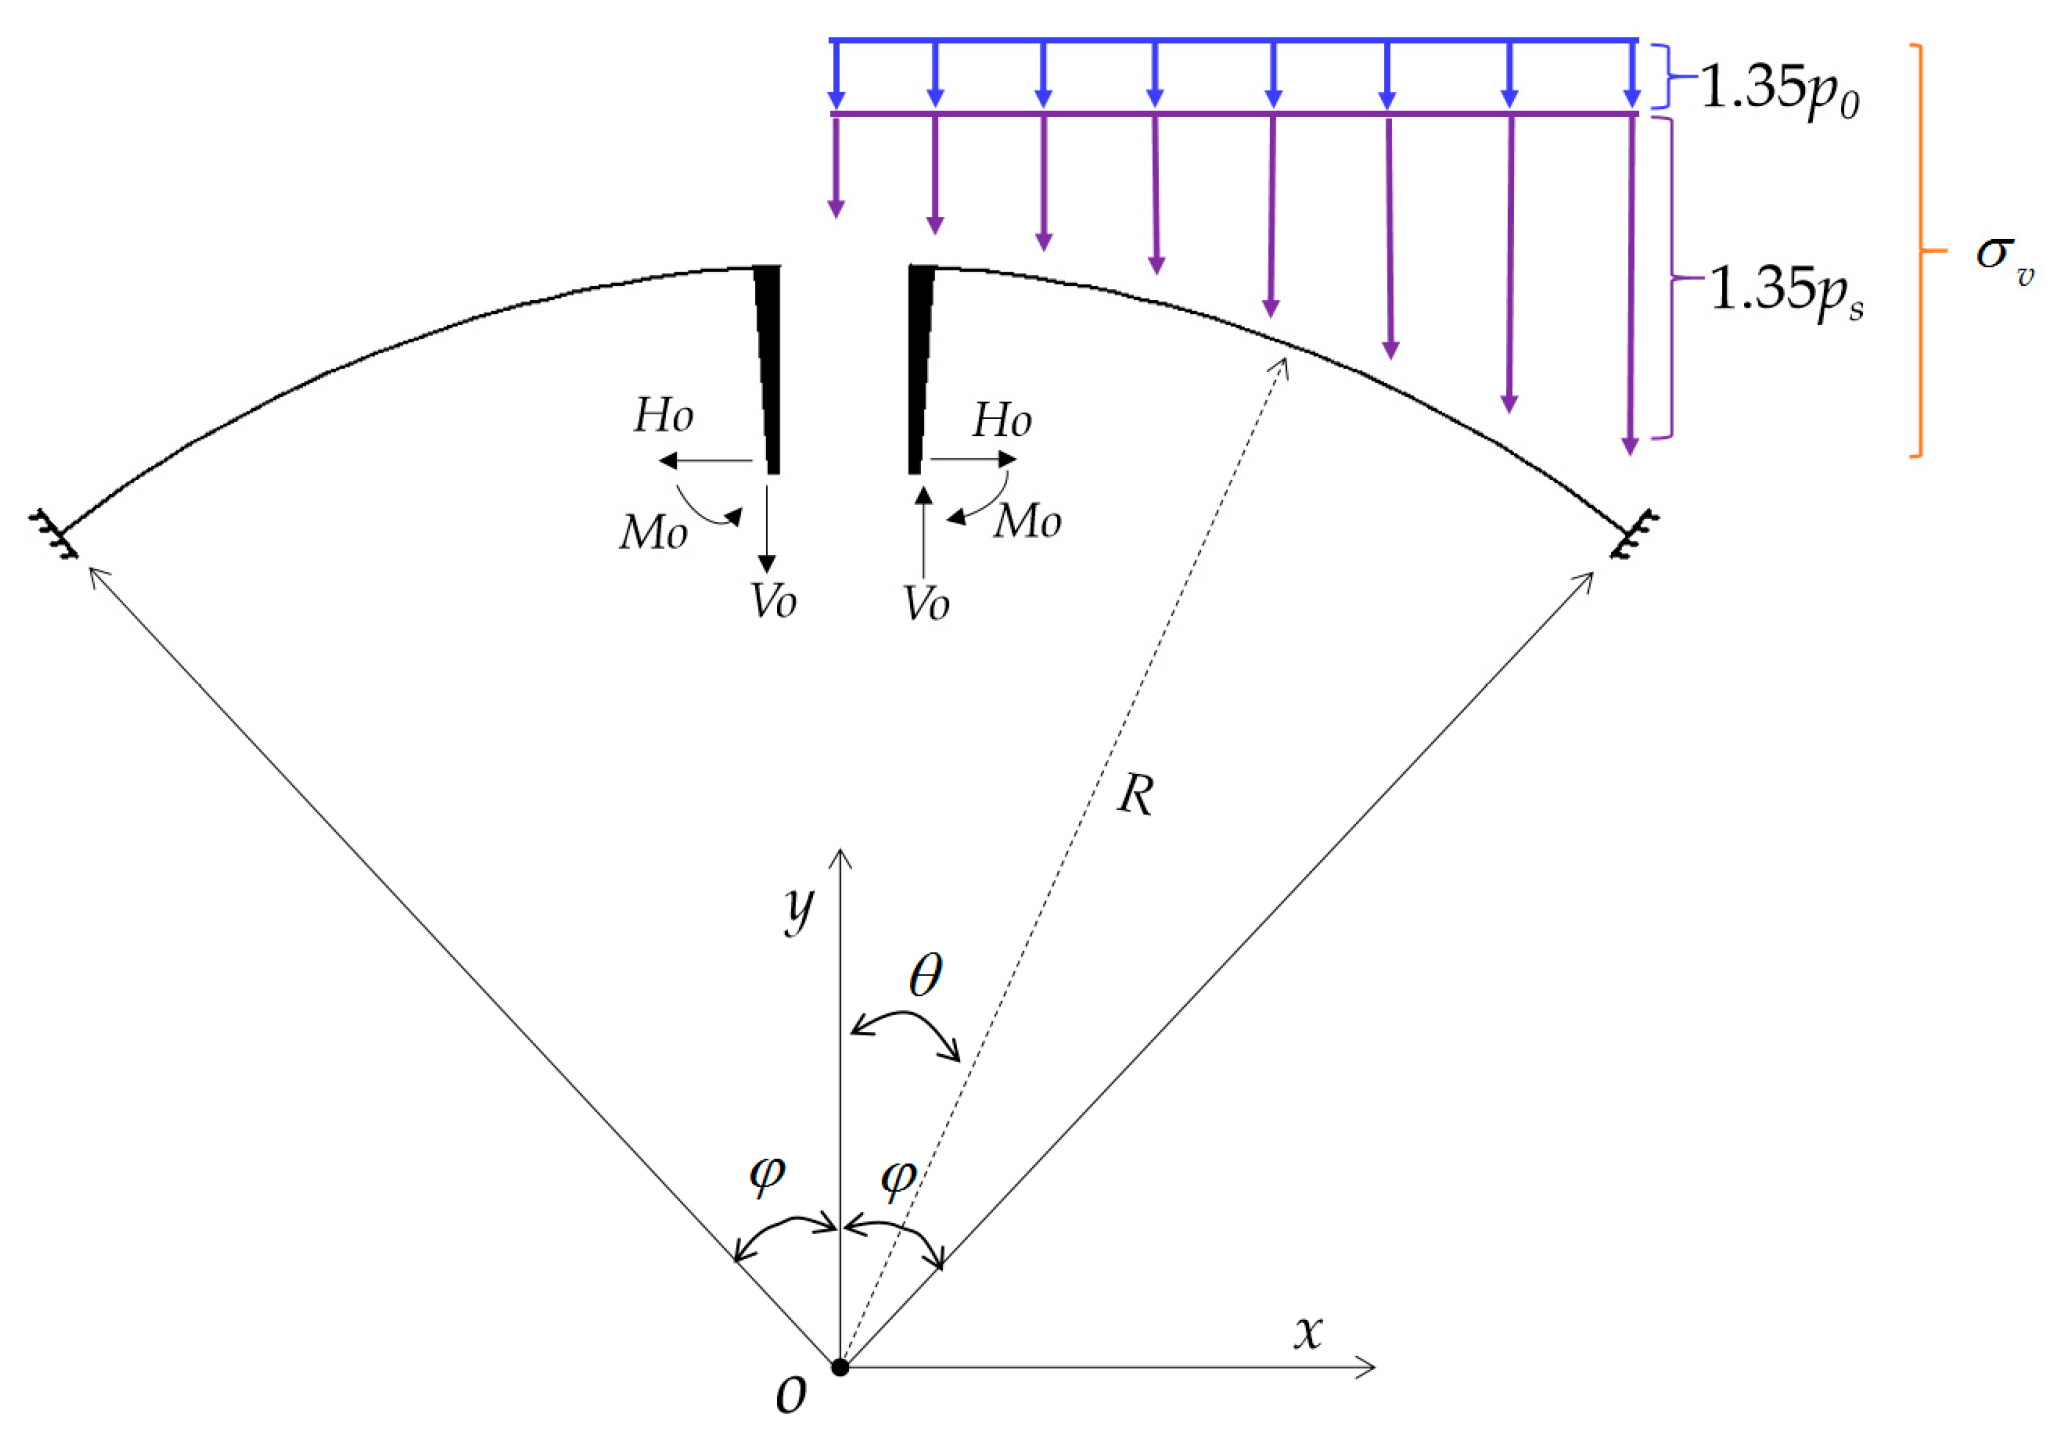
In this study, the final integral arch was idealized as a clamped circular arch subjected to vertical asymmetric loading, as shown in Figure 7. Here, θ denotes the angle between the arch foot section and the y-axis, and R represents the radius of the arch. Additionally, EA refers to the extensional stiffness, while EI denotes the bending stiffness. Because a clamped arch is a statically indeterminate structure, the force method equation is expressed based on the definition of the elastic center method as follows:
M O δ 11 + Δ 1 P = 0 H O δ 22 + Δ 2 P = 0 V O δ 33 + Δ 3 P = 0
The internal forces at the elastic center of the clamped circular arch follow from Equation (1) as
M O = Δ 1 P δ 11 H O = Δ 2 P δ 22 V O = Δ 3 P δ 33
In order to derive analytical solutions for M O , H O , V O from Equation (2), Δ 1 P , Δ 2 P , Δ 3 P , δ 11 , δ 22 , and δ 33 need to be calculated, respectively. M O , H O , and V O stand for the bending moment, horizontal force, and the shear force at the elastic center, respectively. δ 11 , δ 22 , and δ 33 denote shape constants, respectively, Δ 1 P , Δ 2 P , and Δ 3 P represent load constants, respectively. The shape constant and load constant at the elastic center of the clamped circular arch are expressed by Equations (3) and (4):
Δ 1 P = s M P M 1 E I d s Δ 2 P = s M P M 2 E I d s Δ 3 P = s M P M 3 E I d s
δ 11 = s M 1 2 E I d s δ 22 = s M 2 2 E I d s + s N 2 2 E A d s δ 33 = s M 3 2 E I d s
The width of the element of the arch is equal to 1 m. Herein, σ v is the sum of the distributed external loading. In order to simplify the calculation, the vertical pressure is divided into two load forms, and q 1 and q 2 denote the vertical uniformly distributed line loading and vertical distributed line loading in the circumferential direction, respectively. Above formula coefficients’ specific calculation methods are in Appendix A.
By substituting Equations (A1), (A3) and (A5) into Equation (2), respectively, M O , H O and V O of the clamped circular arch can be obtained. The formulas for bending moment, M ( θ ) , axial force, N ( θ ) , and shear force, V ( θ ) in each specified section of the clamped circular arch are as follows, respectively:
M ( θ ) = M O + H O [ r ( 1 cos θ ) c ] V O r sin θ + M P N ( θ ) = ( H O + H P ) cos θ + ( P P ± V O ) sin θ V ( θ ) = ( H O + H P ) sin θ ± ( P P ± V O ) cos θ

4.3. Internal Force Analysis of the Arch Element

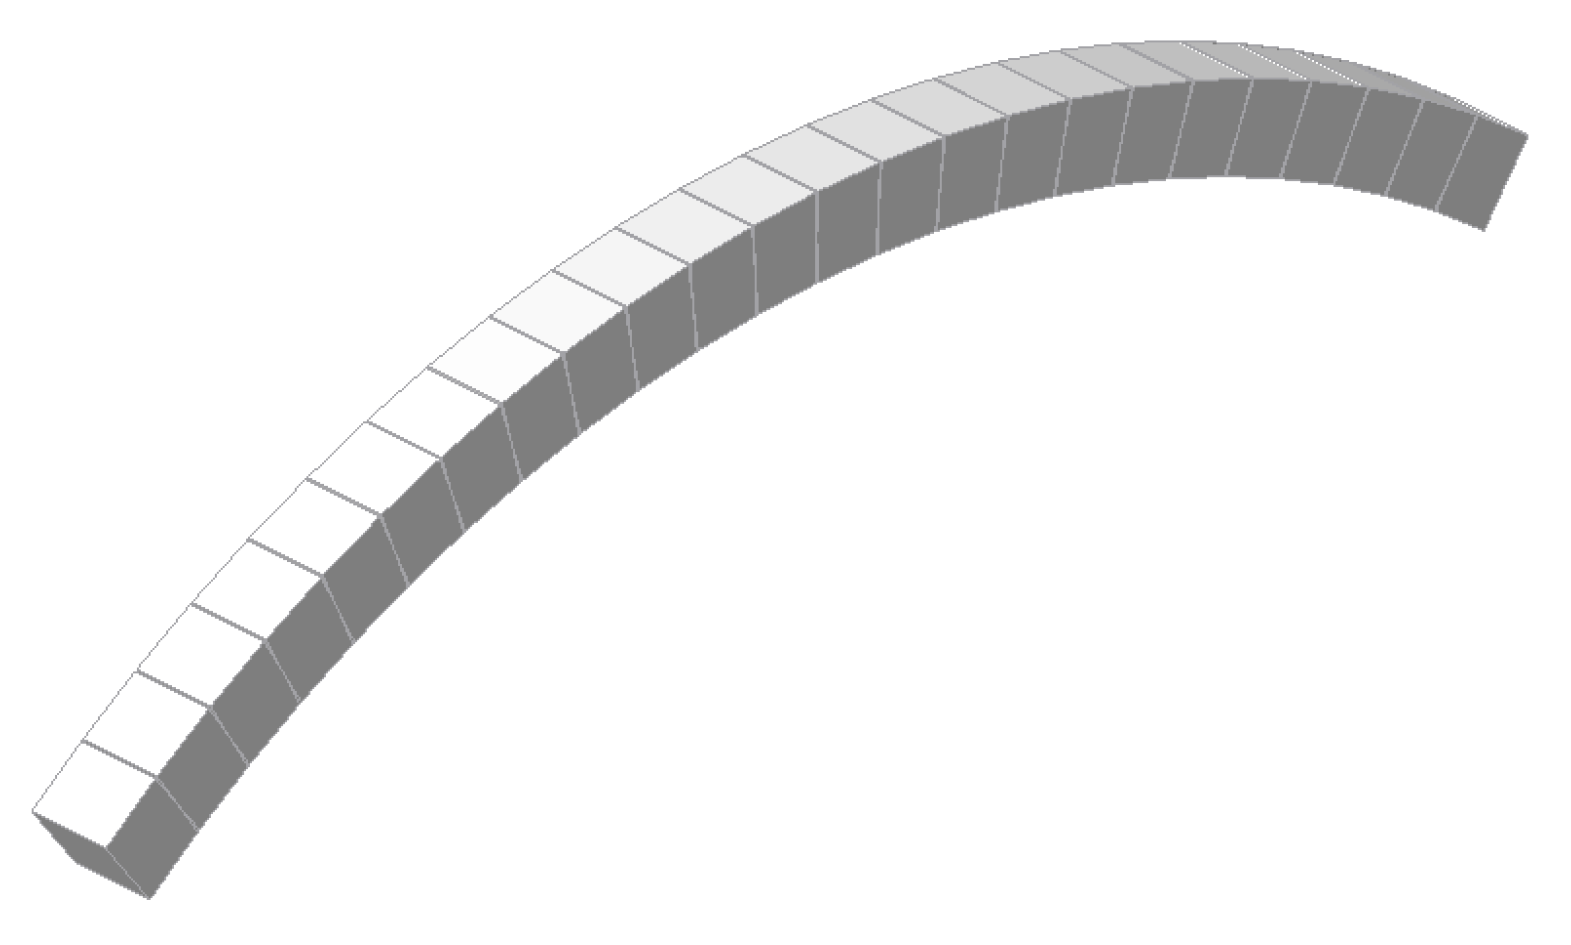
The vertical uniformly distributed line load q1 was 99.78 kN/m, and the vertical circularly distributed line load q2 was 120.48 kN/m. To comprehensively verify the accuracy of the calculation formula derived for the tested arch, a finite element analysis model was established using a commercial software, as shown in Figure 8. The model adopted beam elements and elastic material properties, as summarized in Table 2. The boundary conditions were defined as fixed constraints, and linear loading was applied.
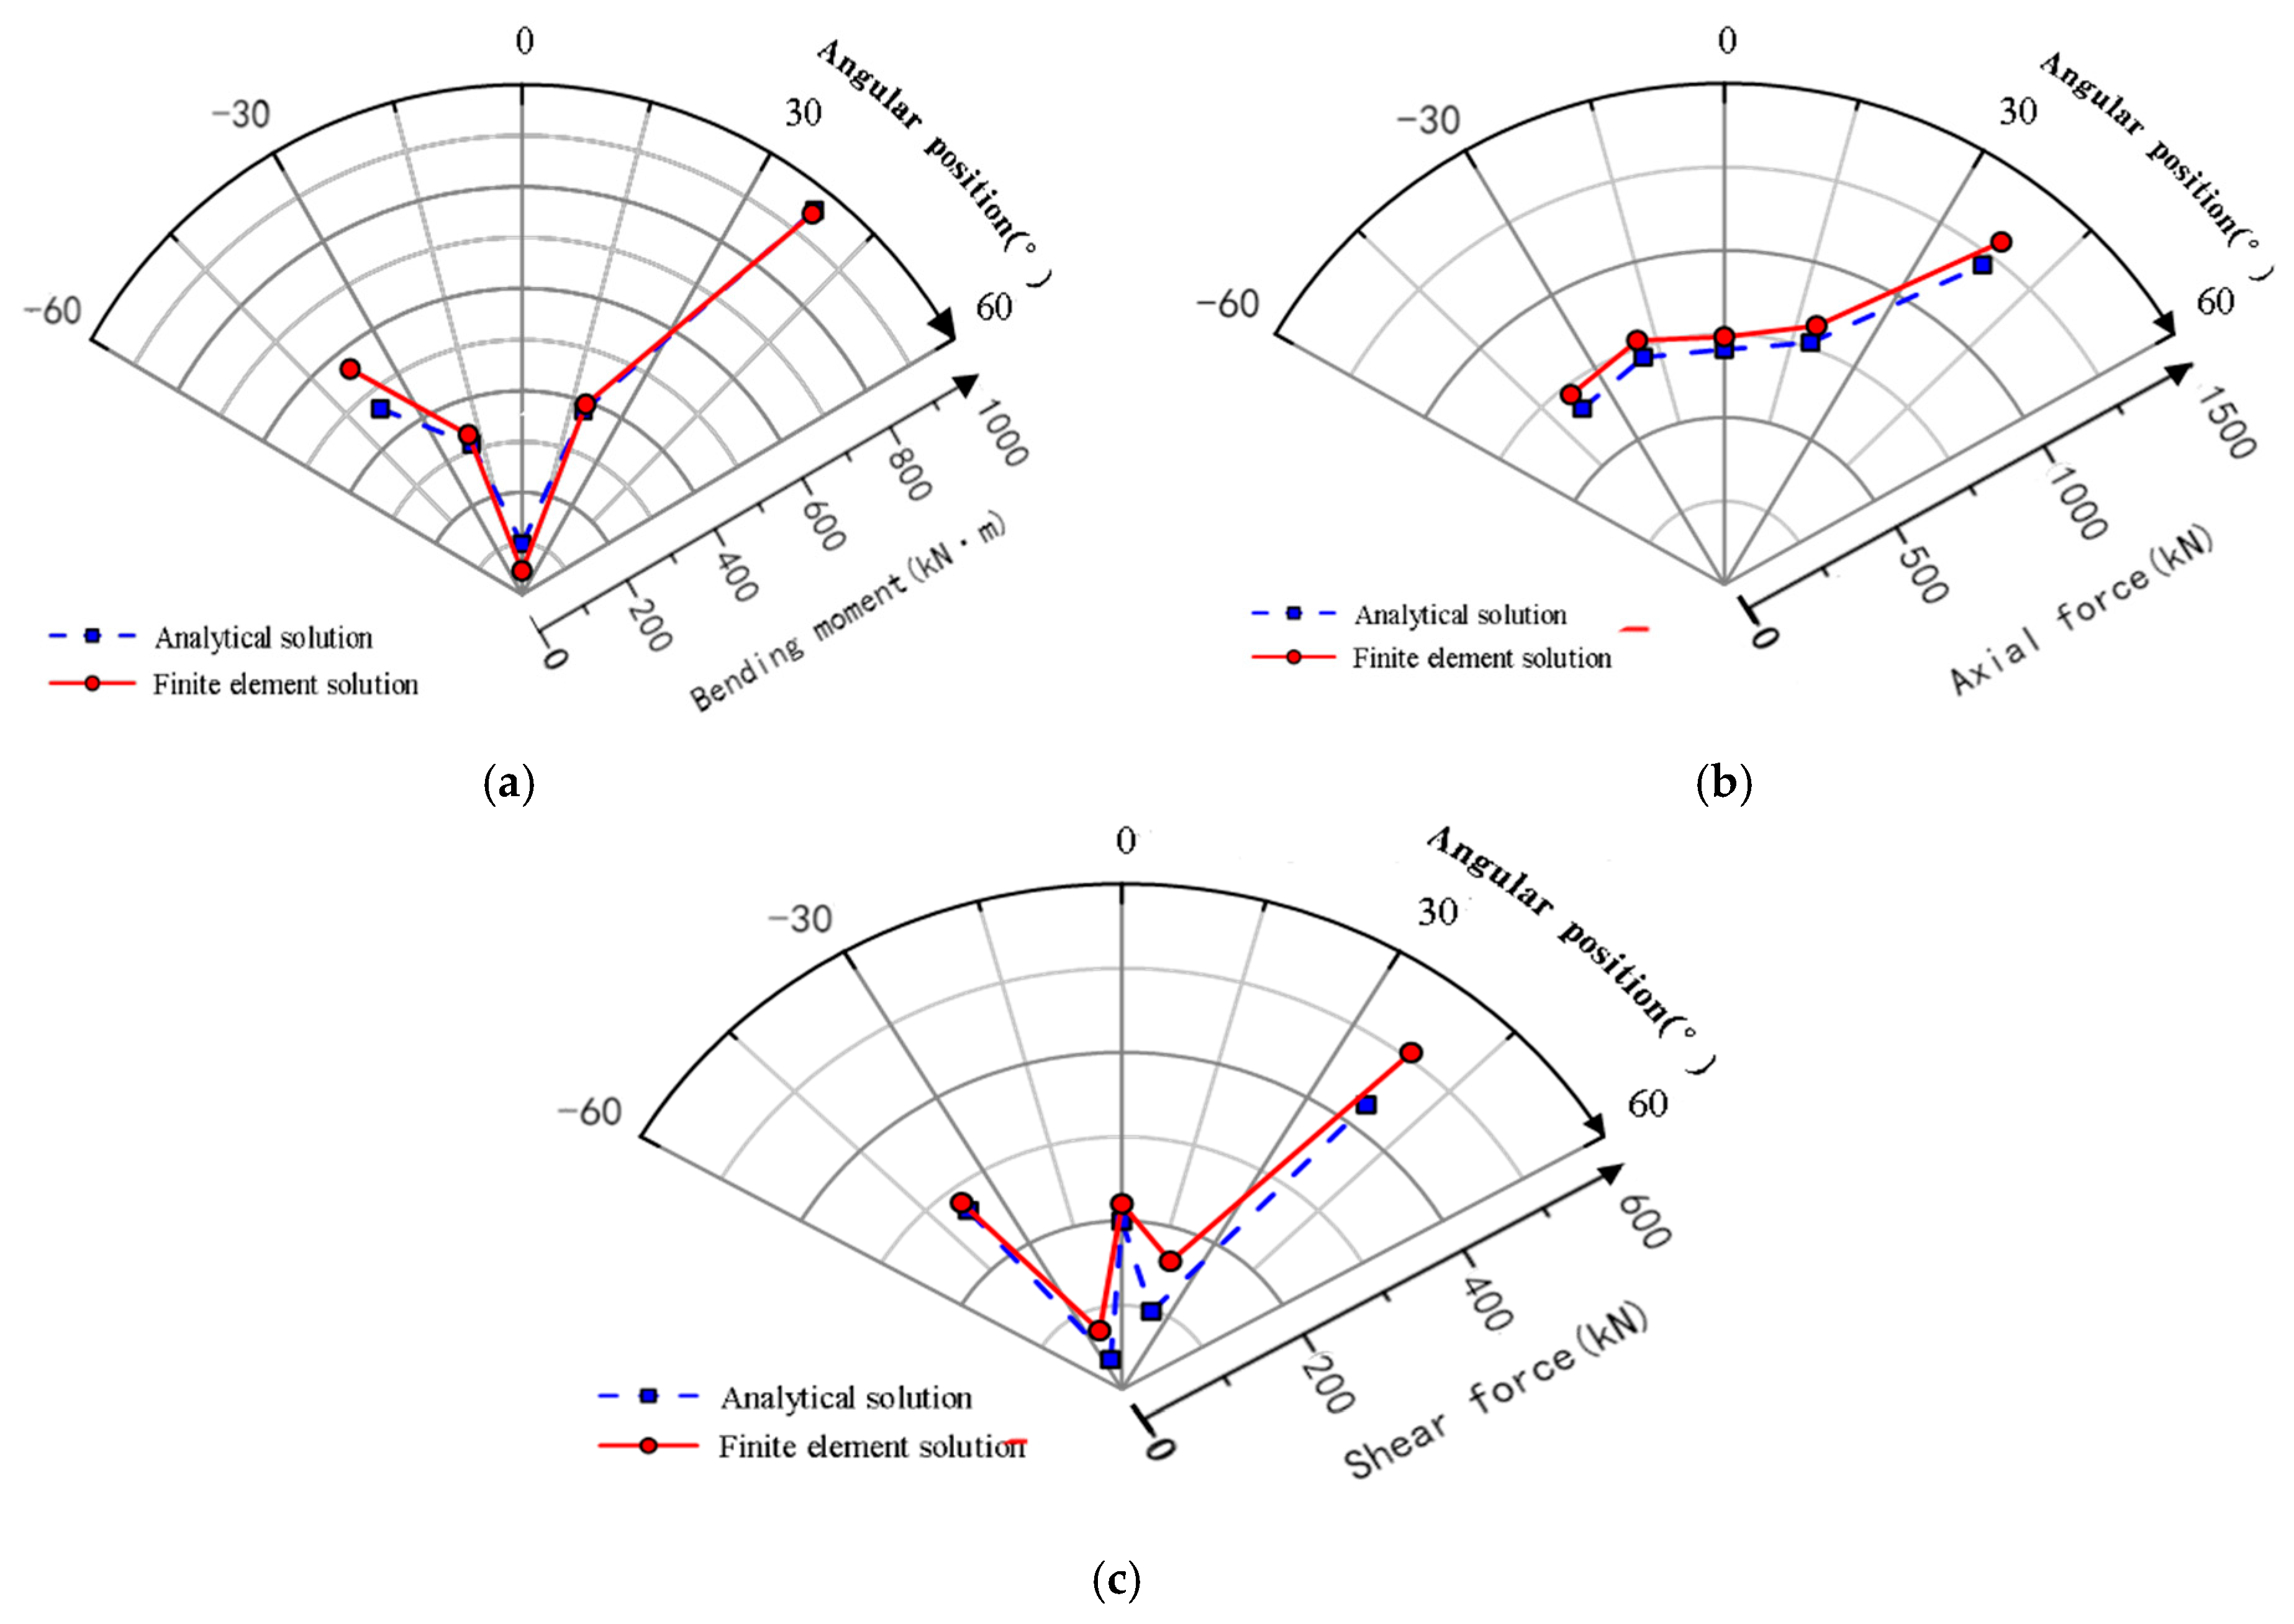
The comparison between the analytical solution and the finite element calculation results is presented in Figure 9. The maximum errors were 17.74% for bending moment, 7.32% for axial force, and 30.14% for shear force. These results indicate that the analytical solution derived from this test is reliable and can be applied with confidence in practical engineering analysis.

5. Discussion

This discussion focuses on the cracking behavior of the concrete arch structure under asymmetric loads. Specifically, the prescribed displacement of the sliding foot at the onset of cracking is defined as the safety threshold. According to test observations, vault deflection increases significantly as the sliding foot displacement grows. Moreover, cracks are most likely to occur at the crown, and the crack width directly affects reinforcement corrosion within the concrete [29,30,31]. Therefore, it is necessary to evaluate cracking of the vault through both numerical simulation and analytical solutions.
The reinforcement in the tensile region of the cross-section consists of 32 mm diameter bars, spaced at 150 mm, and arranged in two layers. The safety threshold displacement of the arch foot was obtained through numerical simulation and Equations (6)–(9). The safety threshold for concrete crack width includes two prescribed values, as summarized in Table 3. When the estimated sliding foot displacement reached 2.29 mm, visible cracking of the concrete was predicted. The initial boundary value for visible cracks was taken as 0.02 mm [32]. However, even when the sliding foot displacement was increased to 3 mm, no cracks were observed on the concrete surface during the test. This finding suggests that the combined precast and cast in situ approach reduces bending moments at the crown. Although the slip distance exceeded the expected value, which was inconsistent with the expectation, it indicates that the structure of this process after pouring cannot be simply regarded as a fixed-end arch. When the crack width at the crown reached 0.2 mm [33], the calculated displacement of the sliding foot was 2.29 mm, which may be regarded as the safety threshold for the arch structure under asymmetric loading.
Thus, the proposed construction method enhances both the crack resistance and long-term durability of the arch structure under asymmetric loading.
ω max = α c r ψ σ s E s 1.9 c s + 0.08 d e q ρ t e
ψ = 1.1 0.65 f t k ρ t e σ s
d e q = n i d i 2 n i ν i d i
ρ t e = A s + A P A t e

6. Conclusions

In this paper, the structure behavior of the arch of column-free large span underground station under asymmetric loads is studied. It mainly refers to (i) a full-scale test of an element of the vault at metro station, (ii) structural analysis of a full-scale test. In order to explain the structural behavior of the vault under asymmetric loads, a real-scale test of the vault element was carried out in the spot. Analytical solutions of the clamped circular arch under asymmetric load were proved. From this full-scale test, the following conclusions were drawn:
  • When the weight of the steel blocks reaches 1.35 times of the vertical ground pressure, the vertical displacement of the arch crown and arch foot, as well as the staggered value and opening value of the joint change slightly. It indicates that the precast layer and cast in situ layer can work together as a whole. When the prescribed displacement of the arch foot is increased to 3 mm, this deflection of the vault crown of 3.79 mm is only 0.02% of the span of the vault. Cross sectional stiffness of the vault combined with precast and cast in situ method is acceptable.
  • In the half span loading stage, the full section is compressed, and the arching effect is obvious. When the prescribed displacement of sliding foot is increased further, the arch effect gradually weakened. The maximum tensile stress and compressive stress of the rebars occur at one half of the left and right arches. The change in-internal force of the rebars is basically within the range of −30 MPa and 20 MPa. The results are less than the yield stress of the rebars. It is proven that the stacked arch has a large safety reserve, and there is room for optimal design of the structure.
  • The computed value results in an increase in the maximum deflection of the arch by 13.67%, compared to the experimental results, which indicates that the reliability of the numerical simulation method is verified under the same boundary conditions.
  • In order to check the validity of the derived analytical solutions of the clamped arch for ground pressure resulting from the vertical ground pressure. Compared to the numerical simulation, the maximum error range is 7.32% to 30.14%. The results are in good agreement with each other. It is verified the reliability of the analytical solution of the clamped circular arch under the asymmetric loads derived from the tested arch. The consistency demonstrated by the mutual verification of full-scale test results, numerical simulation results, and analytical solutions also provides strong support for the reliability of the numerical model and the general applicability of the conclusions.
  • During this test, the response of the stacked arch structure to the arch feet displacement is obvious. Therefore, the lateral displacement of arch feet is an important index to control the safety of underground arch structures.
This study has basically clarified the mechanical characteristics of the arch slab under asymmetric loads, yet it still has the following limitations: restricted by objective factors such as cost and time, the full-scale test was only conducted once, and it did not involve tests on dynamic loads like cyclic loads and seismic loads. Meanwhile, there is a lack of research on how long-term loads and environmental factors (e.g., temperature and humidity changes, corrosion, etc.) affect the long-term performance of the structure [34,35,36]. Additionally, the numerical model does not take into account the process of the structure transforming from a three-hinged arch to a fixed-end arch, which is caused by the “precast + cast in situ” construction technology. The above issues will be gradually improved in future research work.

Author Contributions

J.-L.Z.: Conceptualization, methodology, data curation, writing—review and editing, project administration, supervision; G.-H.Q.: Data analysis, writing—review and editing, investigation; Z.Z.: funding acquisition, writing—review and editing, project administration; C.L.: Conceptualization, methodology, data curation, writing—original draft preparation, software, project administration. All authors have read and agreed to the published version of the manuscript.

Funding

This research was funded by the Science and Technology Commission of Shanghai Municipality (No. 23DZ1202906).

Institutional Review Board Statement

Not applicable.

Informed Consent Statement

Not applicable.

Data Availability Statement

All data included in this study are available upon request by contact with the corresponding author.

Conflicts of Interest

Authors Zheng Zhou and Cao Li were employed by the Shanghai Mechanized Construction Group. The remaining authors declare that the research was conducted in the absence of any commercial or financial relationships that could be construed as a potential conflict of interest.

Appendix A

This appendix is used to supplement and explain the specific derivation formulas of load constants under different loads in Section 4.1 and Section 4.2 of the article.
δ 11 = s M 1 2 E I d s = 2 R φ E I δ 22 = s M 2 2 E I d s + s N 2 2 E A d s = R E I φ + sin φ cos φ 2 sin 2 φ φ R 2 + φ + sin φ cos φ I A δ 33 = s M 3 2 E I d s = 2 R 3 E I s sin 2 θ d θ = φ sin φ cos φ R 3 E I
When the clamped arch is subjected to vertical uniformly distributed line load, q 1 , the deducing formulas of load constants are as follows:
p P = q 1 R sin θ M P = 1 2 q 1 R 2 sin 2 θ
Δ 1 P = 1 4 ( φ sin φ cos φ ) q 1 R 3 E I Δ 2 P = 1 4 ( φ sin φ cos φ ) ( R c ) + 1 6 R sin 3 φ Δ 3 P = ( 1 6 cos 3 φ cos φ + 1 3 ) q 1 R 4 E I
When the clamped arch is subjected to vertical circumferential line load, q 2 , the deducing formulas of load constants are as follows:
q x = 1 cos θ 1 cos φ q 2 p P = 0 θ 1 cos θ 1 cos φ q 2 . R cos θ d θ = q 2 R 1 cos φ [ sin θ 0.5 ( θ + sin θ cos θ ) ] M P = 0 θ 1 cos θ 1 cos φ q 2 . R cos θ . R ( sin θ sin θ ) d θ = q 2 R 2 1 cos φ 0 θ ( cos θ cos 2 θ ) ( sin θ sin θ ) d θ = q 2 R 2 1 cos φ [ sin 2 θ 2 sin θ 2 θ sin 2 θ 2 cos θ + 1 3 cos 3 θ 3 ]
Δ 1 P = 1 1 cos φ 7 12 φ 0.25 sin φ cos φ 5 6 sin φ + φ cos φ 2 1 18 sin 3 φ q 2 R 3 E I Δ 2 P = 1 1 cos φ 7 12 φ 0.25 sin φ cos φ 5 6 sin φ + φ cos φ 2 1 18 sin 3 φ ( R c ) + r 1 cos φ sin 3 φ 6 + sin φ 3 + 1 24 sin φ cos 3 φ + φ cos 2 φ 4 5 16 ( φ + sin φ cos φ ) q 2 R 3 E I Δ 3 P = 1 12 ( 1 cos φ ) 2 cos 3 φ + 1.5 sin 4 φ + cos 4 φ + 7 10 cos φ 1.5 φ 2 + 3 φ sin φ cos φ 1.5 sin 2 φ q 2 R 4 E I

References

  1. Lu, L.; Qiu, J.; Yuan, Y.; Tao, J.; Yu, H.; Wang, H.; Mang, H. Large-scale test as the basis of investigating the fire-resistance of underground RC substructures. Eng. Struct. 2019, 178, 12–23. [Google Scholar] [CrossRef]
  2. He, X.; Zhang, Z.; Yuan, Y.; Yu, H.; Bilotta, E. Improving seismic performance of an atrium-style metro station using CFRP composites. Soil Dyn. Earthq. Eng. 2025, 197, 109535. [Google Scholar] [CrossRef]
  3. Tao, L.; Shi, C.; Ding, P.; Yang, X.; Bao, Y.; Wang, Z. Shaking table test of the effect of an enclosure structure on the seismic performance of a prefabricated subway station. Tunn. Undergr. Space Technol. 2022, 125, 104533. [Google Scholar] [CrossRef]
  4. Cao, L.; Fang, Q.; Zhang, D.; Chen, T. Subway station construction using combined shield and shallow tunnelling method: Case study of Gaojiayuan station in Beijing. Tunn. Undergr. Space Technol. 2018, 82, 627–635. [Google Scholar] [CrossRef]
  5. Sadaghiani, M.H.; Dadizadeh, S. Study on the effect of a new construction method for a large span metro underground station in Tabriz-Iran. Tunn. Undergr. Space Technol. 2010, 25, 63–69. [Google Scholar] [CrossRef]
  6. Pichler, C.; Lackner, R.; Spira, Y.; Mang, H.A. Thermochemomechanical assessment of ground improvement by jet grouting in tunneling. J. Eng. Mech. 2003, 129, 951–962. [Google Scholar] [CrossRef]
  7. Ayaydin, N.; Ekici, Z.; Walter, H. Metro Istanbul–Kadıköy, an underground station close to the sea and below a historical building. Geomech. Tunnelbau 2008, 1, 189–196. [Google Scholar] [CrossRef]
  8. Yang, X.; Li, Y. Research of surface settlement for a single arch long-span subway station using the Pipe-roof Pre-construction Method. Tunn. Undergr. Space Technol. 2018, 72, 210–217. [Google Scholar] [CrossRef]
  9. Guo, X.; Jiang, A. Study on the stability of a large-span subway station constructed by combining with the shaft and arch cover method. Tunn. Undergr. Space Technol. 2022, 127, 104582. [Google Scholar] [CrossRef]
  10. Zhang, J.L.; Liu, X.; Zhao, J.B. Application of a combined precast and cast-in-situ construction method for large-span underground archs. Tunn. Undergr. Space Technol. 2021, 111, 103795. [Google Scholar] [CrossRef]
  11. Zhang, J.L.; Liu, X.; Yuan, Y. Transfer relations: Useful basis for computer-aided engineering of circular arch structures. Eng. Comput. 2021, 38, 1287–1302. [Google Scholar] [CrossRef]
  12. Kim, S.; Chang, S.; Castro-Lacouture, D. Dynamic modeling for analyzing impacts of skilled labor shortage on construction project management. J. Manag. Eng. 2020, 36, 04019035. [Google Scholar] [CrossRef]
  13. Huang, B.T.; Li, Q.H.; Xu, S.L. Development of reinforced ultra-high toughness cementitious composite permanent formwork: Experimental study and digital image correlation analysis. Compos. Struct. 2017, 180, 892–903. [Google Scholar] [CrossRef]
  14. Ding, P.; Tao, L.; Yang, X. Three-dimensional dynamic response analysis of a single-ring structure in a precast subway station. Sustain. Cities Soc. 2019, 45, 271–286. [Google Scholar] [CrossRef]
  15. Tao, L.; Ding, P.; Shi, C. Shaking table test on seismic response characteristics of precast subway station structure. Tunn. Undergr. Space Technol. 2019, 91, 102994. [Google Scholar] [CrossRef]
  16. Qiu, T.; Chen, X.; Rao, W.; Su, D.; Bao, X.; Hong, C. Intelligent monitoring-based resilience assessment system for prefabricated underground structures based on restorability. Tunn. Undergr. Space Technol. 2025, 158, 106411. [Google Scholar] [CrossRef]
  17. Qiu, T.; Chen, X.; Chen, K.; Su, D.; Shen, J.; Wang, L.; Zheng, Z. An adaptation resilience assessment framework for key components of prefabricated underground stations. Tunn. Undergr. Space Technol. 2023, 136, 105037. [Google Scholar] [CrossRef]
  18. Timoshenko, S.P.; Gere, J.M. Theory of Elastic Stability, 2nd ed.; McGraw Hill Book Company, Inc.: New York, NY, USA, 1961. [Google Scholar]
  19. Zhang, J.L.; Vida, C.; Yuan, Y. A hybrid analysis method for displacement-monitored segmented circular tunnel rings. Eng. Struct. 2017, 148, 839–856. [Google Scholar] [CrossRef]
  20. Pi, Y.L.; Bradford, M.A.; Liu, A. Nonlinear equilibrium and buckling of fixed shallow arches subjected to an arbitrary radial concentrated load. Int. J. Struct. Stab. Dyn. 2017, 17, 1750082. [Google Scholar] [CrossRef]
  21. Lu, H.; Liu, A.; Pi, Y.L.; Bradford, M.A.; Fu, J.; Huang, Y. Localized loading and nonlinear instability and post-instability of fixed arches. Thin Wall. Struct. 2018, 131, 165–178. [Google Scholar] [CrossRef]
  22. Stevens, L.K. Carrying capacity of mild-steel arches. ICE Proc. 1957, 6, 493–514. [Google Scholar] [CrossRef]
  23. Lu, Y.; Cheng, Y.; Han, Q. Experimental investigation into the in-plane buckling and ultimate resistance of circular steel arches with elastic horizontal and rotational end restraints. Thin Wall. Struct. 2017, 118, 164–180. [Google Scholar] [CrossRef]
  24. Liu, J.P.; Hu, H.F.; Li, J.; Chen, Y.F.; Zhang, L. Flexural behavior of prestressed concrete composite slab with precast inverted T-shaped ribbed panels. Eng. Struct. 2020, 215, 110687. [Google Scholar] [CrossRef]
  25. Zhang, J.S.; Yao, Y.; Wang, Y.Z. Failure Mode and Ultimate Bearing Capacity of Precast Ribbed Panels Used for Concrete Composite Slabs. Adv. Struct. Eng. 2013, 16, 2005–2017. [Google Scholar] [CrossRef]
  26. Zheng, W.; Lu, X.; Wang, Y. Flexural behaviour of concrete composite slabs with precast ribbed reactive powder concrete bottom panels. J. Comput. Theor. Nanos 2016, 13, 1831–1839. [Google Scholar] [CrossRef]
  27. Pan, P.; Nakashima, M.; Tomofuji, H. Online test using displacement-force mixed control. Earthq. Eng. Struct. Dyn. 2005, 34, 869–888. [Google Scholar] [CrossRef]
  28. Zhang, J.L.; Zhao, J.B.; Liu, X.; Jiang, S.C.; Yang, Z.H.; Jiang, H.C. Experimental investigation on structural behavior of a stacked reinforced-concrete arch. In Proceedings of the Fib Symposium 2019: Concrete—Innovations in Materials, Design and Structures, International Federation for Structural Concrete, Krakow, Poland, 27–29 May 2019; pp. 2270–2277. [Google Scholar]
  29. Ryu, J.S.; Otsuki, N. Crack closure of reinforced concrete by electrodeposition technique. Cem. Concr. Res. 2002, 32, 159–164. [Google Scholar] [CrossRef]
  30. Lee, H.X.D.; Wong, H.S.; Buenfeld, N.R. Self-sealing of cracks in concrete using superabsorbent polymers. Cem. Concr. Res. 2016, 79, 194–208. [Google Scholar] [CrossRef]
  31. Win, P.P.; Watanabe, M.; Machida, A. Penetration profile of chloride ion in cracked reinforced concrete. Cem. Concr. Res. 2004, 34, 1073–1079. [Google Scholar] [CrossRef]
  32. Shan, B.; Zheng, S.; Ou, J. A stereovision-based crack width detection approach for concrete surface assessment. KSCE J. Civ. Eng. 2016, 20, 803–812. [Google Scholar] [CrossRef]
  33. GB 50010-2010; State Standard of the People’s Republic of China: Code for Design of Concrete Structures. China Architecture and Building Press: Beijing, China, 2010.
  34. Nicoletti, F.; Carbonari, S.; Gara, F. Design tools for pre-design of reinforced concrete beam-column joints based on Eurocode 8. Structures 2022, 39, 958–973. [Google Scholar] [CrossRef]
  35. Hu, Z.; Wen, W.; Zhai, C.; Pei, S. Seismic resilience of urban metro systems: A review of earthquake effects and performance-based strategies. Tunneling Undergr. Space Technol. 2024, 152, 105920. [Google Scholar] [CrossRef]
  36. Hashash, Y.M.A.; Hook, J.J.; Schmidt, B.; Yao, J.I. Seismic design and analysis of underground structures. Tunn. Undergr. Space Technol. 2001, 16, 247–293. [Google Scholar] [CrossRef]
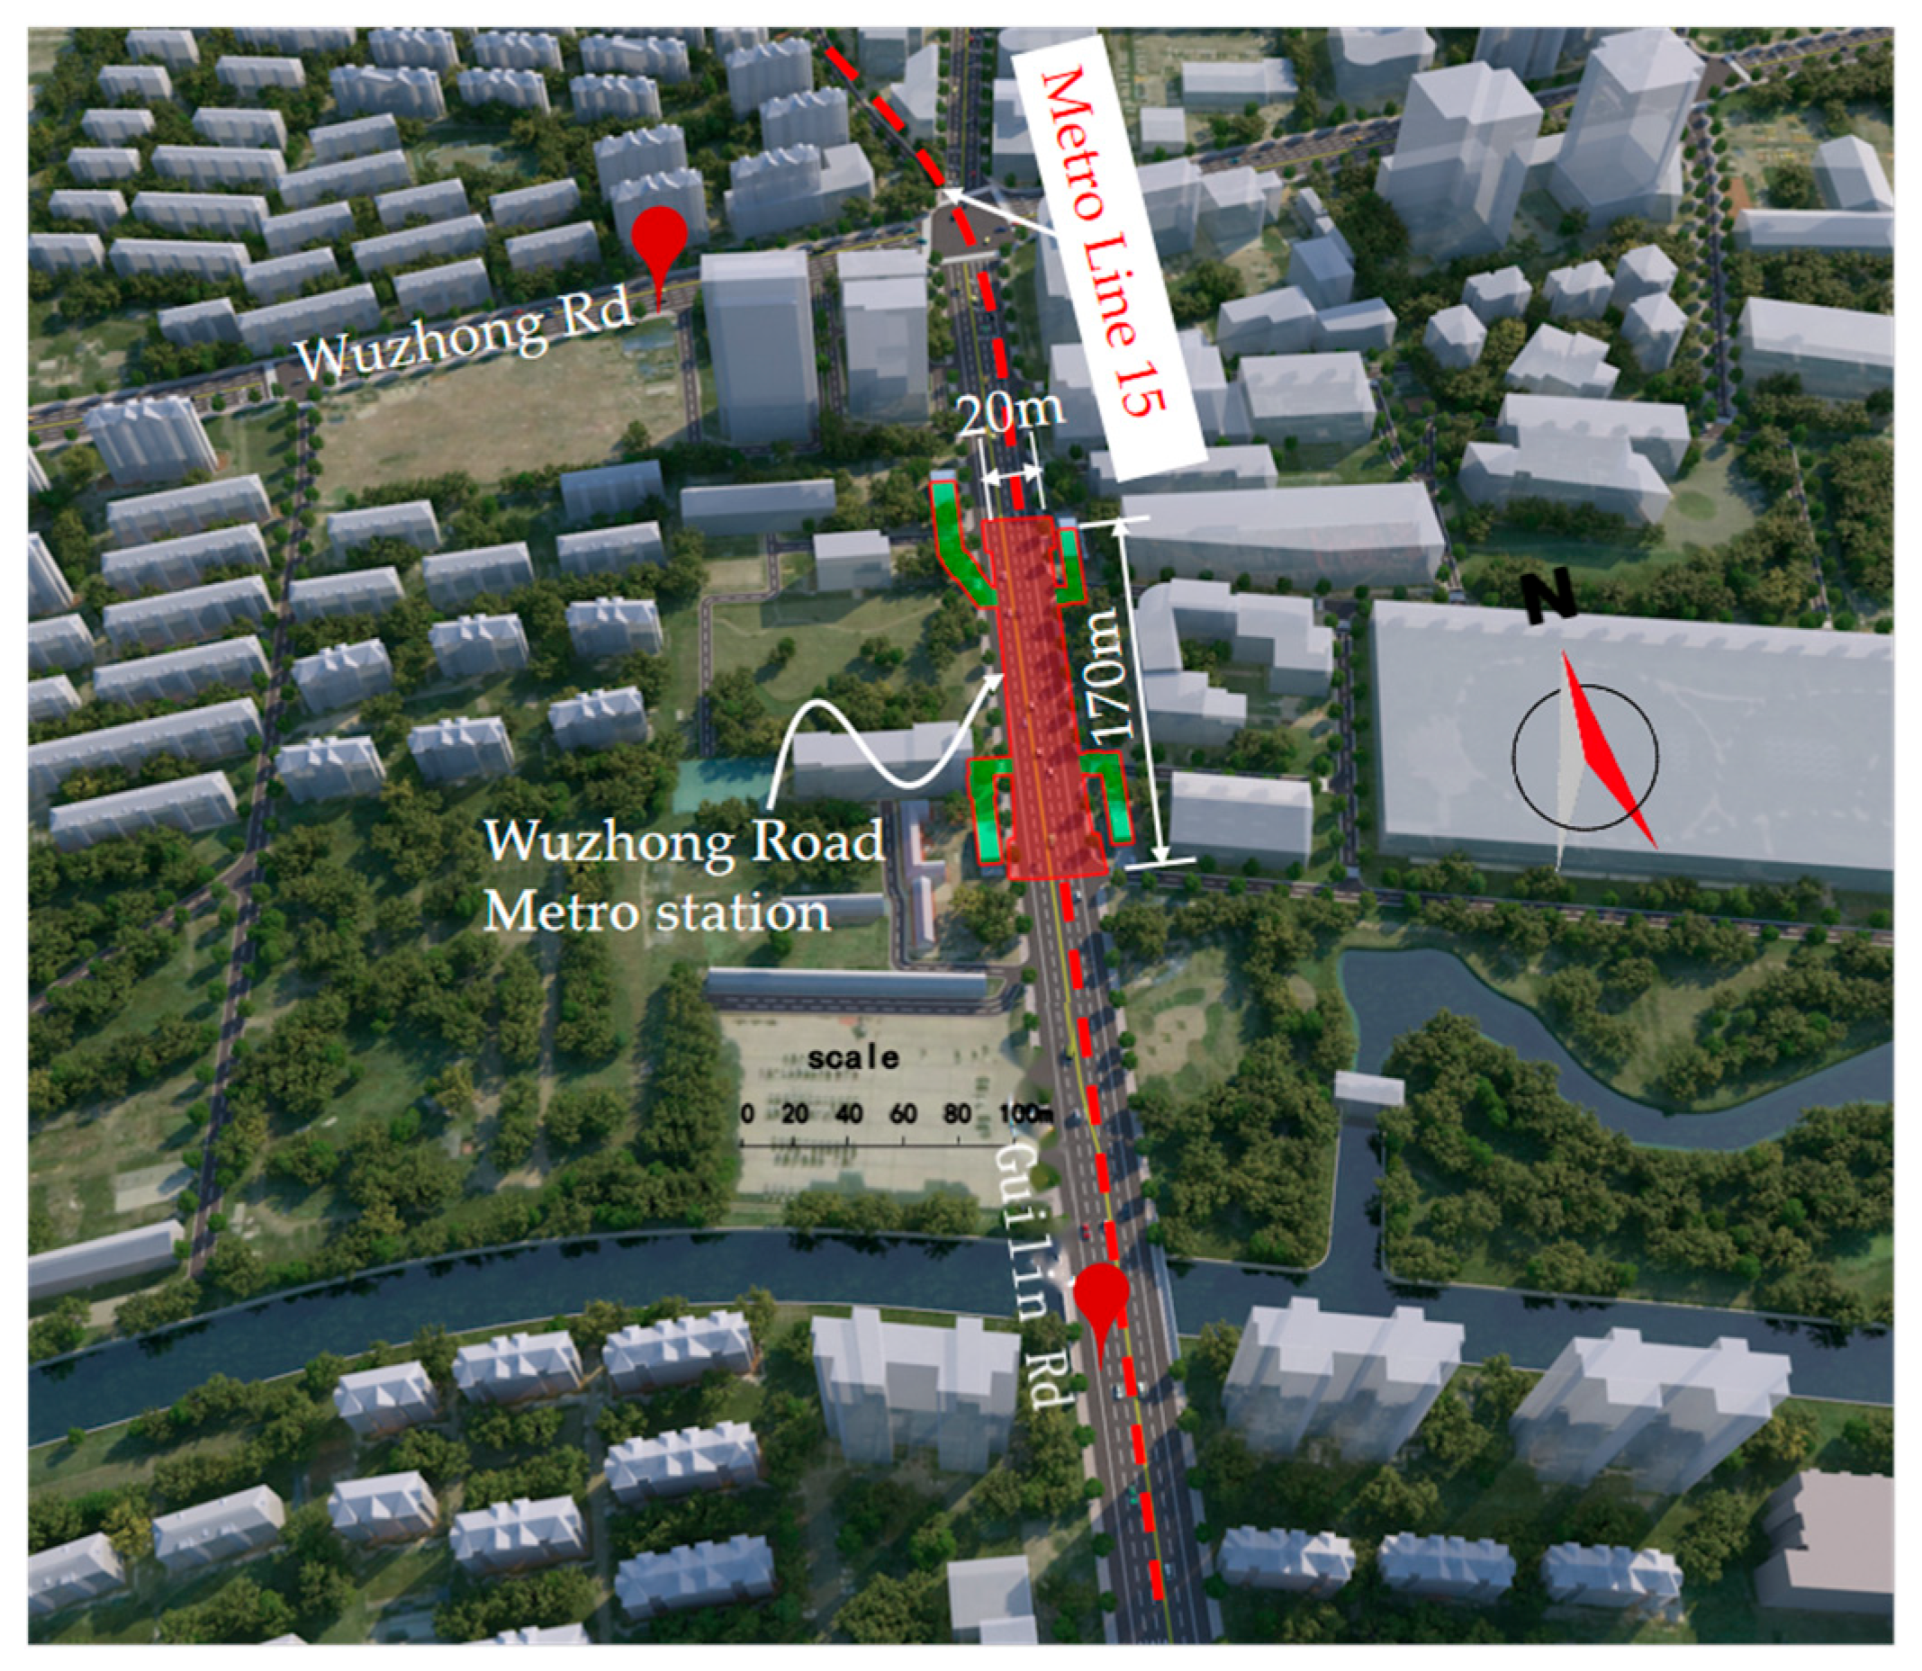
Figure 1. Location of metro station project in Shanghai, China. (Created by the author through aerial photography and modeling). The red dashed line indicates Shanghai Metro Line 15; red boxes indicate metro stations, and green boxes indicate exits.
Applsci 15 10944 g001
Figure 2. Profile of the investigated arched metro station without column.
Applsci 15 10944 g002
Figure 3. Composite arch structure: (a) 3D model of the precast segments; (b) A-A section of the investigated metro station.
Applsci 15 10944 g003
Figure 4. A full-scale test of the arch element: (a) schematic diagram of stacked arch test (The light blue line indicates the outline of the vault structure, and the dark blue line indicates the roller of the sliding support); (b) Schematic diagram of half-span loading sequence (The red line indicates the roller of the sliding support); (c) sketch of the tested arch; (d) photo of simulation test set-up; (e) photo of the sliding foot, cable and jack.
Applsci 15 10944 g004aApplsci 15 10944 g004b
Figure 5. Overview of measuring instruments layout. (The light blue line indicates the outline of the top of the vault structure; the pink line indicates the outline of the bottom of the vault structure; the dark blue line indicates the cable and hydraulic jack; and the diagonal dividing line indicates the roller of the sliding support).
Applsci 15 10944 g005
Figure 6. (a) Diagram of Arch Crown Loading Process; (b) Diagram of Arch Foot Displacement Process; Structure deformation process curve of half span loading: (c) Vertical displacement of the arch crown and arch feet: D1 and D5 represent the vertical displacement of the arch feet; D3 represents the vertical displacement of the arch crown; (d) Joint opening displacement: Z2 and Z6 represent the joint opening at the arch feet; Z4 represents the joint opening at the arch crown; (e) Joint stagger displacement (note: parameters denote stress-related data): C2 and C5 represent the steel bar stress at the arch feet; C3 represents the steel bar stress at the arch crown.
Applsci 15 10944 g006aApplsci 15 10944 g006b
Figure 7. Structural analysis of the clamped arch element of elastic center method.
Applsci 15 10944 g007
Figure 8. FEM model of the tested arch. The boundary condition of this model is fixed arch foot, solid element is adopted, and the mesh size is 1 m × 1 m × 0.833 m.
Applsci 15 10944 g008
Figure 9. Comparison of analytical solution and numerical simulation: (a) bending moments; (b) axial force; (c) shear force.
Applsci 15 10944 g009
Table 1. Comparison of the deflection at the arch crown.
Load FormControl VariableDeflection at the Crown
Prescribed Displacement of the Sliding Foot (mm)Load (kN)Experimental Measurement (mm)Numerical
Simulation
(mm)
Half span load3.0Vertical ground pressure × 1.353.794.39
Table 2. Input parameters of finite element model.
MaterialCross-Section
(m2)
Constraint ConditionUniformly Distributed Line Load (kN/m)Circular Distributed Line Load (kN/m)
Concrete (C40)1.0fixed constraints99.78120.48
Table 3. Safety threshold for cracking of the crown.
Safety ThresholdInternal ForceCrack Width
(mm)
Displacement Calculation Value (mm)Bending Moment (kN·m)Axial Force
(kN)
2.29244.38224.920.02Cracks visible
6.76723.00665.400.20Maximum limit [33]
Disclaimer/Publisher’s Note: The statements, opinions and data contained in all publications are solely those of the individual author(s) and contributor(s) and not of MDPI and/or the editor(s). MDPI and/or the editor(s) disclaim responsibility for any injury to people or property resulting from any ideas, methods, instructions or products referred to in the content.