Article

Investigation into Anchorage Performance and Bearing Capacity Calculation Models of Underreamed Anchor Bolts

1
College of Civil and Transportation, Hohai University, Nanjing 210024, China
2
School of Civil Engineering and Surveying & Mapping Engineering, Jiangxi University of Science and Technology, Ganzhou 341000, China
*
Authors to whom correspondence should be addressed.
Appl. Sci. 2025, 15(20), 10929; https://doi.org/10.3390/app152010929
Submission received: 17 September 2025 / Revised: 7 October 2025 / Accepted: 10 October 2025 / Published: 11 October 2025

Abstract

Underreamed anchor bolts, as an emerging anchoring element in geotechnical engineering, operate via a fundamentally distinct load transfer mechanism compared with conventional friction type anchors. The accurate and reliable prediction of their ultimate bearing capacity constitutes a pivotal technological impediment to their broader engineering adoption. Firstly, this paper systematically elucidates the constituent mechanisms of underreamed anchor resistance and their progressive load transfer trajectory. Subsequently, in situ full-scale pull-out experiments are leveraged to decompose the load–displacement response throughout its entire evolution. The multi-stage development law and the underlying mechanisms governing the evolution of anchorage characteristics are thereby elucidated. Based on the experimental dataset, a three-dimensional elasto-plastic numerical model is rigorously established. The model delineates, at high resolution, the failure mechanism of surrounding soil mass and the spatiotemporal evolution of its three-dimensional displacement field. A definitive critical displacement criterion for the attainment of the ultimate bearing capacity of underreamed anchors is established. Consequently, analytical models for the ultimate side frictional stress and end-bearing capacity at the limit state are advanced, effectively circumventing the parametric uncertainties inherent in extant empirical formulations. Ultimately, characteristic parameters of the elasto-plastic branch of the load–displacement curve are extracted. An ultimate bearing capacity prognostic framework, founded on an optimized hyperbolic model, is established. Its superior calibration fidelity to the evolving load–displacement response and its demonstrable engineering applicability are rigorously substantiated.

1. Introduction

The mitigation of geotechnical challenges in soft soil terrains, encompassing slope stability against sliding, uplift resistance, and deep excavation support, has long been contingent upon the deployment of anchoring systems. Underreamed anchors, as next-generation anchoring elements, exhibit ultimate bearing capacities [1] that markedly exceed those of equivalently dimensioned conventional friction-type bolts. Consequently, they are regarded as the pivotal technology for overcoming the low strength constraint inherent to soft soils. Nevertheless, the accurate prediction of ultimate bearing capacity remains an outstanding scientific challenge in geomechanics; despite sustained and intensive investigations along the principal axes of experimental characterization, numerical back-analysis, and theoretical derivation, the community has yet to establish a universal, reliable, and parametrically robust prognostic framework.
Existing experimental research results indicate that the main factors [2] affecting the ultimate bearing capacity of underreamed anchors are embedment depth, expanded-body diameter, the number of expanded-body segments, soil cohesion, soil internal friction angle, slope inclination, drilling angle, the group anchor effect, etc. Guo et al. [3] designed a layered assembly-type semi-model test sand box. This model test can observe the failure mode of the soil around the anchor. When the embedment depth is relatively shallow, the soil around the anchor undergoes inverted bell-shaped deformation. When the embedment depth is relatively deep, the soil around the anchor undergoes spherical deformation. To avoid the friction between the expanded-body anchor and the sand box wall in the semi-model test sand box, Xia et al. [4] used transparent soil as the foundation material. They employed Particle Image Velocimetry (PIV) to measure the deformation of soil particles around the anchor and explored the influence of the shape of the expanded-body anchor segment on the disturbance patterns of the soil around the anchor.
Due to the high cost of field tests, existing experimental research is basically conducted indoors. To more comprehensively analyze the factors affecting the ultimate bearing capacity of expanded-body anchors, Wang et al. [5] established a three-dimensional particle flow numerical model based on field working conditions. The study shows that when the embedment depth is relatively shallow, the angle between the failure surface of the soil around the anchor and the pull-out direction is approximately equal to the internal friction angle of the soil around the anchor. Hsu and Liao [6] pointed out that when the ratio of embedment depth to expanded-body diameter is less than eight, shallow embedment failure occurs in the soil around the anchor; when the ratio of embedment depth to expanded-body diameter is greater than eight, deep embedment failure occurs in the soil around the anchor. Hyett et al. [7] pointed out that the optimal expanded-body diameter is two to three times the diameter of the conventional anchor segment. Jie et al. [8] pointed out that when the horizontal spacing of expanded-body anchors exceeds three times the expanded-body diameter, the group anchor effect has a minimal impact on the ultimate bearing capacity of the expanded-body anchors.
To quantitatively describe the relationship between various factors and the ultimate bearing capacity of expanded-base anchors, scholars have mainly conducted research on three aspects: (1) the distribution model of lateral frictional stress [9]; (2) the empirical formula for end resistance [10]; (3) the load–displacement curve fitting model for pull-out tests [11]. The existing models for the distribution of lateral friction stress mainly include the shear stress–shear displacement function model [12] and the shear stress distribution function model [13]. The existing empirical formulas for end resistance can be applied to expanded-base anchors subjected to both horizontal and inclined [14] pull-out directions. The existing load–displacement curve fitting models for pull-out tests of expanded-base anchors mainly include the hyperbolic model [15], the exponential model [16], and the power function model [17].
The existing experiments, numerical simulations, and theoretical analyses are largely based on destructive pull-out tests of expanded-base anchors. These destructive pull-out tests are often limited by on-site conditions and are relatively expensive. Moreover, certain parameters in empirically derived formulas based on test data lack clear physical interpretation. To address the aforementioned issues, this paper proposes a method for calculating the ultimate bearing capacity of underreamed anchors. This method can calculate the ultimate bearing capacity with minimal reliance on destructive pull-out tests. It is characterized by small errors and simple calculations. This paper first elaborates on the differences in the load transfer mechanisms between underreamed anchors and traditional friction anchors; Then, field pull-out tests are conducted. Based on the pull-out curves, the anchoring characteristics of underreamed anchors are analyzed. Subsequently, numerical simulations of the deep anchoring failure patterns of the soil surrounding expanded-base anchors are carried out using ABAQUS 2016. An analytical model for side friction and end-bearing capacity under ultimate-limit conditions is proposed, in which every parameter possesses an unambiguous physical meaning. Finally, the ultimate bearing capacity of underreamed anchors is calculated based on the pull-out data from the elastic–plastic stage and the function model.

2. Characteristics of Load Transfer for Underreamed Anchor

As a new type of anchor, the underreamed anchor has an enlarged anchoring section with a diameter that is two to three times that of a conventional anchoring section, according to industry standards [14]. Compared with traditional friction anchors, underreamed anchors mobilize two distinct resistance components. First, lateral frictional resistance is generated along the contact surfaces of both the ordinary and the expanded anchoring sections with the surrounding soil. Second, the expanded section provides additional end resistance, as illustrated in Figure 1. Compared with traditional equal-diameter anchors, the bearing capacity of underreamed anchors is usually two to four times that of traditional equal-diameter anchors under the same deformation. Therefore, underreamed anchors can better meet the anchoring requirements for slope reinforcement and deep foundation pit support compared with traditional friction anchors. Compared with traditional equal diameter anchors, the bearing capacity of underreamed anchors is usually two to four times that of traditional equal diameter anchors under the same deformation. Therefore, underreamed anchors can better meet the anchoring requirements for slope reinforcement [18] and deep foundation [19] pit support compared with traditional friction anchors. The load transfer path of underreamed anchors is mainly divided into three stages: (1) When the load is relatively small, the tensile force is primarily provided by lateral frictional resistance at the contact interface between the ordinary anchoring section and stratum. At this stage, the ordinary anchoring section exhibits a full adhesion bearing mechanism. (2) At first, only the lateral friction of the ordinary anchoring section supplies the tensile force. As the load keeps rising, the end-bearing resistance developed at the cross-section of the expanded anchoring section is activated. Eventually, the tensile force is shared jointly by that end resistance and the lateral friction acts on both the ordinary and the expanded anchoring sections. (3) When the load approaches the tensile force of the anchor, the end resistance at the cross-section of the expanded anchoring section and the lateral frictional resistance at the contact interface between the expanded anchoring section and stratum are fully mobilized. The expanded anchoring section also functions as a load-bearing body. Part of the ordinary anchoring section transforms into a pressure-type anchor [20]. Eventually, the load transfer mechanism resembles that of a pressure-type anchor. Due to the high load-bearing capacity of underreamed anchors and their more rational load transfer mechanism, the deformation under external forces is relatively small. This enables underreamed anchors to better maintain the stability and safety of structures in practical engineering applications. During the pull-out process, the displacement of underreamed anchors is relatively small, and the rate of displacement increase is relatively slow as the load increases. This characteristic enables underreamed anchors to maintain relatively small deformations under significant loads, thereby meeting the engineering requirements for deformation control.

3. Characteristics of Anchoring by Underreamed Anchors

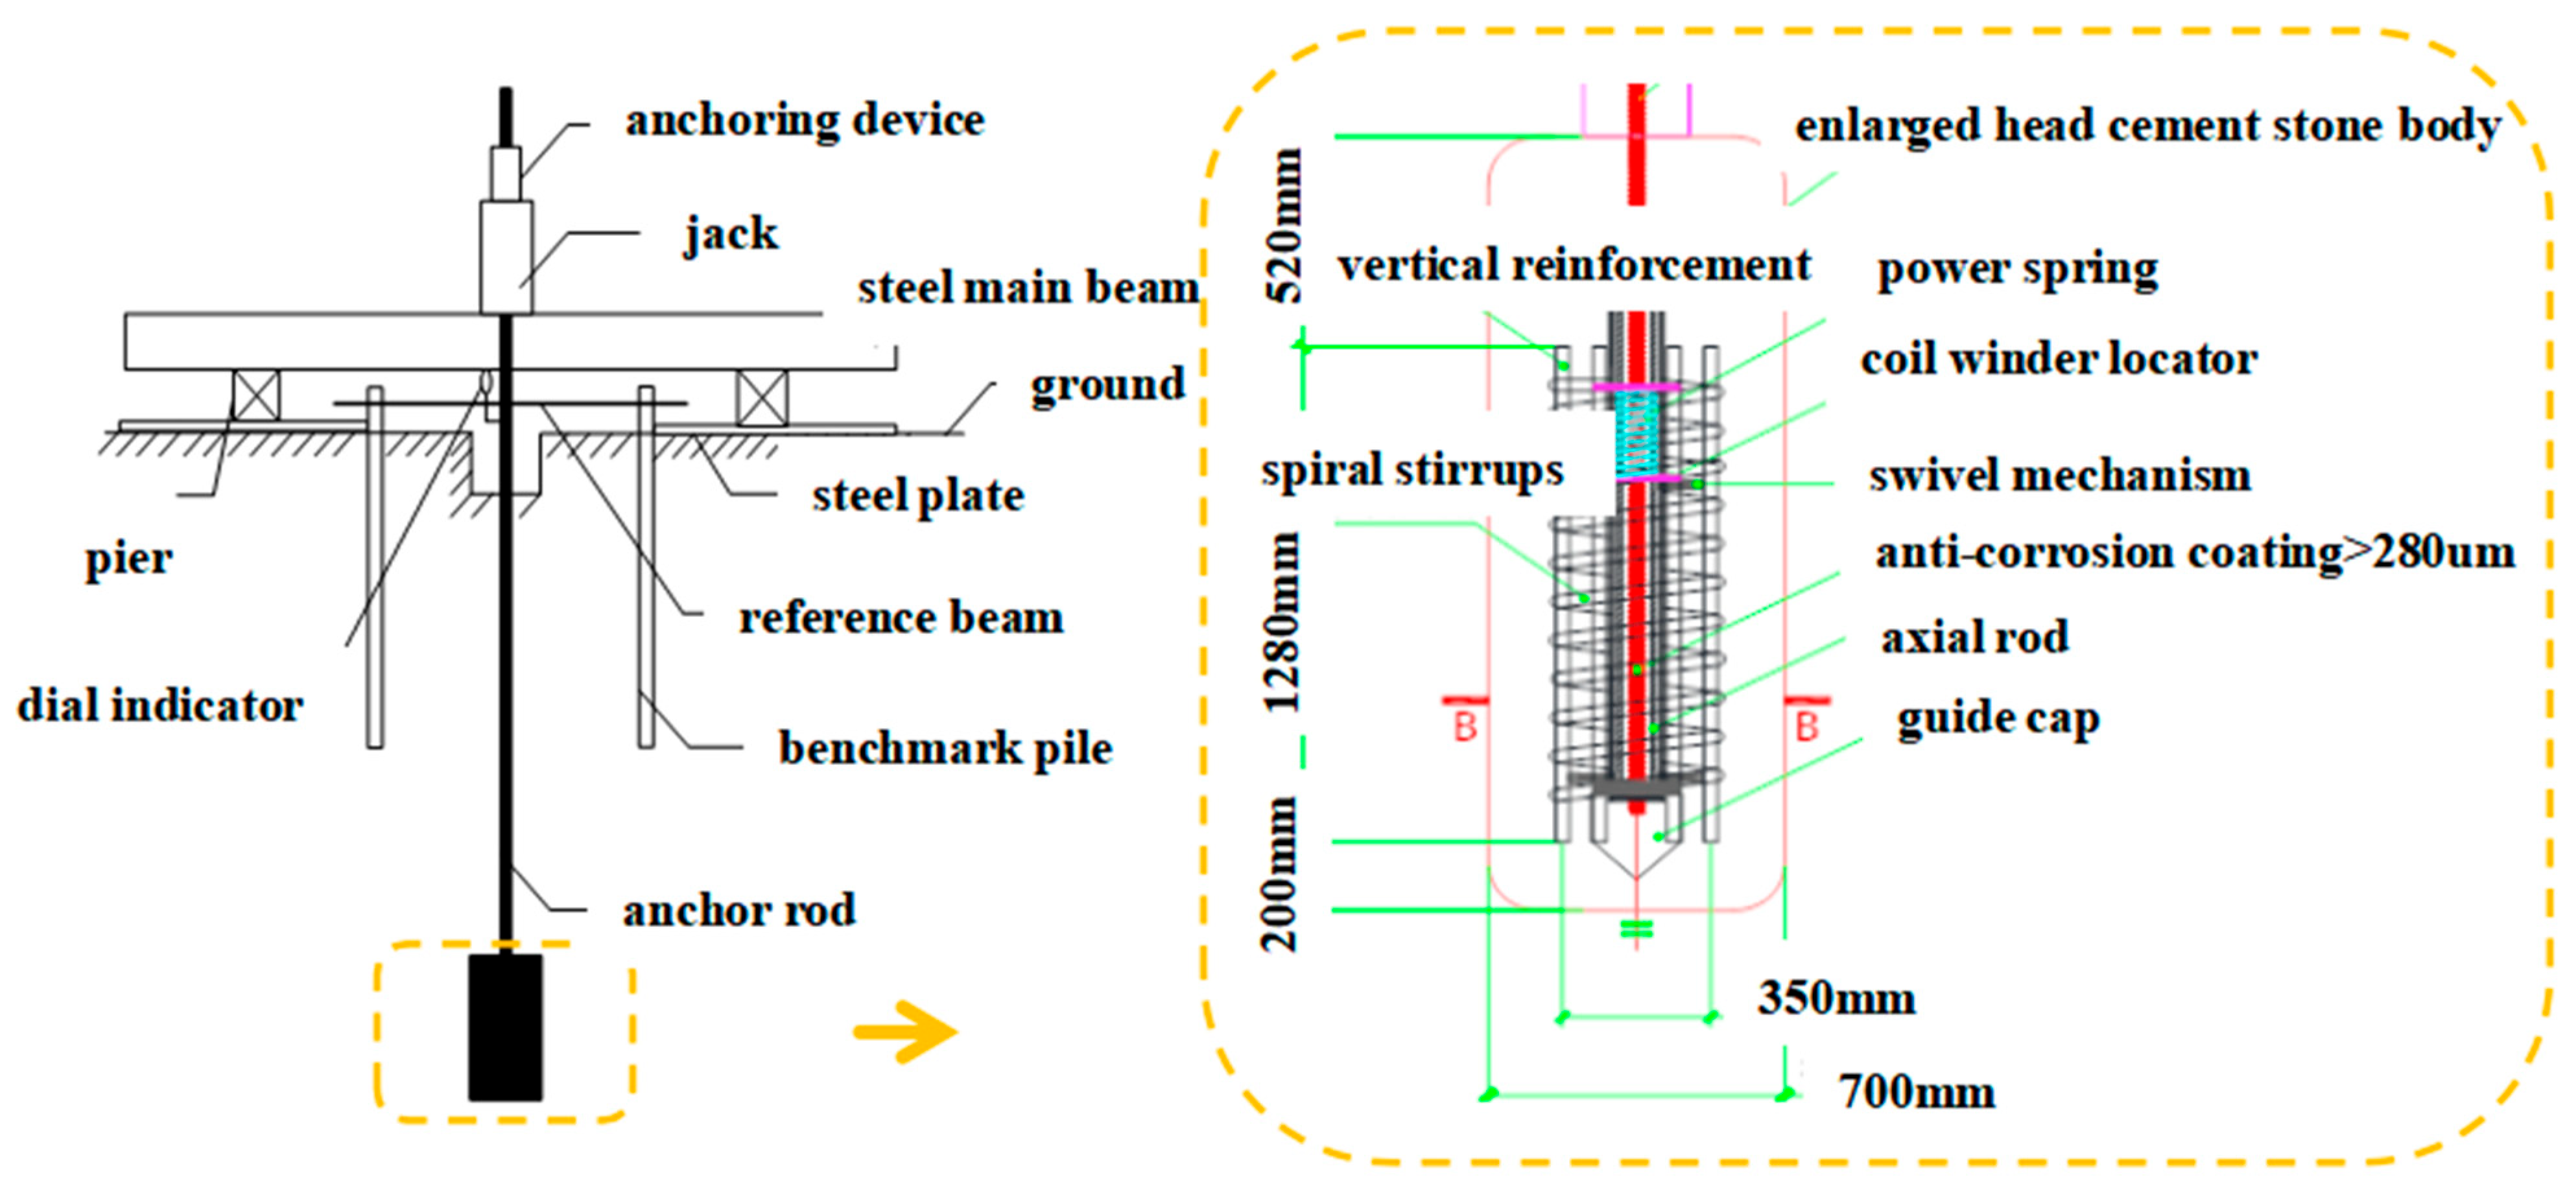
The on-site pull-out testing ground for the underreamed anchors is stratified into nine geological layers based on genetic age and physical characteristics, as detailed in Table 1, with the corresponding physico-mechanical parameters presented in Table 2. A 1.25 MPa air rig drills the 10 m bore; a 150 t jack loads the ϕ36 mm PSB1080 tendon while uplift is logged with a 50 mm dial gauge. The anchor features an 8 m ϕ250 mm bond zone and a 2 m ϕ700 mm underream; the bulb cage is ϕ350 mm, as illustrated in Figure 2.
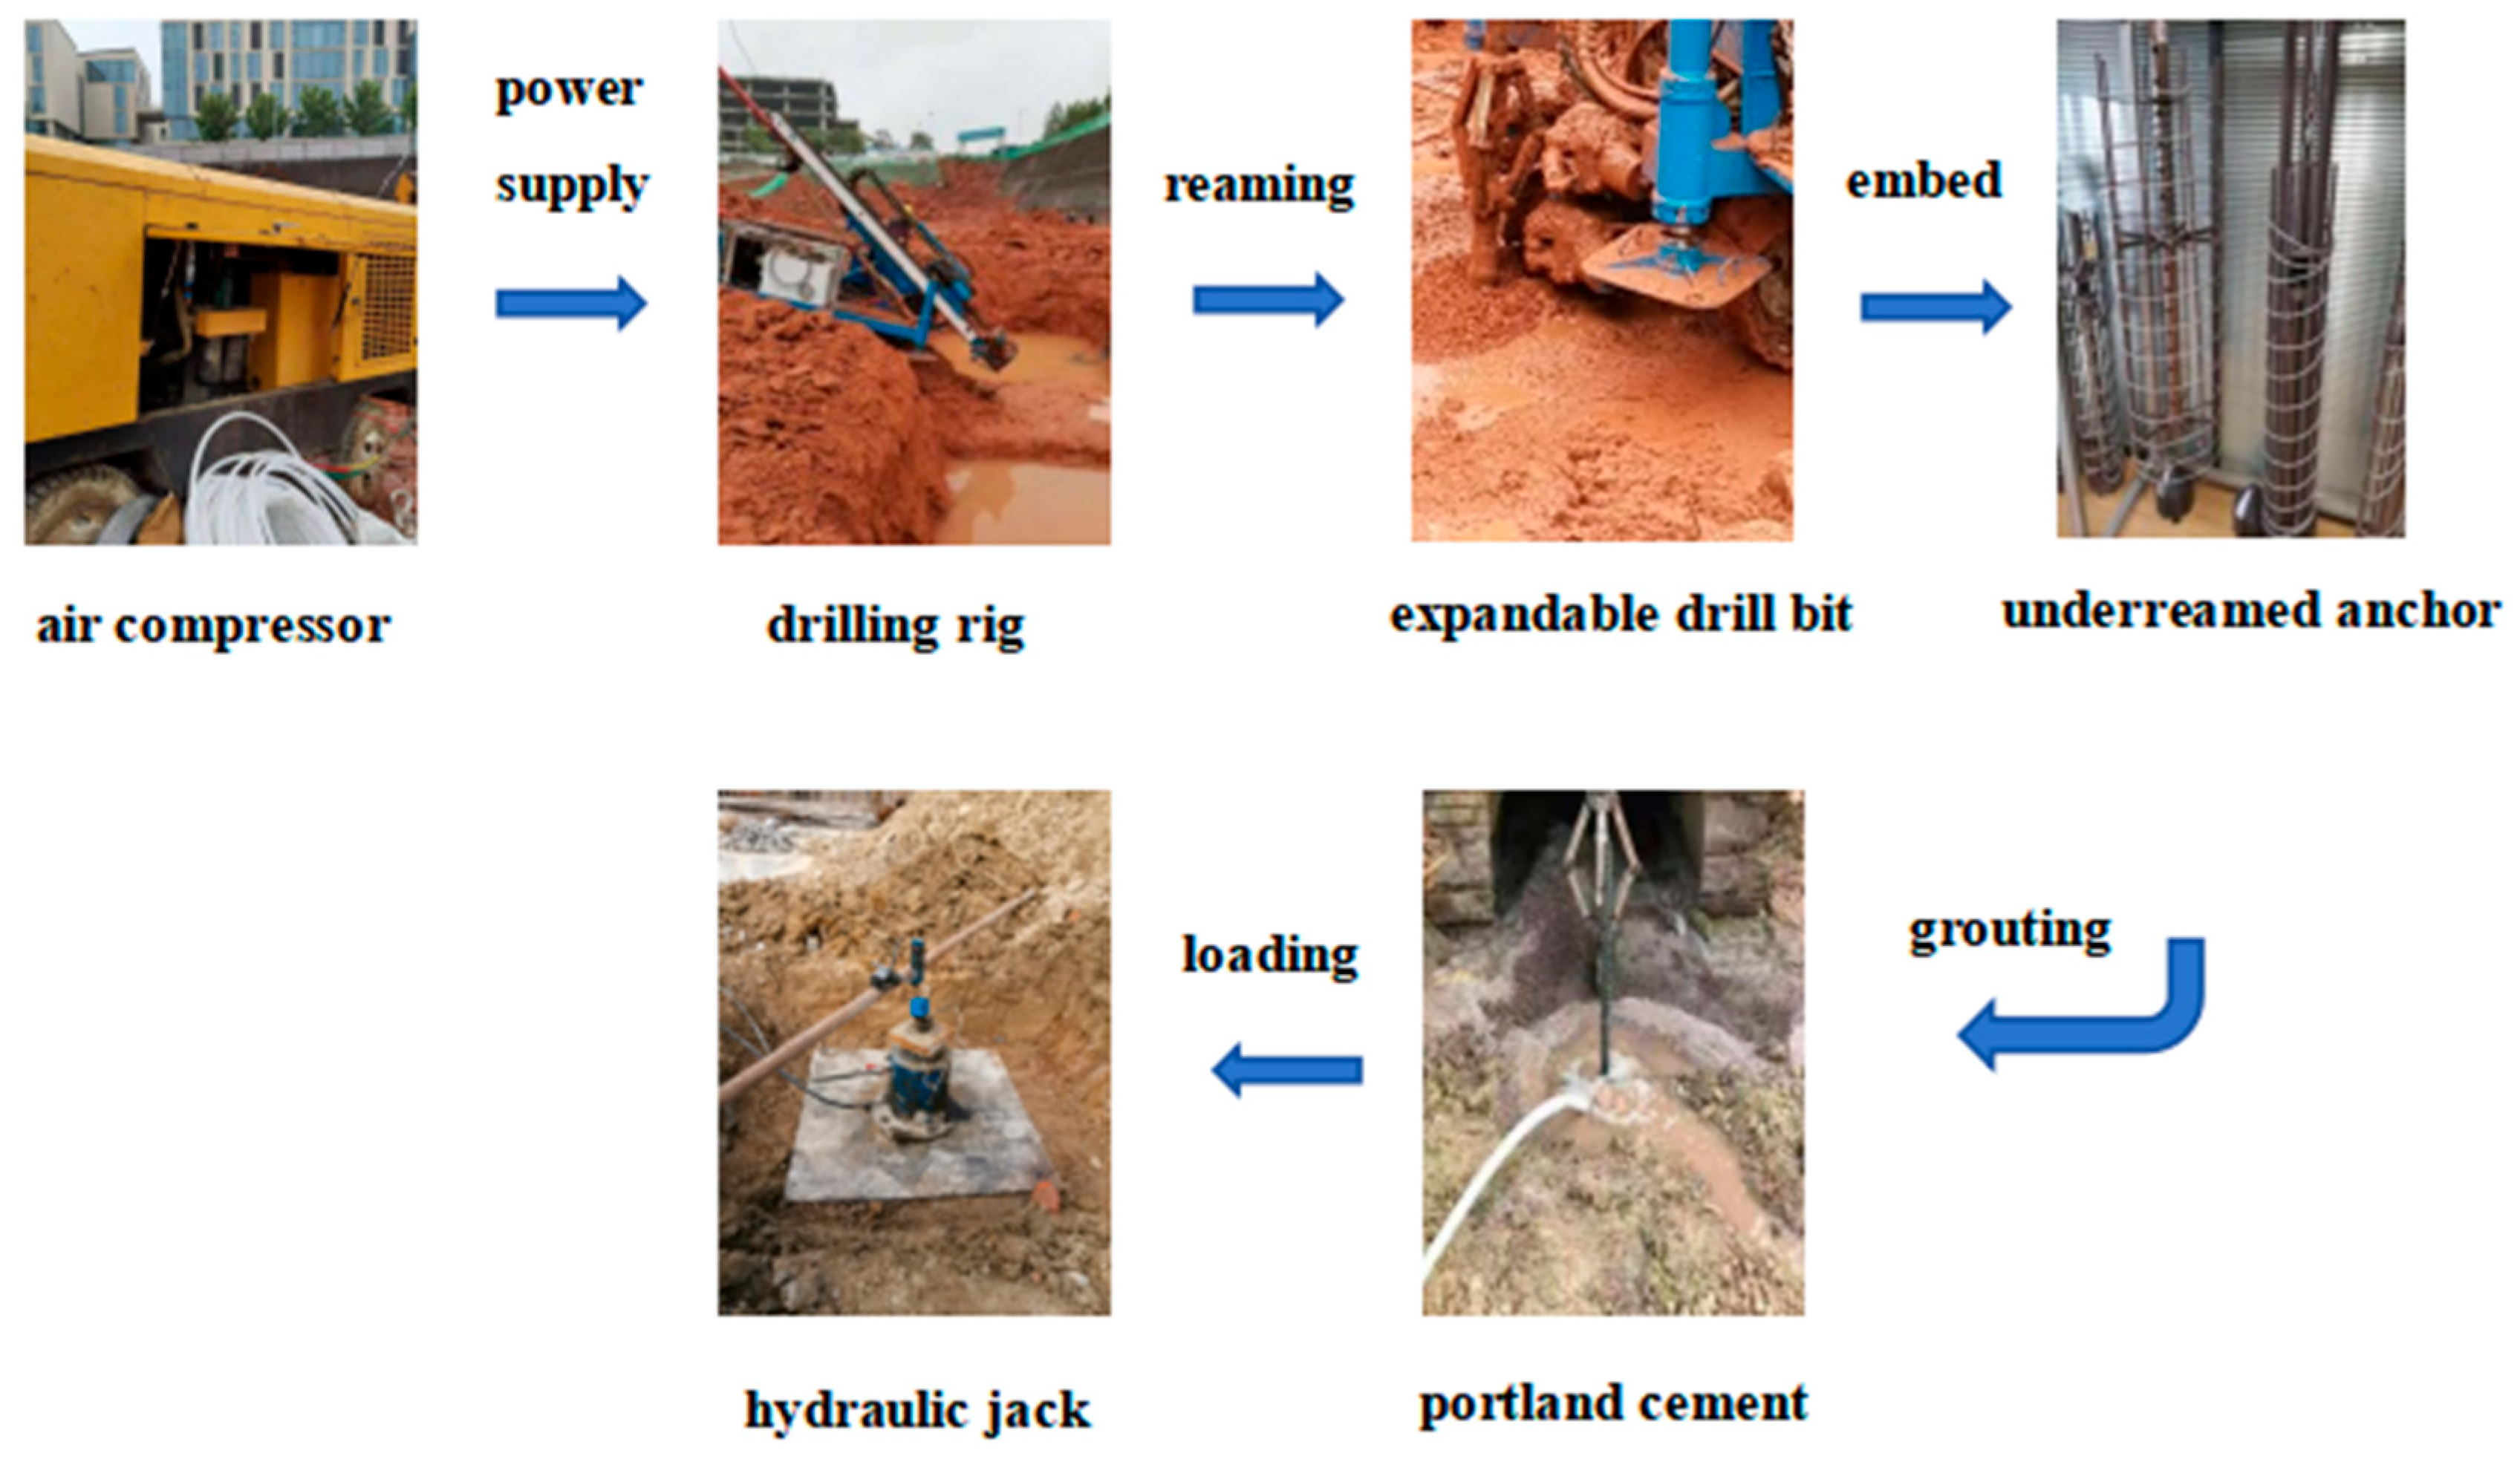
The experimental procedure, illustrated in Figure 3, was executed as follows: (a) A pneumatic compressor energized the drilling rig to advance a ϕ250 mm borehole to 8 m depth. (b) The bit was replaced by an expandable ϕ700 mm underreamer to enlarge the lower section to 10 m depth. (c) The underreamed anchor, fitted with a deployable cage, was inserted to the bore base and the cage was expanded. (d) The annulus was grouted with 42.5-grade Portland cement slurry at an injection pressure of 2–3 MPa; the grout was cured for 28 days under ambient conditions. (e) Pull-out testing was performed by staged cyclic loading: the first five increments were applied at 100 kN/min and the sixth at 50 kN/min, each sustained for 5 min, as shown in Table 3.
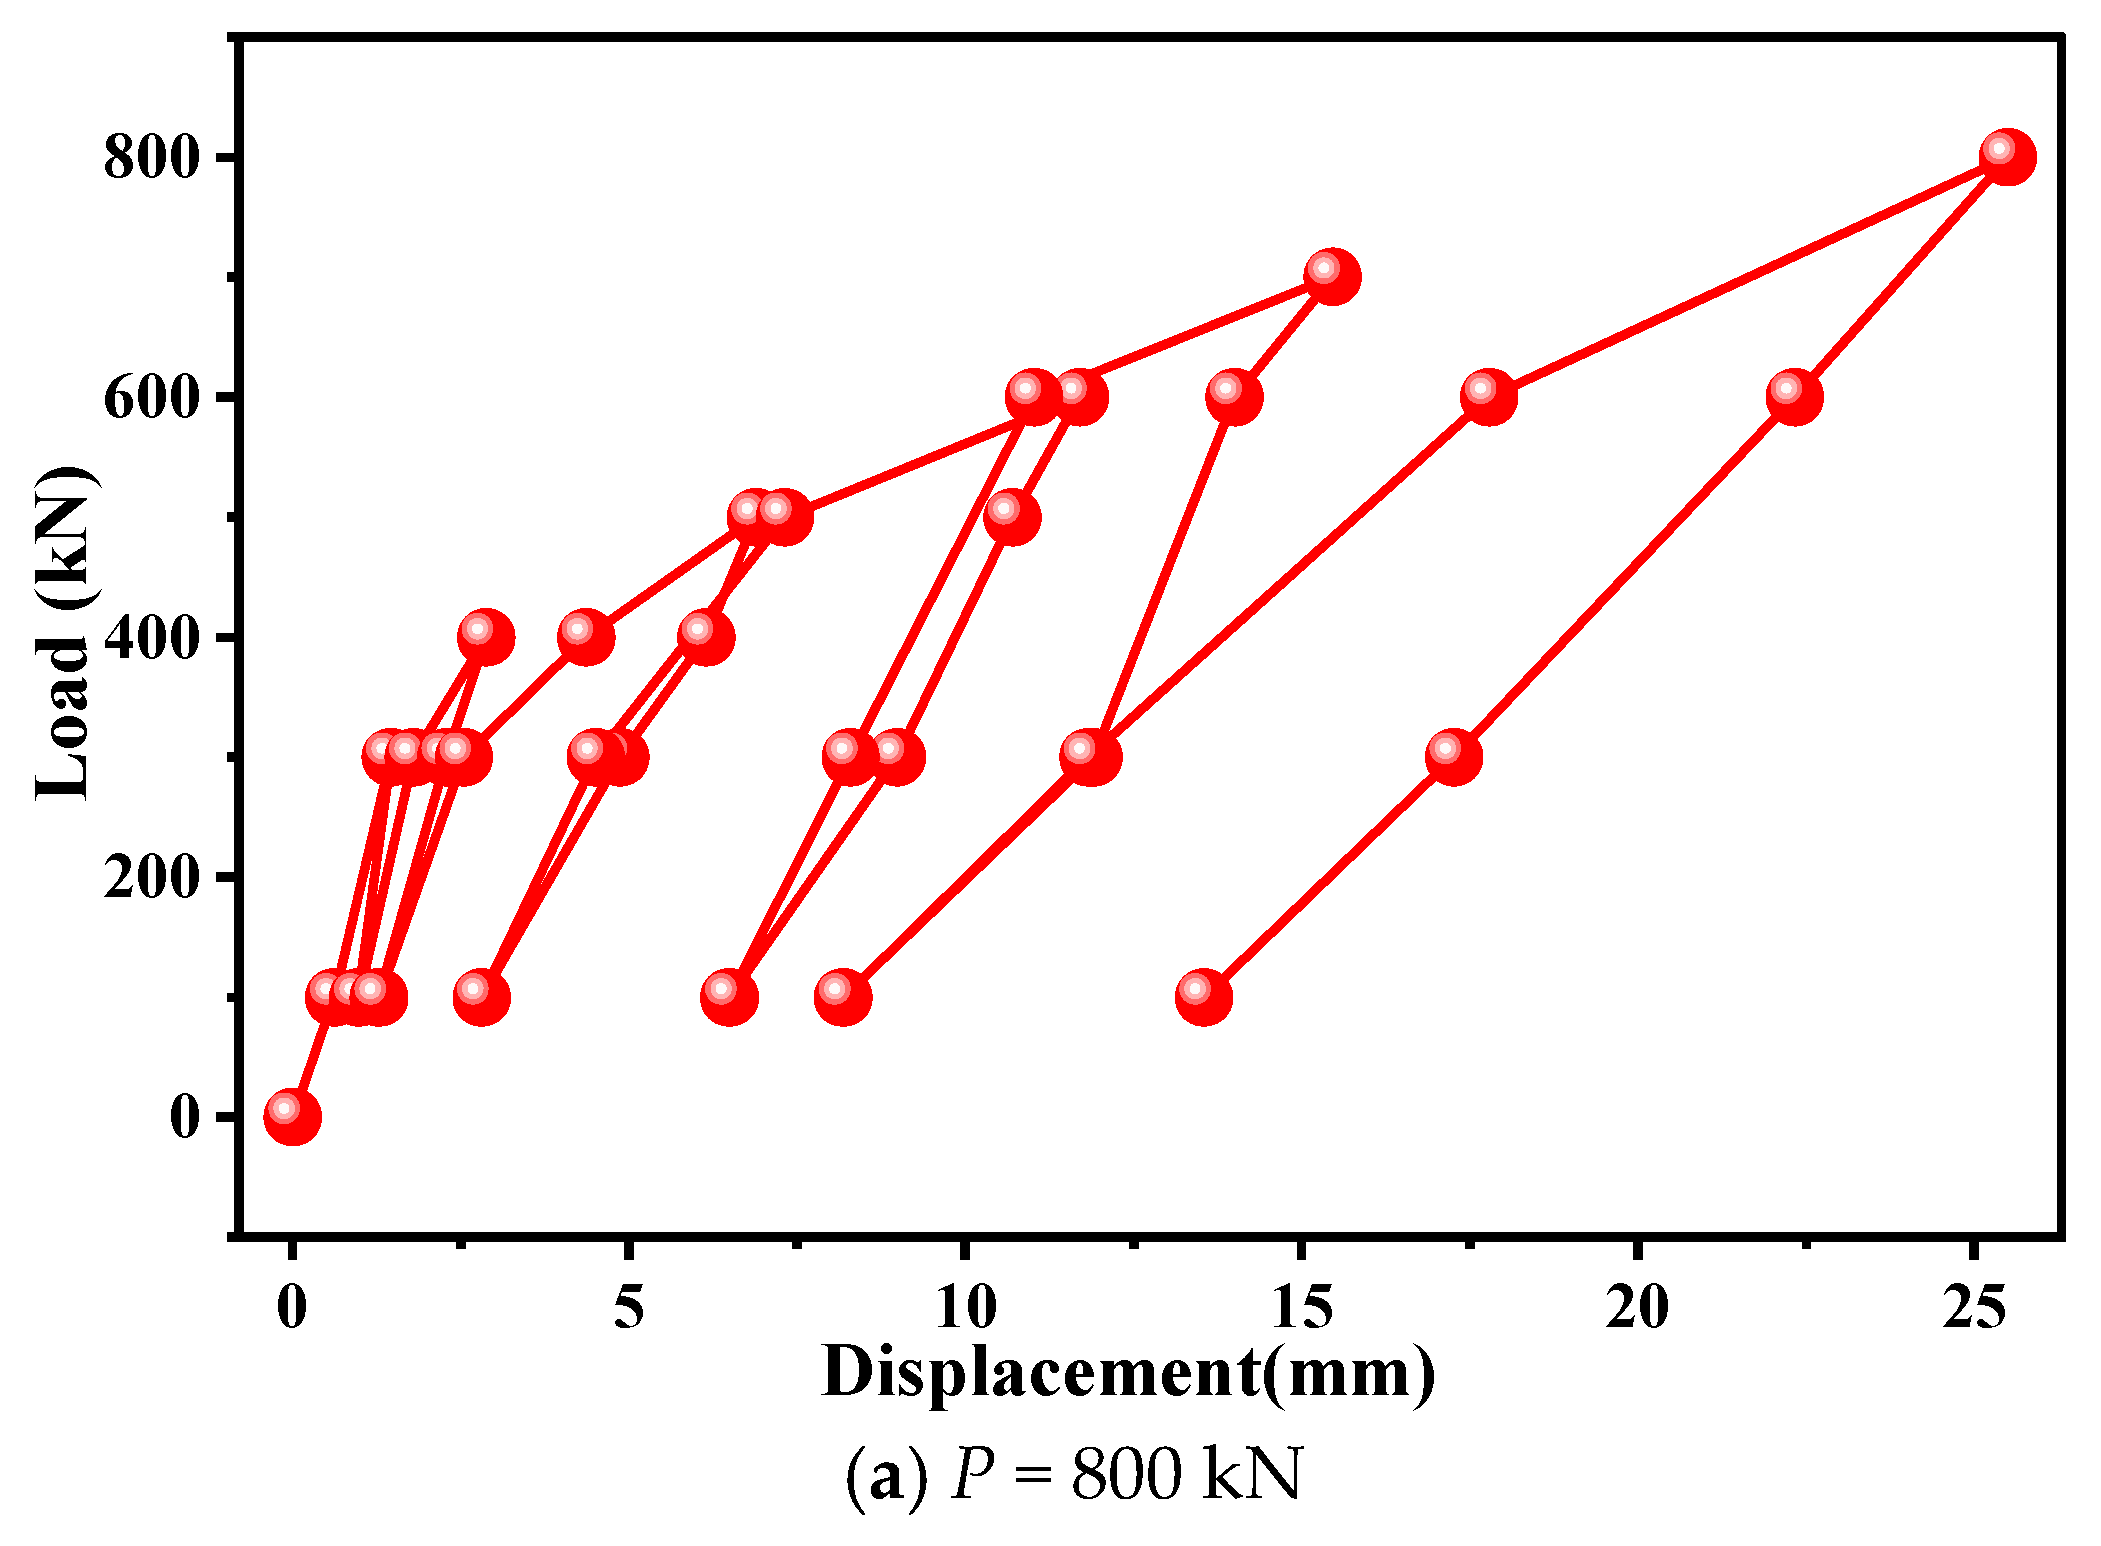
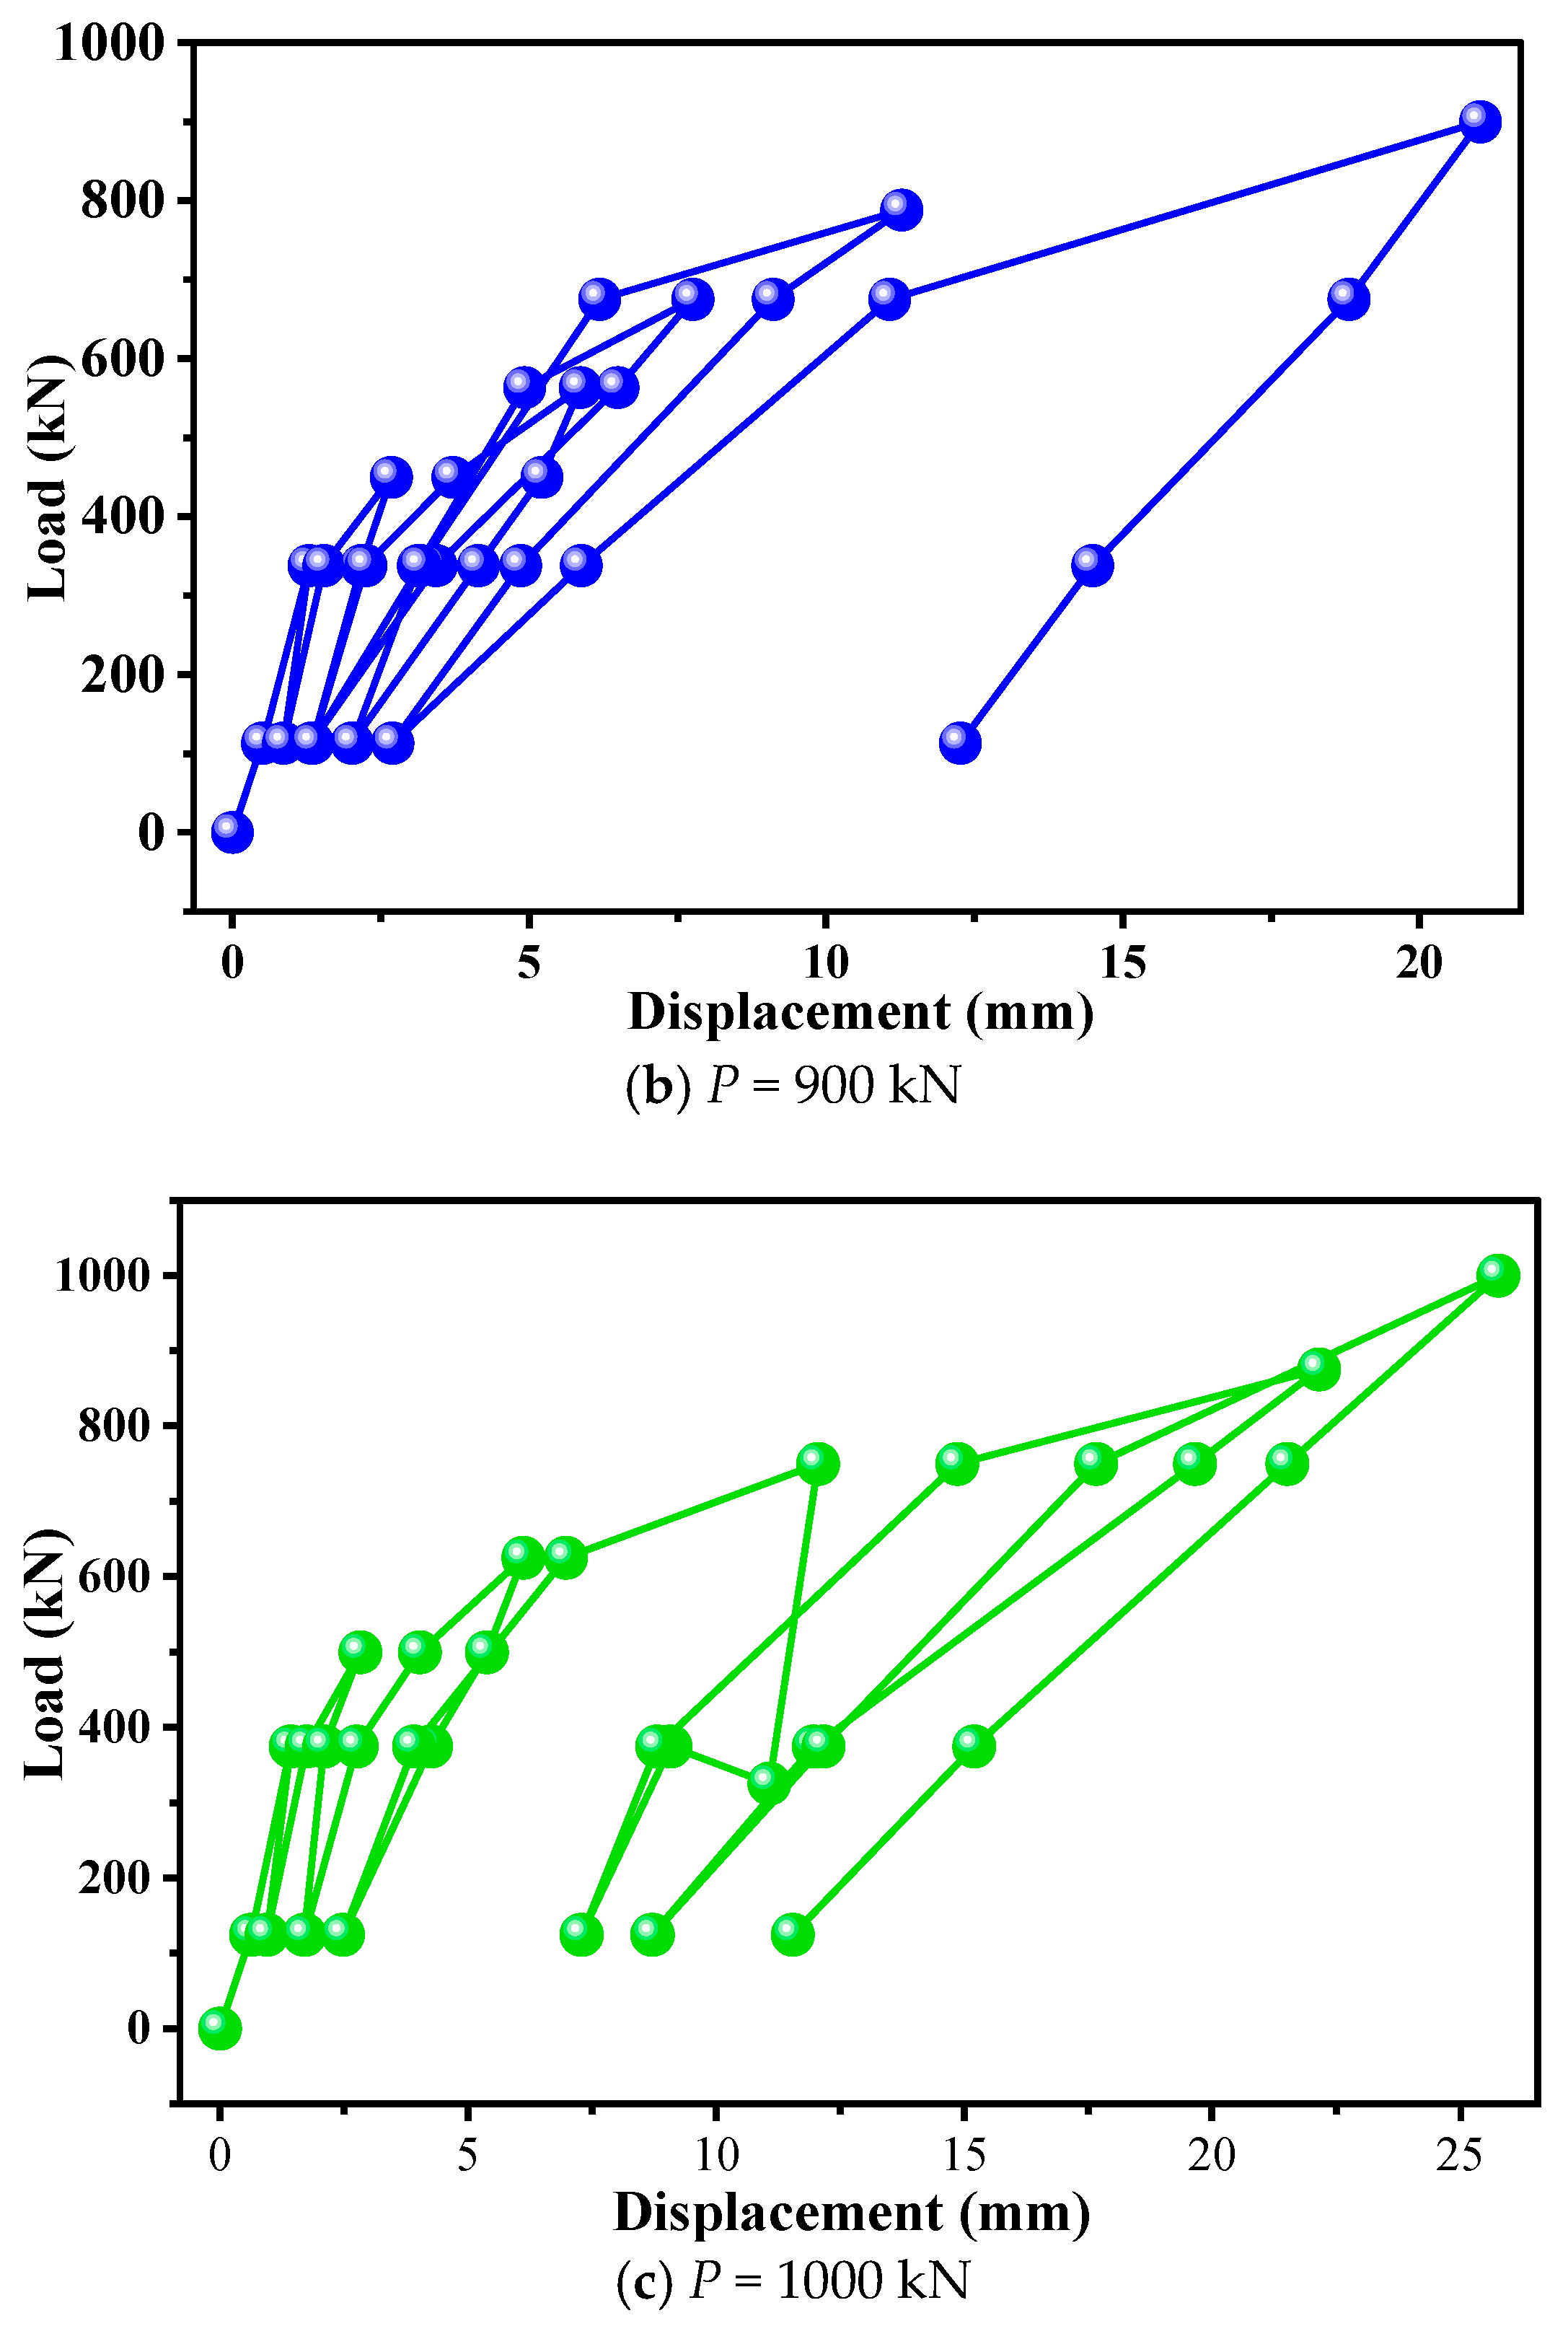
Three sets of tests were conducted on-site, with the final loading values being 800 kN, 900 kN, and 1000 kN. The cumulative uplift displacements were 25.49 mm, 21.02 mm, and 25.76 mm, respectively. The load–displacement curves are shown in Figure 4. This paper explores the fatigue characteristics of underreamed anchors from several aspects, including the hardening and softening of anchor rod materials, the changes in hysteresis loops, and the accumulation of residual deformation. In the initial few cycles, when the load first reaches 400 kN, 338 kN, and 375 kN, the slope of the load–displacement curve keeps increasing. This indicates that the anchor rod material is experiencing hardening under cyclic loading, and the strength of the material is enhanced. As the number of cycles increases, the slope of the curve gradually decreases, indicating that the material begins to soften. This is due to the accumulation of fatigue damage in the material. The area of the hysteresis loop formed by each loading and unloading cycle represents the energy dissipated in each cycle.
As shown in Figure 4a, when the load first reaches 750 kN, the area of the hysteresis loop is maximized. With the increase in the number of cycles, the area of the hysteresis loop gradually decreases, indicating a reduction in the energy absorption capacity of the anchor rod. The change in the shape of the hysteresis loop reflects the degradation of the material. As the number of cycles increases, the hysteresis loop gradually becomes flatter, indicating a reduction in the material’s stiffness. The residual deformation gradually increases after each cycle. In Figure 4b, when the underreamed anchor is first loaded with 100 kN, the displacement is 0.61 mm; when the loading is increased to 300 kN and then unloaded back to 100 kN, the displacement is 0.97 mm; when the loading is increased to 400 kN and then unloaded back to 100 kN, the displacement is 1.27 mm; when the loading is increased to 500 kN and unloaded back to 100 kN, the displacement is 2.80 mm; when the loading is increased to 600 kN and then unloaded back to 100 kN, the displacement is 6.48 mm; when the load is increased to 700 kN and then unloaded back to 100 kN, the displacement is 8.17 mm; and when the loading is increased to 800 kN and then unloaded back to 100 kN, the displacement is 13.54 mm. The load–displacement curves in Figure 4c also exhibit similar patterns of change, indicating that the accumulation of plastic deformation in the anchor rod can lead to permanent damage to the anchor rod.

4. Failure Modes of Soil Surrounding Enlarged Body Anchor Rod

Since the on-site test cannot capture the failure pattern of the soil around the anchor, we employed Abaqus to numerically reproduce the entire loading process of the underreamed anchor so that the failure morphology of the surrounding soil can be visualized and analyzed directly. The basic assumptions of the established model are as follows: (1) The model material is a continuous, homogeneous, and isotropic elastic body. (2) The soil constitutive model adopts the Mohr–Coulomb strength theory model, with the soil dilation angle set at 0.1°. (3) The model is axially symmetric in space, with the zy-plane as the symmetry plane. Half of the model width is selected, and the model is divided perpendicularly to the x-axis. The lateral pressures at corresponding positions of the two divided parts are equal. The key point in establishing this model is the determination of contact stiffness, which will be elaborated in detail later.

4.1. The Geometric Dimensions and Material Properties of the Model

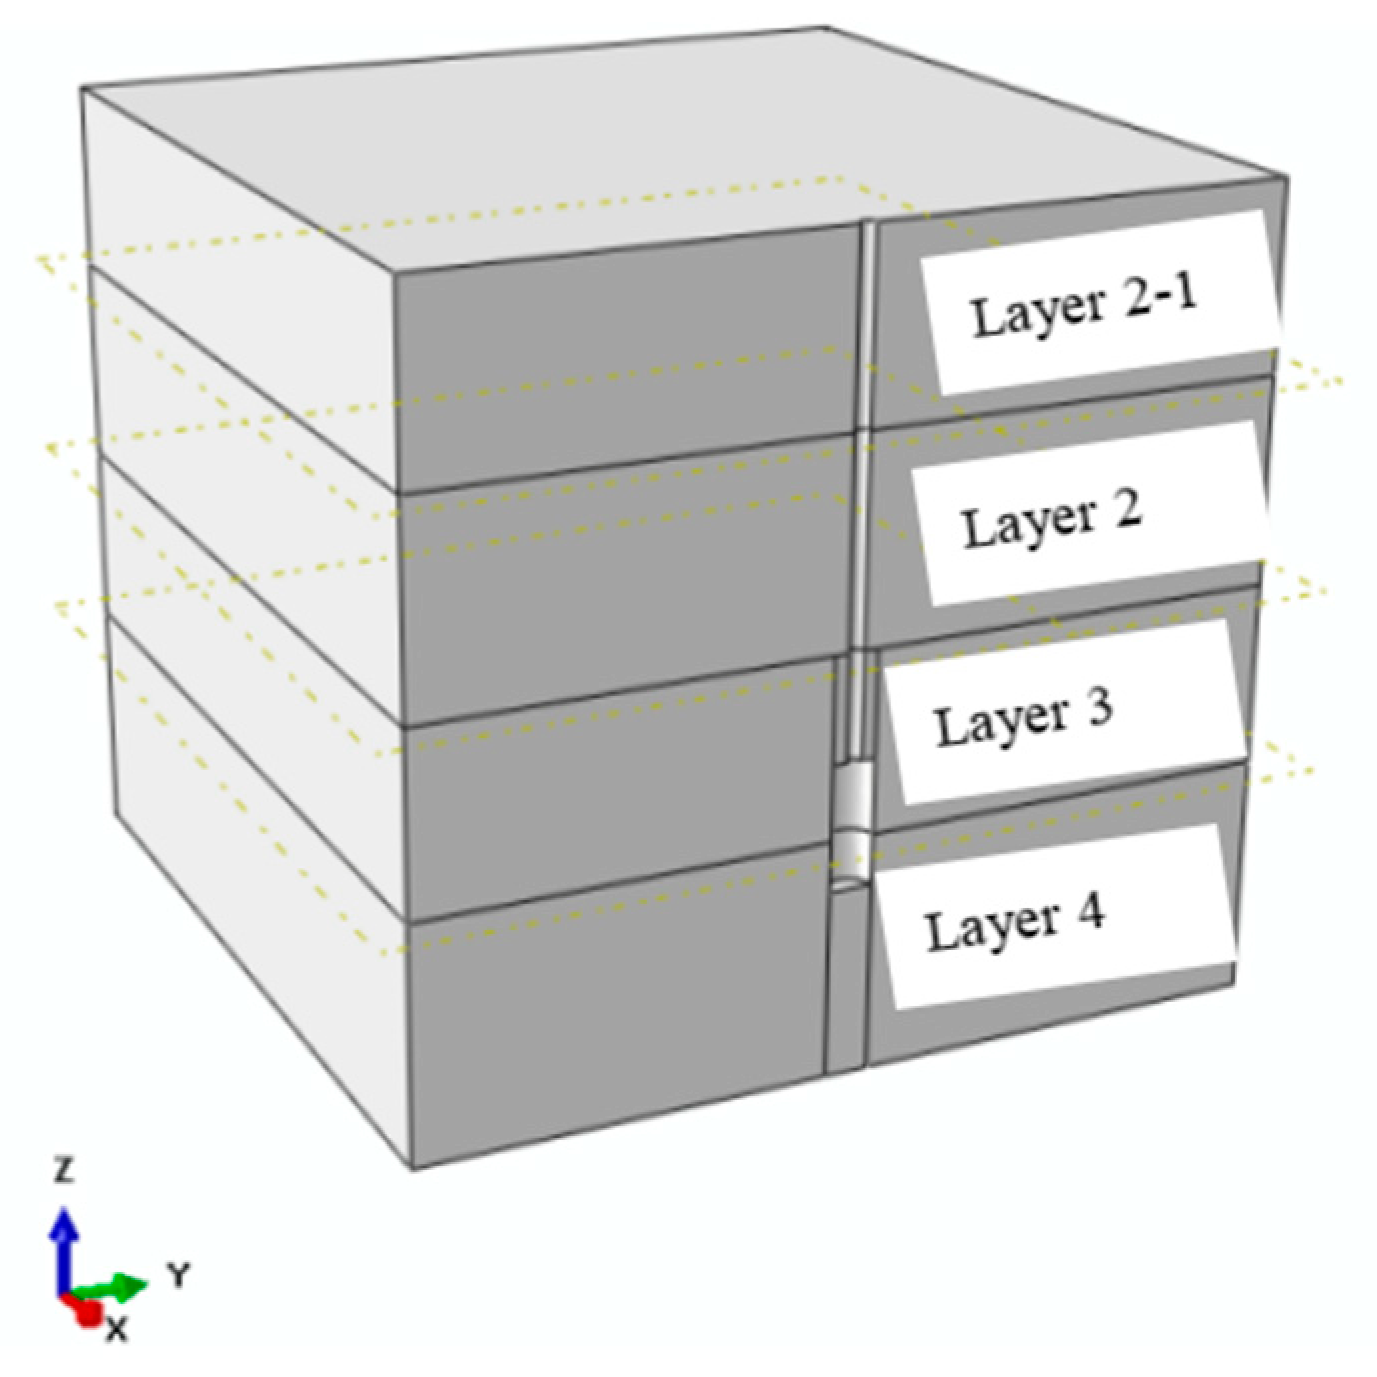
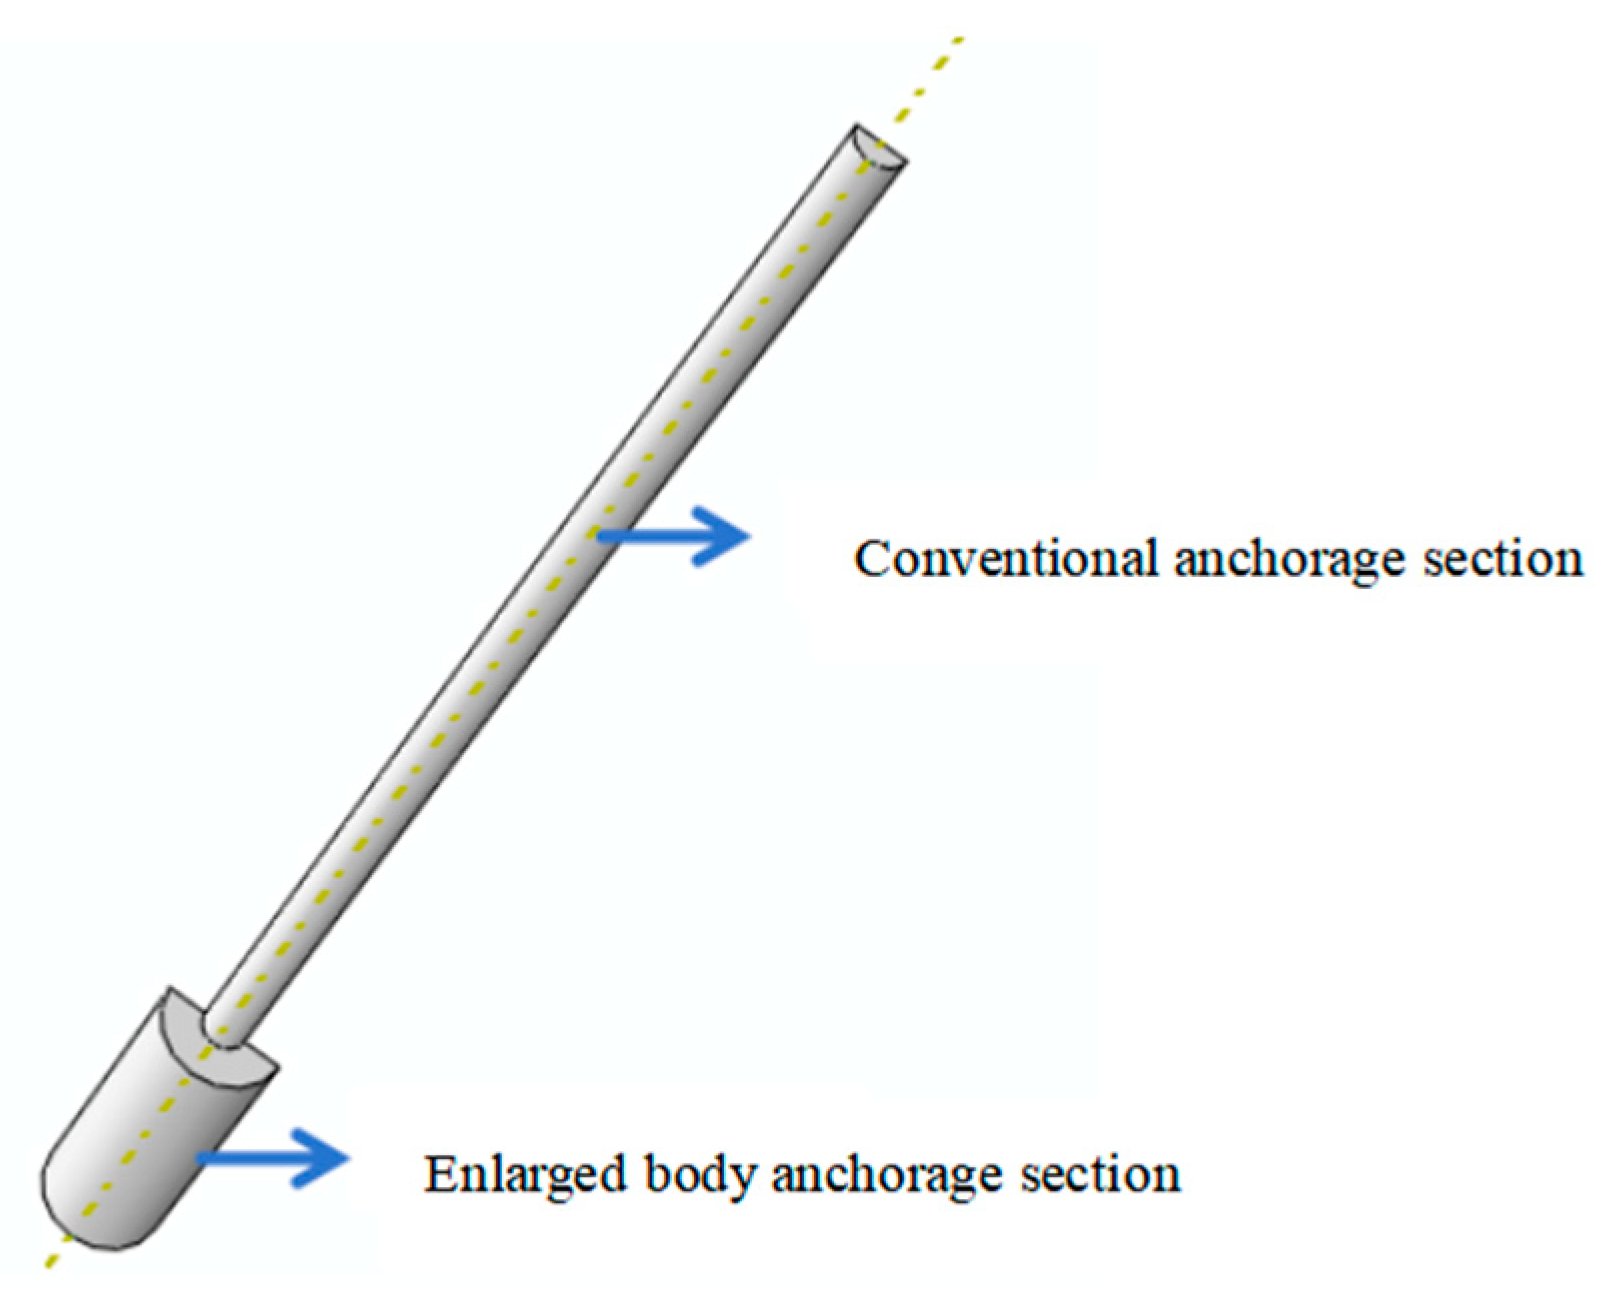
The tensile force that the enlarged body anchor rod bears in the surrounding soil is symmetrically distributed along the central axis. Therefore, when establishing the geometric model, half of the actual structure is taken. The model is divided vertically along the x-axis, taking half of its width with the zy-plane as the symmetry plane, as shown in Figure 5. The geometric dimensions of the model are as follows: the length, width, and height of the soil model surrounding the anchor rod are 14 m, 14 m, and 13 m, respectively. The soil strata are divided into four layers, from top to bottom: Layer 2-1 silt clay, Layer 2 silt clay, Layer 3 silt clay, and Layer 4 silt clay. The physical and mechanical parameters of the soil layers are listed in Table 4. The total length of the enlarged body anchor rod is 10 m, with a conventional anchorage section of 8 m and an enlarged body anchorage section of 2 m, as shown in Figure 6. The diameter of the ordinary anchorage section is 250 mm, while the diameter of the enlarged body anchorage section is 700 mm. The rod material is PSB1080-grade steel, with an elastic modulus of 205 GPa, a Poisson’s ratio of 0.27, and a density of 7850 kg/m3; The grouting material is cement with a strength of 42.5 MPa, a water-to-cement ratio of 0.5, and a grouting pressure of 2–3 MPa. The elastic modulus of cement is 26.7 GPa, and its density is 3000 kg/m3. Based on the provided search results, the material properties for the ordinary and enlarged body anchorage sections are as follows: Ordinary anchorage section: elastic modulus = 2.05 × 10¹¹ Pa, Poisson’s ratio = 0.27, density = 7850 kg/m3; enlarged body anchorage section: elastic modulus = 2.8 × 10⁸ Pa, Poisson’s ratio = 0.22, density = 2360 kg/m3.

4.2. The Determination of Contact Stiffness

The contact surface between the enlarged anchor rod and the surrounding soil is mainly divided into three parts: (1) the side surface of the regular anchorage section and the surrounding soil; (2) the side surface of the enlarged anchorage section and the surrounding soil; (3) the end face of the enlarged anchorage section and the surrounding soil. The bearing capacity of the enlarged anchor rod is mainly composed of the friction and pressure at the contact surface. Therefore, the determination of contact surface stiffness is a core step in modeling. In this paper, the contact stiffness kn [21] is defined as Equation (1). In the normal behavior section, the stress penetration is chosen as linear, and the friction coefficient of tangential behavior penalty function is set to 0.1. The rest of the settings are the default settings of ABAQUS 2016.
k n = 10 max K + 4 3 G Δ z min
K = E 3 1 2 μ
G = E 2 1 + μ
In Equations (2) and (3), K is the bulk modulus; G is the shear modulus; Δzmin is the minimum mesh size on the contact surface; E is the elastic modulus of the foundation; and μ is the Poisson’s ratio of the foundation.

4.3. Boundary Loading and Mesh Generation

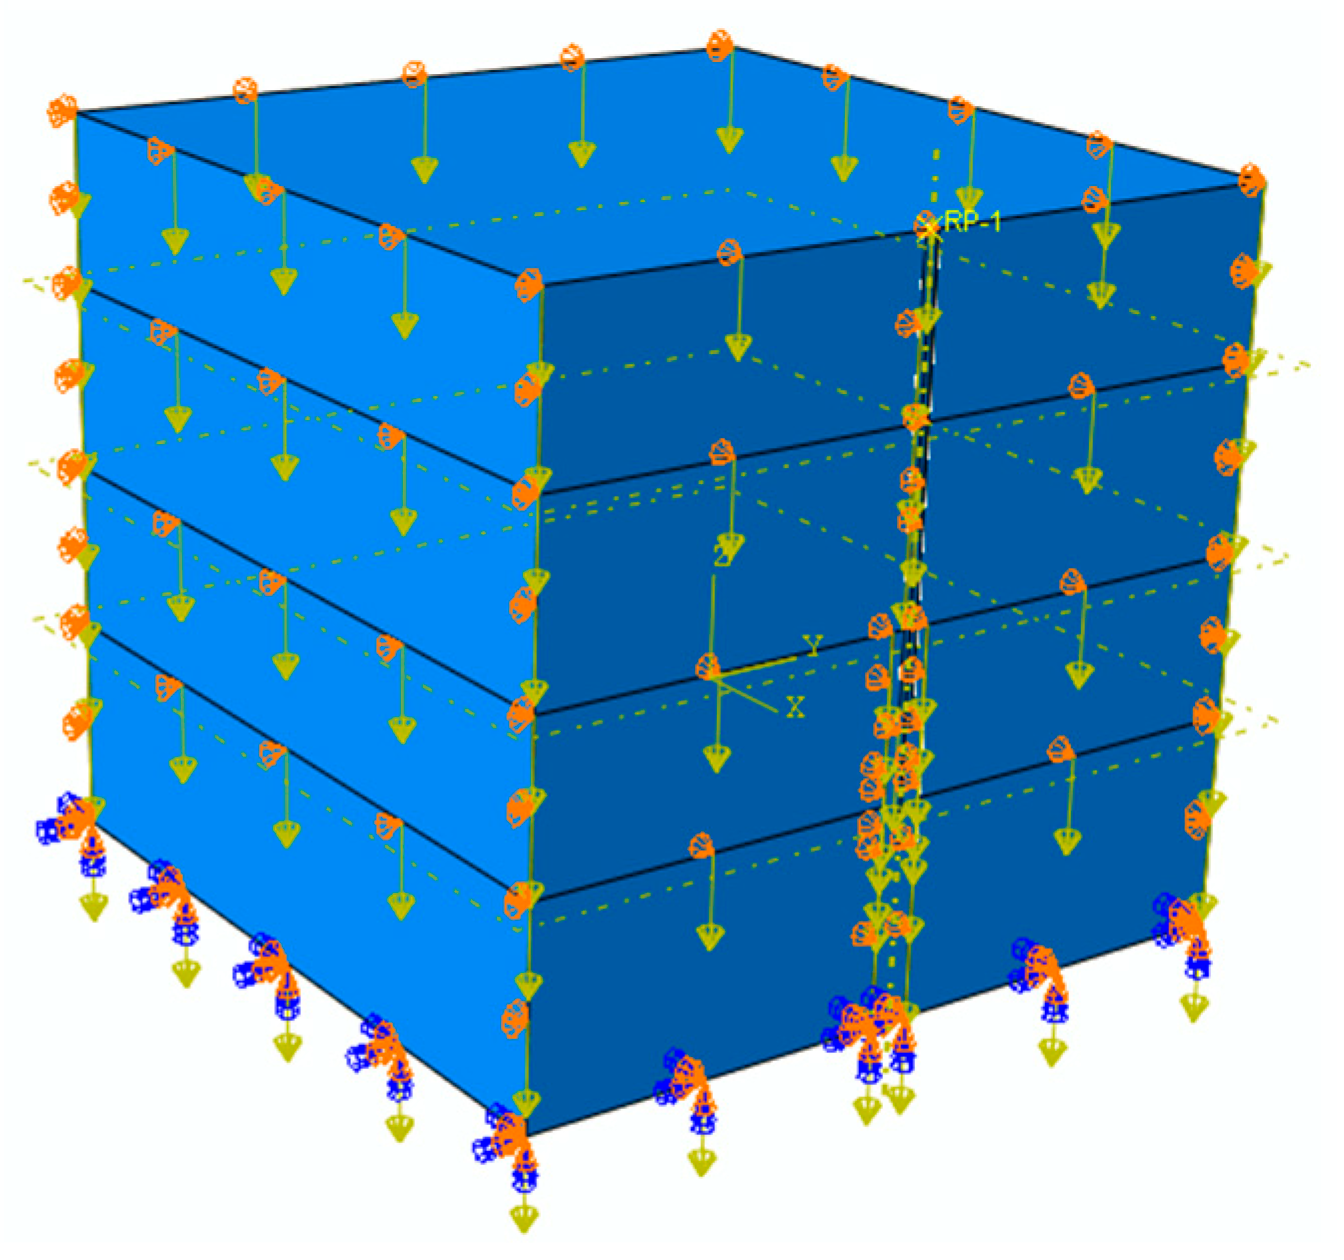
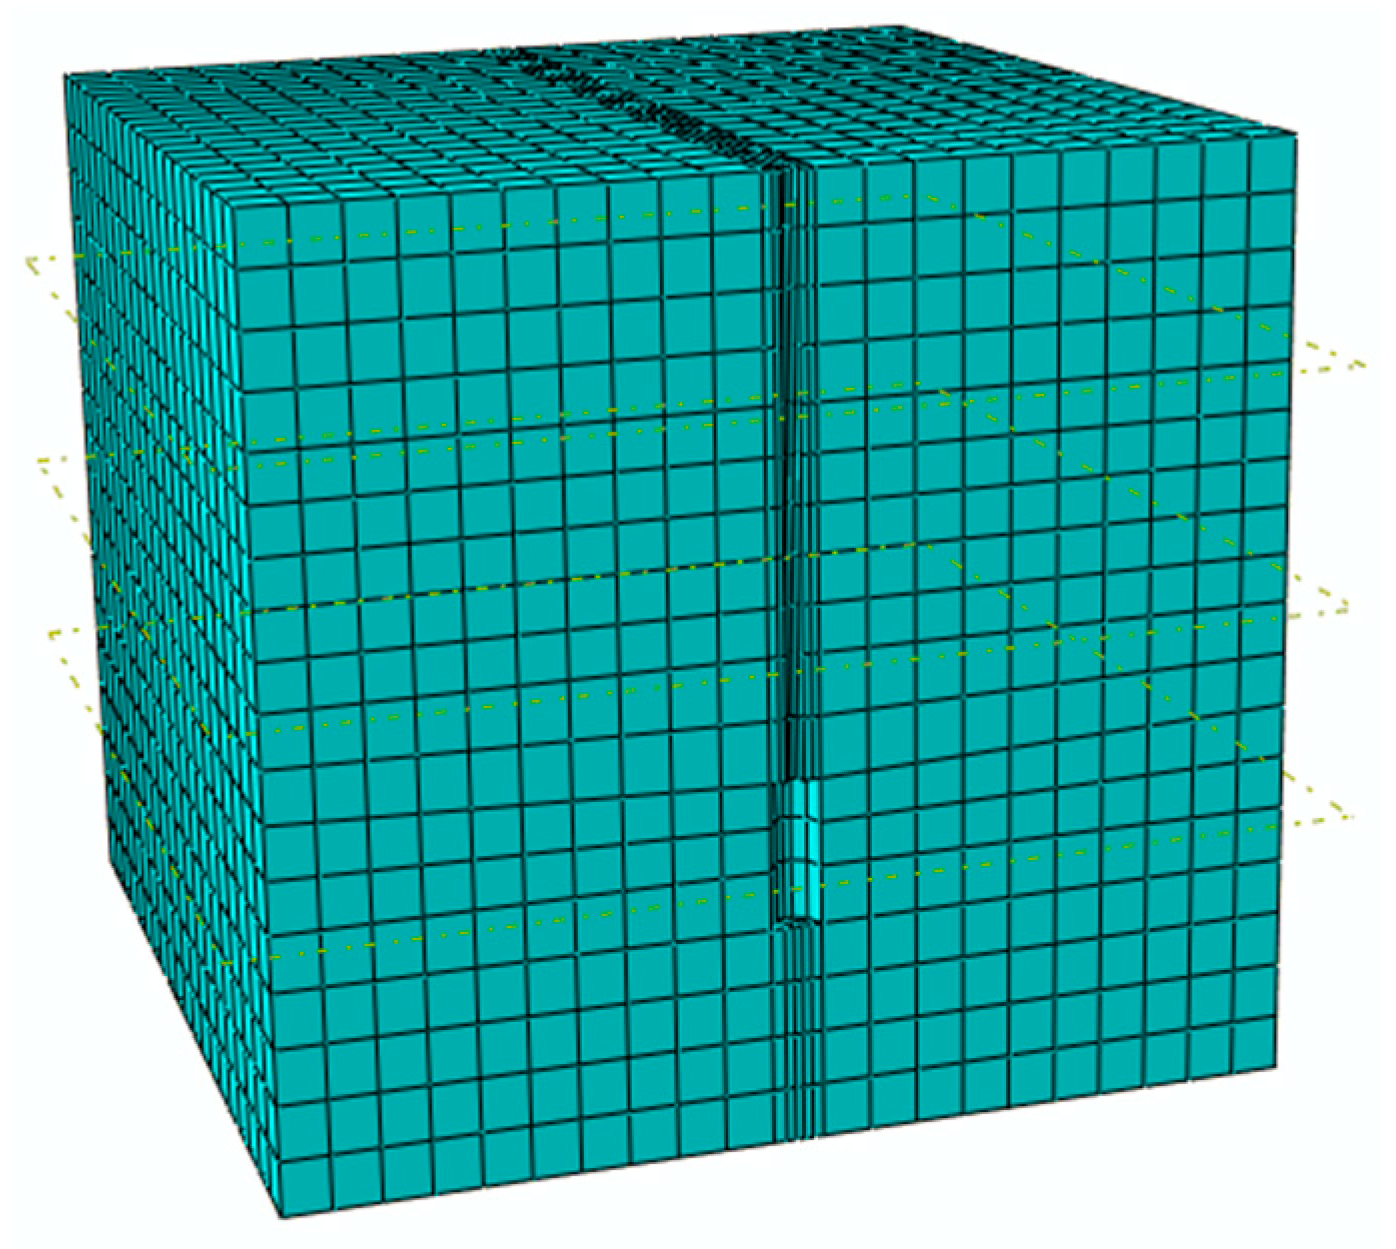
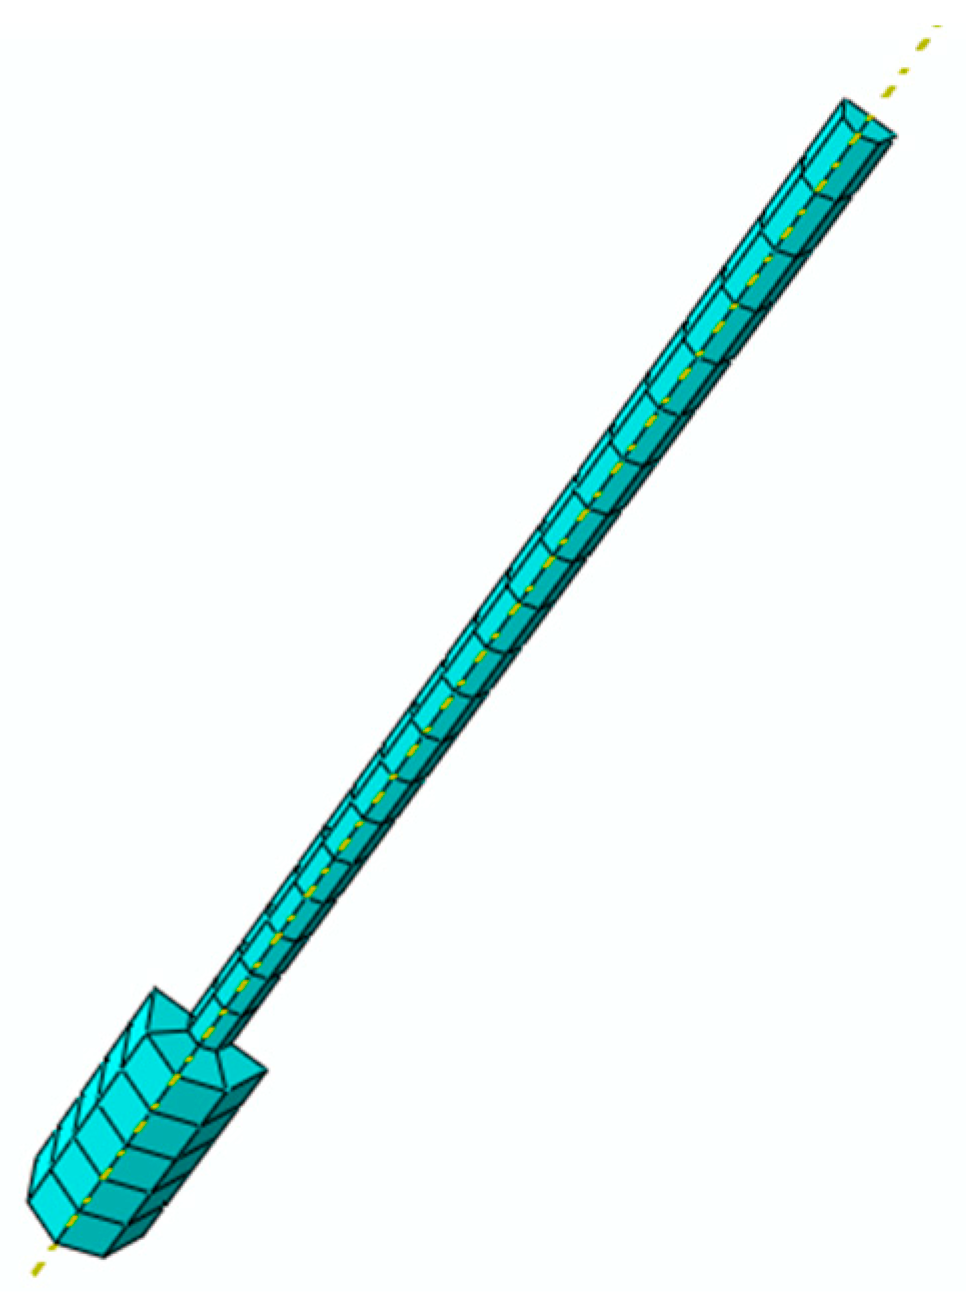
In Figure 7, for the setting of boundary conditions, all degrees of freedom at the bottom of the soil model are restrained, as indicated by the dark-blue conical symbols, and only the normal displacements on the sides of the soil model are constrained, as indicated by the orange conical symbols. For example, the side parallel to the y-axis is only restrained in the x-direction displacement. In Figure 8, The entire model is subjected to geostress equilibrium, as indicated by the yellow arrows. The soil element size is 0.7 m, and the element size at the contact surface between the enlarged anchor rod and the soil ranges from 0.08 to 0.2 m. The total number of elements is 9142, of which 9120 are of the C3D8R type, representing a three-dimensional eight-node hexahedral element. The “R” indicates reduced integration. The remaining 22 elements are of the C3D6 type, representing a three-dimensional six-node triangular prism element. The total number of nodes is 10,546. The element size of the enlarged anchor rod ranges from 0.1 to 0.27 m. The total number of elements is 70, and the element type is C3D8R. The total number of nodes is 186, as shown in Figure 9 and Figure 10.

4.4. Analysis of Soil Failure Patterns Around Anchors

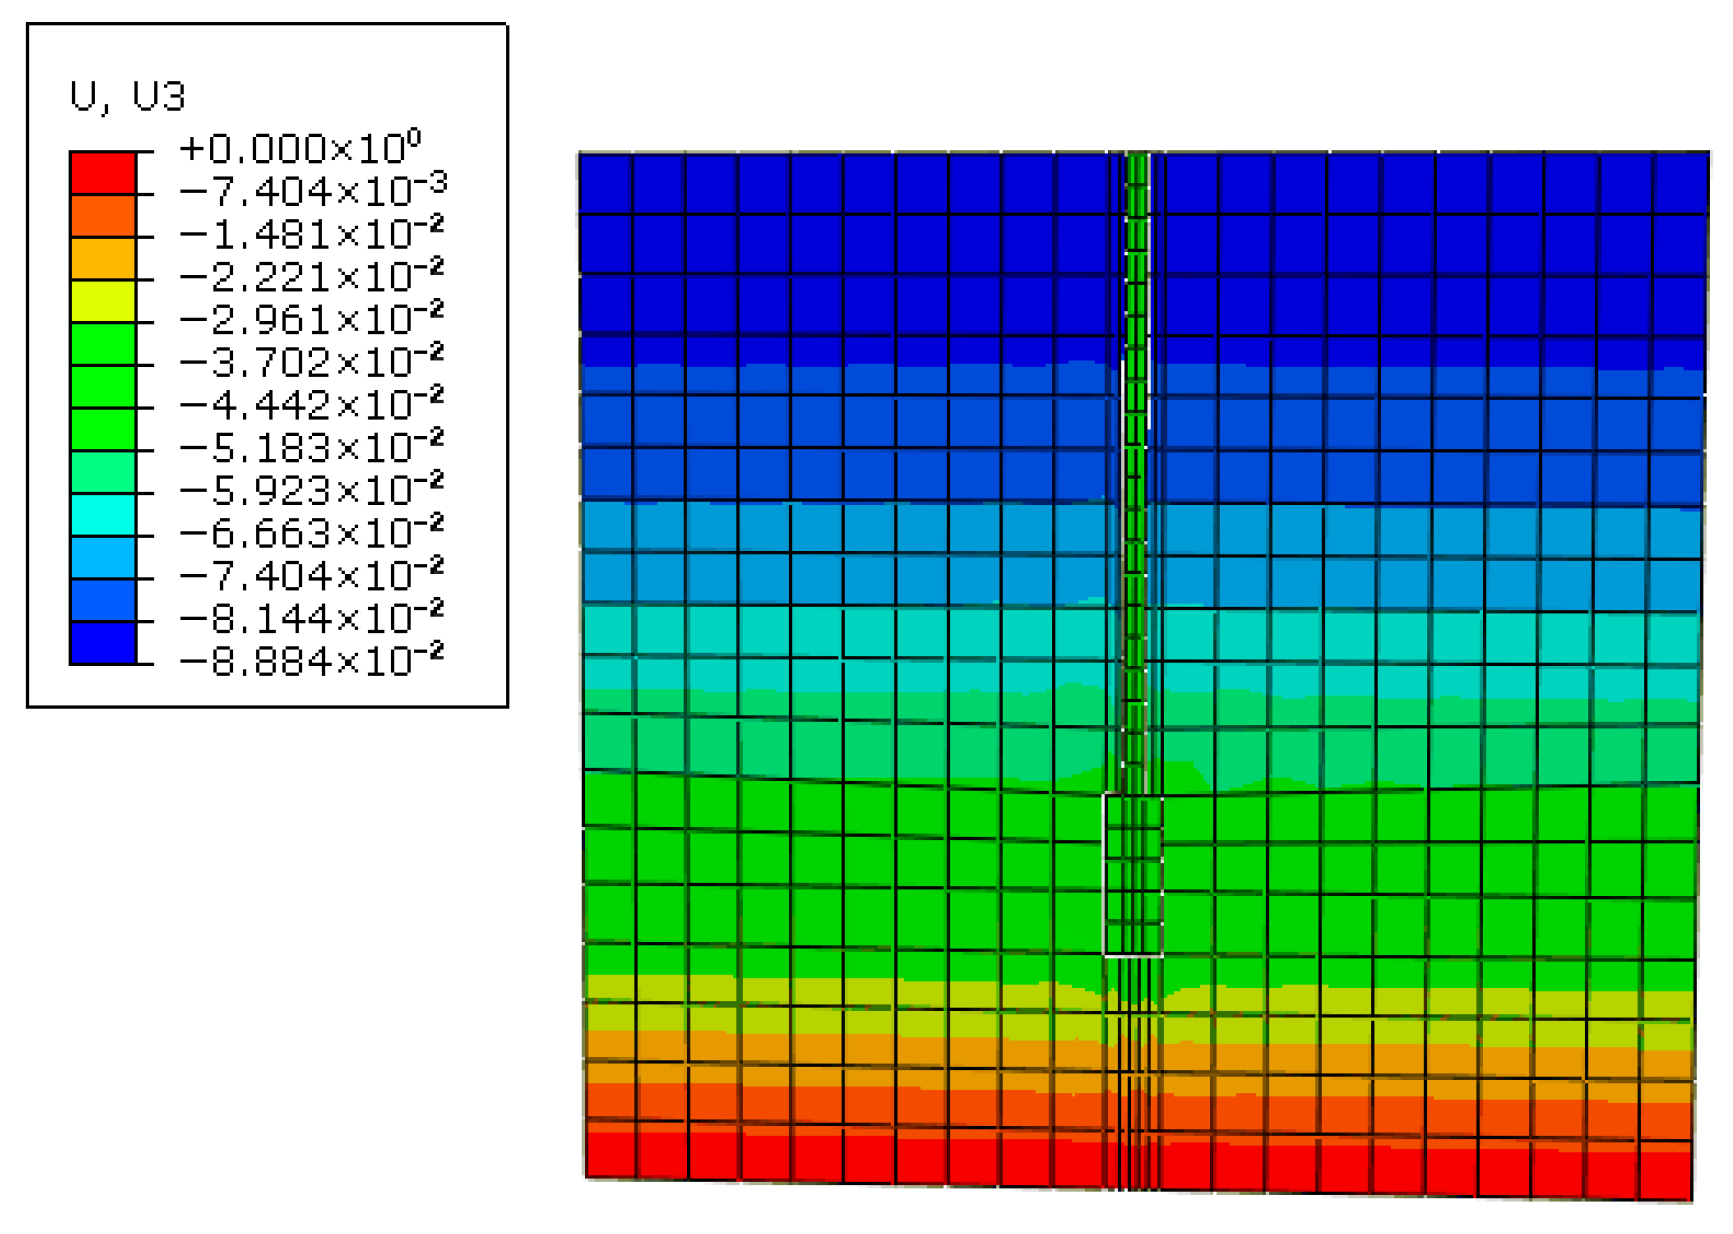
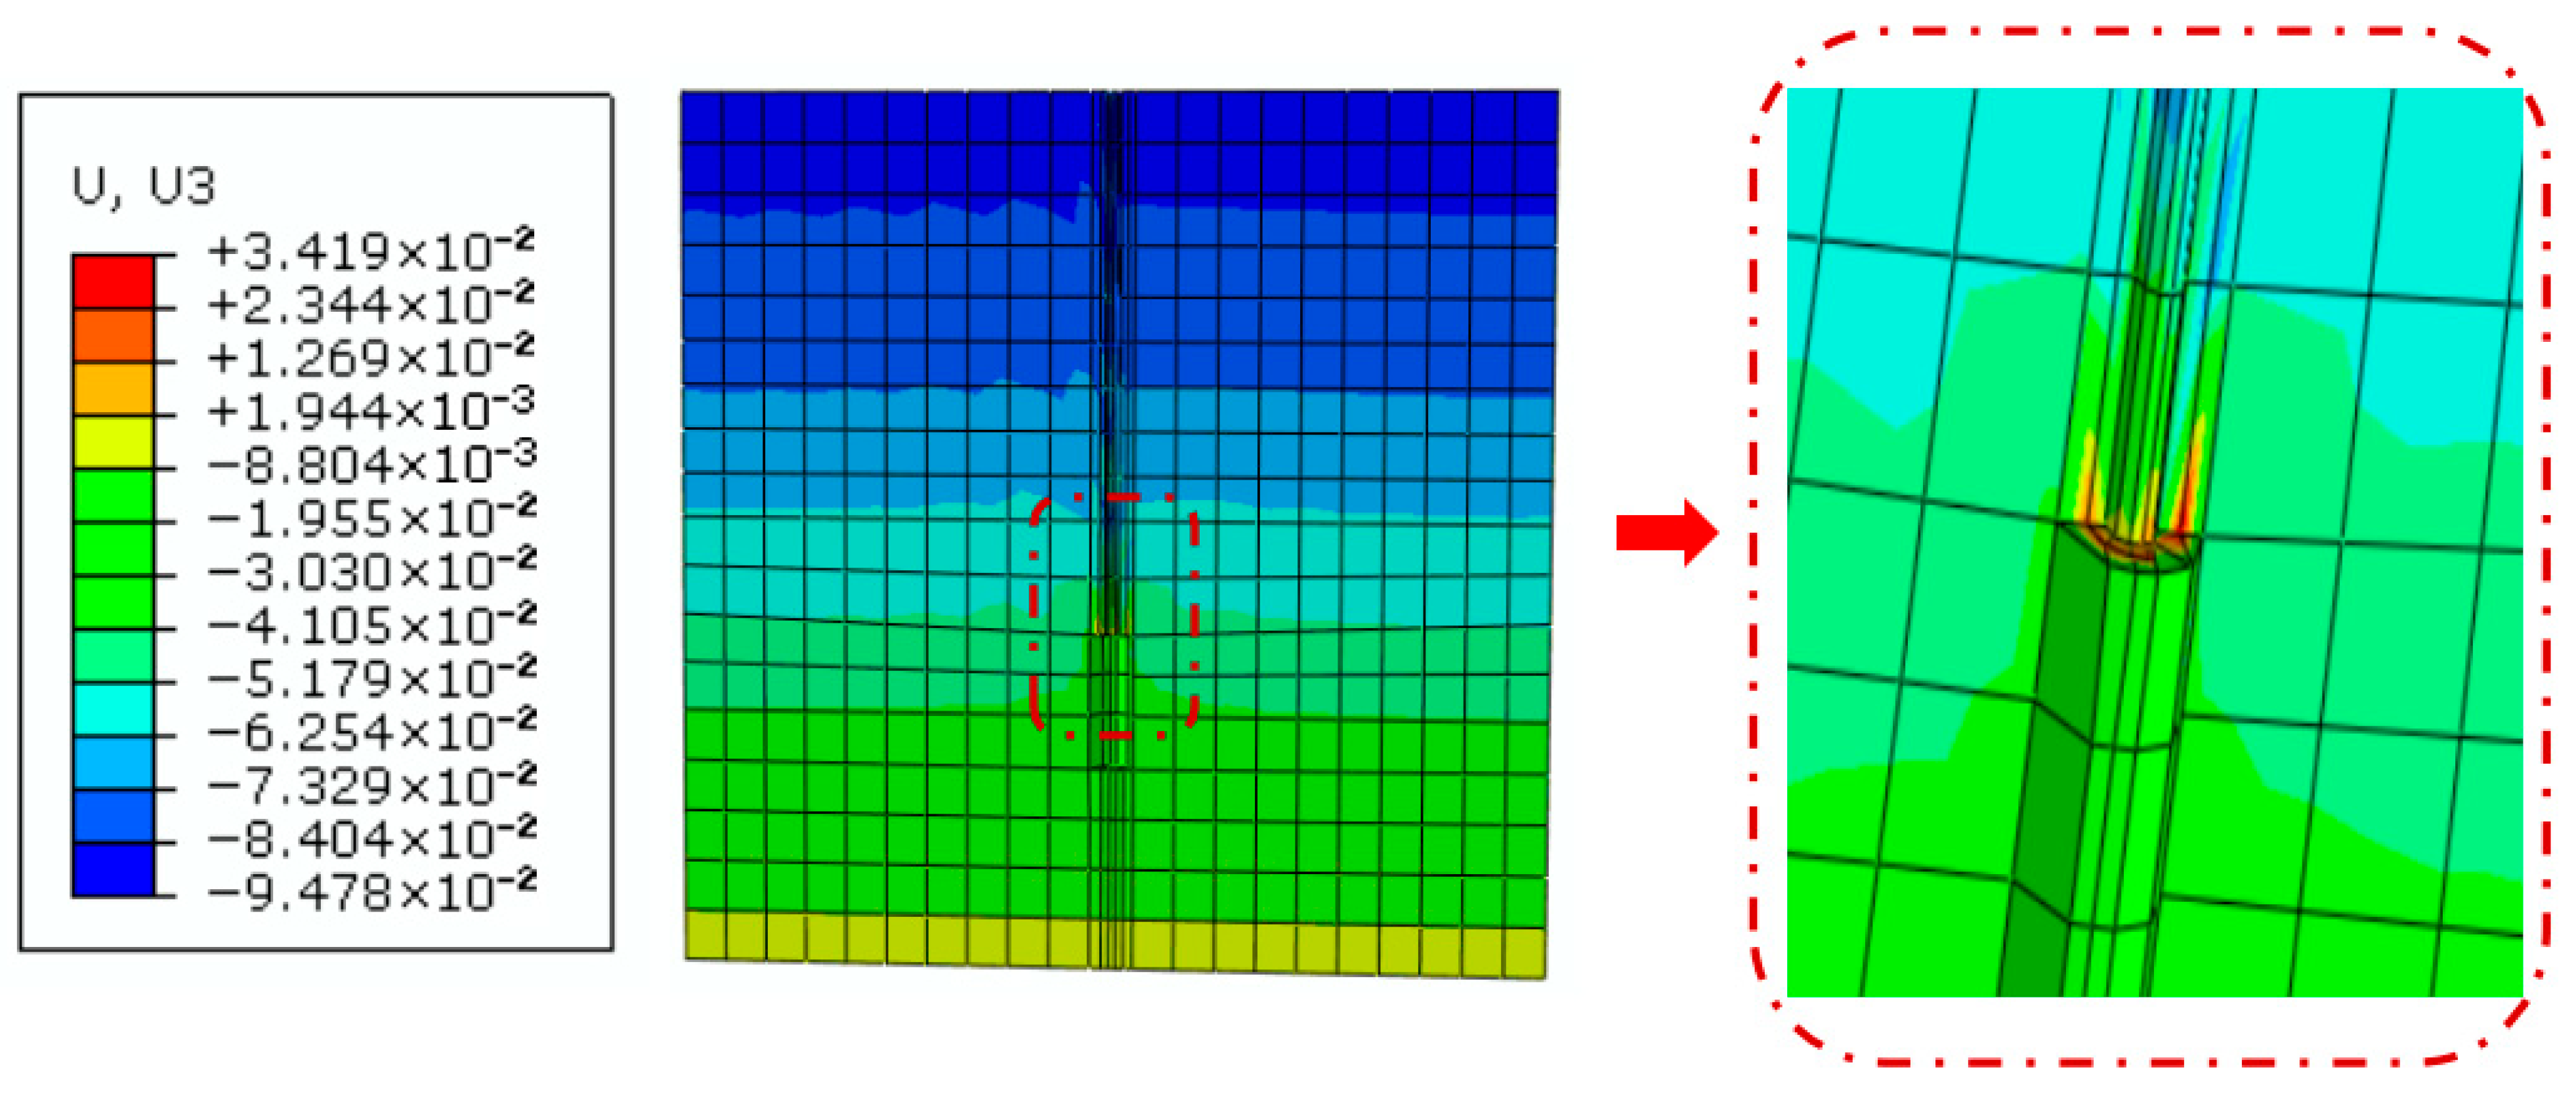
During the on-site test, when the expanded-body anchor rod was loaded with 1000 kN, the uplift displacement was 25.76 mm. In the numerical simulation, the uplift displacement was set to 25.76 mm, and the uplift force of the expanded-body anchor rod was 824 kN. The error between the numerical results and the on-site results was 17.6%. The discrepancies primarily arise from the following simplifications: (1) The Mohr–Coulomb constitutive model, although conventionally employed, is an ideal elasto-plastic formulation that inherently precludes the accurate representation of the nonlinear hardening/softening response and dilatancy evolution characteristic of natural soils. (2) While the soil profile is discretized into four silty clay strata, each layer is treated as spatially homogeneous, thereby neglecting intra-layer heterogeneity such as localized sand lenses, fissures, or spatial variability in strength and stiffness. (3) The simulation imposes an initial geostatic stress field without accounting for the transient stress–strain paths associated with the sequential construction phases of drilling, grouting, and tensioning, which can significantly perturb the in situ stress regime and alter the soil fabric. For an uplift displacement of the anchor rod of 25.76 mm, the soil displacement contour map is shown in Figure 11. The soil displacement shows a stratified decrease, gradually slowing down from top to bottom, with the displacement change ranging from 9.48 cm to 8.8 cm. The soil layer in contact with the end face of the expanded-body anchorage segment is uplifted, with the uplift range varying from 1.94 mm to 3.42 cm. This indicates that the end-bearing capacity of e the xpanded-body anchor rod plays a significant role in the anchoring process.

5. Analysis of Side Frictional Stress and End-Bearing Capacity

Once the failure pattern of the soil around the anchor at the ultimate state has been ascertained, this study proceeds to analyze the distribution of side friction and to calculate the end-bearing capacity on this basis. Based on the Mohr–Coulomb strength criterion and an associated flow rule, this paper presents an analytical model that describes the distribution of side frictional stress along the fixed length under interface plastic deformation. Subsequently, by elucidating the load transfer pattern associated with the local shear failure of the surrounding soil during the vertical pull-out of an underreamed anchor, an analytical formulation for the end-bearing capacity of the anchor is derived.

5.1. Analytical Model for Shaft Frictional Stress

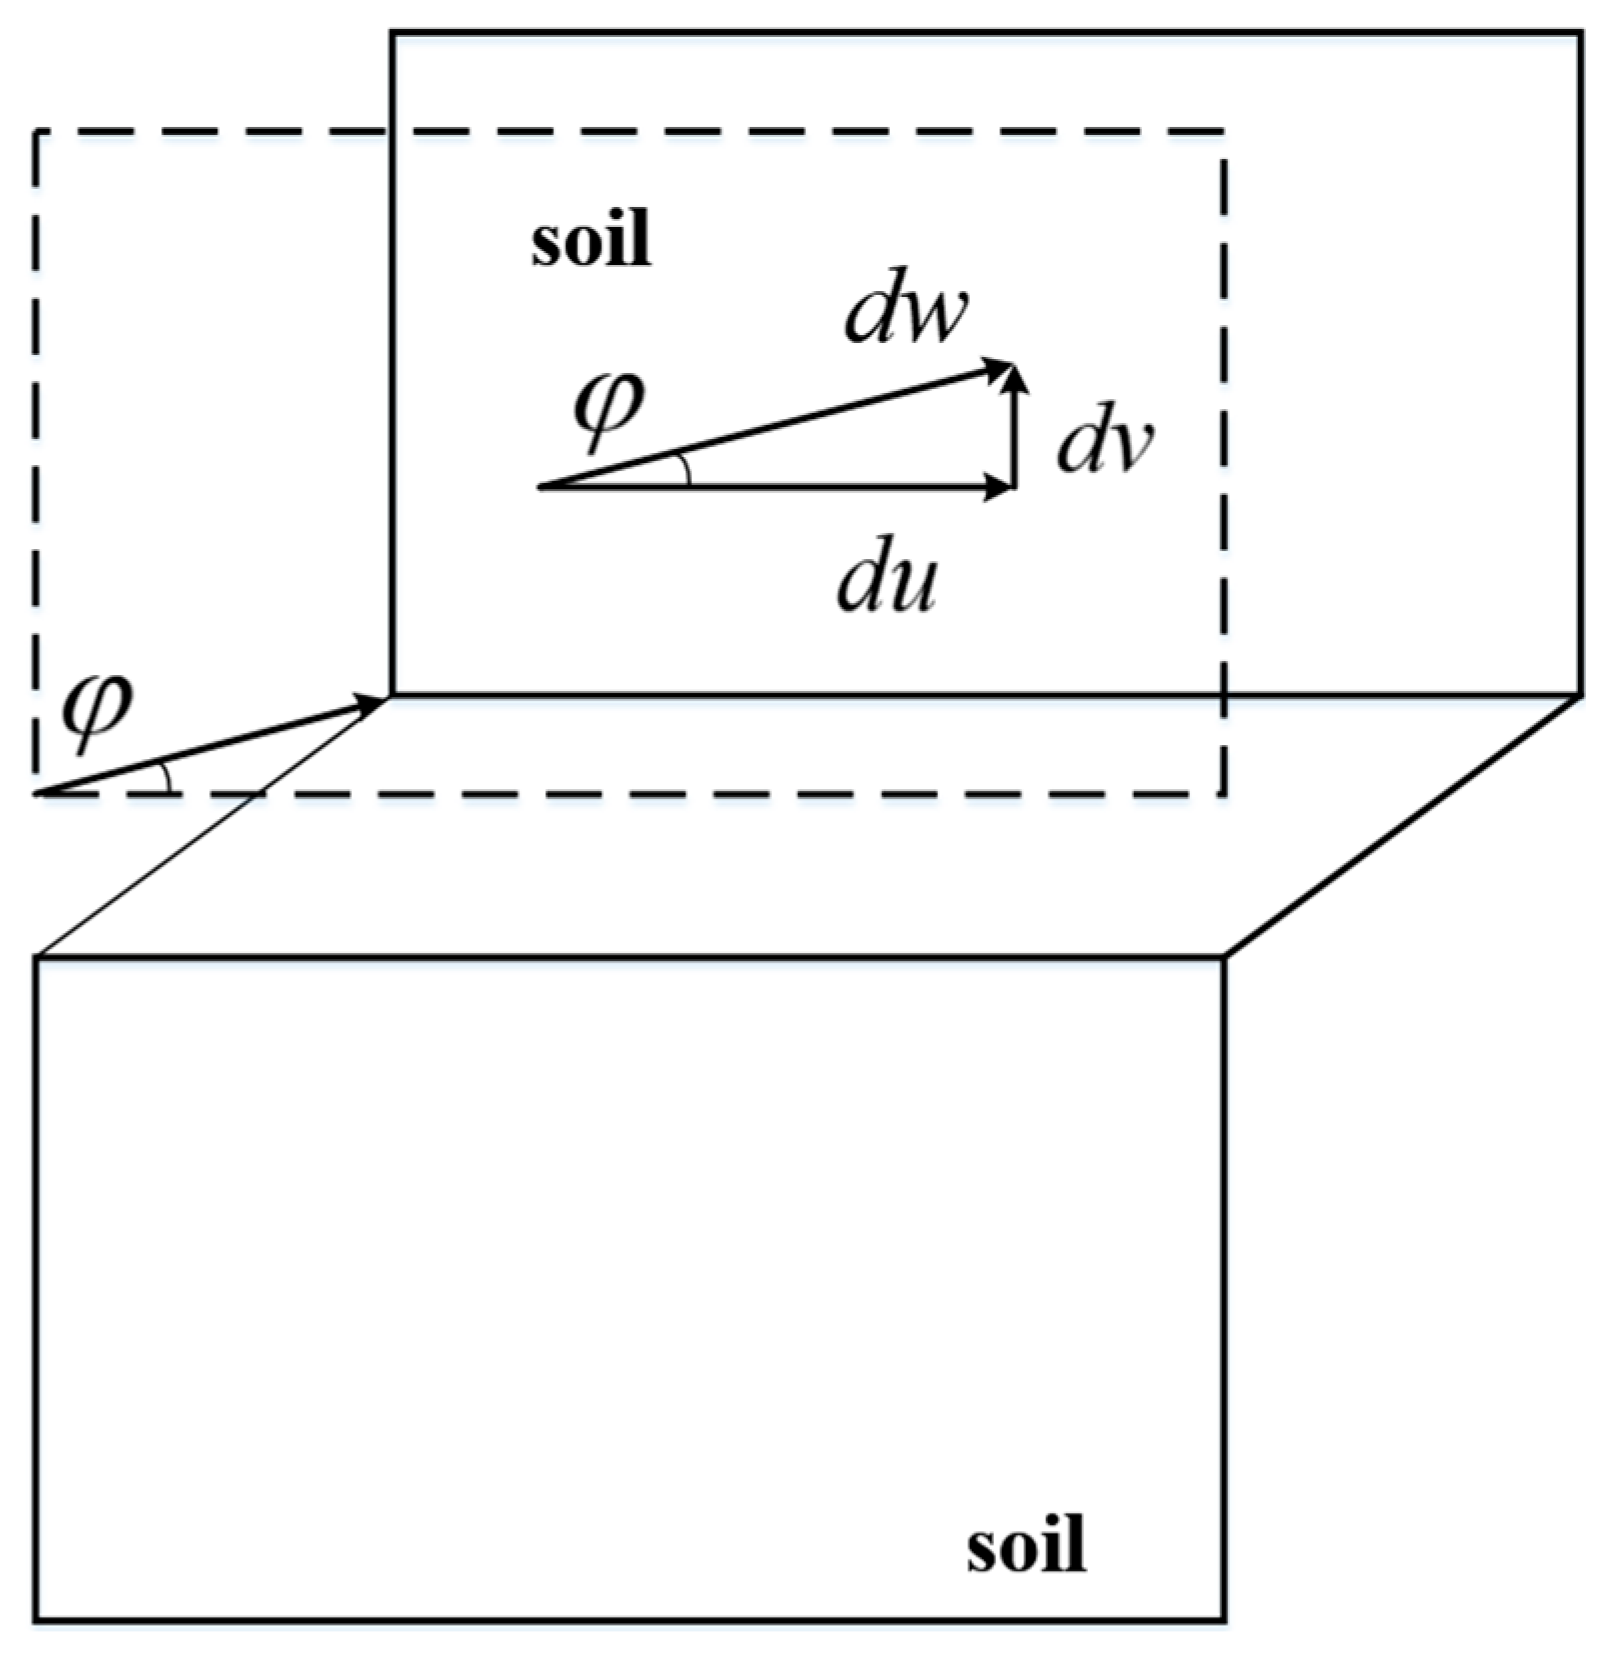
The plastic response of geomaterials is typically described by either an associated flow rule [22] or a non-associated flow rule [23]. Upon yielding, the medium dilates, its volume increases, and the upper and lower blocks separate. The angle between the resultant separation velocity dw and the horizontal velocity du is the soil’s internal friction angle φ, and dv is the vertical velocity, as illustrated in Figure 12.
Let ψ denote the dilatancy angle of the soil and η the corresponding dilatancy coefficient, whose admissible range is 0 < η < 1. When η = 1, the non-associated flow rule collapses to the associated flow rule. Owing to the practical difficulty in accurately determining η, the associated flow rule is adopted herein for the analysis of soil plasticity. On the basis of the associated flow rule in conjunction with the Mohr–Coulomb yield criterion, this section develops an analytical model that characterizes the axial distribution of the frictional shear stress along the soil–anchor interface of an underreamed bolt. The model elucidates the spatial evolution of this stress within the bonded length and furnishes a rigorous methodological basis for evaluating the shaft friction of underreamed anchors. The detailed derivation of the analytical model is presented below.
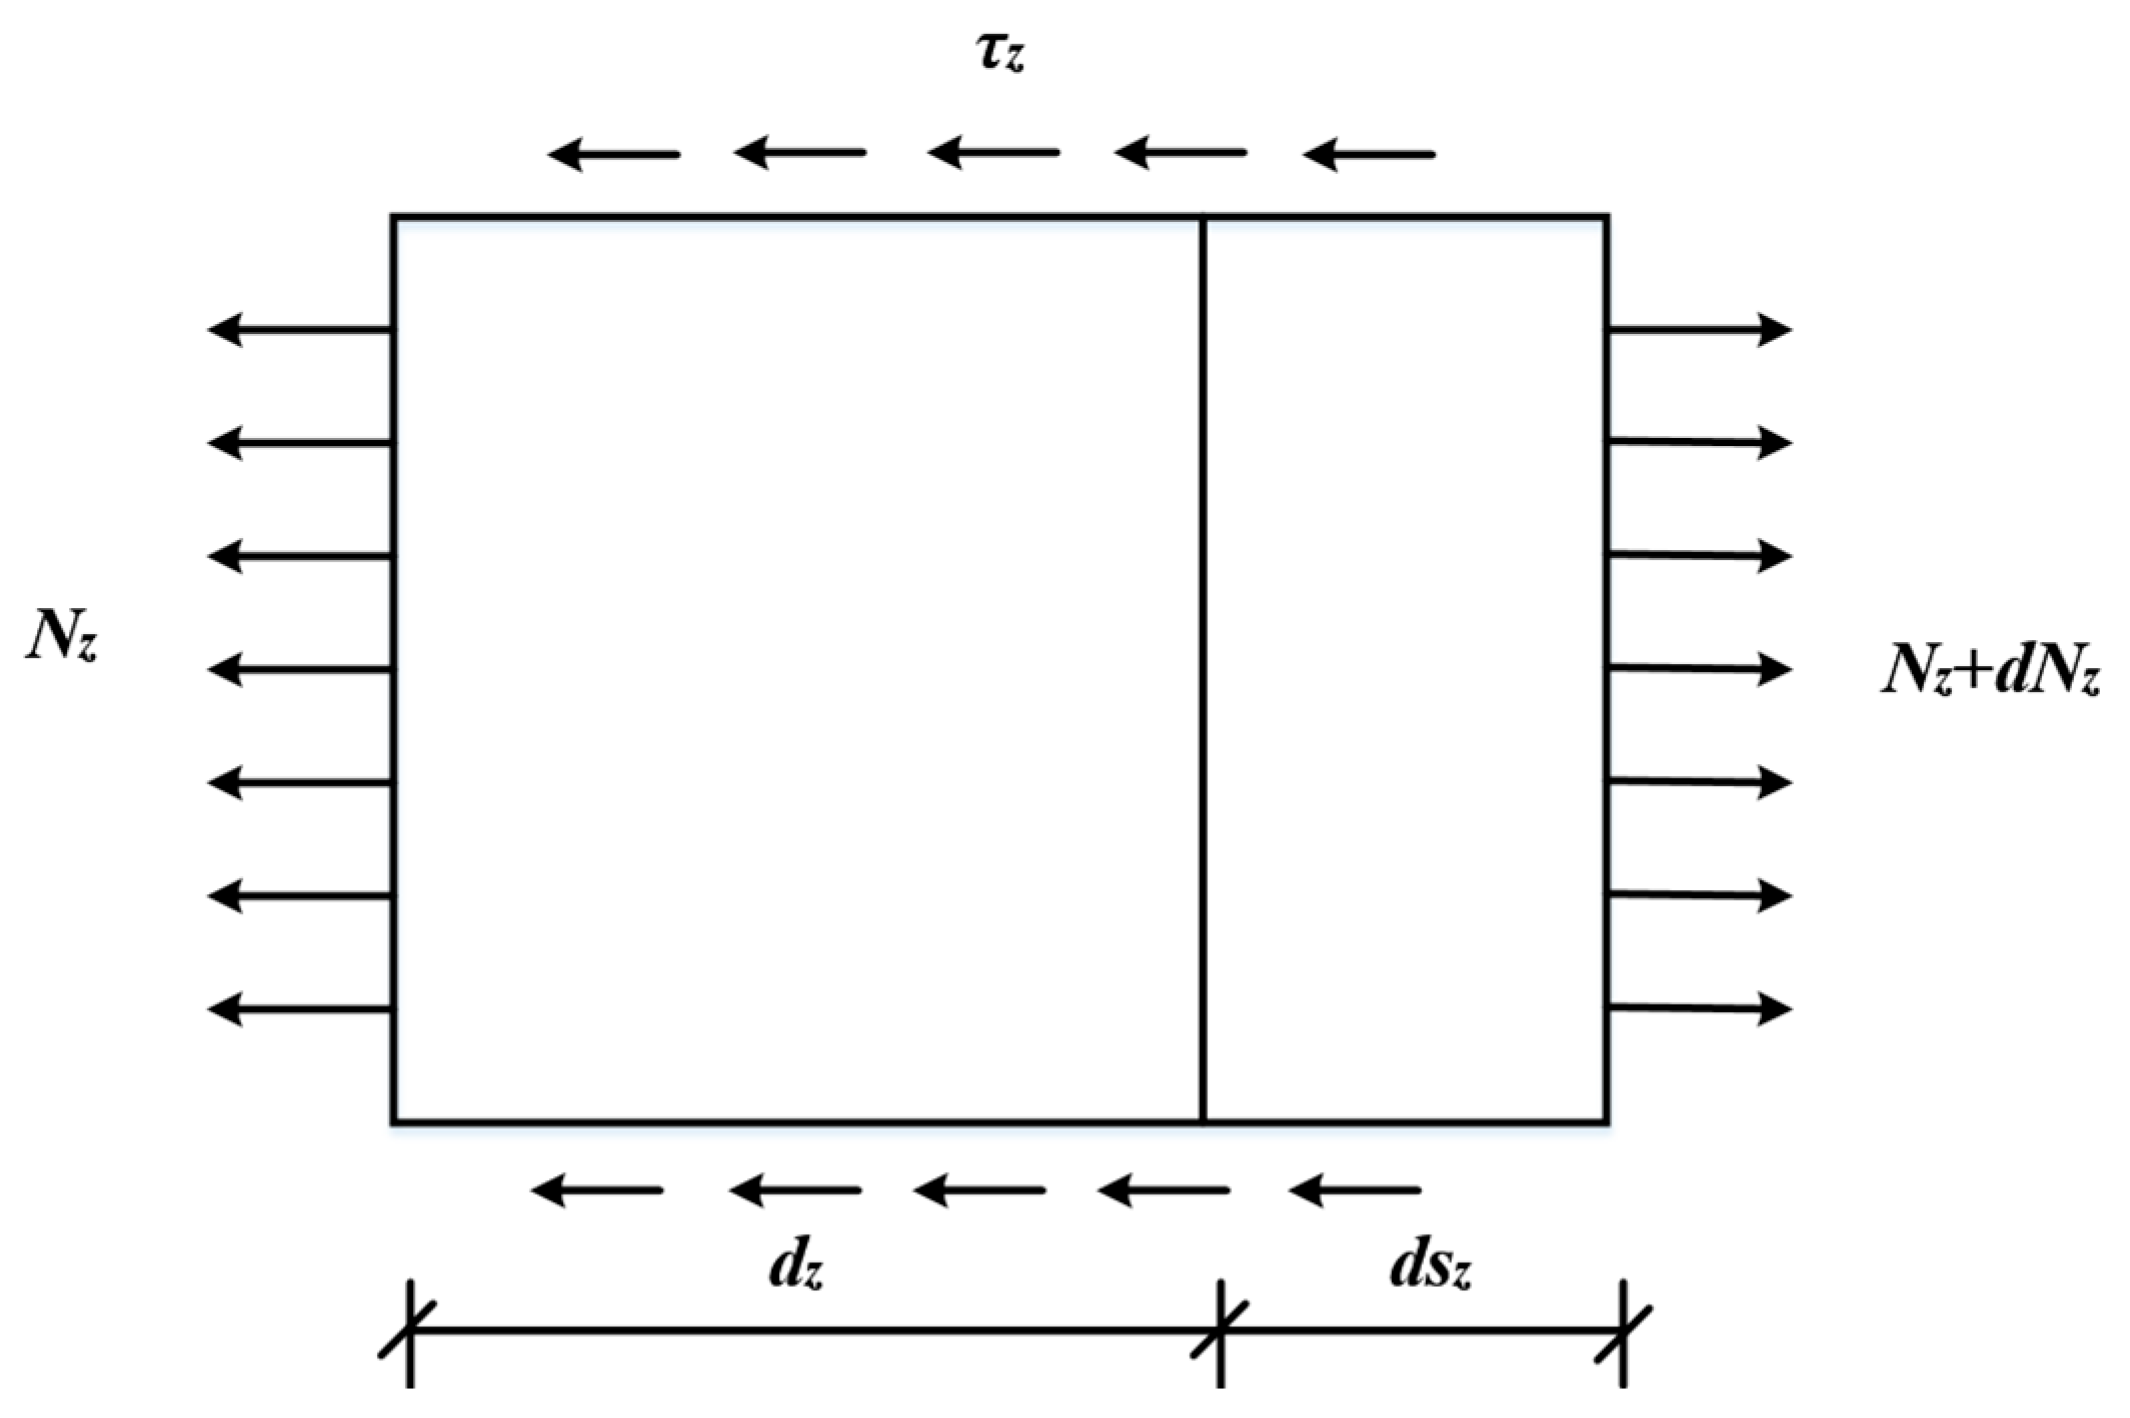
Assuming the bonded length of the anchor to be L and the pull-out load at the anchor head to be P, the calculation model is depicted in Figure 13. Consider an infinitesimal segment dz of the anchor body as the object of study; its schematic diagram is presented in Figure 14. The segment is primarily acted upon by the axial force N(z) and the interfacial shear stress τ(z). D is the diameter of the anchor bolt. Applying the equilibrium condition yields
N z + d N z N z + π D τ z d z = 0
At the cross-section located at the depth z, the constitutive relation yields
d s z = N z E A d z
where Sz denotes the axial displacement of the anchor body at section z; E denotes the effective elastic modulus of the anchor body, expressed as E = E g A g + E b A b A g + A b ; Eg and Eb represent the elastic moduli of the grout and the tendon, respectively; Ag and Ab denote the corresponding cross-sectional areas, and A is the cross-sectional area of the anchorage body, expressed as A = Ag + Ab.
When the anchor is subjected to the pull-out force P, the static equilibrium condition yields
P N z π D z L τ z d z = 0
In accordance with the deformation compatibility requirement u z = u g + s z , where in u g denotes the axial displacement of the grout, differentiation with respect to z yields
d u z d z = d s z d z = N z E A
Combining Equations (4)–(7) yields
d 2 u z d z 2 = π D E A τ z
Denoting the radius of the anchor body as R, one obtains
d 2 u z d z 2 2 E R τ z = 0
Assuming that the interface between the anchor body and the surrounding rock–soil mass possesses a finite thickness, upon the onset of plastic deformation within this interface, the response conforms to the Mohr–Coulomb strength criterion
τ z = c σ n tan φ
in which c denotes the cohesion of the soil, φ its angle of internal friction, and σn the normal stress acting on the interface.
Let the potential function F for the interface layer be defined as
F = τ z c + σ n tan φ = 0
Applying the associated flow rule, one obtains
d ε p = d λ F σ n = d λ tan φ d γ P = d λ F τ = d λ
where ε P denotes the radial plastic linear strain, γ P the plastic shear strain, and λ an undetermined plastic multiplier.
From Equation (12) it follows that
d ε P d γ P = tan φ
Integrating both sides of Equation (13) and invoking the condition that all plastic strain components vanish at the onset of yielding, one obtains
ε P γ P = tan φ
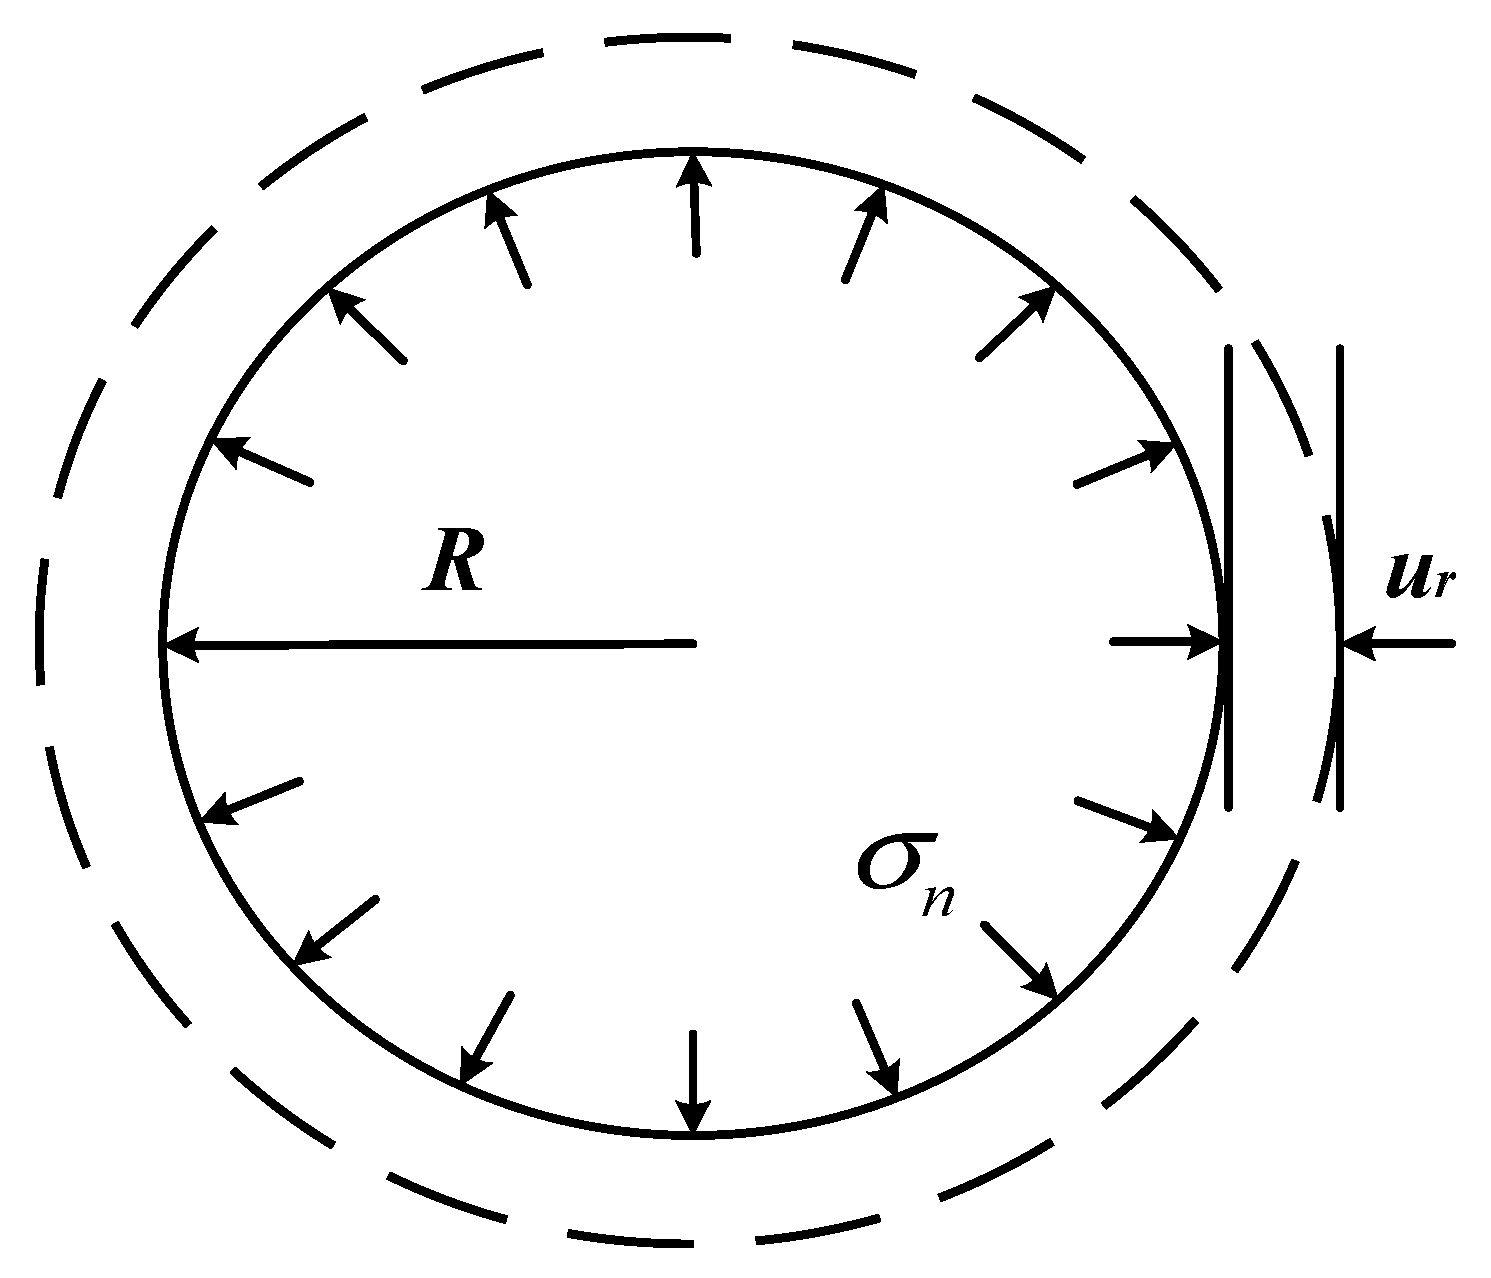
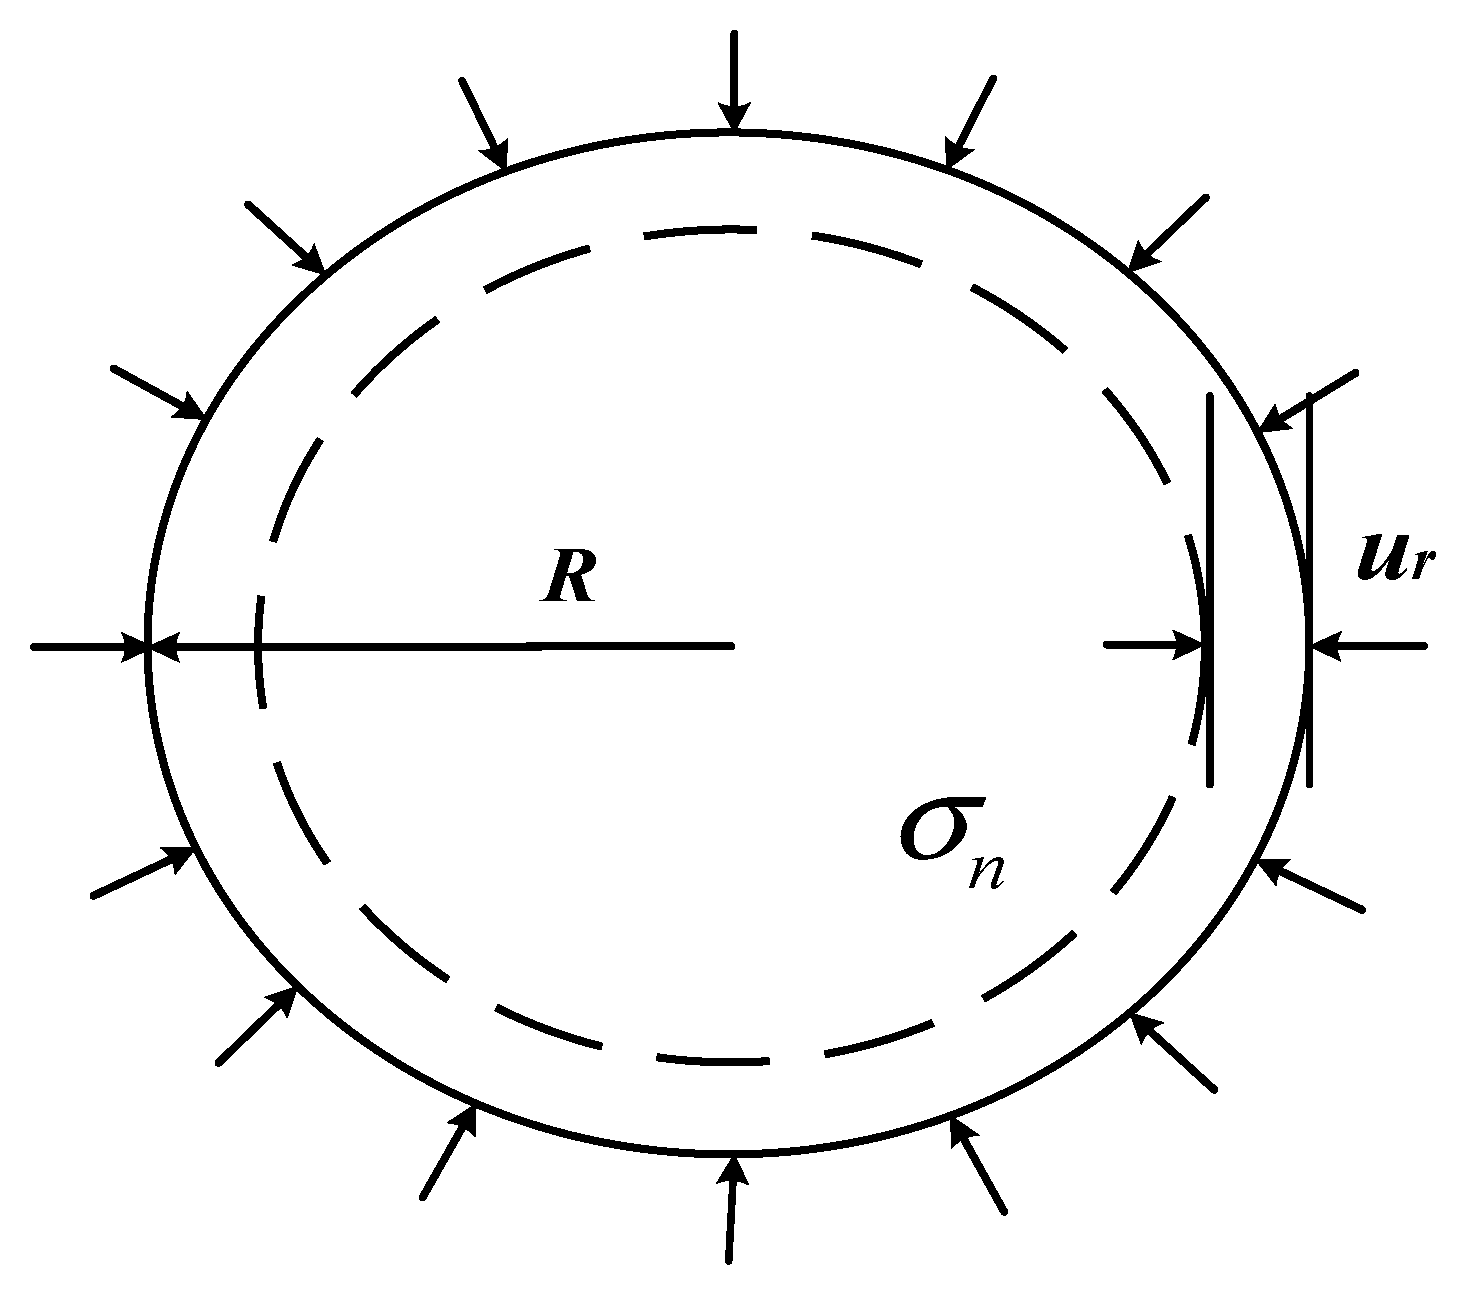
Assuming that the weak plane coincides with the rock soil–anchor interface, the radial deformations of the surrounding rock soil mass and of the anchor body are illustrated in Figure 15 and Figure 16, respectively.
ε P = u r R γ P = u z R
In the above expression, ur denotes the radial displacement of the interface layer and uz denotes its axial displacement. R is the radius of the anchorage body. The radial displacement of the interface layer ur is composed of the radial deformations undergone by the surrounding rock/soil mass and by the anchor body under the action of radial stress σn. Specifically, under radial stress σn the rock soil mass undergoes radial deformation manifested as settlement, whereas the grout experiences radial deformation manifested as dilation.
Combining Equation (14) with Equation (15) yields
u r = tan φ u z
Assuming that the radial deformation of the rock soil mass obeys the Winkler hypothesis and that the radial deformation of the anchor body satisfies Hooke’s law, the relationship between radial stress σn and radial displacement ur can be expressed as
σ n = k u r
The minus sign denotes compression, and k is the reaction modulus. It can be estimated by superposing the elastic solution for an internally pressurized circular cavity in an infinite plane under plane-strain conditions with the deformation of a cylinder under uniform lateral pressure [24].
1 k = 1 k 1 + 1 k 2 k 1 = E 1 + μ R k 2 = E 1 μ R
where k1 and k2 denote the reaction modulus of the rock soil mass and the anchor body, respectively. E’ and μ’ denote the elastic modulus and Poisson’s ratio of the rock soil mass, respectively; E and μ denote the corresponding elastic modulus and Poisson’s ratio of the anchor body, respectively.
Combining Equations (16) and (17) yields
σ n = k tan φ u z
Substituting Equation (19) into Equation (10) yields
τ z = c + k u z tan 2 φ
Combining Equations (9) and (20) yields the second-order linear non-homogeneous ordinary differential equation in displacement as follows:
d 2 u z d z 2 2 k E R tan 2 φ u z = 2 c E R
The solution to this equation is
u z = c 1 e t z + c 2 e t z c k tan 2 φ t = 2 k E R tan φ
where t denotes a constant. Substituting Equation (22) into Equation (9), the interfacial shear stress τ(z) is obtained as
τ z = E R 2 c 1 t 2 e t z + c 2 t 2 e t z
where c1 and c2 denote constants. From Equation (4), one obtains
τ z = 1 π D d N z d z
Substituting Equation (23) into Equation (24) and integrating, the expression for the axial force N(z) is obtained as
0 N z d N z = 0 z E π R 2 c 1 t 2 e t z + c 2 t 2 e t z d z
That is
N z = E π R 2 t c 1 e t z 1 c 2 e t z 1
The constants c1 and c2 appearing in Equations (23) and (26) are determined from the boundary conditions as follows:
  • When z = L, the axial force satisfies Nz = P. Substituting this condition into the expression for the axial force, Equation (26), yields
P = E π R 2 t c 1 e t L 1 c 2 e t L 1
2.
When z = L, τ(L) = 0, substituting this condition into the expression for the interfacial shear stress, Equation (24), yields
0 = E R 2 c 1 t 2 e t L + c 2 t 2 e t L
The integration constants c1 and c2 are thus obtained as
c 1 = P π E R 2 t e t L 1 2 c 2 = P e 2 t L π E R 2 t e t L 1 2

5.2. Numerical Verification of the Analytical Model for Interfacial Shear Stress

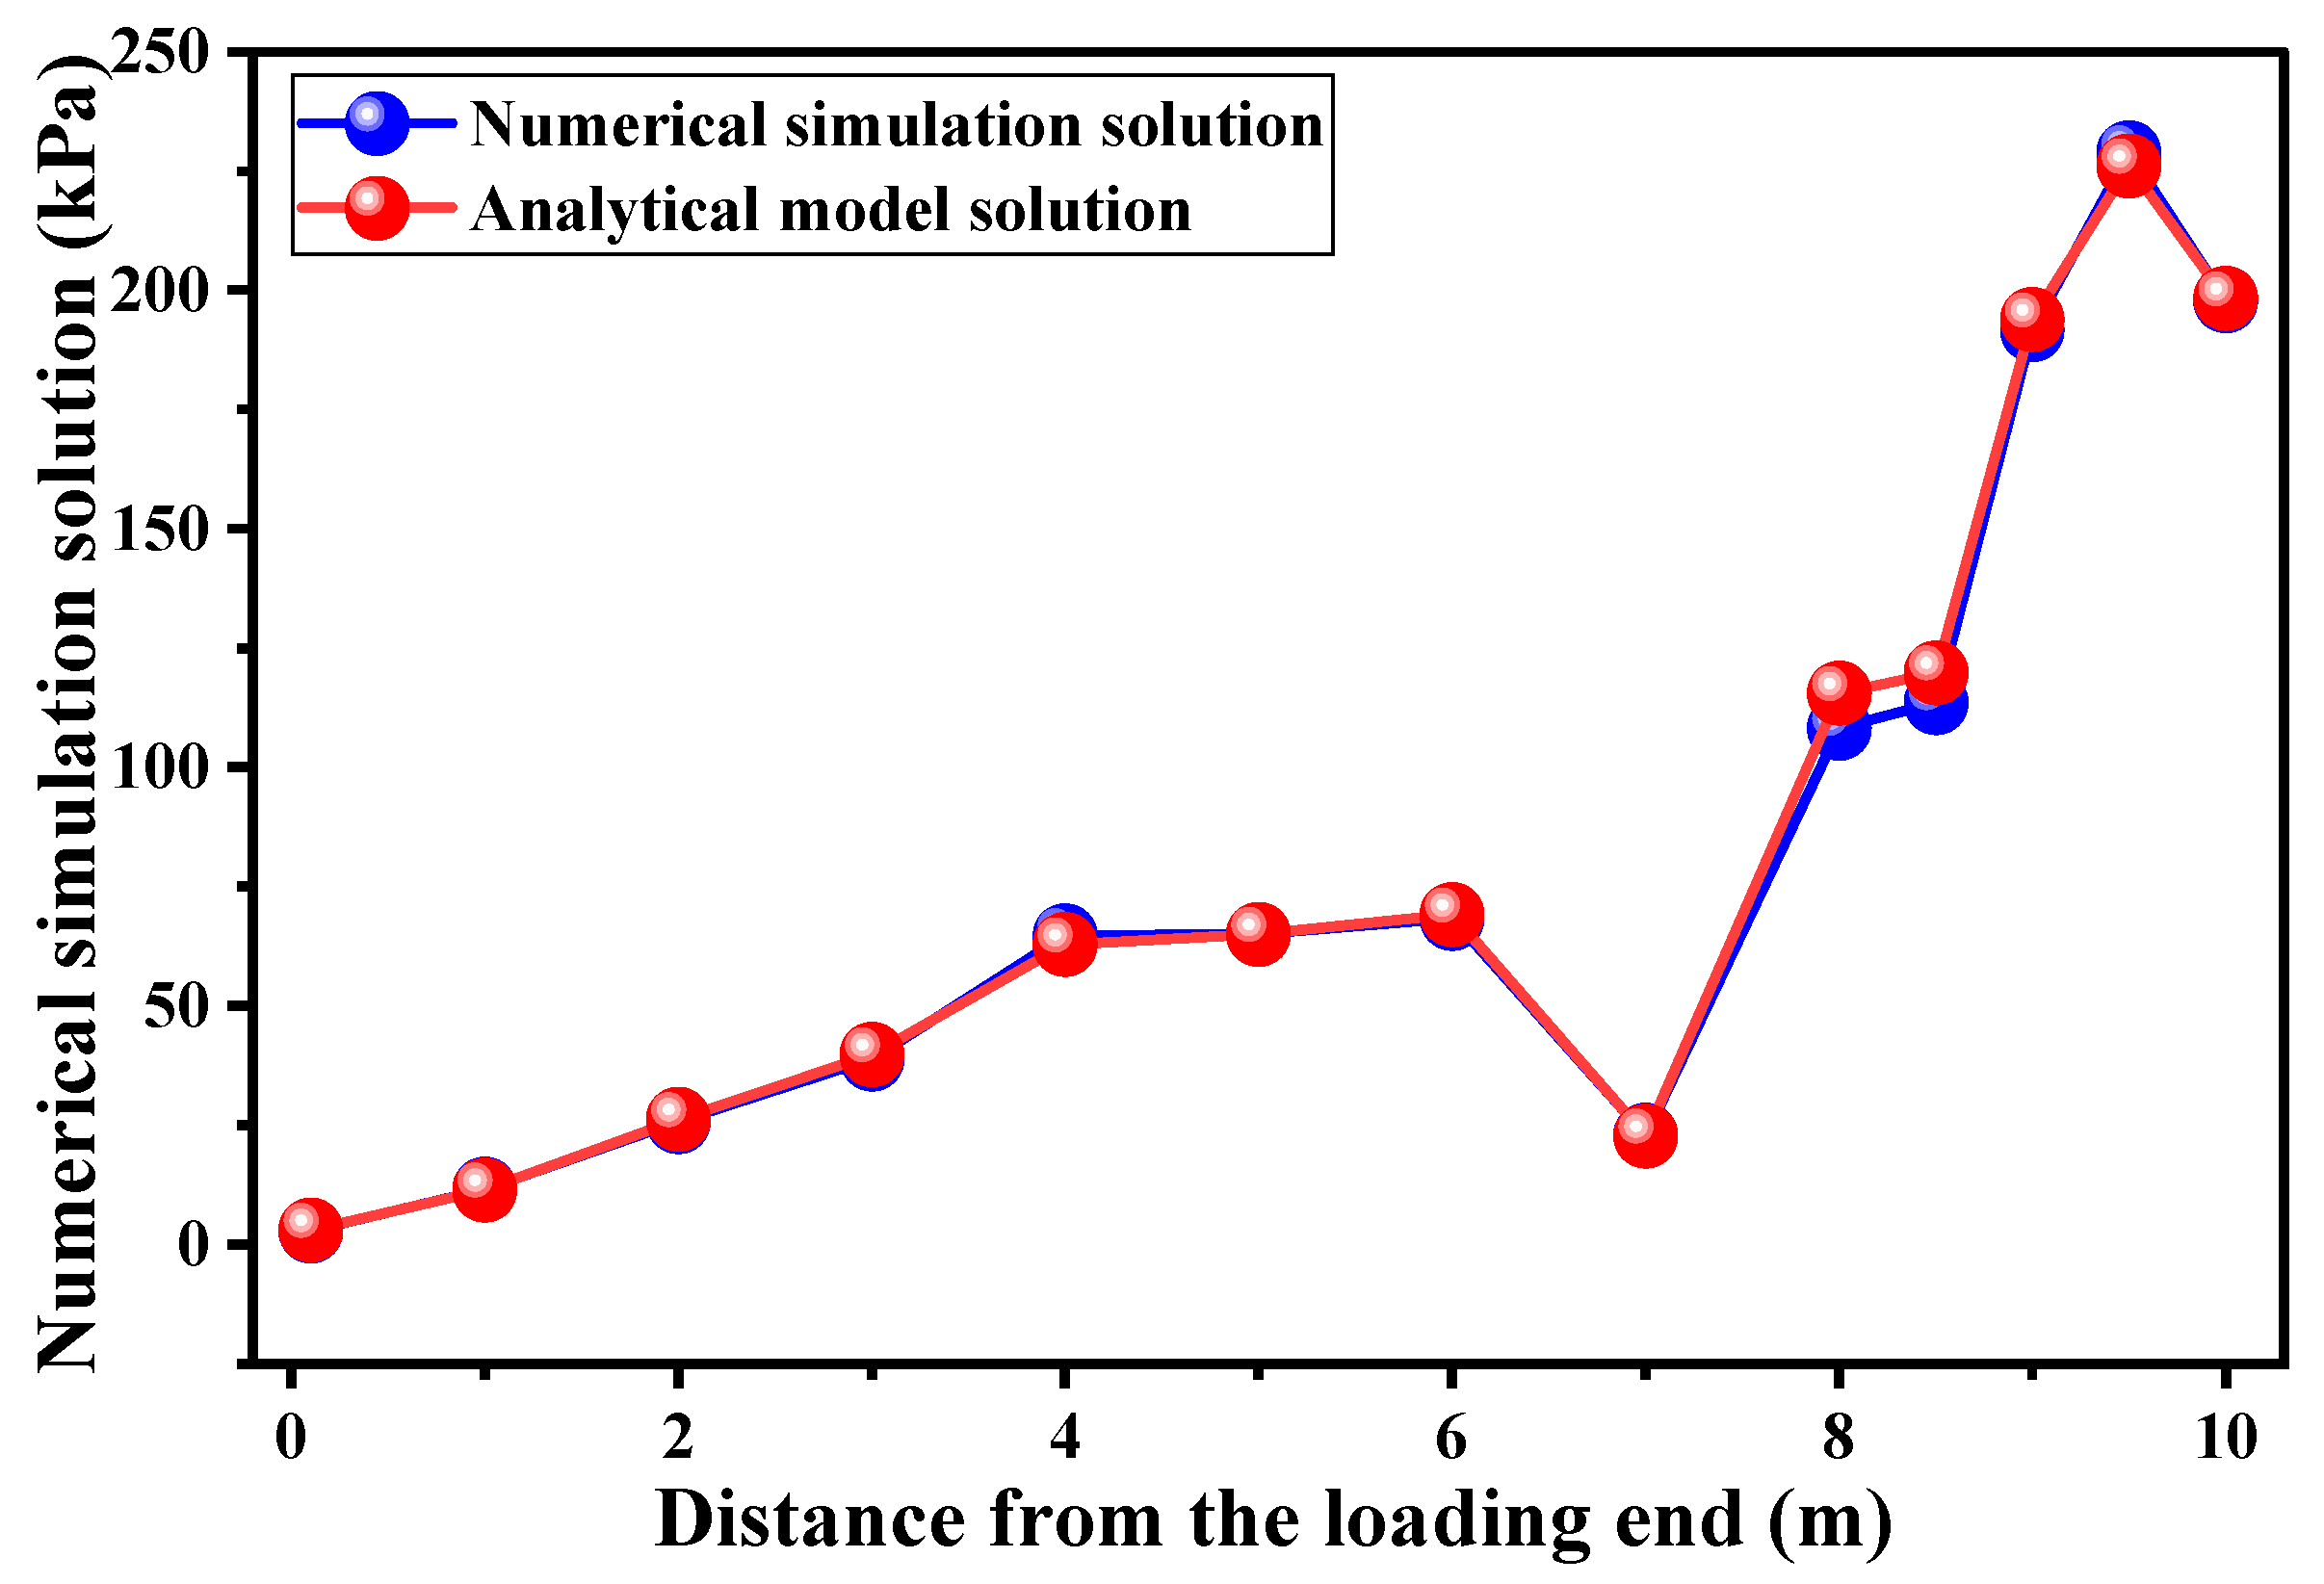
Drawing upon the numerical model developed in Section 4, the interfacial shear stresses are extracted along the contact surface of the underreamed anchor by interrogating the element faces, as illustrated in Figure 17. At an applied load of 824 kN, the theoretical shear stress profile predicted by Equation (23) is evaluated at various depths below the loading end. Both the analytical and numerical results are plotted in Figure 18. A point-wise comparison yields relative errors ranging from 0.02% to 6.29%. Therefore, the proposed analytical model for side frictional stress rationally and reliably captures its distribution along the anchorage segment.

5.3. Analytical Model for End-Bearing Capacity

As established in Section 4.4, when the surrounding soil undergoes localized shear failure, the deformation of the soil particles is confined to the stratum beneath the anchor head, with the failure surface approximating an ellipsoidal geometry. Taking the soil mass within this ellipsoidal deformation zone as the object of study, the following assumptions are proposed on the basis of soil mechanics theory:
  • The tangent at the outer crown of the ellipsoidal deformation zone to the enlarged anchor head subtends an angle θ with the horizontal plane.
  • The ratio of semi-major axis b to semi-minor axis a of the ellipsoidal deformation zone is t.
  • The soil mass within the ellipsoidal deformation zone is an axisymmetric model with the longitudinal axis of the underreamed anchor serving as the axis of symmetry.
With the coordinate origin located at the centroid of the ellipsoidal deformation zone, the x-axis oriented horizontally, and the z-axis oriented vertically, a Cartesian coordinate system is established and shown in Figure 19a, where r denotes the radius of the non-enlarged bonded length. A force analysis is conducted on the soil mass enclosed by the ellipsoidal deformation zone. The soil within this zone is subjected to the overburden pressure from the overlying strata, the lateral earth pressures, its own self-weight, the shear tractions exerted by the surrounding soil, and the end-bearing resistance transmitted from the enlarged anchor bulb. Owing to the axisymmetry of the ellipsoidal deformation zone, the lateral earth pressures in the horizontal direction mutually cancel out. Differential free-body diagrams for the upper and lower hemispheroids are illustrated in Figure 19b,c, respectively.
According to the geometric boundary condition of the ellipsoidal deformation zone of the surrounding soil at the crown of the enlarged head, the ellipse is described by
x 2 a 2 + z 2 b 2 = 1
z x = R = tan θ
b = a t
The slope of the enlarged head crown surface is
z = b 2 x a 2 z
z x = R = b 1 R 2 a 2
where
  • R—the radius of the enlarged anchor bulb;
  • t—the ratio of the ellipse’s semi-major to semi-minor axis;
  • θ—the inclination of the tangent to the ellipse at the crown of the enlarged head with respect to the horizontal;
  • a—the semi-major axis of the ellipse;
  • b—the semi-minor axis of the ellipse.
Substituting Equations (32)–(34) into Equation (31), the semi-major axis b and semi-minor axis a of the ellipsoidal deformation zone within the surrounding soil are obtained as
a = R t 2 tan 2 θ + 1
b = R t t 2 tan 2 θ + 1
From the geometric relations, the height of the ellipsoidal deformation zone h0 in the surrounding soil is
h 0 = R t t tan θ + t 2 tan 2 θ + 1
The maximum width of ellipsoidal deformation zone D0 in the surrounding soil is
D 0 = 2 R t 2 tan 2 θ + 1
As illustrated in Figure 19b, the normal stress acting on the outer surface of the infinitesimal upper ellipsoid element is
σ = Δ G cos β + K Δ G sin β
Δ G = ρ g H b 1 R 2 b 2 z Δ z 2
In the formula, K denotes the coefficient of the lateral earth pressure of the soil surrounding the anchor; β represents the inclination angle between the upper elliptical micro-element surface and the horizontal plane; ΔG signifies the overburden pressure acting on the micro-element surface; ρ is the density of the soil surrounding the anchor; g represents the acceleration due to gravity; and H is the embedment depth of the underreamed anchorage segment.
When the soil surrounding the anchor reaches a state of limit equilibrium, the relationship between the shear stress τ and the normal stress σ can be derived from the Mohr–Coulomb failure criterion as follows:
τ = σ tan φ + c
where
  • τ—the shear stress acting on the micro-element;
  • φ—the internal friction angle of the foundation soil;
  • c—the cohesion of the soil surrounding the anchor.
Therefore, the resultant vertical component of the shear force Tu within the upper ellipsoidal deformation zone of the soil surrounding the anchor is expressed as
T u = τ sin β Δ z 2 π ( x + Δ x )
Substituting Equations (35), (36) and (39)–(41) into Equation (42) yields Tu
T u = 0 b ρ g tan φ H b 1 R 2 a 2 z Λ z 2 cos β + K sin β + c 2 π x + Δ x 2 Δ z sin β
The above expression (46) is evaluated by invoking the parametric representation of an ellipse as follows:
x = a cos α
z = b sin α
Substituting Equations (44) and (45) into Equation (43) and neglecting higher order infinitesimals gives
T u = 2 π ρ g a b 2 tan φ H b 1 R 2 a 2 0 2 π K t sin α cos α sin 2 α + t 2 cos 2 α cos 2 α d α 2 π ρ g a b 3 tan φ 0 2 π K t sin α cos α sin 2 α + t 2 cos 2 α sin α cos 2 α d α 2 π ρ g a b 2 c tan φ 0 2 π cos 3 α sin 2 α + t 2 cos 2 α d α
Owing to the absence of a closed-form solution, Equation (46) is analytically intractable and therefore unsuitable for practical application. Consequently, after an appropriate simplification of Equation (46), it is observed that both integral terms contain a common factor
1 sin 2 α + t 2 cos 2 α
Reducing expression (47) yields
1 t 2 sin 2 α + t 2 cos 2 α = 1 t
Magnifying expression (47) gives
1 sin 2 α + cos 2 α = 1
Expressions (48) and (49) differ by a factor of t, indicating that the deviation between the original and simplified values does not exceed this factor. Design code stipulates that the design value of the ultimate bearing capacity of underreamed anchors is 95% of the failure load obtained from field tests. To guarantee the safety of the anchor application, the following principle is adopted herein: when evaluating Equation (46), the result obtained from the reduced expression (48) is lower than the exact value, whereas the result from the magnified expression (49) is higher. Consequently, to ensure engineering safety, the outcome derived from the reduced expression (48) is taken as a conservative substitute for the exact solution. The resultant vertical component of the shear force within the upper ellipsoidal deformation zone of the surrounding soil after simplification is expressed as
T u = π ρ g a 2 b tan φ 1 2 H b 1 R 2 a 2 K π 1 t 2 3 b K
The force analysis for the lower semi-ellipsoidal deformation zone of the soil surrounding the anchor is illustrated in Figure 19c. By applying the same computational approach, the resultant vertical component of the shear force Td within this lower zone is obtained as
T d = 2 π a b 0 π 2 K ρ g H b 1 R 2 a 2 t 2 cos 4 α sin 2 α + t 2 cos 2 α tan φ K b ρ g t 2 sin α cos 4 α sin 2 α + t 2 cos 2 α tan φ + c t cos 3 α sin 2 α + t 2 cos 2 α d α
Likewise, to ensure engineering safety, Equation (51) is simplified by adopting the reduced form (48), yielding
T d = π 2 a b K ρ g H b 1 R 2 a 2 tan φ 2 5 π a b 2 K ρ g tan φ + 4 3 π a b c
Consequently, the total vertical resultant of the shear forces T exerted by the anchor-surrounding soil on the elliptical deformation zone is expressed as
T = T u + T d = π 2 a b ρ g tan φ H b 1 R 2 a 2 K + a K π 1 t π a b 2 K ρ g tan φ 2 5 + 2 3 a + 4 3 π a b c
Given that the derived end-bearing capacity formulation is founded on a local shear failure mechanism, the ellipsoidal deformation zone associated with this mode develops entirely within the soil mass. As the applied load increases, the dimensions of this deformation zone expand progressively, thereby compressing the surrounding soil. Consequently, the coefficient of the lateral earth pressure K adopted in the proposed end-bearing capacity equation corresponds to the passive earth pressure coefficient.
The gravitational force of the overlying soil acting on the ellipsoidal deformation zone around the anchor is expressed as
G = π 4 D 0 2 ρ g H
where
  • D0—the maximum width of the elliptical deformation zone of the surrounding soil around the anchor.
  • H—the embedment depth of the underreamed anchor.
Accordingly, the end resistance of the underreamed anchor is, in magnitude, equivalent to the algebraic sum of the vertical resultant of the shear stresses mobilized by the surrounding soil along the elliptical deformation zone T and the gravitational force of the overlying soil column G.
Q e = G + T = π a 2 γ H + π 2 a b ρ g tan φ H b 1 R 2 a 2 K + a K π 1 t π a b 2 K ρ g tan φ 2 5 + 2 3 a + 4 3 π a b c
where
  • γ —the unit weight of the overlying soil;
  • φ —the internal friction angle of the soil surrounding the anchor;
  • D —the diameter of the underreamed anchorage segment;
  • H —the embedment depth of the underreamed anchor;
  • K —the coefficient of lateral earth pressure of the soil surrounding the anchor.
When the embedment depth of the underreamed anchor lies below the groundwater table, the buoyant unit weight may be substituted into Equation (55) for computation.

5.4. Numerical Validation of the End-Bearing Capacity Analytical Model

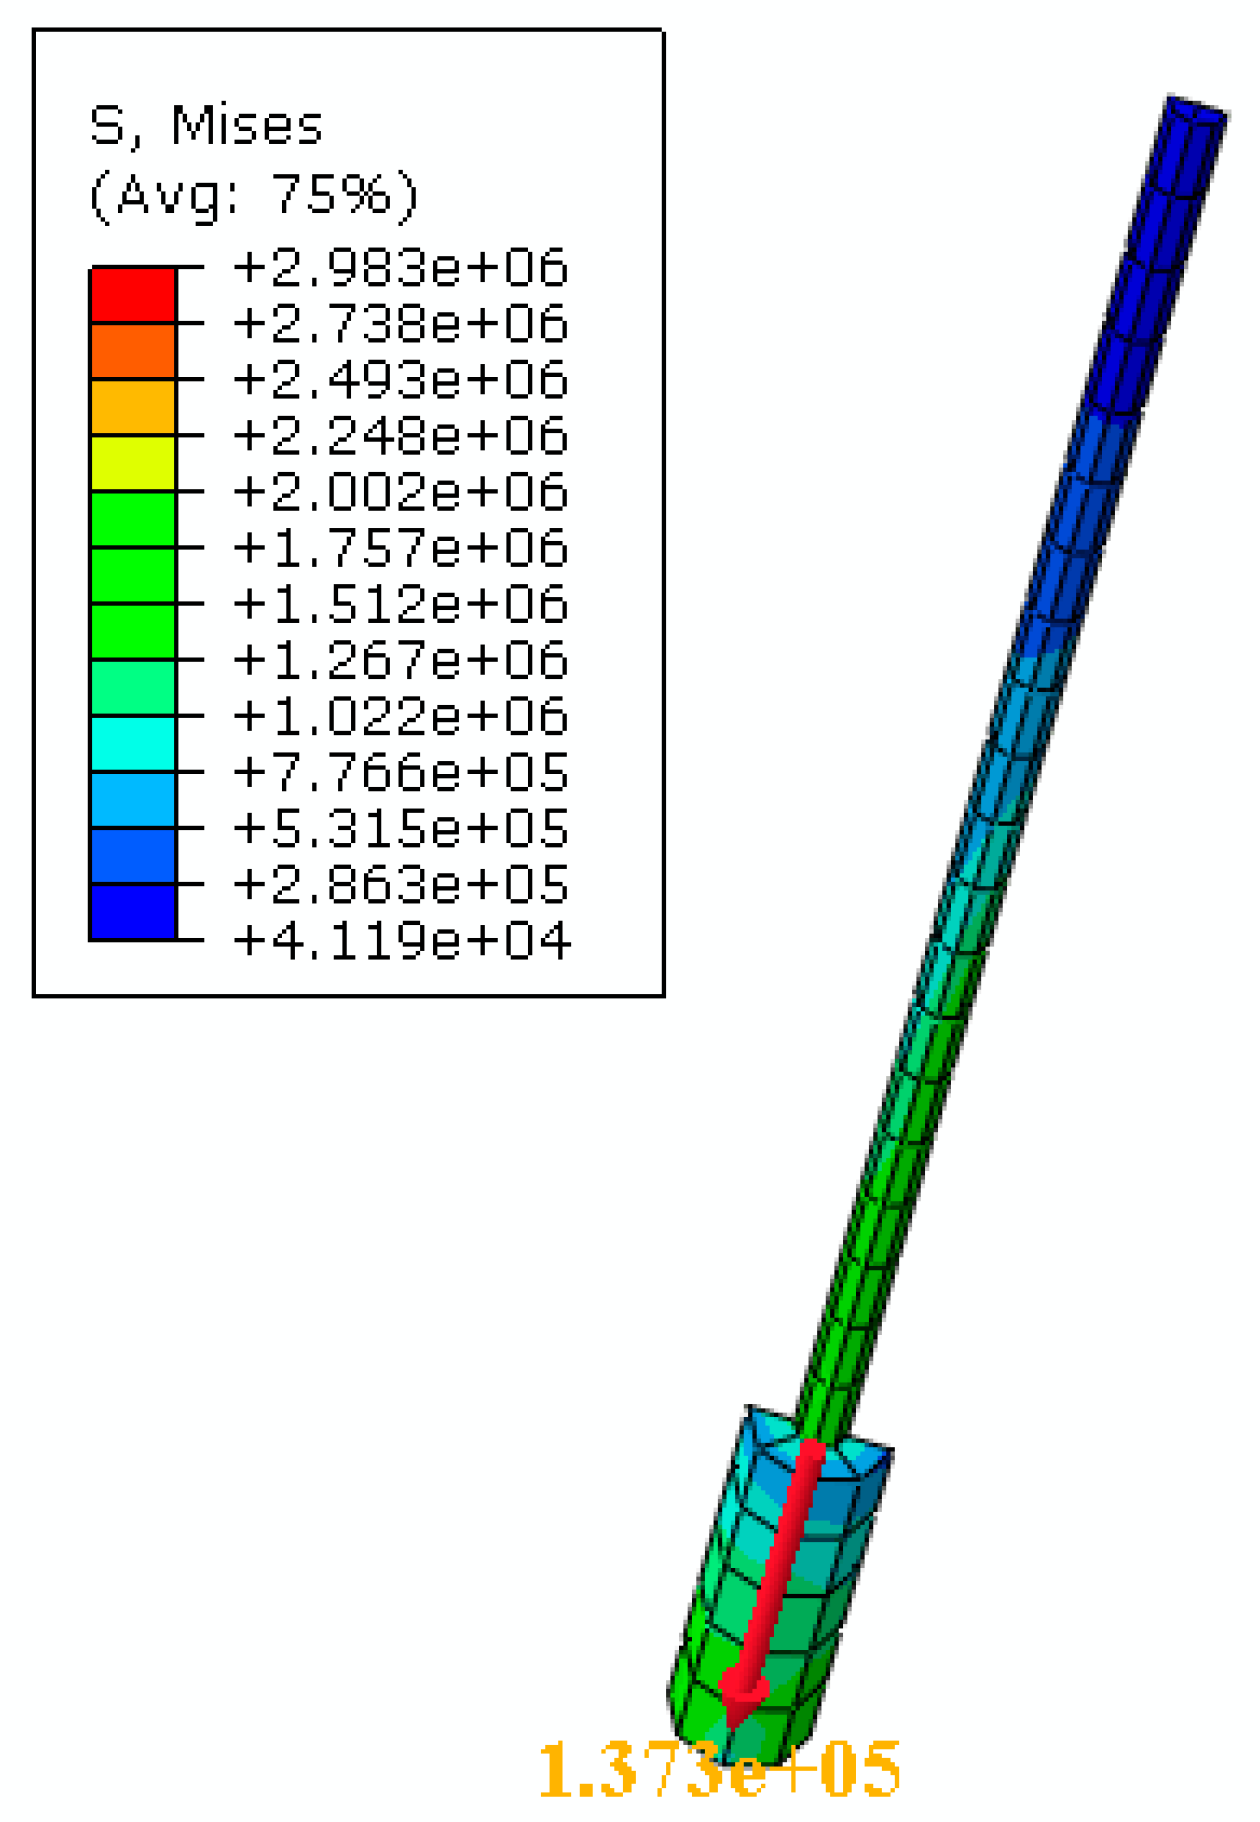
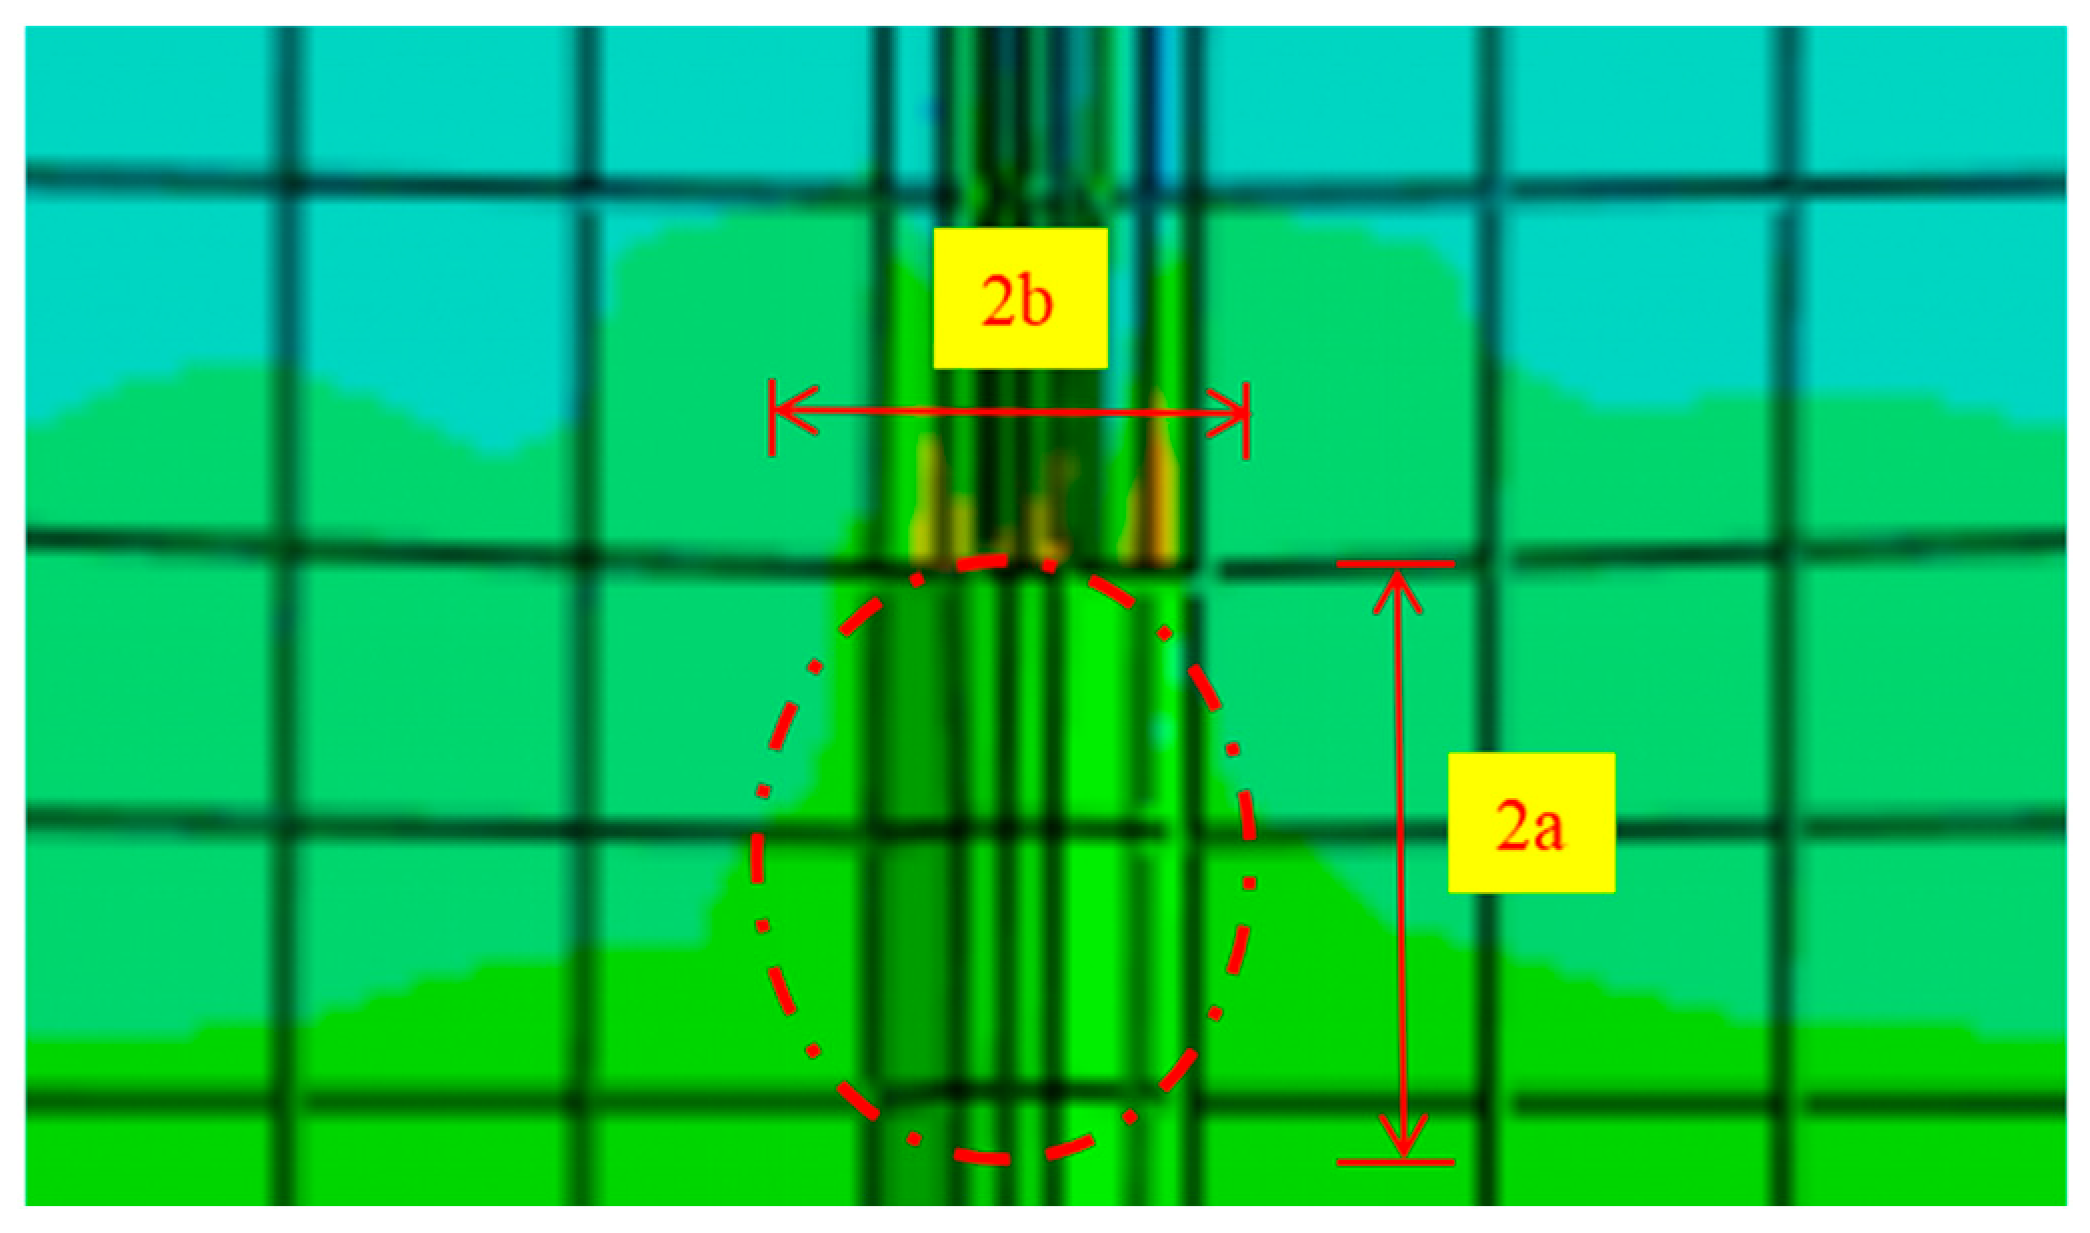
Based on the numerical model established in Section 4, under an applied load of 824 kN, the simulated end-bearing resistance of the underreamed anchor is 137 kN, as shown in Figure 20. Owing to the symmetry of the model, the actual simulated end resistance corresponds to 274 kN. At this load level, the failure zone in the surrounding soil assumes a semi-ellipsoidal shape, as shown in Figure 21. With the adopted mesh size, the semi-major axis a and semi-minor axis b of this zone are determined to be 0.70 m and 0.30 m, respectively. The soil failure zone around the enlarged anchorage end is approximately ellipsoidal, with 2a being the major axis and 2b the minor axis of the ellipsoid. The weighted average unit weight of the overlying soil γ, calculated over the anchor embedment depth, is 19,285 N/m3. The embedment depth H of the underreamed anchor is 8 m, and the weighted average density of the surrounding soil ρ is 1928.5 kg/m3. The weighted average internal friction angle of the surrounding soil φ is 14.8°; the radius of the underreamed anchorage segment R is 0.35 m; the weighted average cohesion of the surrounding soil c is 32.2 kPa; and the lateral earth pressure coefficient K is 0.30. The substitution of these parameters into Equation (55) yields a theoretical end-bearing resistance of 273.84 kN, corresponding to a relative deviation of 0.058% with respect to the numerically simulated value. All model parameters can be determined unambiguously from routine site and numerical simulation data, eliminating the indeterminacy that plagues the end-bearing equations in current design codes. The simulation demonstrates that the proposed formulation predicts the end-bearing capacity of underreamed anchors with high fidelity.

6. Ultimate Bearing Capacity Evaluation of Underreamed Anchors

The ultimate bearing capacity of underreamed anchors cannot be obtained by a simple linear summation of the side friction and end-bearing components. An empirically rigorous formulation for the side friction contribution remains elusive. Equation (23) in Section 5.1 focuses on depicting the distribution pattern of the side friction stress. It does not provide a means for calculating the magnitude of the side friction resistance. Therefore, without invoking an intricate mechanical dissection of the anchor–soil interface, this section interrogates the full load–displacement curve recorded in pull-out tests, focusing on its elasto-plastic evolution to establish the correspondence between progressive mobilization and the asymptotic limit state. Four alternative models are herein adopted for curve fitting solely to the elasto-plastic portion of the experimental data: the adjusted hyperbolic model [25], the improved exponential model [26], the improved exponential power function model [27], and the GM(1,1) gray model [28]. These models are subsequently used to extrapolate the ultimate bearing capacity of the underreamed anchor. The governing equations are summarized in Table 5, where Pu denotes the predicted ultimate capacity, P is the measured load, S is the corresponding displacement, and a, b, c, k are regression parameters determined from the non-destructive test segment.
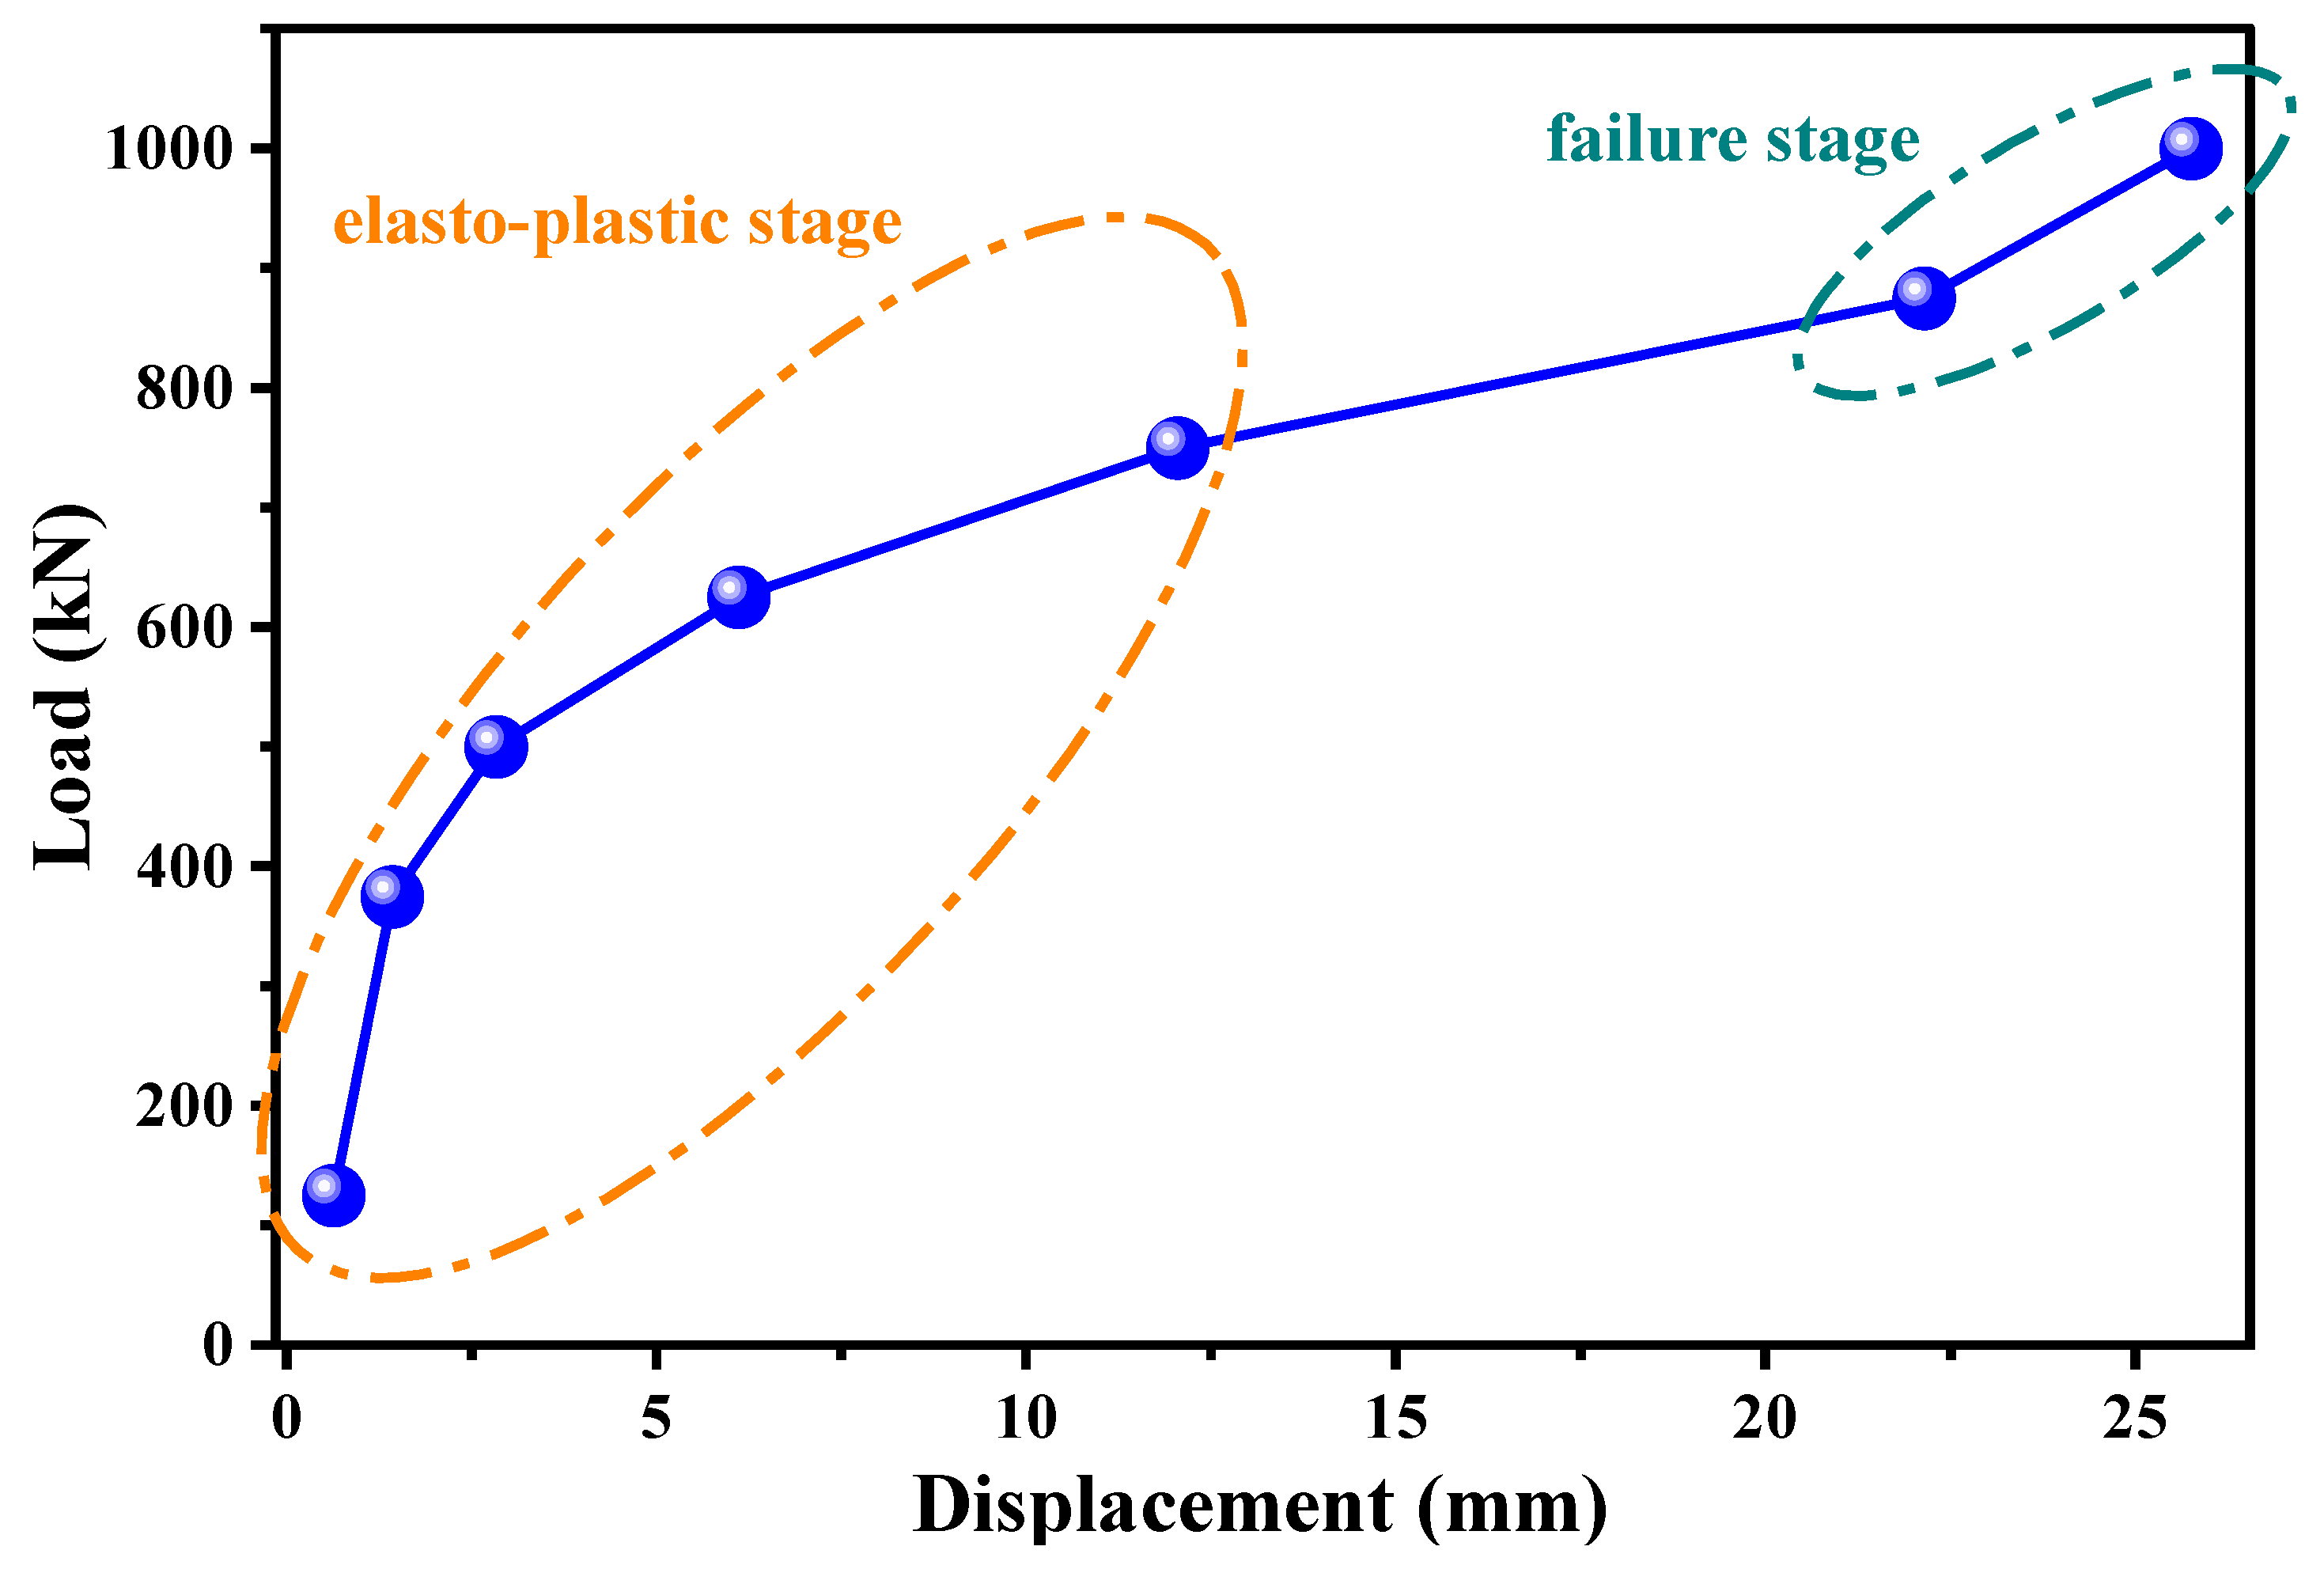
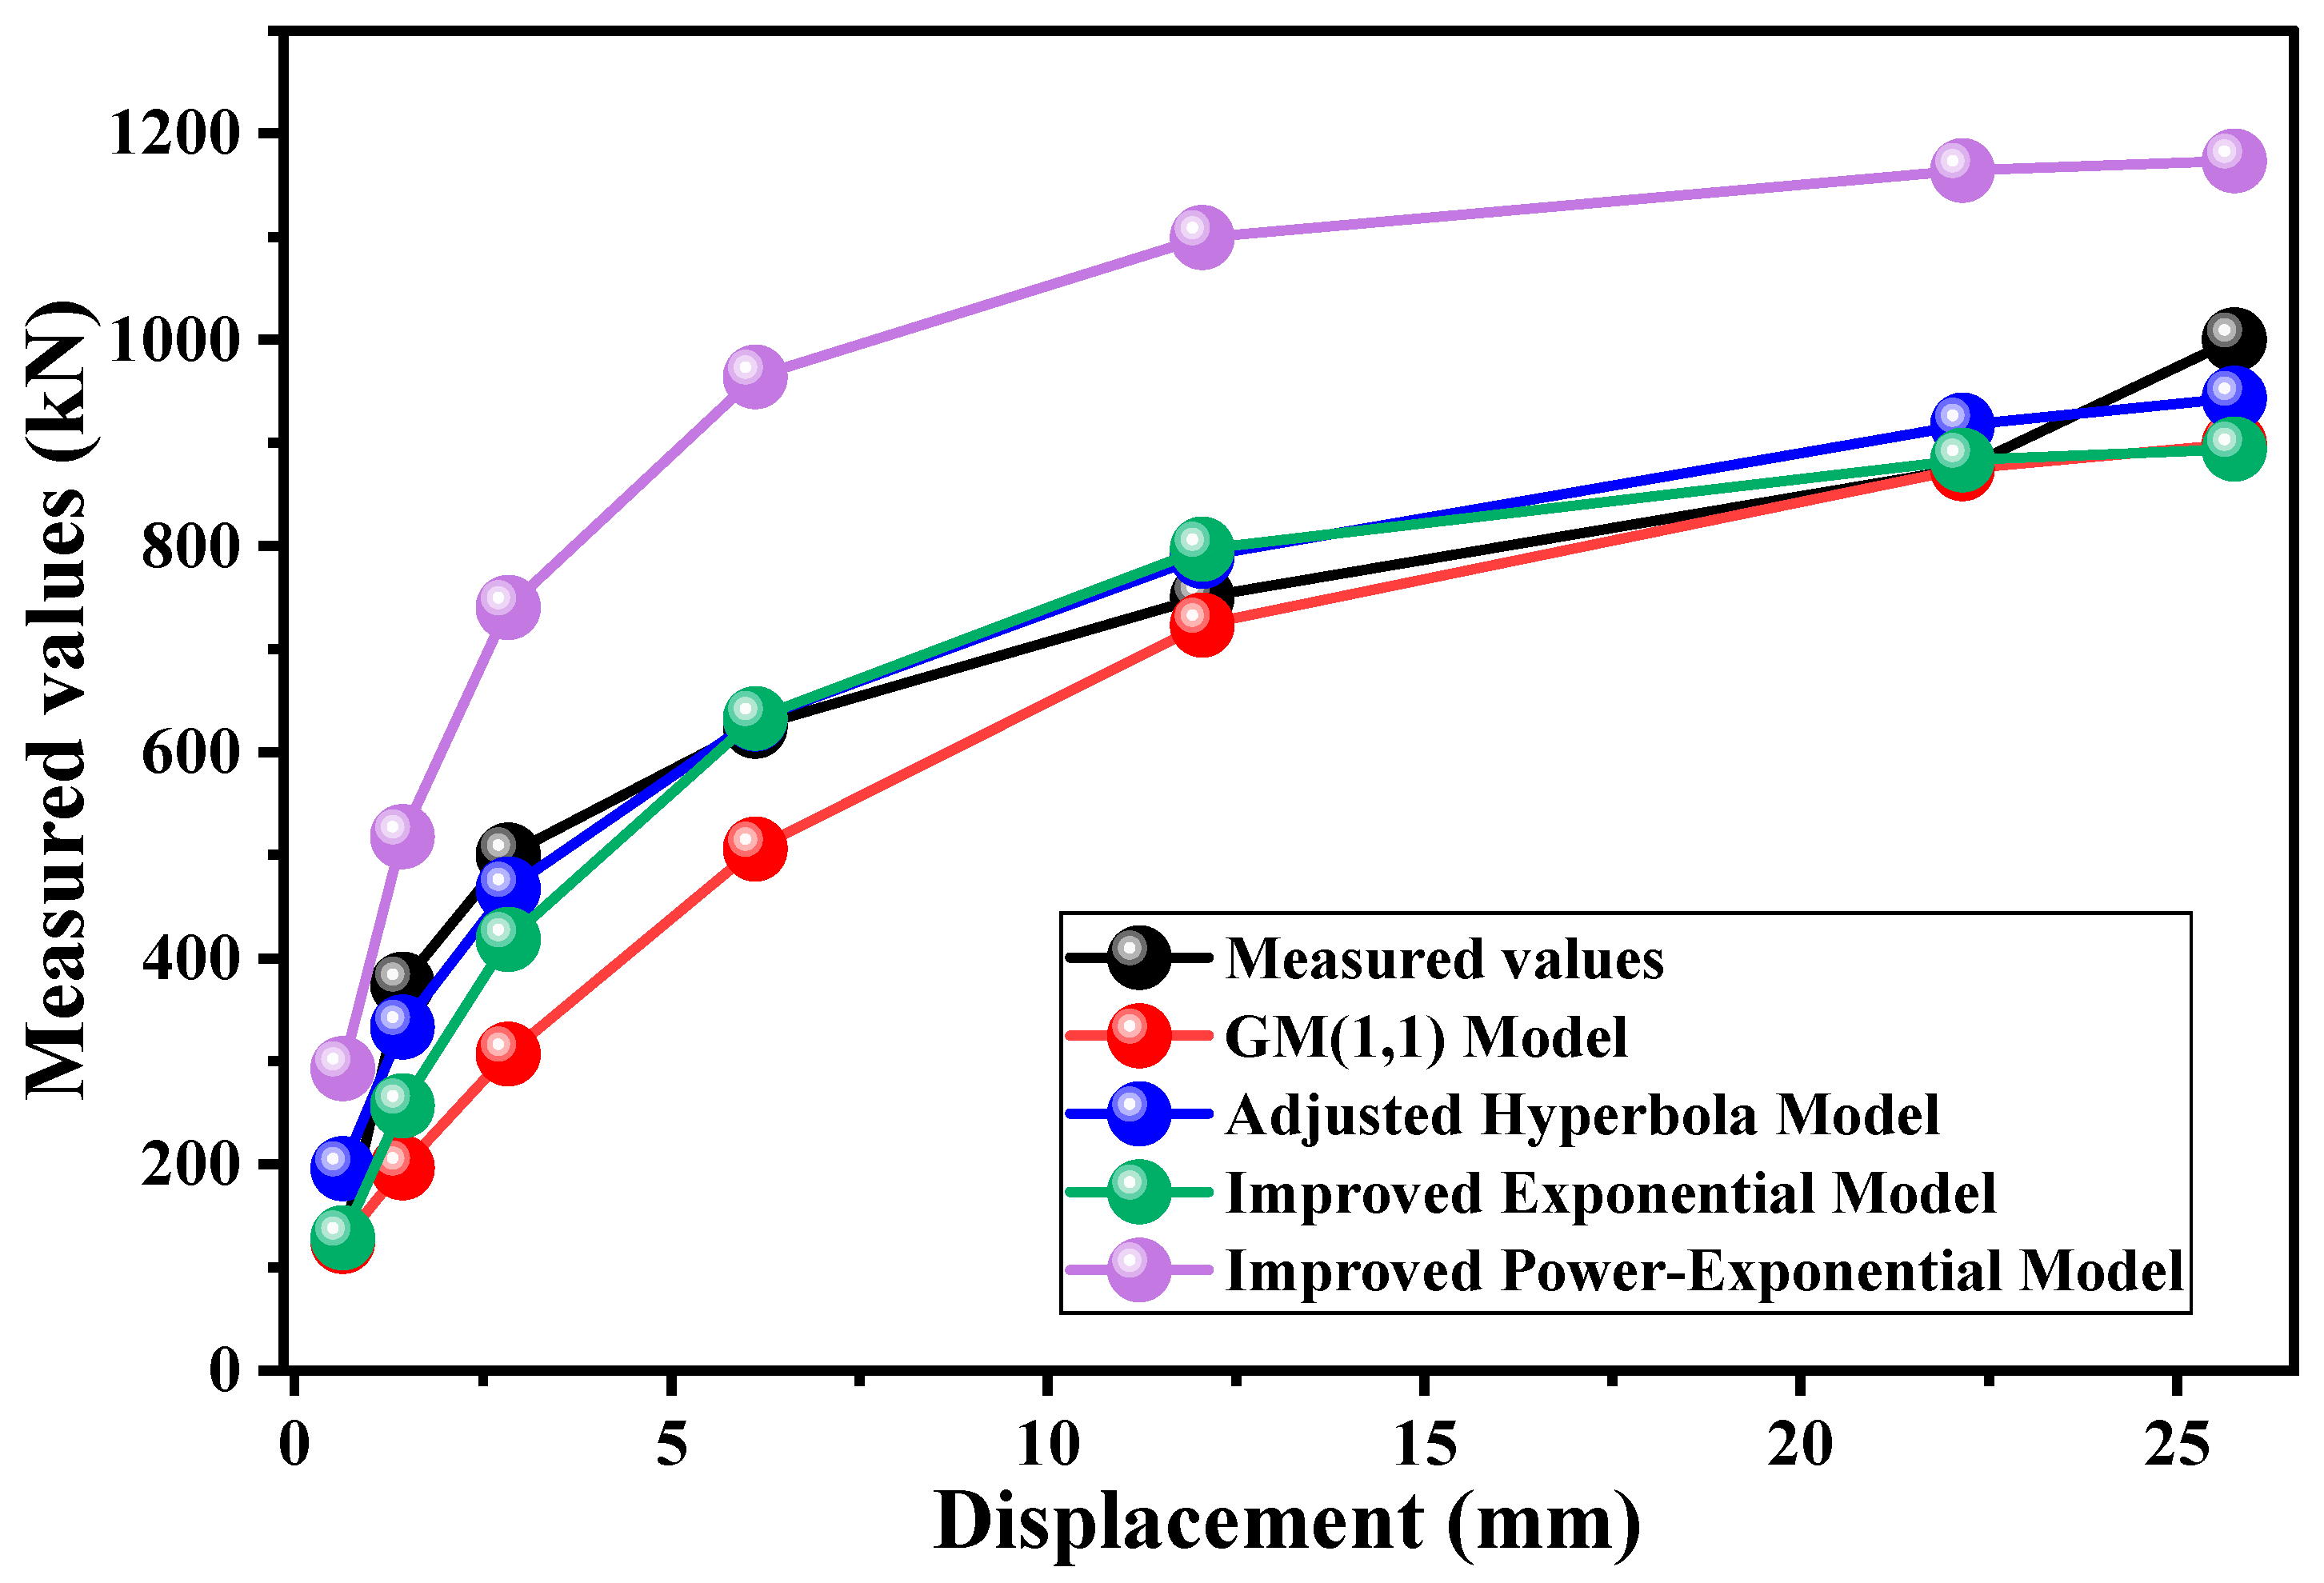
Taking the on-site test with a final loading value of 1000 kN as an example, the complete load–displacement curve is shown in Figure 22. During the elastic–plastic stage, the slope of the curve gradually decreases, while during the failure stage, the slope of the curve suddenly increases. Based on the hyperbolic model, the improved exponential model, the improved exponential power model, and the GM(1,1) model, the ultimate bearing capacity of the underreamed anchor is predicted using the data from the elastic–plastic stage. The calculation results are shown in Figure 23. Among them, the hyperbolic model and improved exponential model have better fitting effects on the load–displacement measured values. Among them, the hyperbolic model and improved exponential model have better fitting effects on the load–displacement measured values. The prediction error of the ultimate bearing capacity of the underreamed anchor using an adjusted hyperbolic model is 5.7%; the prediction error using the improved exponential model is 10.6%; and the prediction errors using the mean GM(1,1) gray model and improved exponential power model are 11.2% and 17.3%, respectively. This indicates that the adjusted hyperbolic model is the optimal model for fitting the load–displacement curve and predicting the ultimate bearing capacity. The adjusted hyperbolic model intrinsically possesses an asymptotic structure that is mathematically isomorphic to the three-stage mechanical response of the anchor–soil interface. Namely, elastic shearing, plastic slip, and post-peak strain-hardening. Its horizontal asymptote physically represents the ultimate bearing capacity, thereby permitting a seamless description of the entire elasto-plastic deformation trajectory. In contrast, exponential or power function models require additional splice conditions to characterize the post-yield regime. Guo et al. [3], through scaled model tests on underreamed anchors, likewise demonstrated that a hyperbolic formulation precisely reproduces the evolution of load with displacement along the sequence “strong hardening → weak hardening → zero hardening.”

7. Conclusions

In this paper, full-scale field tests, high-fidelity numerical simulations, and rigorous theoretical analyses were integrated to form a comprehensive research framework. This framework was used to systematically examine the load transfer characteristics of underreamed anchors, the failure patterns of the surrounding soil, and the methodologies for predicting ultimate capacity. Consequently, the framework enables the accurate estimation of anchor bearing capacity without the need for costly destructive testing. The conclusions are as follows:
  • The existing side fictional stress distribution model primarily characterizes the distribution of elastic deformation. This paper was based on Mohr–Coulomb strength theory and an associated flow rule, while the model furnishes a closed-form expression describing how the side shear stress evolves along the anchorage segment once plastic deformation is mobilized at the anchor rock–soil interface. Comparisons with high-resolution finite element simulations reveal relative deviations ranging from 0.02% to 6.29%, corroborating that the proposed analytical solution faithfully captures the spatial distribution of plastic side shear stress along the underreamed anchor.
  • Based on the clarification of the load transfer mechanism during the local shear failure of the surrounding soil under the vertical pull-out of the underreamed anchor, an end-bearing capacity model is proposed that incorporates factors such as embedment depth, underreamed diameter, soil cohesion, and internal friction angle. The relative error between theoretical predictions and numerical simulations is 0.058%. The analytical model is demonstrated to compute the end-bearing capacity of underreamed anchors with marked accuracy.
  • By employing the existing fitting model to calculate the ultimate bearing capacity of the underreamed anchor, this study reveals that the prediction error of the ultimate bearing capacity of underreamed anchors using the adjusted hyperbolic model is 5.7%, while the prediction error using the improved exponential model is 10.6%. The prediction errors using the GM(1,1) model and improved exponential power model are 11.2% and 17.3%, respectively. This indicates that the adjusted hyperbolic model is the optimal model for fitting the load–displacement curve and calculating the ultimate bearing capacity.

Author Contributions

B.Z.: Writing—original draft, Methodology, Formal analysis. T.F.: Writing—review and editing, Supervision, Project administration, Funding acquisition. J.Z.: Validation. H.W.: Validation. All authors have read and agreed to the published version of the manuscript.

Funding

This research was funded by the Fundamental Research Funds for the Central Universities (B250201154), the Jiangxi Province Major Science and Technology Research and Development Special Fund (20232ACG01004), General Program of the National Natural Science Foundation of China (52378336), and Special Research Funding for High-Level Talents (205201500003, 205200100736). And The APC was funded by the Fundamental Research Funds for the Central Universities (B250201154).

Data Availability Statement

Data will be made available on request.

Acknowledgments

The authors acknowledge the valuable support provided by Lin Wang and Keke Du from Jiangsu Green River Environment Technology Company, Nanjing, China.

Conflicts of Interest

The authors declare the following financial interests/personal relationships which may be considered as potential competing interests: Bin Zheng reports that financial support was provided by the Fundamental Research Funds for the Central Universities. Tugen Feng reports that financial support was provided by the Jiangxi Province Major Science and Technology Research and Development Special Fund, General Program of the National Natural Science Foundation of China, and Special Research Funding for High-Level Talents. The other authors declare that they have no known competing financial interests or personal relationships that could have appeared to influence the work reported in this paper.

References

  1. Park, H.; Lee, S.R.; Kim, N.K.; Kim, T.H. A numerical study of the pullout behavior of grout anchors underreamed by pulse discharge technology. Comput. Geotech. 2013, 47, 78–90. [Google Scholar] [CrossRef]
  2. Zhou, Y.; Shi, S.; Cai, Q. A model test and the ultimate capacity analysis of multi-underreamed anchors in silty clay. Soil Mech. Found. Eng. 2024, 60, 564–573. [Google Scholar] [CrossRef]
  3. Guo, G.; Tang, A.; Zhong, G.; Liu, Z.; Hu, X. Underreamed anchor with geotextile bag and its hyperbolic load versus displacement model for capacity prediction. IOP Conf. Ser Earth Environ. 2019, 340, 052077. [Google Scholar] [CrossRef]
  4. Xia, Y.Y.; Chen, C.; Ni, Q. Comparative modelling of pull-out process of four different anchorages by using transparent soil. Chin. J. Geotech. 2017, 39, 399–407. [Google Scholar] [CrossRef]
  5. Wang, D.; Hu, R.; Randolph, R.F. Three-dimensional large deformation finite-element analysis of plate anchors in uniform clay. Geotech. Geoenvironmental Eng. 2010, 136, 355–365. [Google Scholar] [CrossRef]
  6. Hsu, S.T.; Liao, H.J. Uplift behavior of cylindrical anchors in sand. Can. Geotech. J. 1998, 35, 70–80. [Google Scholar] [CrossRef]
  7. Hyett, A.J.; Bawden, W.F.; Reichert, R.D. The effect of rock mass confinement on the bond strength of fully grouted cable bolts. Int. J. Rock. Mech. Min. Sci. Geomech Abstr. 1992, 29, 503–524. [Google Scholar] [CrossRef]
  8. Liu, J.; Li, H.; Li, Y.; Yang, Y.; Sun, T.; Xie, X.; Tang, H. Effect of surrounding rock confinement on the performance of self-expanding bolt. China J. Highw. Transp. 2022, 35, 245–257. [Google Scholar] [CrossRef]
  9. Zheng, B.; Bayat, M.; Shi, Y.; Cao, M.; Jiang, Y.; Qian, X.; Sumarac, D. A prognostic model of side friction of rock bolt anchoring section based on associated flow law. Kuwait J. Sci. 2025, 52, 100374. [Google Scholar] [CrossRef]
  10. Zhou, Y.; Liang, J.; Shi, S.; Cai, Q. Ultimate uplift capacity of multi-underreamed anchors in soft soil. Soil Mech. Found. Eng. 2024, 61, 426–435. [Google Scholar] [CrossRef]
  11. Chen, C.; Xia, Y.; Ni, Q. Investigation on the working mechanism and structural parameters optimization of multiple ball shaped nodular anchors. Soil Mech. Found. Eng. 2020, 57, 49–56. [Google Scholar] [CrossRef]
  12. Ouyang, P.; Xiao, H.; Shen, Z. Analysis on the Bearing Characteristics of Anchor Bolt Anchoring Interface. Chin. J. Undergr. Sp. Eng. 2024, 20, 575–581. [Google Scholar] [CrossRef]
  13. Li, Z.; Yu, J.; Zhang, X.; Elmaimouni, L. Study on propagation characteristics of ultrasonic guided wave and detection of the defect in resin bolts. Appl. Acoust. 2022, 195, 108843. [Google Scholar] [CrossRef]
  14. Zhang, R.; Zheng, J.; Li, P.; Zhang, J.; Yu, S. A method for predicting mechanical behaviour of HPJG-Anchors-Part I: Mechanical characteristics and load transfer models. Comput. Geotech. 2012, 45, 62–73. [Google Scholar] [CrossRef]
  15. Ensani, A.; Razeghi, H.R.; Mamaghanian, J. A hyperbolic model for mechanical behaviour of marginal soil-geosynthetic interface. Geosynth. Int. 2022, 29, 457–475. [Google Scholar] [CrossRef]
  16. Yue, Z.; Li, A.; Wang, P. An analytical analysis for the mechanical performance of fully-grouted rockbolts based on the exponential softening model. Int. J. Min. Sci. Technol. 2022, 32, 981–995. [Google Scholar] [CrossRef]
  17. Luan, Y.; Zhang, Y.; Zhuang, K.; Ding, L.; Sun, J. Research on power characteristics of fully-power variable speed pumped storage units based on hydraulic-mechanical-electrial modeling. Trans. China Electrotech. Soc. 2025, 40, 730–743. [Google Scholar] [CrossRef]
  18. Wang, X.; Zhao, Y.; Nie, Y.; Lin, X.; Sun, X. The shear resistance mechanism of prestressed anchor cables in slope reinforcement. Int. J. Rock. Mech. Min. Sci. 2023, 170, 105520. [Google Scholar] [CrossRef]
  19. Liu, F.; Zhang, Y.; Ma, T.; Tang, C. Observed performance of a deep excavation of Qingdao Metro Line 4 in China. Tunn. Undergr. Space Technol. 2022, 123, 104445. [Google Scholar] [CrossRef]
  20. Chen, C.; Li, W.; Zhu, S.; Chen, Y. Method for calculating soil-grout interface bond strength of pressure-grouted anchors based on viscoelastic-plastic cavity expansion theory. China J. Highw. Transp. 2023, 36, 41–51. [Google Scholar] [CrossRef]
  21. Cui, Y.; Wang, Y. Effective contact stiffness model for bolted flange joint with spigot. Int. J. Mech. Sci. 2025, 293, 110213. [Google Scholar] [CrossRef]
  22. Song, Y. Analysis of the stability of tunnels based on the Hoek-Brown and associated flow rule. Xi’an Univ. Archit. Technol. Nat. Sci. Ed. 2020, 52, 248–256. [Google Scholar] [CrossRef]
  23. Liu, H. Unified sand modeling using associated or non-associated flow rule. Mech. Res. Commun. 2013, 50, 63–70. [Google Scholar] [CrossRef]
  24. Wang, X.; Schiavone, P. Uniform elastic field inside an elliptical inhomogeneity with Neuber’s nonlinear stress-strain law under generalized plane strain deformations. Mech. Adv. Mater. Struct. 2025, 32, 1993–1998. [Google Scholar] [CrossRef]
  25. Mortezaee, M.; Ghovatmand, M.; Nazemi, A. An application of generalized fuzzy hyperbolic model for solving fractional optimal control problems with caputo-fabrizio derivative. Neural Process Lett. 2020, 52, 1997–2020. [Google Scholar] [CrossRef]
  26. Song, T.; Pan, B.; Niu, G.; Fu, Y. A novel closed-form solutions method based on the product of exponential model for the minimally invasive surgical robot. Ind. Robot. 2022, 49, 934–946. [Google Scholar] [CrossRef]
  27. Ge, C.; Xu, Z.; Du, K.; Zhou, C.; Tan, C.; Liu, W.; Xu, S.; Wang, B. An improved inverse power law model for accelerated fatigue life prediction of 6061-T6 and AZ31B-F. Eng. Fail. Anal. 2022, 138, 106381. [Google Scholar] [CrossRef]
  28. Liu, X.; Peng, H.; Bai, Y.; Zhu, Y.; Liao, L. Tourism flows prediction based on an improved grey GM(1,1) model. Proc. Soc. Behav. Sci. 2014, 138, 767–775. [Google Scholar] [CrossRef]
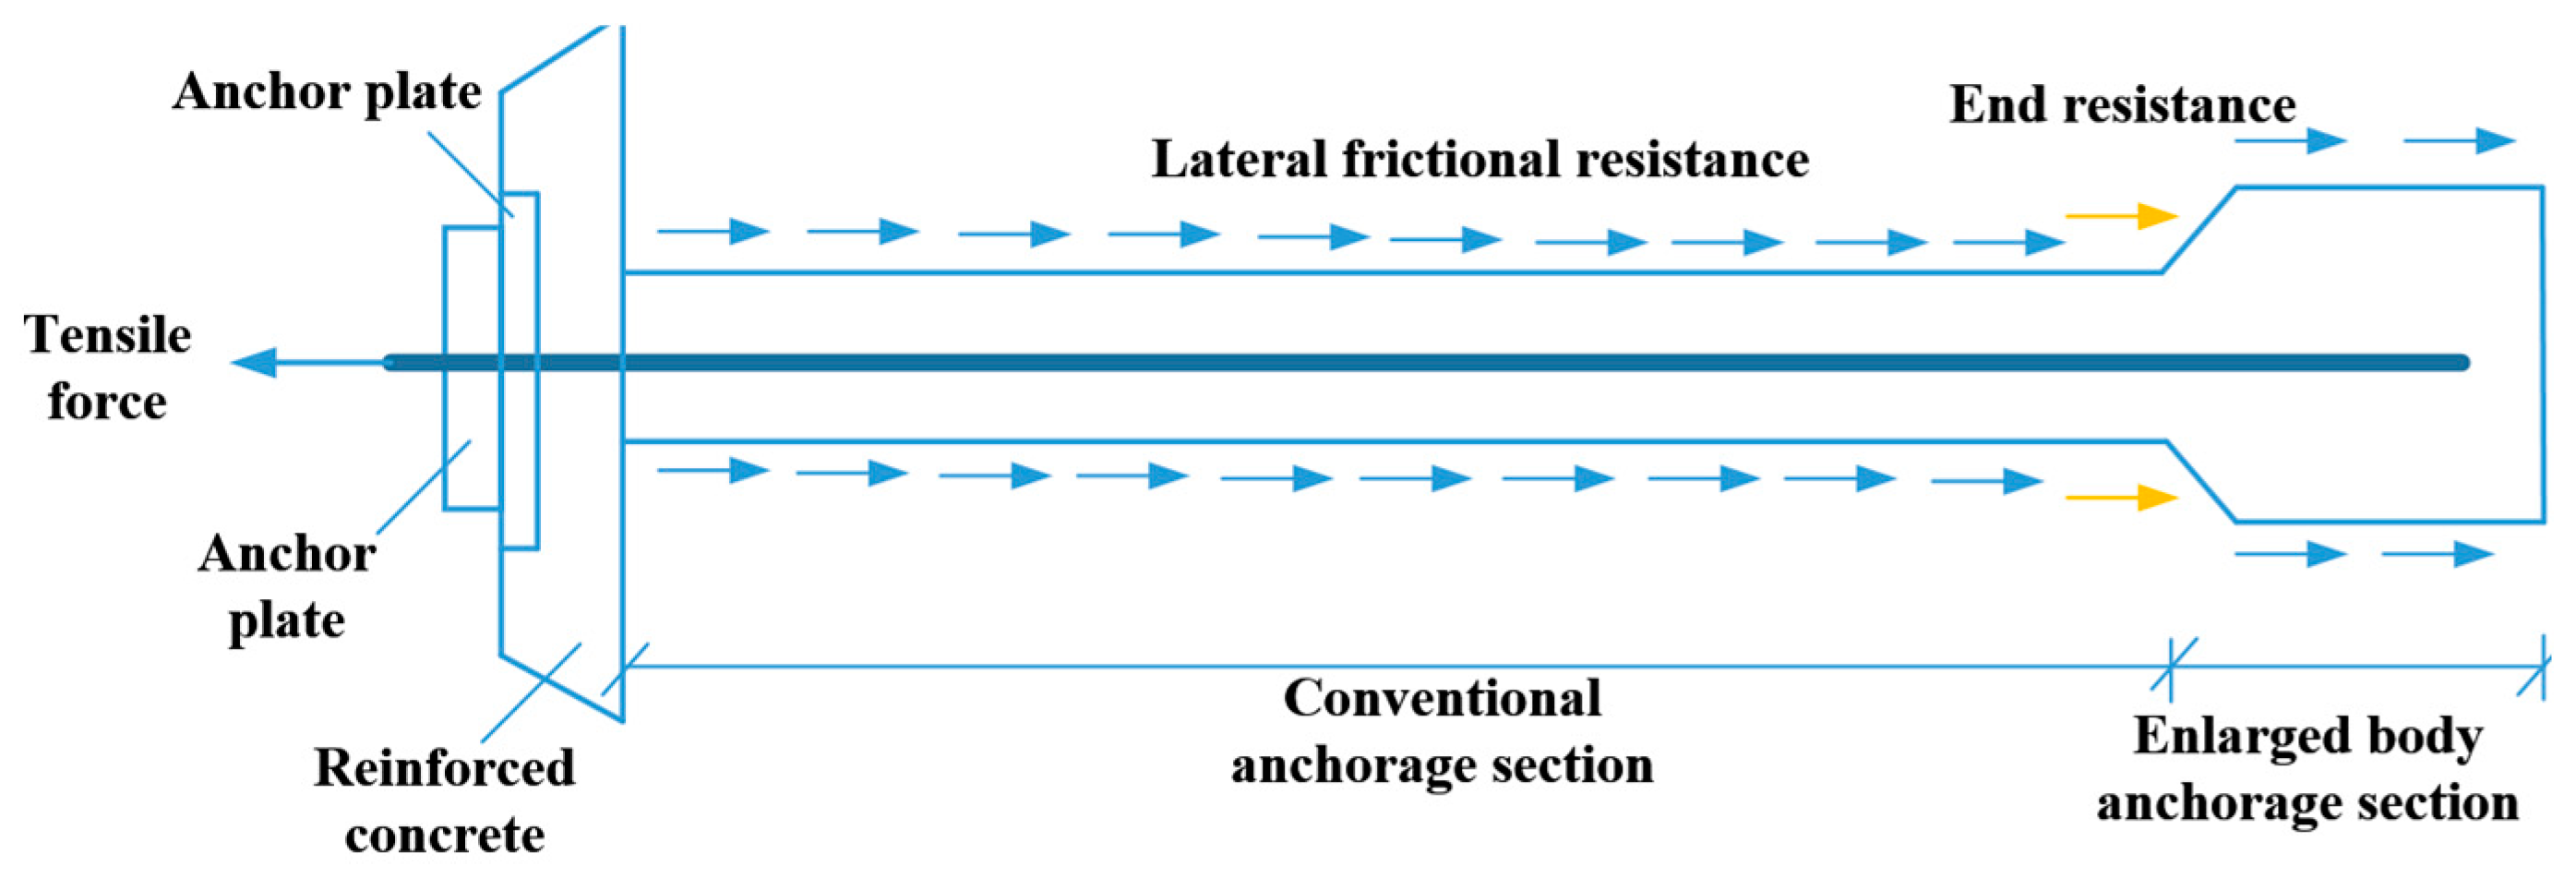
Figure 1. Schematic diagram of force on expanded-body anchors.
Applsci 15 10929 g001
Figure 2. Schematic design of pull-out test setup for underreamed anchor.
Applsci 15 10929 g002
Figure 3. On-site pull-out testing procedure for underreamed anchors.
Applsci 15 10929 g003
Figure 4. Field pull-out test load–displacement curve of underreamed anchors.
Applsci 15 10929 g004aApplsci 15 10929 g004b
Figure 5. Soil geometric model.
Applsci 15 10929 g005
Figure 6. Geometric model of underreamed anchors.
Applsci 15 10929 g006
Figure 7. Boundary constraints and geostress application.
Applsci 15 10929 g007
Figure 8. Initial geostress equilibration.
Applsci 15 10929 g008
Figure 9. Mesh of soil.
Applsci 15 10929 g009
Figure 10. Mesh of underreamed anchors.
Applsci 15 10929 g010
Figure 11. Soil displacement cloud map.
Applsci 15 10929 g011
Figure 12. Shear expansion of geotechnical bodies.
Applsci 15 10929 g012
Figure 13. Calculation sketch of anchor solid pull-out test.
Applsci 15 10929 g013
Figure 14. Schematic diagram of micro-elementary segments of anchor solid deformation.
Applsci 15 10929 g014
Figure 15. Redial deformation of geotechnical bodies.
Applsci 15 10929 g015
Figure 16. Redial deformation of anchor solid.
Applsci 15 10929 g016
Figure 17. Contour plot of interfacial shear stress along the underreamed anchor shaft.
Applsci 15 10929 g017
Figure 18. The theoretical and simulated values of interfacial shear stress at various depths from the loading end.
Applsci 15 10929 g018
Figure 19. Force analysis diagram of elliptical deformation zone.
Applsci 15 10929 g019
Figure 20. End-bearing capacity of the underreamed anchorage segment.
Applsci 15 10929 g020
Figure 21. Failure zone in the soil surrounding the underreamed anchorage segment.
Applsci 15 10929 g021
Figure 22. Field pull-out test load–displacement curve of the underreamed anchor bolt.
Applsci 15 10929 g022
Figure 23. Load–displacement curve fitting for various predictive models.
Applsci 15 10929 g023
Table 1. Rock and soil layer of the test site.
LayerSoilColorSoil TextureLayer Thickness
2-1Silt clayGraySoft to fluid plastic3 m
2Gray-brownPlastic3.3 m
3Gray-yellowHard plastic2.9 m
4Gray-brownPlastic3.8 m
5Gray-yellowHard plastic1.5 m
6Gray-yellowPlastic6 m
7Brown-yellowHard plastic6 m
Table 2. Physical and mechanical indexes of each rock and soil layer.
LayerSoilDensity
(kg/m3)
Poisson’s RationCohesion
(kPa)
Internal Friction Angle (°)Elastic Modulus
(MPa)
2-1Silt clay18700.318.010.38.56
2195034.016.011.76
3199053.920.614.84
4203045.517.414.73
5199055.721.317.27
6202026.923.413
7200055.517.216.23
Table 3. Load level and observation time in ultimate pull-out test of underreamed anchor.
Loading Increment
(%)
Initial Loading---10---
First Cycle10--30--10
Second Cycle1030-40-3010
Third Cycle10304050403010
Fourth Cycle10305060503010
Fifth Cycle10306070603010
Sixth Cycle10306080603010
Observation time (min)55510555
Table 4. Soil physical and mechanical properties.
LayerSoilThick
(m)
Density (kg/m3)Cohesion
(kPa)
Internal Friction Angle
(°)
Elastic Modulus (MPa)
2-1Silt clay318701810.38.56
23.31950341611.76
32.9199053.920.614.84
43.8203045.517.414.73
Table 5. The expression of predictive model function.
Prediction ModelFunction Expression
Adjusted Hyperbolic Model P = P u s s + a s s 1.5 + s n 1 + b
Improved Exponential Model P = P u 1 1 + k e a s + k
Improved Exponential power Function Model P = P u 1 1 + k e a s + k b s + 1 c
GM(1,1) Model P ^ k + 1 ( 1 ) = ( P 1 ( 1 ) b / a ) e a [ s k + 1 ( 1 ) s 1 ( 1 ) ] + b / a
P u = b / a
Disclaimer/Publisher’s Note: The statements, opinions and data contained in all publications are solely those of the individual author(s) and contributor(s) and not of MDPI and/or the editor(s). MDPI and/or the editor(s) disclaim responsibility for any injury to people or property resulting from any ideas, methods, instructions or products referred to in the content.