Optimization of Artificial Neural Networks for Predicting the Radiological Risks of Thermal Waters in Türkiye
Abstract
1. Introduction
2. Research Methodology
2.1. Data Analysis
| Very strong correlation between the variables; | |
| Strong correlation between the variables; | |
| Moderate correlation between the variables; | |
| Weak correlation between the variables; | |
| No correlation between the variables. |
2.2. Radiological Risk Assessment of Thermal Waters
2.3. Artificial Neural Networks (ANNs)
2.3.1. Multilayer Perceptron Artificial Neural Networks (MLPANNs)
2.3.2. Radial Basis Function Artificial Neural Networks (RBFANNs)
3. Results and Discussions
3.1. Development of MLPANN Models
3.2. Development of RBFANN Models
3.3. Simulation of Results
3.4. Rank Analysis
3.5. Taylor Graph
3.6. Scaled Percent Error Graph
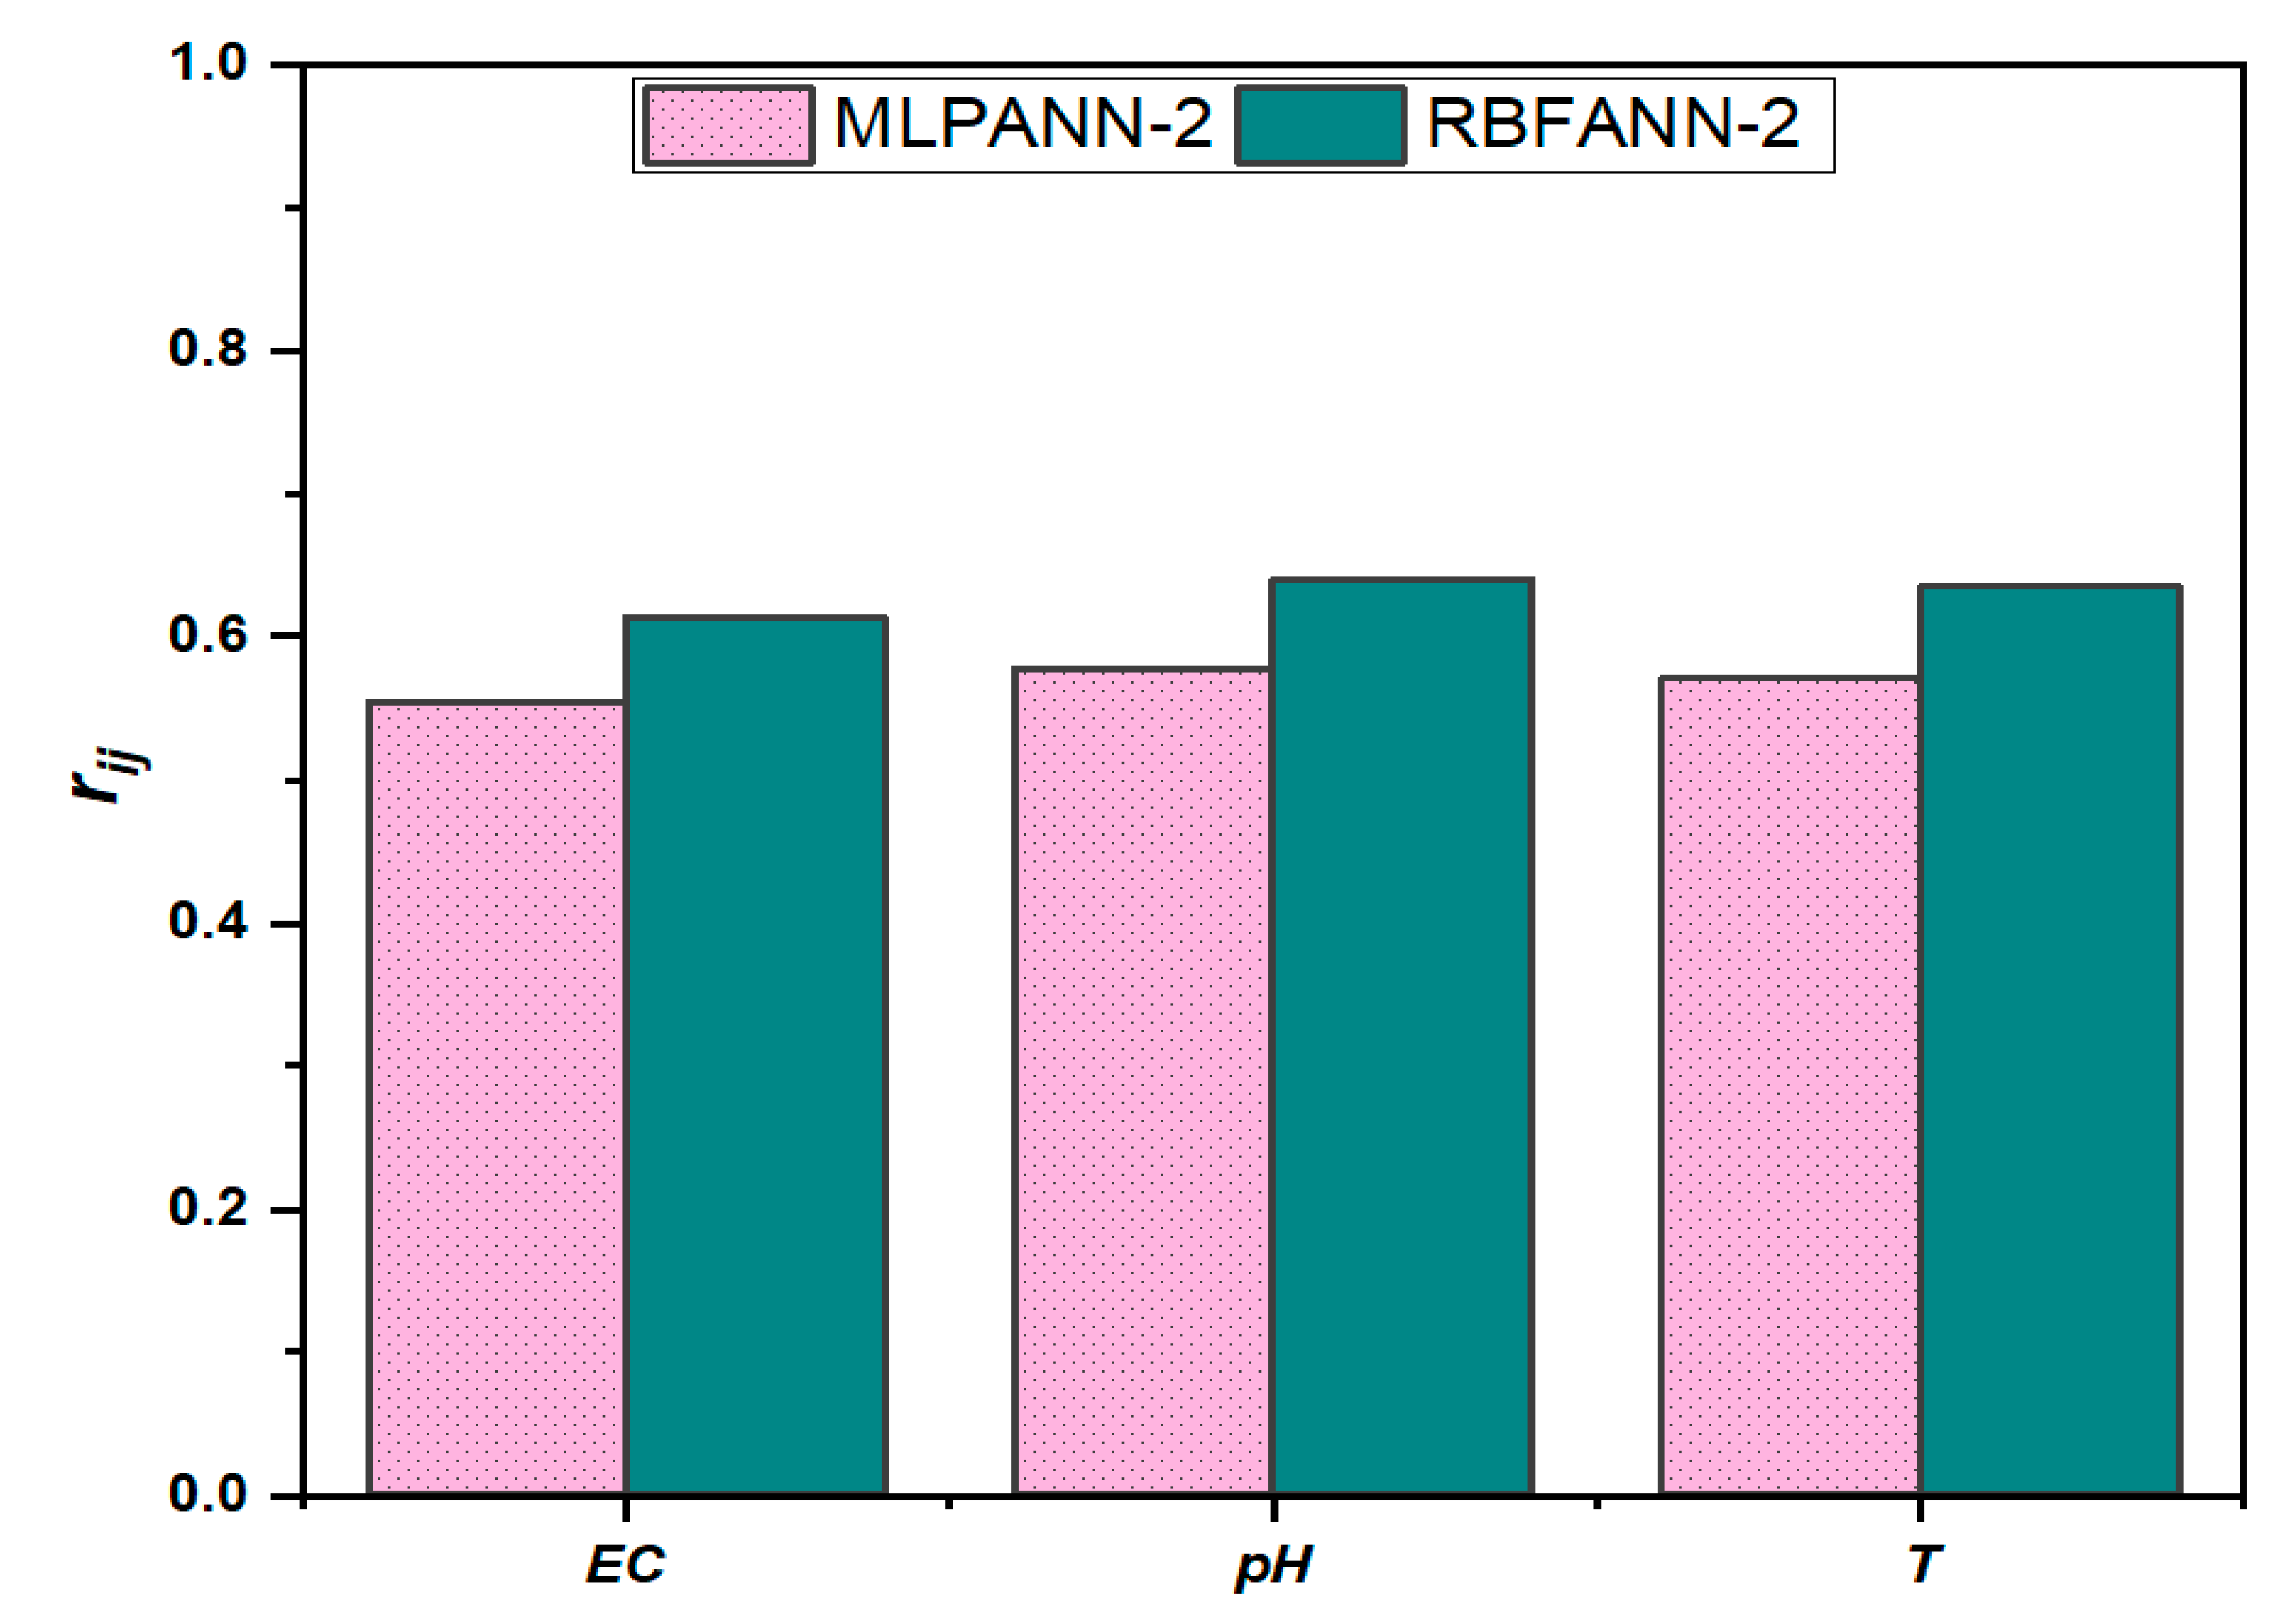
3.7. Sensitivity Analysis
4. Conclusions
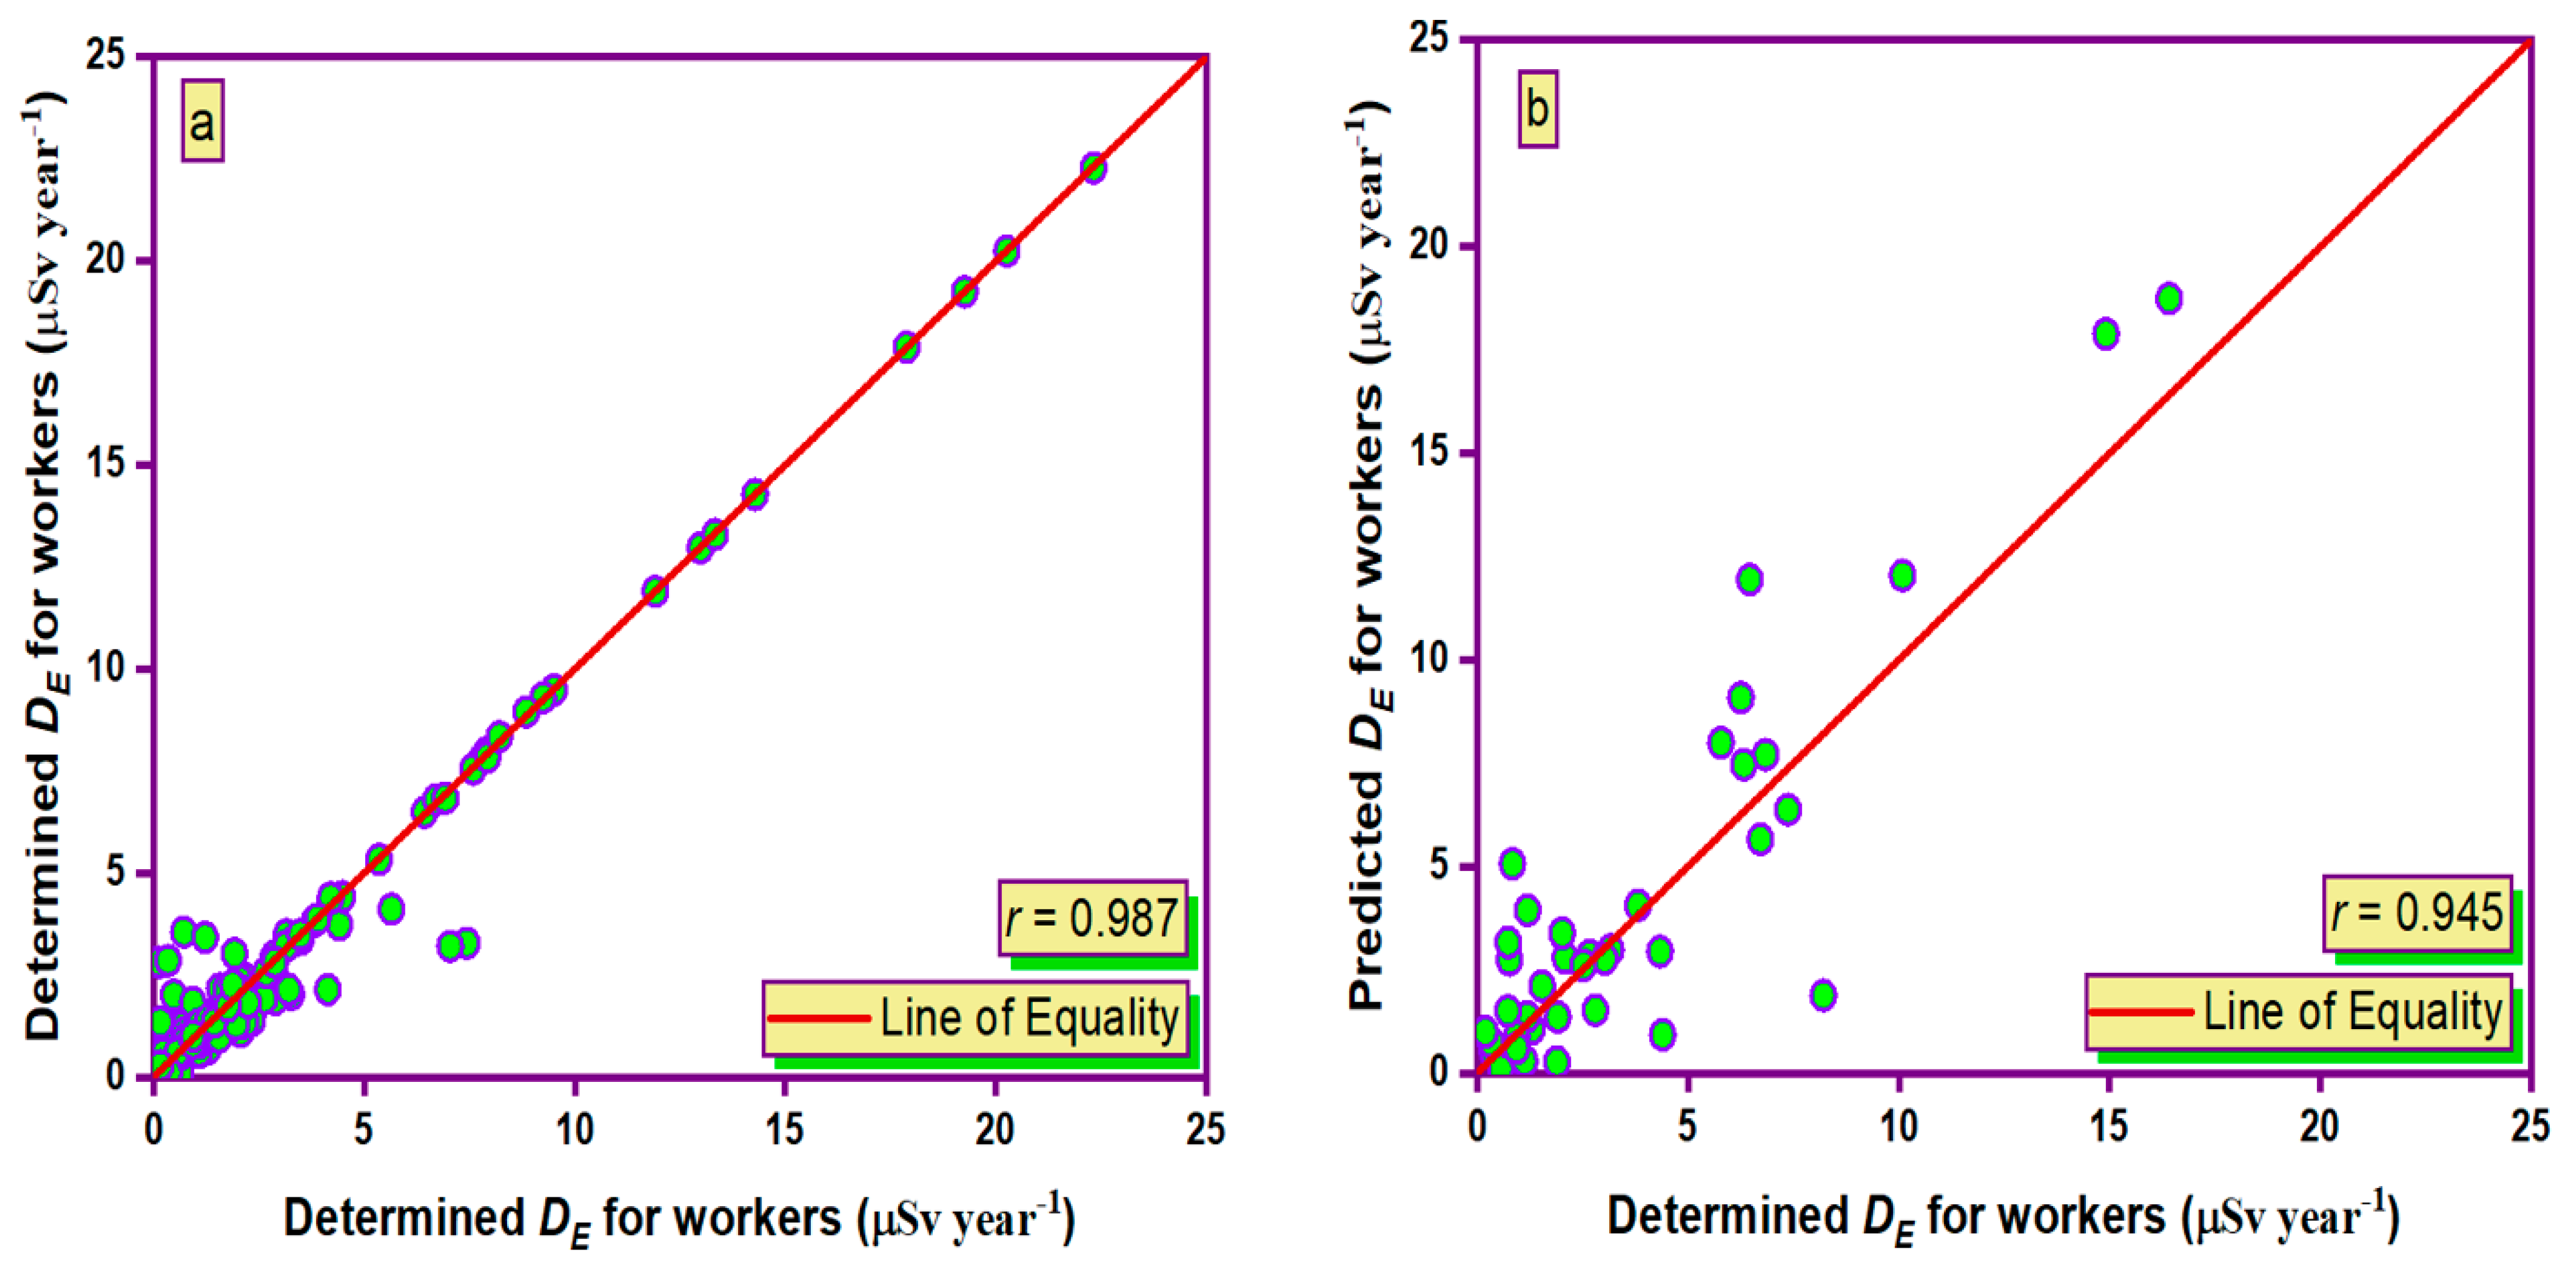
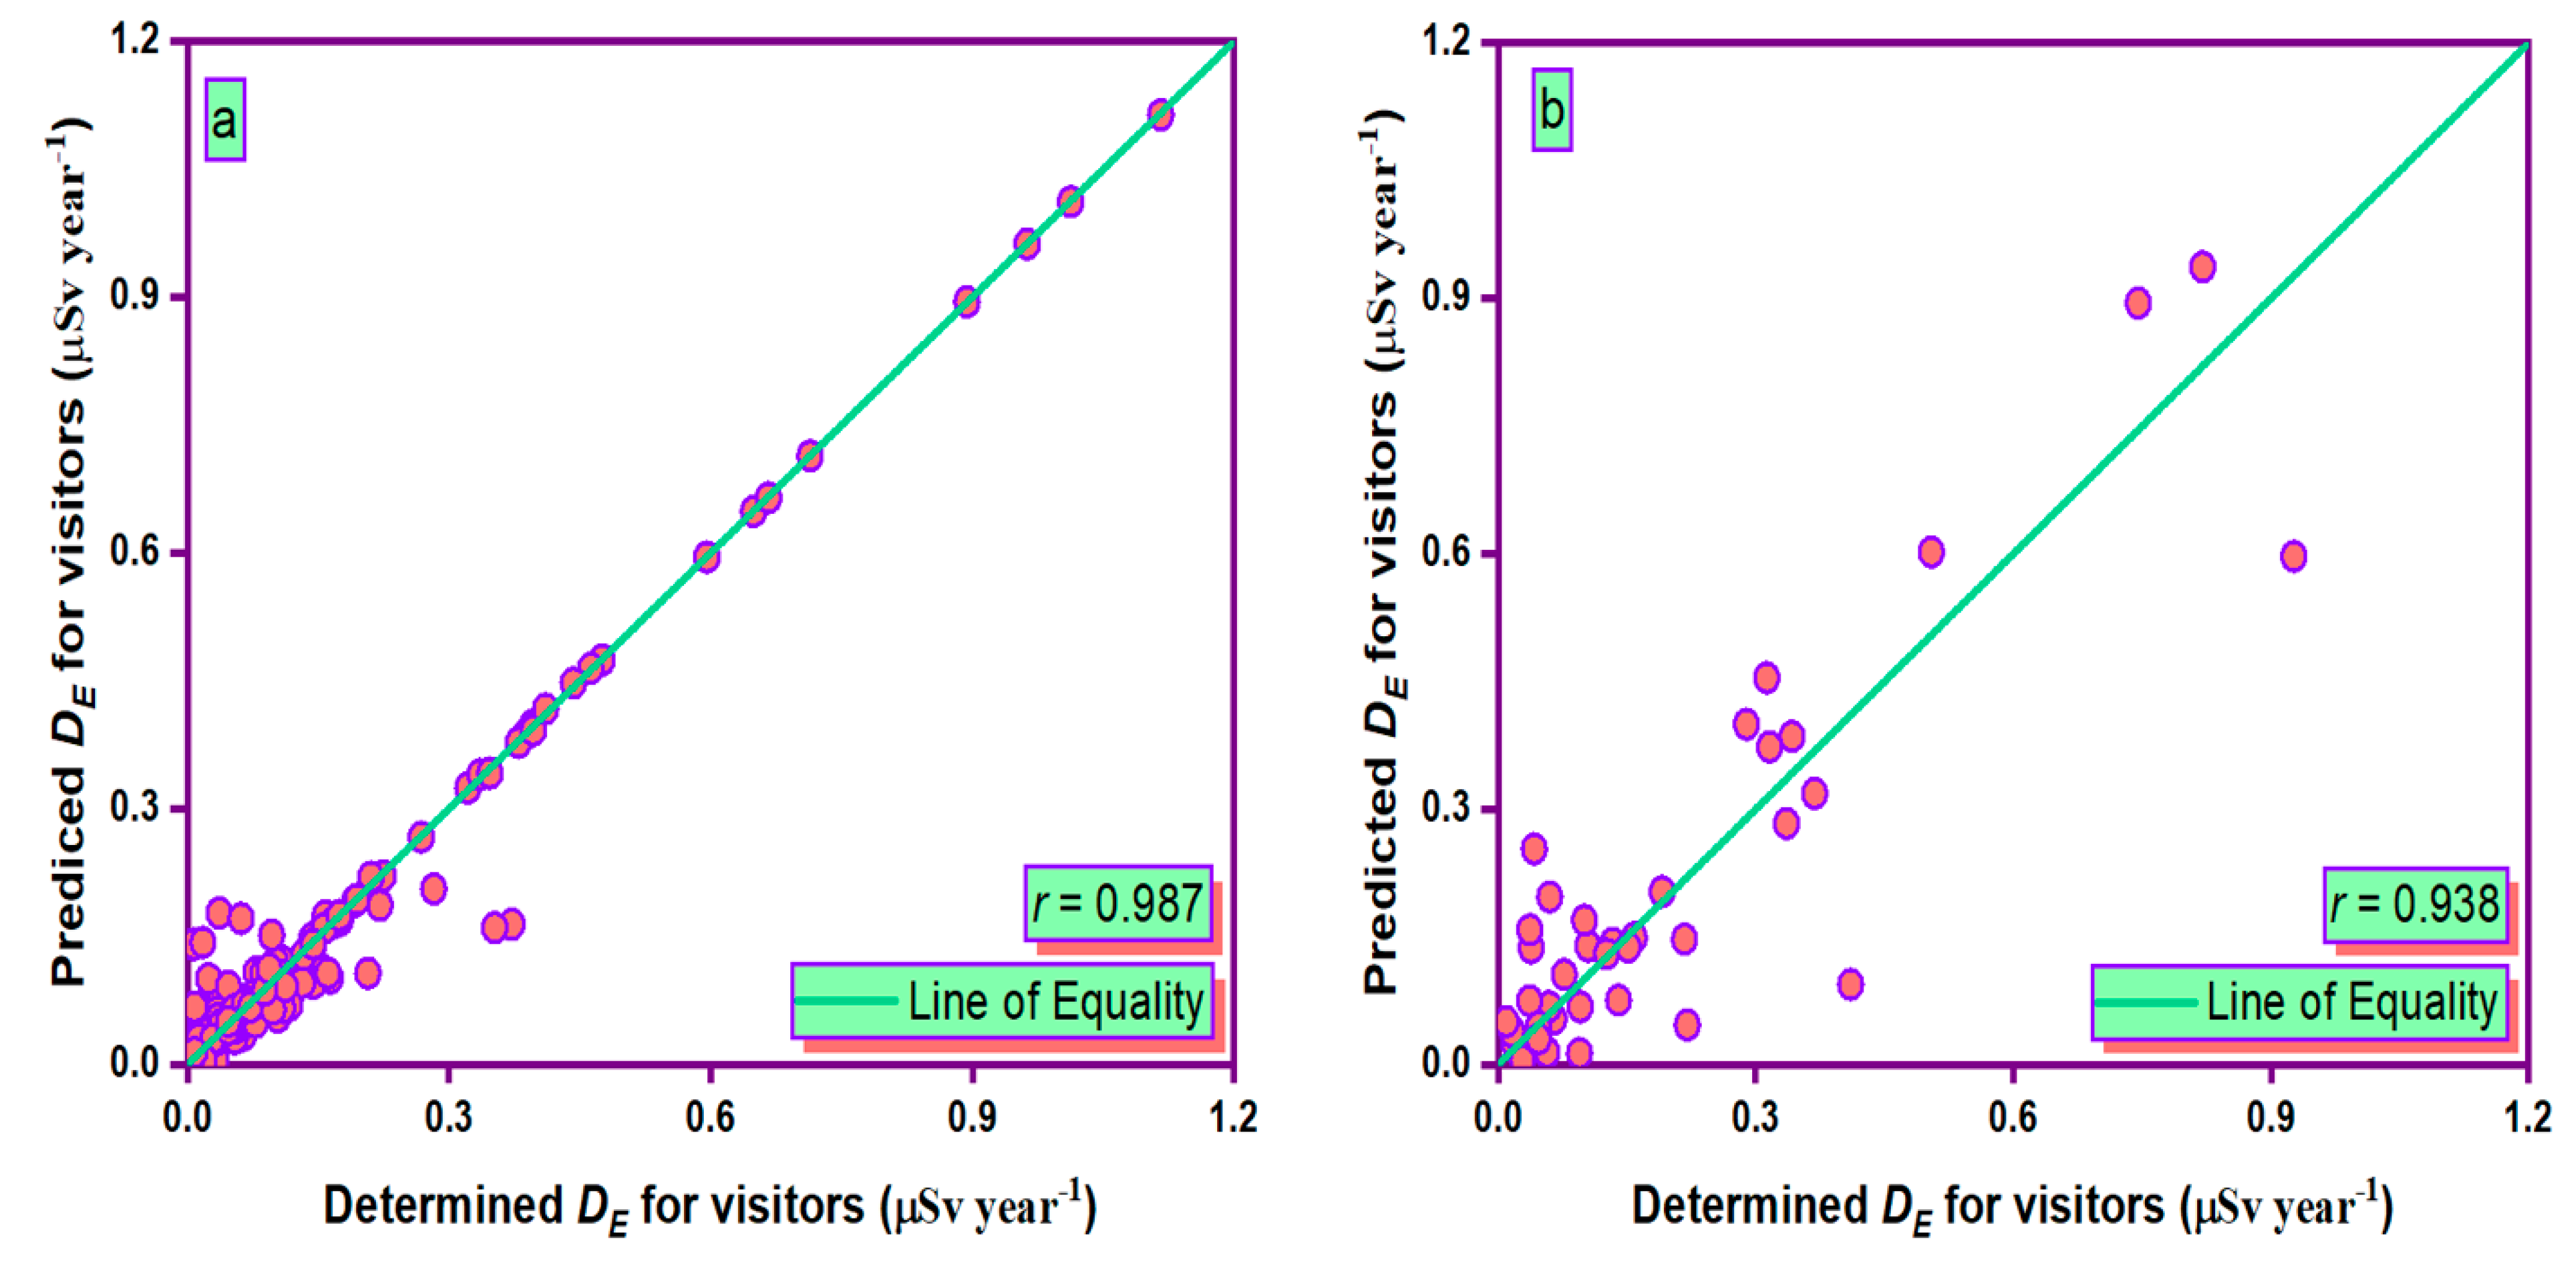
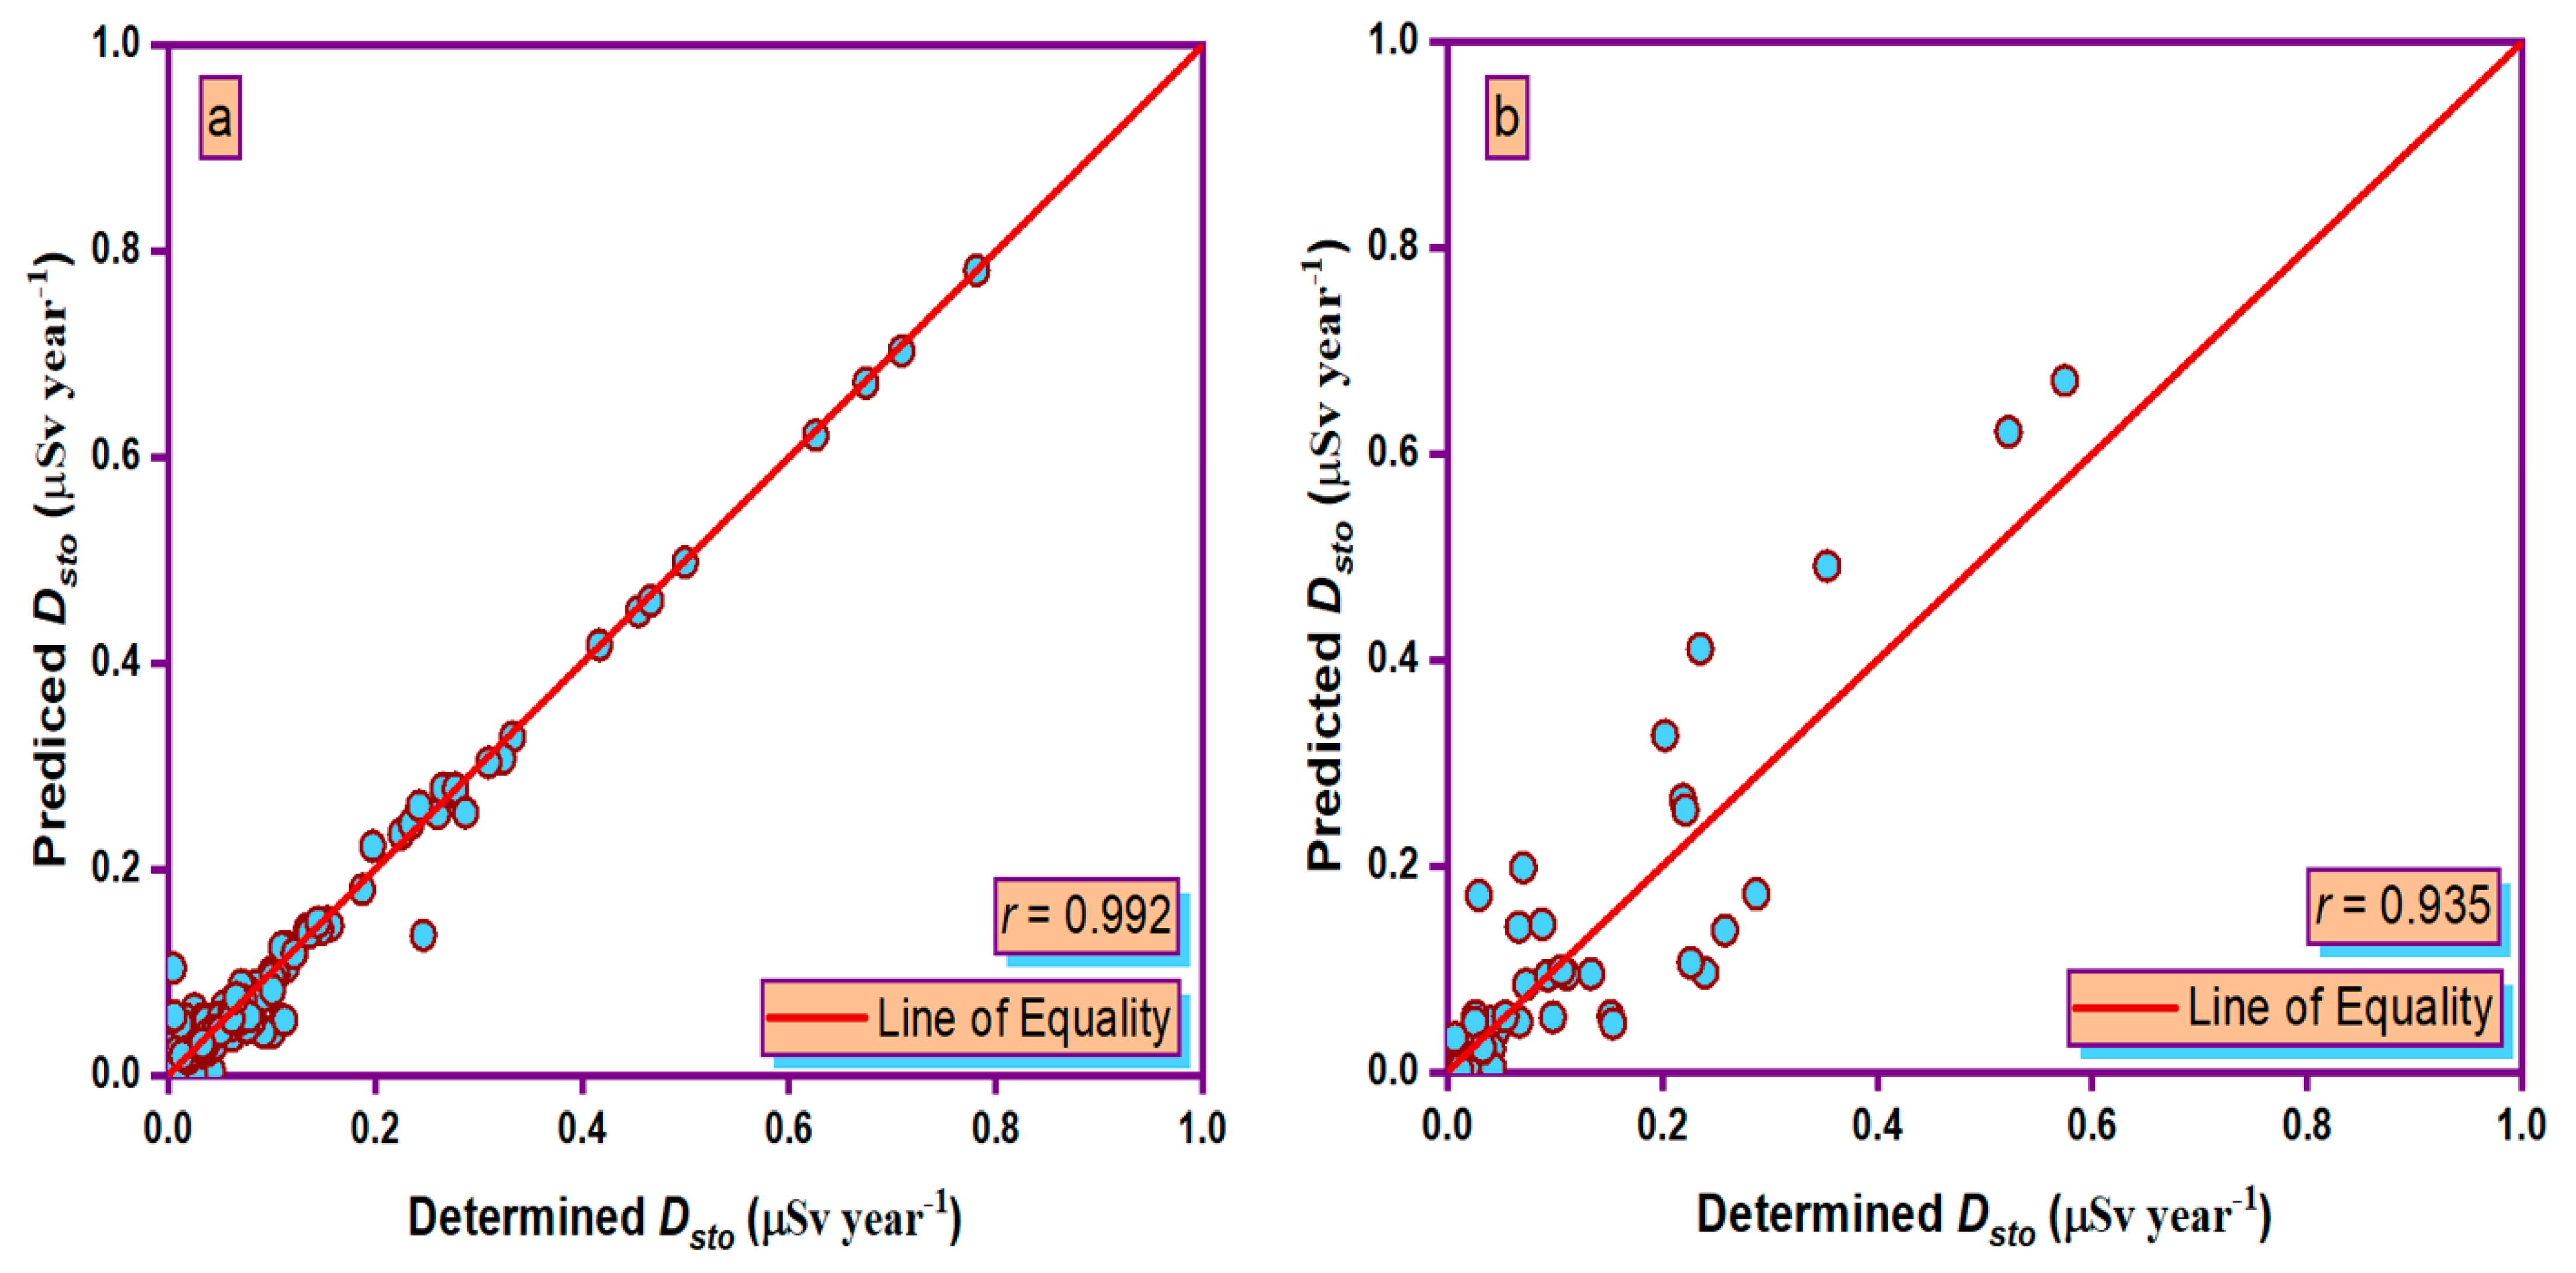
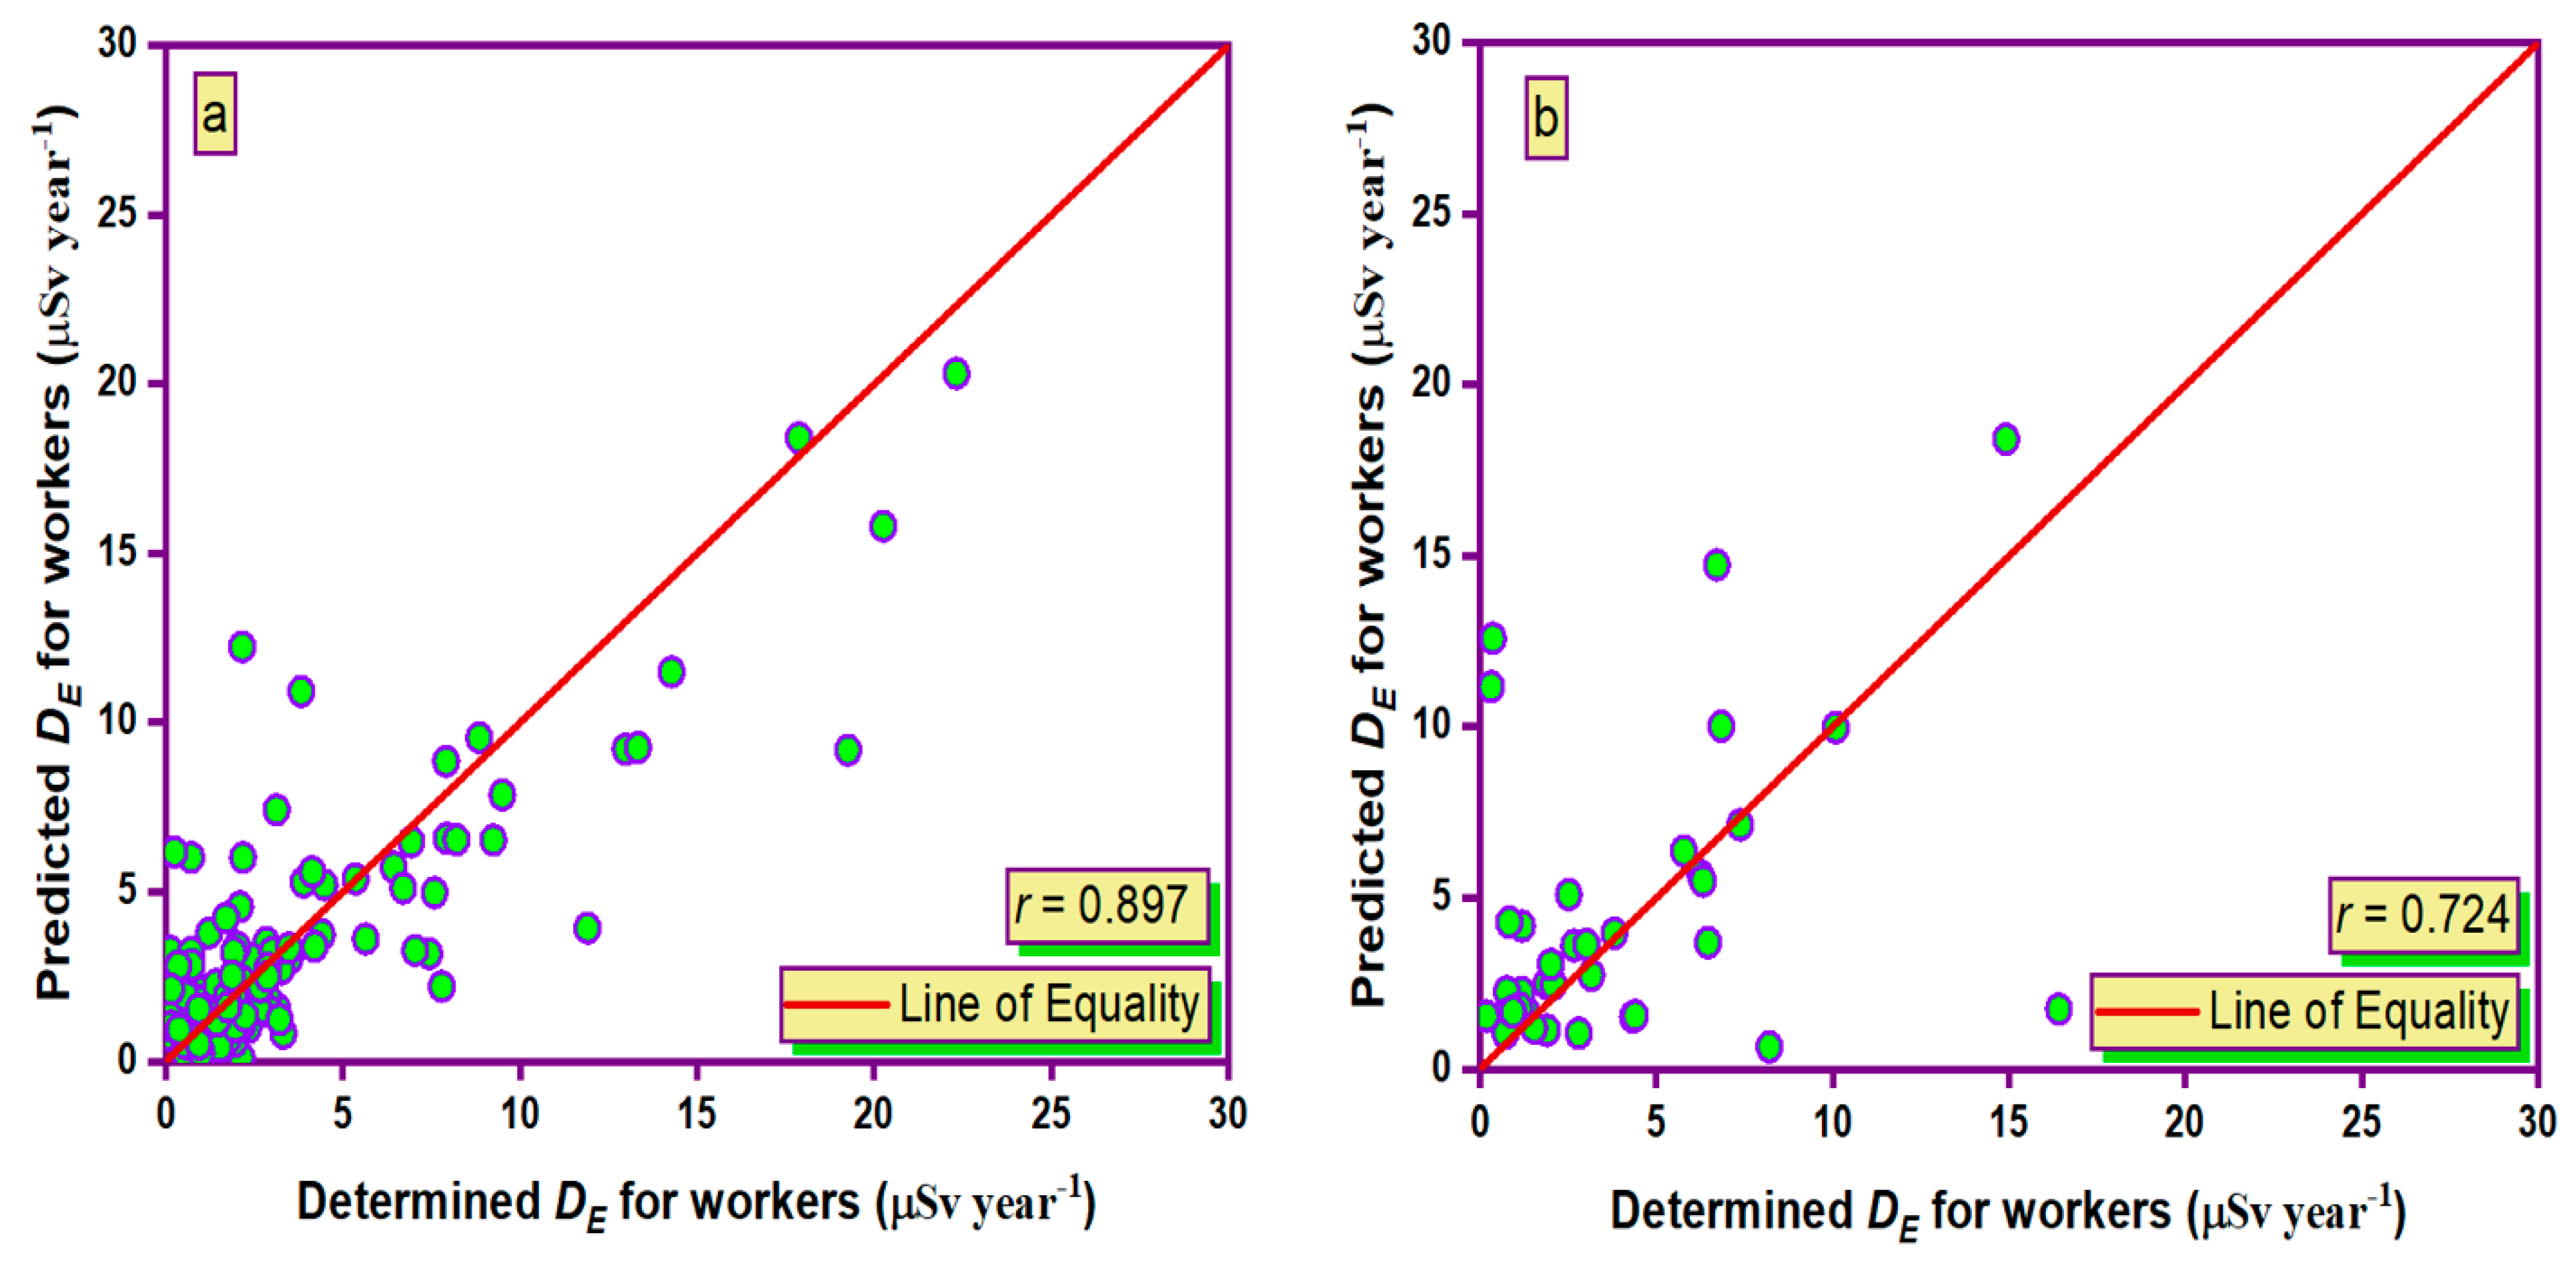
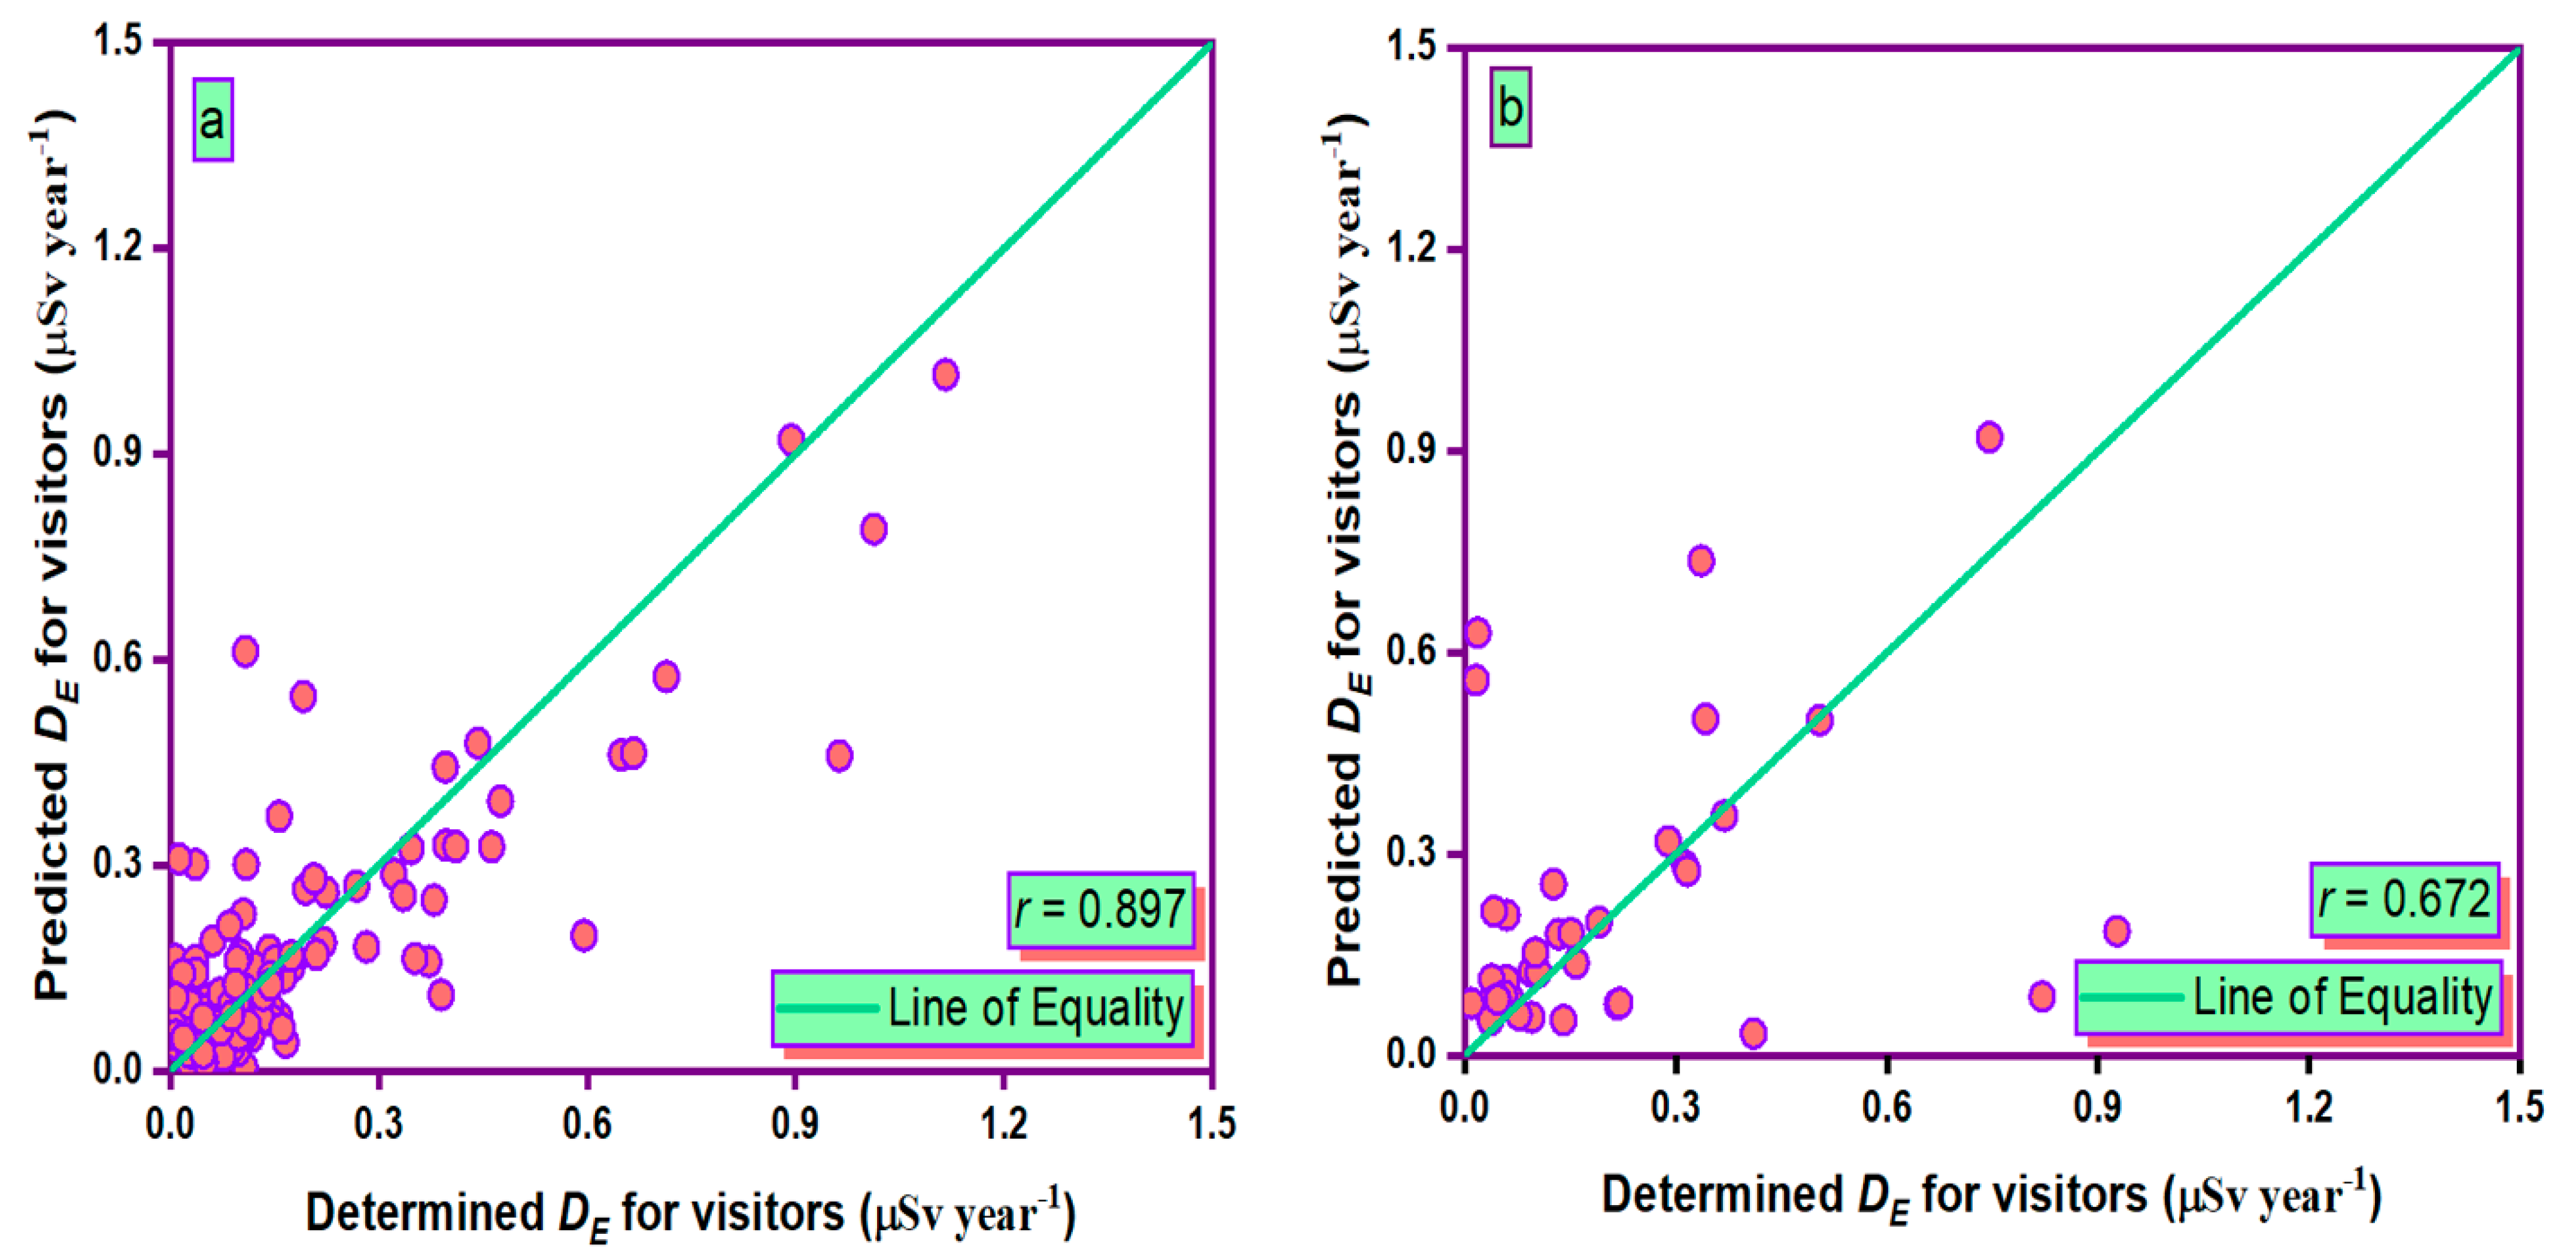
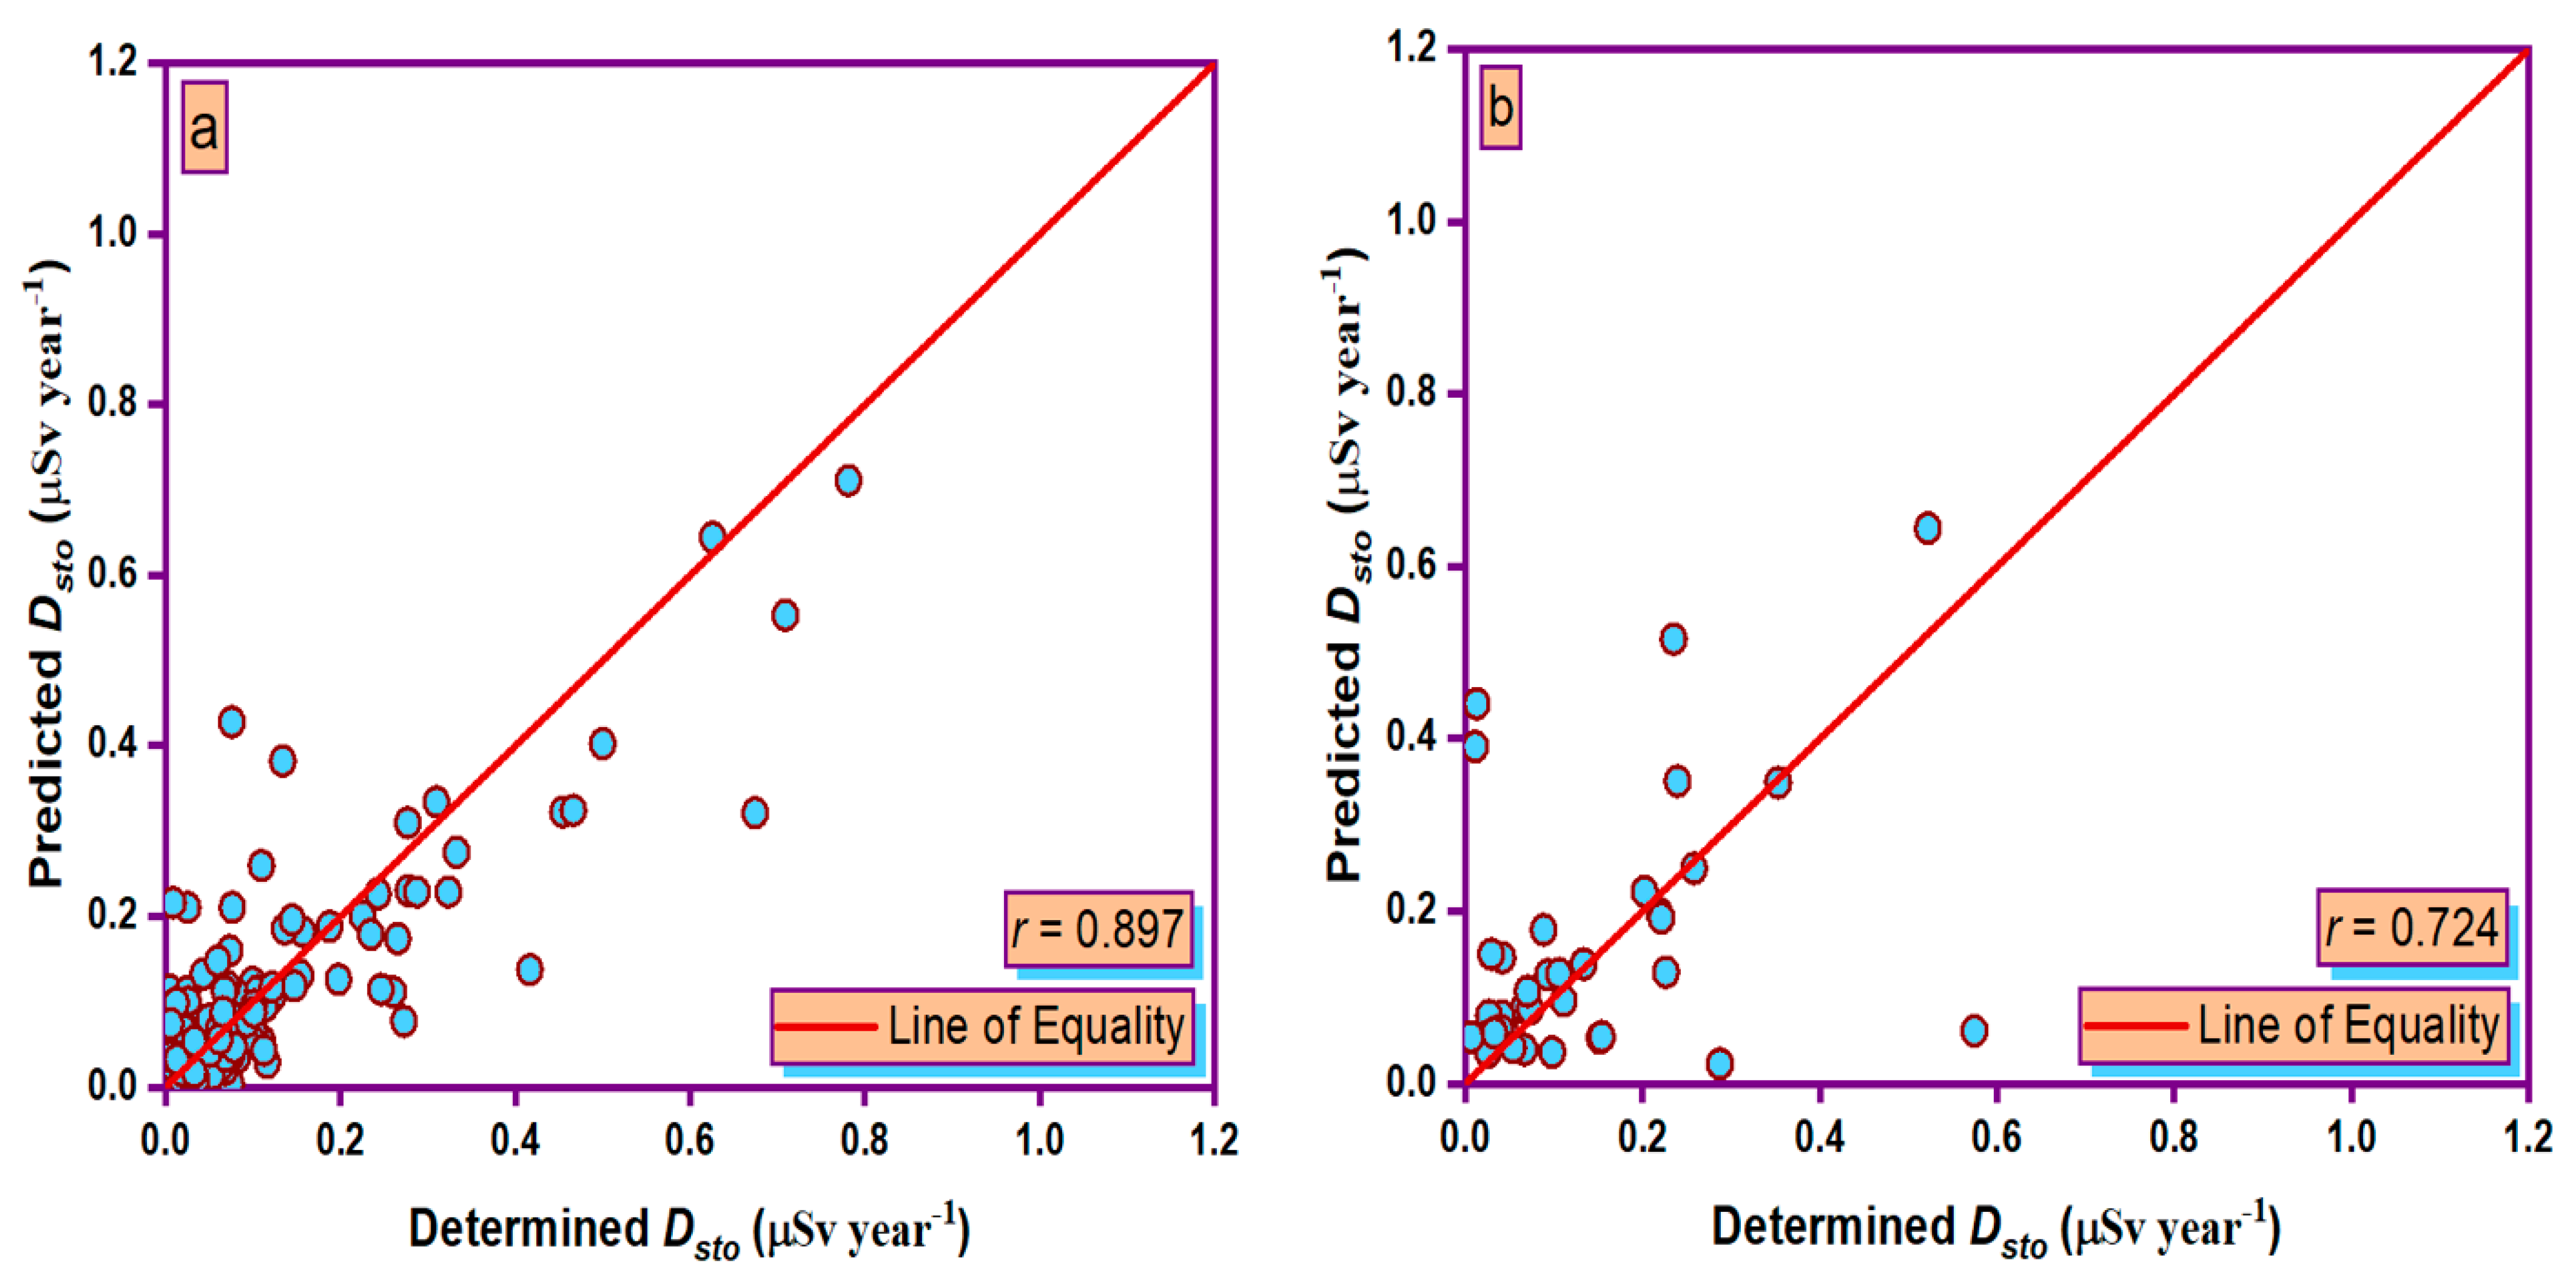
- During the training and testing phases, the MLPANN models produced a higher correlation (r values close to 1) between the determined and predicted four radiological risk parameters of thermal waters than the RBFANN models, indicating that the MLPANN models predicted four radiological risk parameters more accurately.
- MLPANN models had lower MAE, RMSE, RSR, and RAE values than RBFANN models, demonstrating that the MLPANN models outperformed the RBFANN models in predicting four radiological risk parameters of thermal waters.
- The MLPANN and RBFANN models′ rank analysis showed that MLPANN models had higher scores, signifying that MLPANN models achieved better prediction accuracy in the prediction of four radiological risk parameters of thermal waters than RBFANN models
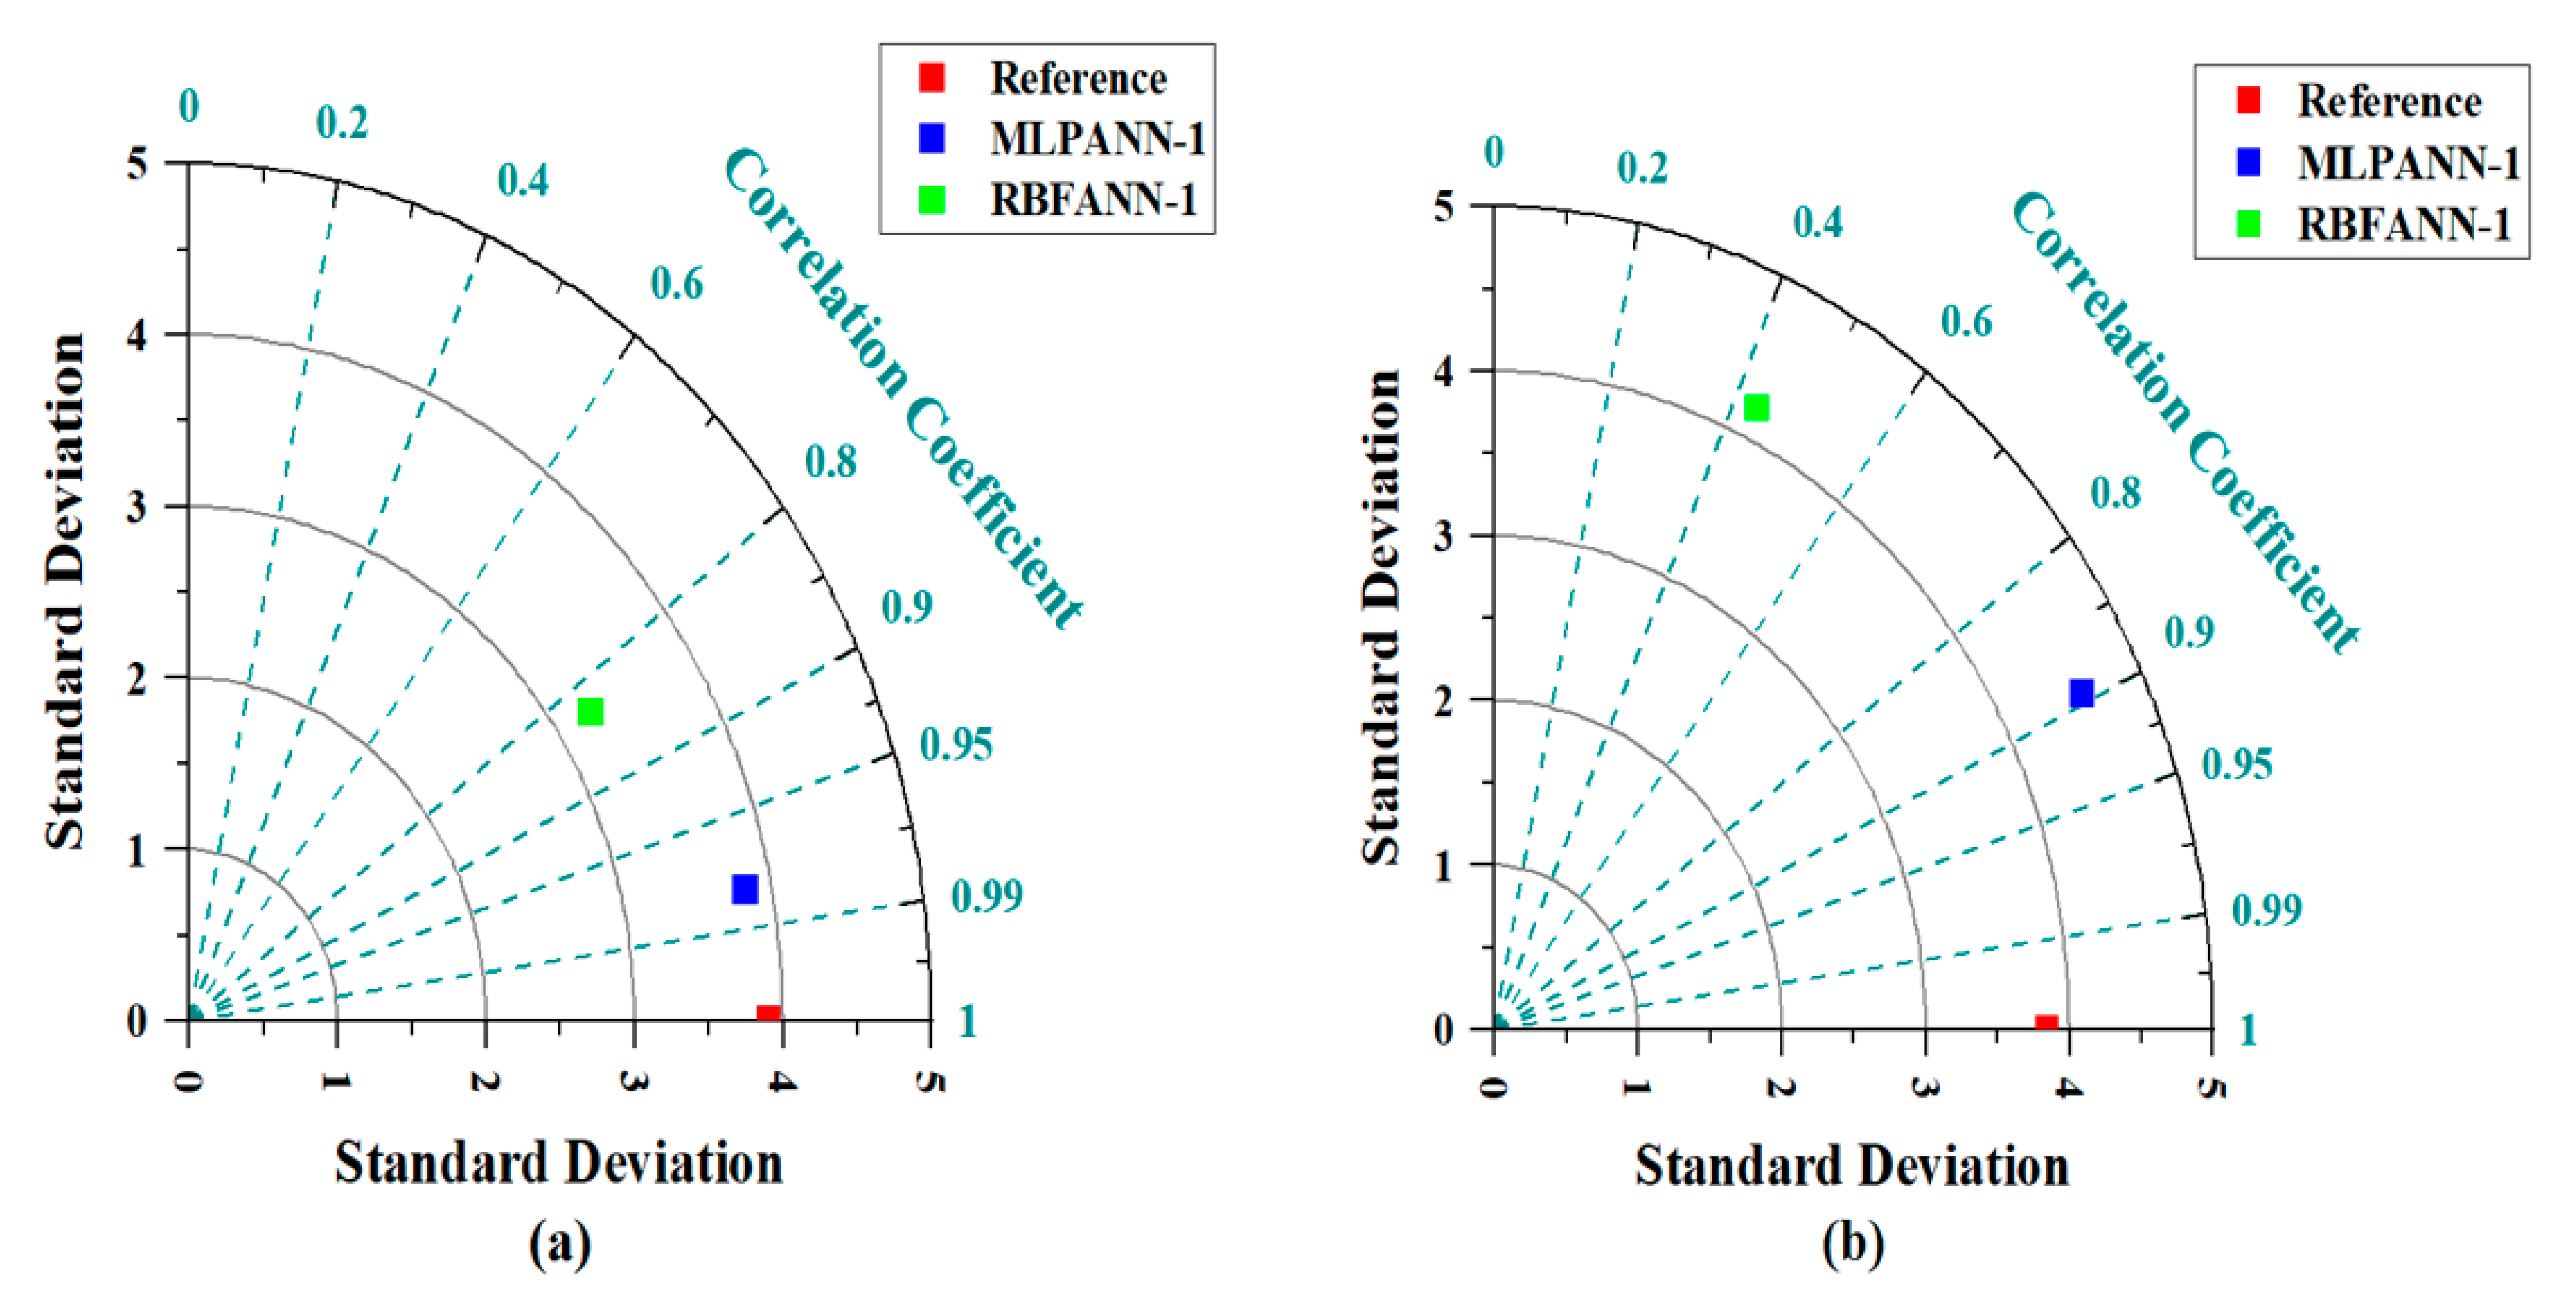
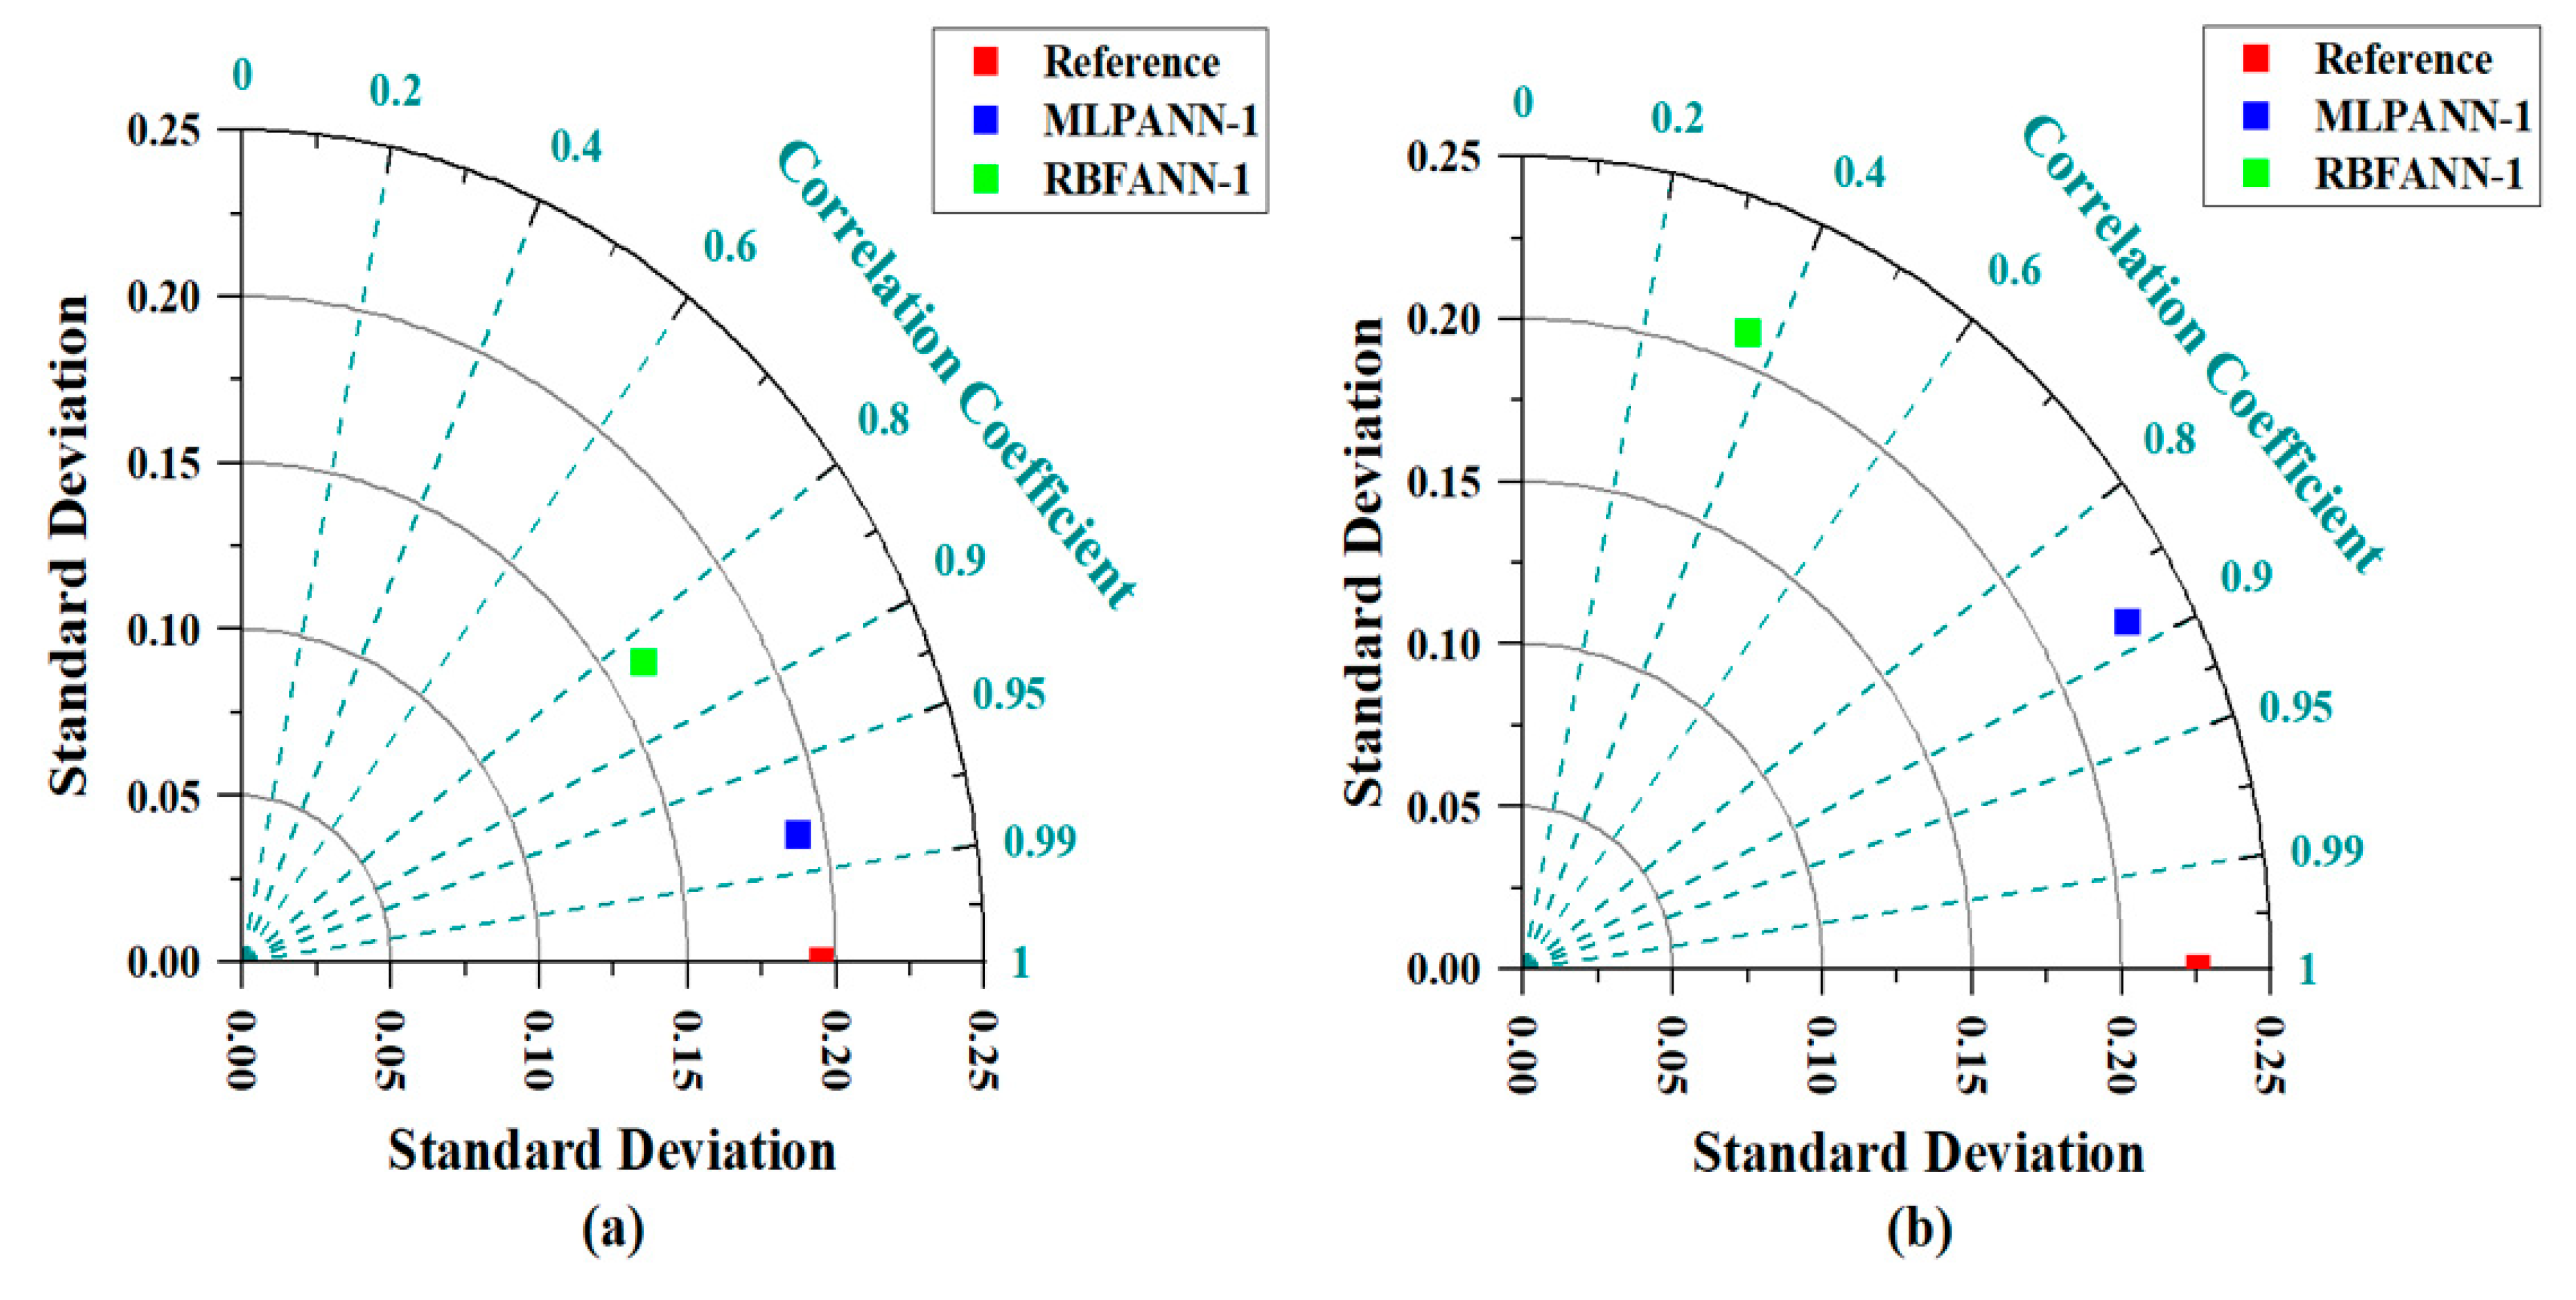
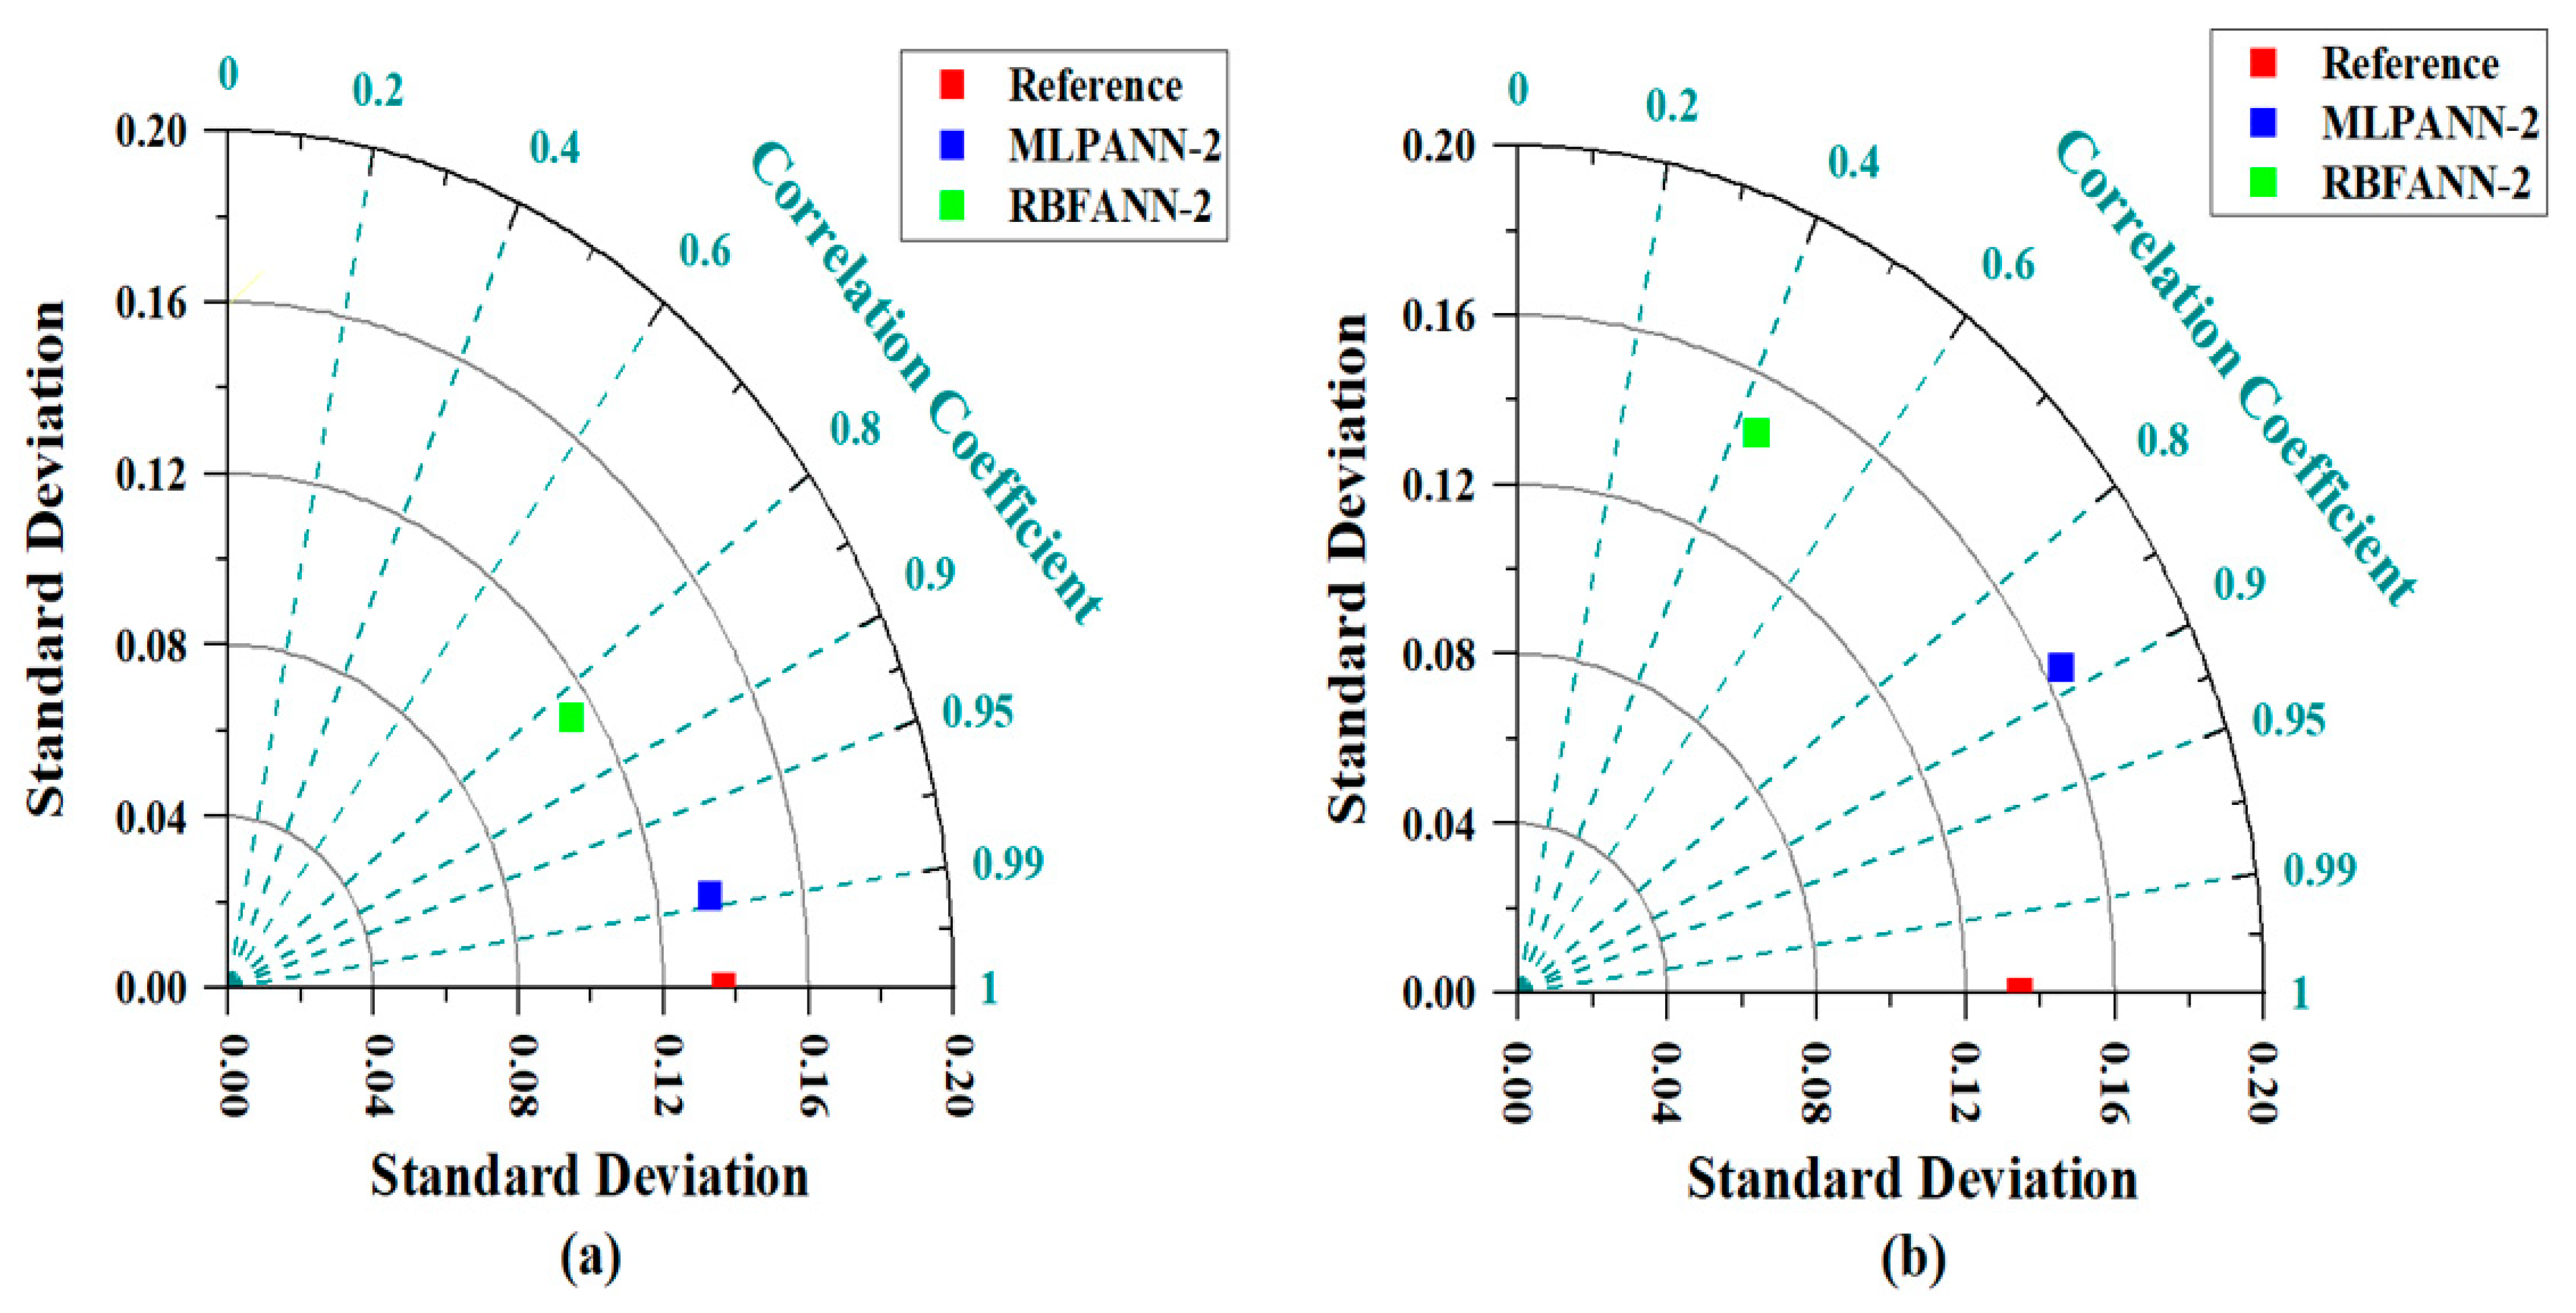
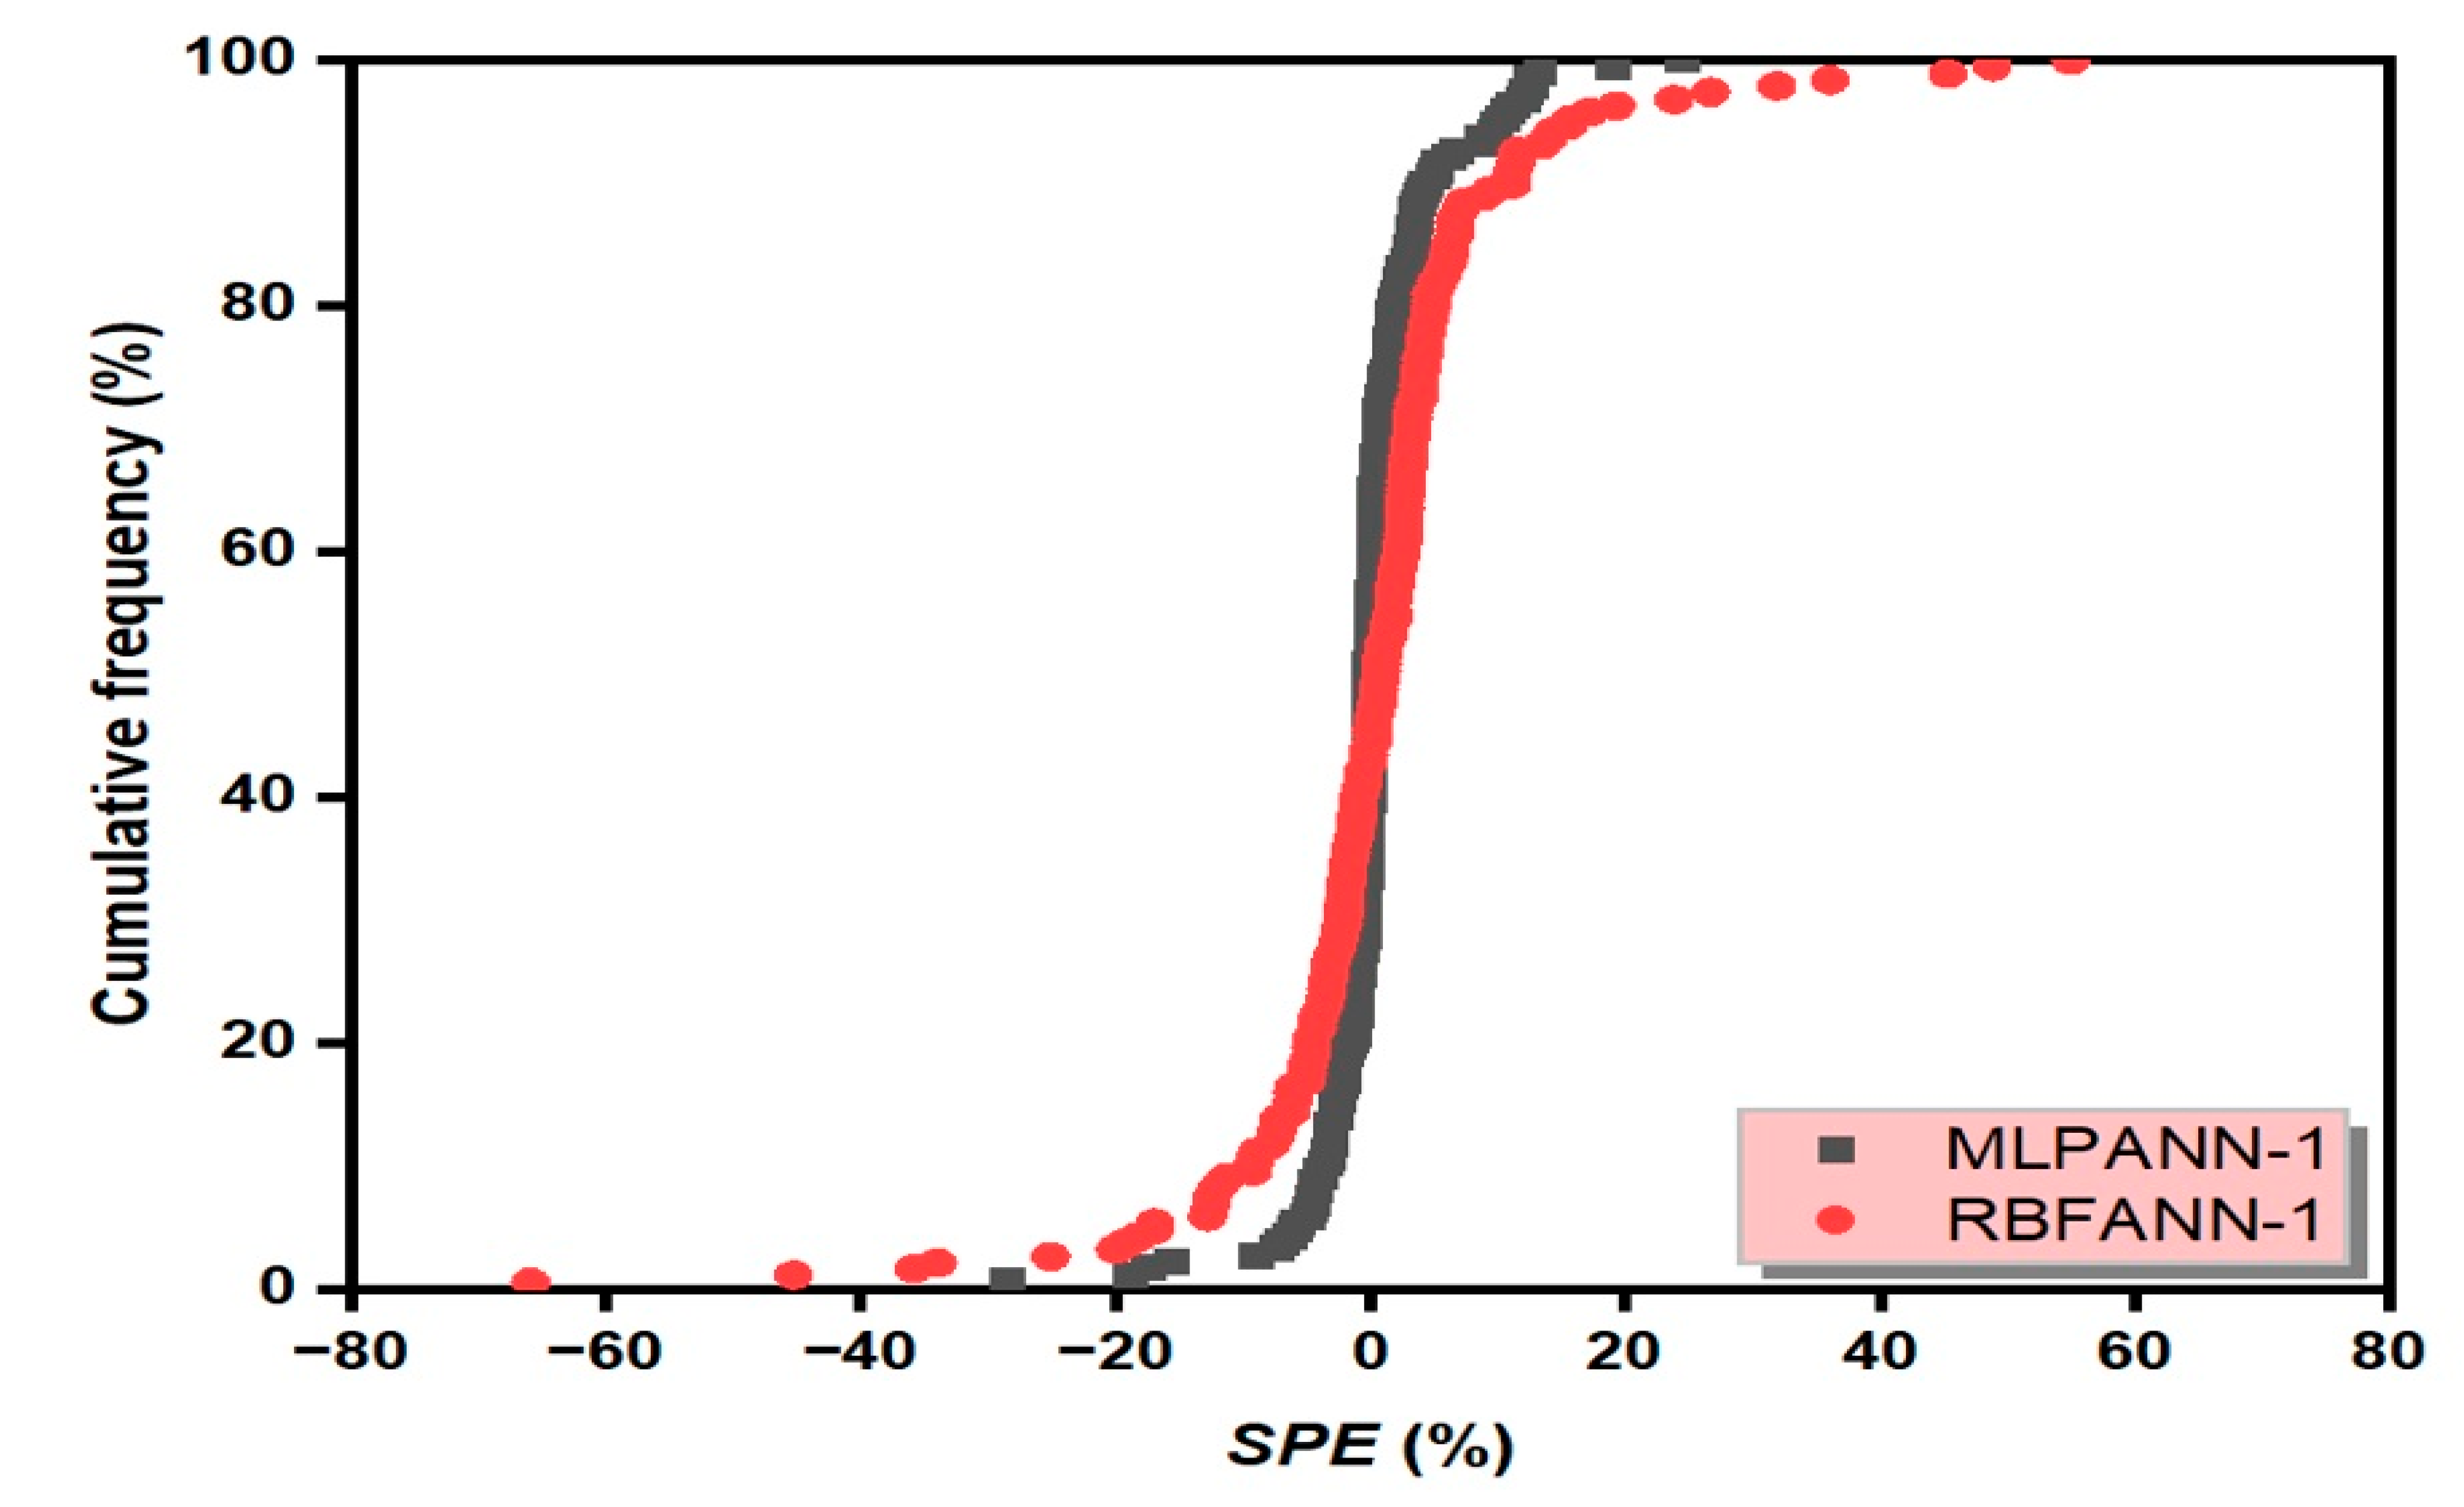
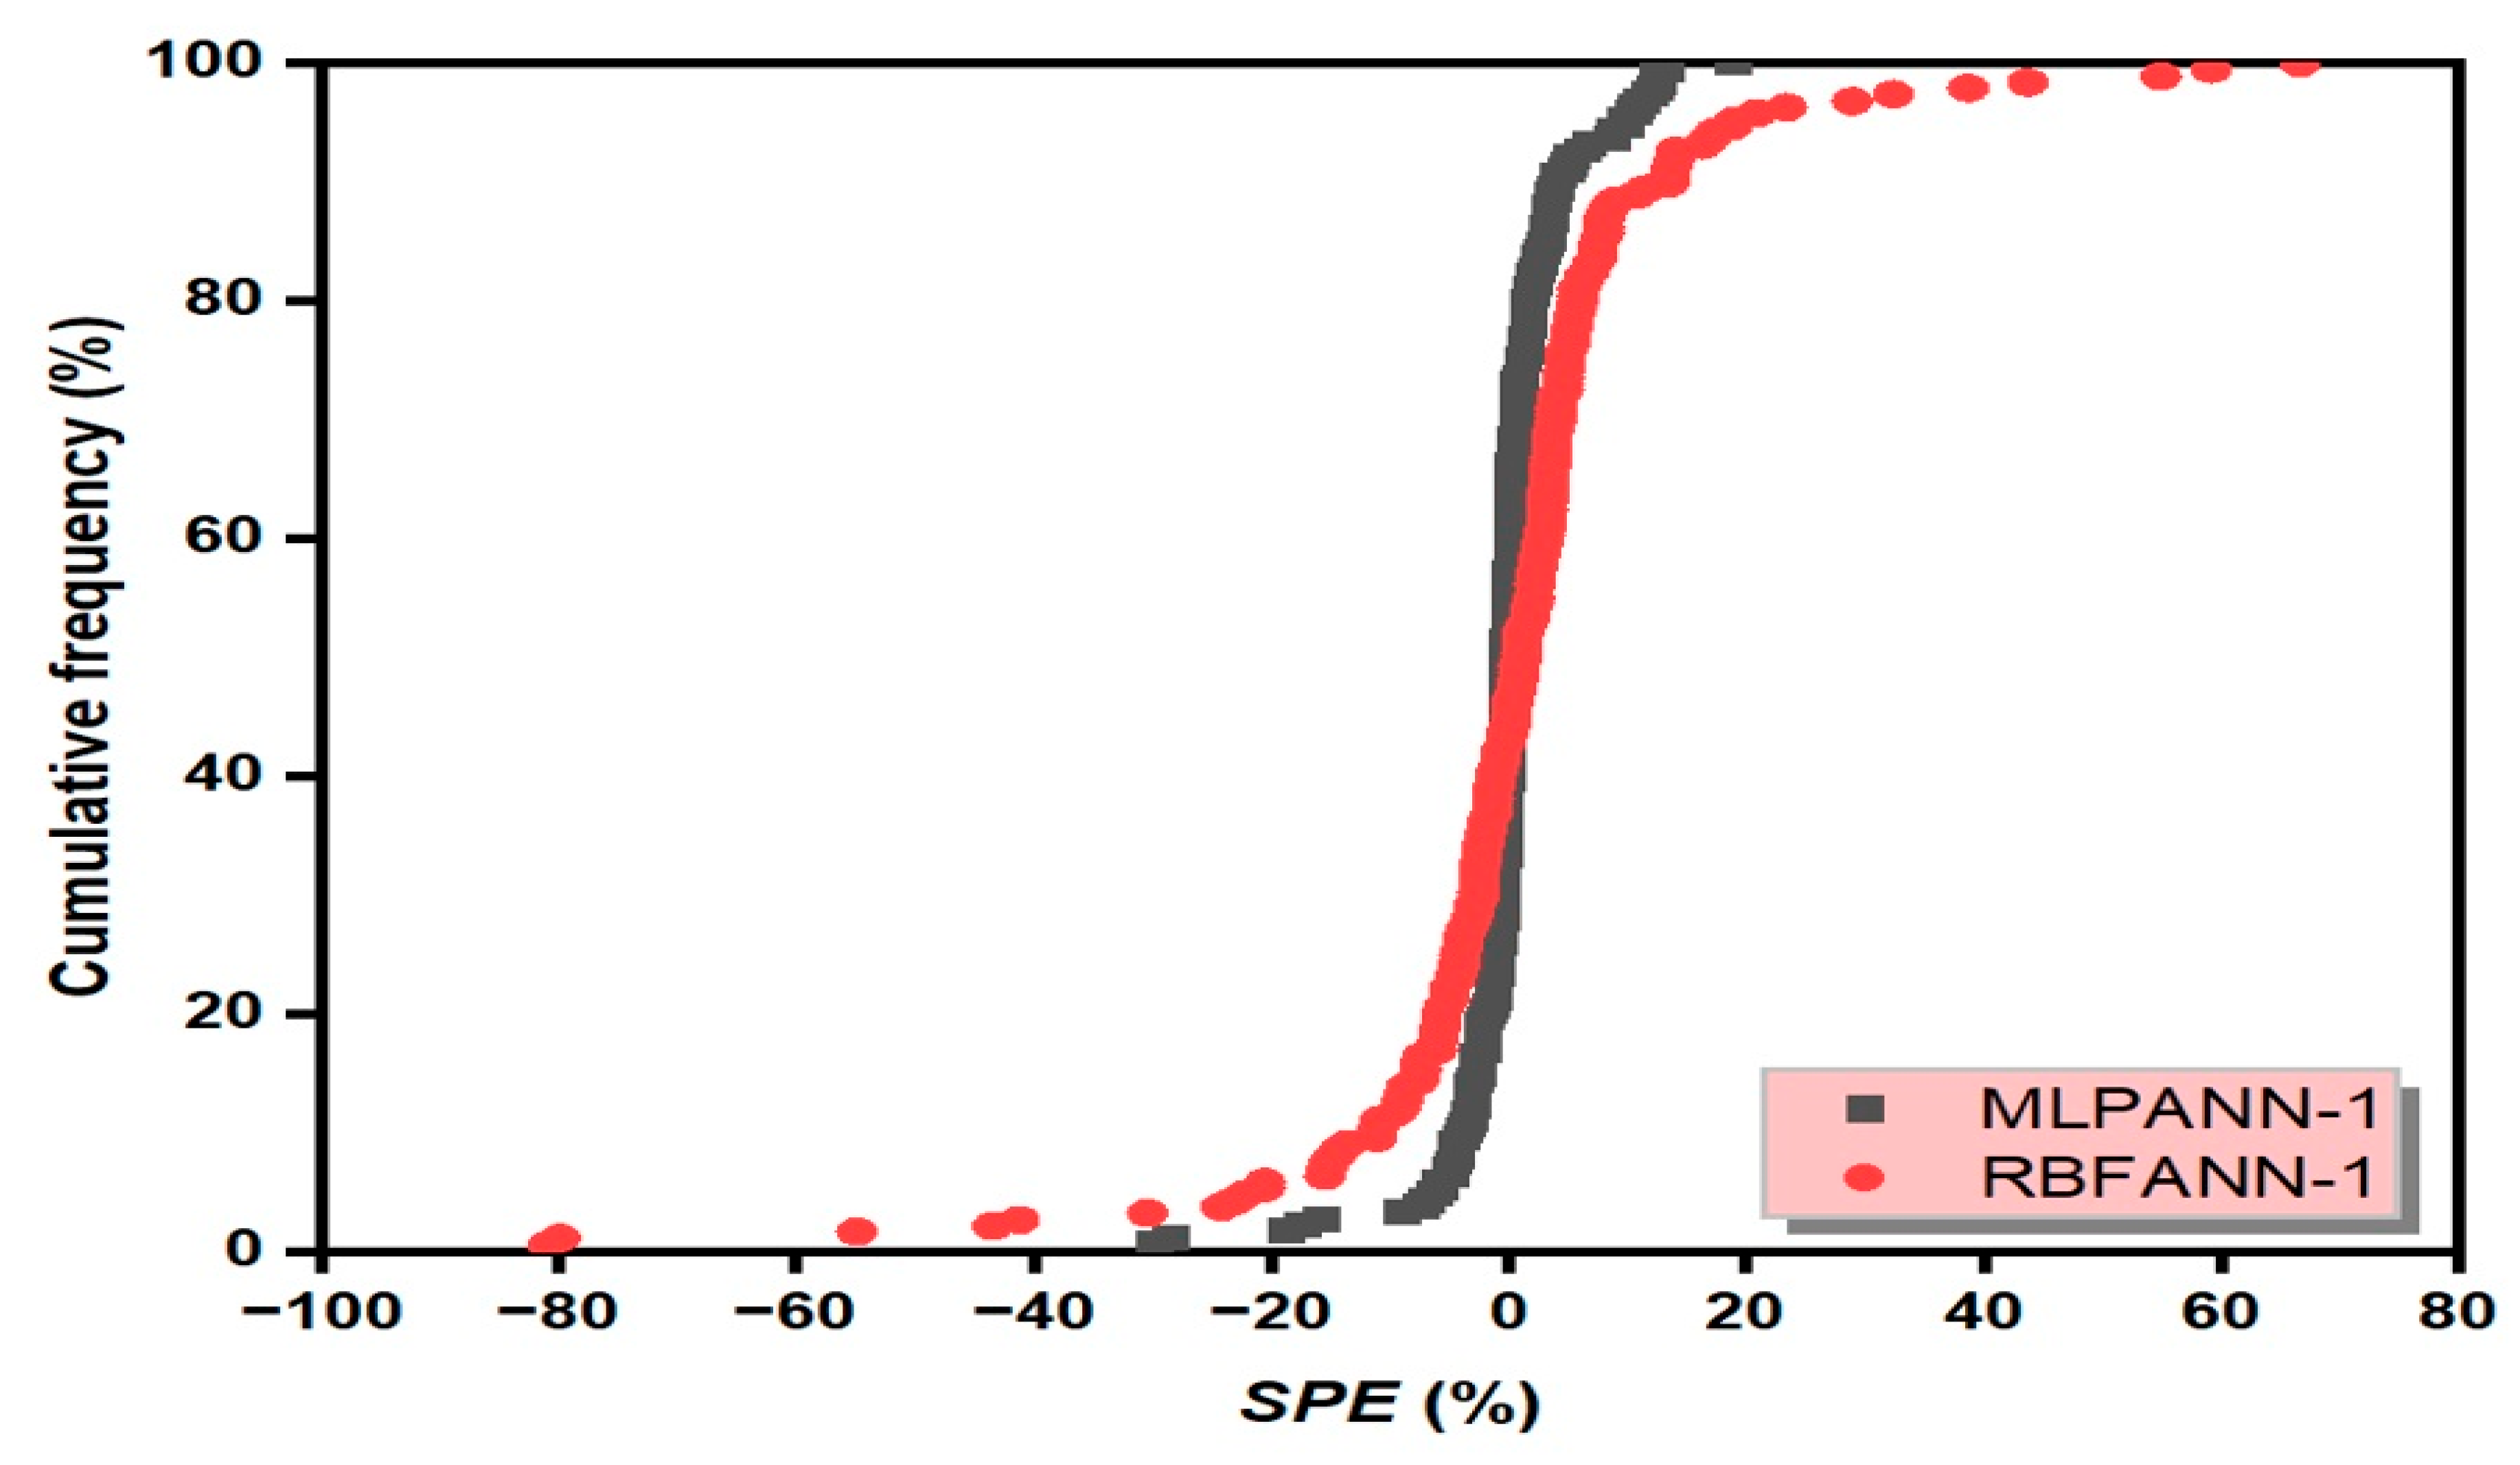
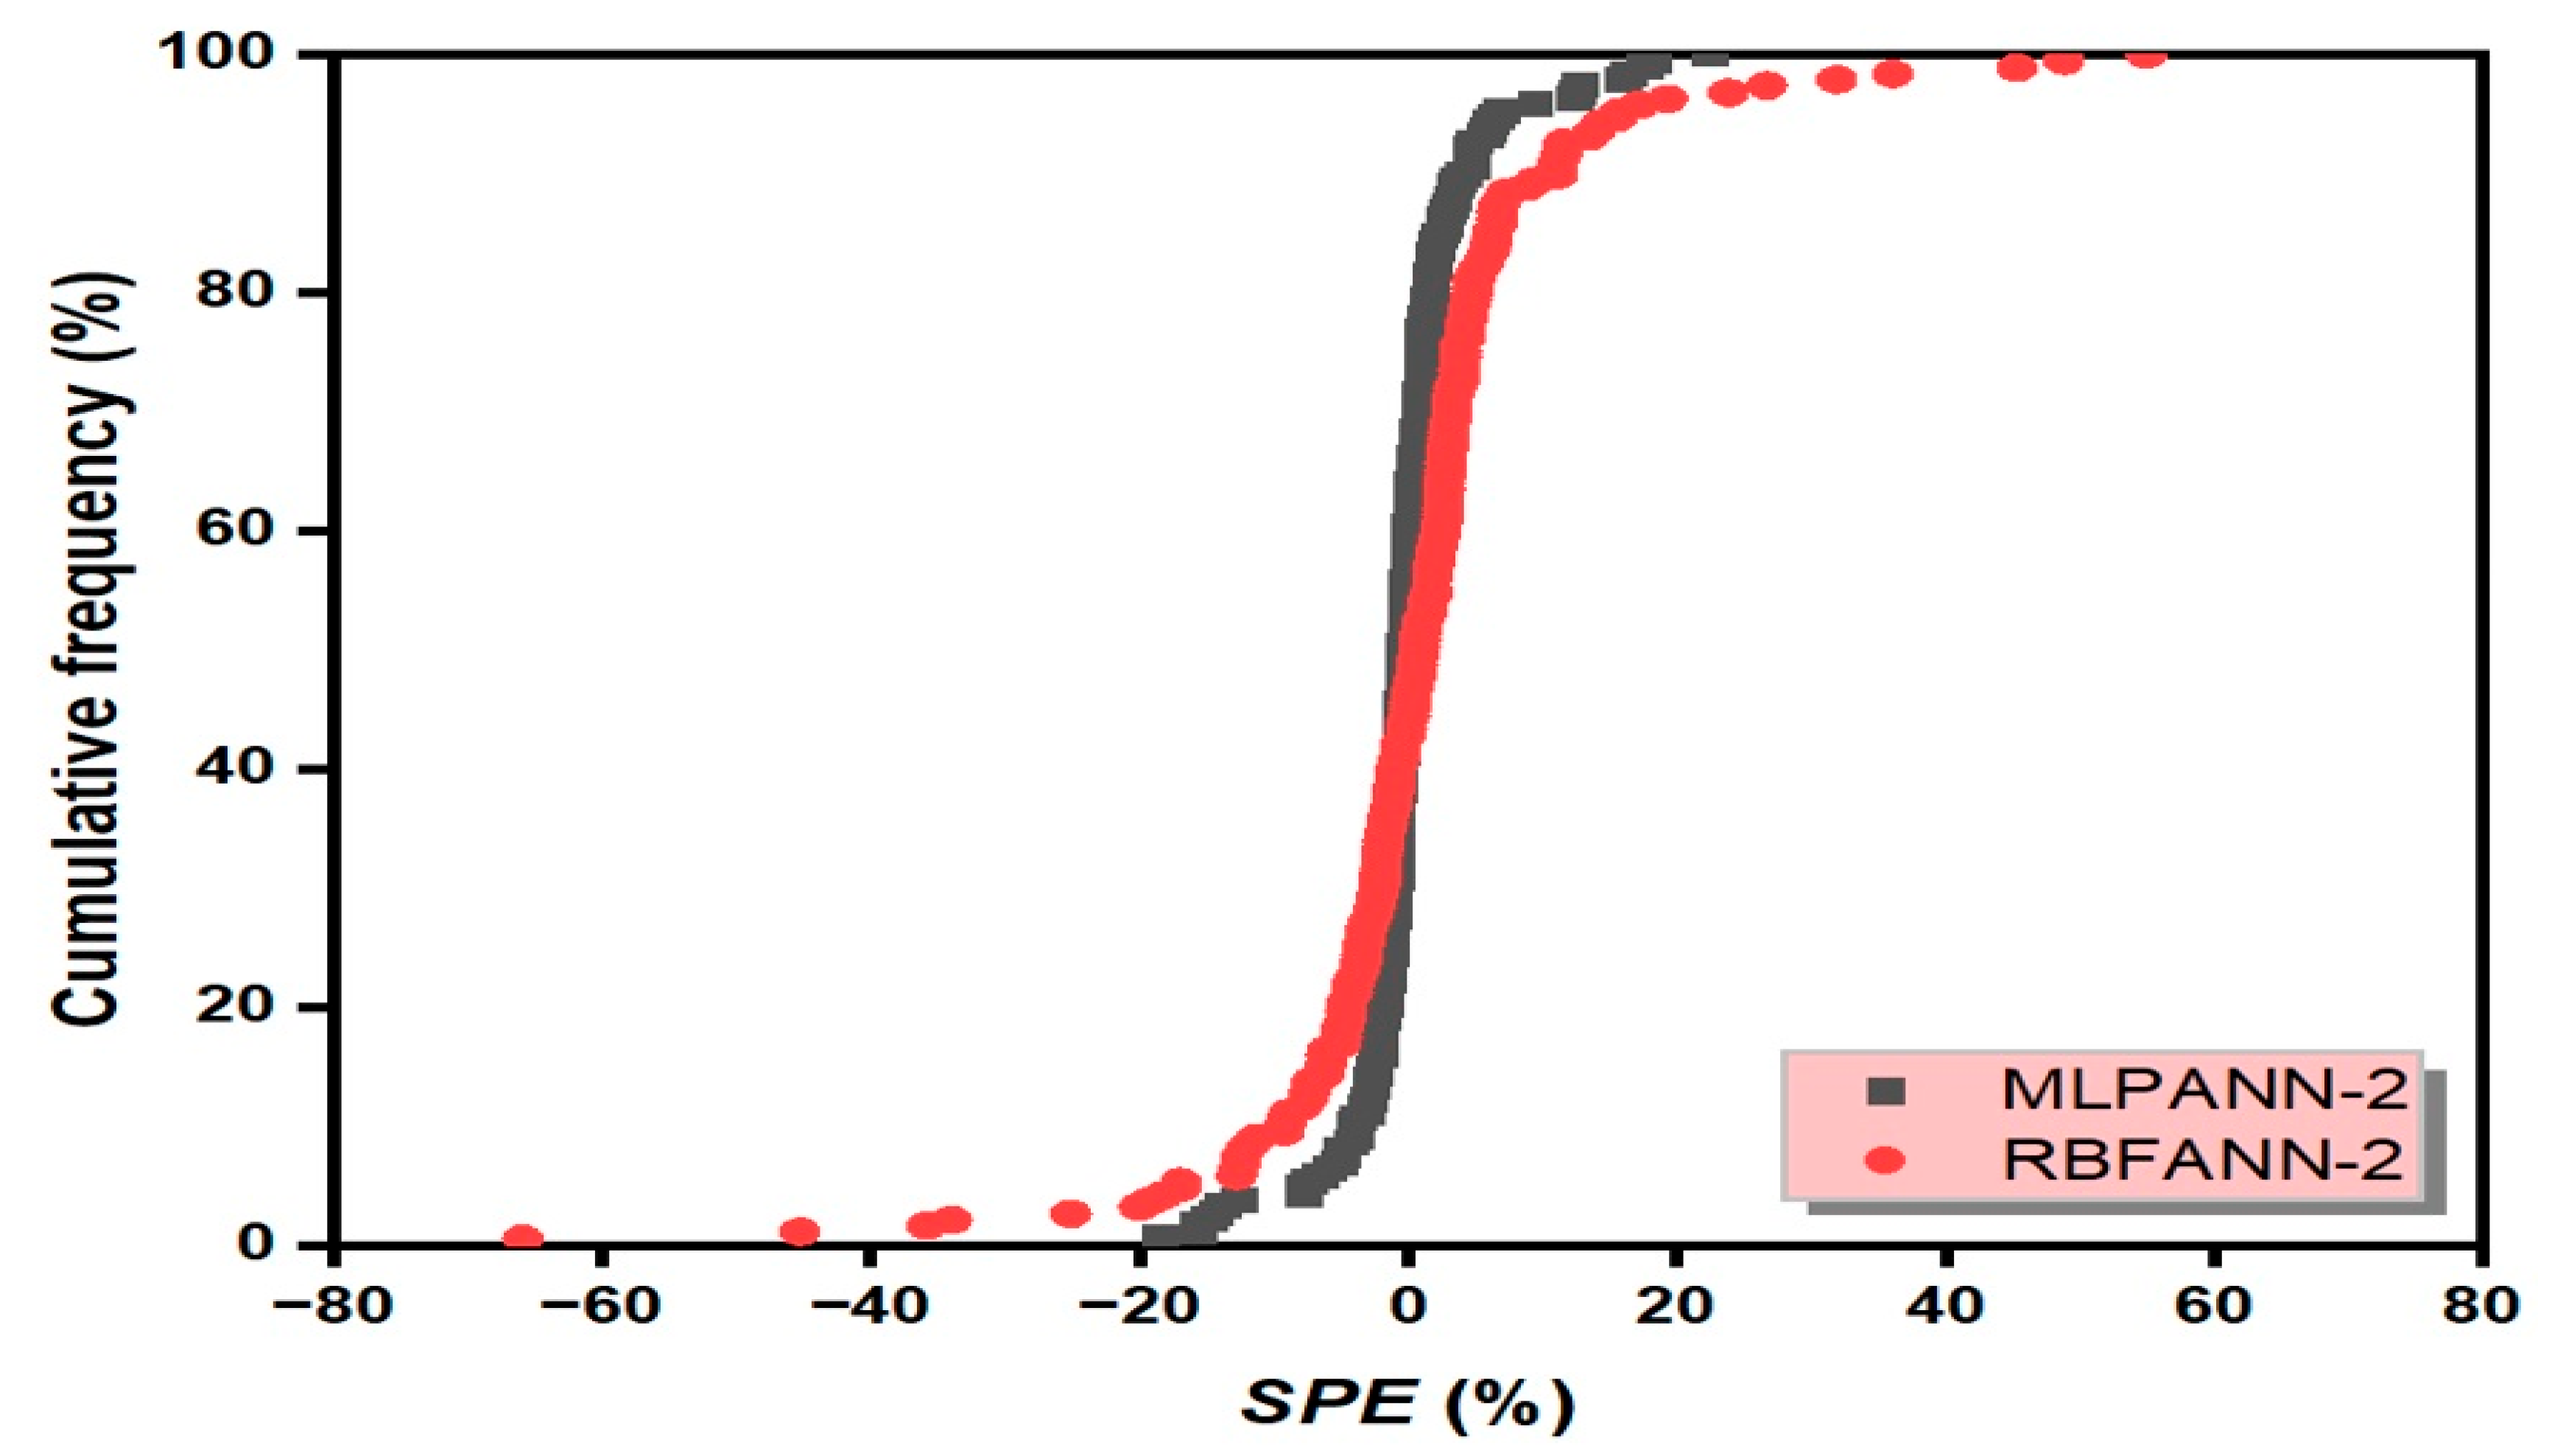
- Taylor and SPE graphs showed that MLPANN models predicted four radiological risk parameters of thermal waters more precisely than RBFANN models.
- Four radiological risk parameters of thermal waters can be predicted reliably and quickly using the developed MLPANN models, as long as the physicochemical properties (EC, pH, and T) of thermal waters are known.
Funding
Data Availability Statement
Conflicts of Interest
Appendix A
| Training | Testing | |||||||||
|---|---|---|---|---|---|---|---|---|---|---|
| Model ID | MAE | RMSE | RSR | RAE | Rank | MAE | RMSE | RSR | RAE | Rank |
| MLPANN-1_A | 2.1457 | 3.4516 | 0.8867 | 0.8692 | 16 | 2.1934 | 3.2304 | 0.8514 | 0.6176 | 9 |
| MLPANN-1_B | 1.9668 | 3.1488 | 0.8089 | 0.7967 | 13 | 2.0849 | 3.1910 | 0.8410 | 0.5870 | 6 |
| MLPANN-1_C | 1.8891 | 3.1571 | 0.8111 | 0.7652 | 14 | 1.9682 | 3.3024 | 0.8704 | 0.5542 | 7 |
| MLPANN-1_D | 1.5873 | 2.8972 | 0.7443 | 0.6430 | 11 | 1.9065 | 3.1562 | 0.8319 | 0.5368 | 5 |
| MLPANN-1_E | 1.2688 | 1.9780 | 0.5082 | 0.5140 | 10 | 2.4096 | 3.6274 | 0.9561 | 0.6784 | 15 |
| MLPANN-1_F | 0.8838 | 1.2392 | 0.3183 | 0.3580 | 8 | 2.3257 | 3.5097 | 0.9250 | 0.6548 | 13 |
| MLPANN-1_G | 0.8326 | 1.1953 | 0.3071 | 0.3373 | 7 | 2.3707 | 3.6539 | 0.9630 | 0.6675 | 16 |
| MLPANN-1_H | 0.6772 | 1.0375 | 0.2665 | 0.2743 | 5 | 2.1858 | 3.7108 | 0.9780 | 0.6154 | 13 |
| MLPANN-1_I | 2.1414 | 3.4390 | 0.8835 | 0.8675 | 15 | 2.2112 | 3.2407 | 0.8541 | 0.6226 | 11 |
| MLPANN-1_J | 1.7540 | 2.8363 | 0.7286 | 0.7105 | 12 | 1.7831 | 2.7057 | 0.7131 | 0.5020 | 3 |
| MLPANN-1_K | 1.2035 | 1.7864 | 0.4589 | 0.4875 | 9 | 1.7522 | 3.1317 | 0.8254 | 0.4933 | 3 |
| MLPANN-1_L | 0.7353 | 1.0576 | 0.2717 | 0.2979 | 6 | 1.9565 | 3.4788 | 0.9169 | 0.5509 | 8 |
| MLPANN-1_M | 0.5214 | 0.8933 | 0.2295 | 0.2112 | 3 | 2.1756 | 3.4702 | 0.9146 | 0.6126 | 10 |
| MLPANN-1_N | 0.6135 | 0.9051 | 0.2325 | 0.2485 | 4 | 2.1340 | 3.7495 | 0.9882 | 0.6008 | 12 |
| MLPANN-1_0 | 0.4502 | 0.7139 | 0.1834 | 0.1824 | 1 | 1.5654 | 2.2512 | 0.5933 | 0.4407 | 2 |
| MLPANN-1_P | 0.4191 | 0.7792 | 0.2002 | 0.1698 | 1 | 1.4653 | 2.0797 | 0.5481 | 0.4126 | 1 |
| Training | Testing | |||||||||
|---|---|---|---|---|---|---|---|---|---|---|
| Model ID | MAE | RMSE | RSR | RAE | Rank | MAE | RMSE | RSR | RAE | Rank |
| MLPANN-1_A | 0.1073 | 0.1726 | 0.8867 | 0.8692 | 16 | 0.1256 | 0.2050 | 0.9204 | 0.7546 | 15 |
| MLPANN-1_B | 0.0983 | 0.1574 | 0.8089 | 0.7966 | 13 | 0.1201 | 0.1917 | 0.8605 | 0.7219 | 12 |
| MLPANN-1_C | 0.0945 | 0.1579 | 0.8111 | 0.7651 | 13 | 0.1143 | 0.1949 | 0.8750 | 0.6869 | 12 |
| MLPANN-1_D | 0.0795 | 0.1425 | 0.7322 | 0.6440 | 11 | 0.1086 | 0.1935 | 0.8685 | 0.6526 | 11 |
| MLPANN-1_E | 0.0634 | 0.0989 | 0.5082 | 0.5139 | 10 | 0.1207 | 0.1818 | 0.8160 | 0.7256 | 10 |
| MLPANN-1_F | 0.0442 | 0.0620 | 0.3183 | 0.3580 | 8 | 0.1252 | 0.1902 | 0.8537 | 0.7523 | 14 |
| MLPANN-1_G | 0.0416 | 0.0598 | 0.3071 | 0.3372 | 7 | 0.1175 | 0.1810 | 0.8124 | 0.7061 | 9 |
| MLPANN-1_H | 0.0339 | 0.0519 | 0.2665 | 0.2743 | 5 | 0.0934 | 0.1372 | 0.6160 | 0.5614 | 4 |
| MLPANN-1_I | 0.1070 | 0.1720 | 0.8835 | 0.8668 | 15 | 0.1264 | 0.2048 | 0.9196 | 0.7597 | 16 |
| MLPANN-1_J | 0.0877 | 0.1418 | 0.7286 | 0.7104 | 12 | 0.1050 | 0.1826 | 0.8196 | 0.6313 | 8 |
| MLPANN-1_K | 0.0602 | 0.0893 | 0.4589 | 0.4875 | 9 | 0.1035 | 0.1848 | 0.8296 | 0.6220 | 7 |
| MLPANN-1_L | 0.0368 | 0.0529 | 0.2717 | 0.2978 | 6 | 0.0819 | 0.1211 | 0.5436 | 0.4925 | 2 |
| MLPANN-1_M | 0.0261 | 0.0447 | 0.2295 | 0.2112 | 3 | 0.1045 | 0.1659 | 0.7448 | 0.6281 | 6 |
| MLPANN-1_N | 0.0307 | 0.0453 | 0.2325 | 0.2485 | 4 | 0.0908 | 0.1579 | 0.7090 | 0.5458 | 5 |
| MLPANN-1_0 | 0.0225 | 0.0357 | 0.1834 | 0.1824 | 1 | 0.0891 | 0.1387 | 0.6225 | 0.5357 | 3 |
| MLPANN-1_P | 0.0210 | 0.0390 | 0.2002 | 0.1698 | 1 | 0.0748 | 0.1082 | 0.4858 | 0.4492 | 1 |
| Training | Testing | |||||||||
|---|---|---|---|---|---|---|---|---|---|---|
| Model ID | MAE | RMSE | RSR | RAE | Rank | MAE | RMSE | RSR | RAE | Rank |
| MLPANN-2_A | 0.6243 | 1.0012 | 0.8819 | 0.8671 | 16 | 0.6558 | 0.9564 | 0.8643 | 0.9343 | 15 |
| MLPANN-2_B | 0.5533 | 0.9023 | 0.7948 | 0.7684 | 14 | 0.5920 | 0.9186 | 0.8301 | 0.8435 | 6 |
| MLPANN-2_C | 0.5257 | 0.8707 | 0.7669 | 0.7301 | 12 | 0.5773 | 0.8971 | 0.8107 | 0.8224 | 3 |
| MLPANN-2_D | 0.3267 | 0.4705 | 0.4144 | 0.4538 | 10 | 0.5153 | 0.9839 | 0.8891 | 0.7341 | 7 |
| MLPANN-2_E | 0.3176 | 0.4313 | 0.3799 | 0.4411 | 8 | 0.6113 | 1.0081 | 0.9109 | 0.8709 | 16 |
| MLPANN-2_F | 0.2766 | 0.4050 | 0.3568 | 0.3841 | 7 | 0.6105 | 0.9989 | 0.9026 | 0.8698 | 13 |
| MLPANN-2_G | 0.2370 | 0.3366 | 0.2964 | 0.3292 | 6 | 0.5185 | 0.9815 | 0.8869 | 0.7387 | 8 |
| MLPANN-2_H | 0.2266 | 0.3270 | 0.2880 | 0.3147 | 5 | 0.5617 | 1.0445 | 0.9438 | 0.8003 | 11 |
| MLPANN-2_I | 0.6068 | 0.9979 | 0.8790 | 0.8427 | 15 | 0.6554 | 0.9553 | 0.8632 | 0.9337 | 12 |
| MLPANN-2_J | 0.5492 | 0.8909 | 0.7847 | 0.7628 | 13 | 0.5708 | 0.9279 | 0.8385 | 0.8132 | 4 |
| MLPANN-2_K | 0.3801 | 0.5856 | 0.5158 | 0.5280 | 11 | 0.5509 | 0.8967 | 0.8103 | 0.7849 | 2 |
| MLPANN-2_L | 0.3240 | 0.4578 | 0.4032 | 0.4501 | 9 | 0.5575 | 0.9420 | 0.8513 | 0.7943 | 5 |
| MLPANN-2_M | 0.1766 | 0.2934 | 0.2584 | 0.2452 | 4 | 0.6125 | 0.8325 | 0.7523 | 0.8727 | 9 |
| MLPANN-2_N | 0.1142 | 0.1803 | 0.1588 | 0.1586 | 1 | 0.4730 | 0.6418 | 0.5799 | 0.6738 | 1 |
| MLPANN-2_0 | 0.1139 | 0.1890 | 0.1664 | 0.1581 | 1 | 0.5922 | 0.9379 | 0.8475 | 0.8438 | 10 |
| MLPANN-2_P | 0.1452 | 0.2401 | 0.2115 | 0.2017 | 3 | 0.6506 | 0.9640 | 0.8711 | 0.9269 | 14 |
| Training | Testing | |||||||||
|---|---|---|---|---|---|---|---|---|---|---|
| Model ID | MAE | RMSE | RSR | RAE | Rank | MAE | RMSE | RSR | RAE | Rank |
| MLPANN-2_A | 0.0749 | 0.1201 | 0.8819 | 0.8670 | 16 | 0.0787 | 0.1148 | 0.8643 | 0.7718 | 15 |
| MLPANN-2_B | 0.0664 | 0.1083 | 0.7948 | 0.7683 | 14 | 0.0710 | 0.1102 | 0.8301 | 0.6968 | 6 |
| MLPANN-2_C | 0.0631 | 0.1045 | 0.7669 | 0.7302 | 12 | 0.0693 | 0.1077 | 0.8107 | 0.6794 | 4 |
| MLPANN-2_D | 0.0392 | 0.0565 | 0.4145 | 0.4537 | 10 | 0.0618 | 0.1181 | 0.8892 | 0.6065 | 7 |
| MLPANN-2_E | 0.0381 | 0.0518 | 0.3800 | 0.4413 | 8 | 0.0733 | 0.1210 | 0.9109 | 0.7194 | 16 |
| MLPANN-2_F | 0.0332 | 0.0486 | 0.3568 | 0.3842 | 7 | 0.0733 | 0.1199 | 0.9027 | 0.7186 | 13 |
| MLPANN-2_G | 0.0284 | 0.0404 | 0.2965 | 0.3293 | 6 | 0.0622 | 0.1178 | 0.8871 | 0.6104 | 8 |
| MLPANN-2_H | 0.0272 | 0.0392 | 0.2881 | 0.3147 | 5 | 0.0674 | 0.1253 | 0.9439 | 0.6612 | 11 |
| MLPANN-2_I | 0.0728 | 0.1198 | 0.8790 | 0.8426 | 15 | 0.0786 | 0.1146 | 0.8633 | 0.7713 | 12 |
| MLPANN-2_J | 0.0654 | 0.1065 | 0.7817 | 0.7568 | 13 | 0.0661 | 0.1084 | 0.8164 | 0.6488 | 3 |
| MLPANN-2_K | 0.0456 | 0.0703 | 0.5158 | 0.5278 | 11 | 0.0661 | 0.1076 | 0.8103 | 0.6483 | 2 |
| MLPANN-2_L | 0.0389 | 0.0549 | 0.4032 | 0.4500 | 9 | 0.0669 | 0.1130 | 0.8513 | 0.6562 | 5 |
| MLPANN-2_M | 0.0212 | 0.0352 | 0.2584 | 0.2452 | 4 | 0.0735 | 0.0999 | 0.7523 | 0.7209 | 9 |
| MLPANN-2_N | 0.0137 | 0.0216 | 0.1588 | 0.1586 | 1 | 0.0568 | 0.0770 | 0.5800 | 0.5568 | 1 |
| MLPANN-2_0 | 0.0137 | 0.0227 | 0.1665 | 0.1581 | 1 | 0.0711 | 0.1126 | 0.8476 | 0.6971 | 10 |
| MLPANN-2_P | 0.0174 | 0.0288 | 0.2115 | 0.2016 | 3 | 0.0781 | 0.1157 | 0.8711 | 0.7657 | 13 |
| Training | Testing | |||||||
|---|---|---|---|---|---|---|---|---|
| Model ID | MAE | RMSE | RSR | RAE | MAE | RMSE | RSR | RAE |
| Fold 1 | 0.6399 | 0.9017 | 0.2343 | 0.2391 | 1.5725 | 2.2922 | 0.5778 | 0.5770 |
| Fold 2 | 0.6434 | 0.9912 | 0.2566 | 0.2333 | 1.4576 | 2.2516 | 0.5759 | 0.6070 |
| Fold 3 | 0.5806 | 0.9554 | 0.2293 | 0.1995 | 1.5379 | 2.9217 | 1.2344 | 0.8550 |
| Fold 4 | 0.5075 | 0.7519 | 0.2105 | 0.1937 | 1.5239 | 3.0460 | 0.6189 | 0.5145 |
| Optimal model | 0.4191 | 0.7792 | 0.2002 | 0.1698 | 1.4653 | 2.0797 | 0.5481 | 0.4126 |
| Training | Testing | |||||||
|---|---|---|---|---|---|---|---|---|
| Model ID | MAE | RMSE | RSR | RAE | MAE | RMSE | RSR | RAE |
| Fold 1 | 0.0314 | 0.0445 | 0.2210 | 0.2397 | 0.0754 | 0.1079 | 0.5442 | 0.5533 |
| Fold 2 | 0.0313 | 0.0484 | 0.2400 | 0.2315 | 0.0717 | 0.1120 | 0.5728 | 0.5974 |
| Fold 3 | 0.0290 | 0.0478 | 0.2207 | 0.2031 | 0.0945 | 0.1685 | 1.4241 | 1.0500 |
| Fold 4 | 0.0248 | 0.0376 | 0.2001 | 0.1932 | 0.0880 | 0.1631 | 0.6629 | 0.5941 |
| Optimal model | 0.0210 | 0.0390 | 0.2002 | 0.1698 | 0.0748 | 0.1082 | 0.4858 | 0.4492 |
| Training | Testing | |||||||
|---|---|---|---|---|---|---|---|---|
| Model ID | MAE | RMSE | RSR | RAE | MAE | RMSE | RSR | RAE |
| Fold 1 | 0.1184 | 0.1872 | 0.1659 | 0.1646 | 0.4805 | 0.6982 | 0.6159 | 0.5610 |
| Fold 2 | 0.1237 | 0.1986 | 0.1754 | 0.1626 | 0.4875 | 0.8387 | 0.7377 | 0.6655 |
| Fold 3 | 0.1315 | 0.2070 | 0.1705 | 0.1568 | 0.4168 | 0.7332 | 1.1648 | 1.2387 |
| Fold 4 | 0.1164 | 0.1806 | 0.1727 | 0.1596 | 0.4762 | 0.8770 | 0.6108 | 0.5441 |
| Optimal model | 0.1142 | 0.1803 | 0.1588 | 0.1586 | 0.4730 | 0.6418 | 0.5799 | 0.6738 |
| Training | Testing | |||||||
|---|---|---|---|---|---|---|---|---|
| Model ID | MAE | RMSE | RSR | RAE | MAE | RMSE | RSR | RAE |
| Fold 1 | 0.0142 | 0.0225 | 0.1659 | 0.1643 | 0.0576 | 0.0837 | 0.6154 | 0.5604 |
| Fold 2 | 0.0148 | 0.0238 | 0.1754 | 0.1625 | 0.0584 | 0.1006 | 0.7371 | 0.6649 |
| Fold 3 | 0.0158 | 0.0248 | 0.1706 | 0.1569 | 0.0500 | 0.0880 | 1.1648 | 1.2389 |
| Fold 4 | 0.0140 | 0.0217 | 0.1727 | 0.1597 | 0.0571 | 0.1052 | 0.6105 | 0.5439 |
| Optimal model | 0.0137 | 0.0216 | 0.1588 | 0.1586 | 0.0568 | 0.0770 | 0.5800 | 0.5568 |
| Training | Testing | |||||||||
|---|---|---|---|---|---|---|---|---|---|---|
| Model ID | MAE | RMSE | RSR | RAE | Rank | MAE | RMSE | RSR | RAE | Rank |
| RBFANN-1_A | 0.0001 | 0.0001 | 0.0000 | 0.0000 | 1 | 4036.448 | 21,032.545 | 5543.446 | 1385.7277 | 30 |
| RBFANN-1_B | 0.3489 | 0.7415 | 0.1905 | 0.1413 | 2 | 249.9901 | 1053.9425 | 277.7825 | 85.8225 | 29 |
| RBFANN-1_C | 0.6460 | 1.1675 | 0.2999 | 0.2617 | 3 | 71.1450 | 256.7383 | 67.6673 | 24.4243 | 28 |
| RBFANN-1_D | 0.8001 | 1.5304 | 0.3932 | 0.3241 | 4 | 16.3937 | 57.3411 | 15.1131 | 5.6280 | 27 |
| RBFANN-1_E | 0.9399 | 1.6806 | 0.4318 | 0.3807 | 5 | 11.0034 | 38.0199 | 10.0207 | 3.7775 | 26 |
| RBFANN-1_F | 0.9693 | 1.7734 | 0.4556 | 0.3927 | 6 | 4.5359 | 9.4355 | 2.4869 | 1.5572 | 25 |
| RBFANN-1_G | 1.0044 | 1.8285 | 0.4697 | 0.4069 | 7 | 3.5734 | 6.3450 | 1.6723 | 1.2268 | 24 |
| RBFANN-1_H | 0.9928 | 1.8465 | 0.4744 | 0.4022 | 8 | 2.9897 | 5.0147 | 1.3217 | 1.0264 | 23 |
| RBFANN-1_I | 1.0828 | 1.9178 | 0.4927 | 0.4386 | 9 | 2.8972 | 4.5579 | 1.2013 | 0.9946 | 20 |
| RBFANN-1_J | 1.0976 | 1.9247 | 0.4945 | 0.4446 | 10 | 3.0529 | 4.7836 | 1.2608 | 1.0481 | 22 |
| RBFANN-1_K | 1.1263 | 1.9504 | 0.5011 | 0.4562 | 11 | 2.8651 | 4.5511 | 1.1995 | 0.9836 | 19 |
| RBFANN-1_L | 1.1446 | 1.9791 | 0.5084 | 0.4637 | 12 | 2.6054 | 4.3277 | 1.1406 | 0.8944 | 9 |
| RBFANN-1_M | 1.1928 | 2.0181 | 0.5184 | 0.4832 | 13 | 2.8856 | 4.9392 | 1.3018 | 0.9907 | 21 |
| RBFANN-1_N | 1.2214 | 2.0357 | 0.5230 | 0.4948 | 14 | 2.6072 | 4.4726 | 1.1788 | 0.8951 | 16 |
| RBFANN-1_O | 1.2416 | 2.0857 | 0.5358 | 0.5029 | 15 | 2.5916 | 4.3297 | 1.1412 | 0.8897 | 8 |
| RBFANN-1_P | 1.2683 | 2.1013 | 0.5398 | 0.5138 | 16 | 2.7630 | 4.5019 | 1.1866 | 0.9485 | 18 |
| RBFANN-1_R | 1.3009 | 2.1467 | 0.5515 | 0.5270 | 17 | 2.5204 | 4.2968 | 1.1325 | 0.8652 | 6 |
| RBFANN-1_S | 1.3005 | 2.1476 | 0.5517 | 0.5268 | 18 | 2.5930 | 4.3365 | 1.1430 | 0.8902 | 10 |
| RBFANN-1_T | 1.3012 | 2.1477 | 0.5517 | 0.5271 | 19 | 2.5966 | 4.3385 | 1.1435 | 0.8914 | 12 |
| RBFANN-1_U | 1.3409 | 2.1575 | 0.5542 | 0.5432 | 21 | 2.5084 | 4.2725 | 1.1261 | 0.8612 | 2 |
| RBFANN-1_V | 1.3380 | 2.1580 | 0.5544 | 0.5420 | 20 | 2.5177 | 4.2775 | 1.1274 | 0.8643 | 3 |
| RBFANN-1_W | 1.3382 | 2.1582 | 0.5544 | 0.5421 | 21 | 2.5199 | 4.2784 | 1.1276 | 0.8651 | 4 |
| RBFANN-1_X | 1.3381 | 2.1584 | 0.5545 | 0.5420 | 23 | 2.5225 | 4.2794 | 1.1279 | 0.8660 | 5 |
| RBFANN-1_Y | 1.3387 | 2.1584 | 0.5545 | 0.5423 | 24 | 2.5267 | 4.2806 | 1.1282 | 0.8674 | 7 |
| RBFANN-1_Z | 1.3428 | 2.1652 | 0.5562 | 0.5440 | 27 | 2.6267 | 4.3331 | 1.1421 | 0.9018 | 13 |
| RBFANN-1_AA | 1.3423 | 2.1651 | 0.5562 | 0.5438 | 25 | 2.6289 | 4.3351 | 1.1426 | 0.9025 | 15 |
| RBFANN-1_AB | 1.3412 | 2.1654 | 0.5563 | 0.5433 | 26 | 2.6250 | 4.3338 | 1.1422 | 0.9012 | 14 |
| RBFANN-1_AC | 1.3444 | 2.1675 | 0.5568 | 0.5446 | 28 | 2.6629 | 4.3585 | 1.1488 | 0.9142 | 17 |
| RBFANN-1_AD | 1.3906 | 2.2051 | 0.5665 | 0.5633 | 29 | 2.5003 | 4.2499 | 1.1201 | 0.8584 | 1 |
| RBFANN-1_AE | 1.3771 | 2.2325 | 0.5735 | 0.5578 | 29 | 2.5897 | 4.3928 | 1.1578 | 0.8891 | 11 |
| Training | Testing | |||||||||
|---|---|---|---|---|---|---|---|---|---|---|
| Model ID | MAE | RMSE | RSR | RAE | Rank | MAE | RMSE | RSR | RAE | Rank |
| RBFANN-1_A | 0.0000 | 0.0000 | 0.0000 | 0.0000 | 1 | 201.838 | 1051.628 | 4720.877 | 1213.125 | 30 |
| RBFANN-1_B | 0.0174 | 0.0371 | 0.1905 | 0.1413 | 2 | 12.4836 | 52.6968 | 236.5618 | 75.0314 | 29 |
| RBFANN-1_C | 0.0323 | 0.0584 | 0.3000 | 0.2618 | 3 | 3.5731 | 12.8385 | 57.6337 | 21.4756 | 28 |
| RBFANN-1_D | 0.0401 | 0.0766 | 0.3934 | 0.3245 | 4 | 0.8275 | 2.8678 | 12.8741 | 4.9738 | 27 |
| RBFANN-1_E | 0.0470 | 0.0840 | 0.4317 | 0.3807 | 5 | 0.5648 | 1.9035 | 8.5448 | 3.3948 | 26 |
| RBFANN-1_F | 0.0485 | 0.0887 | 0.4555 | 0.3927 | 6 | 0.2427 | 0.4823 | 2.1649 | 1.4585 | 25 |
| RBFANN-1_G | 0.0502 | 0.0914 | 0.4698 | 0.4069 | 7 | 0.1939 | 0.3314 | 1.4877 | 1.1652 | 24 |
| RBFANN-1_H | 0.0496 | 0.0923 | 0.4743 | 0.4021 | 7 | 0.1644 | 0.2681 | 1.2033 | 0.9881 | 23 |
| RBFANN-1_I | 0.0541 | 0.0959 | 0.4927 | 0.4386 | 9 | 0.1608 | 0.2501 | 1.1227 | 0.9663 | 20 |
| RBFANN-1_J | 0.0549 | 0.0962 | 0.4945 | 0.4444 | 10 | 0.1685 | 0.2591 | 1.1632 | 1.0125 | 22 |
| RBFANN-1_K | 0.0563 | 0.0975 | 0.5011 | 0.4561 | 11 | 0.1591 | 0.2507 | 1.1253 | 0.9562 | 19 |
| RBFANN-1_L | 0.0572 | 0.0990 | 0.5085 | 0.4637 | 12 | 0.1461 | 0.2406 | 1.0802 | 0.8780 | 6 |
| RBFANN-1_M | 0.0596 | 0.1009 | 0.5185 | 0.4831 | 13 | 0.1601 | 0.2672 | 1.1993 | 0.9625 | 21 |
| RBFANN-1_N | 0.0611 | 0.1018 | 0.5230 | 0.4949 | 14 | 0.1462 | 0.2441 | 1.0959 | 0.8789 | 10 |
| RBFANN-1_O | 0.0621 | 0.1043 | 0.5357 | 0.5028 | 15 | 0.1454 | 0.2411 | 1.0824 | 0.8738 | 4 |
| RBFANN-1_P | 0.0634 | 0.1051 | 0.5398 | 0.5138 | 16 | 0.1540 | 0.2498 | 1.1213 | 0.9256 | 18 |
| RBFANN-1_R | 0.0650 | 0.1073 | 0.5515 | 0.5270 | 17 | 0.1419 | 0.2448 | 1.0991 | 0.8528 | 8 |
| RBFANN-1_S | 0.0650 | 0.1074 | 0.5517 | 0.5270 | 17 | 0.1456 | 0.2466 | 1.1069 | 0.8751 | 11 |
| RBFANN-1_T | 0.0650 | 0.1074 | 0.5517 | 0.5268 | 17 | 0.1456 | 0.2466 | 1.1069 | 0.8749 | 11 |
| RBFANN-1_U | 0.0670 | 0.1079 | 0.5543 | 0.5432 | 23 | 0.1413 | 0.2442 | 1.0962 | 0.8493 | 2 |
| RBFANN-1_V | 0.0669 | 0.1079 | 0.5544 | 0.5420 | 20 | 0.1417 | 0.2445 | 1.0977 | 0.8519 | 3 |
| RBFANN-1_W | 0.0669 | 0.1079 | 0.5544 | 0.5420 | 22 | 0.1419 | 0.2446 | 1.0979 | 0.8526 | 5 |
| RBFANN-1_X | 0.0669 | 0.1079 | 0.5545 | 0.5420 | 21 | 0.1420 | 0.2446 | 1.0982 | 0.8535 | 7 |
| RBFANN-1_Y | 0.0669 | 0.1079 | 0.5545 | 0.5424 | 24 | 0.1422 | 0.2447 | 1.0984 | 0.8545 | 9 |
| RBFANN-1_Z | 0.0671 | 0.1083 | 0.5562 | 0.5439 | 25 | 0.1472 | 0.2468 | 1.1077 | 0.8846 | 15 |
| RBFANN-1_AA | 0.0672 | 0.1083 | 0.5563 | 0.5441 | 27 | 0.1473 | 0.2468 | 1.1080 | 0.8854 | 16 |
| RBFANN-1_AB | 0.0670 | 0.1083 | 0.5564 | 0.5431 | 25 | 0.1470 | 0.2467 | 1.1076 | 0.8836 | 14 |
| RBFANN-1_AC | 0.0672 | 0.1084 | 0.5568 | 0.5444 | 28 | 0.1489 | 0.2477 | 1.1118 | 0.8952 | 17 |
| RBFANN-1_AD | 0.0695 | 0.1103 | 0.5665 | 0.5633 | 29 | 0.1409 | 0.2418 | 1.0857 | 0.8468 | 1 |
| RBFANN-1_AE | 0.0689 | 0.1116 | 0.5734 | 0.5579 | 29 | 0.1454 | 0.2487 | 1.1164 | 0.8738 | 13 |
| Training | Testing | |||||||||
|---|---|---|---|---|---|---|---|---|---|---|
| Model ID | MAE | RMSE | RSR | RAE | Rank | MAE | RMSE | RSR | RAE | Rank |
| RBFANN-2_A | 0.0000 | 0.0000 | 0.0000 | 0.0000 | 1 | 1177.297 | 6134.492 | 5543.447 | 1385.728 | 30 |
| RBFANN-2_B | 0.1018 | 0.2163 | 0.1866 | 0.1413 | 2 | 72.9138 | 307.3999 | 277.7825 | 85.8225 | 29 |
| RBFANN-2_C | 0.1884 | 0.3405 | 0.2938 | 0.2617 | 3 | 20.7506 | 74.8820 | 67.6673 | 24.4243 | 28 |
| RBFANN-2_D | 0.2334 | 0.4464 | 0.3852 | 0.3241 | 4 | 4.7815 | 16.7245 | 15.1131 | 5.6280 | 27 |
| RBFANN-2_E | 0.2741 | 0.4902 | 0.4230 | 0.3807 | 5 | 3.2093 | 11.0891 | 10.0207 | 3.7775 | 26 |
| RBFANN-2_F | 0.2827 | 0.5172 | 0.4463 | 0.3927 | 6 | 1.3230 | 2.7520 | 2.4869 | 1.5572 | 25 |
| RBFANN-2_G | 0.2930 | 0.5333 | 0.4602 | 0.4069 | 7 | 1.0422 | 1.8506 | 1.6723 | 1.2268 | 24 |
| RBFANN-2_H | 0.2896 | 0.5386 | 0.4647 | 0.4022 | 8 | 0.8720 | 1.4626 | 1.3217 | 1.0264 | 23 |
| RBFANN-2_I | 0.3158 | 0.5594 | 0.4826 | 0.4386 | 9 | 0.8450 | 1.3294 | 1.2013 | 0.9946 | 20 |
| RBFANN-2_J | 0.3201 | 0.5614 | 0.4844 | 0.4446 | 10 | 0.8904 | 1.3952 | 1.2608 | 1.0481 | 22 |
| RBFANN-2_K | 0.3285 | 0.5689 | 0.4908 | 0.4562 | 11 | 0.8357 | 1.3274 | 1.1995 | 0.9836 | 19 |
| RBFANN-2_L | 0.3338 | 0.5772 | 0.4981 | 0.4637 | 12 | 0.7599 | 1.2622 | 1.1406 | 0.8944 | 9 |
| RBFANN-2_M | 0.3479 | 0.5886 | 0.5079 | 0.4832 | 13 | 0.8416 | 1.4406 | 1.3018 | 0.9907 | 21 |
| RBFANN-2_N | 0.3562 | 0.5937 | 0.5123 | 0.4948 | 14 | 0.7604 | 1.3045 | 1.1788 | 0.8951 | 16 |
| RBFANN-2_O | 0.3621 | 0.6083 | 0.5249 | 0.5029 | 15 | 0.7559 | 1.2628 | 1.1412 | 0.8897 | 8 |
| RBFANN-2_P | 0.3699 | 0.6129 | 0.5288 | 0.5138 | 16 | 0.8059 | 1.3131 | 1.1866 | 0.9485 | 18 |
| RBFANN-2_R | 0.3794 | 0.6261 | 0.5402 | 0.5270 | 17 | 0.7351 | 1.2532 | 1.1325 | 0.8652 | 6 |
| RBFANN-2_S | 0.3793 | 0.6264 | 0.5405 | 0.5268 | 17 | 0.7563 | 1.2648 | 1.1430 | 0.8902 | 10 |
| RBFANN-2_T | 0.3795 | 0.6264 | 0.5405 | 0.5271 | 19 | 0.7573 | 1.2654 | 1.1435 | 0.8914 | 12 |
| RBFANN-2_U | 0.3911 | 0.6293 | 0.5430 | 0.5432 | 21 | 0.7316 | 1.2461 | 1.1261 | 0.8612 | 2 |
| RBFANN-2_V | 0.3903 | 0.6294 | 0.5431 | 0.5420 | 20 | 0.7343 | 1.2476 | 1.1274 | 0.8643 | 3 |
| RBFANN-2_W | 0.3903 | 0.6295 | 0.5431 | 0.5421 | 21 | 0.7350 | 1.2479 | 1.1276 | 0.8651 | 4 |
| RBFANN-2_X | 0.3903 | 0.6295 | 0.5432 | 0.5420 | 23 | 0.7357 | 1.2482 | 1.1279 | 0.8660 | 5 |
| RBFANN-2_Y | 0.3904 | 0.6295 | 0.5432 | 0.5423 | 24 | 0.7370 | 1.2485 | 1.1282 | 0.8674 | 7 |
| RBFANN-2_Z | 0.3917 | 0.6315 | 0.5449 | 0.5440 | 27 | 0.7661 | 1.2638 | 1.1421 | 0.9018 | 13 |
| RBFANN-2_AA | 0.3915 | 0.6315 | 0.5449 | 0.5438 | 25 | 0.7668 | 1.2644 | 1.1426 | 0.9025 | 15 |
| RBFANN-2_AB | 0.3912 | 0.6316 | 0.5450 | 0.5433 | 26 | 0.7656 | 1.2640 | 1.1422 | 0.9012 | 14 |
| RBFANN-2_AC | 0.3921 | 0.6322 | 0.5455 | 0.5446 | 28 | 0.7767 | 1.2712 | 1.1488 | 0.9142 | 17 |
| RBFANN-2_AD | 0.4056 | 0.6432 | 0.5549 | 0.5633 | 29 | 0.7292 | 1.2396 | 1.1201 | 0.8584 | 1 |
| RBFANN-2_AE | 0.4016 | 0.6511 | 0.5618 | 0.5578 | 30 | 0.7553 | 1.2812 | 1.1578 | 0.8891 | 11 |
| Training | Testing | |||||||||
|---|---|---|---|---|---|---|---|---|---|---|
| Model ID | MAE | RMSE | RSR | RAE | Rank | MAE | RMSE | RSR | RAE | Rank |
| RBFANN-2_A | 0.0001 | 0.0001 | 0.0004 | 0.0007 | 1 | 141.288 | 736.203 | 5543.927 | 1385.848 | 30 |
| RBFANN-2_B | 0.0122 | 0.0260 | 0.1866 | 0.1413 | 2 | 8.7504 | 36.8912 | 277.8067 | 85.8298 | 29 |
| RBFANN-2_C | 0.0226 | 0.0409 | 0.2938 | 0.2617 | 3 | 2.4903 | 8.9866 | 67.6732 | 24.4264 | 28 |
| RBFANN-2_D | 0.0280 | 0.0536 | 0.3852 | 0.3241 | 4 | 0.5738 | 2.0071 | 15.1143 | 5.6284 | 27 |
| RBFANN-2_E | 0.0329 | 0.0588 | 0.4230 | 0.3807 | 5 | 0.3851 | 1.3308 | 10.0217 | 3.7777 | 26 |
| RBFANN-2_F | 0.0339 | 0.0621 | 0.4463 | 0.3927 | 6 | 0.1588 | 0.3303 | 2.4871 | 1.5572 | 25 |
| RBFANN-2_G | 0.0352 | 0.0640 | 0.4602 | 0.4069 | 7 | 0.1251 | 0.2221 | 1.6724 | 1.2268 | 24 |
| RBFANN-2_H | 0.0348 | 0.0646 | 0.4647 | 0.4022 | 7 | 0.1046 | 0.1755 | 1.3217 | 1.0264 | 23 |
| RBFANN-2_I | 0.0379 | 0.0671 | 0.4826 | 0.4386 | 9 | 0.1014 | 0.1595 | 1.2013 | 0.9946 | 20 |
| RBFANN-2_J | 0.0384 | 0.0674 | 0.4844 | 0.4446 | 10 | 0.1068 | 0.1674 | 1.2608 | 1.0480 | 22 |
| RBFANN-2_K | 0.0394 | 0.0683 | 0.4908 | 0.4562 | 11 | 0.1003 | 0.1593 | 1.1995 | 0.9835 | 19 |
| RBFANN-2_L | 0.0401 | 0.0693 | 0.4981 | 0.4637 | 12 | 0.0912 | 0.1515 | 1.1407 | 0.8944 | 9 |
| RBFANN-2_M | 0.0417 | 0.0706 | 0.5079 | 0.4832 | 13 | 0.1010 | 0.1729 | 1.3018 | 0.9906 | 21 |
| RBFANN-2_N | 0.0427 | 0.0712 | 0.5123 | 0.4947 | 14 | 0.0912 | 0.1565 | 1.1788 | 0.8949 | 16 |
| RBFANN-2_O | 0.0435 | 0.0730 | 0.5249 | 0.5029 | 15 | 0.0907 | 0.1515 | 1.1412 | 0.8895 | 8 |
| RBFANN-2_P | 0.0444 | 0.0735 | 0.5288 | 0.5138 | 16 | 0.0967 | 0.1576 | 1.1866 | 0.9484 | 18 |
| RBFANN-2_R | 0.0455 | 0.0751 | 0.5402 | 0.5269 | 17 | 0.0882 | 0.1504 | 1.1325 | 0.8651 | 6 |
| RBFANN-2_S | 0.0455 | 0.0752 | 0.5405 | 0.5268 | 18 | 0.0907 | 0.1518 | 1.1429 | 0.8900 | 10 |
| RBFANN-2_T | 0.0455 | 0.0752 | 0.5405 | 0.5270 | 19 | 0.0909 | 0.1518 | 1.1435 | 0.8913 | 12 |
| RBFANN-2_U | 0.0469 | 0.0755 | 0.5430 | 0.5431 | 21 | 0.0878 | 0.1495 | 1.1261 | 0.8610 | 2 |
| RBFANN-2_V | 0.0468 | 0.0755 | 0.5431 | 0.5420 | 20 | 0.0881 | 0.1497 | 1.1274 | 0.8642 | 3 |
| RBFANN-2_W | 0.0468 | 0.0755 | 0.5431 | 0.5420 | 21 | 0.0882 | 0.1497 | 1.1276 | 0.8650 | 4 |
| RBFANN-2_X | 0.0468 | 0.0755 | 0.5432 | 0.5420 | 23 | 0.0883 | 0.1498 | 1.1279 | 0.8659 | 5 |
| RBFANN-2_Y | 0.0468 | 0.0755 | 0.5432 | 0.5422 | 24 | 0.0884 | 0.1498 | 1.1282 | 0.8673 | 7 |
| RBFANN-2_Z | 0.0470 | 0.0758 | 0.5449 | 0.5439 | 27 | 0.0919 | 0.1517 | 1.1421 | 0.9017 | 13 |
| RBFANN-2_AA | 0.0470 | 0.0758 | 0.5449 | 0.5437 | 25 | 0.0920 | 0.1517 | 1.1426 | 0.9024 | 15 |
| RBFANN-2_AB | 0.0469 | 0.0758 | 0.5450 | 0.5432 | 26 | 0.0919 | 0.1517 | 1.1422 | 0.9011 | 14 |
| RBFANN-2_AC | 0.0470 | 0.0759 | 0.5455 | 0.5445 | 28 | 0.0932 | 0.1525 | 1.1488 | 0.9141 | 17 |
| RBFANN-2_AD | 0.0487 | 0.0772 | 0.5549 | 0.5632 | 29 | 0.0875 | 0.1487 | 1.1201 | 0.8582 | 1 |
| RBFANN-2_AE | 0.0482 | 0.0781 | 0.5618 | 0.5578 | 30 | 0.0906 | 0.1537 | 1.1578 | 0.8889 | 11 |
| Training | Testing | |||||||
|---|---|---|---|---|---|---|---|---|
| Model ID | MAE | RMSE | RSR | RAE | MAE | RMSE | RSR | RAE |
| Fold 1 | 1.3162 | 2.2875 | 0.5911 | 0.5335 | 3.8637 | 6.5414 | 1.6829 | 1.3155 |
| Fold 2 | 1.4464 | 2.3694 | 0.6103 | 0.5546 | 2.6127 | 4.9820 | 1.2781 | 1.0404 |
| Fold 3 | 1.5440 | 2.4824 | 0.5957 | 0.5306 | 2.7912 | 4.8087 | 2.0317 | 1.5517 |
| Fold 4 | 1.5339 | 2.4437 | 0.6814 | 0.6132 | 2.7341 | 4.0143 | 0.8159 | 0.9522 |
| Optimal model | 1.3409 | 2.1575 | 0.5542 | 0.5432 | 2.5084 | 4.2725 | 1.1261 | 0.8612 |
| Training | Testing | |||||||
|---|---|---|---|---|---|---|---|---|
| Model ID | MAE | RMSE | RSR | RAE | MAE | RMSE | RSR | RAE |
| Fold 1 | 0.0745 | 0.1219 | 0.6002 | 0.5755 | 0.1988 | 0.3711 | 1.9096 | 1.3534 |
| Fold 2 | 0.0787 | 0.1241 | 0.6095 | 0.5775 | 0.1484 | 0.2908 | 1.4875 | 1.1820 |
| Fold 3 | 0.0814 | 0.1355 | 0.6259 | 0.5707 | 0.1417 | 0.2368 | 2.0011 | 1.5755 |
| Fold 4 | 0.0815 | 0.1320 | 0.6971 | 0.6230 | 0.1522 | 0.2312 | 0.9399 | 1.0601 |
| Optimal model | 0.0670 | 0.1079 | 0.5543 | 0.5432 | 0.1413 | 0.2442 | 1.0962 | 0.8493 |
| Training | Testing | |||||||
|---|---|---|---|---|---|---|---|---|
| Model ID | MAE | RMSE | RSR | RAE | MAE | RMSE | RSR | RAE |
| Fold 1 | 0.4026 | 0.6804 | 0.6029 | 0.5594 | 1.0701 | 1.7585 | 1.5511 | 1.2492 |
| Fold 2 | 0.4198 | 0.6776 | 0.5984 | 0.5519 | 0.7502 | 1.4673 | 1.2905 | 1.0242 |
| Fold 3 | 0.4503 | 0.7241 | 0.5964 | 0.5369 | 0.8129 | 1.3984 | 2.2215 | 2.4159 |
| Fold 4 | 0.4474 | 0.7127 | 0.6814 | 0.6132 | 0.8751 | 1.2735 | 0.8868 | 0.9999 |
| Optimal model | 0.3911 | 0.6293 | 0.5430 | 0.5432 | 0.7316 | 1.2461 | 1.1261 | 0.8612 |
| Training | Testing | |||||||
|---|---|---|---|---|---|---|---|---|
| Model ID | MAE | RMSE | RSR | RAE | MAE | RMSE | RSR | RAE |
| Fold 1 | 0.0483 | 0.0817 | 0.6029 | 0.5594 | 0.1284 | 0.2110 | 1.5512 | 1.2494 |
| Fold 2 | 0.0504 | 0.0813 | 0.5984 | 0.5519 | 0.0900 | 0.1761 | 1.2907 | 1.0242 |
| Fold 3 | 0.0540 | 0.0869 | 0.5964 | 0.5368 | 0.0975 | 0.1678 | 2.2215 | 2.4159 |
| Fold 4 | 0.0537 | 0.0855 | 0.6814 | 0.6132 | 0.1050 | 0.1528 | 0.8868 | 1.0000 |
| Optimal model | 0.0469 | 0.0755 | 0.5430 | 0.5431 | 0.0878 | 0.1495 | 1.1261 | 0.8610 |
References
- Hopke, P.K.; Borak, T.B.; Doull, J.; Cleaver, J.E.; Eckerman, K.F.; Gundersen, L.C.S.; Simon, S.L. Health Risks Due to Radon in Drinking Water; ACS Publications: Washington, DC, USA, 2000. [Google Scholar]
- Bertolo, A.; Bigliotto, C. Radon concentration in waters of geothermal Euganean basin-Veneto, Italy. Radiat. Prot. Dosim. 2004, 111, 355–358. [Google Scholar] [CrossRef]
- UNSCEAR. Report to the general assembly. In Sources and Effects of Ionizing Radiation; United Nations: New York, NY, USA, 1994. [Google Scholar]
- UNSCEAR. Report, Sources and Effects of Ionizing Radiation; United Nations: New York, NY, USA, 1993. [Google Scholar]
- Yakut, H.; Tabar, E.; Zenginerler, Z.; Demirci, N.; Ertugral, F. Measurement of 222Rn concentration in drinking water in Sakarya, Turkey. Radiat. Prot. Dosim. 2013, 157, 397–406. [Google Scholar] [CrossRef]
- Cothern, C.R.; Smith, J.S. Environmental Radon. Environmental Science Research; Plenum Press: New York, NY, USA, 1987; Volume 35. [Google Scholar]
- Wilkening, M. Radon in the Environment; Elsevier: Amsterdam, The Netherlands, 1990; pp. 1–137. [Google Scholar]
- Somlai, K.; Tokonami, S.; Ishikawa, T.; Vancsura, P.; Gáspár, M.; Jobbágy, V.; Kovács, T. 222Rn concentrations of water in the Balaton Highland and in the southern part of Hungary, and the assessment of the resulting dose. Radiat. Meas. 2007, 42, 491–495. [Google Scholar] [CrossRef]
- Sola, P.; Srisuksawad, K.; Loaharojanaphand, S.; O-Manee, A.; Permnamtip, V.; Issarapan, P.; Thummagarun, L. Radon concentration in air, hot spring water, and bottled mineral water in one hot spring area in Thailand. J. Radioanal. Nucl. Chem. 2013, 297, 183–187. [Google Scholar] [CrossRef]
- Chaudhuri, H.; Nisith, K.D.; Bhandari, R.K.; Sen, P.; Sinh, B. Radon activity measurements around Bakreswar thermal springs. Radiat. Meas. 2010, 45, 143–146. [Google Scholar] [CrossRef]
- Desideri, D.; Bruno, M.R.; Roselli, C. 222Rn determination in some thermal baths of a central eastern Italian area. J. Radioanal. Nucl. Chem. 2004, 261, 37–41. [Google Scholar] [CrossRef]
- Tabar, E.; Kumru, M.N.; Saç, M.M.; İçhedef, M.; Bolca, M.; Özen, F. Radiological and chemical monitoring of Dikili geothermal waters, Western Turkey. Radiat. Phys. Chem. 2013, 91, 89–97. [Google Scholar] [CrossRef]
- Binesh, A.; Mohammadi, S.; Mowlavi, A.A.; Parvaresh, P. Evaluation of the radiation dose from radon ingestion and inhalation in drinking water. Int. J. Water. Res. Environ. Eng. 2010, 2, 174–178. [Google Scholar]
- Bozkurt, V.; Erturk, S. Evaluation of radon gas concentration in indoor air of spas and in spring water in the central Anatolia region of Turkey. Radiat. Environ. Biophys. 2022, 61, 609–614. [Google Scholar] [CrossRef]
- Çetinkaya, H.; Biçer, M. Radon and radium measurements of Eskişehir spa waters. Radiat. Prot. Dosim. 2021, 194, 82–89. [Google Scholar] [CrossRef]
- Hofmann, W.; Winkler-Heil, R.; Lettner, H.; Hubmer, A.; Gaisberger, M. Radon transfer from thermal water to human organs in radon therapy: Exhalation measurements and model simulations. Radiat. Environ. Biophys. 2019, 58, 513–529. [Google Scholar] [CrossRef] [PubMed]
- Silva, A.S.; Dinis, M.D.L. Assessment of indoor radon concentration and time-series analysis of gamma dose rate in three thermal spas from Portugal. Environ. Monit. Assess. 2022, 194, 611. [Google Scholar] [CrossRef]
- Tabar, E.; Yakut, H. Radon measurements in water samples from the thermal springs of Yalova basin, Turkey. J. Radioanal. Nucl. Chem. 2014, 299, 311–319. [Google Scholar] [CrossRef]
- McCulloch, W.S.; Pitts, W. A logical calculus of the ideas immanent in nervous activity. Bull. Math. Biophys. 1943, 5, 115–133. [Google Scholar] [CrossRef]
- Hebb, D.O. The Organization of Behavior: A Neuropsychological Theory; Psychology Press: Hove, UK, 1949. [Google Scholar]
- Mohapatra, P.; Ray, A.; Jena, S.; Padhiari, B.M.; Kuanar, A.; Nayak, S.; Mohanty, S. Artificial neural network based prediction and optimization of centelloside content in Centella asiatica: A comparison between multilayer perceptron (MLP) and radial basis function (RBF) algorithms for soil and climatic parameter. S. Afr. J. Bot. 2023, 160, 571–585. [Google Scholar] [CrossRef]
- Gopal, P.M.; Bhargavi, R. A novel approach for efficient crop yield prediction. Comput. Electron. Agric. 2019, 165, 104968. [Google Scholar] [CrossRef]
- Mandal, U.; Gowda, V.; Ghosh, A.; Bose, A.; Bhaumik, U.; Chatterjee, B.; Pal, T.K. Optimization of metformin HCl 500 mg sustained release matrix tablets using Artificial Neural Network (ANN) based on Multilayer Perceptrons (MLP) model. Chem. Pharm. Bull. 2008, 56, 150–155. [Google Scholar] [CrossRef] [PubMed]
- Kalani, H.; Sardarabadi, M.; Passandideh-Fard, M. Using artificial neural network models and particle swarm optimization for manner prediction of a photovoltaic thermal nanofluid based collector. Appl. Therm. Eng. 2017, 113, 1170–1177. [Google Scholar] [CrossRef]
- Baştan, N. Study on Relationships Between Radon Measurement and Seismic Activities in Geothermic Areas on Denizli Region. Master’s Thesis, Ege University, İzmir, Turkey, 2013. (Turkish with English abstract). [Google Scholar]
- Revan, M. Determination of Radioactivity Levels of the Northern Aegean Spas. Master’s Thesis, Ege University, İzmir, Turkey, 2010. (Turkish with English abstract). [Google Scholar]
- Tabar, E. Evaluation of Tectonic Activity in Dikili and Bergama Regions wıth Radon Measurements in Jeothermal Waters. Master’s Thesis, Ege University, İzmir, Turkey, 2010. (Turkish with English abstract). [Google Scholar]
- Hair, J., Jr.; Wolfinbarger, M.C.; Ortinau, D.J.; Bush, R.P. Essentials of Marketing; Mc Graw Hill: New York, NY, USA, 2013. [Google Scholar]
- Rabbani, A.; Samui, P.; Kumari, S. Optimized ANN-based approach for estimation of shear strength of soil. Asian J. Civ. Eng. 2023, 24, 3627–3640. [Google Scholar] [CrossRef]
- Erzin, S. Using radial basis artificial neural networks to predict radiation hazard indices in geological materials. Environ. Monit. Assess. 2024, 196, 315. [Google Scholar] [CrossRef]
- Erzin, S. Prediction of the radon concentration in thermal waters using artificial neural networks. Int. J. Sci. Environ. Technol. 2024, 21, 7321–7328. [Google Scholar] [CrossRef]
- Erzin, S. Optimization of artificial neural network for predicting radon exhalation rates and effective radium content in soil samples. Earth. Sci. Inform. 2025, 18, 170. [Google Scholar] [CrossRef]
- Erzin, S.; Yaprak, G. Prediction of the activity concentrations of 232Th, 238U and 40K in geological materials using radial basis function neural network. J. Radioanal. Nucl. Chem. 2022, 331, 3525–3533. [Google Scholar] [CrossRef]
- Rabbani, A.; Samui, P.; Kumari, S. A novel hybrid model of augmented grey wolf optimizer and artificial neural network for predicting shear strength of soil. Model. Earth. Syst. Env. 2023, 9, 2327–2347. [Google Scholar] [CrossRef]
- Rabbani, A.; Samui, P.; Kumari, S. Implementing ensemble learning models for the prediction of shear strength of soil. Asian J. Civ. Eng. 2023, 24, 2103–2119. [Google Scholar] [CrossRef]
- Reddy, P.S.; Huang, H.; Huang, X.; Erzin, Y.; Guixiong, M.; Garg, A.; Rao, B.H.A. Comprehensive Study for Assessing Parameters Influencing Tensile Strength Behaviour of Fine-Grained and Coarse-Grained Soils. In Proceedings of the 1st Indo-China Research Series in Geotechnical and Geoenvironmental Engineering, Online, 8–19 May 2020; Springer: Singapore, 2021; pp. 39–64. [Google Scholar]
- Hurlburt, S. Radon—A real killer or just an unsolved mystery. Water Well J. 1989, 43, 34–41. [Google Scholar]
- IARC. Working Group on the Evaluation of Carcinogenic Risks to Humans, & International Agency for Research on Cancer. In Man-Made Mineral Fibres and Radon; World Health Organization: Geneva, Switzerland, 1988; Volume 43. [Google Scholar]
- UNSCEAR. Report to the general assembly. In Sources and Effects of Ionizing Radiation; United Nations: New York, NY, USA, 2000. [Google Scholar]
- Sahin, L.; Durak, S.; Hafızoğlu, N. Assessment of radiation doses from natural radioactivity measurements in the spa centres of Kütahya Province, Turkey. J. Radioanal. Nucl. Chem. 2022, 331, 2993–3004. [Google Scholar] [CrossRef]
- Doğan, M.; Ganioğlu, E.; Sahin, L.; Hafızoğlu, N. Investigation of radon concentrations in some reservoirs, spring and tap waters in İstanbul, Turkey. J. Radioanal. Nucl. Chem. 2018, 315, 653–660. [Google Scholar] [CrossRef]
- Markopoulos, A.P.; Georgiopoulos, S.; Manolakos, D.E. On the use of back propagation and radial basis function neural networks in surface roughness prediction. J. Ind. Eng. Int. 2016, 12, 389–400. [Google Scholar] [CrossRef]
- Mohaghegh, S. Virtual-intelligence applications in petroleum engineering: Part 1—Artificial neural networks. J. Pet. Technol. 2000, 52, 64–73. [Google Scholar] [CrossRef]
- Abiodun, O.I.; Jantan, A.; Omolara, A.E.; Dada, K.V.; Mohamed, N.A.; Arshad, H. State-of-the-art in artificial neural network applications: A survey. Heliyon 2018, 4, e00938. [Google Scholar] [CrossRef]
- Varshney, K.; Poddar, K. Prediction of wind properties in urban environments using artificial neural network. Theor. Appl. Climatol. 2012, 107, 579–590. [Google Scholar] [CrossRef]
- Sabah, M.; Talebkeikhah, M.; Agin, F.; Talebkeikhah, F.; Hasheminasab, E. Application of decision tree, artificial neural networks, and adaptive neuro-fuzzy inference system on predicting lost circulation: A case study from Marun oil field. J. Pet. Sci. Eng. 2019, 177, 236–249. [Google Scholar] [CrossRef]
- Hemmati-Sarapardeh, A.; Ghazanfari, M.H.; Ayatollahi, S.; Masihi, M. Accurate determination of the CO2-crude oil minimum miscibility pressure of pure and impure CO2 streams: A robust modelling approach. Can. J. Chem. Eng. 2016, 94, 253–261. [Google Scholar] [CrossRef]
- Liu, X.; Yang, F.; Chu, J.; Zhu, C.; He, M.; Zhang, Y. General model based on artificial neural networks for estimating the viscosities of oxygenated fuels. ACS Omega 2019, 4, 16564–16571. [Google Scholar] [CrossRef]
- Rumelhart, D.E.; Hinton, G.E.; Williams, R.J. Learning Internal Representations by Error Propagation, Parallel Distributed Processing. In Explorations in the Microstructures of Cognition; Rumelhart, D.E., McClelland, J.L., Eds.; MIT Press: Cambridge, MA, USA, 1986; Volume I, pp. 318–362. [Google Scholar]
- Dai, Q.; Liu, N. Alleviating the problem of local minima in Backpropagation through competitive learning. Neurocomputing 2012, 94, 152–158. [Google Scholar] [CrossRef]
- Lashkenari, M.S.; Taghizadeh, M.; Mehdizadeh, B. Viscosity prediction in selected Iranian light oil reservoirs: Artificial neural network versus empirical correlations. Pet. Sci. 2013, 10, 126–133. [Google Scholar] [CrossRef]
- Segal, R.; Kothari, M.L.; Madnani, S. Radial basis function (RBF) network adaptive power system stabilizer. IEEE Trans. Power Syst. 2000, 15, 722–727. [Google Scholar] [CrossRef]
- Howlett, R.J.; Jain, L.C. Radial Basis Function Networks 2: New Advances in Design; Springer Science & Business Media: Berlin/Heidelberg, Germany, 2001; Volume 2. [Google Scholar]
- Ham, F.M.; Kostanic, I. Principles of Neurocomputing for Science and Engineering; McGraw-Hill Higher Education: Columbus, OH, USA, 2000. [Google Scholar]
- WHO. Guidelines for Drinking-Water Quality: Recommendations, 3rd ed.; World Health Organization Press: Geneva, Switzerland, 2004; Volume 1. [Google Scholar]
- USEPA—U.S. Environmental Protection Agency. National Primary Drinking Water Regulations for Radionuclides; Government Printing Office: Washington, DC, USA, 1991; EPA/570/9-91/700.
- Benardos, P.G.; Vosniakos, G.C. Optimizing feedforward artificial neural network architecture. Eng. Appl. Artif. Intell. 2007, 20, 365–382. [Google Scholar] [CrossRef]
- Bayat, M.; Bettinger, P.; Hassani, M.; Heidari, S. Ten-year estimation of Oriental beech (Fagus orientalis Lipsky) volume increment in natural forests: A comparison of an artificial neural networks model, multiple linear regression and actual increment. Int. J. For. Res. 2021, 94, 598–609. [Google Scholar]
- Ahmad, M.W.; Mourshed, M.; Rezgui, Y. Trees vs Neurons: Comparison between random forest and ANN for high-resolution prediction of building energy consumption. Energy Build. 2017, 147, 77–89. [Google Scholar] [CrossRef]
- Kaastra, I.; Boyd, M. Designing a neural network for forecasting financial and economic time series. Neurocomputing 1996, 10, 215–236. [Google Scholar] [CrossRef]
- Khatti, J.; Grover, K.S. Assessment of hydraulic conductivity of compacted clayey soil using artificial neural network: An investigation on structural and database multicollinearity. Earth Sci. Inform. 2024, 17, 3287–3332. [Google Scholar] [CrossRef]
- Bors, A.G.; Pitas, I. Median radial basis function neural network. IEEE Trans. Neural. Netw. 1996, 7, 1351–1364. [Google Scholar] [CrossRef]
- Khatti, J.; Grover, K.S.; Kim, H.J.; Mawuntu, K.B.A.; Park, T.W. Prediction of ultimate bearing capacity of shallow foundations on cohesionless soil using hybrid lstm and rvm approaches: An extended investigation of multicollinearity. Comput. Geotech. 2024, 165, 105912. [Google Scholar] [CrossRef]
- Rabbani, A.; Samui, P.; Kumari, S.; Saraswat, B.K.; Tiwari, M.; Rai, A. Optimization of an artificial neural network using three novel meta-heuristic algorithms for predicting the shear strength of soil. Transp. Infrastruct. Geotechnol. 2024, 11, 1708–1729. [Google Scholar] [CrossRef]
- Kumar, M.; Kumar, D.R.; Khatti, J.; Samui, P.; Grover, K.S. Prediction of bearing capacity of pile foundation using deep learning approaches. Front. Struct. Civ. Eng. 2024, 18, 870–886. [Google Scholar] [CrossRef]
- Biswas, R.; Kumar, M.; Singh, R.K. A novel integrated approach of RUNge Kutta optimizer and ANN for estimating compressive strength of self-compacting concrete. Case Stud. Construct. Mater. 2023, 18, e02163. [Google Scholar] [CrossRef]
- Erzin, Y.; Ecemis, N. The use of neural networks for the prediction of cone penetration resistance of silty sands. Neural Comput. Appl. 2017, 28, 727–736. [Google Scholar] [CrossRef]
- Khatti, J.; Grover, K.S. Prediction of compaction parameters for fine-grained soil: Critical comparison of the deep learning and standalone models. J. Rock Mech. Geotech. 2023, 15, 3010–3038. [Google Scholar] [CrossRef]
- Ardakani, A.; Kordnaeij, A. Soil compaction parameters prediction using GMDH-type neural network and genetic algorithm. Eur. J. Environ. Civ. Eng. 2019, 23, 449–462. [Google Scholar] [CrossRef]
- Chen, W.; Hasanipanah, M.; Nikafshan Rad, H.; Jahed Armaghani, D.; Tahir, M.M. A new design of evolutionary hybrid optimization of SVR model in predicting the blast-induced ground vibration. Eng. Comput. 2021, 37, 1455–1471. [Google Scholar] [CrossRef]
- Shirani Faradonbeh, R.; Jahed Armaghani, D.; Abd Majid, M.Z.; Md Tahir, M.; Ramesh Murlidhar, B.; Monjezi, M.; Wong, H.M. Prediction of ground vibration due to quarry blasting based on gene expression programming: A new model for peak particle velocity prediction. Int. J. Environ. Sci. Technol. 2016, 13, 1453–1464. [Google Scholar] [CrossRef]
- Wang, H.L.; Yin, Z.Y. High performance prediction of soil compaction parameters using multi expression programming. Eng. Geol. 2020, 276, 105758. [Google Scholar] [CrossRef]
- Momeni, E.; Nazir, R.; Armaghani, D.J.; Maziar, H. Prediction of pile bearing capacity using a hybrid genetic algorithm-based ANN. Measurement 2014, 57, 122–131. [Google Scholar] [CrossRef]



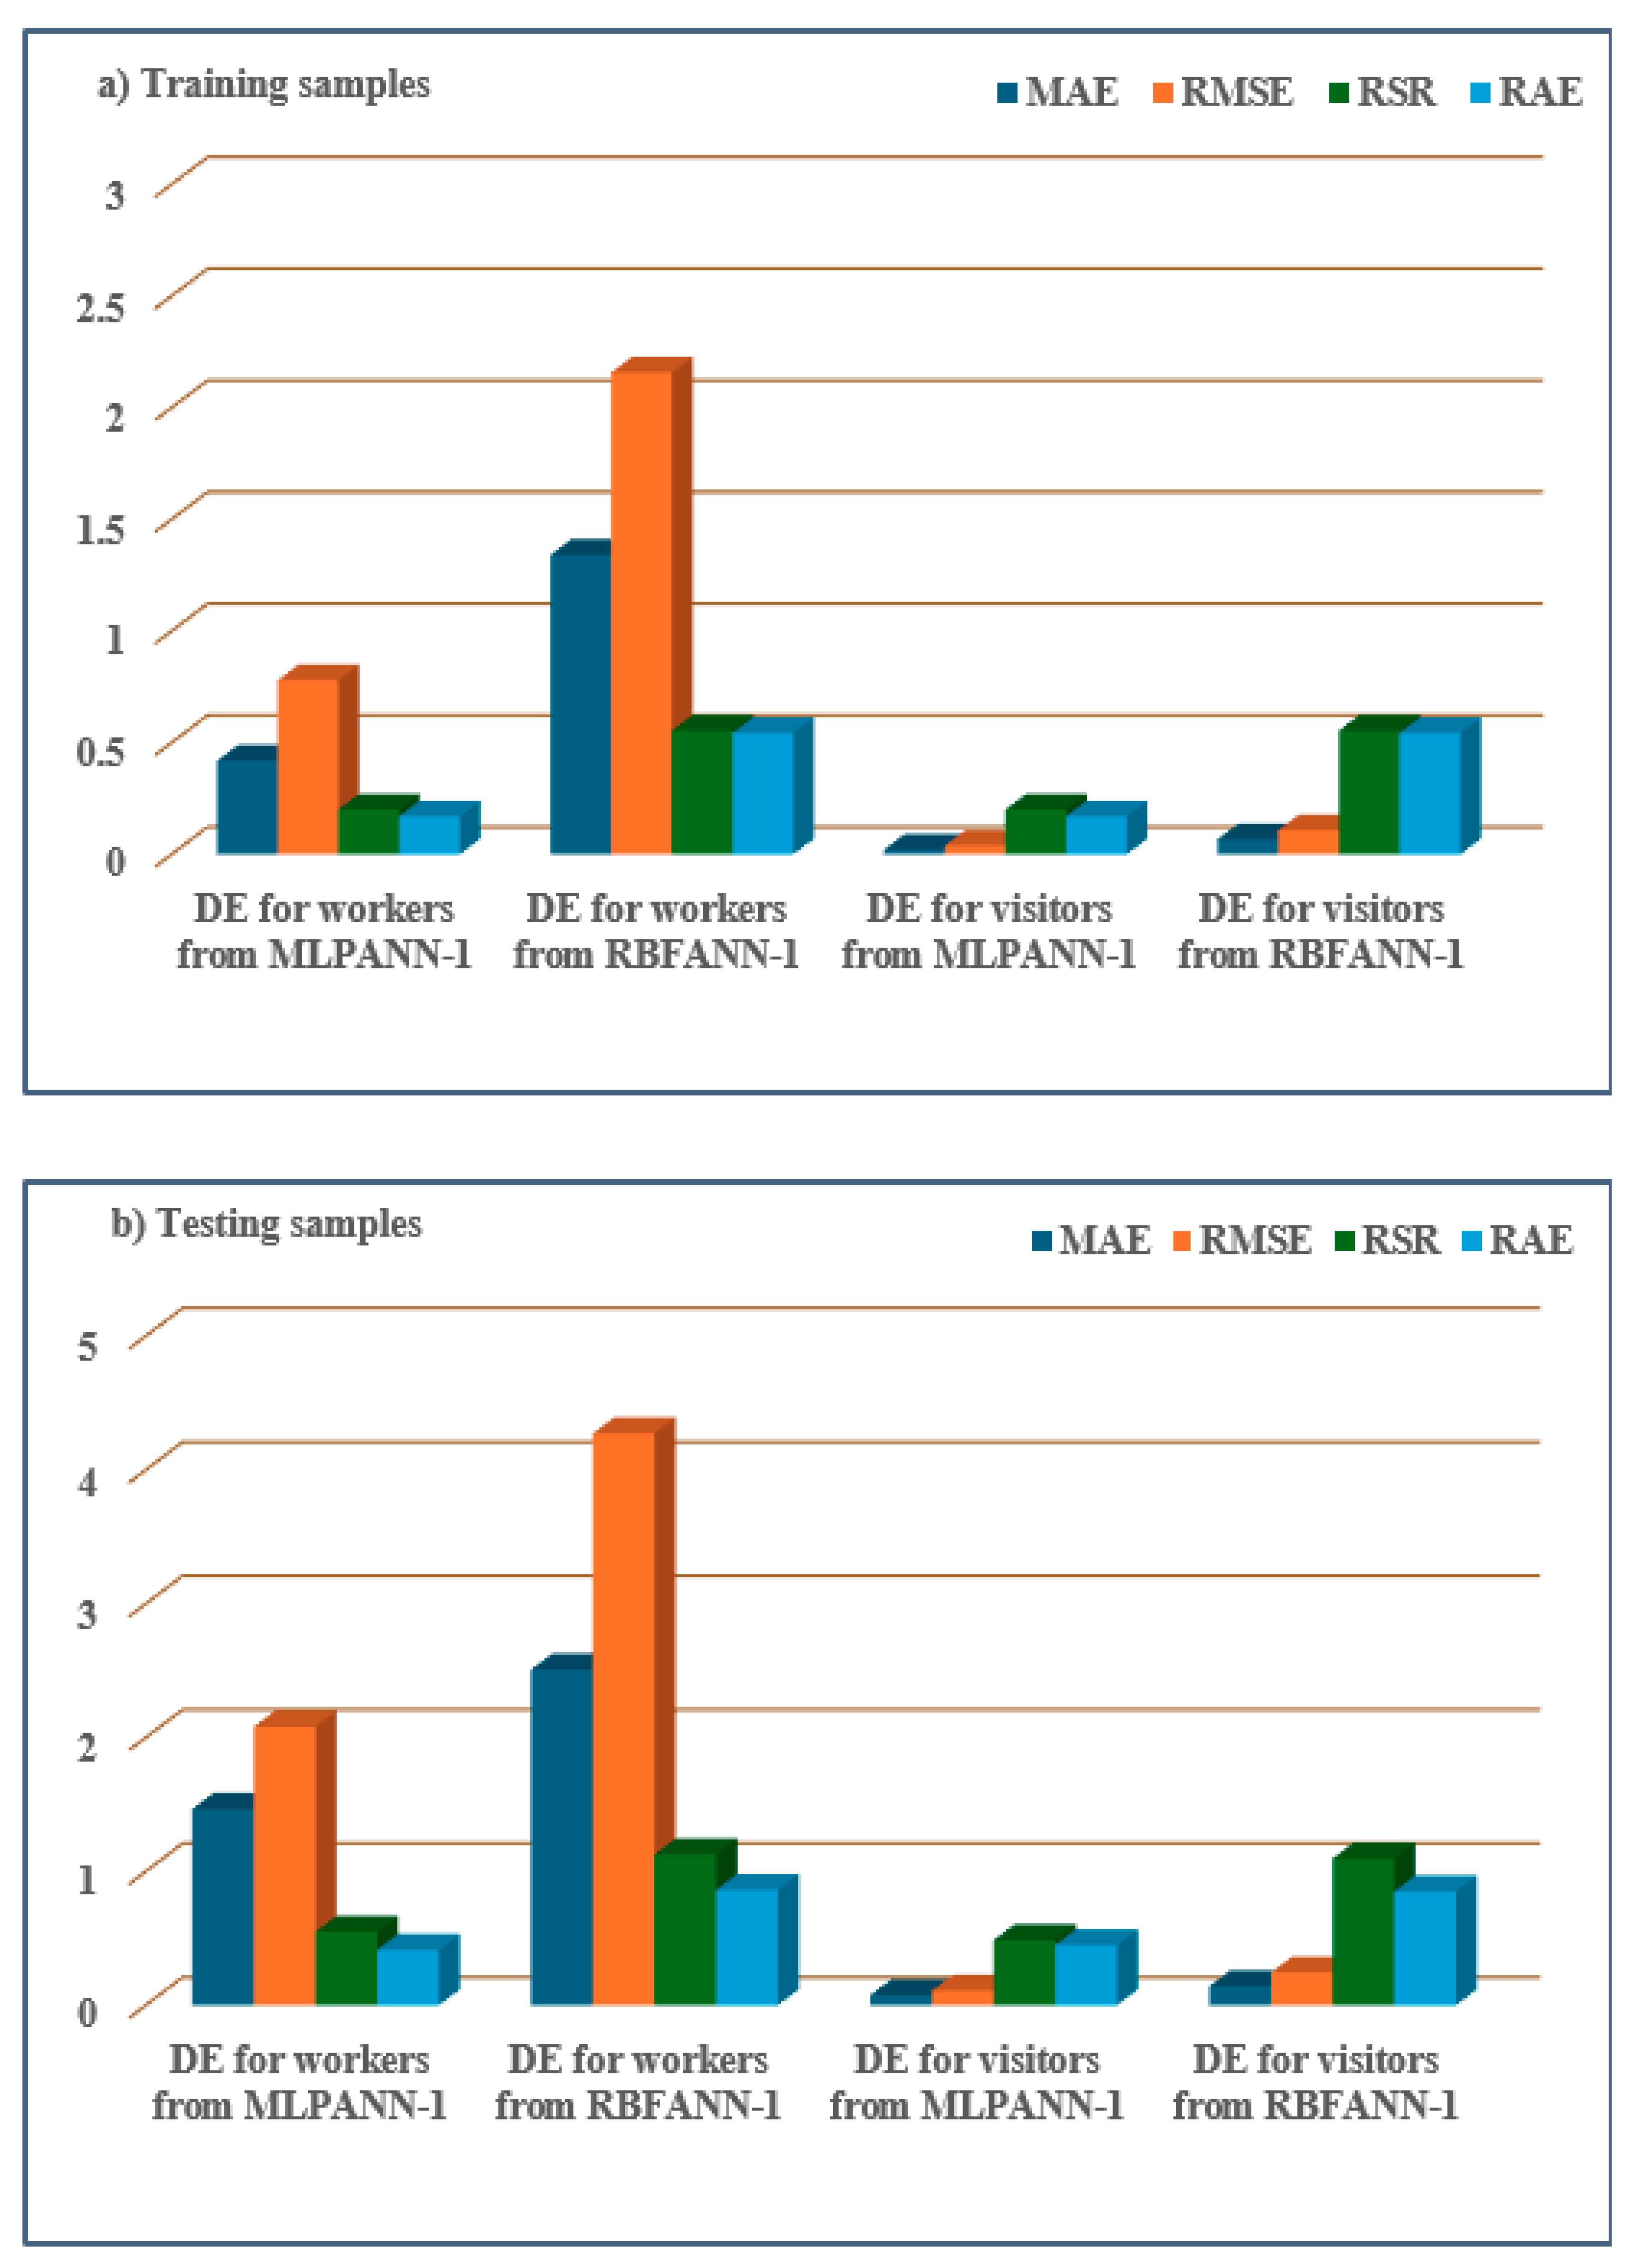
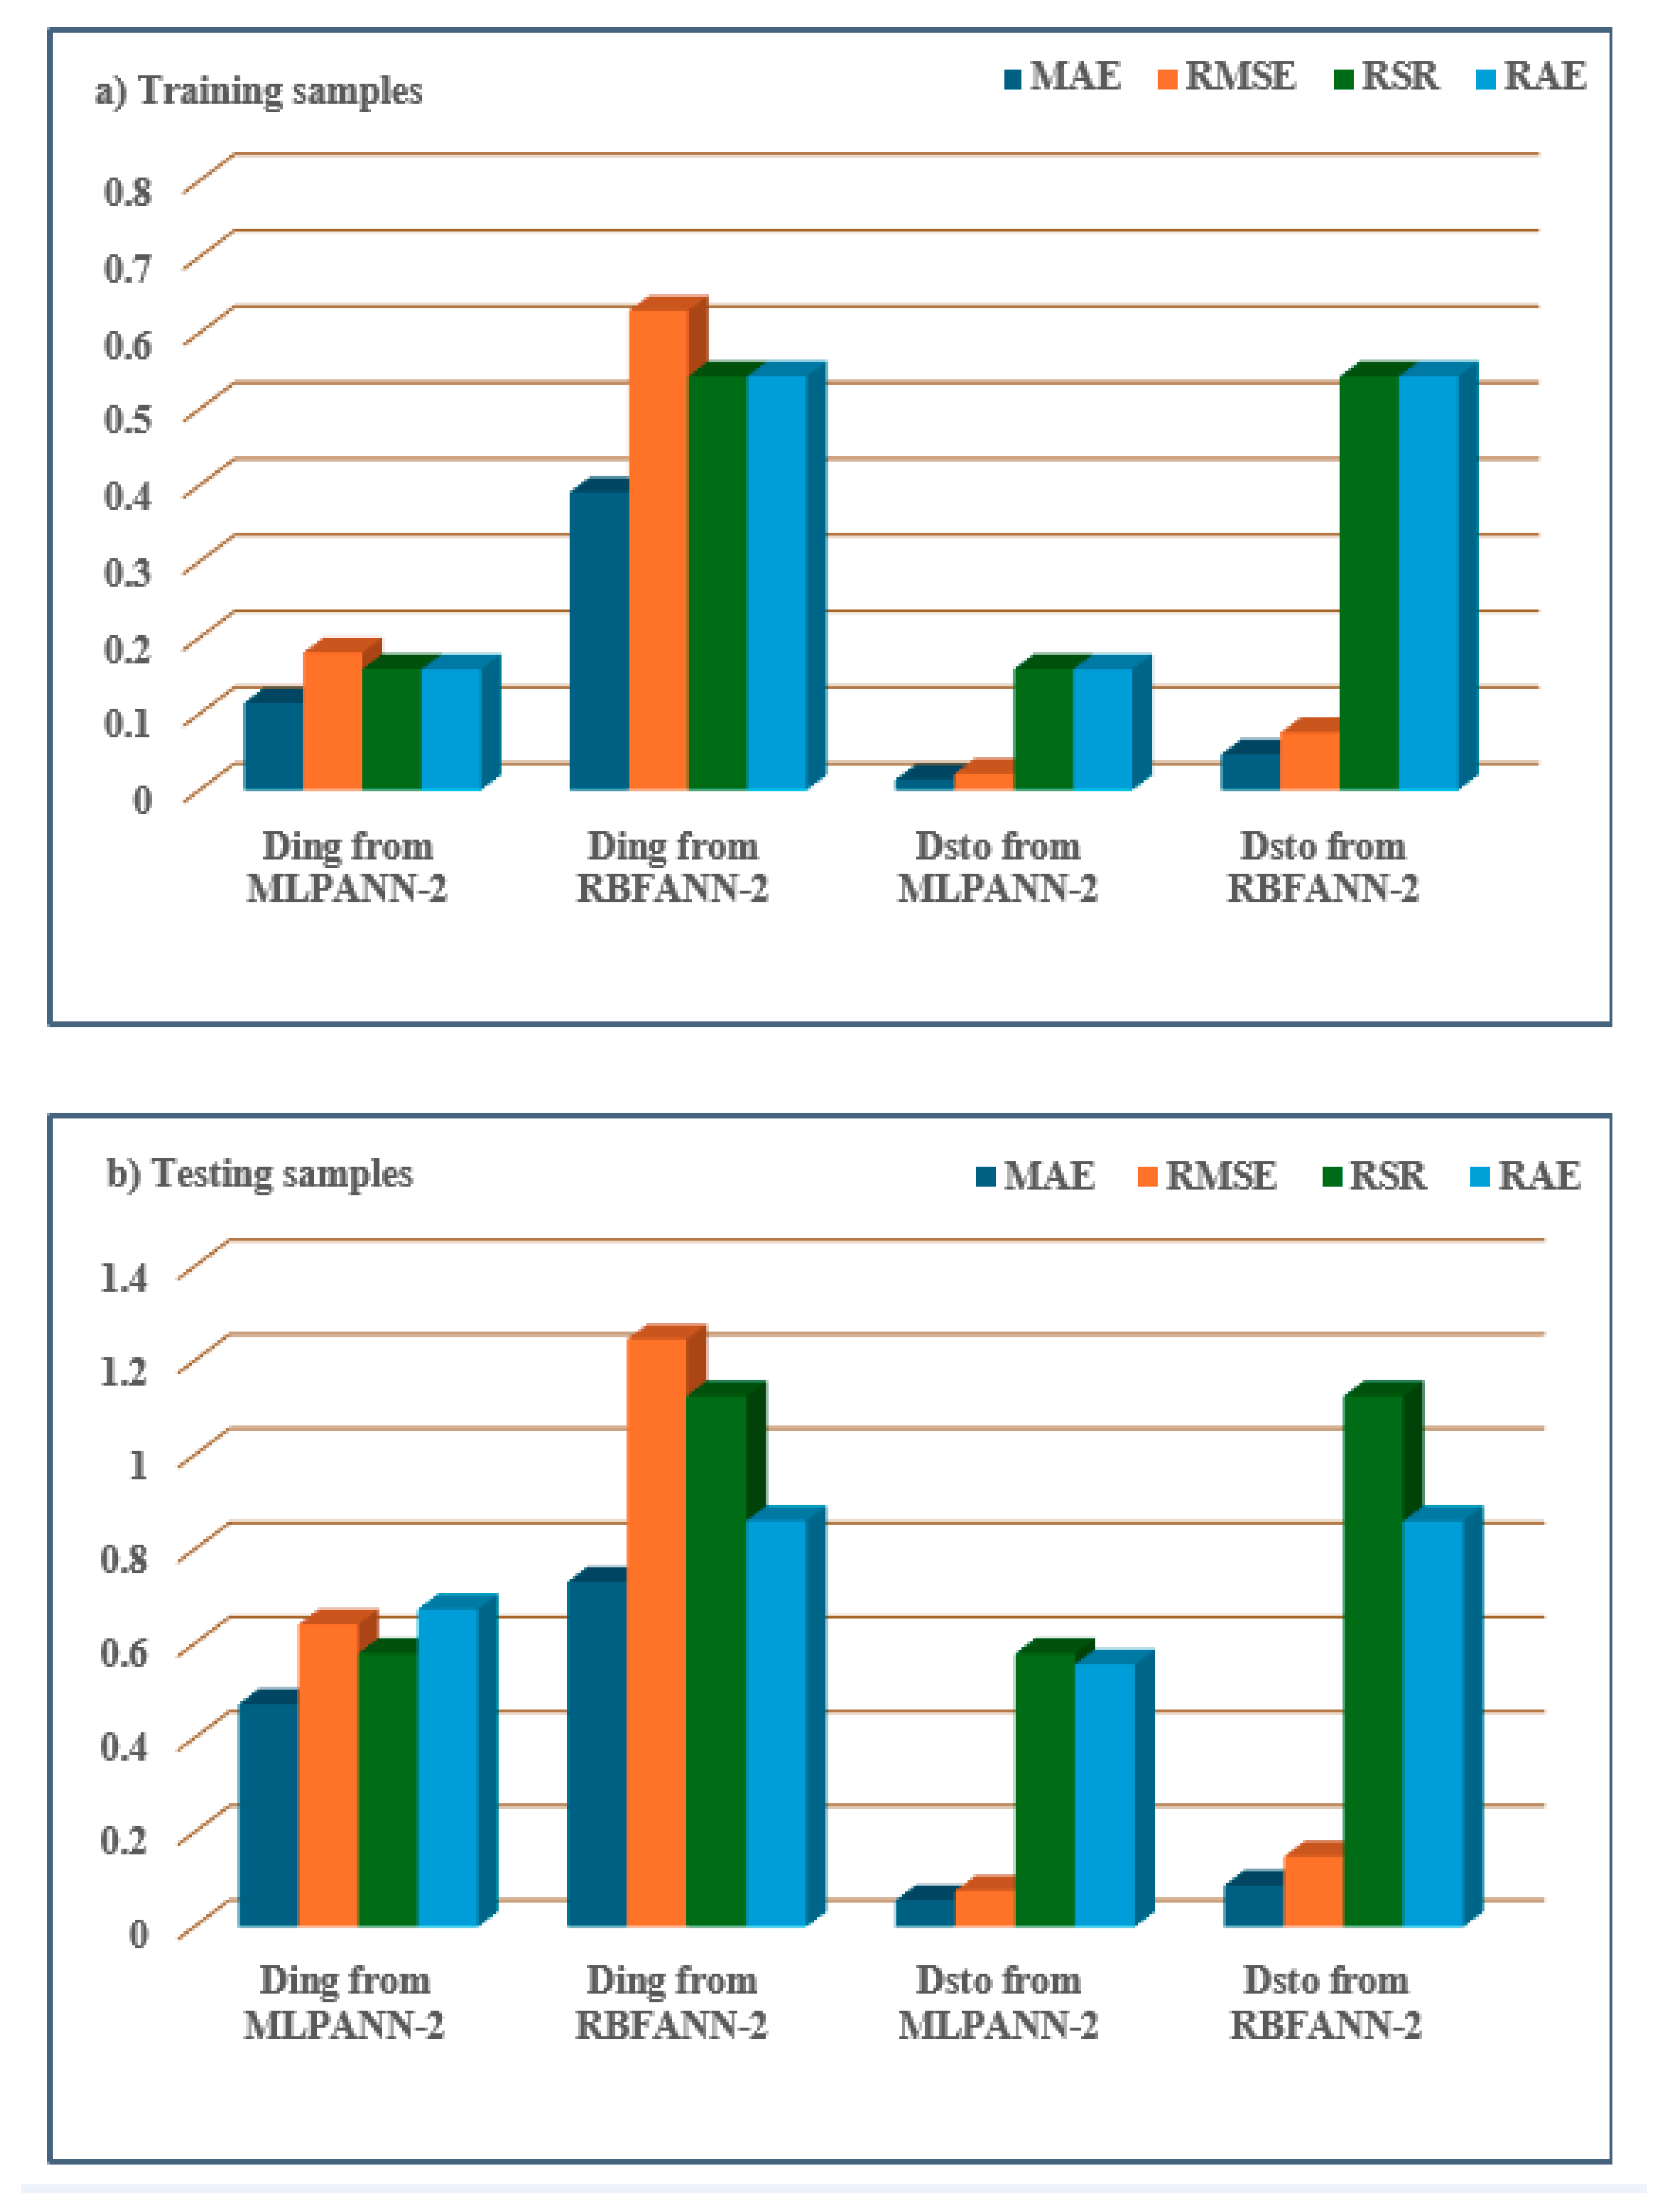



| pH | T | EC | DE for Workers | DE for Visitors | Ding | Dsto | |
|---|---|---|---|---|---|---|---|
| Parameters | (°C) | (mS/cm) | (μSv Year−1) | (μSv Year−1) | (μSv Year−1) | (μSv Year−1) | |
| Category | Input | Input | Input | Output | Output | Output | Output |
| N total | 189 | 189 | 189 | 189 | 189 | 189 | 189 |
| Minimum | 5.90 | 0.129 | 20.00 | 0.07992 | 0.00400 | 0.02331 | 0.00280 |
| Maximum | 9.00 | 16.290 | 98.00 | 22.32000 | 1.11600 | 6.51000 | 0.78120 |
| Mean | 7.25 | 3.562 | 44.70 | 3.11779 | 0.15589 | 0.90936 | 0.10912 |
| Median | 7.07 | 2.260 | 41.00 | 1.87200 | 0.09360 | 0.54600 | 0.06552 |
| Standard deviation | 0.72 | 3.45 | 20.20 | 3.90 | 0.19 | 1.14 | 0.14 |
| Skewness | 0.60 | 1.97 | 1.11 | 2.61 | 2.61 | 2.61 | 2.61 |
| Kurtosis | −0.57 | 3.38 | 0.53 | 7.55 | 7.55 | 7.55 | 7.55 |
| Model | Health Risk Parameter | Data | MAE | RMSE | RSR | RAE |
|---|---|---|---|---|---|---|
| MLPANN-1 | DE for workers | Training set | 0.4191 | 0.7792 | 0.2002 | 0.1698 |
| Testing set | 1.4653 | 2.0797 | 0.5481 | 0.4126 | ||
| DE for visitors | Training set | 0.0210 | 0.0390 | 0.2002 | 0.1698 | |
| Testing set | 0.0748 | 0.1082 | 0.4858 | 0.4492 | ||
| MLPANN-2 | Ding | Training set | 0.1142 | 0.1803 | 0.1588 | 0.1586 |
| Testing set | 0.4730 | 0.6418 | 0.5799 | 0.6738 | ||
| Dsto | Training set | 0.0137 | 0.0216 | 0.1588 | 0.1586 | |
| Testing set | 0.0568 | 0.0770 | 0.5800 | 0.5568 | ||
| RBFANN-1 | DE for workers | Training set | 1.3409 | 2.1575 | 0.5542 | 0.5432 |
| Testing set | 2.5084 | 4.2725 | 1.1261 | 0.8612 | ||
| DE for visitors | Training set | 0.0670 | 0.1079 | 0.5543 | 0.5432 | |
| Testing set | 0.1413 | 0.2442 | 1.0962 | 0.8493 | ||
| RBFANN-2 | Ding | Training set | 0.3911 | 0.6293 | 0.5430 | 0.5432 |
| Testing set | 0.7316 | 1.2461 | 1.1261 | 0.8612 | ||
| Dsto | Training set | 0.0469 | 0.0755 | 0.5430 | 0.5431 | |
| Testing set | 0.0878 | 0.1495 | 1.1261 | 0.8610 |
| Performance Indices | Best Value |
|---|---|
| MAE | 0 |
| RMSE | 0 |
| RSR | 0 |
| RAE | 0 |
| Training | Testing | ||||||||
|---|---|---|---|---|---|---|---|---|---|
| DE for Workers | DE for Workers | DE for Visitors | DE for Visitors | DE for Workers | DE for Workers | DE for Visitors | DE for Visitors | ||
| MLPANN-1 | RBFANN-1 | MLPANN-1 | RBFANN-1 | MLPANN-1 | RBFANN-1 | MLPANN-1 | RBFANN-1 | ||
| MAE | Value | 0.4191 | 1.3409 | 0.0210 | 0.0670 | 1.4653 | 2.5084 | 0.0748 | 0.1413 |
| Score | 2 | 1 | 2 | 1 | 2 | 1 | 2 | 1 | |
| RMSE | Value | 0.7792 | 2.1575 | 0.0390 | 0.1079 | 2.0797 | 4.2725 | 0.1082 | 0.2442 |
| Score | 2 | 1 | 2 | 1 | 2 | 1 | 2 | 1 | |
| RSR | Value | 0.2002 | 0.5542 | 0.2002 | 0.5543 | 0.5481 | 1.1261 | 0.4858 | 1.0962 |
| Score | 2 | 1 | 2 | 1 | 2 | 1 | 2 | 1 | |
| RAE | Value | 0.1698 | 0.5432 | 0.1698 | 0.5432 | 0.4126 | 0.8612 | 0.4492 | 0.8493 |
| Score | 2 | 1 | 2 | 1 | 2 | 1 | 2 | 1 | |
| Total | 8 | 4 | 8 | 4 | 8 | 4 | 8 | 4 | |
| Training | Testing | ||||||||
|---|---|---|---|---|---|---|---|---|---|
| Ding | Ding | Dsto | Dsto | Ding | Ding | Dsto | Dsto | ||
| MLPANN-2 | RBFANN-2 | MLPANN-2 | RBFANN-2 | MLPANN-2 | RBFANN-2 | MLPANN-2 | RBFANN-2 | ||
| MAE | Value | 0.1142 | 0.3911 | 0.0137 | 0.0469 | 0.4730 | 0.7316 | 0.0568 | 0.0878 |
| Score | 2 | 1 | 2 | 1 | 2 | 1 | 2 | 1 | |
| RMSE | Value | 0.1803 | 0.6293 | 0.0216 | 0.0755 | 0.6418 | 1.2461 | 0.0770 | 0.1495 |
| Score | 2 | 1 | 2 | 1 | 2 | 1 | 2 | 1 | |
| RSR | Value | 0.1588 | 0.5430 | 0.1588 | 0.5430 | 0.5799 | 1.1261 | 0.5800 | 1.1261 |
| Score | 2 | 1 | 2 | 1 | 2 | 1 | 2 | 1 | |
| RAE | Value | 0.1586 | 0.5432 | 0.1586 | 0.5431 | 0.6738 | 0.8612 | 0.5568 | 0.8610 |
| Score | 2 | 1 | 2 | 1 | 2 | 1 | 2 | 1 | |
| Total | 8 | 4 | 8 | 4 | 8 | 4 | 8 | 4 | |
Disclaimer/Publisher’s Note: The statements, opinions and data contained in all publications are solely those of the individual author(s) and contributor(s) and not of MDPI and/or the editor(s). MDPI and/or the editor(s) disclaim responsibility for any injury to people or property resulting from any ideas, methods, instructions or products referred to in the content. |
© 2025 by the author. Licensee MDPI, Basel, Switzerland. This article is an open access article distributed under the terms and conditions of the Creative Commons Attribution (CC BY) license (https://creativecommons.org/licenses/by/4.0/).
Share and Cite
Erzin, S. Optimization of Artificial Neural Networks for Predicting the Radiological Risks of Thermal Waters in Türkiye. Appl. Sci. 2025, 15, 10891. https://doi.org/10.3390/app152010891
Erzin S. Optimization of Artificial Neural Networks for Predicting the Radiological Risks of Thermal Waters in Türkiye. Applied Sciences. 2025; 15(20):10891. https://doi.org/10.3390/app152010891
Chicago/Turabian StyleErzin, Selin. 2025. "Optimization of Artificial Neural Networks for Predicting the Radiological Risks of Thermal Waters in Türkiye" Applied Sciences 15, no. 20: 10891. https://doi.org/10.3390/app152010891
APA StyleErzin, S. (2025). Optimization of Artificial Neural Networks for Predicting the Radiological Risks of Thermal Waters in Türkiye. Applied Sciences, 15(20), 10891. https://doi.org/10.3390/app152010891


