Article

Comparative Evaluation of Cow and Goat Milk Samples Utilizing Non-Destructive Techniques and Chemometric Approaches

by
Kyriaki Chatzimichail
1,
Georgia Ladika
1,
Paris Christodoulou
1,
Vasileios Bartzis
1,
Spyros J. Konteles
1,
Andriana E. Lazou
1,
Eftichia Kritsi
1,
Dionisis Cavouras
2,* and
Vassilia J. Sinanoglou
1,*
1
Laboratory of Chemistry, Analysis and Design of Food Processes, Department of Food Science and Technology, University of West Attica, Agiou Spyridonos, 12243 Egaleo, Greece
2
Department of Biomedical Engineering, University of West Attica, Agiou Spyridonos, 12243 Egaleo, Greece
*
Authors to whom correspondence should be addressed.
Appl. Sci. 2025, 15(20), 10883; https://doi.org/10.3390/app152010883
Submission received: 24 September 2025 / Revised: 8 October 2025 / Accepted: 8 October 2025 / Published: 10 October 2025
(This article belongs to the Section Chemical and Molecular Sciences)

Abstract

This study applied a multi-analytical methodology involving Attenuated Total Reflectance Fourier Transform Infrared (ATR-FTIR) spectroscopy, protein secondary structure determination, colorimetry, and texture analysis of milk images at a microscopic level to characterize 47 commercial cow and goat milk samples of different fat content (whole and light). Colorimetric measurements showed that hue values were significantly higher in light than in whole milks, providing a rapid marker of fat level, while microscopic image analysis indicated that whole milks had more heterogeneous textures with larger fat globules, whereas light milks were more homogeneous. ATR-FTIR spectra revealed lipids, proteins, and carbohydrates as the main constituents; lipid-associated bands were more intense in whole milks, whereas carbohydrate-associated bands, particularly at 1026–1028 cm−1, were stronger in cow milk. Protein secondary structure analysis confirmed β-parallel sheet as the predominant motif, with cow milk showing higher random coil and α-helix proportions and goat milk enriched in β-turn structures. Chemometric modeling using PCA and PLS-DA achieved robust classification of samples by species and fat content, while Receiver Operation Characteristics (ROC) analysis validated markers of differentiation. The combination of the above methodologies enables effective classification of cow’s and goat’s milk, offering a thorough product description.

1. Introduction

Milk and dairy products are among the most nutritionally complete foods, providing essential macro- and micronutrients such as proteins, lipids, carbohydrates, minerals, and vitamins that contribute significantly to human health across all life stages [1]. Due to their high nutritional value and widespread consumption, there is sustained scientific, industrial, and consumer interest in improving the quality, safety, and authenticity of milk and its derivatives [2,3]. According to the Food and Agriculture Organization, global milk production is expected to increase by 1.7% annually until 2028, outpacing most other agricultural commodities [4].
Among the various types of milk consumed worldwide, cow’s milk dominates production and trade, accounting for over 95% of the dairy market volume [5]. In 2022 alone, European countries produced over 154 million tonnes of cow’s milk, compared to 3 million tonnes of sheep milk and 2.5 million tonnes of goat milk [6]. However, in Mediterranean countries such as Greece, non-cow milk—particularly from goats and sheep—plays a significant role in dairy production and consumption, especially for traditional cheese and yogurt manufacturing [7].
Goat milk is increasingly recognized as a valuable alternative to cow milk due to its smaller fat globule size, which facilitates faster digestion, as well as its distinct protein profile, which may offer hypoallergenic benefits [8]. Compared to cow milk, goat milk generally contains higher levels of fat, protein, calcium, magnesium, and vitamin A, but less lactose and sodium [9,10]. Also, it has a thicker and creamier texture [8]. The compositional differences extend to casein micelle structure and whey protein fractions, affecting not only digestibility but also processing characteristics like coagulation behavior and heat stability [11,12]. As a result, goat milk is frequently used in specialized dairy products and marketed toward consumers with lactose intolerance or milk protein allergies.
The nutritional and functional properties of milk are influenced by several intrinsic and extrinsic factors, such as animal breed, lactation stage, feed, health status, rearing method, and environmental conditions [13,14]. Variations in the composition profile and balance of milk’s main compounds directly affect its nutritional quality, sensory characteristics, and technological performance. These factors result in complex variations in milk composition, which necessitate rapid, sensitive, and non-destructive analytical methods for its evaluation.
To this end, Attenuated Total Reflectance-Fourier Transform Infrared (ATR-FTIR) spectroscopy has emerged as a powerful tool for milk analysis. It enables the identification of key vibrational bands corresponding to functional groups in lipids, proteins, and carbohydrates, and allows for the evaluation of secondary protein structures, which are important for functional properties and product stability [15,16]. Complementary methods, such as color analysis, which quantifies visual parameters linked to composition (e.g., riboflavin and fat content), and light microscopic image analysis, which reveals structural attributes like fat globule size, further contribute to the overall characterization of milk samples [17,18,19]. Moreover, the integration of these analytical outputs with chemometric tools, including multivariate data analysis, enhances interpretability, pattern recognition, and classification of milk based on origin, processing state, or compositional attributes [20,21]. This analytical synergy provides a robust framework for quality assurance and innovation in dairy research.
In light of the above, the present study aims to comparatively evaluate various milk types (such as cow’s and goat’s milk) of different fat contents using ATR-FTIR spectroscopy, color assessment, texture analysis of microscopic images, and protein secondary structure characterization, in conjunction with chemometric modeling. While previous research has demonstrated the utility of ATR-FTIR spectroscopy for differentiating milk species or detecting adulteration [22,23], few studies have integrated spectral, structural, and image-derived features to achieve both high classification accuracy and biological interpretability. Moreover, by explicitly incorporating protein secondary structures into multivariate models, this work also explores the conformational aspects of milk proteins that underpin functional and technological properties. The ultimate scope of this study is to establish reliable markers for species- and fat-level discrimination and to demonstrate the potential of multi-modal, non-destructive analysis as a tool for milk characterization and quality control in the dairy sector. Finally, the integration of these multi-modal datasets through chemometrics could offer a robust and data-driven approach to milk classification.

2. Materials and Methods

2.1. Sampling and Lyophilization of the Milk Samples

The milk samples were purchased from the Greek market, transported to the laboratory, and stored under refrigerated conditions prior to analysis. The two most prevalent types of milk available on the market-cow’s and goat’s, were selected for analysis. A total of 47 samples from various commercial brands were examined, comprising 35 cow’s milk samples and 12 goat’s milk samples. Apart from their origin, the samples differed in terms of fat content, as whole (≈3.5% fat) or light (≈1.5% fat). Prior to spectroscopic analysis, milk samples were preserved at −80 °C for three days and then freeze-dried using a Gellert CryoDryer 20 lyophiliser (Langweid a. Lech, Bavaria, Germany) to eliminate water content. The vacuum was set to 0.80 mbar and the freeze-drying process began for the samples once the thermocouples registered −25 °C. This continued until complete dehydration was achieved. The milk samples, classified by animal origin and fat content, along with their sample codes (each code representing a specific commercial brand) and compositional data (mean values). Detailed sample labeling and compositional data are provided in Table S1 (Supplementary Material). The samples’ codes were: M11 for light cow’s milk, M12 for whole cow’s milk, M21 for light goat’s milk and M22 for whole goat’s milk, and the individual commercial brands were 17, 18, 4, and 8, respectively. For every commercial brand, three replicates were used.

2.2. Color Evaluation, Microscopic Image Analysis, and Statistical Assessment

Lightness (L*), red-green color (a*), yellow-blue color (b*), and hue angle (h), of milk samples were measured according to Tsiaka et al. [24] with the CR-400 Minolta chromatometer (Tokyo, Japan). For microscopic image analysis, a drop of each milk sample was carefully placed on a glass slide, covered with a coverslip, and observed at 10× magnification using an Olympus CX23 bright-field microscope fitted with an Olympus EP50 digital camera (Olympus Corporation, Tokyo, Japan). Each microscopy image was then divided into 70 square regions of interest (ROIs), with 10 horizontal and 7 vertical regions (Figure 1), in order to extract the appropriate textural features. A total of 15 statistical textural features were extracted from the grayscale versions of the microscopic images to analyze the textural differentiations of milk samples. These features were obtained using first-order statistics and gray-level co-occurrence matrix (GLCM)-based descriptors. These included the following: mean; standard deviation; contrast; energy; homogeneity; correlation; dissimilarity; angular second moment (ASM); gray-level non-uniformity (GLN); run-length non-uniformity (RLN); short-run emphasis (SRE); long-run emphasis (LRE), and run percentage (RP). The above-mentioned features were calculated using the Python 3.10.6 scipy library (https://docs.scipy.org/doc/scipy/tutorial/, accessed in 5 June 2025).

2.3. ATR-FTIR Spectroscopy of the Lyophilized Milk Samples

According to Christodoulou et al. [25], lyophilised milk samples were analyzed using ATR-FTIR spectroscopy with an IRAffinity-1S FTIR spectrometer from Shimadzu in Kyoto, Japan. The same paper [25] states that LabSolutions IR software (version 2.21) was used to perform ATR correction, normalization, smoothing and peak picking on the milk samples’ FTIR spectra. Following the procedures described by Kritsi et al. [26], LabSolutions IR software examined the amide I area (1600–1700 cm−1) using Gaussian curves to determine the secondary structure of the proteins.

2.4. Univariate Statistical Analysis

One-way Analysis of Variance (ANOVA) was used to statistically evaluate quantitative results from the chemical composition, colorimetric parameters (L*, a*, b*, hue angle), ATR-FTIR spectral band intensities, and the proportions of the secondary protein structure. Tukey’s post hoc test was then used to determine pairwise differences among means at p < 0.05. IBM SPSS Statistics (Version 29.0, IBM Corp., Chicago, IL, USA) was used to conduct this analysis. Furthermore, correlations between the respective FTIR band intensities and the macronutrient content (as stated on the product label) were investigated using Pearson’s correlation coefficients (r).

2.5. Chemometrics and Multivariate Statistical Analysis

The ATR-FTIR spectral datasets were normalized using Pareto scaling (mean-centered and divided by the square root of the standard deviation) prior to multivariate analysis. All analyses were performed with the MetaboAnalyst 6.0 platform (www.metaboanalyst.ca, accessed on 25 May 2025). To investigate natural clustering patterns and detect outliers, an unsupervised Principal Component Analysis (PCA) was first applied. For supervised classification, Partial Least Squares Discriminant Analysis (PLS-DA) was then employed to distinguish among the four milk groups: whole cow, light cow, whole goat, and light goat. The models incorporated 18 ATR-FTIR spectral band intensities along with four secondary protein structures (β-sheet, α-helix, β-turn, random coil) derived from Gaussian deconvolution of the amide I region. Model reliability was tested using 1000-fold permutation analysis, and predictive accuracy was further evaluated by cross-validation. Variable Importance in Projection (VIP) scores were calculated to determine the features contributing most to discrimination. Marker analysis was subsequently carried out to identify variables responsible for discrimination. Receiver Operating Characteristic (ROC) curve analysis was applied for three targeted comparisons: (i) cow vs. goat milk, (ii) cow whole vs. goat whole milk, and (iii) cow light vs. goat light milk. Features with an n area under the curve (AUC) > 0.70 and p < 0.05 were considered as validated markers.

3. Results and Discussion

3.1. Nutritional Information and Color Parameters of Milk Samples

The chemical composition of milk differs between species and breeds [14]. The composition of goat’s milk is significantly influenced by factors such as season, lactation stage, breed, diet and environmental conditions [27]. The same is true of cow’s milk, whose composition can be affected by internal and external animal factors. These include the hygiene of the udder, microbial activity and enzyme reactions in raw milk, breed, stage of lactation, milk quality control and processing procedures [28]. Table 1 presents the chemical composition of total fat, carbohydrates, sugars, protein, and salt per 100 g of milk for each milk type as indicated on their labels. The data revealed significant differences between the various types of milk. The most important findings are listed below. The fat content of milk is not influenced by the species of animal from which it originates. Therefore, whole cow’s and goat’s milk do not differ significantly in fat content, and the same was found for light milks. Felice et al. [29] reported that goat’s milk contains smaller fat globules than cow’s milk, which makes it easier to digest for many people. The fat in goat’s milk possesses higher proportions of short-chain fatty acids [30], imparting its unique flavor. In contrast, cow’s milk contains higher concentrations of longer-chain fatty acids, which affect the product’s structure and consistency [31]. Goat’s milk has a significantly higher protein content than cow’s milk (p < 0.05). The two main characteristics that distinguish goat’s milk from cow’s milk are the size of the casein micelles and the low level of alpha-S1-casein, which is a protein associated with allergic reactions [32]. Therefore, goat’s milk is less allergenic than cow’s milk. Also, cow’s milk has a significantly higher salt concentration than goat’s milk. A significant difference (p < 0.05) in carbohydrate content was found between light cow’s milk and whole goat’s milk. Regarding sugar content, cow’s milk has a significantly higher value than goat’s milk. According to Chauhan et al. [33], cow’s milk contains a higher concentration of lactose than goat’s milk, making the latter a better choice for those who are lactose intolerant.
It was deemed necessary to measure the color parameters of milk samples as consumers’ perception of food is significantly influenced by its hue (see Table 2).
With respect to color parameters, no variation in lightness was observed among the milk samples, irrespective of their type or fat content. Light cow’s milk also showed a significantly (p < 0.05) lower a* value than whole cow’s milk. There was significant variation in the yellow parameter b* of cow’s milk, with low-fat milk having the lowest (p < 0.05) value and full-fat milk the highest. The goat milks did not differ from each other and ranged between values. According to Milovanovic et al. [34], whole cow’s milk has a more intense yellowish b* parameter due to the presence of carotenoids, especially beta-carotene, which are not metabolized by cows. According to Chudy et al. [35], the natural color of milk is due to the presence of both water- and fat-soluble pigments. The water-soluble pigment is riboflavin, also known as vitamin B2, which gives milk its yellow color with green fluorescence. Fat-soluble pigments are carotenoids, such as beta-carotene, retinol and xanthophylls, which range in color from yellow to orange and deep red-orange. Interestingly, the values for hue (position of a color on a color wheel) were significantly higher (p < 0.05) in light milks (yellow-green, chartreuse) compared to whole milks (yellow-green, lime). This indicates that colorimetry is a rapid, easy-to-apply, non-destructive and reliable method of distinguishing between light and whole milk. Milovanovic et al. [34] also reported that milk color, could be affected by the animal diet and breed, parity and animal age, lactation stage, and seasonal calving.

3.2. Assessment of Milk Samples Using Texture Analysis of the Microscopic Images

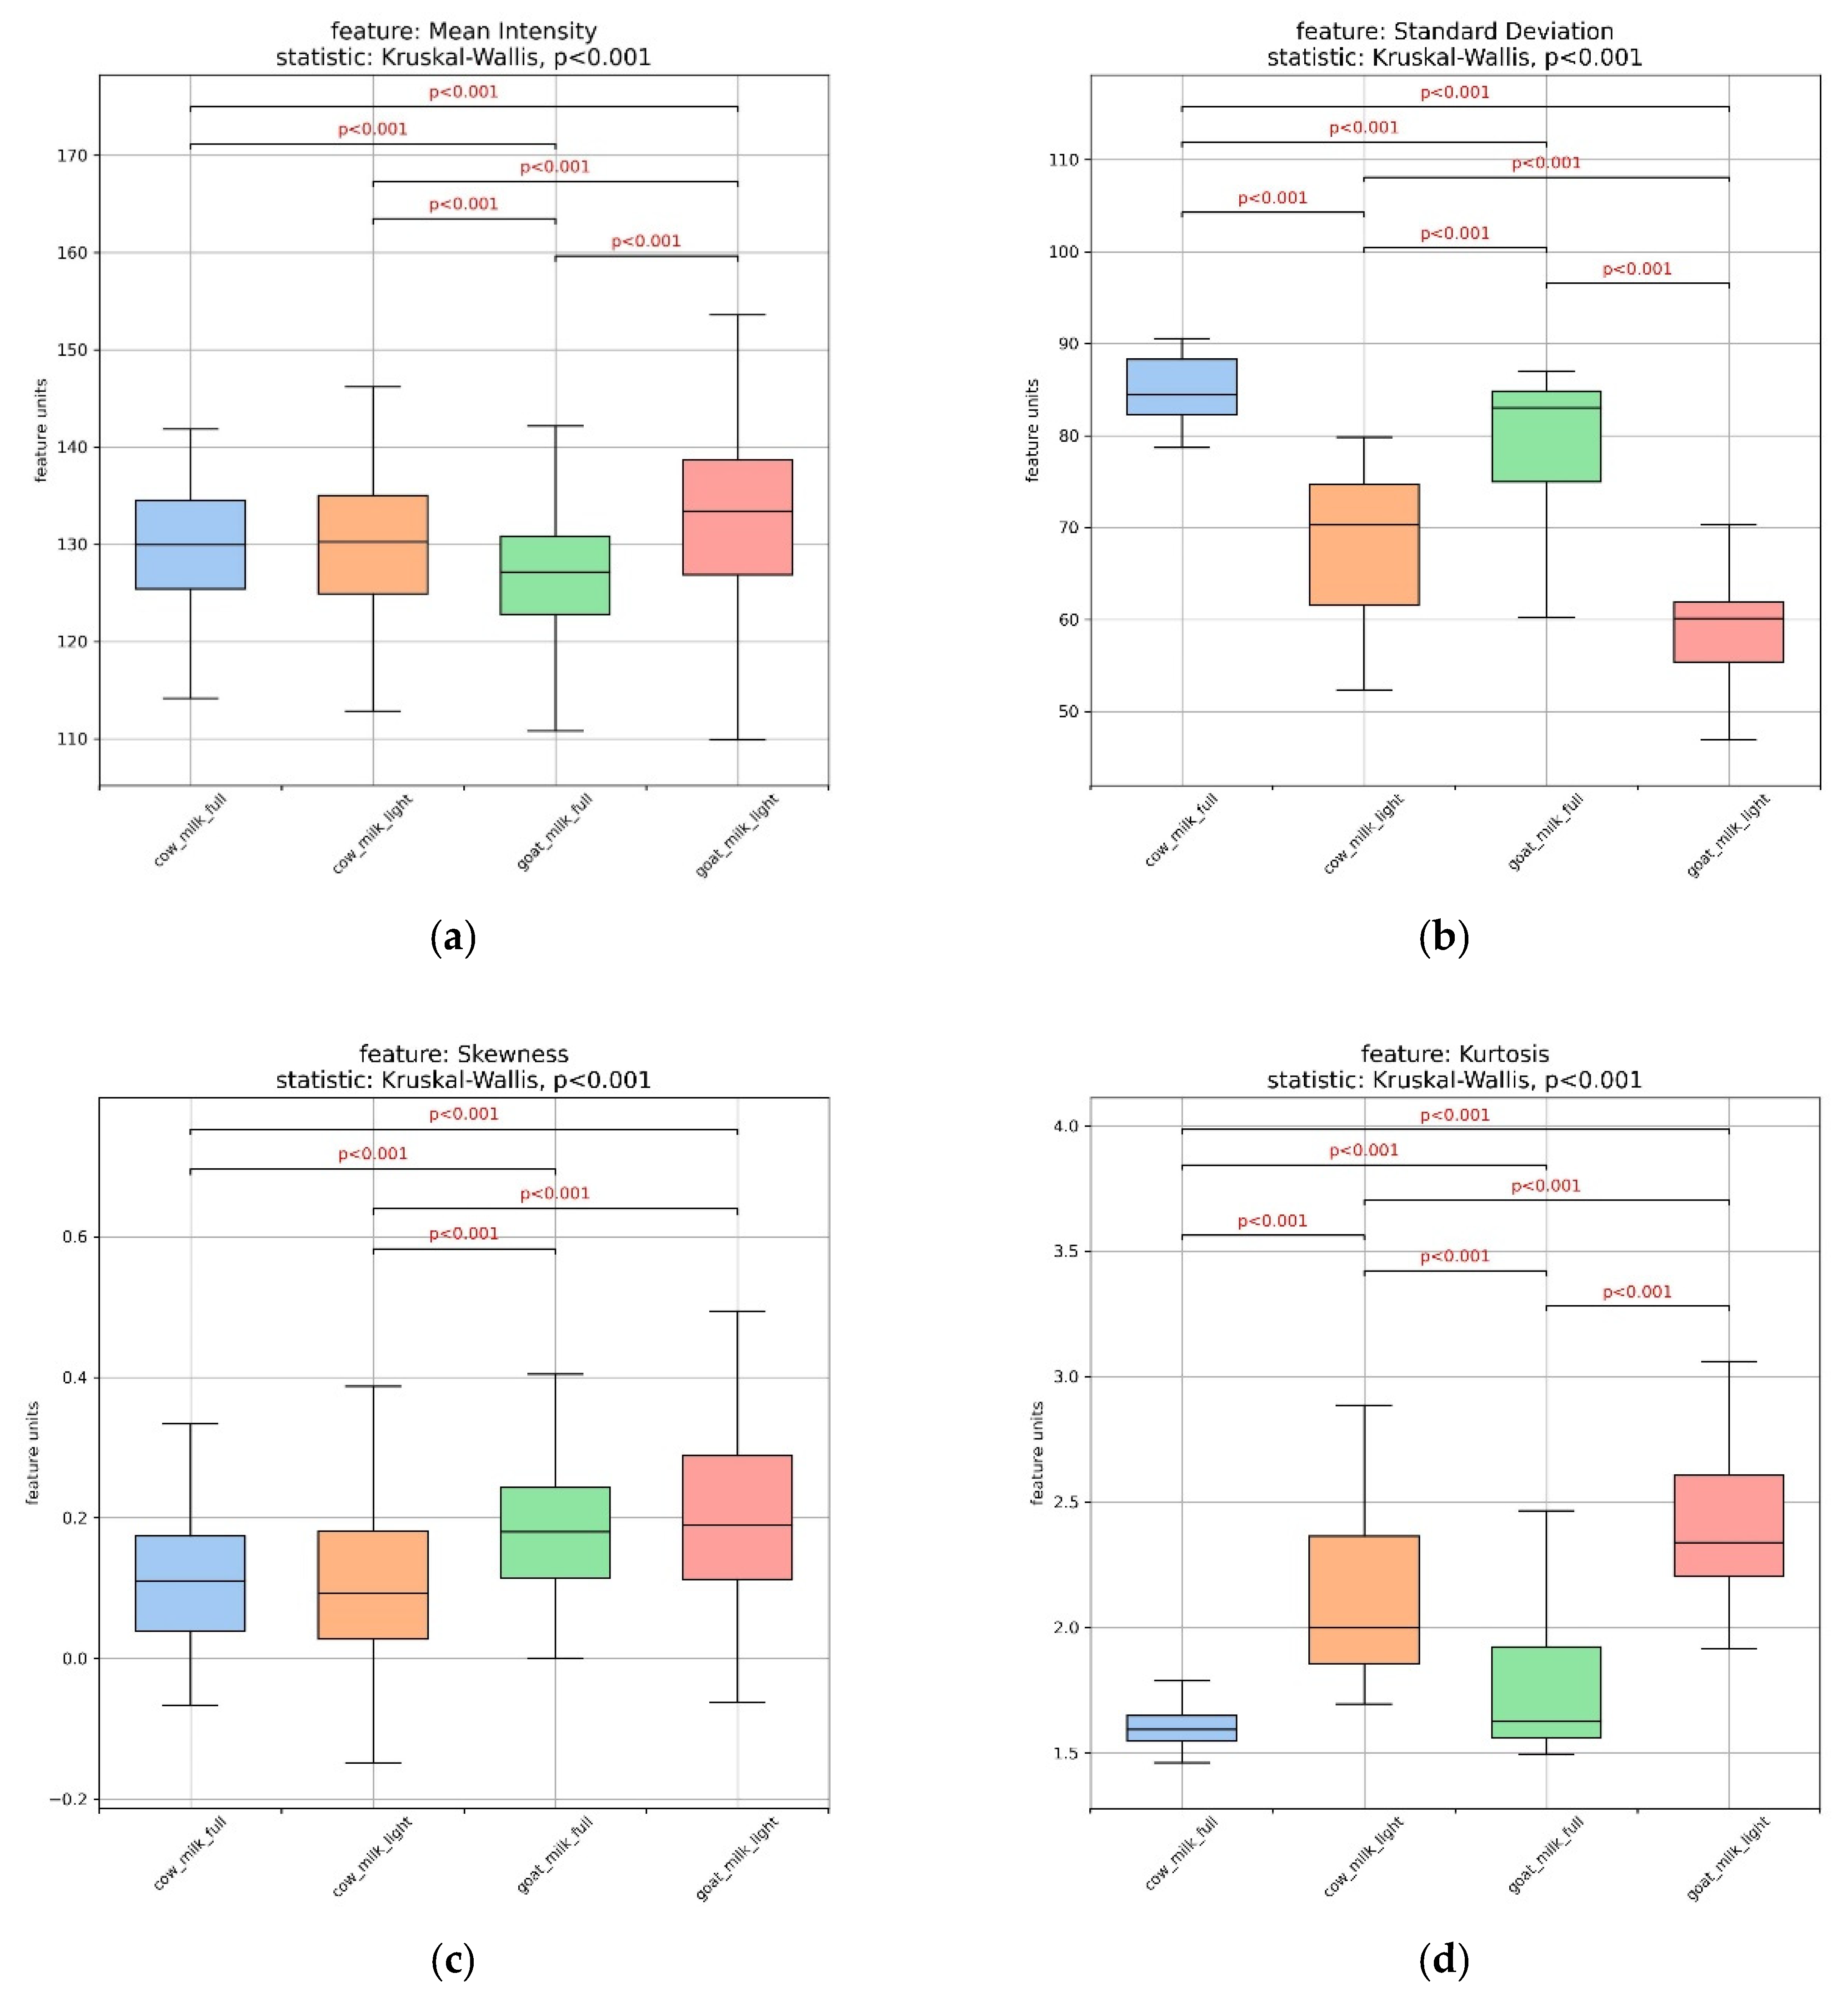
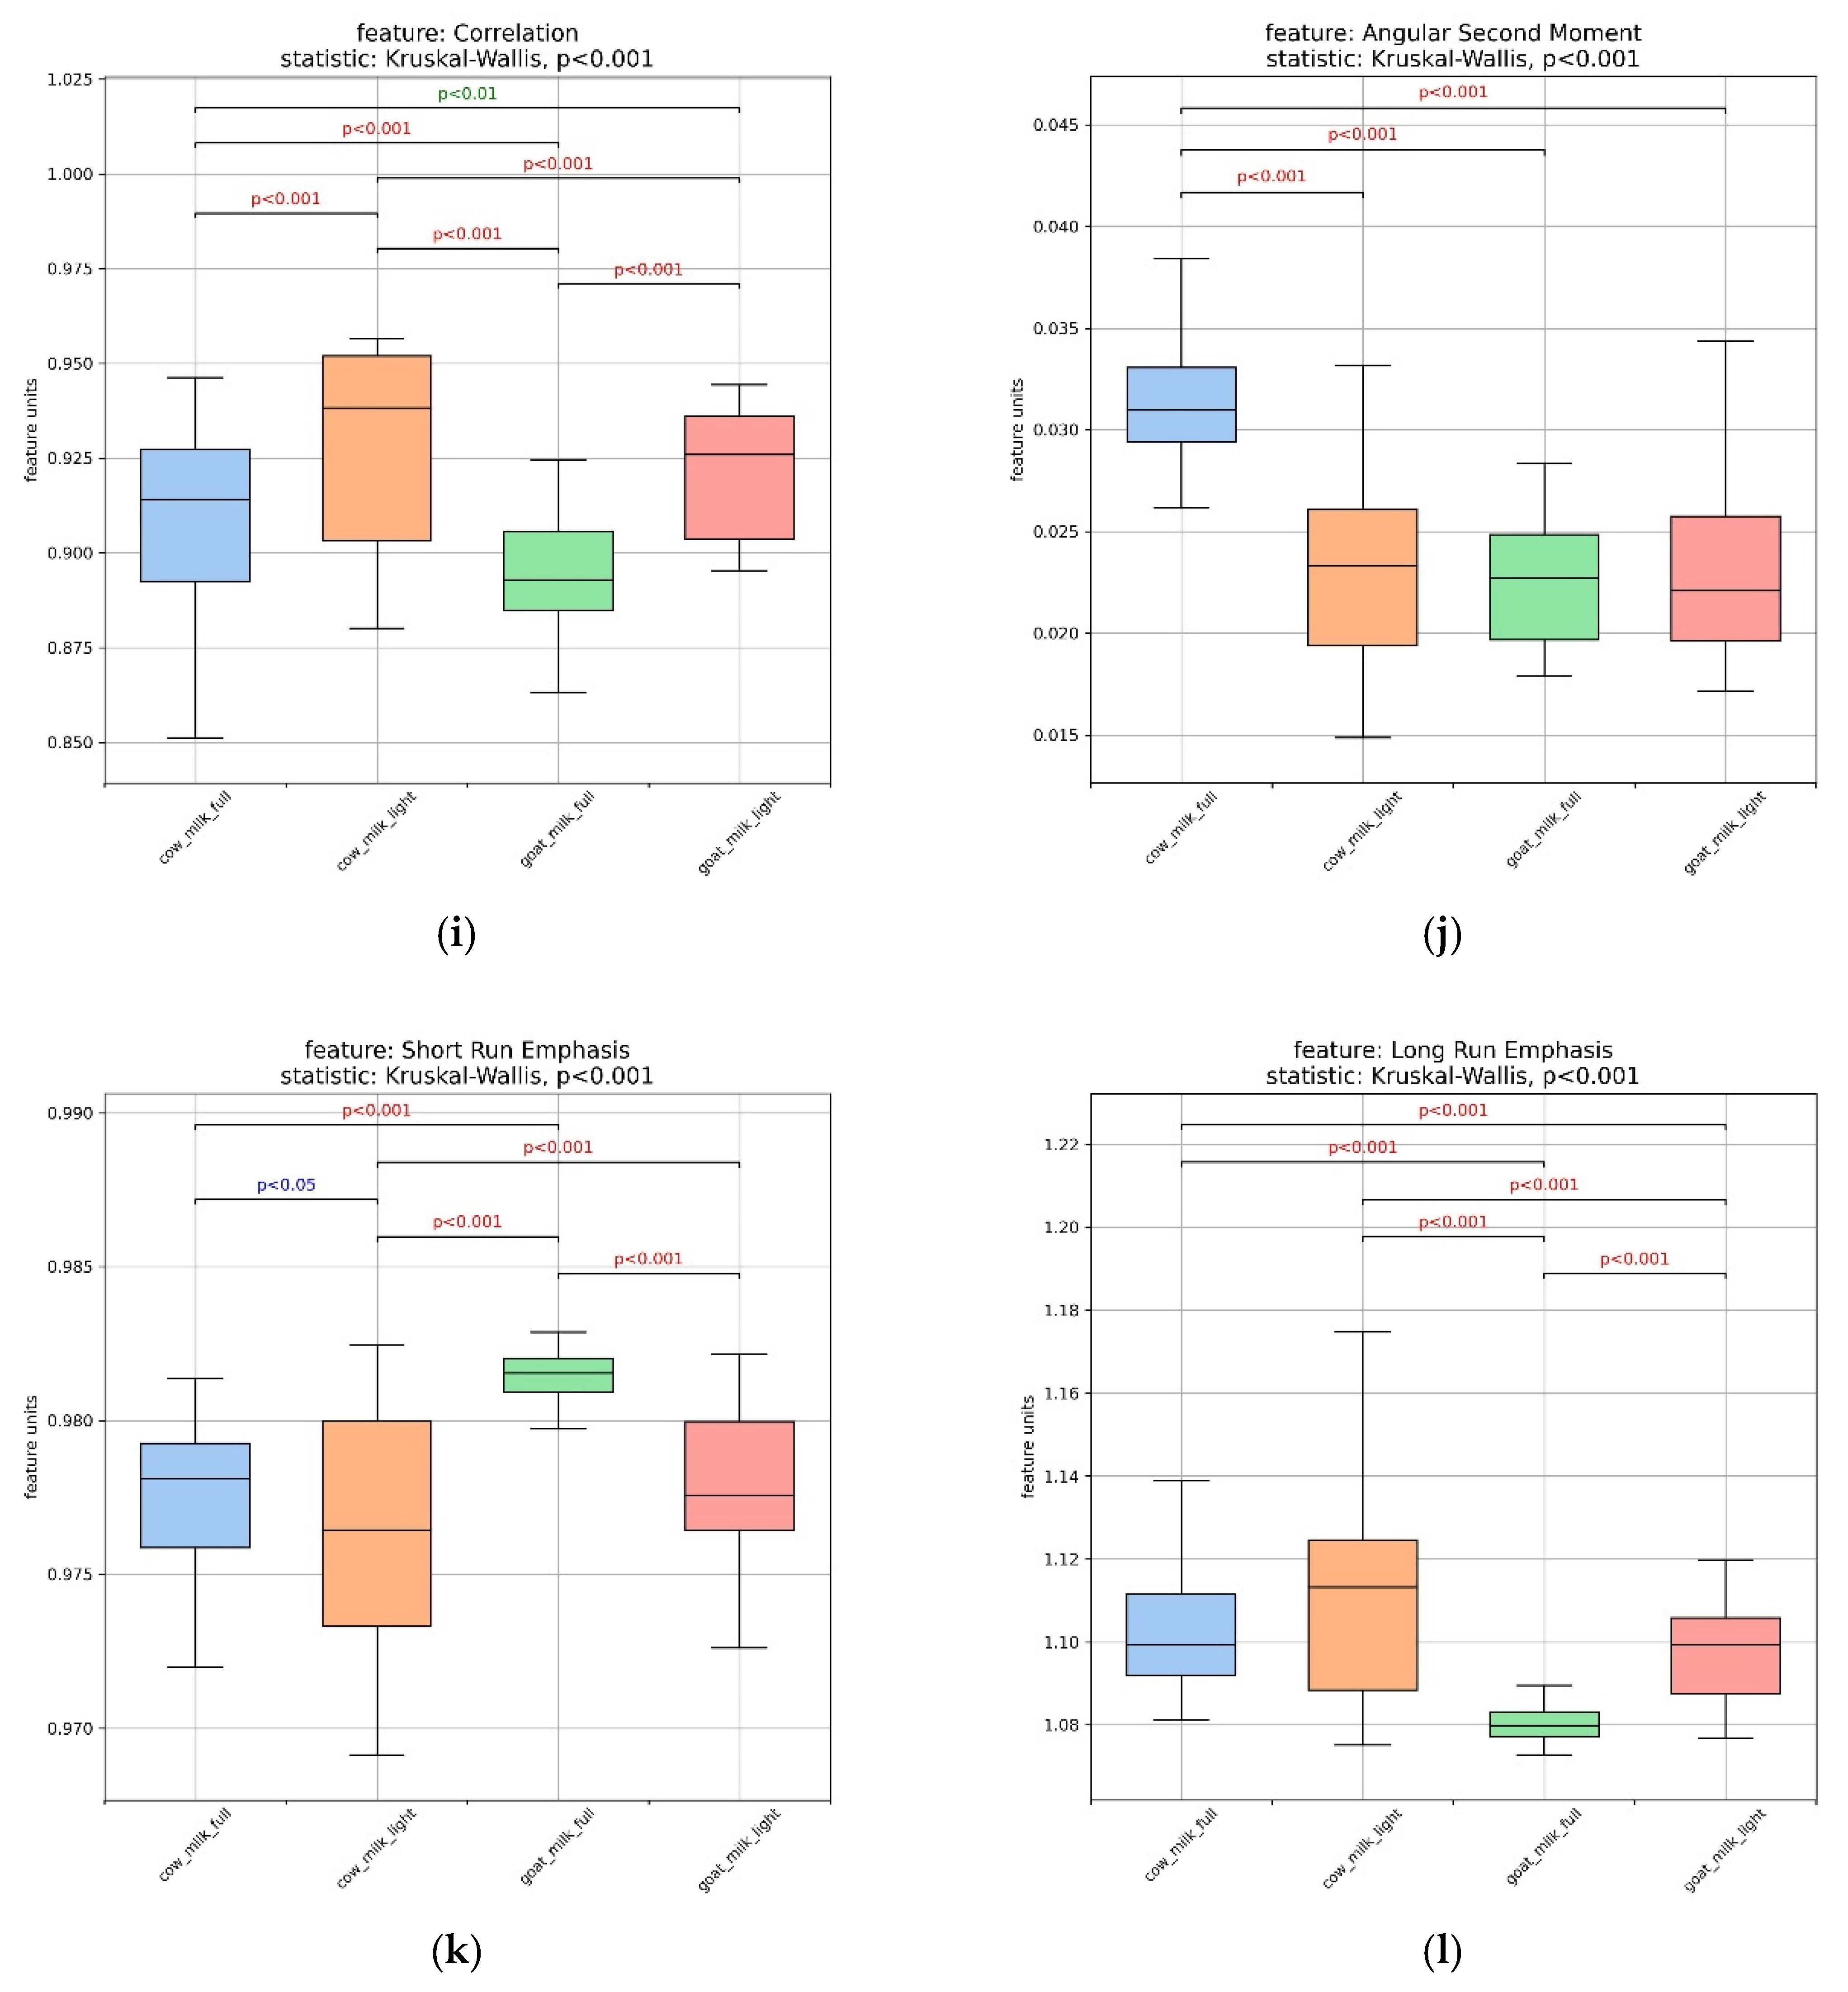
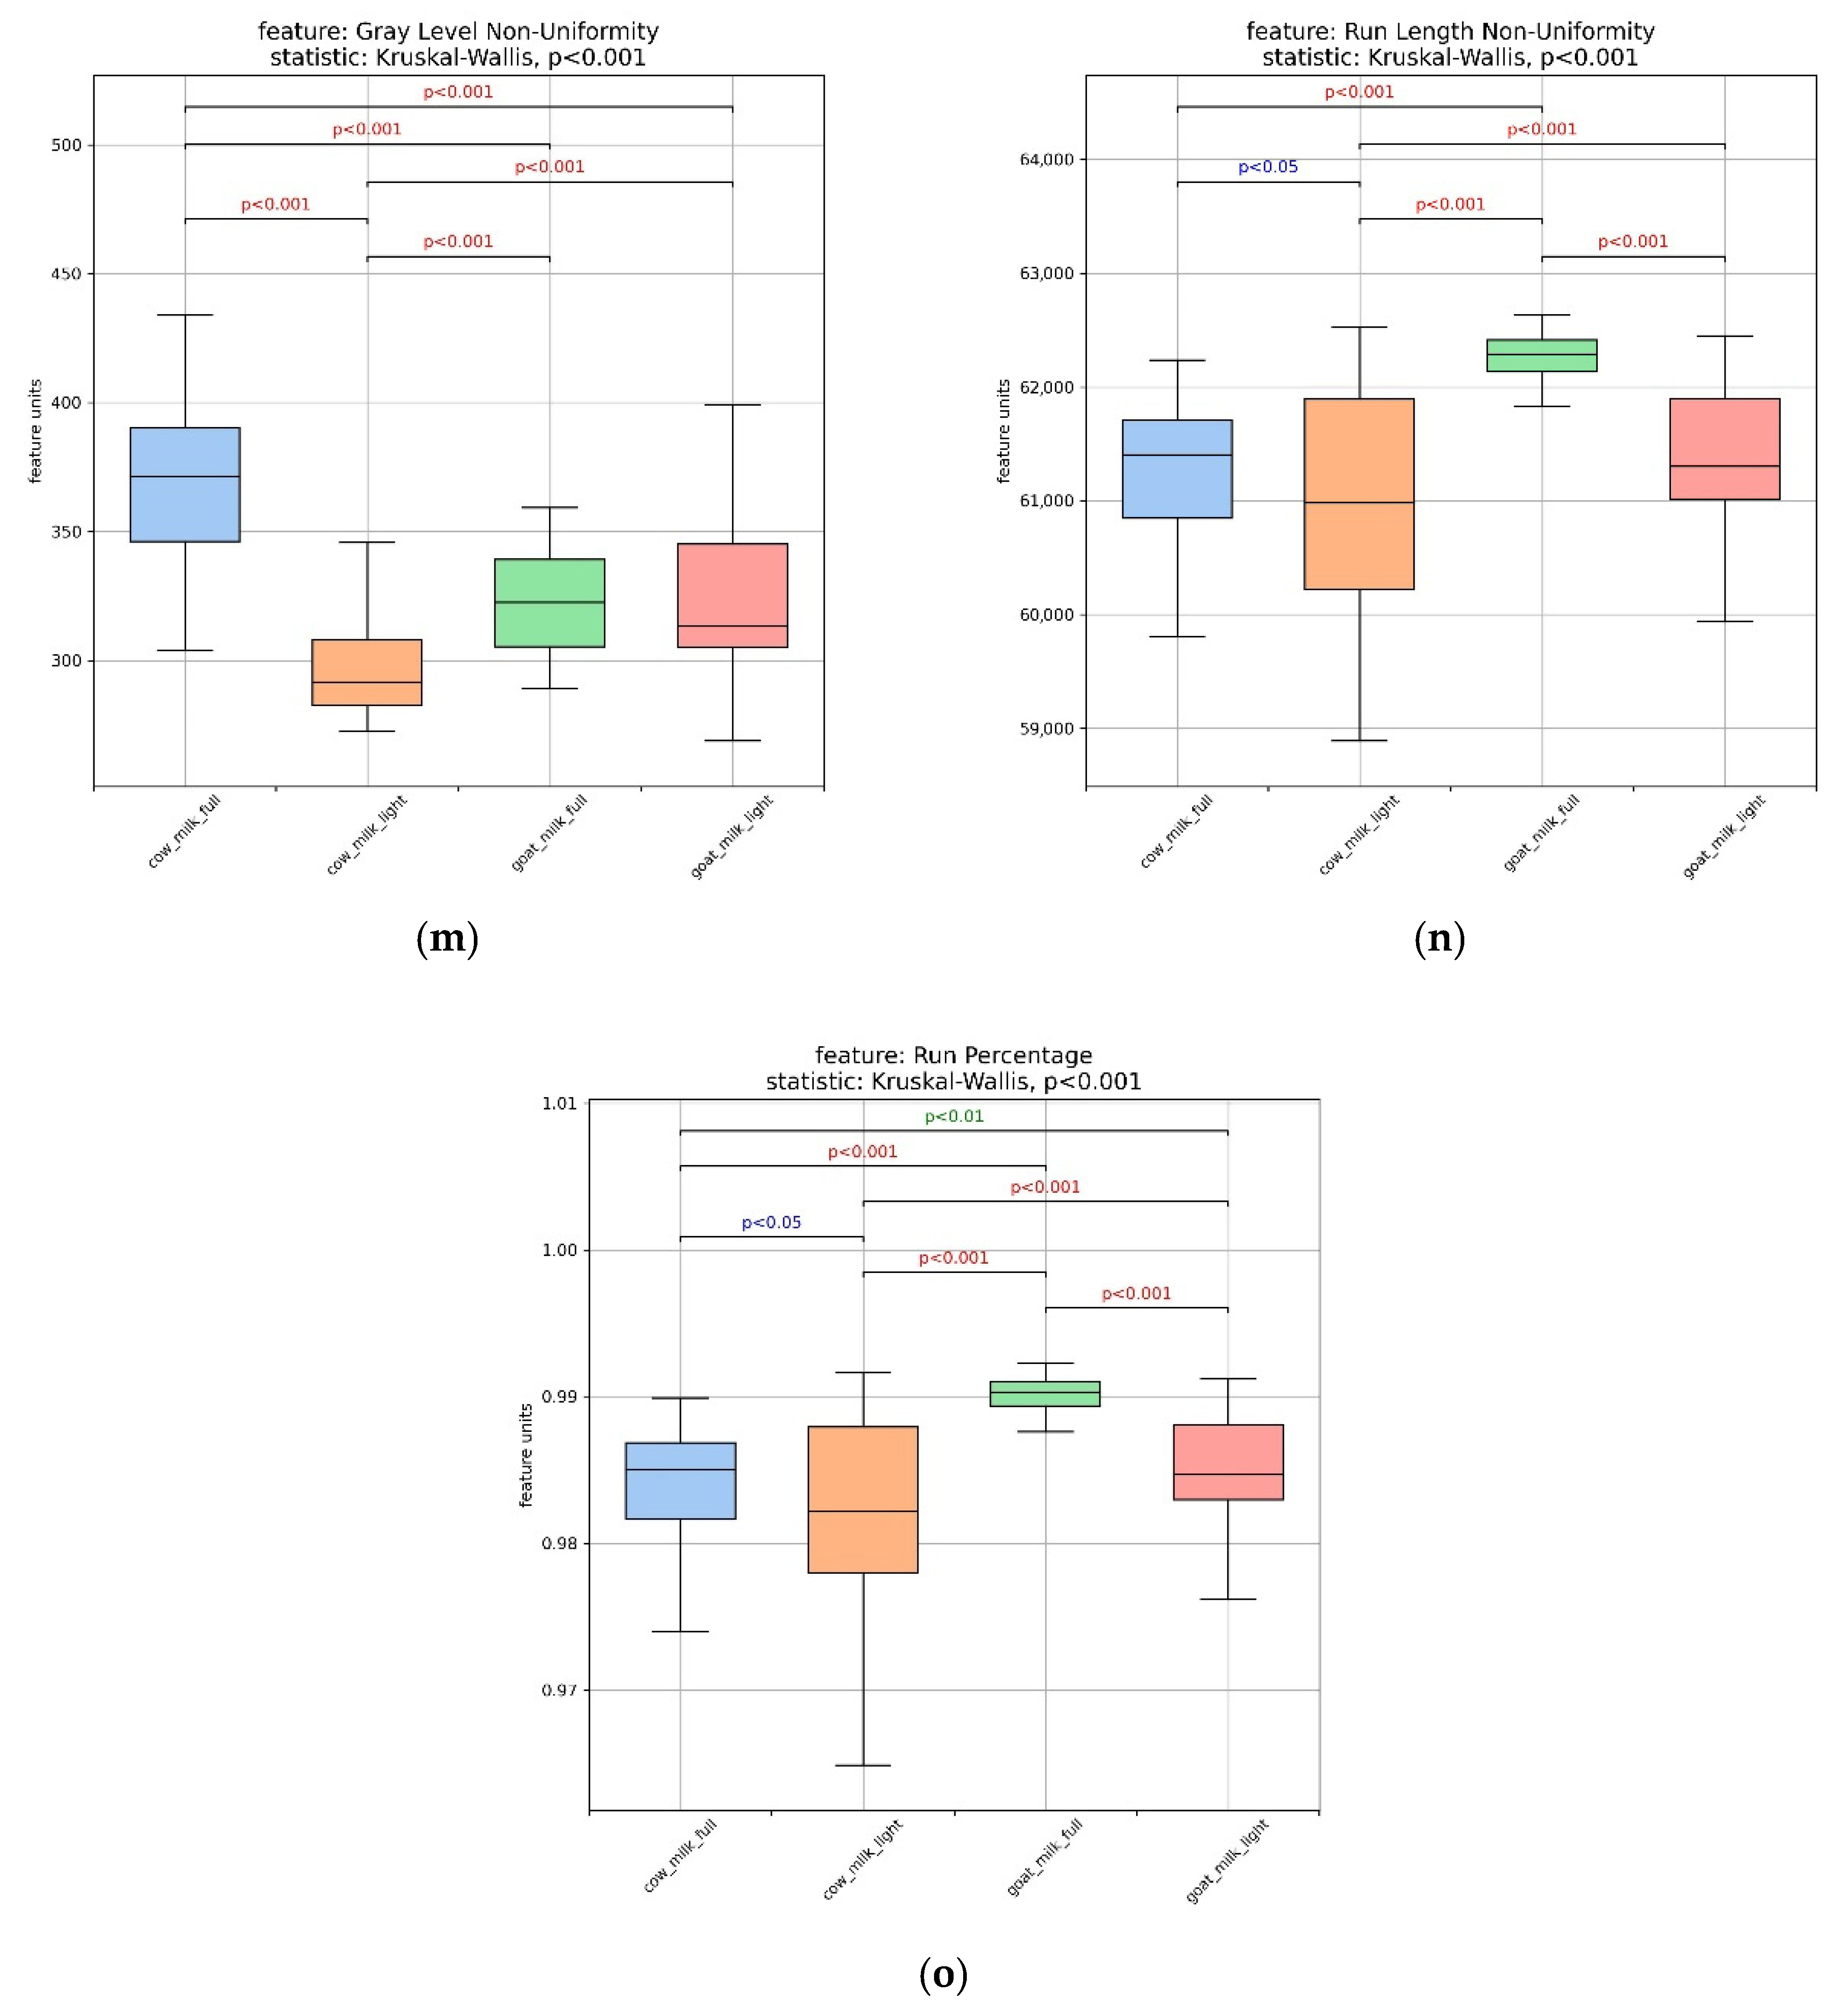
As indicated in the Section 2, the microscopic images of the milk samples were processed using image analysis. The resulting textural features were then statistically correlated according to the origin and fat content of the milk samples. The results obtained were significant and interesting, as discussed below in Figure 2. Initially, the standard deviation, contrast, dissimilarity and GLN values were significantly higher (p < 0.05) and the kurtosis, homogeneity and correlation values were significantly lower (p < 0.05) for whole milk microscopic images than for light milk images. According to Christodoulou et al. [25], the above-mentioned changes in textural features suggest that whole milk is more heterogeneous than light milk in terms of its image texture. Since the main difference between these milks is their fat content, it can be concluded that reducing the fat content makes the milk more homogeneous. Consistent with this finding, Cheong et al. [36] reported that whole milk contains larger fat globules, making it less homogeneous. Interestingly, goat’s milk yielded significantly higher (p < 0.05) skewness values than cow’s milk, regardless of its fat content. As the skewness value evaluates the asymmetry of pixel intensity within the region of interest of microscopic images of milk, it appears that the visual weight of the components of goat’s milk emulsion is not evenly distributed compared to cow’s milk. This finding may be related to the fact that goat’s milk has a higher protein content and a lower sugar content than cow’s milk (as shown in Table 2). Furthermore, energy and ASM values of whole cow’s milk were significantly higher (p < 0.05) than those of all the other milk samples, which did not differ from each other. As energy and ASM measure the textural uniformity and the orderliness of an image, it is possible that these values are correlated with the larger, more numerous fat globules contained in whole cow’s milk [29]. Finally, whole goat’s milk presented significantly higher (p < 0.05) SRE, RLN, RP values, and significantly lower (p < 0.05) long-run emphasis (LRE) values than those of all the other milk samples. These values are associated with small gray-level structures [37], which may be due to the smaller fat globules present in whole goat’s milk [29,38]. In conclusion, the features obtained from the microscopic images that indicate spatial variation in pixel intensity levels within the milk tissue can be correlated with the milk’s composition, homogeneity and smoothness.

3.3. ATR-FTIR Spectra Evaluation of Milk Samples

The analysis of ATR-FTIR spectra for the milk samples revealed significant findings, highlighting the importance of Fourier Transform Infrared (FTIR) spectroscopy in evaluating the chemical composition of milk based on milk type and its fat content. Representative ATR-FTIR spectra are shown in Figure S1 (Supplementary Material). The interpretation of each absorption band in the FTIR spectra (Table 3) is provided below, alongside a commentary on the results and a reference to the most interesting findings.
The amino group (N-H) stretching vibration (Amide I) in amides and proteins, as well as the hydroxyl group (O-H) stretching vibration in hydroxyl-containing compounds such as carbohydrates, phenolic and organic acids, etc., are linked to the spectra region at 3200–3300 cm−1 [39,40]. Light milks showed significantly (p < 0.05) higher intensity than whole milks. This finding could be attributed to light milks having a higher proportion of proteins and carbohydrates than lipids. The intensities of the bands at 2922 and 2854 cm−1, which correspond to the asymmetric and symmetric C(sp3)-H stretching vibrations of the methylene groups, that are predominantly present in lipids and secondarily in carbohydrates [25], were significantly (p < 0.05) higher in whole milks than in light milks, thereby confirming the higher fat content of whole milks, as shown in Table 2. In addition, light goat milks showed higher intensity at 2922 and 2854 cm−1 than light cow milks, while whole milks showed no significant difference, irrespective milk origin. Nikolaou et al. [41] reported that the intensity of goat milk was higher than that of cow milk at 2976–2884 cm−1, due to its higher content of fatty acids. The intensity of the carbonyl group (C=O) stretch, at 1741–1745 cm−1, which is mainly found in lipids (Balan et al., 2020) [16], was found to be significantly higher (p < 0.05) in whole milk than in light milk due to the higher fat content of whole milk. Moreover, the total fat content and the 2922, 2854 and 1741–1745 cm−1 intensities showed high positive Pearson correlations (R2 = 0.5658 0.5322, and 0.5467, respectively, p < 0.05). Cow’s light milk also had a significantly lower intensity than goat’s light milk, while there was no significant difference between whole cow’s and goat’s milks. Proteins present three spectra bands at 1638–1645 cm−1 of Amide I (stretching vibrations of C=O), at 1535–1545 cm−1 of Amide II (combined C-N stretching and N-H bending vibrations) and at 1280–1300 cm−1 of Amide III (combined O=C-N stretching and N-H bending vibrations) [26,39,40,42]. According to the results, light goat’s milk had the highest intensity (p < 0.05) at the Amide I band compared to all the other milk samples, while whole cow’s milk had the lowest. Moreover, whole cow’s milk presented significant lower (p < 0.05) intensity at the Amide II band than light goat’s milk samples. The intensities of methyl and methylene groups scissoring, and twisting vibrations, of lipids, proteins, and carbohydrates, at 1440–1450, and 1380–1370 cm−1 [26,40,43], resulted significant (p < 0.05) variations among samples. These intensities were notably higher in whole milk than in light milk, which supports the finding in Table 2 that whole milks have a higher fat content. Interestingly, the absorbance band at 1396–1400 cm−1 was only identified in light milk samples, suggesting that it could be used to distinguish light from whole milk. This band may be related to the symmetric bending of methyl groups in proteins and/or the symmetric stretching of the COO−1 group of amino acids and fatty acids [40,44]. It is also important to mention the intensities of the absorbance bands at 1242–1245, 1145–1149, 1064 and 1026–1028 cm−1, which are associated with stretching vibrations of the etheric bond primarily in mono- and polysaccharides, and secondarily in triglycerides [45]. The most important finding was the significantly higher (p < 0.05) milk intensities for cow’s milk than for goat’s milk at 1026–1028 cm−1, probably due to the higher sugar (Table 2) and lactose content of cow’s milk, as it is reported by Chauhan et al. [33]. In accordance with the above findings, Nicolaou et al. [41] also reported higher C-O absorption band values for carbohydrates at 1134–1018 cm−1. The second important finding was that the intensities of whole milks were significantly higher than those of light milks at 1064 cm−1, possibly due to the etheric bond of triglycerides. This is consistent with the higher fat content found in whole milks (Table 1). The intensities at 891 and 777 cm−1, which are attributed to the β-anomeric configuration of carbohydrates and lactose’s pyran ring skeleton vibrations, respectively [46,47], showed no significant differences between milk samples. Finally, no significant differences (p > 0.05) were revealed in the intensity of the bands at 700 and 538–542 cm−1, relating to the cis (Csp2-H) out-of-plane bend and the glycosidic linkage (C-O-C) in-plane bend, respectively [37,40], between the milk samples.
The profile of proteins’ secondary structure in cow and goat milks was further evaluated (Table 4). This outcome is important in food science because it affects the nutritional value and texture of food by improving thermal stability, influencing digestibility, functional properties and amino acid bioavailability. One of the most important findings was that a higher (p < 0.05) percentage of β-parallel sheet and a lower percentage of β-turn was detected, regardless of the milk’s origin or fat content. β-parallel sheet proteins play a critical role in the stability and functionality of dairy products, as well as increasing the coagulation capacity of milk [48,49]. Another important finding was that, irrespective of the fat content, cow’s milk showed higher proportions of random coil and α-helix, while goat’s milk showed higher proportions of β-turn structure. Finally, light milks have a significantly (p < 0.05) higher percentage of the β-parallel sheet structure than whole milks, irrespective of the milk’s origin. In general, the β-turn structure plays a key role in protein flexibility and can influence its interactions with other molecules in milk. This structure is essential for protein stability and functionality, and variations in its proportion can affect the quality and processing of milk [50]. Moreover, the random coil structure typically indicates flexibility in proteins, which can impact their functionality. Differences in random coil values between milk types may reflect variations in protein flexibility and rigidity [50]. The higher percentage of random coils in cow’s milk is due to the higher concentration of αs1-casein, which has a more flexible structure [48]. Furthermore, α-helix plays an important role in the structure and stability of proteins, and an increased presence of this structure in cow’s milk may be related to processing and storage methods [49].

3.4. Multivariate Statistical Analysis and Marker Validation

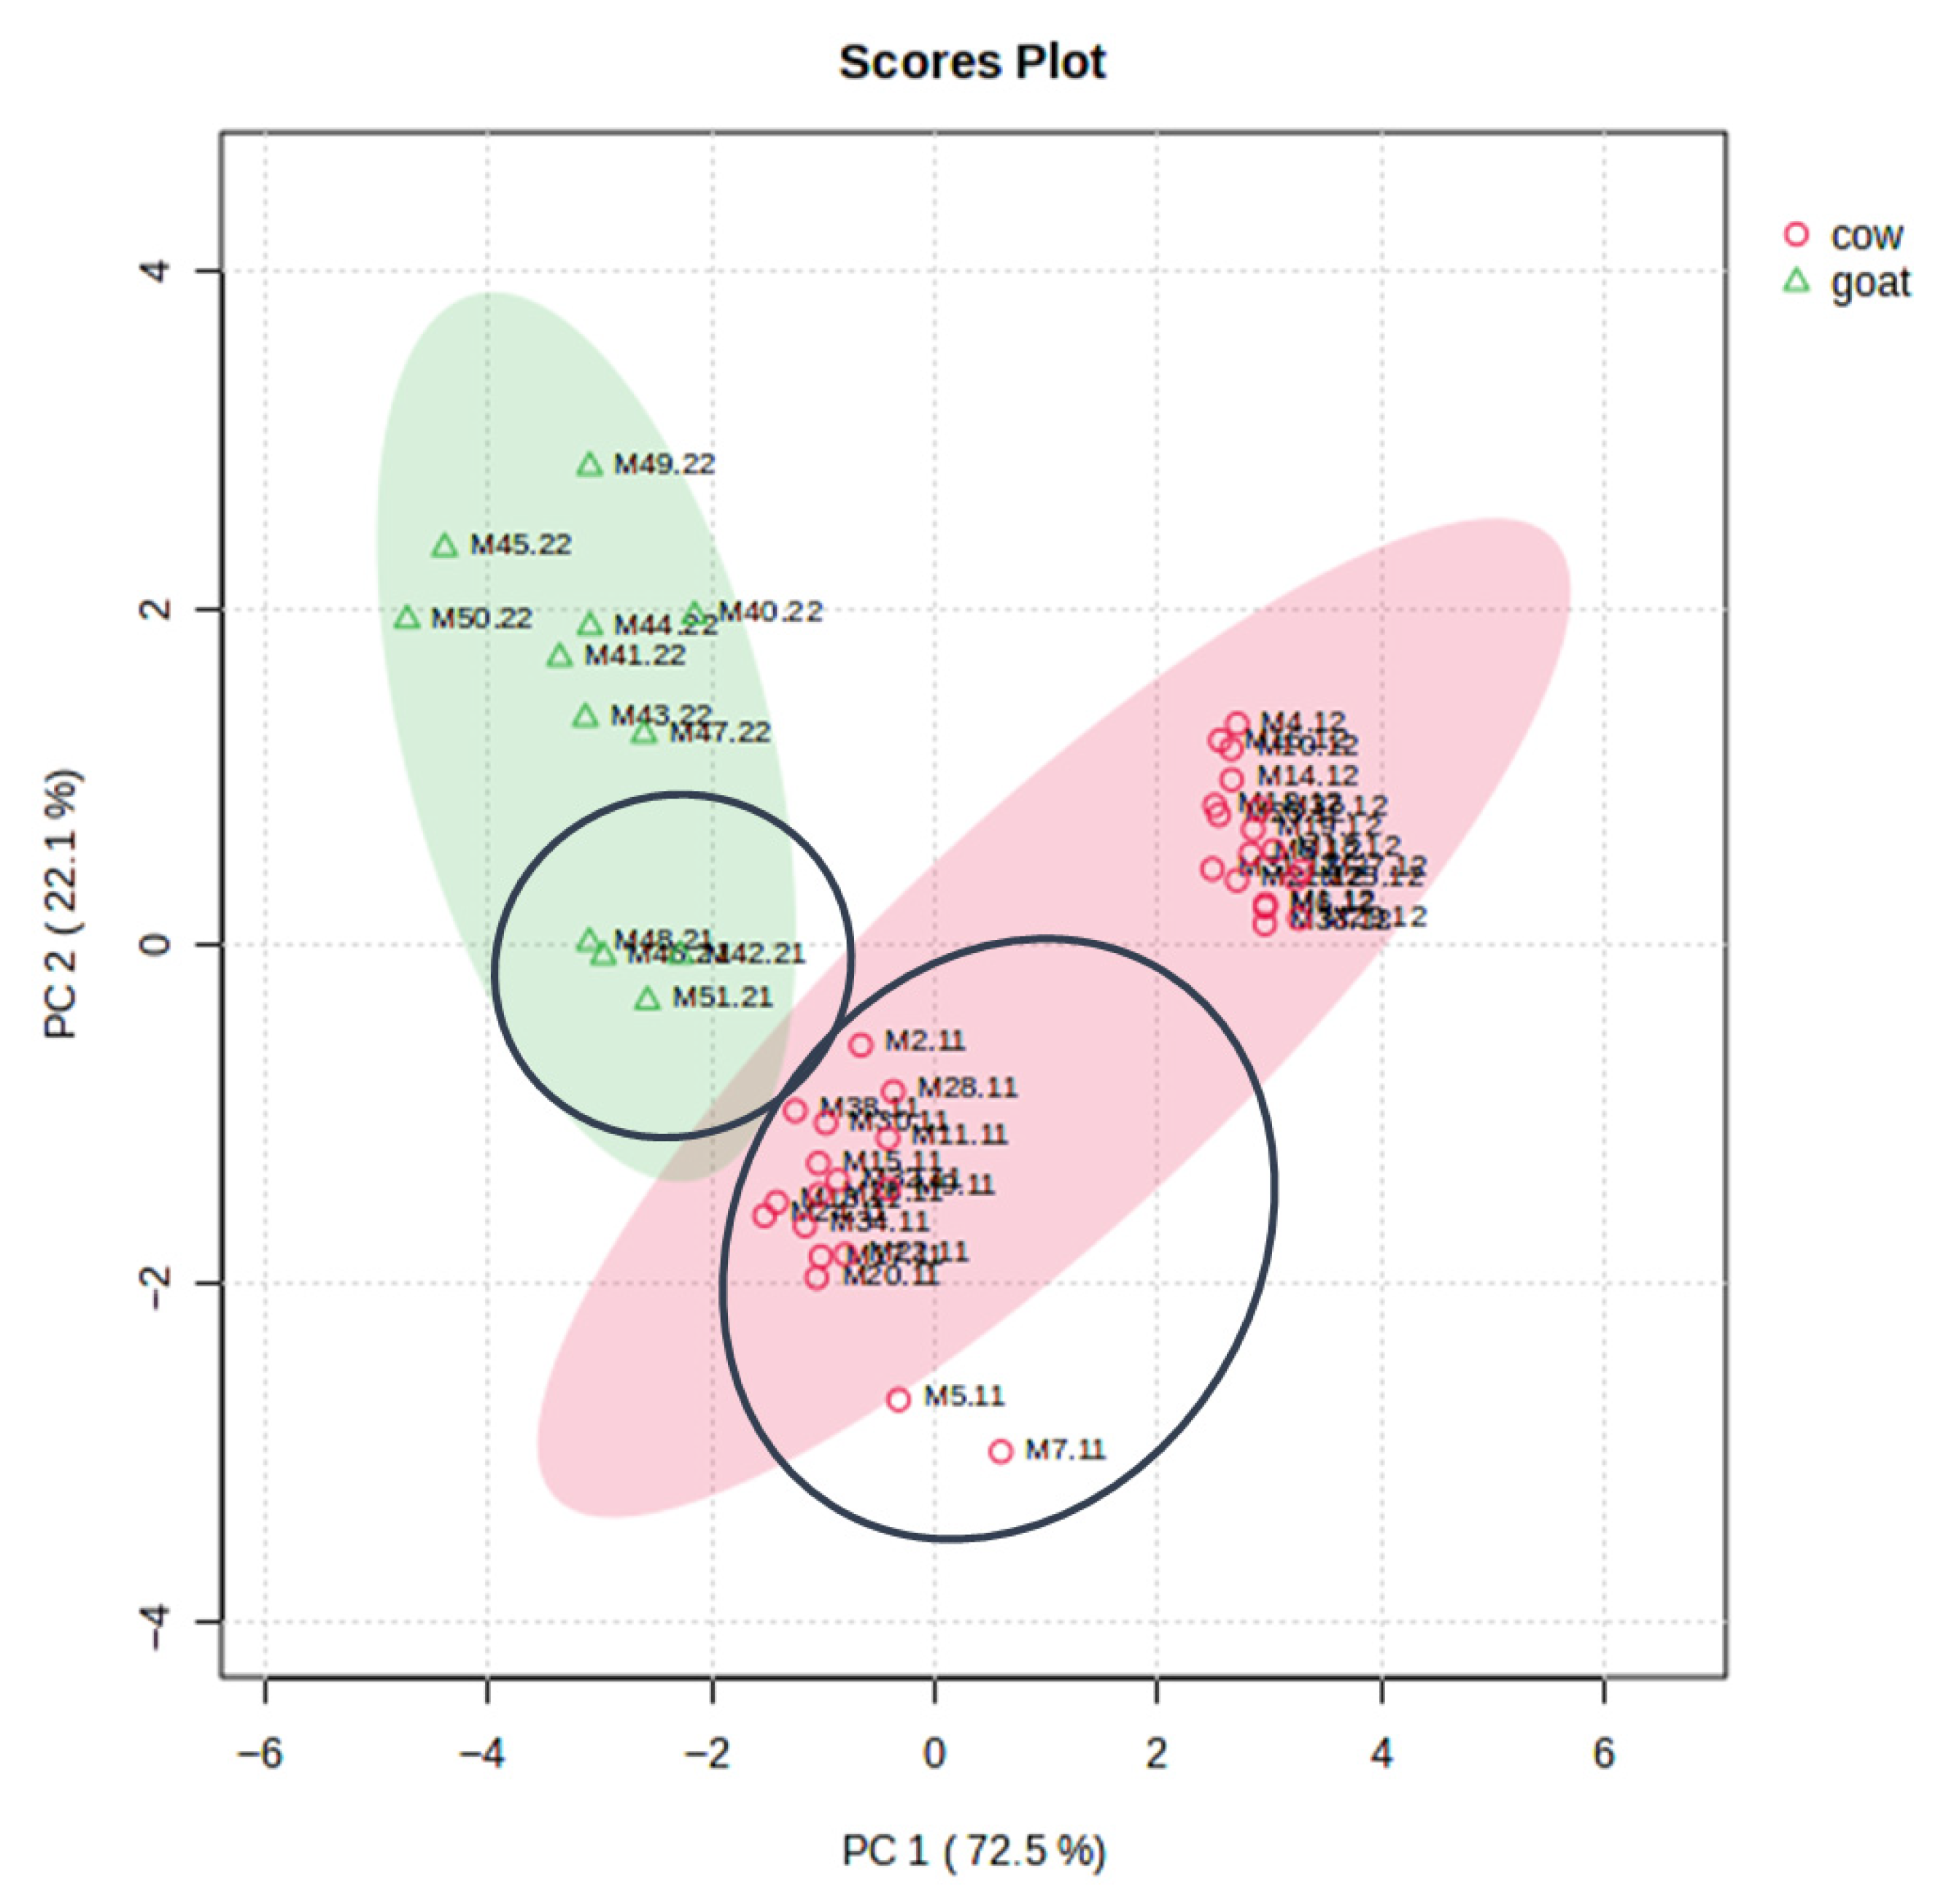
The unsupervised PCA provided an overview of the dataset structure. As shown in Figure 3, the primary separation was observed between cow and goat samples, which formed distinct clusters along the first principal component (PC1). Within each species cluster, a further subdivision was evident along PC2, corresponding to fat content. Specifically, light samples formed separate subclusters (highlighted within black cycles), indicating that fat level contributed additional variance after species differences were accounted for. The two-dimensional PCA model explained a considerable proportion of variance among the samples, supporting the existence of intrinsic structural and compositional differences based on both animal origin and fat content. The clustering of the four sample types—cow whole, cow light, goat whole, and goat light—into distinct quadrants confirms the discriminatory power of PCA. The statistical significance of these separations was confirmed by PERMANOVA (Permutational Multivariate Analysis of Variance), which yielded an F-value of 42.887, an R2 of 0.488, and a p-value of 0.001. Although the dataset was slightly unbalanced between cow and goat samples, the observed patterns remained consistent and statistically significant. These results indicate that nearly 49% of the total variance in the dataset can be attributed to differences between the milk groups, with the probability of random group formation being statistically insignificant (p = 0.001).
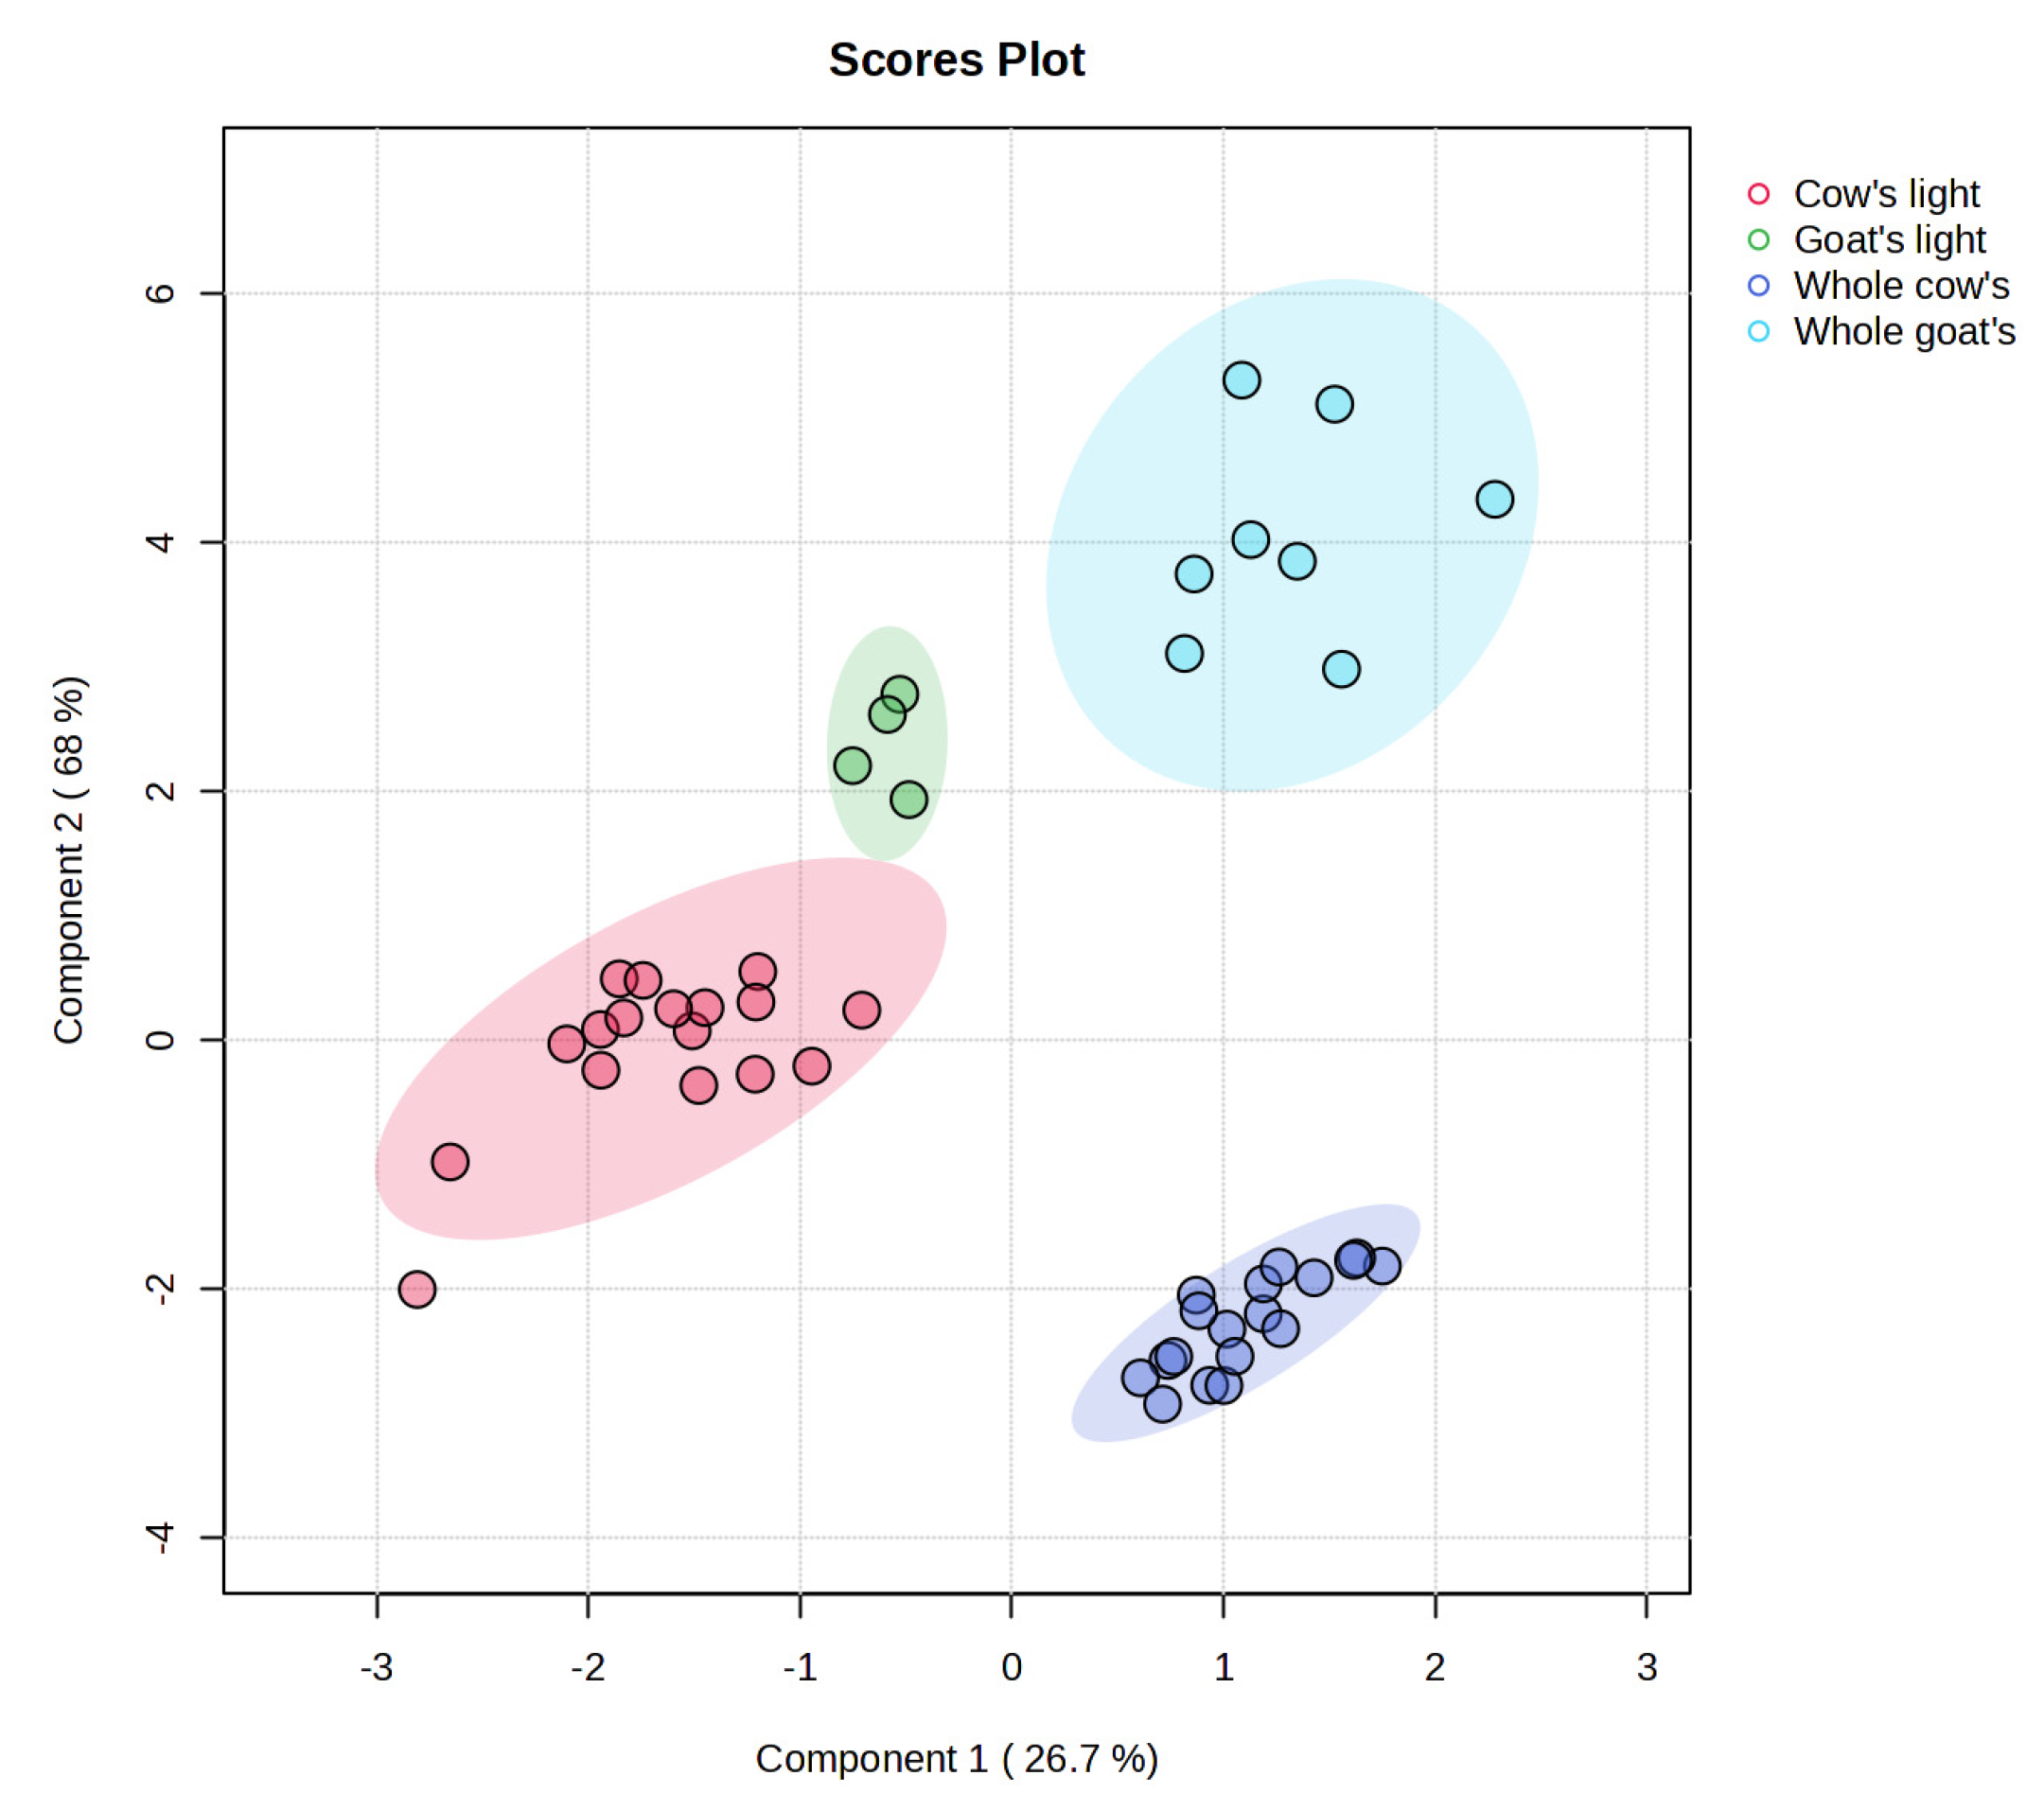
A supervised PLS-DA model was developed to classify the four milk groups: cow whole, cow light, goat whole, and goat light. As shown in Figure 4, Component 1 describes the separation between whole and light milk within the two core categories (cow/goat milk), while Component 2 effectively differentiated cow and goat milk samples. This resulted in compact and distinct clusters for all four groups, indicating that the FTIR-derived spectral dataset contains compositional features that are both species- and fat-dependent.
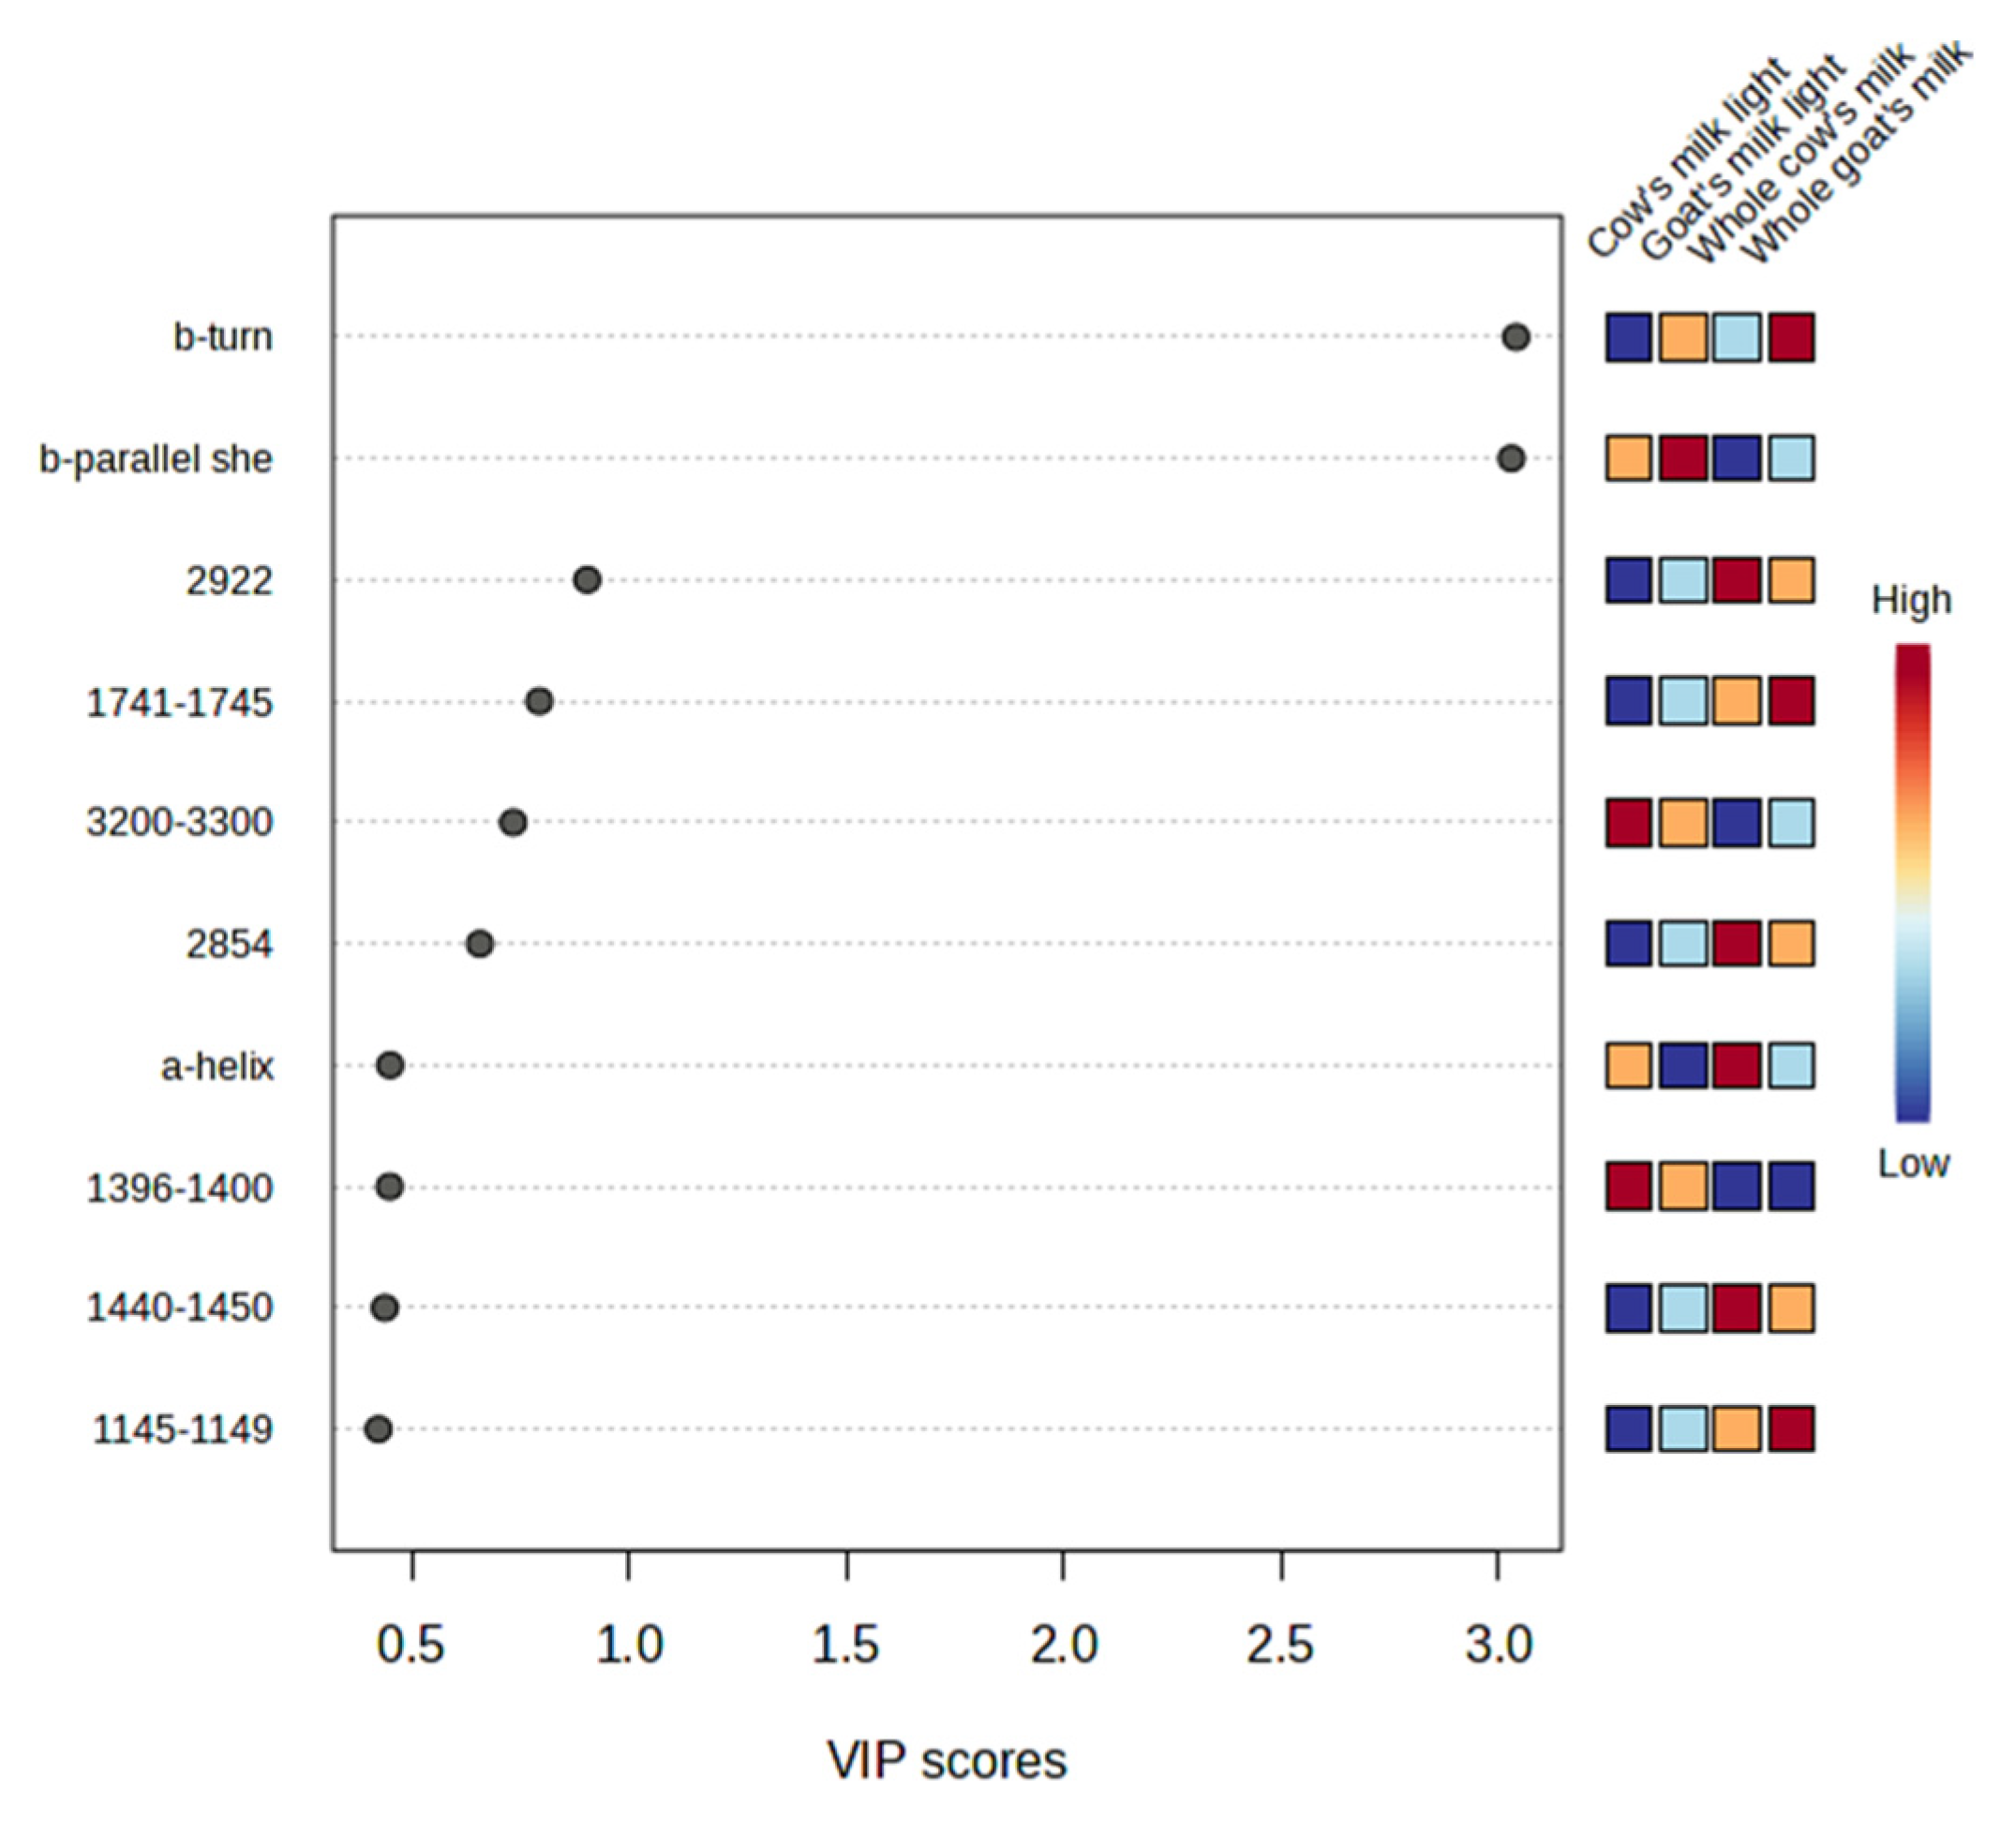
To identify the variables most responsible for this discrimination, a VIP plot was generated (Figure 5). Variables with VIP scores greater than 1 were considered influential. The most significant discriminants corresponded to protein secondary structure features and more specifically to β-turn and β-parallel sheet content. These findings align with the structural differences observed in Section 3.3: goat milk displayed a higher proportion of β-turn structures, while cow milk contained more α-helix and random coil motifs. In addition, light milks exhibited higher β-parallel sheet content than whole milks, which may explain their tighter clustering and more homogeneous microscopic textures (Section 3.2). Thus, the prominence of secondary structure features in the PLS-DA model reinforces the central role of protein conformation in milk differentiation.
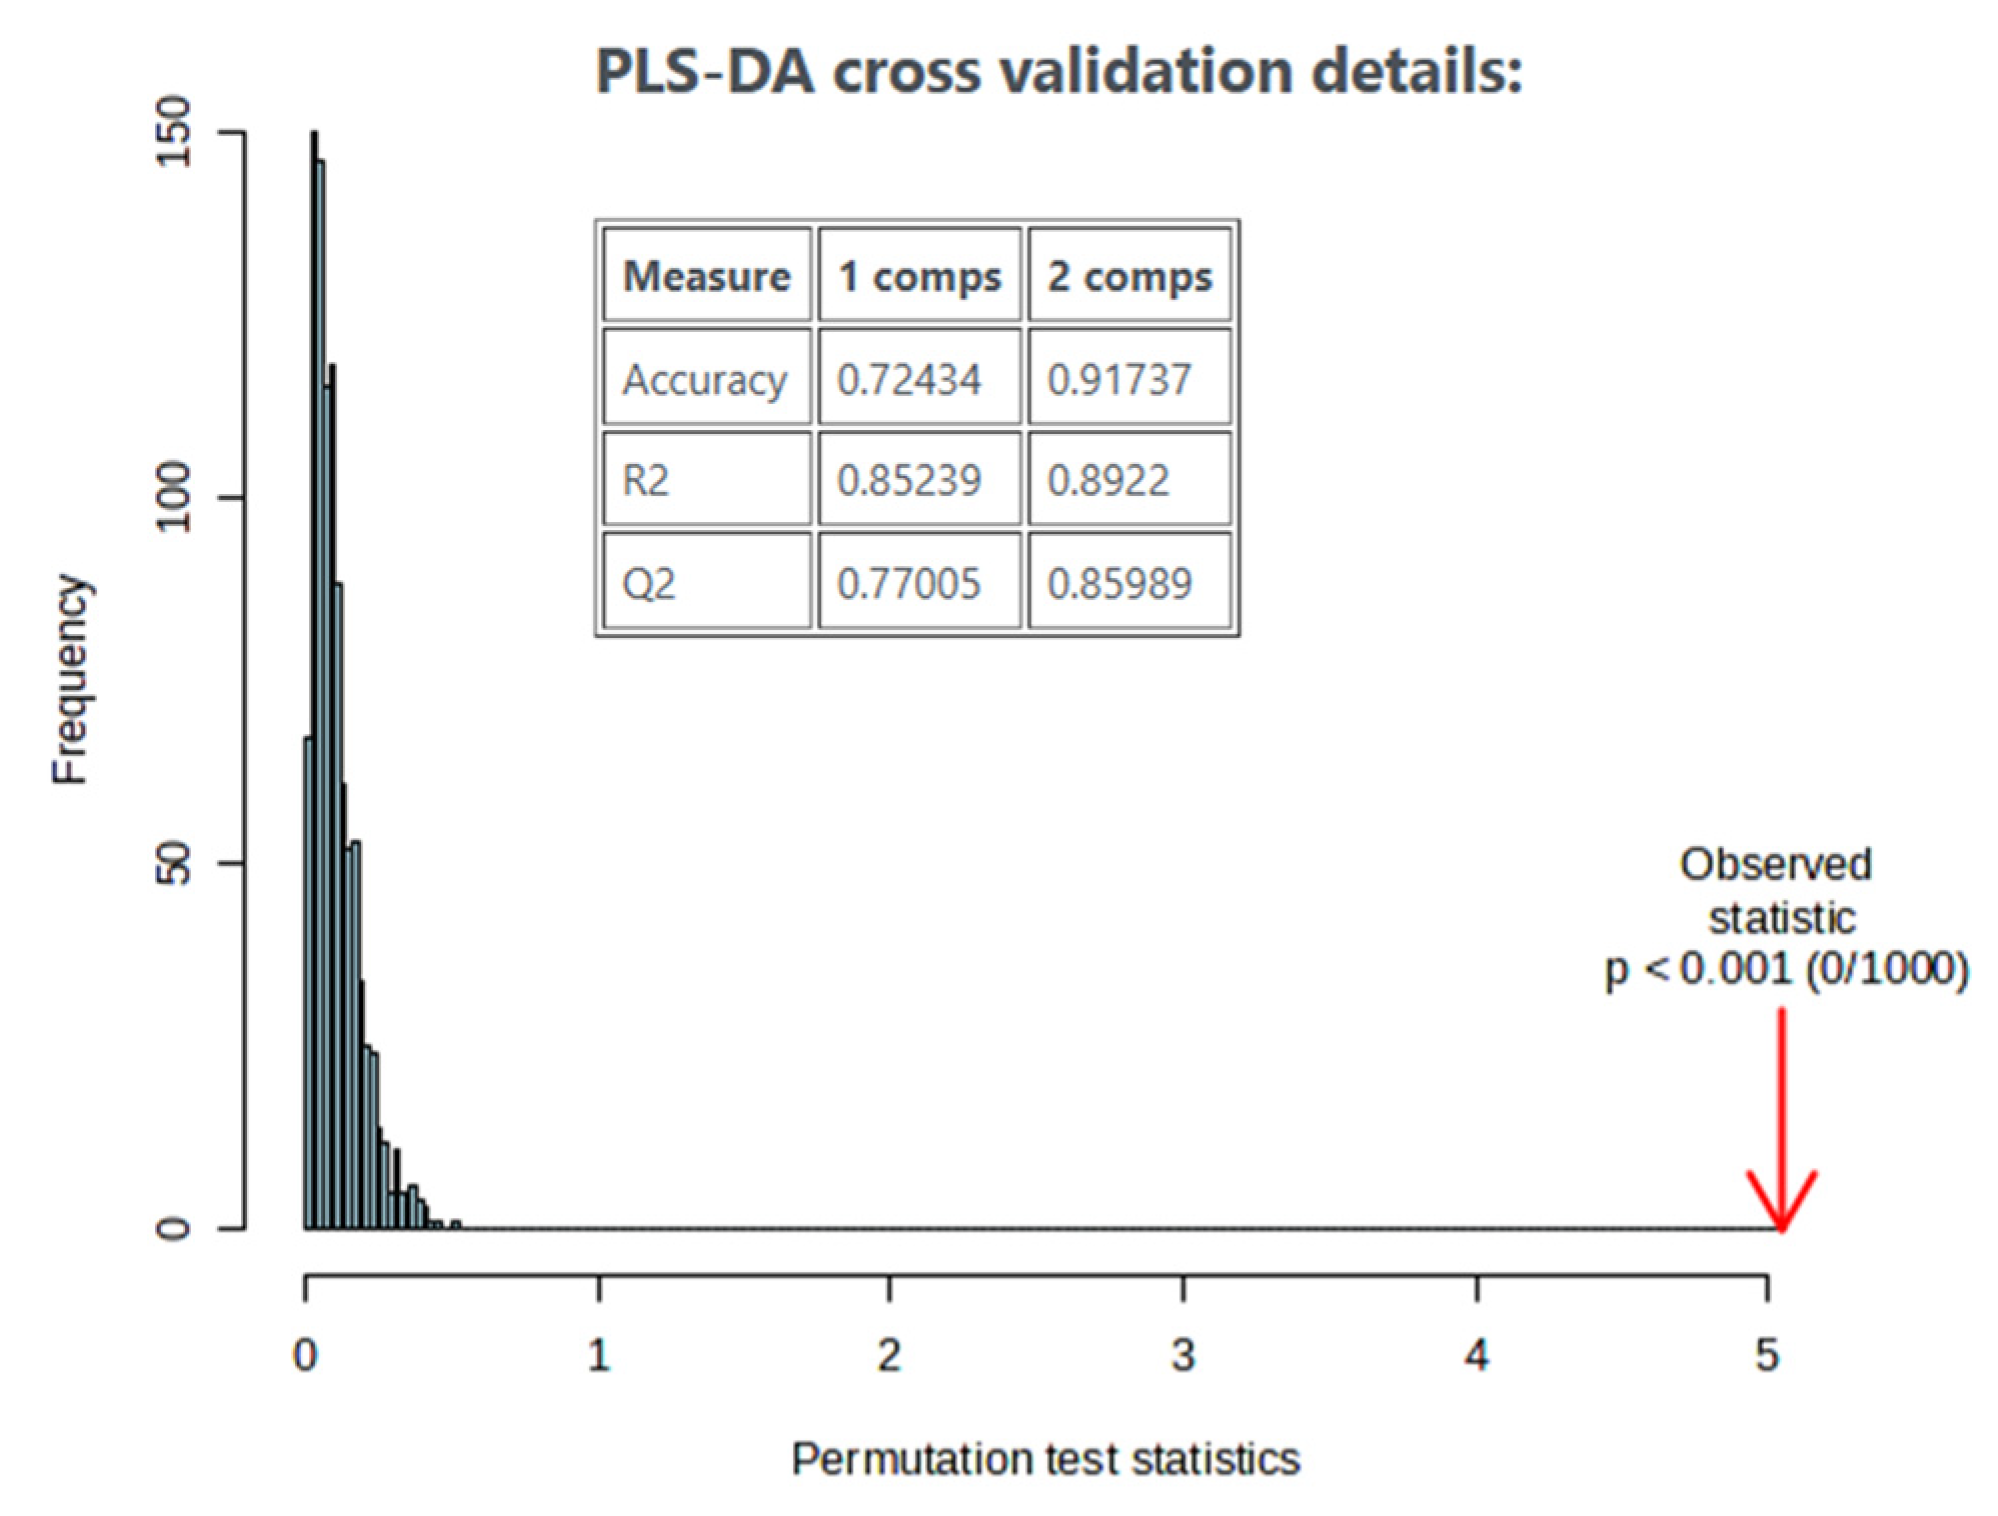
Model reliability was assessed through 1000-fold permutation testing, which confirmed that the classification accuracy of the original model was consistently higher than that of the permuted models (p < 0.001). Predictive performance was further evaluated using 5-fold cross-validation, yielding a Q2 > 0.85, an R2 > 0.89, and an overall classification accuracy of 92%. These metrics demonstrate that the model was both statistically robust and highly predictive (Figure 6).
In summary, the PLS-DA confirmed that compositional differences at the level of protein structure, already observed in univariate analyses, are the strongest drivers of discrimination in the multivariate space. This highlights the potential of the model for milk characterization and compositional profiling.

3.5. Marker Validation

3.5.1. Comparative Analysis of Cow and Goat Milk

The comparison between cow and goat milk yielded a comprehensive panel of discriminant markers (Table 5). Notably, protein secondary structures demonstrated exceptional discriminatory power. The β-turn, random coil, and α-helix structures displayed AUC values of 1.000, 1.000, and 0.990, respectively, each with highly significant p-values (p < 10−8), underscoring their robust ability to distinguish between milk origin.
In addition to secondary structure, several vibrational bands emerged as validated markers. The 891 cm−1 band (AUC = 0.870, p = 4.28 × 10⁻⁶) and the 1382 cm−1 band (AUC = 0.833, p = 4.96 × 10⁻⁶), commonly attributed to C–O stretching and CH bending in carbohydrates and phospholipids, suggest that compositional variations in minor milk components also contribute significantly to species differentiation. These findings support a multidimensional discriminatory model incorporating both structural and compositional variables.

3.5.2. Comparative Analysis of Cow Whole and Goat Whole Milk

The comparative assessment between cow and goat whole milk revealed a robust set of discriminative markers, underscoring both structural protein configurations and matrix-compositional divergences inherent to species origin (Table 6). Notably, all four evaluated secondary structure components—β-turn, random coil, α-helix, and β-parallel sheet—exhibited perfect classification accuracy (AUC = 1.000), each supported by highly significant p-values (p < 10−12).
In addition to structural markers, several infrared spectral regions associated with lipid and carbohydrate functionalities were validated. The 1382 cm−1 band emerged as a top-performing marker (AUC = 1.000; p = 2.41 × 10⁻⁷), likely corresponding to CH3 symmetric bending vibrations prevalent in fatty acid chains. Similarly, the 1242–1245 cm−1 and 1311–1313 cm−1 regions (AUCs = 0.81 and 0.80, respectively) represent contributions from C–O and P=O stretching modes, consistent with phospholipid and ester functionalities present in milk fat globule membranes.
The 1440–1450 cm−1 region (AUC = 0.73) further contributed to class differentiation. This spectral window typically captures CH2 modes in saturated fatty acid moieties, and its discriminant role suggests compositional and perhaps organizational differences in the triacylglycerol content between cow and goat whole milk.
Collectively, these findings highlight the interplay between protein supramolecular structure and lipid matrix organization in defining spectral fingerprints specific to milk origin in whole milk systems. The statistical power of both secondary structure features and lipid-informative bands supports the applicability of ATR-FTIR spectroscopy in authenticating full-fat dairy matrices, with direct relevance to traceability, certification, and fraud prevention workflows in the dairy industry.

3.5.3. Comparative Analysis of Cow Light and Goat Light Milk

The light milk comparison yielded a diverse and highly discriminative set of spectral markers, confirming that fat-reduced matrices retain strong molecular signatures capable of differentiating species origin (Table 7). In this comparison, a total of 15 spectral features exceeded the criteria, with several variables demonstrating near-perfect or perfect classification performance.
Among the most robust discriminants were α-helix and β-turn secondary structure motifs, both attaining AUC = 1.000, highlighting those intrinsic differences in protein conformation between bovine and caprine milk persist even after fat removal.
Additionally, several vibrational bands linked to carbohydrate, protein, and residual lipid functionalities emerged as validated markers. The 891 cm−1 region (AUC = 1.000) is associated with C–H deformation modes in saccharides, and the 1026–1028 cm−1 and 1145–1149 cm−1 bands (AUCs = 1.000) likely correspond to C–O stretching vibrations in glycoproteins or lactose. These results are consistent with previous studies suggesting that variations in oligosaccharide and glycoprotein profiles are species-dependent and preserved in low-fat formulations.
Additional validated markers included:
(i)
1396–1400 cm−1 (AUC = 1.000)—CH3 bending modes, potentially linked to residual phospholipids
(ii)
1440–1450 cm−1 (AUC = 0.99)—CH2 from saturated fatty acids
(iii)
2854 cm−1 (AUC = 0.99)—CH2 symmetric stretching from lipid chains
(iv)
1064, 1382, 1638–1645, 1741–1745, and 777 cm−1—AUCs ranging from 0.79 to 0.96
The presence of lipid-associated markers—despite the low-fat context—suggests that minor differences in residual triglyceride or phospholipid content still contribute meaningfully to the spectral distinction. Meanwhile, 1638–1645 and 1545 cm−1 regions provided further insights into secondary structure alterations, supporting the assertion that protein folding behavior is not homogenized by fat removal but instead retains species-specific traits.
In summary, the marker landscape in this comparison demonstrates a complex interplay between structural protein features, lipid and carbohydrate-related vibrations, all of which contribute to robust interspecies classification in milk products. These findings validate the application of ATR-FTIR spectroscopy as a sensitive, compositionally integrative technique for milk types characterization in dairy matrices, even under reduced-fat conditions where conventional lipid markers may be diminished.
Overall, the outcomes of PCA, PLS-DA, and ROC analyses confirm the strong discriminatory power of ATR-FTIR combined with chemometrics for milk classification. These findings are in line with previous studies showing that spectral fingerprints can effectively distinguish milk species and detect adulteration [22,23,51]. Nicolaou et al. [41] reported that FTIR spectroscopy successfully differentiated bovine, caprine, and ovine milks, with species-specific carbohydrate and lipid bands driving the separation. Similarly, Balan et al. [16,52] demonstrated the utility of ATR-FTIR and multivariate models in detecting adulterants in cow milk. The present study supports these earlier reports while extending them by incorporating protein secondary structure variables into the multivariate space. By including protein conformation alongside spectral features, this study offers a more biologically meaningful interpretation of FTIR-based classification. From an industrial standpoint, this integrative approach offers a rapid, non-destructive, and cost-effective tool for verifying milk authenticity and detecting potential adulteration without extensive sample preparation. Furthermore, the discrimination between species and fat content could facilitate automated quality-control, traceability, and certification systems, while the inclusion of secondary-structure markers enhances biological interpretability and ensures compliance with labeling standards.

4. Conclusions

This study applied ATR-FTIR spectroscopy, protein secondary structure profiling, colorimetry, and texture analysis on the microscopic images to characterize and classify 47 commercial cow and goat milk samples of different fat contents. The results demonstrated clear compositional and structural distinctions between milk groups. Goat milk contained significantly more protein, whereas cow milk had higher salt concentrations, while fat differences were driven by type rather than species. Colorimetric evaluation showed that hue angle values were significantly higher in light than in whole milks, providing a rapid and non-destructive marker of fat level, while whole cow milk exhibited greater yellowness. Textural features obtained from microscopic images showed spatial variation in pixel intensity levels within milk tissue, which correlated with composition, homogeneity and smoothness. Specifically, whole milks displayed more heterogeneous textures with larger fat globules, whereas light milks appeared more homogeneous; in addition, goat milks showed higher skewness, reflecting uneven distribution of components linked to their higher protein and lower sugar content. ATR-FTIR spectra confirmed these trends, with whole milks showing stronger lipid-associated bands at 2922, 2854, and 1741 cm−1, while cow milks exhibited more intense carbohydrate bands at 1026–1028 cm−1, consistent with their higher lactose content. Light milks were uniquely characterized by the 1396–1400 cm−1 band, highlighting the impact of fat reduction on the spectral profile. Analysis of protein secondary structures revealed β-parallel sheet as the predominant motif across all groups, with cow milk containing higher proportions of random coil and α-helix, goat milk showing elevated β-turn, and light milks enriched in β-parallel sheet compared to whole. Multivariate analysis further confirmed these differences. PCA revealed a primary separation between cow and goat samples, with additional sub-clustering according to fat content. The PLS-DA model clearly distinguished the four milk groups, achieving robust validation (Q2 > 0.85, R2 > 0.89) and high classification accuracy of approximately 92%. Marker validation through ROC analysis identified protein secondary structures, especially β-turn, random coil, and α-helix, as highly effective discriminants with AUC values approaching 1.0. In addition, several carbohydrate- and lipid-associated bands, including 1026–1028, 1382, and 2854 cm−1, and the 1396–1400 cm−1 band specific to light milks, were validated as reliable markers. It should be noted that the number of goat-milk samples analyzed (n = 12) was smaller than that of cow milk samples (n = 35). Although the statistical models achieved high accuracy and cross-validation metrics, the unequal sample size could affect model generalizability to broader populations. Future studies should therefore include larger and more balanced sample sets, encompassing additional breeds and seasonal variations, to further validate the robustness of the discriminant features identified. In conclusion, the integration of ATR-FTIR spectral data, protein conformational information, and image-derived features enabled robust and biologically meaningful classification of milks according to species and fat content. The approach not only achieved high statistical accuracy but also revealed compositional and structural markers that reflect intrinsic differences between cow and goat milks and between whole and light formulations.

Supplementary Materials

The following supporting information can be downloaded at: https://www.mdpi.com/article/10.3390/app152010883/s1, Figure S1. Representative ATR-FTIR spectra of cow and goat milks (whole and light) recorded in the 4000–499 cm−1 region; Table S1. Labeling of milk samples.

Author Contributions

Conceptualization, V.J.S. and D.C.; methodology, K.C., G.L., P.C., S.J.K., E.K., V.J.S. and D.C.; software, P.C., G.L., V.B. and D.C.; validation, P.C., V.B., A.E.L., V.J.S. and D.C.; formal analysis, K.C., P.C., S.J.K. and G.L.; investigation, K.C., A.E.L., P.C., G.L., S.J.K., E.K., V.J.S. and D.C.; data curation, K.C., G.L., P.C., E.K. and D.C.; writing—original draft preparation, G.L., P.C., K.C., E.K., V.J.S. and D.C.; writing—review and editing, A.E.L., P.C., G.L., S.J.K., E.K., V.J.S. and D.C.; visualization, P.C., S.J.K. and D.C.; supervision, V.B., V.J.S. and D.C.; project administration, V.J.S. All authors have read and agreed to the published version of the manuscript.

Funding

This research received no external funding.

Institutional Review Board Statement

Not applicable.

Informed Consent Statement

Not applicable.

Data Availability Statement

All the data presented in this study are available within the manuscript and the Supplementary Materials.

Acknowledgments

We gratefully acknowledge Natalia A. Stavropoulou, PhD Candidate at the University of West Attica, for her kind assistance with the freeze-drying process.

Conflicts of Interest

The authors declare no conflicts of interest.

References

  1. Sanjulián, L.; Fernández-Rico, S.; González-Rodríguez, N.; Cepeda, A.; Miranda, J.M.; Fente, C.; Lamas, A.; Regal, P. The Role of Dairy in Human Nutrition: Myths and Realities. Nutrients 2025, 17, 646. [Google Scholar] [CrossRef]
  2. Shawky, E.; Nahar, L.; Nassief, S.M.; Sarker, S.D.; Ibrahim, R.S. Dairy Products Authentication with Biomarkers: A Comprehensive Critical Review. Trends Food Sci. Technol. 2024, 147, 104445. [Google Scholar] [CrossRef]
  3. Mozart, G.G.; Köptcke, F.B.N.; Pinto, L.A.; Moebus, V.F.; Tamy, W.P.; Aronovich, M.; Keller, L.A.M. Enhancement of Dairy Cow Milk Quality with Probiotic and Inorganic Selenium Supplementation. Dairy 2024, 5, 336–345. [Google Scholar] [CrossRef]
  4. Organization for Economic Co-operation and Development; Food and Agriculture Organization of the United Nations. OECD-FAO Agricultural Outlook 2019–2028; OECD-FAO Agricultural Outlook; OECD: Paris, France, 2019; ISBN 978-92-64-31245-6. [Google Scholar]
  5. Anusha Siddiqui, S.; Mahmood Salman, S.H.; Ali Redha, A.; Zannou, O.; Chabi, I.B.; Oussou, K.F.; Bhowmik, S.; Nirmal, N.P.; Maqsood, S. Physicochemical and Nutritional Properties of Different Non-Bovine Milk and Dairy Products: A Review. Int. Dairy J. 2024, 148, 105790. [Google Scholar] [CrossRef]
  6. Eurostat. (2023). Milk and milk product production statistics. In Agricultural production—Livestock and meat. European Commission. Available online: https://ec.europa.eu/eurostat (accessed on 1 June 2025).
  7. Pappa, E.C.; Kondyli, E.; Sotirakoglou, K.; Bosnea, L.; Mataragas, M.; Allouche, L.; Tsiplakou, E.; Pappas, A.C. Farmers Profile and Characterization of Sheep and Goat Dairy Chain in Northwestern Greece. Sustainability 2021, 13, 833. [Google Scholar] [CrossRef]
  8. Wang, L.; Wu, T.; Zhang, Y.; Yang, K.; He, Y.; Deng, K.; Liang, C.; Gu, Y. Comparative Studies on the Nutritional and Physicochemical Properties of Yoghurts from Cows’, Goats’, and Camels’ Milk Powder. Int. Dairy J. 2023, 138, 105542. [Google Scholar] [CrossRef]
  9. Prosser, C.G. Compositional and Functional Characteristics of Goat Milk and Relevance as a Base for Infant Formula. J. Food Sci. 2021, 86, 257–265. [Google Scholar] [CrossRef]
  10. Turkmen, N. The Nutritional Value and Health Benefits of Goat Milk Components. In Nutrients in Dairy and their Implications on Health and Disease; Elsevier: Amsterdam, The Netherlands, 2017; pp. 441–449. ISBN 978-0-12-809762-5. [Google Scholar]
  11. Nayik, G.A.; Jagdale, Y.D.; Gaikwad, S.A.; Devkatte, A.N.; Dar, A.H.; Ansari, M.J. Nutritional Profile, Processing and Potential Products: A Comparative Review of Goat Milk. Dairy 2022, 3, 622–647. [Google Scholar] [CrossRef]
  12. Zhao, L.; Wang, J.; Mao, X. Composition and Interfacial Properties Play Key Roles in Different Lipid Digestion between Goat and Cow Milk Fat Globules in Vitro. Food Chem. 2022, 374, 131538. [Google Scholar] [CrossRef]
  13. Visoka, Y.; Majadi, M.; Kovacs, Z.; Gecaj, R.M. Utilizing Near-Infrared Spectroscopy for Discriminant Analysis of Goat Milk Composition across Diverse Breeds and Lactation Seasons. Biol. Life Sci. Forum 2023, 26, 64. [Google Scholar] [CrossRef]
  14. Kailasapathy, K. Chemical Composition, Physical, and Functional Properties of Milk and Milk Ingredients. In Dairy Processing and Quality Assurance; Chandan, R.C., Kilara, A., Shah, N.P., Eds.; Wiley: Hoboken, NJ, USA, 2015; pp. 77–105. ISBN 978-1-118-81031-6. [Google Scholar]
  15. Pereira, C.G.; Luiz, L.C.; Bell, M.J.V.; Anjos, V. Near And Mid Infrared Spectroscopy To Assess Milk Products Quality: A Review Of Recent Applications. J. Dairy Res. Technol. 2020, 3, 1–10. [Google Scholar] [CrossRef]
  16. Balan, B.; Dhaulaniya, A.S.; Jamwal, R.; Amit; Sodhi, K.K.; Kelly, S.; Cannavan, A.; Singh, D.K. Application of Attenuated Total Reflectance-Fourier Transform Infrared (ATR-FTIR) Spectroscopy Coupled with Chemometrics for Detection and Quantification of Formalin in Cow Milk. Vib. Spectrosc. 2020, 107, 103033. [Google Scholar] [CrossRef]
  17. Zhang, J.; Li, C.; Rahaman, M.M.; Yao, Y.; Ma, P.; Zhang, J.; Zhao, X.; Jiang, T.; Grzegorzek, M. A Comprehensive Review of Image Analysis Methods for Microorganism Counting: From Classical Image Processing to Deep Learning Approaches. Artif. Intell. Rev. 2022, 55, 2875–2944. [Google Scholar] [CrossRef] [PubMed]
  18. Boruczkowska, H.; Boruczkowski, T.; Bronkowska, M.; Prajzner, M.; Rytel, E. Comparison of Colour Measurement Methods in the Food Industry. Processes 2025, 13, 1268. [Google Scholar] [CrossRef]
  19. Kardas, M.; Rakuła, M.; Kołodziejczyk, A.; Staśkiewicz-Bartecka, W. Consumer Preferences, Sensory Evaluation, and Color Analysis of Beetroot and Tomato Juices: Implications for Product Development and Marketing in Health-Promoting Beverages. Foods 2024, 13, 4059. [Google Scholar] [CrossRef]
  20. Agiomavriti, A.-A.; Nikolopoulou, M.P.; Bartzanas, T.; Chorianopoulos, N.; Demestichas, K.; Gelasakis, A.I. Spectroscopy-Based Methods and Supervised Machine Learning Applications for Milk Chemical Analysis in Dairy Ruminants. Chemosensors 2024, 12, 263. [Google Scholar] [CrossRef]
  21. Kharbach, M.; Alaoui Mansouri, M.; Taabouz, M.; Yu, H. Current Application of Advancing Spectroscopy Techniques in Food Analysis: Data Handling with Chemometric Approaches. Foods 2023, 12, 2753. [Google Scholar] [CrossRef]
  22. Cirak, O.; Icyer, N.C.; Durak, M.Z. Rapid Detection of Adulteration of Milks from Different Species Using Fourier Transform Infrared Spectroscopy (FTIR). J. Dairy Res. 2018, 85, 222–225. [Google Scholar] [CrossRef]
  23. Vinciguerra, L.; Marcelo, M.; Motta, T.; Meneghini, L.; Bergold, A.; Ferrão, M. Chemometric Tools and FTIR-ATR Spectroscopy Applied in Milk Adulterated with Cheese Whey. Química Nova 2019, 42, 249–254. [Google Scholar] [CrossRef]
  24. Tsiaka, T.; Kritsi, E.; Bratakos, S.M.; Sotiroudis, G.; Petridi, P.; Savva, I.; Christodoulou, P.; Strati, I.F.; Zoumpoulakis, P.; Cavouras, D.; et al. Quality Assessment of Ground Coffee Samples from Greek Market Using Various Instrumental Analytical Methods, In Silico Studies and Chemometrics. Antioxidants 2023, 12, 1184. [Google Scholar] [CrossRef]
  25. Christodoulou, P.; Ladika, G.; Tsiantas, K.; Kritsi, E.; Tsiaka, T.; Cavouras, D.; Zoumpoulakis, P.; Sinanoglou, V.J. Quality Assessment of Greenhouse-Cultivated Cucumbers (Cucumis sativus) during Storage Using Instrumental and Image Analyses. Appl. Sci. 2024, 14, 8676. [Google Scholar] [CrossRef]
  26. Kritsi, E.; Ladika, G.; Stavropoulou, N.A.; Oikonomakou, M.; Ioannou, A.-G.; Christodoulou, P.; Konteles, S.J.; Cavouras, D.; Sinanoglou, V.J. Evaluation of the Quality Changes in Three Commercial Pastourma Samples during Refrigerated Storage Using Physicochemical, Microbiological, and Image Analyses Combined with Chemometrics. Foods 2024, 13, 1017. [Google Scholar] [CrossRef]
  27. Moatsou, G.; Park, Y.W. Goat Milk Products: Types of Products, Manufacturing Technology, Chemical Composition, and Marketing. In Handbook of Milk of Non-Bovine Mammals; Park, Y.W., Haenlein, G.F.W., Wendorff, W.L., Eds.; Wiley: Hoboken, NJ, USA, 2017; pp. 84–150. ISBN 978-1-119-11027-9. [Google Scholar]
  28. Foroutan, A.; Guo, A.C.; Vazquez-Fresno, R.; Lipfert, M.; Zhang, L.; Zheng, J.; Badran, H.; Budinski, Z.; Mandal, R.; Ametaj, B.N.; et al. Chemical Composition of Commercial Cow’s Milk. J. Agric. Food Chem. 2019, 67, 4897–4914. [Google Scholar] [CrossRef]
  29. Felice, V.D.; Owens, R.A.; Kennedy, D.; Hogan, S.A.; Lane, J.A. Comparative Structural and Compositional Analyses of Cow, Buffalo, Goat and Sheep Cream. Foods 2021, 10, 2643. [Google Scholar] [CrossRef] [PubMed]
  30. Liao, G.; Han, H.; Wang, T.; Li, H.; Qian, Y.; Zhu, M.; Jia, Q.; Qiu, J. Comparative Analysis of the Fatty Acid Profiles in Goat Milk during Different Lactation Periods and Their Interactions with Volatile Compounds and Metabolites. Food Chem. 2024, 460, 140427. [Google Scholar] [CrossRef]
  31. Roy, D.; Ye, A.; Moughan, P.J.; Singh, H. Composition, Structure, and Digestive Dynamics of Milk From Different Species—A Review. Front. Nutr. 2020, 7, 577759. [Google Scholar] [CrossRef]
  32. Muñoz-Salinas, F.; Andrade-Montemayor, H.M.; De La Torre-Carbot, K.; Duarte-Vázquez, M.Á.; Silva-Jarquin, J.C. Comparative Analysis of the Protein Composition of Goat Milk from French Alpine, Nubian, and Creole Breeds and Holstein Friesian Cow Milk: Implications for Early Infant Nutrition. Animals 2022, 12, 2236. [Google Scholar] [CrossRef]
  33. Chauhan, S.; Powar, P.; Mehra, R. A Review on Nutritional Advantages and Nutraceutical Properties of Cow and Goat Milk. Int. J. Appl. Res. 2021, 7, 101–105. [Google Scholar] [CrossRef]
  34. Milovanovic, B.; Djekic, I.; Miocinovic, J.; Djordjevic, V.; Lorenzo, J.M.; Barba, F.J.; Mörlein, D.; Tomasevic, I. What Is the Color of Milk and Dairy Products and How Is It Measured? Foods 2020, 9, 1629. [Google Scholar] [CrossRef]
  35. Chudy, S.; Bilska, A.; Kowalski, R.; Teichert, J. Colour of Milk and Milk Products in CIE L*a*b* Space. Med. Weter. 2020, 76, 77–81. [Google Scholar] [CrossRef]
  36. Cheong, F.C.; Xiao, K.; Grier, D.G. Technical Note: Characterizing Individual Milk Fat Globules with Holographic Video Microscopy. J. Dairy Sci. 2009, 92, 95–99. [Google Scholar] [CrossRef]
  37. Sinanoglou, V.J.; Tsiaka, T.; Aouant, K.; Mouka, E.; Ladika, G.; Kritsi, E.; Konteles, S.J.; Ioannou, A.-G.; Zoumpoulakis, P.; Strati, I.F.; et al. Quality Assessment of Banana Ripening Stages by Combining Analytical Methods and Image Analysis. Appl. Sci. 2023, 13, 3533. [Google Scholar] [CrossRef]
  38. Lu, N.; Wang, J.; Chen, Z.; Zhang, X.; Chen, C.; Wang, S. The Effect of Adding Phospholipids before Homogenization on the Properties of Milk Fat Globules. LWT 2021, 146, 111659. [Google Scholar] [CrossRef]
  39. Julmohammad, N.; Suhaini, I.K.M.; Govindasamy, T.; Tan, E.; Soloi, S.; Julmohamad, N.; Akanda, M.J.H. Quantification of Adulterant Residues in UHT Milk Products Using ATR-FTIR Spectroscopy Coupled with Multivariate Analysis. ARD 2024, 115, 1–13. [Google Scholar] [CrossRef]
  40. Nandiyanto, A.B.D.; Oktiani, R.; Ragadhita, R. How to Read and Interpret FTIR Spectroscope of Organic Material. Indones. J. Sci. Technol. 2019, 4, 97. [Google Scholar] [CrossRef]
  41. Nicolaou, N.; Xu, Y.; Goodacre, R. Fourier Transform Infrared Spectroscopy and Multivariate Analysis for the Detection and Quantification of Different Milk Species. J. Dairy Sci. 2010, 93, 5651–5660. [Google Scholar] [CrossRef]
  42. Stocco, G.; Dadousis, C.; Pazzola, M.; Vacca, G.M.; Dettori, M.L.; Mariani, E.; Cipolat-Gotet, C. Prediction Accuracies of Cheese-Making Traits Using Fourier-Transform Infrared Spectra in Goat Milk. Food Chem. 2023, 403, 134403. [Google Scholar] [CrossRef]
  43. Sinanoglou, V.J.; Cavouras, D.; Xenogiannopoulos, D.; Proestos, C.; Zoumpoulakis, P. Quality Assessment of Pork and Turkey Hams Using FT-IR Spectroscopy, Colorimetric, and Image Analysis. Foods 2018, 7, 152. [Google Scholar] [CrossRef]
  44. Movasaghi, Z.; Rehman, S.; Rehman, I.U. Fourier Transform Infrared (FTIR) Spectroscopy of Biological Tissues. Appl. Spectrosc. Rev. 2008, 43, 134–179. [Google Scholar] [CrossRef]
  45. Christodoulou, P.; Kritsi, E.; Ladika, G.; Tsafou, P.; Tsiantas, K.; Tsiaka, T.; Zoumpoulakis, P.; Cavouras, D.; Sinanoglou, V.J. Estimation of Tomato Quality During Storage by Means of Image Analysis, Instrumental Analytical Methods, and Statistical Approaches. Appl. Sci. 2025, 15, 7936. [Google Scholar] [CrossRef]
  46. Conceição, D.; Gonçalves, B.-H.; Da Hora, F.; Faleiro, A.; Santos, L.; Ferrão, S. Use of FTIR-ATR Spectroscopy Combined with Multivariate Analysis as a Screening Tool to Identify Adulterants in Raw Milk. J. Braz. Chem. Soc. 2018, 30, 780–785. [Google Scholar] [CrossRef]
  47. Hong, T.; Yin, J.-Y.; Nie, S.-P.; Xie, M.-Y. Applications of Infrared Spectroscopy in Polysaccharide Structural Analysis: Progress, Challenge and Perspective. Food Chem. X 2021, 12, 100168. [Google Scholar] [CrossRef] [PubMed]
  48. Advanced Dairy Chemistry: Volume 1A: Proteins: Basic Aspects, 4th ed.; McSweeney, P.L.H., Fox, P.F., Eds.; Springer: Boston, MA, USA, 2013; ISBN 978-1-4614-4713-9. [Google Scholar]
  49. Ye, M.P.; Zhou, R.; Shi, Y.R.; Chen, H.C.; Du, Y. Effects of Heating on the Secondary Structure of Proteins in Milk Powders Using Mid-Infrared Spectroscopy. J. Dairy Sci. 2017, 100, 89–95. [Google Scholar] [CrossRef] [PubMed]
  50. Chen, L.; Hong, T.; Li, Z.; Shen, G.; Gu, Y.; Han, J. A Comparison of Milk Fat Globule Membranes and Whey Proteomes: New Insight into Variation Nutrient Differences between Buffalo, Cow, Goat, and Yak. Food Chem. 2023, 429, 136845. [Google Scholar] [CrossRef] [PubMed]
  51. Tarapoulouzi, M.; Kokkinofta, R.; Theocharis, C.R. Chemometric Analysis Combined with FTIR Spectroscopy of Milk and Halloumi Cheese Samples According to Species’ Origin. Food Sci. Nutr. 2020, 8, 3262–3273. [Google Scholar] [CrossRef]
  52. Jaiswal, P.; Jha, S.N.; Borah, A.; Gautam, A.; Grewal, M.K.; Jindal, G. Detection and quantification of soymilk in cow–buffalo milk using Attenuated Total Reflectance Fourier Transform Infrared spectroscopy (ATR–FTIR). Food Chem. 2015, 168, 41–47. [Google Scholar] [CrossRef]
Figure 1. Calculation of textural features by extracting ROIs from a milk sample’s microscopic picture, as indicated by the blue boxes.
Applsci 15 10883 g001
Figure 2. Box plots showing the variation in textural features of milks’ images: (a) mean, (b) standard deviation, (c) skewness, (d) kurtosis, (e) contrast, (f) dissimilarity, (g) energy, (h) homogeneity, (i) correlation, (j) angular second moment, (k) short run emphasis, (l) long run emphasis, (m) gray level non-uniformity, (n) run length non-uniformity, and (o) run percentage.
Applsci 15 10883 g002aApplsci 15 10883 g002bApplsci 15 10883 g002cApplsci 15 10883 g002d
Figure 3. PCA score plot illustrating sample clustering by milk origin (PC1) and fat content (PC2) using Pareto-scaled data.
Applsci 15 10883 g003
Figure 4. PLS-DA score plot showing distinct clustering of samples by fat- and milk type content (red circles correspond to light cow milk, green to light goat milk, purple to whole cow milk and blue to whole goat milk).
Applsci 15 10883 g004
Figure 5. VIP plot showing the most influential FTIR spectral variables contributing to the PLS-DA model.
Applsci 15 10883 g005
Figure 6. Permutation test validating statistical significance of the supervised PLS-DA model; Cross-validation plot showing high predictive performance (Q2 > 0.85, R2 > 0.89).
Applsci 15 10883 g006
Table 1. Chemical composition of milk samples.
Composition (g/100 g)Cow’s Milk Light (17 Samples)Whole Cow’s Milk (18 Samples)Goat’s Milk Light (4 Samples)Whole Goat’s Milk (8 Samples)
Total fat1.4 ± 0.3a *3.6 ± 0.1b1.7 ± 0.1a3.7 ± 0.2b
Proteins3.4 ± 0.1ac3.3 ± 0.1a3.7 ± 0.1b3.6 ± 0.1bc
Carbohydrates4.8 ± 0.1a4.7 ± 0.1ab4.7 ± 0.1ab4.5 ± 0.1b
Sugars4.8 ± 0.1a4.7 ± 0.1a4.4 ± 0.1b4.4 ± 0.1b
Salt0.11 ± 0.02a0.10 ± 0.02a0.08 ± 0.00b0.07 ± 0.01b
Results are given as mean ± standard deviation (mean ± SD); * Different letters along the same row indicate a significant statistical difference (p < 0.05).
Table 2. Color parameters of milk samples.
Color ParametersCow’s Milk Light (17 Samples)Whole Cow’s Milk (18 Samples)Goat’s Milk Light (4 Samples)Whole Goat’s Milk (8 Samples)
L* (Lightness)75.67 ± 5.55a *78.91 ± 6.94a73.23 ± 7.89a74.24 ± 5.02a
a* (red–green)−3.26 ± 0.61a−2.50 ± 0.45b−3.07 ± 0.48ab−2.33 ± 0.36b
b* (yellow–blue)3.52 ± 0.38a5.33 ± 0.72b4.79 ± 0.26b4.92 ± 0.54b
h (hue angle)133.68 ± 11.72a115.46 ± 4.53b122.52 ± 2.53a115.29 ± 1.48b
Results are given as mean ± standard deviation (mean ± SD); * Different letters along the same row indicate a significant statistical difference (p < 0.05).
Table 3. Relative intensities % of ATR-FTIR spectra bands of milk samples.
Spectra Bands (cm−1)Cow’s Milk Light (17 Samples)Whole Cow’s Milk (18 Samples)Goat’s Milk Light (4 Samples)Whole Goat’s Milk (8 Samples)
3200–33000.786 ± 0.018a0.651 ± 0.054b0.749 ± 0.034a0.676 ± 0.045b
29220.412 ± 0.044a0.583 ± 0.035b0.474 ± 0.009c0.569 ± 0.019b
28540.115 ± 0.017a0.213 ± 0.023b0.151 ± 0.008c0.195 ± 0.011b
1741–17450.189 ± 0.024a0.308 ± 0.030b0.232 ± 0.011c0.315 ± 0.036b
1638–16450.437 ± 0.016a0.405 ± 0.013b0.489 ± 0.011c0.441 ± 0.005a
1535–15450.197 ± 0.014ab0.184 ± 0.010a0.209 ± 0.008b0.195 ± 0.006ab
1440–14700.054 ± 0.009a0.097 ± 0.007b0.078 ± 0.003c0.092 ± 0.005b
1396–14000.041 ± 0.005a-0.021 ± 0.002b-
1370–13800.011 ± 0.001a0.029 ± 0.004b0.021 ± 0.001c0.049 ± 0.006d
1280–13000.013 ± 0.001a0.012 ± 0.002a0.011 ± 0.002a0.011 ± 0.001a
1242–12450.056 ± 0.005a0.051 ± 0.004a0.057 ± 0.003a0.056 ± 0.005a
1145–11490.067 ± 0.008a0.091 ± 0.007b0.086 ± 0.004b0.092 ± 0.004b
10640.025 ± 0.003a0.037 ± 0.005b0.026 ± 0.002a0.035 ± 0.002b
1026–10280.557 ± 0.040a0.544 ± 0.028a0.453 ± 0.017b0.475 ± 0.018b
8910.041 ± 0.004a0.040 ± 0.005a0.045 ± 0.002a0.046 ± 0.004a
7770.045 ± 0.005a0.038 ± 0.003a0.041 ± 0.003a0.039 ± 0.002a
7000.030 ± 0.001a0.029 ± 0.002a0.030 ± 0.001a0.028 ± 0.001a
538–5420.045 ± 0.005a0.046 ± 0.004a0.053 ± 0.002a0.049 ± 0.002a
Results are given as mean ± standard deviation (mean ± SD); Different letter along the same row indicates a significant statistical difference (p < 0.05).
Table 4. Proteins’ secondary structure proportion (%) of milk samples.
Secondary Structure of Proteins (%)Cow’s Milk Light (17 Samples)Whole Cow’s Milk (18 Samples)Goat’s Milk Light (4 Samples)Whole Goat’s Milk (8 Samples)
β-parallel sheet
1610–1642 cm−1
42.45 ± 0.63ac *37.43 ± 0.29b42.80 ± 0.35a41.54 ± 0.83c
random coil
1642–1650 cm−1
26.86 ± 0.37a29.17 ± 0.45b25.78 ± 0.46c24.57 ± 0.55d
α-helix
1650–1660 cm−1
22.02 ± 0.59a24.52 ± 0.40b20.25 ± 0.46c20.32 ± 1.15c
β-turn
1660–1680 cm−1
8.66 ± 0.88a8.88 ± 0.48a11.16 ± 0.30b13.56 ± 0.86c
Results are given as mean ± standard deviation (mean ± SD); * Different letter along the same row indicates a significant statistical difference (p < 0.05).
Table 5. Discriminative molecular features for cow versus goat milk differentiation identified through ATR-FTIR spectroscopy. The table summarizes validated markers with Area Under the Curve (AUC) values exceeding 0.70, including secondary structure components and functional group-specific vibrational bands.
Cow Milk vs. Goat Milk
FeaturesAUCp-Values
β-turn16.44 × 10−17
random coil13.07 × 10−10
α-helix0.998.06 × 10−9
891 cm−10.874.28 × 10−6
1382 cm−10.834.96 × 10−6
538–542 cm−10.81.33 × 10−3
1242–1245 cm−10.789.89 × 10−3
1311–1313 cm−10.781.08 × 10−3
1145–1149 cm−10.745.64 × 10−3
Table 6. Robust spectral and structural markers distinguishing cow and goat whole milk samples. Validated variables (AUC > 0.70) are presented, encompassing conformational protein features and characteristic infrared absorbance bands. The listed markers reflect compositional and structural attributes unique to whole-fat milk across milk types.
Cow Whole Milk vs. Goat Whole Milk
FeaturesAUCp-Values
1382 cm−112.41 × 10⁻⁷
β-parallel sheet15.16 × 10−16
random coil11.36 × 10−17
α-helix15.33 × 10−13
β-turn11.91 × 10−15
1242–1245 cm−10.816.30 × 10−3
1311–1313 cm−10.81.18 × 10−2
1440–1450 cm−10.734.63 × 10−2
Table 7. Validated FTIR-based markers enabling classification of light cow and goat milk. The table reports feature with confirmed discriminatory power (AUC > 0.70), highlighting the influence of protein folding, carbohydrate vibrations, and residual lipid bands in differentiating light milk products by milk origin.
Cow Light Milk vs. Goat Light Milk
FeaturesAUCp-Values
891 cm−111.03 × 10⁻²
1026–1028 cm−113.81 × 10⁻¹²
1145–1149 cm−113.08 × 10⁻⁶
1396–1400 cm−111.48 × 10⁻⁷
α-helix12.27 × 10−5
β-turn12.61 × 10−5
1440–1450 cm−10.993.49 × 10−5
2854 cm−10.992.02 × 10−2
random coil0.977.18 × 10−5
1064 cm−10.964.66 × 10−4
1382 cm−10.941.96 × 10−3
538–542 cm−10.937.15 × 10−3
1741–1745 cm−10.932.77 × 10−3
1638–1645 cm−10.911.00 × 10−2
777 cm−10.791.42 × 10−2
Disclaimer/Publisher’s Note: The statements, opinions and data contained in all publications are solely those of the individual author(s) and contributor(s) and not of MDPI and/or the editor(s). MDPI and/or the editor(s) disclaim responsibility for any injury to people or property resulting from any ideas, methods, instructions or products referred to in the content.