Abstract
The temporal dominance of sensations (TDS) method captures assessors’ real-time sensory experiences during food tasting, while the temporal liking (TL) method evaluates dynamic changes in food preferences or perceived deliciousness. These sensory evaluation tools are essential for understanding consumer preferences but are also resource-intensive processes in the food development cycle. In this study, we used reservoir computing, a machine learning technique well-suited for time-series data, to predict temporal changes in liking based on the temporal evolution of dominant sensations. While previous studies developed reservoir models for specific food brands, achieving cross-brand prediction—predicting the temporal liking of one brand using a model trained on other brands—is a critical step toward replacing human assessors. We applied this approach to coffee products, predicting temporal liking for a given brand from its TDS data using a model trained on three other brands. The average prediction error across all brands was approximately 10% of the maximum instantaneous liking scores, and the mean correlation coefficients between the observed and predicted temporal scores ranged from 0.79 to 0.85 across the four brands, demonstrating the model’s potential for cross-brand prediction. This approach offers a promising technique for reducing the costs of sensory evaluation and enhancing product development in the food industry.
1. Introduction
Sensory evaluation allows for the recording of subjective experiences based on complex phenomena occurring in the mouth that are caused by, for example, saliva, mastication, and synergy of taste sensations [1,2,3,4]. Although numerous attempts have been made to replace or complement sensory evaluation with chemical, optical, and mechanical analysis methods [5,6,7,8,9], it remains an indispensable tool in the field of food science. For instance, according to a survey reported in 2021, approximately 70% of food developers employ sensory evaluation approaches to assess new products [10].
As relatively new sensory evaluation methods, the temporal dominance of sensations (TDS) method [11,12,13,14] and the temporal liking (TL) method [15,16,17] have garnered attention. While many conventional sensory evaluation methods aim to obtain an overall assessment of the tasting experience, these methods focus on capturing the temporal changes in sensations and preferences during tasting. Because of their rich time-series data, TDS methods can effectively distinguish between different food brands [18,19,20,21,22]. Furthermore, TDS methods have opened new doors for mathematical modeling of human sensory experiences, including causal modeling of interactions between sensory and emotional attributes [23] and stochastic modeling of sensory experience transitions [24,25].
The TDS method is still in its developmental stages. As this method involves averaging multiple responses, it is currently not well-suited for addressing individual differences. However, approaches for analyzing differences among panels [26] and samples [27] are being developed. Furthermore, there are several variations of the TDS method [28], highlighting the need for protocol standardization.
Similar to other sensory evaluation methods, collecting a large number of samples for TDS tasks is costly, limiting the volume of data available for most statistical and machine learning algorithms. Consequently, data-scientific applications of the TDS method require further research efforts. This challenge is expected to be addressed gradually through the implementation of resampling or data augmentation techniques [20,29]. This study is part of a broader effort to apply machine learning algorithms to TDS data.
Although the roots of the TL method are not actually new [30], the approach of combining the TDS and TL methods to analyze food tastes has drawn the interest of many researchers [15,16,17,31,32,33,34,35,36]. This is because this combination can serve as a framework for identifying the taste factors that determine temporal preferences. For example, Thomas et al. [15,17] discussed the drivers of liking based on the average temporal liking scores when a specific taste attribute is being evaluated using the TDS method. We also consider the conjunctive use of the TDS and TL methods in this study.
Attempts to replace temporal sensory evaluation with instrumented machines and computational methods have only recently begun. Aoki et al. [37] estimated the temporal changes in food texture from the time history of forces required for chewing food. Natsume and Okamoto [38] proposed a method to predict the temporal changes in liking from TDS results using machine learning, demonstrating its feasibility with strawberries as an example. This study extends their work to cross-brand prediction.
As shown in Figure 1, cross-brand or inter-brand prediction refers to the use of a predictive model trained on data from brands to estimate the temporal liking of another brand of the same food product. Demonstrating the effectiveness of machine learning predictions on untrained brands is a crucial step toward practical applications. This is the first research to investigate the feasibility of cross-brand estimation of temporal liking. The ultimate goal of this study is to replace part of the sensory evaluation conducted by human panels with machine-based methods, aiming to reduce costs and enhance the efficiency of food development and evaluation.
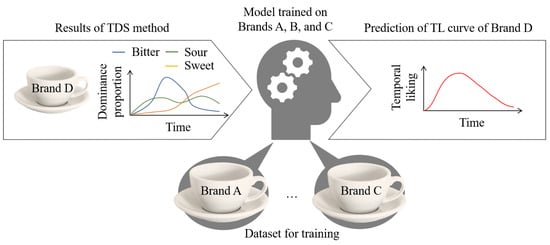
Figure 1.
Cross-brand prediction of a temporal liking curve from temporal dominance of sensations curves. Machine learning model trained on Brands A–C is used to predict the temporal liking of Brand D.
In this study, we evaluated the cross-brand prediction performance of the method introduced by Natsume and Okamoto [38], using instant coffee as an example. In their study, Natsume and Okamoto [38] investigated the effectiveness of the machine learning method using TDS and TL task samples from the same strawberry brand. In contrast, this study involved TDS and TL tasks for four types of instant coffee from a single company. A predictive model trained on data from three coffee types was used to estimate the temporal liking of the fourth type. We then discuss the potential for cross-brand estimation of temporal liking scores. This study represents a step toward the application of machine learning approaches as alternatives to sensory evaluations conducted by human panels.
The remainder of this paper is structured as outlined in Figure 2. The TDS and TL tasks conducted for four coffee brands are detailed in Section 2. The preparation of data for model training is explained in Section 3.3. The specification, training, and validation of the machine learning model are presented in Section 3. The estimation results are summarized in Section 4, followed by discussions of these results in Section 5.
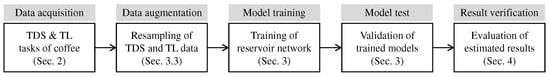
Figure 2.
Structure of the paper.
2. Sensory Evaluation: TDS and TL Methods
2.1. Food Stimuli: Four Coffee Brands
Four coffee brands were used as food stimuli: Kilimanjaro, Columbia, Brazil, and Mocha (A Slightly Luxurious Coffee Shop, Ajinomoto AGF, Inc., Tokyo, Japan; manufacturing numbers: +TE/160724F). These are dried soluble coffee powders produced by the same manufacturer, each characterized by distinct flavors. These coffee brands are readily available in Japan and can be easily purchased at local supermarkets.
For preparation, 1 g of coffee powder was dissolved in 80 mL of hot water at 65 °C in a paper cup. The hot water was prepared using an electric kettle with a temperature control function (Ecorelax Ltd., Birmingham, UK). Participants were instructed to take a sip of the coffee immediately after it was served. To account for individual preferences, the timing and amount of coffee consumed were not controlled. No additional measures were taken to maintain the coffee temperature after serving. For each trial, a new, identical solid white paper cup was used to ensure that participants could not distinguish between brands based on the cups’ appearance. No additives, such as milk or sugar, were included.
2.2. Panels
Twenty-one university students (mean age of 21.1 years; seven females) participated in the experiment as panels, in accordance with the recommended number of assessors outlined in ISO 13299 [12]. All participants reported that they either drank coffee nearly every day or enjoyed coffee regularly. Among them, 13 typically drank black coffee, while the others preferred coffee with milk or milk and sugar. Written informed consent was obtained from all participants prior to the experiment. Participants performed the tasks at least two hours after their last meals, either in the morning or afternoon.
2.3. Procedures of TDS Method
The experiment was conducted in a quiet office room with a controlled temperature of 22 °C. The brightness at the desktop was approximately 500–700 lux.
The TDS experiment was conducted using a custom Python-based application developed by the authors. The interface displayed buttons labeled with sensory attributes, such as sweet or bitter, representing various sensations. An example of the interface is shown in Figure 3a. Participants were instructed to take a sip of coffee and begin the task by pressing the start button themselves.
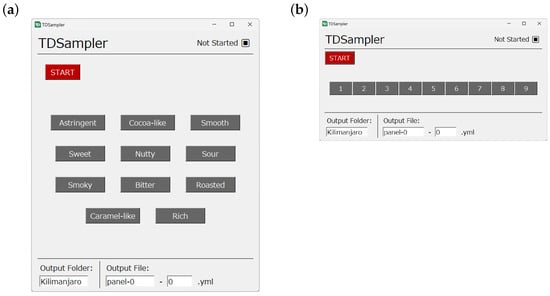
Figure 3.
Graphical interface used in the TDS/TL tasks. (a) Interface for the TDS task. Buttons labeled by sensory attributes are displayed. (b) Interface for the TL tasks. Nine buttons with liking scores are displayed.
After the task began, participants pressed the button corresponding to the attribute that best described the dominant sensation they perceived. When their perception of the dominant sensation changed, they selected a different button. This process continued throughout the coffee tasting, which lasted for 10 s, during which the participants held the coffee in their mouths. After swallowing the coffee, they continued their evaluation for an additional 5 s, resulting in a total task duration of 15 s. The timing was monitored and announced by the experimenter. Participants then rinsed their mouths with water and rested for at least 2 min before proceeding to the next trial.
Each participant evaluated all four coffee brands, with each brand being tested three times. This repetition of the task adhered to the guidelines outlined in ISO 13299 [12]. Consequently, each individual completed a total of 12 TDS trials (four brands × three repetitions) in a randomized block design. In this design, all four brands were tested in each of the three sessions, with the order of the coffee brands randomized for each participant to minimize potential order effects. The entire evaluation task, including the TL tasks described in Section 2.5, took approximately 1.5 h per participant.
Before the main task, participants completed a training session to familiarize themselves with the TDS procedure and the button arrangement on the computer interface. This session lasted several minutes.
2.4. Sensory Attributes Used in TDS Tasks
In this study, 11 sensory attributes were used: astringent, bitter, caramel-like, cocoa-like, nutty, rich, roasted, smoky, smooth, sour, and sweet. The labels for the attributes were randomly arranged on the interface for each participant but remained consistent throughout their trials. These attributes were selected from an initial pool of 20 attributes used in the sensory evaluation literature on coffee [39,40,41,42,43]. The list was refined to 11 attributes using a check-all-that-apply (CATA) analysis. During this process, a group of seven participants, including the authors, tasted each coffee sample and identified attributes applicable to coffee. The final 11 attributes were those that received the highest number of votes (seven or six). Their descriptions, adapted from [43] for use with untrained panels, are presented in Table 1.

Table 1.
Description of attributes presented to the panels.
2.5. Procedures of TL Method
In the TL method, participants used a custom-made on-screen interface displaying buttons numbered from 1 to 9, as shown in Figure 3b. Participants rated their momentary liking of the coffee by pressing a button, where 9 indicated “very favorable” and 1 indicated “very unfavorable”. Similar to the TDS method, participants pressed a different button whenever their evaluation changed.
The timing protocol was identical to that of the TDS method. Participants began the task by taking a sip of coffee and holding it in their mouths for 10 s before swallowing. They then continued their evaluation for an additional 5 s, concluding the task themselves. A randomized block design, similar to that used in TDS tasks, was employed with three repetitions for each brand. A two-minute break was taken after completing each task.
2.6. TDS and TL Curves
The results of the TDS tasks are visualized as TDS curves. A TDS curve for an attribute represents the changes in dominance proportion, defined as the proportion of time points at which the attribute was selected as dominant. All attributes are displayed on the same graph, illustrating how multiple sensations evolve throughout the tasting process. The time axis is normalized between 0 (start of the task) and 1 (end of the task). The TDS curves represent the average experience across all panels.
Similarly, the results of the TL tasks are visualized as curves that depict the time-series changes in average liking scores. The liking scores range from 1 to 9; however, the score is considered 0 when no rating is provided immediately after the start of the task. As a result, the liking curve may take values below 1 during the initial phase.
2.7. Results of TDS and TL Tasks
Figure 4 presents the TDS and TL curves for the four coffee brands. At the normalized time of 0.67 (10 s after the initiation of the task), participants were expected to have consumed the coffee. They then reported the tastes or flavors perceived in the mouth after drinking.
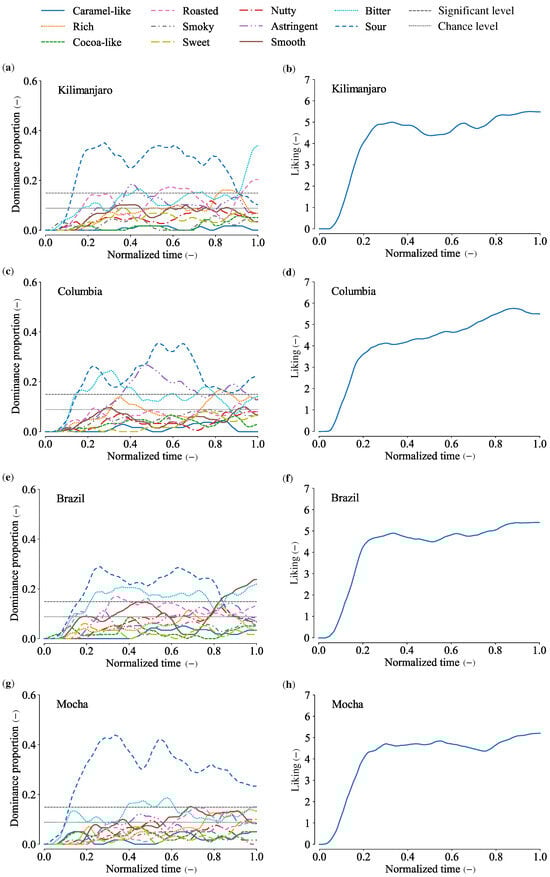
Figure 4.
TDS/TL curves of four brands of coffee. (a) TDS curves of Kilimanjaro. (b) TL curve of Kilimanjaro. (c) TDS curves of Columbia. (d) TL curve of Columbia. (e) TDS curves of Brazil. (f) TL curve of Brazil. (g) TDS curves of Mocha. (h) TL curve of Mocha.
Across all brands, a prominent sour taste was observed throughout the tasting period. Additionally, the liking curves for all brands showed a sharp increase during the initial phase (approximately 0.2), followed by fluctuations between 4 and 6 until the end of the task. The characteristic features of each brand are summarized below.
Kilimanjaro. Sourness diminished in the final phase, with bitterness becoming the most dominant taste. The TL curve nearly peaked at the normalized time of 0.3 and remained stable until the end of the task.
Colombia. Sourness, bitterness, and astringency alternated throughout the task. Astringency reached its highest value during the middle phase of the tasting. The TL curve increased monotonically, nearly reaching its peak at the end of the task.
Brazil. Sourness was the dominant taste throughout the task, except in the final phase. Smoothness and bitterness were most pronounced during the last period after drinking the coffee. The TL curve resembled that of Kilimanjaro, peaking early and remaining stable until the end.
Mocha. Sourness was the most dominant attribute across all four brands and persisted throughout the entire task. Despite this, the TL curve for Mocha showed a similar profile to Brazil, peaking early and remaining relatively stable.
These results highlight the distinct sensory and liking profiles of the four coffee brands, suggesting that cross-brand prediction among these brands poses a significant challenge.
3. Predictive Models
3.1. Reservoir Computing
Reservoir computing is a machine learning approach particularly well-suited for processing time-series data. In this study, we employed an echo state network [44], a widely used model in reservoir computing. Its architecture comprises three layers: an input layer, a reservoir layer, and an output layer, as illustrated in Figure 5.
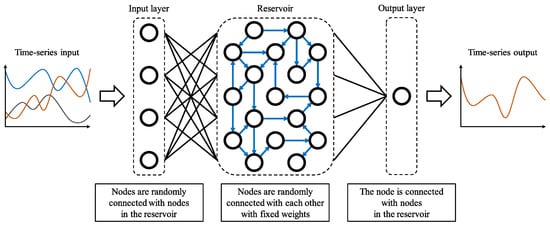
Figure 5.
Echo state network with one-dimensional output (adapted from [38]). The network receives multiple time-series inputs (TDS curves), represented in different colors, and produces a single TL curve as output.
The reservoir layer is a recurrent neural network that performs nonlinear computations. Its nodes are randomly connected, and their weights remain fixed throughout the training process. This layer acts as a memory by storing information about past inputs, enabling the model to process sequential data where the current state depends on previous states.
The output layer generates the final output by linearly combining the activations of the reservoir layer nodes. During training, only the weights between the reservoir layer and the output layer are adjusted, making the training process computationally efficient and less resource-intensive.
For this study, we implemented the echo state network using ReservoirPy (version 0.3.12), a Python library for reservoir computing.
3.2. Model Specification
For each target coffee brand, we constructed 16 independent models to predict TL curves based on TDS curves. As described in Section 3.4, each model was trained on a different dataset. The input layer of the echo state network had 11 dimensions, corresponding to the number of sensory attributes, while the output layer had a single dimension, as the liking score was represented as a scalar value.
The echo state network required several hyperparameters to be specified, among which the size of the reservoir layer was determined first. To this end, the model was trained and evaluated using data from the four coffee brands. The optimal reservoir size was found to be 128 neurons, which minimized the prediction error, measured as the root mean square error (RMSE) of the TL curve values. This reservoir size aligns with our previous study on strawberries [38].
Other hyperparameters were adjusted for each model to achieve optimal performance. Initially, parameter values were set based on reference values from [45]. A neighborhood search was then conducted to minimize the RMSE of the TL curves. The tuning process was terminated when the RMSE fluctuation was less than 0.01. The ranges of the final hyperparameters are listed in Table 2.
Table 2.
Ranges of hyperparameters for the reservoir models.
Since the echo state network operates on discretized time-series data, the TDS and TL curves were discretized into 1000 points along the time axis before being input into the model.
3.3. Data Augmentation Using Bootstrap Resampling
To augment the dataset, we applied the bootstrap resampling method [20,29] to the TDS and TL curve sets, generating new curve sets with statistically valid variations. The original dataset consisted of 21 TDS and TL curve sets obtained from 21 panels. Each panel performed three TDS and TL trials, and the mean curves across these trials were used as their representative values.
To create a new sample curve set, the bootstrap method randomly selected 21 panels from the original pool with replacement (i.e., the same panel could be selected multiple times). The TDS and TL curves of these selected panels were averaged to create a new set of curves. This resampling process was repeated to generate datasets for training and validation.
3.4. Training and Validation
Each cross-brand model was trained on data from three coffee brands and tested on the remaining brand. For instance, to predict the TL curves for the Kilimanjaro brand, the model was trained using datasets from the Columbia, Brazil, and Mocha brands ( curve sets for training). The trained model was then tested on the Kilimanjaro brand using 20 curve sets. This process was repeated for each brand with 16 independent models, resulting in a total of 320 test trials.
As a baseline reference, intra-brand prediction models were also constructed. These models were trained and tested on datasets from the same coffee brand, providing an expectation of better prediction performance compared to the cross-brand models. For each brand, 16 models were trained using different datasets and tested on 20 datasets, leading to a total of 320 test trials per brand, similar to the cross-brand models.
We recorded the RMSE and the coefficient of determination () as performance metrics for predicting TL curves. To ensure robust results, outliers were excluded from the analysis. Samples were retained only if their RMSEs fell within the range defined by the third quartile plus 1.5 times the interquartile range and the first quartile minus 1.5 times the interquartile range.
4. Results
4.1. Cross-Brand Prediction
Table 3 presents the RMSE and values for each cross-brand prediction, along with their 95% confidence intervals, calculated from 320 validation trials. The best prediction performance was observed for Kilimanjaro and Mocha, both achieving a mean RMSE of 0.59. These were followed by Brazil with a mean RMSE of 0.63 and Colombia with a mean RMSE of 0.71.
Table 3.
Results of cross-brand prediction. Means and 95% confident intervals.
Figure 6 provides examples of estimation results for each brand, specifically the trials with the median RMSE among all validations. Similar to the mean curves in Figure 4, the TDS curves showed sourness as a prominent attribute across all brands. However, the temporal profiles of sourness differed between brands. For example, in the Mocha brand, sourness became dominant early in the tasting phase and persisted throughout the task. In contrast, Colombia exhibited a gradual rise in sourness during the middle phase, followed by a gradual decline. Other attributes also differed among the brands.
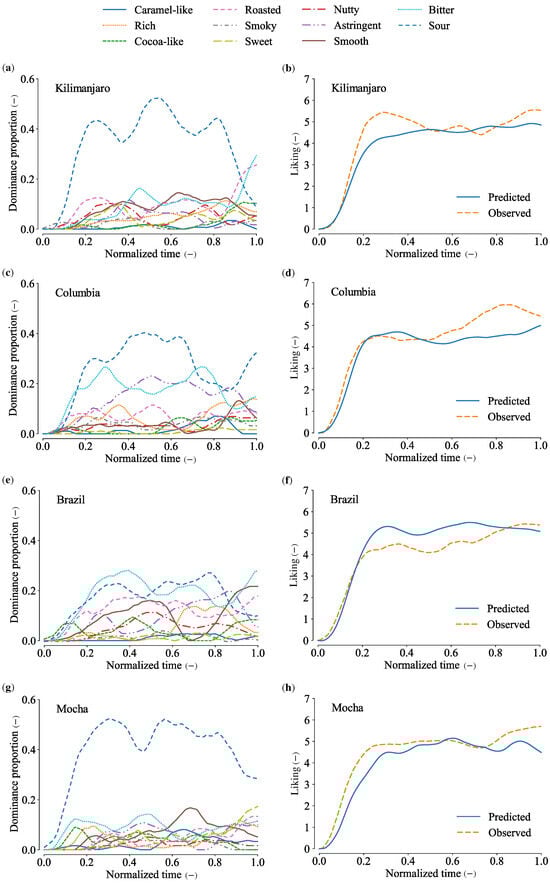
Figure 6.
TDS curves and predicted/observed TL curves of four brands with median RMSEs. (a) TDS curves of Kilimanjaro. (b) TL curves of Kilimanjaro. RMSE . (c) TDS curves of Columbia. (d) TL curves of Columbia. RMSE = 0.70. (e) TDS curves of Brazil. (f) TL curves of Brazil. RMSE = 0.63. (g) TDS curves of Mocha. (h) TL curves of Mocha. RMSE = 0.59.
4.2. Intra-Brand Prediction
Table 4 presents the RMSE and values for each intra-brand prediction, along with their 95% confidence intervals, calculated from 320 validation trials. The best prediction performance was observed for Mocha, with a mean RMSE of 0.46. This was followed by Brazil at 0.53, Colombia at 0.57, and Kilimanjaro at 0.59.
Table 4.
Intra-brand prediction results with 95% confident intervals.
4.3. Comparison Between Cross-Brand and Intra-Brand Predictions
The performance of cross-brand predictions (Table 3) demonstrates that the models generalize across brands, achieving mean RMSE values in the range of 0.59–0.71. In contrast, intra-brand predictions (Table 4) resulted in lower RMSE values, ranging from 0.46 to 0.59, indicating more accurate predictions when the training and test data originate from the same brand.
Table 5 presents the Wilcoxon–Mann–Whitney test statistics, computed using MATLAB (2024b, MathWorks, Inc., Natick, MA, USA), comparing the RMSE values of cross-brand and intra-brand predictions. Among the brands, Kilimanjaro exhibited the smallest difference between the cross-brand and intra-brand RMSE values (). In contrast, Columbia, Brazil, and Mocha showed statistically significant differences in prediction accuracy with p-values below .
Table 5.
Wilcoxon–Mann–Whitney test statistics between cross-brand RMSE and intra-brand RMSE of four brands.
5. Discussion
The predicted TL curves for the untrained brands exhibited mean prediction errors ranging from 0.59 to 0.71. Given that the TL values were rated on a scale from 1 to 9 and the TL curves peaked at approximately 6, the average prediction error was around 10% of the maximum TL values. While we cannot definitively conclude whether such errors are acceptable, as no precise standards have been established, these results suggest that TL curves can be reasonably predicted from TDS curves. This approach has the potential to significantly reduce the costs associated with sensory evaluation tasks performed by human assessors.
The results of this study suggest that the framework for cross-brand prediction is effective when applied to different brands of the same food that share similar sensory profiles. However, this approach may not be applicable to food brands with significantly divergent characteristics. For instance, predicting TL curves for milk coffee using a model trained on black coffee may be challenging. Currently, the extent to which differences in food brands can be accommodated by this method remains unclear. As a next step, we aim to expand the range of food brands studied to evaluate the impact of such variations on the performance of cross-brand prediction.
Predictive models can serve as a complement to, rather than a replacement for, human panels. For instance, consider a scenario where a fifth coffee brand is being developed in addition to the existing four brands. Suppose sufficient TDS and TL data have already been collected from a large number of panels for the four existing brands. A reservoir network could then be constructed using the data from these four brands. In this case, it would be beneficial to construct more than ten networks using resampled data. In this study, we utilized 16 networks. For the new brand prototypes, a small number of panels would conduct TDS tasks. Using these TDS curves as input, the reservoir networks would generate TL curves. Since 16 slightly different TL curves would be obtained from the 16 networks, their mean and variance should be used as references. In this way, the TL tasks for the prototypes could be omitted.
In addition to the above method, it may also be beneficial to conduct TL tasks with a small number of panels for the prototypes to enhance the reliability of the predictions. The resulting data can then be used to further refine the reservoir networks. This concept is likely analogous to transfer learning in machine learning [46,47], where a model trained on one domain is adapted to a different target domain. In such scenarios, it is common to fine-tune or retrain the model using data from the target domain. In the case of reservoir computing, retraining is not involved; instead, the approach relies on learning that integrates sufficient data from other brands with a small amount of data from the target brand. For this purpose, employing trained panels to obtain high-quality and unbiased data for the target brand may be effective.
The limitations of this study are acknowledged here. As discussed, the cross-brand prediction technique has not yet been fully established. Future research should explore how the applicability of predictive models depends on the specific characteristics of food brands. Additionally, efforts to enhance prediction performance will be essential. It should also be noted that the current framework does not account for individual differences in food preferences, which remains a common challenge for both the TDS and TL methods as they analyze average sensory properties across a group of consumers. A potential solution involves training separate models for distinct consumer groups. For instance, in the context of coffee, consumers can be classified based on factors such as their preferences for coffee styles and attributes [48]. In the present study, however, we focused only on habitual coffee drinkers. Addressing these limitations will be crucial for advancing machine-assisted tasting and preference testing in the field of food science.
6. Conclusions
The TDS and TL methods are well-established tools for collecting subjective ratings of time-evolving tasting experiences. However, few studies have explored how these sensory evaluation tasks can be substituted with computational approaches. A key technique for such automation is the cross-brand prediction of TL curves, where a machine learning model trained on data from different food brands predicts consumer preferences for a specific brand.
In this study, we employed reservoir computing to predict TL curves from TDS curves across four brands of coffee products. The constructed models achieved mean RMSEs ranging from 0.59 to 0.71 on a nine-point scale for temporal liking. These results suggest that TL tasks for a given brand can be reduced by predicting its TL curves from its TDS data, offering a cost-effective and efficient alternative to traditional sensory evaluation. This approach has the potential to accelerate product development in the food industry.
Author Contributions
Conceptualization, H.N. and S.O.; methodology, H.N. and S.O.; software, H.N.; validation, H.N. and S.O.; formal analysis, H.N.; investigation, H.N. and S.O.; resources, H.N.; data curation, H.N.; writing—original draft preparation, H.N. and S.O.; writing—review and editing, H.N. and S.O.; visualization, H.N.; supervision, S.O.; project administration, S.O.; funding acquisition, S.O. All authors have read and agreed to the published version of the manuscript.
Funding
This research was in part funded by the Urakami Foundation for Food and Food Culture Promotion (R6-Okamoto).
Institutional Review Board Statement
The study was approved by the Institutional Review Board, Hino Campus, Tokyo Metropolitan University (approval number: R6-008, approval date: 19 April 2024).
Informed Consent Statement
All the participants provided written informed consent in advance.
Data Availability Statement
The dataset is available upon request from the authors, subject to accountability and approval for its intended use.
Conflicts of Interest
The authors declare no conflicts of interest.
References
- Zhang, F.; Klebansky, B.; Fine, R.M.; Xu, H.; Pronin, A.; Liu, H.; Tachdjian, C.; Li, X. Molecular Mechanism for the Umami Taste Synergism. Proc. Natl. Acad. Sci. USA 2008, 105, 20930–20934. [Google Scholar] [CrossRef] [PubMed]
- Mao, Y.; Tian, S.; Qin, Y.; Chen, S. Sensory Sweetness and Sourness Interactive Response of Sucrose-citric Acid Mixture based on Synergy and Antagonism. Npj Sci. Food 2022, 6, 33. [Google Scholar] [CrossRef] [PubMed]
- Pedersen, L.; Bertelsen, A.S.; Byrne, D.V.; Kidmose, U. Sensory Interactions between Sweetness and Fat in a Chocolate Milk Beverage. Foods 2023, 12, 2711. [Google Scholar] [CrossRef] [PubMed]
- Liu, S.; Gu, Y.; Zheng, R.; Sun, B.; Zhang, L.; Zhang, Y. Progress in Multisensory Synergistic Salt Reduction. Foods 2024, 13, 1659. [Google Scholar] [CrossRef]
- Toko, K. Recent development of taste sensors. Food Sci. Technol. Res. 2023, 29, 87–99. [Google Scholar] [CrossRef]
- Ghasemi-Varnamkhasti, M.; Mohtasebi, S.S.; Siadat, M. Biomimetic-based odor and taste sensing systems to food quality and safety characterization: An overview on basic principles and recent achievements. J. Food Eng. 2010, 100, 377–387. [Google Scholar] [CrossRef]
- Shibata, A.; Takahashi, R.; Nagahata, Y.; Kimura, K.; Shimizu, R.; Hotta, M.; Inoue, M.; Higashimori, M. Food Texture Estimation Using Robotic Mastication Simulator Equipped with Teeth and Tongue. Sens. Mater. 2019, 31, 2367. [Google Scholar] [CrossRef]
- Rodrigues, S.S.Q.; Dias, L.G.; Teixeira, A. Emerging Methods for the Evaluation of Sensory Quality of Food: Technology at Service. Curr. Food Sci. Technol. Rep. 2024, 2, 77–90. [Google Scholar] [CrossRef]
- Fodor, M.; Matkovits, A.; Benes, E.L.; Jókai, Z. The Role of Near-Infrared Spectroscopy in Food Quality Assurance: A Review of the Past Two Decades. Foods 2024, 13, 3501. [Google Scholar] [CrossRef]
- Świa̧der, K.; Marczewska, M. Trends of Using Sensory Evaluation in New Product Development in the Food Industry in Countries That Belong to the EIT Regional Innovation Scheme. Foods 2021, 10, 446. [Google Scholar] [CrossRef]
- Pineau, N.; Schlich, P.; Cordelle, S.; Mathonniére, C.; Issanchou, S.; Imbert, A.; Rogeaux, M.; Etiévant, P.; Köster, E. Temporal dominance of sensations: Construction of the TDS curves and comparison with time-intensity. Food Qual. Prefer. 2009, 20, 450–455. [Google Scholar] [CrossRef]
- ISO 13299; Sensory Analysis–Methodology–General Guidance for Establishing a Sensory Profile. International Organization for Standarzation: Geneva, Switzerland, 2016.
- Marques, C.; Correia, E.; Dinis, L.T.; Vilela, A. An Overview of Sensory Characterization Techniques: From Classical Descriptive Analysis to the Emergence of Novel Profiling Methods. Foods 2022, 11, 255. [Google Scholar] [CrossRef] [PubMed]
- Visalli, M.; Galmarini, M.V. Multi-attribute temporal descriptive methods in sensory analysis applied in food science: A systematic scoping review. Compr. Rev. Food Sci. Food Saf. 2024, 23, e13294. [Google Scholar] [CrossRef] [PubMed]
- Thomas, A.; Visalli, M.; Cordelle, S.; Schlich, P. Temporal Drivers of Liking. Food Qual. Prefer. 2015, 40, 365–375. [Google Scholar] [CrossRef]
- Meyners, M. Temporal liking and CATA analysis of TDS data on flavored fresh cheese. Food Qual. Prefer. 2016, 47, 101–108. [Google Scholar] [CrossRef]
- Thomas, A.; Chambault, M.; Dreyfuss, L.; Gilbert, C.; Hegyi, A.; Henneberg, S.; Knippertz, A.; Kostyra, E.; Kremer, S.; Silva, A.; et al. Measuring temporal liking simultaneously to Temporal Dominance of Sensations in several intakes. An application to Gouda cheeses in 6 Europeans countries. Food Res. Int. 2017, 99, 426–434. [Google Scholar] [CrossRef]
- Pineau, N.; Schilch, P. 13—Temporal dominance of sensations (TDS) as a sensory profiling technique. In Rapid Sensory Profiling Techniques; Delarue, J., Lawlor, J.B., Rogeaux, M., Eds.; Woodhead Publishing Series in Food Science, Technology and Nutrition; Woodhead Publishing: Sawston, UK, 2015; pp. 269–306. [Google Scholar] [CrossRef]
- Okamoto, S.; Ehara, Y.; Okada, T.; Yamada, Y. Affective dynamics: Principal motion analysis of temporal dominance of sensations data. IEEE Trans. Affect. Comput. 2020, 13, 871–880. [Google Scholar] [CrossRef]
- Castura, J.; Rutledge, D.; Ross, C.; Næs, T. Discriminability and Uncertainty in Principal Component Analysis (PCA) of Temporal Check-all-that-apply (TCATA) Data. Food Qual. Prefer. 2022, 96, 104370. [Google Scholar] [CrossRef]
- Nguyen, H.; Wismer, W.V. Temporal Sensory Profiles of Regular and Sodium-Reduced Foods Elicited by Temporal Dominance of Sensations (TDS) and Temporal Check-All-That-Apply (TCATA). Foods 2022, 11, 457. [Google Scholar] [CrossRef]
- Saita, A.; Yamamoto, K.; Raevskiy, A.; Takei, R.; Washio, H.; Shioiri, S.; Sakai, N. Crispness, the Key for the Palatability of “Kakinotane”: A Sensory Study with Onomatopoeic Words. Foods 2021, 10, 1724. [Google Scholar] [CrossRef]
- Okada, T.; Okamoto, S.; Yamada, Y. Affective Dynamics: Causality Modeling of Temporally Evolving Perceptual and Affective Responses. IEEE Trans. Affect. Comput. 2022, 13, 628–639. [Google Scholar] [CrossRef]
- Cardot, H.; Lecuelle, G.; Schlich, P.; Visalli, M. Estimating finite mixtures of semi-Markov chains: An application to the segmentation of temporal sensory data. J. R. Stat. Soc. Appl. Stat. Ser. C 2019, 68, 1281–1303. [Google Scholar] [CrossRef]
- Lecuelle, G.; Visalli, M.; Cardot, H.; Schlich, P. Modeling Temporal Dominance of Sensations with semi-Markov chains. Food Qual. Prefer. 2018, 67, 59–66. [Google Scholar] [CrossRef]
- Lepage, M.; Neville, T.; Rytz, A.; Schlich, P.; Martin, N.; Pineau, N. Panel performance for Temporal Dominance of Sensations. Food Qual. Prefer. 2014, 38, 24–29. [Google Scholar] [CrossRef]
- Natsume, H.; Okamoto, S.; Nagano, H. TDS similarity: Outlier analysis using a similarity index to compare time-series responses of temporal dominance of sensations Tasks. Foods 2023, 12, 2025. [Google Scholar] [CrossRef]
- Castura, J.C.; Antúnez, L.; Giménez, A.; Ares, G. Temporal Check-All-That-Apply (TCATA): A Novel Dynamic Method for Characterizing Products. Food Qual. Prefer. 2016, 47, 79–90. [Google Scholar] [CrossRef]
- Okamoto, S. Bootstrap Resampling of Temporal Dominance of Sensations Curves to Compute Uncertainties. Foods 2021, 10, 2472. [Google Scholar] [CrossRef]
- Taylor, D.E.; Pangborn, R.M. Temporal aspects of hedonic responses. J. Sens. Stud. 1990, 4, 241–247. [Google Scholar] [CrossRef]
- Nagano, H.; Saito, N.; Matsumori, K.; Kazama, T.; Konyo, M.; Yokokohji, Y. On the Analysis of Tactile Sensation Based on Time Measurement: An Experimental Case Study on the Interaction Between Skin and Lotion. IEEE Trans. Haptics 2023, 16, 339–344. [Google Scholar] [CrossRef]
- Thomas Carr, B.; Lesniauskas, R.O. Analysis of variance for identifying temporal drivers of liking. Food Qual. Prefer. 2016, 47, 97–100. [Google Scholar] [CrossRef]
- Castura, J.C.; Li, M. Using TDS dyads and other dominance sequences to characterize products and investigate liking changes. Food Qual. Prefer. 2016, 47, 109–121. [Google Scholar] [CrossRef]
- Ares, G.; Alcaire, F.; Antúnez, L.; Vidal, L.; Giménez, A.; Castura, J.C. Identification of drivers of (dis)liking based on dynamic sensory profiles: Comparison of Temporal Dominance of Sensations and Temporal Check-all-that-apply. Food Res. Int. 2017, 92, 79–87. [Google Scholar] [CrossRef] [PubMed]
- Silva, A.P.; Voss, H.P.; van Zyl, H.; Hogg, T.; de Graaf, C.; Pintado, M.; Jager, G. Temporal Dominance of Sensations, Emotions, and Temporal Liking Measured in a Bar for Two Similar Wines Using a Multi-Sip Approach. J. Sens. Stud. 2018, 33, e12459. [Google Scholar] [CrossRef]
- Nguyen, Q.C.; Varela, P. Identifying temporal drivers of liking and satiation based on temporal sensory descriptions and consumer ratings. Food Qual. Prefer. 2021, 89, 104143. [Google Scholar] [CrossRef]
- Aoki, T.; Nakamoto, H.; Kobayashi, F. Prediction of Food Texture Changes Using Force Data in Simulations of Repetitive Chewing. Food Sci. Technol. Res. 2024, 30, 635–645. [Google Scholar] [CrossRef]
- Natsume, H.; Okamoto, S. Prediction of Temporal Liking from Temporal Dominance of Sensations by Using Reservoir Computing and Its Sensitivity Analysis. Foods 2024, 13, 3755. [Google Scholar] [CrossRef]
- Galmarini, M.; Silva Paz, R.; Enciso Choquehuanca, D.; Zamora, M.; Mesz, B. Impact of Music on the Dynamic Perception of Coffee and Evoked Emotions Evaluated by Temporal Dominance of Sensations (TDS) and Emotions (TDE). Food Res. Int. 2021, 150, 110795. [Google Scholar] [CrossRef]
- Koizumi, A.; Tokuda, A.; Sato, Y.; Mineki, M. Effects of the Taste and Flavor of Milk Coffee When Milk Heated to Different Temperatures Is Added. J. Home Econ. Jpn. 2019, 70, 416–424. [Google Scholar] [CrossRef]
- Isac-Torrente, L.; Martí, J.; Isidro, B.; Lázaro, A.; Chaya, C. Use of multi-intake Temporal Dominance of Sensations (TDS) and Temporal Dominance of Emotions (TDE) protocols to evaluate the influence of different beverage pairings on chocolate. Int. J. Gastron. Food Sci. 2023, 32, 100681. [Google Scholar] [CrossRef]
- Dinnella, C.; Masi, C.; Naes, T.; Monteleone, E. A new approach in TDS data analysis: A case study on sweetened coffee. Food Qual. Prefer. 2013, 30, 33–46. [Google Scholar] [CrossRef]
- Chambers, E.; Sanchez, K.; Phan, U.X.T.; Miller, R.; Civille, G.V.; Di Donfrancesco, B. Development of a “Living” Lexicon for Descriptive Sensory Analysis of Brewed Coffee. J. Sens. Stud. 2016, 31, 465–480. [Google Scholar] [CrossRef]
- Tanaka, G.; Yamane, T.; Héroux, J.B.; Nakane, R.; Kanazawa, N.; Takeda, S.; Numata, H.; Nakano, D.; Hirose, A. Recent advances in physical reservoir computing: A review. Neural Netw. 2019, 115, 100–123. [Google Scholar] [CrossRef] [PubMed]
- Tanaka, G. Reservoir Computing: High-Speed Machine Learning Theory and Hardware for Time-Series Pattern Recognition; Morikita Publishing Co., Ltd.: Tokyo, Japan, 2021. [Google Scholar]
- Iman, M.; Arabnia, H.R.; Rasheed, K. A Review of Deep Transfer Learning and Recent Advancements. Technologies 2023, 11, 40. [Google Scholar] [CrossRef]
- Upadhyay, R.; Phlypo, R.; Saini, R.; Liwicki, M. Sharing to Learn and Learning to Share; Fitting Together Meta, Multi-Task, and Transfer Learning: A Meta Review. IEEE Access 2024, 12, 148553–148576. [Google Scholar] [CrossRef]
- Samoggia, A.; Riedel, B. Coffee Consumption and Purchasing Behavior Review: Insights for Further Research. Appetite 2018, 129, 70–81. [Google Scholar] [CrossRef]
Disclaimer/Publisher’s Note: The statements, opinions and data contained in all publications are solely those of the individual author(s) and contributor(s) and not of MDPI and/or the editor(s). MDPI and/or the editor(s) disclaim responsibility for any injury to people or property resulting from any ideas, methods, instructions or products referred to in the content. |
© 2025 by the authors. Licensee MDPI, Basel, Switzerland. This article is an open access article distributed under the terms and conditions of the Creative Commons Attribution (CC BY) license (https://creativecommons.org/licenses/by/4.0/).