1. Introduction
Eye-tracking techniques have become one of the most effective tools to reveal the factors influencing consumers behavior. By tracking the movement and focus of the eyes, researchers gain insights into what consumers pay attention to, how long they focus on different elements, and how their visual attention influences their behavior [
1]. Furthermore, eye-tracking techniques offer a promising avenue for objectively assessing consumers’ visual attention to products [
2,
3]. Both in Google scholar and Scopus, the key word of “eye-tracking” has shown a clear upward trend during the past five years.
Consumer behavior, particularly in the context of food purchase decisions, is influenced by a multitude of factors. One of the key factors is visual attention—the process by which consumers visually explore and process information about products [
4]. Visual attention is a key step in the consumer decision-making process, yet fruits and vegetables that deviate from the “ideal” look—such as apples with minor bruises—are often perceived as inferior, resulting in a tendency among consumers to reject these products [
5,
6]. This rejection not only reduces producers’ profits but also leads to substantial food waste, as large quantities of still-edible fruits are discarded solely due to their appearance [
7]. Against the backdrop of pressing global challenges, including the need to reduce food waste and ensure sustainable resource use, understanding how consumers visually perceive and evaluate produce is more important than ever. In addition, the global demand for high-quality fruits is increasing, with consumer satisfaction being a key determinant of profitability in the production chain [
8].
Research shows that consumer’s knowledge about eco-friendly products and cultural background significantly influence the purchase decision. In particular, a study found that consumer experience was the most influential factor among the them [
9]. The cultural differences in visual attention was observed by [
5,
10,
11], who highlighted that visual cues, such as food presentation, play a more significant role in shaping decision making in certain cultural contexts. These findings suggest that the appearance of products such as fresh fruits and vegetables, including the presence of defects, can significantly affect consumers’ trust and willingness to repurchase. However, research on the attentional capture of fruit disorders is still in its infancy.
Studies on consumer visual attention to defective fruits are rapidly evolving, with recent research highlighting the importance of visual cue placement, consumer involvement and motivation, and clear labeling in influencing consumer attention and perception of fruit defects [
12,
13,
14]. A previous study delved into the role of visual attention in consumer behavior, particularly in the context of fruit purchase decisions [
15]. Moriuchi and Moriyoshi [
4] argue that visual attention significantly influences consumer acceptance or rejection of fruits, underscoring the importance of product appearance in the decision-making process. Moreover, the study by [
16] provides a compelling insight into how consumers interact with nutrition labels and make beverage choices. This research utilized eye-tracking to analyze attention to nutrition information, particularly sugar content, on the updated Nutrition Facts Label (NFL). Their findings revealed that the updated NFL captured consumer attention more effectively, impacting their beverage selection. This study’s relevance extends to our research on consumer behavior toward fruit defects, suggesting that visual presentation and salience of information, like those on nutrition labels, significantly influence consumer decision making.
Similarly, Takahashi et al. [
13] explored how to motivate consumers to purchase certified forest coffee and confirm that providing detailed information about the certification program significantly influenced consumers’ purchasing behavior. This finding suggests that consumer awareness and knowledge can play a crucial role in shaping their purchase decisions. Lastly, Zuschke [
14] investigated the order in multi-attribute product choice decisions. The study combined discrete choice experiments with eye-tracking, providing valuable insights into how consumers process information and make decisions. The research highlights the importance of considering the order of product attributes in influencing consumer choice. Nevertheless, these studies collectively emphasize the importance of visual attention, and the order of product attributes in shaping consumer behavior and decision-making processes needs more research.
Furthermore, attentional capture, the process by which certain stimuli commandeer our focus, plays a key role in various fields, from cognitive psychology to marketing. Recent studies explore this phenomenon in the context of fruit disorders, seeking to understand how defects in fruits capture consumers’ attention and influence their purchasing decisions. The quality of a stimulus, such as the color and texture of a fruit, can significantly influence where consumers direct their attention [
17]. Visual saliency and choice significantly influence brand recall, underscoring the impact of visual elements on consumer behavior [
18]. This suggests that high-quality fruits are more likely to capture consumers’ attention, while fruits with visible defects may repel it.
Suboptimal food refers to food that deviates from the “ideal” look, while their nutritional content and taste are typically unaffected, close to, at, or beyond the best-before-date [
19]. Under the UN sustainable development goals framework, as the global demand for fresh produce continues to rise, ensuring that suboptimal but quality fruits are not discarded becomes important [
20]. Research has consistently shown that visual appearance plays a pivotal role in food selection [
17,
21,
22]. Furthermore, consumers often misconstrue visually suboptimal foods, like overripe bananas, as less palatable, leading to unnecessary wastage [
19]. This perception, predominantly driven by visual cues, underscores the critical role of appearance in food selection [
23].
The intricate relationship between visual attention, defect perception, and purchasing decisions, as highlighted in Jaeger et al. [
21] shows that consumers quickly notice visible flaws in apples, such as external damage or internal browning. However, this awareness does not often lead to purchasing behaviors. Specifically, only 0% to 7% of consumers chose apples with visible defects when shopping, a number that rose only slightly to between 3.4% and 15.1% when it came to eating them. As for internal qualities like browning, consumer attitudes were more complex. Minor browning was not a deal-breaker, but if around 8.2% of the apple was brown, consumers were evenly split over whether to discard it or not. Building on these foundational insights, our study aims to provide a more granular understanding of the influence of various defects of apples on consumer’s cognitive processes. By examining apples of different varieties, each presented with incremental levels of bruising, we gained insights into the “Threshold of Rejection”—the point at which a fruit’s visual defects become unacceptable to consumers. Identifying this threshold offers multiple benefits [
6,
24]: It can guide producers and retailers in managing inventory and grading processes. Such insights also help foster sustainable consumption by encouraging the acceptance of suboptimal produce, potentially reducing waste and promoting better resource utilization. Our aims were to extend the previous results and include additional factors, such as the color of the apple and the effect of culture. Therefore, two apple varieties (with three skin colors) were tested, with Hungarian and Chinese participants. Specifically, the following questions were addressed in the study:
(1) How does visual attention impact consumer behavior, particularly in the context of purchasing fruits with visible defects?
(2) How do the appearance and defects of fruits influence their purchase decisions?
(3) What are the factors that may alter consumer perception and acceptance of visually suboptimal but nutritionally adequate fruits, aiding in reducing food wastage?
2. Materials and Methods
2.1. Participants
Hungarian participants were recruited from the Hungarian University of Agriculture and Life Sciences. Chinese participants were those who study and work at the Budapest metropolitan areas. The recordings took place in October 2022, and 121 participants were recruited. From the 121 participants, 21 had to be discarded due to unacceptable eye-tracking quality (gaze capture below 80%) and uncompleted questionnaire, resulting 100 participants (mean age = 23, SD = 4.9, males/females: 44/56) whose data were evaluated. Detailed demographic information on the participants is presented by
Table 1. Recent research indicates that younger generations tend to exhibit stronger environmental concerns and a greater willingness to adopt sustainable consumption practices compared to older cohorts [
25,
26,
27]. By focusing on a younger demographic, the study aims to capture emerging behavioral trends that could inform interventions, marketing strategies, and policy decisions aimed at reducing food waste and encouraging sustainable consumption patterns. Participants received a short, written description on the aims and nature of the study. After expressing their interest in participating, a written informed consent was handed out in which all necessary information about anonymization and data handling was presented. Participants received a random code, ensuring anonymity and making it impossible to connect the recorded data with them. Participants were instructed that they could stop the experiment at any point and that they could withdraw their data during and after the measurements at any time.
Eye-tracking measurement was carried out at the Buda Campus of the Hungarian University of Agriculture and Life Sciences. A classroom was converted into a measurement laboratory, therefore making it easier to access and recruit participants. The classroom was approximately 24 m2 (6 m long and 4 m wide, 2.5 m high) and located in a quiet environment. The computer and the presentation screen were placed on a table in a central part of the room. Artificial light was produced by an LED panel (6500 K, 1600 lm) mounted on the ceiling above the table. None of the participants reported any color vision deficiency. Participants wearing contact lenses or glasses reported no issues during or after the experiment. In preparation for the measurement, we provided a comprehensive briefing to all participants regarding the procedural aspects and the necessary precautions associated with the study. Additionally, we secured their consent through the signing of a GDPR-compliant information collection consent form.
2.2. Stimuli
The samples (‘Golden Delicious’ and ‘Idared’ variety) were harvested in the western region of Hungary (Almakúti Kft., Zalaszántó, Zala county, Hungary). Some of the samples were dropped from a height of 1 m and then the flying apple was caught after one hit. The location of the resulting tissue laceration was determined. In the experiment, after dropping, whole and halved apples were examined. For the halved apples, the flesh browning of the cut tissue was examined. A GoPro Hero 7 Silver (GoPro, San Mateo, CA, USA) camera was used for taking photos. Time lapse mode was chosen with 4K resolution; the interval time was 30 s. After destructing, the samples were stored at room temperature, and images of the destructed and control samples were taken in a photo box. Control samples were not destructed. The apple images are presented in
Figure 1.
2.3. Quantitative Analysis of Apple Bruising
In our quest to understand and quantify the extent of bruising on different apple varieties, we developed a computational method leveraging image processing techniques. The primary objective was to compute the percentage of the bruised area over the total apple surface.
2.3.1. Image Preprocessing
Each apple image was center-cropped to a consistent size of 1400 × 1400 pixels, ensuring the primary focus remained on the apple and excluding potential background distractions. The RGB images were then converted to the HSV color space to exploit the color characteristics of the bruises.
2.3.2. Bruise Segmentation
According to our analysis, the segmentation of bruised areas from the apple images is a critical step. To achieve this, we employed a nonparametric and unsupervised method of automatic threshold selection [
17]. This method is particularly effective in maximizing the separability of classes in gray levels, a feature crucial for accurately distinguishing between bruised and nonbruised areas in our apple images. The validation of this method through various experimental results in existing studies further strengthens our confidence in its applicability and effectiveness in our analysis of apple bruising.
2.3.3. Bruise Quantification
The percentage of bruising was calculated by determining the ratio of the number of pixels in the segmented bruised regions to the total number of pixels in the apple image.
Using the above method, preliminary results for the “Golden Green” apple variety showed a bruise percentage of approximately 7.15% for one of the samples. This value was in alignment with visual observations and manual assessments. The use of the HSV color space, specifically the saturation channel, proved crucial in distinguishing between the bruised and nonbruised areas. While this method provided satisfactory results for our sample images, it is essential to note its dependence on consistent lighting and background conditions.
2.4. Experimental Procedure
Upon arrival, a short pre-survey information letter was handed to the participants. After reading it and agreeing to participate, participants were asked to sit down in front of the presentation screen. Participants were instructed to sit approximately 65 cm away from the monitor and to minimize head movement.
Recording was captured by a Tobii Pro Nano (Tobii Pro AB, Danderyd, Sweden) device (sampling frequency: 60 Hz, precision: 0.10°, accuracy: 0.3°, gaze recovery time: 250 ms). Timelines were created and presented using Tobii Pro Lab v.1.171 (Tobii Pro AB, Danderyd, Sweden) software. An HP 22″ UHD monitor with a resolution of 1920 × 1080 and refresh rate 59.940 Hz was used to present the visual stimuli. Stimuli were placed as far away from each other as possible to avoid any overlapping gaze recordings. Identification using the Velocity Threshold (I-VT) filtering method was applied with an interpolation between gaps (75 ms), noise reduction (median), a velocity threshold of 30°/s, merged adjacent fixations (<0.5°), between fixations (<75 ms), and discarded short fixations (<60 ms).
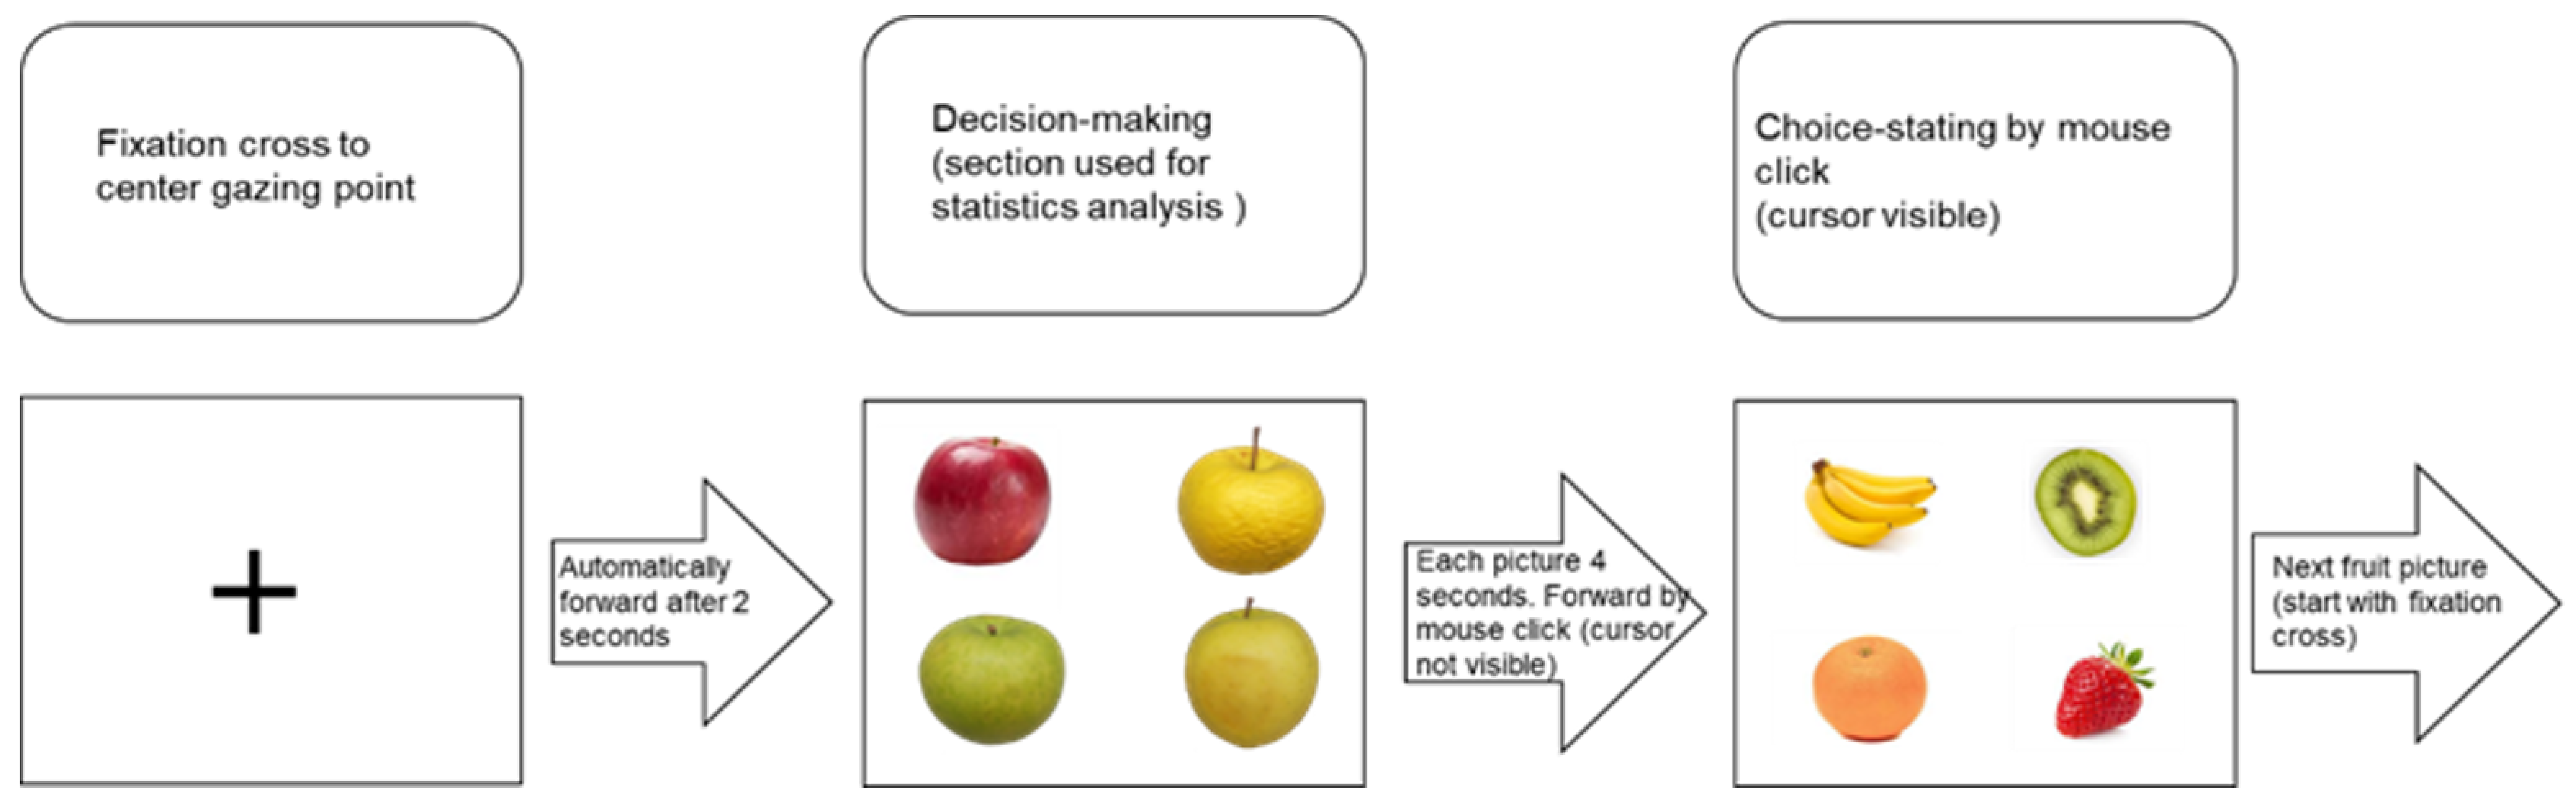
The experiment was divided into two tasks. In the first task, participants were asked to freely view 36 images of different fruits, each displayed for 4 s. The presentation order was balanced for order and carry-over effects using a Tobii Pro Lab random design method. The task details that can be found from
Figure 2 show the testing procedure on the example of apple. A fixation cross (+) on a white background was presented for 0.5 s after each image to calibrate and center the participant’s gaze before proceeding to the next task. Eye-tracking recordings during the decision-making section was used for the statistical analyses.
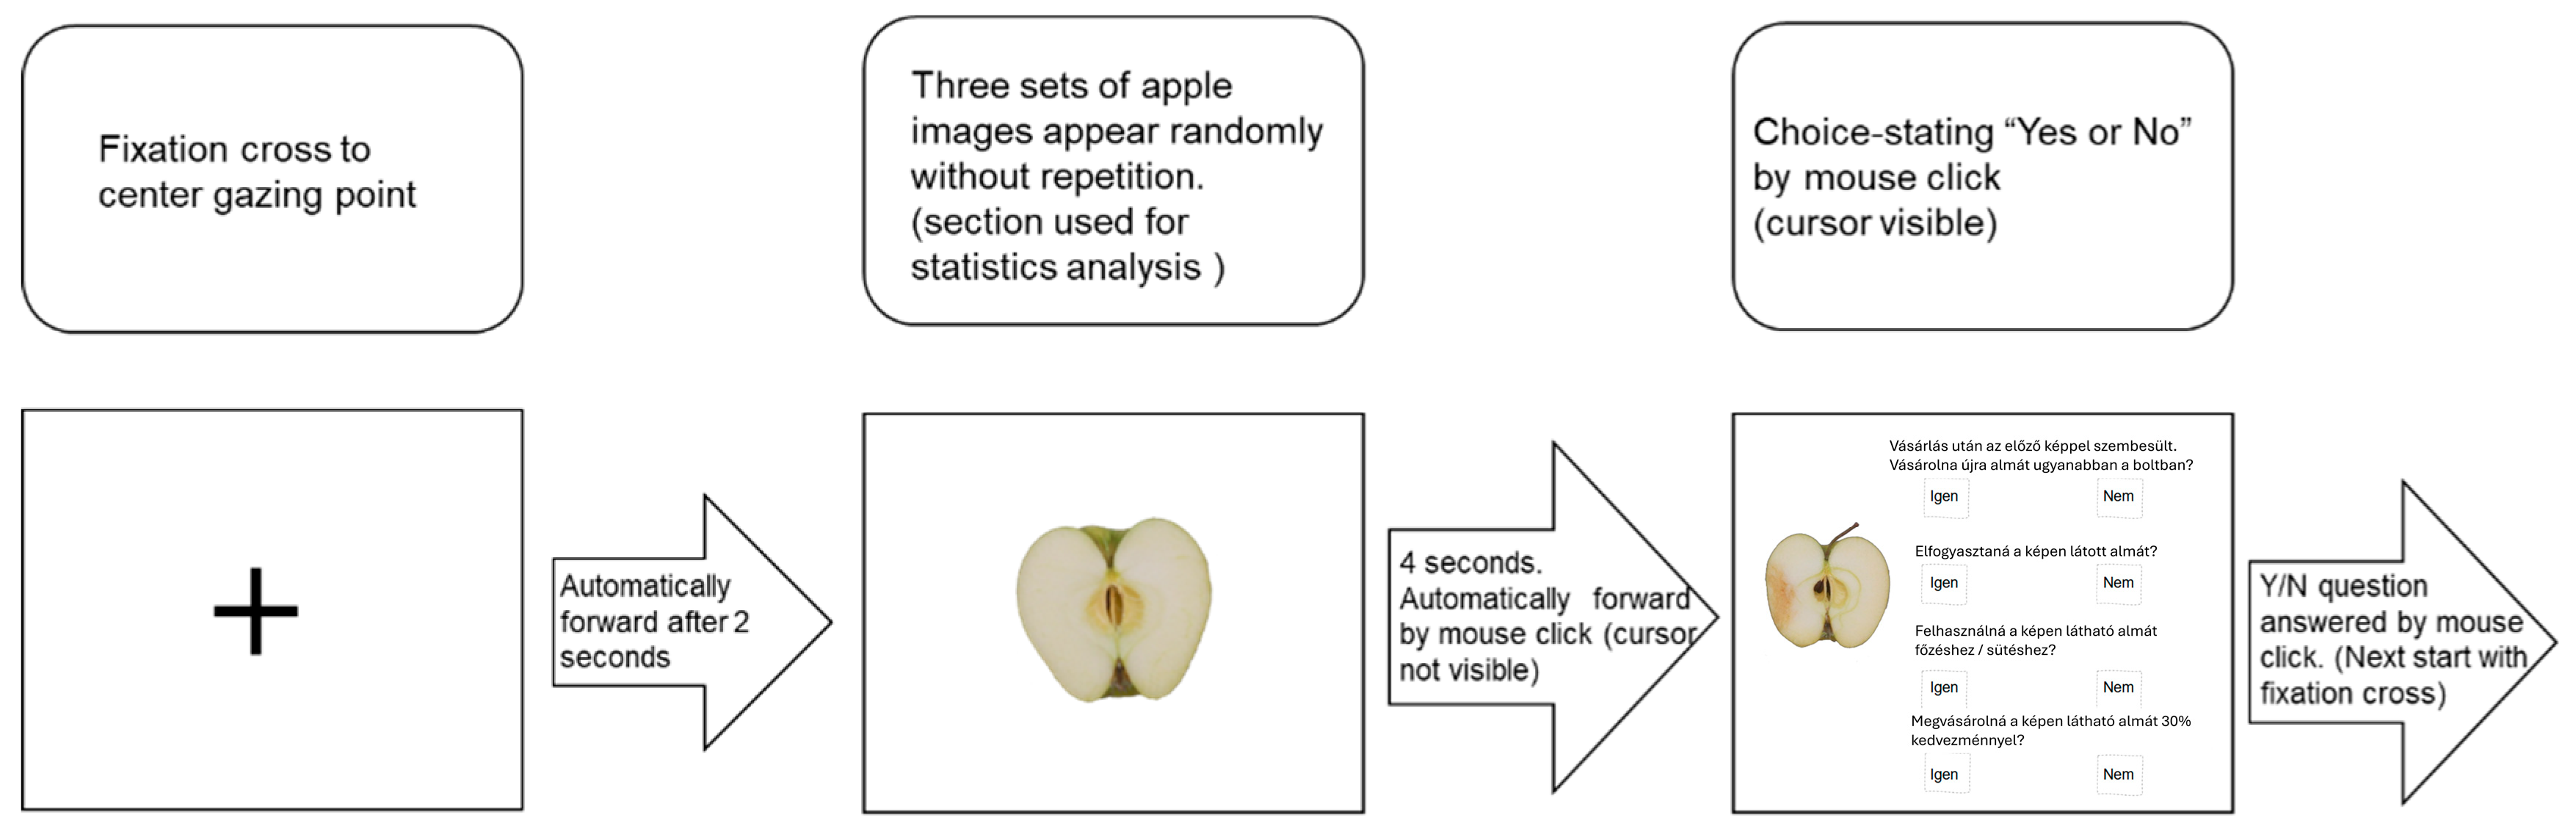
In the second task, participants were shown images of apples and asked to imagine that they had previously purchased apples that looked like the ones in the images. After viewing each image, participants were asked a series of questions, such as whether they would buy the apples again, eat or use them as cooking ingredients, or buy them at a discounted price. The presentation order was balanced for order and carry-over effects using a Tobii Pro Lab random design method;
Figure 3 shows the details.
Before each image was shown in both tasks, a fixation cross appeared on the screen for 0.2 s to make participants fixate their gaze at a fixed pre-defined point. This was done to minimize carry-over effects and to compare eye movement measures across stimuli and participants. After each image, the fixation cross reappeared for 0.2 s, followed by the next image or question.
After completing the tasks, participants were asked demographic questions about their age, gender, apple consumption habits, cooking habits, food shopping responsibilities, and awareness and attitudes towards suboptimal fruits and food waste. They were also asked about their awareness of suboptimal fruits, their interest in environmental issues, and their experiences with environmental volunteering or participation in environmental events. The experiment concluded with a thank you screen displayed for 2 s, thanking the participants for their participation.
2.5. Data Analysis
Eye-tracking data were recorded using Tobii Pro Lab v.1.171 (Tobii Pro AB, Danderyd, Sweden) software. As reported by the time to first fixation, fixation duration and dwell count are critical metrics for understanding consumer behavior in food choice tasks, making them suitable measures for analyzing visual attention in this study [
3]. The following eye-tracking parameters were extracted and used for the data analysis [
4]:
- –
Time To First Fixation (TTFF, time elapsed between the appearance of stimuli and the user fixating his/her gaze first on an alternative measured in seconds);
- –
First Fixation Duration (FFD, length of the first fixation on an alternative measured in seconds);
- –
Fixation Duration (FD, total length of fixations on an alternative measured in seconds);
- –
Fixation Count (FC, number of fixations on an alternative measured as a count);
- –
Dwell Duration (DD, time elapsed between the user’s first fixation on a product and the next fixation outside the product measured in seconds);
- –
Dwell Count (DC, number of “visits” on an alternative measured as a count).
Independent samples t-test was used to compare the means of the different eye-tracking parameters of participants coming from the two countries (CHN and HUN).
A series of factorial ANOVAs was conducted to test the effects of independent variables (Variety: Golden Delicious Green, Golden Delicious Yellow, Idared; Defect Severity: multiple levels based on bruise percentage) on the dependent variables (eye-tracking metrics). Where ANOVA results were significant (p < 0.05), Tukey’s HSD post hoc tests were used to determine which groups differed significantly.
A polynomial regression analysis was conducted to understand the relationship between defect severity (independent variable) and repurchase probability (dependent variable). The choice of a cubic polynomial model was guided by initial observations suggesting a nonlinear response to increasing defect severity.
While ANOVA tests addressed differences in visual attention due to Country, Variety, and Defect Severity, Tukey’s HSD identified which specific groups differed significantly, and polynomial regression analysis modeled how increasing defect severity related to changes in repurchase likelihood.
Data analysis was run using IBM SPSS Statistics v.25 (IBM Corp., Armonk, NY, USA).
4. Threshold of Rejection
The defectiveness of the apple, quantified through the area metric, was selected as the key explanatory variable in this study, since it directly correlated with the visual prominence of the defect. Previous research has shown that consumers’ attention is often drawn to visible imperfections in food products, making this metric a reliable predictor of consumer reactions [
35,
36]. While other variables, such as defect type or texture, could also play a role in consumer decision making, the defect area ratio was chosen due to its straightforward and quantifiable relationship with visual attention and purchase decisions [
37].
The analysis of willing-to-pay behavior across the selected apple varieties—Golden Delicious Green, Golden Delicious Yellow, and Idared—provides insights into the interplay between product quality and consumer choices. For the Golden Delicious Green variety, a clear inverse relationship was found between the defective area percentage and the willing-to-pay percentage. As
Figure 4 shows, when the defects increased, the likelihood of consumers rebuying decreased significantly, with willing-to-pay rates plummeting from 43% with a 5% defect percentage to just 11% with a 24% defect percentage.
The trend of being willing to pay for the Golden Delicious Yellow variety is intricate. Initially, there was a drop in rebuy rates as defects increased, but this decline stabilized around the 40% mark despite defects ranging from 7% to 11%. However, when defects escalated to 14%, a sharper drop to 24% was observed. This pattern suggests a potential threshold of defect tolerance specific to this variety. Conversely, the variety of Idared showcased a more consistent decline in willing-to-pay rates as defects rose. Starting from a 49% willing-to-pay rate at a 4% defect percentage, the rate dwindled to 15% as defects reached 13%. This steady decline indicates a heightened sensitivity to visible defects in this variety compared to the others.
Collectively, these findings highlight the intricate dynamics of consumer perceptions and preferences. While the general trend indicates declining willing-to-pay rates with increasing apple defects, the rate and extent of this decline varied across varieties. Such insights underscore the importance of tailored quality control and marketing strategies for each apple variety. Recognizing these variety-specific nuances and implementing strategies that cater to them can significantly enhance consumer satisfaction and repurchase intent, fostering sustained market success.
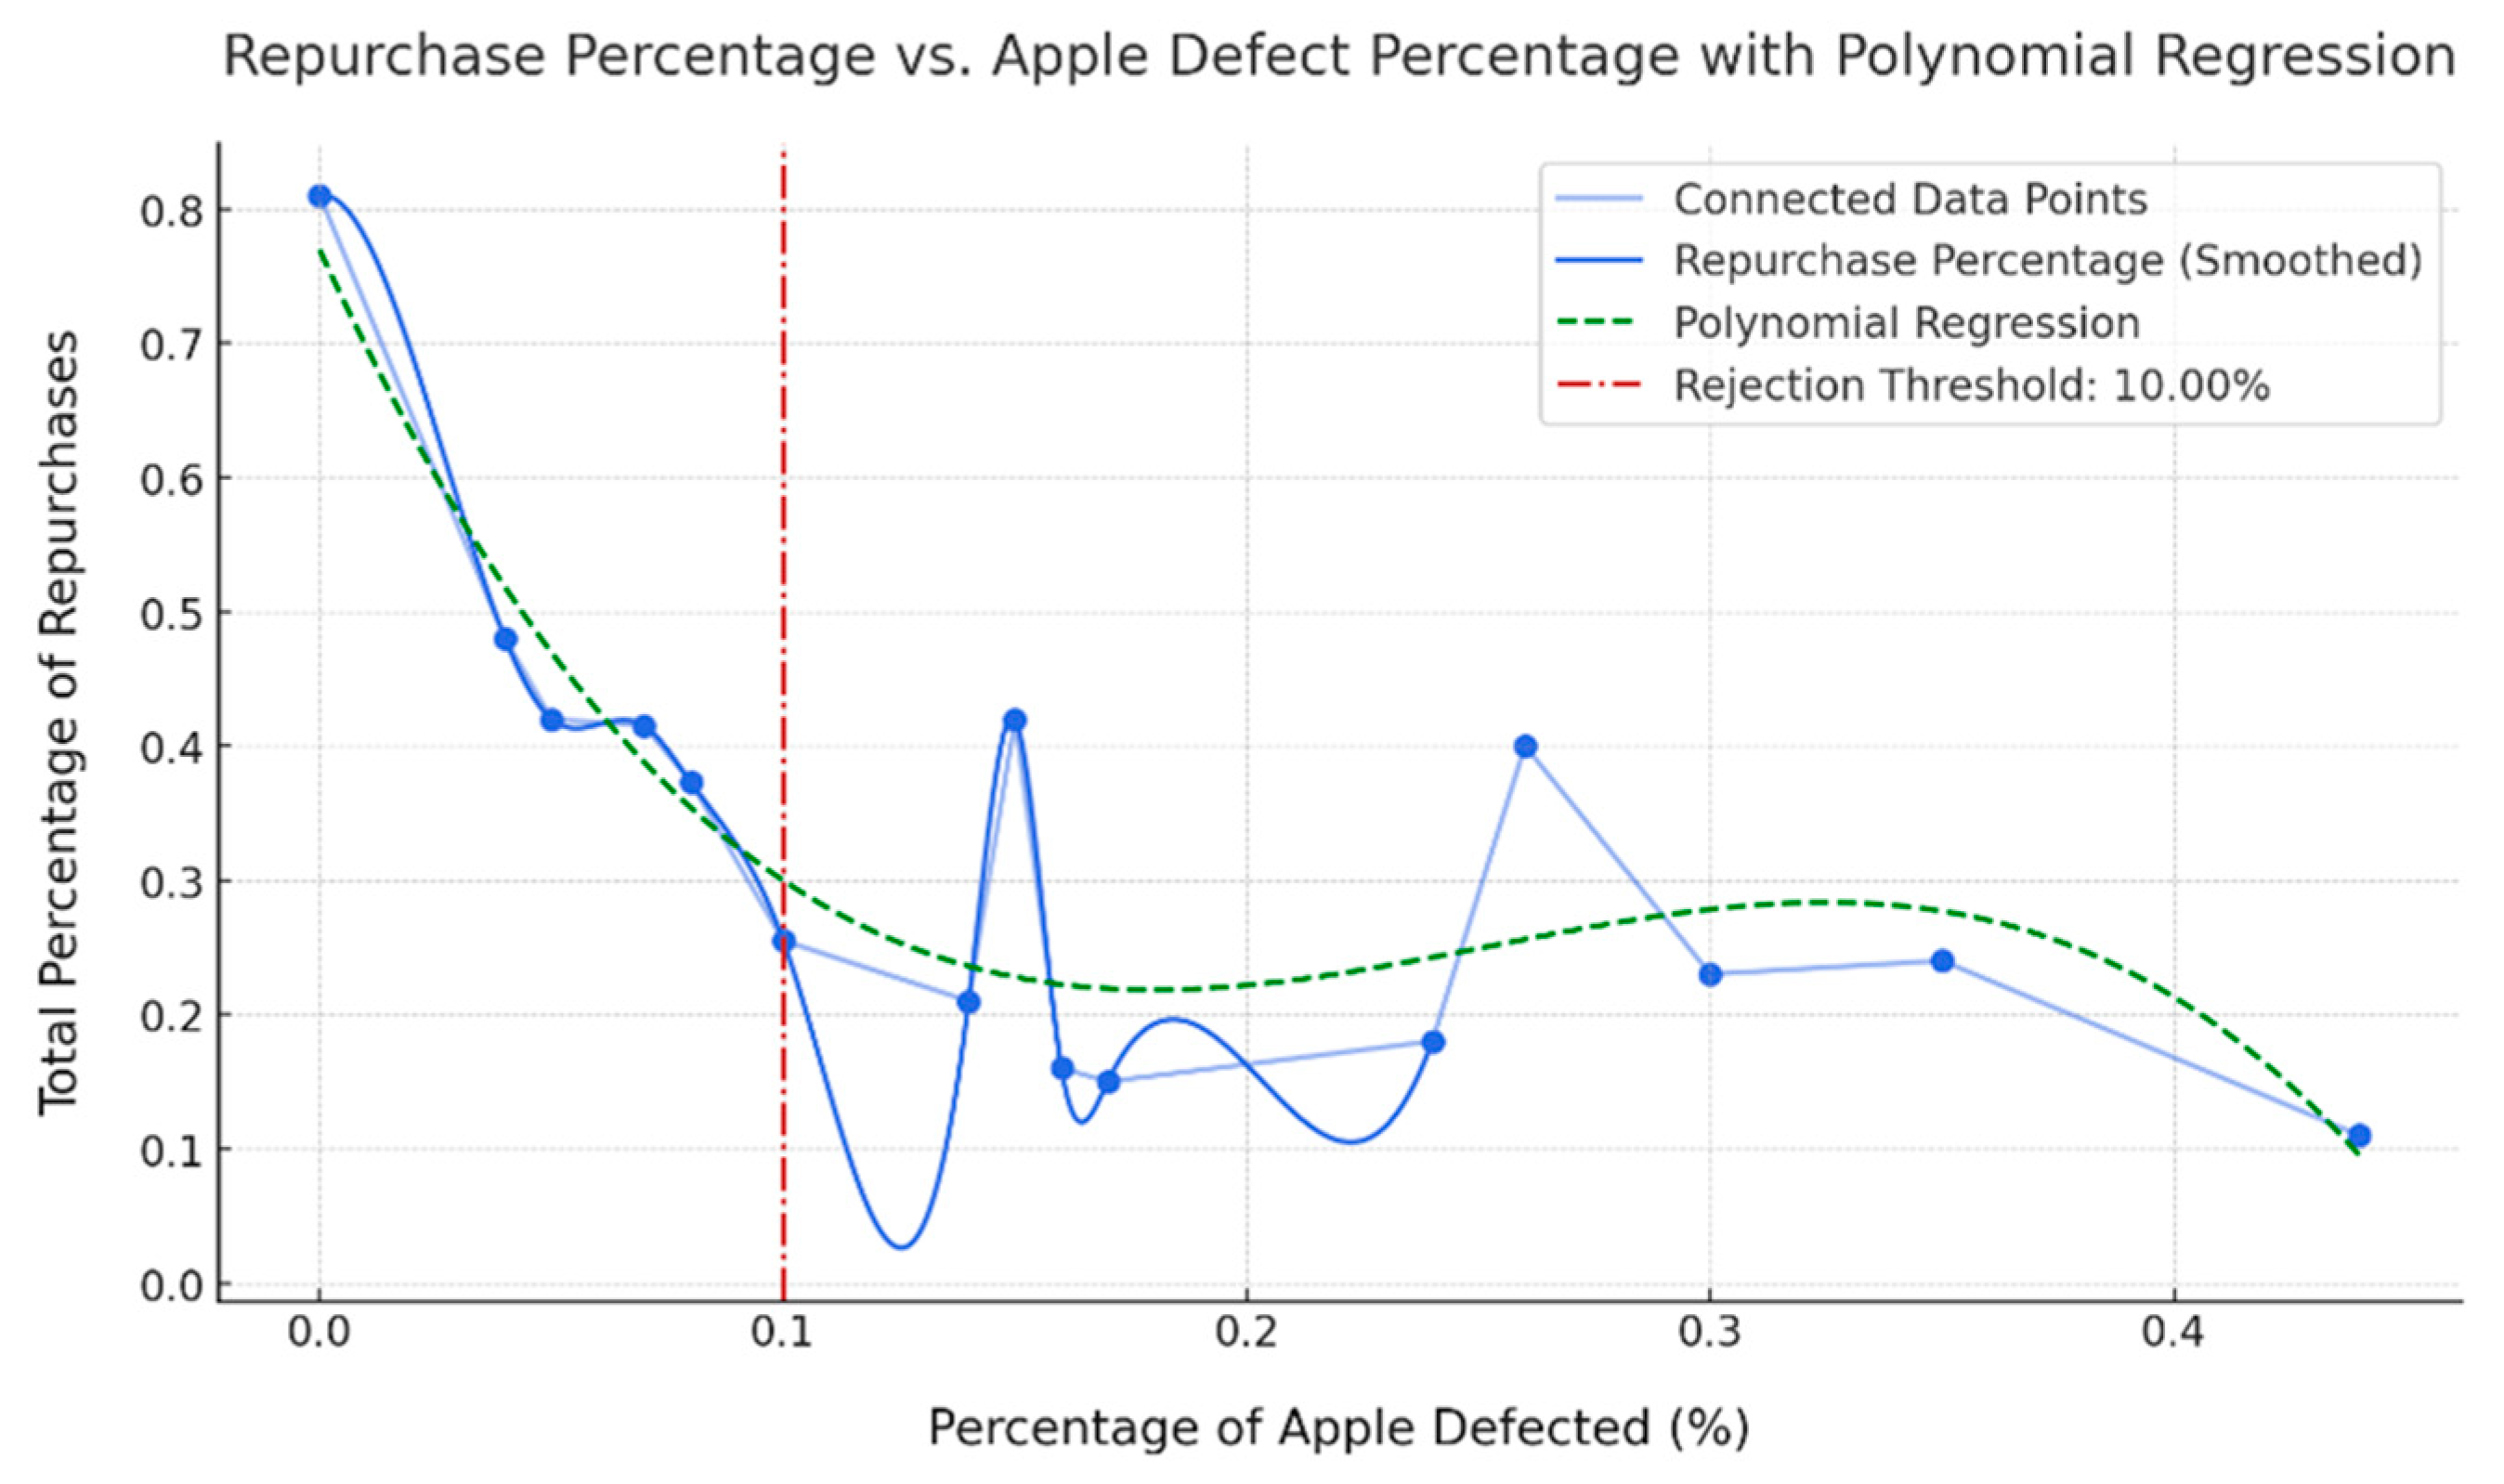
The formula derived from the polynomial regression is defined as follows:
We used a cubic polynomial formula to fit the relationship between an apple that is defective (x) and the total percentage of repurchases (y). After taking the derivative, we can obtain a 1% increase in defectiveness, which would result in an approximately 1.156% decrease in the repurchase rate. The model’s R2 value was 0.971, suggesting an acceptable fit. The linear term is significant (p = 0.012), and the quadratic term is also significant (p = 0.041), but the cubic term is marginally nonsignificant (p = 0.081) at the conventional 0.05 level.
In order to account for the nonlinear nature of consumer choices, we decided to use a cubic polynomial approximation to model the relationship between defectiveness and repurchaseability. The cubic model allows for flexibility in capturing both initial consumer tolerance for minor defects and the sharp decline in repurchase likelihood as defect severity increases. While a monotonically decreasing model such as y = exp(−ax) could have been used, this would assume a constant rate of rejection as defects increase, which was not supported by the data. Instead, the cubic model better reflects the initial plateau, where consumers tolerate minor imperfections before rapidly decreasing their willingness to repurchase as defects become more pronounced. This approach aligns with observed consumer behavior, where moderate defects are often acceptable, but more severe defects lead to sharply increased rejections.
5. Conclusions
The present research delved into the intricate dynamics of consumer behavior, specifically focusing on how visual attention influences purchasing decisions related to three varieties of apples with varying degrees of defects. Utilizing the eye-tracking method, the research explored the effects of the severity of defects, apple variety, and cultural background on visual attention metrics. The findings revealed that while cultural differences between participants from Hungary and China did influence gazing patterns, the variety of the apple did not exhibit a significant impact. This suggests that irrespective of the type of apple—whether Golden Delicious Green, Golden Delicious Yellow, or Idared—what primarily capture and hold consumer attention are the defects present in the apple. Our area metric, quantifying defectiveness, emerged as a critical determinant of visual attention, compellingly illustrating how even minor visual defects could significantly influence consumer behavior.
In addition, we also introduced the concept of a “Threshold of Rejection”, shedding light on the limits of consumer tolerance towards defects in apples. When the percentage of apples with appearance defects went beyond 10%, the willingness to pay sharply declined from 80% to 25%. If the defect rate escalated to 40%, and the rate of repurchase dwindled to a mere 10%. Our polynomial regression formula further quantified the relationship between the percentage of apple defects and the likelihood of repurchase. This mathematical representation could serve as a useful tool for industry stakeholders, providing a predictive framework to anticipate consumer behavior based on the visual quality of the apples. Importantly, our model offers a pragmatic approach to reducing food waste. By enabling early screening of apples, a rejection rate higher than 75% could be repurposed for alternative uses such as in the production of jams and other culinary products. This approach not only reduces food wastage but also adds value to the agricultural supply chain.
This study’s sample was predominantly young and drawn from a university setting, which may limit generalizability. Future research should broaden demographic profiles (including older and more diverse populations) and explore other fruit or vegetable categories. Additionally, informational interventions (e.g., eco-labels, sustainability messages, etc.) and psychophysiological measures (e.g., GSR, heart rate, etc.) could deepen the understanding of the emotional underpinnings of consumer acceptance. Finally, the study focused on a limited range of apple varieties and defect levels; exploring a wider range of products and conditions would enhance the robustness of these findings.
Future research should broaden demographic profiles, explore other produce categories, and consider informational interventions (e.g., eco-labels) that may influence acceptance. Employing additional psychophysiological measures could further clarify emotional responses to imperfect produce, guiding more resilient and sustainable food systems. In conclusion, while culture shapes the pattern of visual attention and defectiveness determines its intensity, variety appears less influential at the initial decision-making stage. The polynomial model offers a predictive framework for defect-driven behavior, and recognizing these complex interactions and thresholds can support more efficient, sustainable marketing strategies that benefit both consumers and the environment.
In conclusion, this study delved into understanding the interplay between cultural differences, apple varieties, and the defectiveness of apples in shaping visual attention metrics. Given the pivotal role of defects in capturing attention, this finding can have broad implications, especially in quality control, marketing, and consumer behavior research. Understanding the nuanced interplay between culture and defect perception can offer invaluable insights for apple producers and marketers, aiming to cater to diverse global markets like in Hungary and China.


 ,
, 


