Abstract
Food and food safety, as one of the basic issues of human life, has made it necessary to store foods for a long time with the increasing population. One of the oldest and most common methods of extending the shelf life of food products is the drying process. The drying process contributes to the higher quality of foods in terms of physical, chemical, and microbial properties by ensuring that beneficial contents such as vitamins, minerals, and aroma compounds are better preserved. The aroma values of foods, which consist of taste and smell components, gain importance. In foods, the taste is determined by permanent components, while smell is determined by volatile components. The loss of volatile aroma compounds in the strawberry drying process negatively affects product quality. Small changes in aroma compounds can lead to significant differences in product taste. Therefore, strawberry aroma is a critical factor for consumer appeal and commercial success. In this study, the effects of drying methods on the aroma compounds of strawberry fruit were compared with Multi Criteria Decision Making (MCDM) techniques. In this study, PSI-based MCDM techniques were used to make the most appropriate choice among strawberry drying methods. The values of 23 distinct aroma compounds obtained with different drying methods applied to strawberry fruit were analyzed with 7 different MCDM techniques. The calculations gave similar results and these results were combined with the Borda rule. Accordingly, the drying methods with the highest scores were determined as freeze drying.
1. Introduction
After harvesting, agricultural products begin to rot and deteriorate, with this process occurring more quickly in fresh fruits and vegetables. Foods not stored under proper conditions lose their nutritional value and result in economic losses. Throughout history, various methods have been employed to preserve food for extended periods, and one of the oldest and most common methods is drying. Drying not only facilitates the transportation and storage of foods but also preserves their nutritional value, extends their shelf life, and reduces storage costs [1]. Inappropriate food preservation methods not only lead to economic losses but also diminish quality and nutritional value, posing a significant threat to food safety [2]. Drying is a production method widely used in the food industry and other industries. The main purpose of the drying process is to improve the storage conditions of the products and extend their shelf life [3]. Fresh fruits and vegetables usually have high moisture content. Therefore, if they are not dried in time, they are at risk of mold and spoilage [4]. In addition, the costs of dried foods are generally lower compared to canned and frozen foods [5].
Food drying is an economical method that requires less labor and equipment compared to many other preservation techniques, making it particularly suitable for the long-term storage of fruits and vegetables. By reducing the moisture content in food, this method prevents the growth of microorganisms and preserves food without spoilage [1]. Dried foods can either be consumed directly or used as raw materials for other packaged food products.
Strawberry is one of the most consumed fruits with its attractive color, unique aroma, flavor, and high nutritional value, which grows almost everywhere in the World [6,7]. Agricultural experts report that farmers are expanding strawberry cultivation to meet the growing global demand for the world’s 19th most popular fruit. According to the Food and Agriculture Organization (FAO), global strawberry production reached 12,933,872.48 tons in 2022 [8]. World production is projected to grow by 2.5% in 2024, reaching 13.2 million tons [9]. The leading countries in global strawberry production are listed in Table 1.

Table 1.
Leading countries in world strawberry production [8].
In 2022, Turkey ranked third in the world for strawberry production, as shown in Table 1. While most strawberries are consumed domestically in Turkey, exports have been steadily increasing. According to Trademark data, strawberry exports amounted to $31,560,000 in 2022 and rose to $37,130,000 in 2023 [10]. Given their significant economic and commercial value both in Turkey and globally, strawberries were chosen as the focus of this study. A literature review of strawberry-related research published in the Web of Science database was conducted using Vosviewer software (version 1.6.20), and the countries involved in these studies are presented in Figure 1.
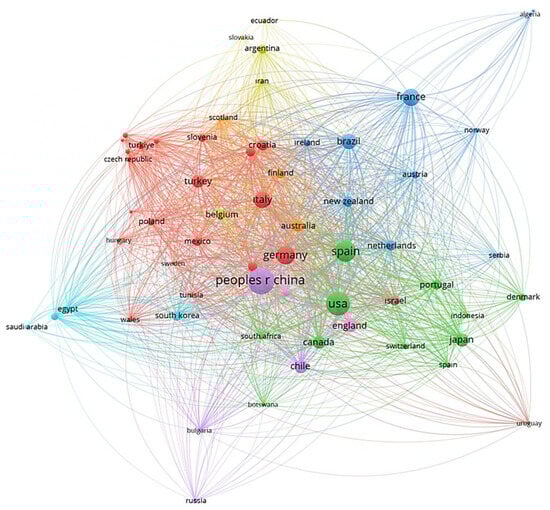
Figure 1.
Countries where strawberry-themed studies have been conducted.
Strawberries are a fruit widely consumed fresh or processed with other foods around the world due to their high nutritional value. Just eight strawberries contain more vitamin C than an orange. In addition, they contain many beneficial nutrients such as potassium, manganese, iron, calcium, magnesium, folate, and other antioxidants. Another benefit of strawberries is that they are preferred by many people on a food diet due to their low glycemic index value [11]. The nutritional values of 100 g of strawberry fruit are shown in Figure 2. Known for their fresh and delicious taste, strawberries are highly appealing with their pleasant aroma and unique flavor. While predominantly consumed fresh, they can be preserved for extended periods through freezing and hold significant potential for industrial applications. Nutritionally, strawberries are a low-calorie fruit with limited energy, protein, fat, and carbohydrate content [9].
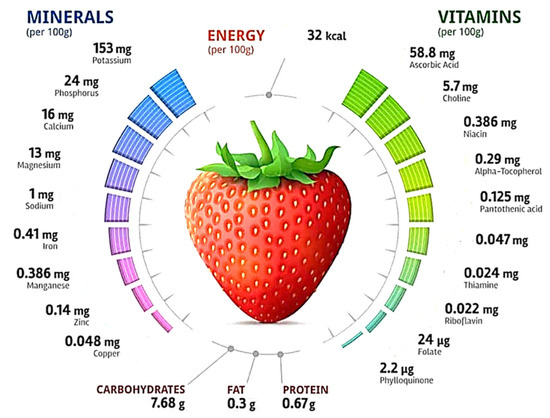
Figure 2.
Nutritional values of 100 g strawberries [9].
In addition, the bioactive components of strawberries, which offer numerous health benefits, have significantly increased their demand and economic significance in the market [12]. Consequently, strawberries stand out as one of the most sought-after fruits, available in fresh, frozen, and dried forms, as well as in processed products such as jam [13,14]. Strawberry is a fruit rich in water and has high physiological activity after harvest. During storage, transpiration and respiration cause the consumption of organic matter, leading to water loss and deterioration. This makes it difficult to store strawberries for a long time. Therefore, strawberries are often used as a model fruit for preservation research [15]. Due to its perishable nature, fresh strawberries are prone to rapid deterioration, which can result in significant economic losses. In addition, the short harvest season of strawberries and therefore its unavailability throughout the year limits its commercial use and consumption. Drying strawberries is an excellent way to retain their nutritional value, prolong their shelf life, and broaden their applications [16]. Drying, which is widely employed in the food sector, inhibits microbiological development and increases shelf life by lowering water content. Furthermore, it reduces transportation and storage expenses while maintaining the nutritional content and flavor of the fruit [17]. Consumers are particularly attracted to the unique flavor and attractive red color of these fruits. The flavor is the result of a combination of aroma, taste, and mouthfeel. The appealing aroma of strawberries is based on a complex mixture of volatile compounds such as esters, aldehydes, alcohol, ketones, furanones, and terpenes [18]. Therefore, the preservation of these volatile compounds during the drying process becomes important.
Different technologies are being developed and used to better preserve and store the color, flavor, textural, and structural properties of foods, as well as their nutritional value. These methods are widely used in strawberry drying. Depending on the type of food and the desired quality, various methods such as sun drying, oven drying, vacuum drying, freeze drying, and shade air drying are employed [19]. Each drying method has its own advantages and disadvantages, and these methods can impact food safety and quality in different ways.
Different strawberry drying methods have different positive and negative effects on the product. Traditional methods have negative effects such as loss of nutritional value, and formation of toxic gases and microorganisms [20]. Technological drying methods contribute to increasing the drying quality by providing a controlled drying environment and effective use of heat [21]. The choice of the optimum drying method is very important in terms of reducing the negative effects of the methods used in drying fresh vegetables and fruits and increasing their positive effects [22,23]. The main drying methods used in strawberry drying are explained below.
Shade Air Drying: Shade air drying is a method of drying food products and herbs in a shaded area with adequate air circulation. This method prevents exposure to direct sunlight to preserve sensitive compounds (vitamins, antioxidants, pigments). However, shade drying is generally slower than sun drying or other methods and can increase the risk of microbial contamination. This method is especially preferred for sensitive products such as herbs, fruits, and vegetables, where preservation of quality is important [17,19].
Oven Drying: Oven drying is the process of reducing moisture in foods by using an oven at a certain temperature and time. This method is widely preferred to extend the shelf life of foods and prevent them from spoiling [24]. It is usually used for ingredients such as vegetables, fruits and meat. Since the temperature and time can be easily controlled, the uniformity of the drying process increases [25]. In addition, this method helps preserve the texture and color of the food. Especially when applied at low temperatures, vitamins, and other nutrients are better preserved [26].
Microwave drying: This method, which is used especially for drying products with high moisture and water content by converting electromagnetic energy into heat, increases quality and efficiency together with hot or vacuum drying. It is an important advantage that it reduces costs while increasing the process speed and quality. The greatest advantage of this method is that heat is effectively and equally transferred to the interior of the food thanks to high conductivity [27]. In addition, reaching the required temperature quickly significantly increases production speed [28].
Freeze drying: Freeze drying is the method that best preserves product freshness. Water and moisture in the food are removed by sublimation, microbial and other spoilage are prevented and high quality is provided. However, high cost limits the use of this method. Flavor and color change are less compared to other drying methods [29].
The visuals of strawberries dried using different drying methods are presented in Figure 3 [14,30,31].
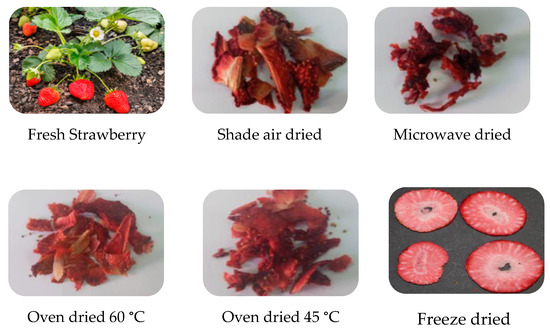
Figure 3.
The visuals of strawberries dried using different drying methods [14,30,31].
Experts are working on the use of these methods and the changes in product properties. Some of these are aimed at determining the effects of dried foods on aroma compounds. It is seen that studies have been carried out on the investigation of volatile compounds and ellagic acid formation in strawberry fruit [32], modeling approaches used in drying [33], aroma formation during the ripening stage of strawberries [34], design of solar food dryers [35], analysis of aroma compounds in strawberry storage [15], the effect of different drying methods on drying characteristics [17], the effect of pasteurization and storage conditions on straw-berry aroma components [36], effect of drying process on product properties [37], effect of microwave and hot air drying methods on product color [38], drying of straw-berries with radiofrequency cold plasma [39], use of infrared radiation in pre-drying processes [40] etc. in the literature. In these studies, a drying method has generally been compared with others and the effects on various properties of dried foods have been examined. However, no study has been found to compare the methods used in strawberry drying with each other according to certain parameters or to determine the drying method that preserves the aroma values at the optimum level.
It is extremely important to analyze the effects of drying methods on the aroma compounds of dried food and to determine the drying method that ensures the optimum preservation of product properties. Ideally, the nutritional values, texture, flavor, and aroma of foods preserved through various methods should remain unchanged. In particular, maintaining aroma values is crucial, especially for commercial products. As a result, selecting the optimal preservation method in food drying has become increasingly important. At this point, the use of Multi-Criteria Decision Making (MCDM) techniques, which allow for an integrated evaluation of different and diverse study results, stands out. In the literature, it is seen that studies have been conducted on the comparison of drinking water brands with MCDM techniques [41], analysis of agricultural production methods with MCDM [42], comparative analysis of apricot drying methods [1], factors causing vegetable and fruit losses in the supply chain [43], risk analysis with MCDM in food packaging [44], determination of the importance levels of potential sun drying problems with MCDM [45], etc. In addition, strawberry-themed studies were meticulously explored using the Web of Science database, and the insights gathered were analyzed and visualized through Vosviewer for a comprehensive evaluation, as shown in Figure 4.
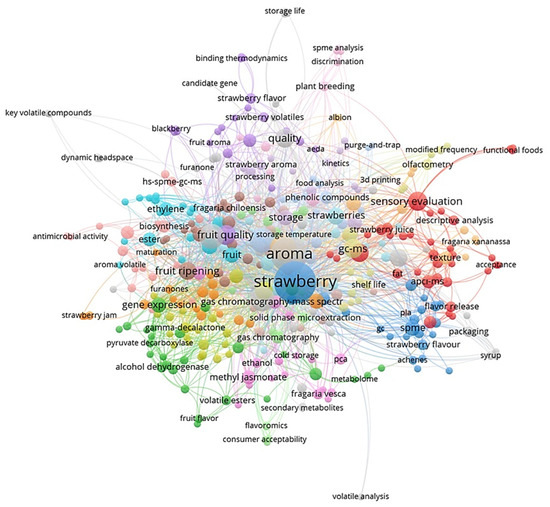
Figure 4.
Strawberry-themed works.
However, no study has been identified that compares the effects of different strawberry drying methods on the product’s aroma compounds using MCDM techniques or provides decision support to producers in selecting a drying method and to consumers in choosing the most suitable dried strawberry product for purchase. Therefore, the study aims to compare different drying methods for their effects on strawberry aroma compounds using MCDM techniques.
The stages of this study, which aim to identify strawberry aroma compounds, evaluate the most commonly used strawberry drying techniques and their effects on product aroma, and determine the drying method that best preserves strawberry aroma compounds, are illustrated in Figure 5.
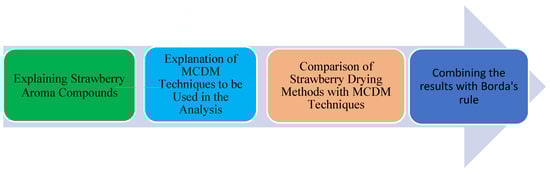
Figure 5.
Stages of the study.
2. Materials and Methods
Strawberries (Fragaria spp.) are perennial plants from the Rosaceae family, known for their delicious taste and high nutritional value. The content and concentration of aroma compounds, which contribute to the fruit’s characteristic taste and smell, serve as key indicators of strawberry quality [32]. Alongside their vibrant color and distinctive aroma, the sensory quality of strawberries is attributed to a combination of vitamin C and antioxidant compounds such as flavonoids and ellagic acid (EA) [46]. EA, found in natural sources such as strawberries, blackberries, pomegranates, and almonds, is a major phenolic acid that is a dimeric condensation product of gallic acid. Due to its potent anticarcinogenic, antithrombotic, anti-inflammatory, and neurodegenerative disease-protective qualities, ellagic acid is crucial in the prevention and treatment of several chronic illnesses, including cancer, diabetes, metabolic syndrome, and Alzheimer’s [32].
Studies have confirmed that almost all of the aroma compounds in fruits are derived from non-volatile biosynthetic precursors such as fatty acids, sugars, amino acids, and secondary metabolites [47].
In strawberry fruits, aroma is an important organoleptic property that directly affects consumption and determines consumer preferences. It is also one of the quality indicators of the fruit [48]. Strawberry aroma plays a key role in the commercial success as well as the attractiveness of the fruit [49]. This unique aroma is caused by a variety of volatile organic compounds (VOCs), including esters, alcohols, ketones, furans, terpenes, aldehydes, and sulfur compounds. Even small changes in volatile compounds can significantly affect the taste of strawberries. Although these compounds constitute only 0.001–0.01% of the strawberry weight, they are the main factors determining aroma characteristics and consumer appeal [7,50].
The aroma profile of strawberries is quite complex. To date, more than 360 volatile compounds have been identified in fresh strawberries [7,14,51]. However, not all of these compounds affect aroma. Odor activity value (OAV) is generally used to evaluate the effect of compounds. Compounds with OAV values higher than 1 are considered important volatile compounds [52]. It is known that compounds with high OAV values in strawberries make significant contributions to aroma [7].
The main volatile compounds found in strawberries are esters, furanones, lactones, terpenes, aldehydes, and minor components.
Esters are the most dominant volatile compound group that defines the aroma profile of strawberries. Studies have determined that esters constitute 25% to 90% of the total volatiles in strawberries [7]. Esters are the main source of fruity and floral odors in strawberries and contribute significantly to the aroma of ripe strawberries [14,48]. Prominent esters include methyl butanoate, ethyl butanoate, methyl hexanoate, and hexyl acetate [53,54]. In contrast, ethyl acetate has been associated with off-flavor notes [55].
Furanones contribute greatly to strawberry aroma despite being present in low concentrations. The two main furanone compounds of strawberries are known as furaneol (2,5-dimethyl-4-hydroxy-3(2H)-furanone) and mesifuran (2,5-dimethyl-4-methoxy-3(2H)-furanone). These compounds are characterized by their sweet and caramel-like aroma profiles and enhance the “fresh strawberry” sensation [51,54].
Lactones are an intense and important group of compounds in the aroma profile of strawberries. γ-decalactone, which has a peach and strawberry-like odor, was found in high amounts in some strawberry varieties [6]. γ-decalactone was detected as the main lactone in freeze-dried and oven-dried strawberries, while γ-butyrolactone was prominent in microwave-dried samples [14].
Terpenes contribute to the floral and citrus notes in strawberry aroma. The monoterpene linalool and the sesquiterpene nerolidol are among the most important volatile terpene compounds in cultivated strawberry varieties. Linalool generally provides a citrus and floral aroma, while nerolidol carries fir/pine notes [7]. Wild strawberries contain different terpenes such as α-pinene and β-myrcene.
Aldehydes such as hexanal, (E)-2-hexenal, and nonanal in strawberries are responsible for green/herbal aroma profiles [51]. These compounds are also the cornerstone of the “fresh strawberry” taste [6]. Heat-sensitive compounds such as furfural and 5-hydroxymethylfurfural (HMF) are only produced in high-temperature applications such as oven or microwave drying [14].
Minor Components: Volatile organic acids make smaller contributions to the aroma profile of strawberries. These compounds are generally complementary elements of the aroma [6].
The aroma of foods consists of taste and odor components. Persistent components determine taste, while volatile components determine smell. Strawberries, which are a product rich in aroma, lose their volatile components during drying, which negatively affects quality [56]. Aroma compounds in strawberries may vary depending on the processing and drying methods used. In particular, freeze drying provides better preservation of volatile components, while heat-based methods may cause some aroma compounds to disappear or undesirable compounds to form.
Therefore, the selection of appropriate drying and processing techniques is of great importance to preserve aroma quality. In this context, 23 aroma compounds found in strawberries were considered and a table was created from the data obtained from the literature. It is desired that the first seven of the compounds specified in the table are in low amounts in the product and the other sixteen are in high amounts [6,7,14,51,53,55].
Table 2 below presents the key aroma compounds of both fresh strawberries and those dried using various methods, based on findings from the literature [14].
Table 2.
Strawberry drying methods and aroma compounds values [14].
In the following tables, these aroma compounds are symbolized as follows:
| AC1: Ethyl acetate | AC2: Nonanal | AC3: 5-Hydroxymethylfurfural |
| AC4: Acetic acid | AC5: Octanoic acid | AC6: α-Terpineol |
| AC7: Furfural | AC8: Mesifurane | AC9: Furaneol |
| AC10: γ-Butyrolactone | AC11: γ-Decalactone | AC12: Methyl butanoate |
| AC13: Ethyl butanoate | AC14: (E)-Nerolidol | AC15: Methyl hexanoate |
| AC16: Ethyl hexanoate | AC17: Hexyl acetate | AC18: Methyl octanoate |
| AC19: Ethyl octanoate | AC20: Hexanal | AC21: (E)-2-Hexenal |
| AC22: Heptanal | AC23: Linalool |
Drying Methods are symbolized as follows:
| F: Fresh, | D1: Shade air Dried, | D2: Microwave dried, |
| D3: Oven-Dried (60 °C), | D4: Oven dried (45 °C), | D5: Freeze Dried |
2.1. Multi-Criteria Decision Making Methods (MCDM)
MCDM methods, which are used in almost every area of life, allow decision-makers to make evaluations by considering a large number of factors. MCDM methods are used in decision problems that require ranking or weighting. There are approximately 200 published methods in the literature [1,57]. In MCDM techniques (methods), operations are generally carried out by following the steps shown in Figure 6 below. Microsoft Excel was used in the calculations.
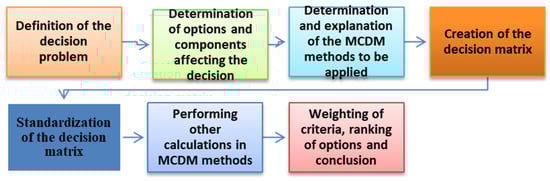
Figure 6.
Multi-Criteria Decision Making process [1].
2.1.1. PSI (Preference Selection Index) Technique
PSI, one of the MCDM techniques, was first developed by Maniya and Bhatt in 2010 and applied to a material selection problem [58]. PSI solves with a simple, easy, and systematic calculation. Due to this feature, it is a useful method for determining the importance levels of criteria in situations where decision-making is difficult and complex [59]. The PSI technique finds the variance values indicating the importance levels of each option by making variance-based calculations for each component calculates the preference index and makes the final ranking. The steps of the PSI technique are explained below in order [58].
In this study, the importance levels of aroma compounds were determined using the PSI technique which has 4 steps by using Equations (1)–(7) [59].
Step 1. Creating the decision matrix X: The matrix X in Equation (1), which consists of m rows and n columns, is created.
Step 2. Normalizing the decision matrix. The normalized matrix is derived from decision matrix (1) using Equation (2) for maximization-oriented criteria and Equation (3) for minimization-oriented criteria.
Step 3. Calculating the preference variance values (). These values are calculated using Equation (4). calculated using Equation (5) represents the arithmetic mean of each row of the normalized matrix.
Step 4. Calculation of the general preference value (). After the deviation in the preference values is found in Equation (6), the importance levels of the preference values are calculated in Equation (7).
The values, calculated with the PSI technique, express the importance levels of aroma compounds.
2.1.2. COPRAS (The Complex Proportional Assessment) Technique
COPRAS was developed by Zavadskas and Kaklauskas in 1996 and is used to evaluate the criteria of the options by taking into account the benefit and cost objectives [60]. Its biggest advantage is that it compares the options and expresses proportionally how good or bad they are compared to each other. The technique has 6 steps and can be implemented by using the Equations (8)–(13) [60,61,62].
Step 1. Creating the decision matrix: The matrix X in Equation (1), which consists of m rows and n columns, is created.
Step 2. Normalizing the decision matrix: The normalized matrix is derived from decision matrix (1) using Equation (8)
Step 3. Weighting the normalized matrix: The normalized matrix is weighted with Equation (9). In this context, the normalized matrix is multiplied by the weights obtained by the PSI method.
Step 4. The sum of the criteria values: The sum of the criteria values is calculated by using Equation (10) for the benefit (maximum) oriented criteria and Equation (11) for the cost (minimum) oriented criteria.
Step 5. Relative weights of the options: The relative weights of the options are calculated using Equation (12).
Step 6. Calculating the performance index of the options: The performance indices of each alternative are determined and ranked using Equation (13).
The values of the options are ranked from biggest to smallest.
2.1.3. MOORA (Multi Objective Optimization on the Basis of Ratio Analysis) Technique
MOORA is an MCDM technique that was first developed by Brauers and can be successfully applied to solve various complex decision-making problems [63]. The biggest advantage of the technique is that it offers the opportunity to evaluate the criteria where the maximum value is better and the criteria where the minimum value is preferred together. The MOORA technique is implemented with four steps by using Equations (14)–(16) [64].
Step 1. Creating the decision matrix: In the ratio method, the initial (decision) matrix shown in Equation (1) is created.
Step 2. Matrix normalization: Normalization is performed by using Equation (14), where i = 1, 2, …, m is the number of alternatives, j = 1, 2, …, n is the number of criteria (objectives).
Step 3. Weighing normalization matrix: Weighted normalized matrix values () are created using Equation (15) by multiplying each of the normalized matrix values by the weight of the criterion (). criteria weights were calculated using the PSI method.
Step 4. Determination of utility function of the options: In the decision matrix, the minimum goal values are subtracted from the maximum goal values of the criteria specified at the beginning. Equation (16) is used for this operation.
i are the values that the options take according to the criteria evaluation. The process is completed by sorting the values from biggest to smallest.
2.1.4. MAIRCA (Multi Attributive Ideal Real Comparative Analysis) Technique
MAIRCA, introduced to the MCDM literature by Gigovic and his colleagues, is a technique that identifies the gaps between ideal and empirical ratings [65]. By summing the gaps for each criterion, the total gap value for decision alternatives is calculated. At the end of the application, the alternative with the values closest to the ideal ratings, i.e., the one with the least total gap value, is determined as the best option. The MAIRCA technique is implemented with seven steps by using Equations (17)–(26) [66,67].
Step 1. Creating the decision matrix. The matrix X in Equation (1), which consists of m rows and n columns, is created.
Step 2. Normalizing the decision matrix. The normalized matrix is derived from decision matrix (1) using Equation (18) for maximization-oriented criteria and Equation (19) for minimization-oriented criteria. The normalized matrix shown in Equation (20) is obtained.
Step 3. Determination of selection probabilities (). It is calculated using Equation (20).
Step 4. Creation of the theoretical evaluation matrix. The theoretical evaluation matrix is calculated using Equation (21).
Step 5. Creation of the real evaluation matrix. The R real evaluation matrix shown in Equation (24) is created with Equation (22).
Step 6. Formation of the Total Difference Matrix. The difference matrix shown in Equation (25) is created using Equation (24).
Step 7. Calculation of criterion function values of alternatives. The criterion function is calculated with Equation (26)
The process is completed by sorting the values of the options from smallest to biggest.
2.1.5. MOOSRA (Multi-Objective Optimization Based on Simple Ratio Analysis) Technique
MOOSRA, developed by Das et al. in 2012, is preferred due to its short calculation time, few mathematical operations, high reliability, and simple applicability [68]. While the first two steps of the method are similar to the MOORA technique, it differs in the 3rd step by comparing the maximization and minimization. The MOOSRA technique is implemented with four steps by using Equations (27)–(29) [68,69].
Step 1. Creating the decision matrix: The matrix X in Equation (1), which consists of m rows and n columns, is created.
Step 2. Normalizing the decision matrix: The normalized matrix is derived from decision matrix (1) using Equation (27)
Step 3. Weighting the normalized matrix: The normalized matrix is weighted with Equation (28). In this context, the normalized matrix is multiplied by the weights () obtained by the PSI method.
Step 4. Calculating the benefit scores of the alternatives: The total benefit score () of each alternative is calculated using Formula (29). The results are sorted from largest to smallest.
for maximization,
for minimization
The process is completed by sorting the values of the options from biggest to smallest.
2.1.6. MABAC (Multi-Attributive Border Approximation Area Comparison) Technique
Developed by Pamučar and Ćirović in 2015, MABAC evaluates decision options by taking into account the distance of the criteria to the border proximity areas [70]. MABAC is an MCDM technique that aims to select the best alternative in a problem with many criteria in institutional and individual decision-making processes. MABAC is implemented with six steps by using Equations (30)–(37) [70,71].
Step 1. Creating the decision matrix: The matrix X in Equation (1), which consists of m rows and n columns, is created.
Step 2. Normalizing the decision matrix: The normalized matrix is derived from decision matrix (1) using Equation (31) for maximization-oriented criteria and Equation (30) for minimization-oriented criteria.
Step 3. Weighting the normalized matrix: The normalized matrix is weighted with Equation (32). In this context, the normalized matrix is multiplied by the weights (wj) obtained by the PSI method.
Step 4. Obtaining the boundary proximity matrix: Using Equation (33), the boundary proximity area matrix (G) shown in Equation (34) is obtained.
Step 5. Determining the distances of the alternatives from the boundary proximity values: These distances are calculated using Equations (35) and (36).
Step 6. Ranking the alternatives: The alternatives specified in the decision matrix X are ranked using Equation (37).
The process is completed by sorting the values of the options from biggest to smallest.
2.1.7. WPM (Weighted Product Method) Technique
Simple and easy to apply, WPM determines the overall score of each option based on the weighted multiplication of the criteria values of the options. (Therefore, in this study, to prevent zero values from negatively affecting the results, calculations were performed by using the value 0.00001, which is significantly smaller than the other values, in the WPM and OWA methods.) In this way, the performance values of the options are found. The WPM technique is applied with four steps by using Equations (38)–(41) [72,73].
Step 1. Creating the decision matrix: The matrix X in Equation (1), which consists of m rows and n columns, is created.
Step 2. Normalizing the matrix: Since the criteria are multiplied by each other in this method, no additional normalization process is applied.
Step 3. Creating the weighted decision matrix: The decision matrix is weighted with the Equations (38)–(40).
Step 4. Finding the multiplication points: The multiplication value of each option is found using the Equation (41).
The process is completed by sorting the values of the options from biggest to smallest.
2.1.8. OWA (Ordered Weighted Average) Operator
Developed by Ronald R. Yager in 1998, OWA is a technique that allows combining different pieces of information through the weights associated with these pieces [74,75]. OWA performs a parameterized aggregation between the largest and smallest values. The OWA operator covers criteria such as the highest value, the smallest value, and the average within the framework of special cases and provides an integrated structure according to different decision-making criteria. OWA is implemented with three steps by using the Equations (42)–(44) given below [74,75].
Step 1. Creating the decision matrix: The matrix X in Equation (1), which consists of m rows and n columns, is created.
Step 2. Normalizing the decision matrix: The normalized matrix is derived from decision matrix (1) using Equation (42) for maximization -oriented criteria and Equation (43) for minimization-oriented criteria.
Step 3. Calculating the OWA value for each alternative: The final result for each alternative is obtained by applying Equation (44) to compute the OWA values.
Here, the values () values are arranged in decreasing order from biggest to smallest. In this way, the process is completed.
2.1.9. Borda Rule
It is one of the voting methods of the social choice system developed by Borda in 1784. In this technique, different rankings are combined to obtain a single ranking [76]. According to Borda’s Rule, the most preferred alternative is given (n-1) points, and the least preferred is given 0 points. Scoring is done using Equality (45) [77]. Borda’s rule eliminates contradictions by combining the outputs of various techniques and creating a single ranking [66]. In this study, the results obtained with each MCDM technique will be scored with Borda’s Rule, and then the scores of the techniques will be added to make the final ranking.
3. Results and Discussion
The aroma values of dried foods vary depending on the drying method. Using the PSI technique, these data were evaluated in an integrated manner to calculate the importance levels of the aroma values. The aroma compounds of strawberry which were tabulated in Table 2 were analyzed with MCDM techniques, and firstly the importance level of aroma compounds was found with the PSI technique. Then, COPRAS, MOORA, MOOSRA, MAIRCA MABAC, WPM, and OWA techniques were used to rank the options. The different rankings obtained with each technique were combined with the Borda rule. It is desired that the first seven of the aroma compounds specified in the table have minimum values and the others have maximum values.
3.1. Aroma Compound Weights in Strawberry Drying Method Selection Using PSI Technique
The normalization step was performed using Formulas 1–3 and obtained results tabulated in Table 3.
Table 3.
Normalized matrix obtained by PSI technique.
As a result of the operations performed using Formulas (4)–(7) specified in the PSI technique, the importance levels of strawberry aroma compounds were calculated as shown in Table 4.
Table 4.
Importance levels of strawberry aroma compounds.
As a result of the calculations made using the PSI technique, the three most important strawberry aromas were determined as (E)-Nerolidol (AC14), γ-Butyrolactone (AC10) and Linalool (AC23), respectively.
3.2. Comparison of Strawberry Drying Methods with COPRAS Technique
In the COPRAS technique, the Formulas (8)–(13) were applied to the decision matrix. Table 5 shows the normalization matrix with COPRAS and Table 6 shows the order of strawberry drying methods.
Table 5.
Normalized matrix with COPRAS.
Table 6.
List of strawberry drying methods using the COPRAS technique.
According to the results obtained, the best drying method was determined to be Freeze Drying and the least preferred one was the Oven Drying method (60 °C) for the COPRAS technique.
3.3. Comparison of Strawberry Drying Methods with MOORA Technique
In the MOORA technique, the Formulas (14)–(16) were applied to the decision matrix. Table 7 shows the normalization matrix with MOORA and Table 8 shows the order of strawberry drying methods.
Table 7.
Normalized matrix with MOORA.
Table 8.
List of strawberry drying methods using the MOORA technique.
According to the results obtained, the best drying method was determined to be Shade Air Dried and the least preferred one was the Oven Drying method (60 °C).
3.4. Comparison of Strawberry Drying Methods with MAIRCA Technique
In the MAIRCA technique, the Formulas (17)–(26) were applied to the decision matrix. Table 9 shows the normalization matrix with MAIRCA and Table 10 shows the order of strawberry drying methods.
Table 9.
Normalized matrix with MAIRCA.
Table 10.
List of strawberry drying methods using the MAIRCA technique.
According to the results obtained, the best drying method was determined to be Oven-Dried (45 °C) and the least preferred one was Oven-Dried (60 °C) for MAIRCA.
3.5. Comparison of Strawberry Drying Methods with MOOSRA Technique
In the MOOSRA technique, the Formulas (27)–(29) were applied to the decision matrix. Table 11 shows the normalization matrix with MOOSRA and Table 12 shows the order of strawberry drying methods.
Table 11.
Normalized matrix with MOOSRA.
Table 12.
List of strawberry drying methods using the MOOSRA technique.
According to the results obtained, the best aroma values were identified in Fresh and the least preferred one was the Oven Drying method (60 °C) for MOOSRA.
3.6. Comparison of Strawberry Drying Methods with MABAC Technique
In the MABAC technique, the Formulas (30)–(37) were applied to the decision matrix. Table 13 shows the normalization matrix with MABAC and Table 14 shows the order of strawberry drying methods.
Table 13.
Normalized matrix with MABAC.
Table 14.
List of strawberry drying methods using MABAC technique.
According to the results obtained, the best drying method was determined to be oven-dried (45 °C) and the least preferred one was oven-dried method (60 °C) for MABAC.
3.7. Comparison of Strawberry Drying Methods with WPM Technique
In the WPM technique, the Formulas (38)–(41) were applied to the decision matrix. Table 15 shows the normalization matrix with WPM and Table 16 shows the order of strawberry drying methods.
Table 15.
Normalized matrix with WPM.
Table 16.
List of strawberry drying methods using WPM technique.
According to the results obtained, the best drying method was determined to be Freeze Dried and the least preferred one was the Microwave Drying method for WPM.
3.8. Comparison of Strawberry Drying Methods with OWA Technique
In the OWA technique, the Formulas (42)–(44) were applied to the decision matrix. Table 17 shows the normalization matrix with OWA and Table 18 shows the order of strawberry drying methods.
Table 17.
Normalized matrix with OWA.
Table 18.
List of strawberry drying methods using the OWA technique.
According to the results obtained, the best drying method was determined to be the Oven Drying (45 °C) method and the least preferred one was the Microwave Drying method for OWA.
3.9. Combining the Results Obtained by MCDM Techniques with the Borda Rule
The rankings made with 7 different MCDM methods were combined with the Borda rule. First, the borda value of each method was found with Equation (45). Then, these values were added up to find the total borda value of the options and, the final ranking was made. The results of these operations are shown in Table 19.
Table 19.
Combining the results of MCDM techniques with the Borda rule.
Freeze Drying emerged as a suitable drying method in the collective evaluation of the rankings obtained with the applied MCDM techniques using the Borda rule. On the other hand, in Table 19, Shade Air Dried is second, and Oven-Dried (45 °C) is third. Fresh fruit gives fourth place and Microwave drying and Oven Drying at 60 °C fifth and sixth place, respectively. These rankings are quite compatible with the literature. Abouelenein et al. (2021) found that fruity ester compounds were significantly reduced in microwave drying, oven drying at 60 °C, and oven drying at 45 °C [14]. Microwave drying was determined to be the method that reduced the ester content the most. In contrast, shade-drying and freeze-drying methods were reported to preserve ester compounds better. Also, Abouelenein et al. (2023) suggest that drying at low temperatures for a long time should be preferred to drying at high temperatures for a short time in order to obtain dried strawberries with a fruitier taste [30].
Furthermore, it was determined in this study that aroma values were best preserved in freeze-drying. It is stated in the literature that drying processes at temperatures of 50 °C and above have negative effects on food quality parameters and can especially lead to the loss of components such as color, aroma, and phenolic substances. This situation may negatively affect the overall quality of foods [78]
Furanone compounds were observed to increase especially in low-temperature drying (45 °C oven drying), shade drying, and freeze-drying processes. Furaneol was detected at low levels in samples obtained by oven drying at 60 °C but was not detected at all in the microwave drying method due to the high temperature. This was attributed to the fact that furaneol was not stable, depending on temperature and pH [52]. Jetti et al. (2007) stated that lactone levels increased significantly in samples dried by freeze and shade, and freeze drying gave the best results for terpene compounds [52]. These findings are consistent with the rankings obtained in this study.
Graphics of the ranking results of MCDM and Borda’s rule are shown in Figure 7.
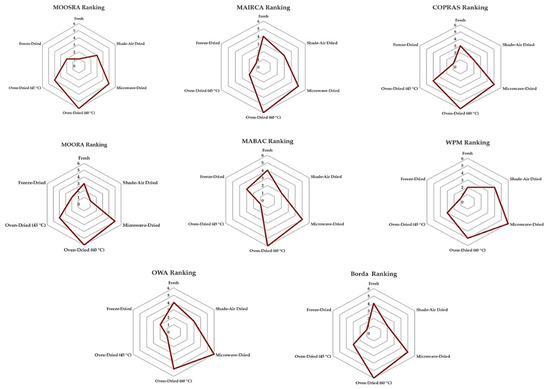
Figure 7.
Graphics of the ranking results of MCDM and Borda rule.
Although drying technologies are closely linked to the economy, employment, energy savings, and food safety in the food drying industry [79], this study does not address aspects such as the environmental impact and cost of drying methods within its scope. Instead, the evaluation focuses solely on the aroma values of dried strawberries. However, when examining drying methods from the perspectives of cost and environmental impact, it becomes evident that each method has its unique advantages and limitations. Shade drying, for instance, is a simple and cost-effective technique [80]. However, it presents challenges such as extended drying times, the need for ample space, and significant manpower requirements [81]. On the other hand, oven drying remains a widely utilized method due to its affordability [82]. The incorporation of microwaves in the food industry has revolutionized drying processes by reducing processing time and costs compared to traditional methods, while also preserving high sensory quality and minimizing nutritional degradation. Additionally, microwave-assisted drying is environmentally friendly [83,84,85]. In contrast, freeze drying, despite its ability to produce high-quality dried products, is hindered by significant energy demands and high operating costs due to prolonged drying times. This makes it the most expensive drying method, thereby limiting its broader application [86]. However, given the improved preservation of product quality, nutritional content, minerals, and fragrance qualities, this issue may be neglected. Furthermore, employing renewable energy for freeze-drying can have a favourable influence on both cost and environmental impact.
4. Conclusions
Some agricultural products are cultivated seasonally and stored for year-round use, usually by drying. Drying lowers moisture content, which increases shelf life and prevents spoiling. Traditional techniques, such as oven drying at 60 °C, can reduce food quality by affecting colour, microbiological structure, and scent components, as demonstrated in strawberries. To overcome these difficulties, innovative drying technologies are constantly being developed, which improve product quality, increase commercial value, and emphasize the relevance of the drying industry. While some methods enhance quality, others may have adverse effects. Selecting the appropriate drying method requires considering the product’s characteristics, production goals, and consumer expectations. Evaluating numerous aroma compounds systematically adds to the complexity of this decision-making process.
Multi-Criteria Decision Making (MCDM) techniques are frequently used to make decision-making processes more systematic and to manage uncertainties, such as in choosing strawberry drying methods. MCDM enables more effective solutions to complex problems and more informed decisions. In this study, PSI-based MCDM techniques were used to make the most appropriate choice among strawberry drying methods.
The values of 23 distinct aroma compounds obtained with different drying methods applied to strawberry fruit were analyzed with seven different MCDM techniques. The calculations gave similar results and these results were combined with the Borda rule. Accordingly, the drying methods with the highest scores were determined as freeze drying, shade drying, and oven drying at 45 °C, respectively. These findings revealed that the freeze-drying method, which has been frequently preferred in recent years but is quite high in terms of cost, gave the best results. On the other hand, the oven drying method performed at 60 °C in food drying was determined to be the method that gave the worst results because it caused the loss of a significant part of the aroma compounds. High temperatures caused the decrease or disappearance of many aroma compounds in the food content.
Future research can expand on the results by carrying out more thorough examinations of numerical data derived from strawberry drying tests using MCDM methodologies, such as nutritional content, mineral levels, and vitamin values. Further enriching the study might involve including expert comments on drying procedures, and cost and objectively assessing these subjective insights. Sensitivity studies can also be carried out with different parameters, enabling a thorough investigation of how each element affects the outcomes. These methods would help to build a more profound comprehension of the drying process and more objective, accurate findings.
Author Contributions
Conceptualization: A.A. (Aslı Abdulvahitoğlu) and A.A. (Adnan Abdulvahitoğlu), Data Curation: N.C., A.A. (Aslı Abdulvahitoğlu) and A.A. (Adnan Abdulvahitoğlu), Formal analysis: A.A. (Aslı Abdulvahitoğlu) and A.A. (Adnan Abdulvahitoğlu), Methodology: A.A. (Aslı Abdulvahitoğlu) and A.A. (Adnan Abdulvahitoğlu), Visualization: A.A. (Aslı Abdulvahitoğlu) and A.A. (Adnan Abdulvahitoğlu), Writing-original draft: A.A. (Aslı Abdulvahitoğlu), A.A. (Adnan Abdulvahitoğlu) and N.C., Writing-review & editing: A.A. (Aslı Abdulvahitoğlu), A.A. (Adnan Abdulvahitoğlu) and N.C. All authors have read and agreed to the published version of the manuscript.
Funding
This research received no external funding.
Institutional Review Board Statement
Not applicable.
Informed Consent Statement
Not applicable.
Data Availability Statement
The data presented in this study are openly available in Molecules at https://doi.org/10.3390/molecules26144153, reference number [14].
Conflicts of Interest
The authors declare no conflicts of interest.
References
- Abdulvahitoğlu, A.; Abdulvahitoğlu, A.; Cengiz, N. A Comprehensive Analysis of Apricot Drying Methods via Multi-Criteria Decision Making Techniques. J. Food Process Eng. 2024, 47, e14759. [Google Scholar] [CrossRef]
- Ratti, C. Hot-air and Frezee-drying of High Value Foods: A Review. J. Food Eng. 2001, 49, 311–319. [Google Scholar] [CrossRef]
- Santos, P.H.S.; Silva, M.A. Kinetics of L-ascorbic Acid Degradation in Pineapple Drying Under Ethanolic Atmosphere. Dry. Technol. 2009, 27, 947–954. [Google Scholar] [CrossRef]
- Zambrano, M.V.; Dutta, B.; Mercer, D.G.; MacLean, H.L.; Touchie, M.F. Assessment of moisture content measurement methods of dried food products in small-scale operations in developing countries: A review. Trends Food Sci. Technol. 2019, 88, 484–496. [Google Scholar] [CrossRef]
- Alwazeer, D. Kuru Gıdaların Rengini Muhafaza Etmeye Yönelik Yeni bir Teknik: İndirgen Atmosferik Kurutma. J. Inst. Sci. Technol. 2018, 8, 125–131. [Google Scholar] [CrossRef]
- Du, X.; Plotto, A.; Baldwin, E.; Rouseff, R. Evaluation of volatiles from two subtropical strawberry cultivars using GC–olfactometry, GC-MS odor activity values, and sensory analysis. J. Agric. Food Chem. 2011, 59, 12569–12577. [Google Scholar] [CrossRef]
- Yan, J.; Ban, Z.; Lu, H.; Li, D.; Poverenov, E.; Luo, Z.; Li, L. The Aroma Volatile Repertoire in Strawberry Fruit: A Review. J. Sci. Food Agric. 2018, 98, 4395–4402. [Google Scholar] [CrossRef]
- FAO. 2022. Available online: https://www.fao.org/faostat/en/#data/QCL (accessed on 5 December 2024).
- Sitso, Silifke Ticaret ve Sanayi Odası Çilek Sektör Raporu. Available online: www.sitso.org.tr (accessed on 5 December 2024).
- UIB. 2024. Available online: https://uib.org.tr/tr/library-download/uymsib-cilek-raporu (accessed on 5 December 2024).
- Worldpopulationreview. Available online: https://worldpopulationreview.com/country-rankings/strawberry-production-by-country (accessed on 5 December 2024).
- Fan, L.; Roux, V.; Dubé, C.; Charlebois, D.; Tao, S.; Khanizadeh, S. Effect of mulching systems on fruit quality and phytochemical composition of newly developed strawberry lines. Agric. Food Sci. 2012, 21, 132–140. [Google Scholar] [CrossRef]
- Miller, K.; Feucht, W.; Schmid, M. Bioactive compounds of strawberry and blueberry and their potential health effects based on human intervention studies: A brief overview. Nutrients 2019, 11, 1510. [Google Scholar] [CrossRef]
- Abouelenein, D.; Mustafa, A.M.; Angeloni, S.; Borsetta, G.; Vittori, S.; Maggi, F.; Sagratini, G.; Caprioli, G. Influence of freezing and different drying methods on volatile profiles of strawberry and analysis of volatile compounds of strawberry commercial jams. Molecules 2021, 26, 4153. [Google Scholar] [CrossRef]
- Kou, X.; Gao, N.; Xu, X.; Zhu, J.; Ke, Q.; Meng, Q. Preparation, Structural Analysis of Alcohol Aroma Compounds/β-cyclodextrin İnclusion Complexes and the Application in Strawberry Preservation. Food Chem. 2024, 457, 140160. [Google Scholar] [CrossRef] [PubMed]
- Sadowska, A.; Świderski, F.; Hallmann, E. Bioactive, physicochemical and sensory properties as well as microstructure of organic strawberry powders obtained by various drying methods. Appl. Sci. 2020, 10, 4706. [Google Scholar] [CrossRef]
- Yang, Q.; Hu, C.; Li, J.; Xiao, H.; Jia, W.; Wang, X.; Liu, X.; Tang, Z.; Chen, B.; Yi, X.; et al. Effects of Different Natural Drying Methods on Drying Characteristics and Quality of Diaogan apricots. Agriculture 2024, 14, 660. [Google Scholar] [CrossRef]
- Forney, C.F.; Kalt, W.; Jordan, M.A. The Composition of Strawberry Aroma is Influenced by Cultivar, Maturity, and Storage. Hortscience 2000, 35, 1022–1026. [Google Scholar] [CrossRef]
- Ropelewska, E.; Sabanci, K.; Aslan, M.F. The use of digital color imaging and machine learning for the evaluation of the effects of shade drying and open-air sun drying on mint leaf quality. Appl. Sci. 2022, 13, 206. [Google Scholar] [CrossRef]
- Polatçı, H.; Taşova, M.; Saraçoğlu, O. Armut (Pirus communis L.) Posasının Bazı Kalite Değerleri Açısından Uygun Kurutma Sıcaklığının Belirlenmesi. Akadamik Platf. Mühendislik Bilim Derg. 2020, 8, 540–546. [Google Scholar]
- Kocayiğit, F. Bazı Sebzelerin Kurutma Karakteristiklerinin İncelenmesi. Master’s Thesis, Yıldız Teknik Üniversitesi Fen Bilimleri Enstitüsü Yüksek Lisans Tezi, İstanbul, Türkiye, 2010; 107p. [Google Scholar]
- Sablani, S.S. Drying of Fruits and Vegetable: Retention of Nutritional/Functional Quality. Dry. Technol. 2006, 24, 123–135. [Google Scholar] [CrossRef]
- Karatas, F.; Kamıslı, F. Variations of Vitamins (A, C and E) and MDA in Apricots Dried in IR and Microwave. J. Food Eng. 2007, 78, 662–668. [Google Scholar] [CrossRef]
- Ayanwale, B.A.; Ocheme, O.B.; Oloyede, O.O. The Effect of Sun-Drying and Oven-Drying on the Nutritive Value of Meat Pieces in Hot Humid Environment. Pak. J. Nutr. 2007, 6, 370–374. [Google Scholar] [CrossRef]
- Nowacka, M.; Dadan, M.; Tylewicz, U. Drying Technologies in Food Processing. Appl. Sci. 2023, 13, 10597. [Google Scholar] [CrossRef]
- Natumanya, P.; Twinomuhwezi, H.; Igwe, V.S.; Maryam, S.; Awuchi, C.G. Effects of drying techniques on nutrient retention and phytochemicals in selected vegetables. Eur. J. Agric. Food Sci. 2021, 3, 5–14. [Google Scholar] [CrossRef]
- Göğüş, F.; Özel, M.Z.; Lewis, A.C. The Effect of Various Drying Techniques on Apricot Volatiles Analysed Using Direct Thermal Desorption-GC–TOF/MS. Talanta 2007, 73, 321–325. [Google Scholar] [CrossRef] [PubMed]
- Fratianni, A.; Albanese, D.; Mignogna, R.; Cinquanta, L.; Panfili, G.; Di Matteo, M. Degradation of Carotenoids in Apricot (Prunus armeniaca L.) During Drying Process. Plant Foods Hum. Nutr. 2013, 68, 241–246. [Google Scholar] [CrossRef] [PubMed]
- Sablani, S.S.; Rahman, M.S.; Al-Kuseibi, M.K.; Al-Habsi, N.A.; Al-Belushi, R.H.; Al-Marhubi I ve Al-Amri, I.S. Influence of Shelf Temperature on Pore Formation in Garlic During Freeze-Drying. J. Food Eng. 2007, 80, 68–79. [Google Scholar] [CrossRef]
- Abouelenein, D.; Acquaticci, L.; Alessandroni, L.; Borsetta, G.; Caprioli, G.; Mannozzi, C.; Marconi, R.; Piatti, D.; Santanatoglia, A.; Sagratini, G.; et al. Volatile profile of strawberry fruits and influence of different drying methods on their aroma and flavor: A review. Molecules 2023, 28, 5810. [Google Scholar] [CrossRef] [PubMed]
- Shih, C.; Pan, Z.; McHugh, T.; Wood, D.; Hirschberg, E. Sequential infrared radiation and freeze-drying method for producing crispy strawberries. Trans. ASABE 2008, 51, 205–216. [Google Scholar] [CrossRef]
- Zhao, J.; Liu, J.; Wang, F.; Wang, S.; Feng, H.; Xie, X.; Hao, F.; Zhang, L.; Fang, C. Volatile Constituents and Ellagic Acid Formation in Strawberry Fruits of Selected Cultivars. Food Res. Int. 2020, 138, 109767. [Google Scholar] [CrossRef]
- Kilic, M.; Sahin, M.; Hassan, A.; Ullah, A. Preservation of fruits through drying—A comprehensive review of experiments and modeling approaches. J. Food Process Eng. 2024, 47, e14568. [Google Scholar] [CrossRef]
- Fang, X.; Shen, J.; Zhang, L.; Zou, X.; Jin, L. Metabolomic and Transcriptomic Integration Reveals the Mechanism of Aroma Formation as Strawberries Naturally Turn Colors While Ripening. Food Chem. 2024, 460, 140765. [Google Scholar] [CrossRef]
- Memur, E. Güneş Enerjili Gıda Kurutucusu Tasarımı ile Kurutma Performans Değerlendirmeleri. Yekarum e-Dergi 2022, 7, 48–57. [Google Scholar]
- Teribia, N.; Buve, C.; Bonerz, D.; Aschoff, J.; Hendrickx, M.; Loey, A.V. Effect of Cultivar, Pasteurization and Storage on the Volatile and Taste Compounds of Strawberry Puree. LWT-Food Sci. Technol. 2021, 150, 112007. [Google Scholar] [CrossRef]
- Garcia-Martinez, E.; Igual, M.; Martin-Esparza, E.; Martinez-Navarrete, N. Assessment of the Bioactive Compounds, Color, and Mechanical Properties of Apricots as Affected by Drying Treatment. Food Bioprocess Technol. 2013, 6, 3247–3255. [Google Scholar] [CrossRef]
- Albanese, D.; Cinquanta, L.; Cuccurullo, G.; Di Matteo, M. Effects of Microwave and Hot-Air Drying Methods on Colour, B-Carotene and Radical Scavenging Activity of Apricots. Int. J. Food Sci. Technol. 2013, 48, 1327–1333. [Google Scholar] [CrossRef]
- Warne, G.R.; Lim, M.; Wilkinsin, K.; Hessel, V.; Williams, P.W.; Coad, B.; Fisk, I.D. Radiofrequency Cold Plasma—A Novel Tool for Flavour Modification in Fresh and Freeze-Dried Strawberries. Innov. Food Sci. Emerg. Technol. 2023, 90, 103497. [Google Scholar] [CrossRef]
- Zare, A.H.; Azadbakht, M.; Naseri, R. Effects of pretreatments involving ohmic heating and infrared radiation on the drying process of bananas using hot air. J. Food Process Eng. 2024, 47, e14612. [Google Scholar] [CrossRef]
- Abdulvahitoğlu, A. Drinking Water Safety and Comparison of Drinking Water Characteristics with Multi-Criteria Decision Making (MCDM) Methods. BIO Web Conf. 2024, 85, 01025. [Google Scholar] [CrossRef]
- Özdemir, Y.S.; Savalan, Ş. Farklı tarımsal üretim yöntemleri sonucu elde edilen ürün kalitesi analizi için sürdürülebilir melez bulanık ÇKKV yaklaşımı uygulaması. J. Turk. Oper. Manag. 2022, 6, 1121–1133. [Google Scholar]
- Haider, I.; Choubey, V.K. Identifying fruit and vegetable losses and waste causing factors in supply chain towards achieving sustainable consumption and production. Environ. Dev. Sustain. 2024. [Google Scholar] [CrossRef]
- Bayhun, S.; Oral, T.; Özdemir, M. Gıda Paketlemede Risk Değerlendirmesi Süreci İçin Bulanık Çok Kriterli Bir Model Uygulaması: DEMATEL ve CODAS. Black Sea J. Eng. Sci. 2023, 6, 265–275. [Google Scholar] [CrossRef]
- Dwivedi, A.; Goel, V.; Pathak, S.K.; Kumar, A. Prioritization of potential barriers to the implementation of solar drying techniques using MCDM tools: A case study and mapping in INDIA. Sol. Energy 2023, 253, 199–218. [Google Scholar] [CrossRef]
- da Silva Pinto, M.D.; Lajolo, F.M.; Genovese, M.I. Bioactive compounds and quantification of total ellagic acid in strawberries (Fragaria × ananassa Duch.). Food Chem. 2008, 107, 1629–1635. [Google Scholar] [CrossRef]
- Abonyi, B.I.; Feng, H.; Tang, J.; Edwards, C.G.; Chew, B.P.; Mattinson, D.S.; Fellman, J.K. Quality retention in strawberry and carrot purees dried with Refractance WindowTM system. J. Food Sci. 2002, 67, 1051–1056. [Google Scholar] [CrossRef]
- Kaplan, M.; Levent, O. Farklı Kurutma Yöntemlerinin 12-Kadıoğlu Kayısı Çeşidinin Uçucu Organik Bileşenleri Üzerine Etkisi. Derim 2019, 36, 168–176. [Google Scholar] [CrossRef]
- Zang, J.; Yu, D.; Zhang, P.; Xu, Y.; Xi, W. The Key Enzymes and Flavor Precursors İnvolved in Formation of Characteristic Flavor Compounds of Low-Salt Fermented Common Carp (Cyprinus carpio L.). LWT-Food Sci Technol. 2022, 154, 112806. [Google Scholar] [CrossRef]
- Padilla-Jiménez, S.M.; Angoa-Pérez, M.V.; Mena-Violante, H.G.; Oyoque-Salcedo, G.; Montañez-Soto, J.L.; Oregel-Zamudio, E. Identification of organic volatile markers associated with aroma during maturation of strawberry fruits. Molecules 2021, 26, 504. [Google Scholar] [CrossRef]
- Schwieterman, M.L.; Colquhoun, T.A.; Jaworski, E.A.; Bartoshuk, L.M.; Gilbert, J.L.; Tieman, D.M.; Odabasi, A.Z.; Moskowitz, H.R.; Folta, K.M.; Klee, H.J.; et al. Strawberry flavor: Diverse chemical compositions, a seasonal influence, and effects on sensory perception. PLoS ONE 2014, 9, e88446. [Google Scholar] [CrossRef]
- Jetti, R.R.; Yang, E.; Kurnianta, A.; Finn, C.; Qian, M.C. Quantification of selected aroma-active compounds in strawberries by headspace solid-phase microextraction gas chromatography and correlation with sensory descriptive analysis. J. Food Sci. 2007, 72, S487–S496. [Google Scholar] [CrossRef]
- Nuzzi, M.; Lo Scalzo, R.; Testoni, A.; Rizzolo, A. Evaluation of fruit aroma quality: Comparison between gas chromatography–olfactometry (GC–O) and odour activity value (OAV) aroma patterns of strawberries. Food Anal. Methods 2008, 1, 270–282. [Google Scholar] [CrossRef]
- Zhang, Y.T.; Wang, G.X.; Jing, D.; Zhong, C.F.; Jin, K.; Li, T.Z.; Han, Z.H. Analysis of volatile components in strawberry cultivars Xingdu 1 and Xingdu 2 and their parents. Agric. Sci. China 2009, 8, 441–446. [Google Scholar] [CrossRef]
- Rohloff, J. Impact of agricultural and environmental factors on strawberry (Fragaria× ananassa Duch.) aroma—A review. Eur. J. Plant Sci. Biotechnol. 2011, 5, 17–34. [Google Scholar]
- Abdulvahitoğlu, A.; Abdulvahitoğlu, A.; Kılıç, M. Elektrikli Araç Bataryalarının Bütünleşik SWARA-TOPSIS Metodu ile Değerlendirilmesi. Çukurova Üniversitesi Mühendislik Fakültesi Derg. 2022, 37, 1061–1076. [Google Scholar] [CrossRef]
- Maniya, K.; Bhatt, M.G. A selection of material using a novel type decision-making method: Preference selection index method. Mater. Des. 2010, 31, 1785–1789. [Google Scholar] [CrossRef]
- Attri, R.; Grover, S. Application of preference selection index method for decision making over the design stage of production system life cycle. J. King Saud Univ.-Eng. Sci. 2015, 27, 207–216. [Google Scholar] [CrossRef]
- Akyüz, G.; Aka, S. Çok kriterli karar verme teknikleriyle tedarikçi performansı değerlendirmede toplamsal bir yaklaşım. Yönetim Ekon. Araştırmaları Derg. 2017, 15, 28–46. [Google Scholar] [CrossRef]
- Özbek, A. İlkokul öğretmenleri sağlık ve sosyal yardım sandığı’nın finansal performans analizi. Çankırı Karatekin Üniversitesi İktisadi İdari Bilim. Fakültesi Derg. 2017, 7, 1–31. [Google Scholar]
- Hezer, S.; Gelmez, E.; Özceylan, E. Comparative Analysis of TOPSIS, VIKOR and COPRAS Methods for the COVID-19 Regional Safety Assessment. J. Infect. Public Health 2021, 14, 775–786. [Google Scholar] [CrossRef]
- Hezam, İ.M.; Mishra, A.R.; Rani, P.; Saha, A.; Smarandache, F.; Pamucar, D. An integrated decision support framework using single-valued neutrosophic-MASWIP-COPRAS for sustainability assessment of bioenergy. Expert. Syst. Appl. 2023, 211, 118674. [Google Scholar] [CrossRef]
- Brauers, W.K.M.; Zavadskas, E.K. Robustness of the Multiobjective MOORA Method with a Test for the Facilities Sector. Technol. Econ. Dev. Econ. Balt. J. Sustain. 2009, 15, 352–375. [Google Scholar]
- Hafezalkotob, A.; Liao, H.; Herrera, F. An overview of MULTIMOORA for multi-criteria decision-making: Theory, developments, applications, and challenges. Inf. Fusion 2019, 51, 145–177. [Google Scholar] [CrossRef]
- Szymczyk, K.; Bağcı, H.; Kaygın, C.Y.; Şahin, D. A Comparison of the Entrepreneurial Performance of Asian-Oceanian Countries via the Multi-Criteria Decision-Making Techniques of Critic, Aras, Waspas, Mairca and Borda Count Methods. Acta Polytech. Hung. 2023, 20, 65–81. [Google Scholar] [CrossRef]
- Gigović, L.; Pamučar, D.; Bajić, Z.; Milićević, M. The Combination of Expert Judgment and GIS-MAIRCA Analysis for the Selection of Sites for Ammunition Depots. Sustainability 2016, 8, 372. [Google Scholar] [CrossRef]
- Ul Haq, R.S.; Saeed, M.; Mateen, N.; Siddiqui, F.; Sohail, A. An interval-valued neutrosophic based MAIRCA method for sustainable material selection. Eng. Appl. Artif. Intell. 2023, 123 Pt A, 106177. [Google Scholar] [CrossRef]
- Demircioğlu, M.; Coşkun, İ.T. CRITIC-MOOSRA Yöntemi ve UPS Seçimi Üzerine Bir Uygulama. Ç.Ü. Sos. Bilim. Enstitüsü Derg. 2018, 27, 183–195. [Google Scholar]
- Das, M.C.; Sarkar, B.; Ray, S. On the performance of Indian technical institutions: A combined SOWIA-MOORA approach. Opsearch 2013, 50, 319–333. [Google Scholar] [CrossRef]
- Pamučar, D.; Ćirović, G. The Selection of Transport and Handling Resources in Logistics Centers Using Multi-Attributive Border Approximation Area Comparison (MABAC). Expert. Syst. Appl. 2015, 42, 3016–3028. [Google Scholar] [CrossRef]
- Stojanović, I.; Puška, A. Logistics Performances of Gulf Cooperation Council’s Countries in Global Supply Chains. Decis. Mak. Appl. Manag. Eng. 2021, 4, 174–193. [Google Scholar] [CrossRef]
- Keleş, M.K.; Özdağoğlu, A.; Yörük Eren, F. Bir Laboratuvarda Tam Kan Sayım Cihazı Alternatiflerinin SWARA, WPM, TODIM ve AHS Yöntemleri ile Değerlendirilmesi. İzmir İktisat Derg. 2019, 34, 511–526. [Google Scholar] [CrossRef]
- Taka, M.; Raygor, S.P.; Purohit, R.; Parashar, V. Selection of tool and work piece combination using Multiple Attribute Decision Making Methods for Computer Numerical Control turning operation. Mater. Today Proc. 2017, 4, 1199–1208. [Google Scholar] [CrossRef]
- Emrouznejad, A.; Marra, M. Ordered Weighted Averaging Operators 1988–2014: A Citation Based Literature Survey. Int. J. Intell. Syst. 2014, 29, 994–1014. [Google Scholar] [CrossRef]
- Altıntaş, F.F. G7 Ülkelerinin Enerji Sürdürülebilirliği Performanslarının Analizi: OWA Opearatörü ve CODAS Yöntemleri ile bir Uygulama. Akad. Düşünce Derg. 2022, 5, 3–25. [Google Scholar] [CrossRef]
- Wu, J.; Güneş, J.; Liang, L.; Zha, Y. Determination of weights for ultimate cross efficiency using Shannon Entropy. Expert. Syst. Appl. 2011, 38, 5162–5165. [Google Scholar] [CrossRef]
- Hacıfettahoğlu, Ö.; Pereçin, S. Bütünleşik ÇKKV Yaklaşimi ile Finansal Boyutta Türk Inşaat Firmalarinin Performansinin Değerlendirilmesi. Dokuz Eylül Üniversitesi Sos. Bilim. Enstitüsü Derg. 2020, 22, 543–567. [Google Scholar] [CrossRef]
- Belwal, T.; Cravotto, C.; Prieto, M.A.; Venskutonis, P.R.; Daglia, M.; Devkota, H.P.; Baldi, A.; Ezzat, S.M.; Gómez-Gómez, L.; Salama, M.M.; et al. Effects of different drying techniques on the quality and bioactive compounds of plant-based products: A critical review on current trends. Dry. Technol. 2022, 40, 1539–1561. [Google Scholar] [CrossRef]
- Martynenko, A.; Vieira, G.N.A. Sustainability of drying technologies: System analysis. Sustain. Food Technol. 2023, 1, 629–640. [Google Scholar] [CrossRef]
- Periche, A.; Castelló, M.L.; Heredia, A.; Escriche, I. Influence of drying method on steviol glycosides and antioxidants in Stevia rebaudiana leaves. Food Chem. 2015, 172, 1–6. [Google Scholar] [CrossRef]
- Martínez-Las Heras, R.; Heredia, A.; Castelló, M.L.; Andrés, A. Influence of drying method and extraction variables on the antioxidant properties of persimmon leaves. Food Biosci. 2014, 6, 1–8. [Google Scholar] [CrossRef]
- Arslan, D.; Özcan, M.M. Study the effect of sun, oven and microwave drying on quality of onion slices. LWT-Food Sci. Technol. 2010, 43, 1121–1127. [Google Scholar] [CrossRef]
- Kalla, A.M.; Devaraju, R. Microwave energy and its application in food industry: A review. Asian J. Dairy Food Res. 2017, 36, 37–44. [Google Scholar] [CrossRef]
- Kaveh, M.; Abbaspour-Gilandeh, Y.; Fatemi, H.; Chen, G. Impact of different drying methods on the drying time, energy, and quality of green peas. J. Food Process Preserv. 2021, 45, e15503. [Google Scholar] [CrossRef]
- Guzik, P.; Kulawik, P.; Zając, M.; Migdał, W. Microwave applications in the food industry: An overview of recent developments. Crit. Rev. Food Sci. Nutr. 2022, 62, 7989–8008. [Google Scholar] [CrossRef]
- Yao, J.; Chen, W.; Fan, K. Novel efficient physical technologies for enhancing freeze drying of fruits and vegetables: A review. Foods 2023, 12, 4321. [Google Scholar] [CrossRef] [PubMed]
Disclaimer/Publisher’s Note: The statements, opinions and data contained in all publications are solely those of the individual author(s) and contributor(s) and not of MDPI and/or the editor(s). MDPI and/or the editor(s) disclaim responsibility for any injury to people or property resulting from any ideas, methods, instructions or products referred to in the content. |
© 2025 by the authors. Licensee MDPI, Basel, Switzerland. This article is an open access article distributed under the terms and conditions of the Creative Commons Attribution (CC BY) license (https://creativecommons.org/licenses/by/4.0/).