Abstract
Grout voids in external tendons of post-tensioned bridges are a critical issue, as they may result in the corrosion of the steel strands and significantly reduce tendon strength. Therefore, preventing tendon failure necessitates thorough inspection for these voids during both construction and operation. Terahertz electromagnetic wave testing is an effective method for detecting voids between the protective duct and the grout in external tendons, as terahertz waves can penetrate through the protective duct. This study introduces a D-band electronic frequency-modulated continuous-wave terahertz A-scanner for enhanced real-time inspection. The proposed method offers key advantages such as miniaturization, cost-effectiveness, and robustness, while providing effective detection of voids beneath the duct in external tendons. It is indicated that voids with a thickness of approximately 2.5 mm or greater can be detected using the D-band THz A-scanner.
1. Introduction
External tendons, extensively utilized in the girders of post-tensioned bridges, are essential components for carrying loads, and their condition is closely related to the structural stability of the bridges [1]. Tendon failure, primarily caused by the corrosion of the steel strands, can severely compromise structural integrity [2]. Compared to internal tendons, external tendons are more vulnerable to corrosion due to their direct exposure to environmental aggressors such as temperature, humidity, and salinity [3]. A critical concern is the formation of grout voids within these tendons. Such voids not only impede proper stress redistribution, thereby weakening the tendon system [4], but also, more importantly, expose the steel strands to moisture and corrosive ions, significantly accelerating the corrosion process [5]. These voids are common defects and often result from factors including unskilled workmanship, substandard grout materials, abrupt changes in duct geometry, and long-term grout settlement. Therefore, regular inspection of external tendons to detect voids, along with monitoring any changes in their size and shape, is essential, necessitating the development of effective and reliable inspection methodologies.
Typically, an external tendon in post-tensioned bridges comprises multiple steel strands, cementitious grout, and a protective duct that encases them, which is most commonly made of smooth high-density polyethylene (HDPE) [6]. Recent studies have investigated a variety of techniques for detecting grout voids in external tendons. These techniques can be broadly categorized into mechanical wave-based and electromagnetic wave-based approaches. Mechanical wave-based methods include sounding inspection [7] and ultrasonic testing [8]. The sounding inspection method involves striking the outer surface of the duct with an impactor and interpreting the resulting sound based on the expertise of the technician. While this method is quick and simple, it is not effective for detecting smaller voids. Ultrasonic testing, on the other hand, utilizes probes that emit and receive ultrasonic waves. Various techniques, including through-transmission, pulse-echo, guided waves, and linear array, are employed, depending on the ultrasonic mode and probe configuration. A key challenge in ultrasonic testing is maintaining proper coupling between the duct and the probe by using a liquid couplant, which can complicate void imaging and sizing. Electromagnetic wave-based methods, such as infrared thermography and radiography, offer high-resolution imaging capabilities for void detection [9]. In infrared thermography, voids function as barriers to heat transfer, making them detectable through thermal imaging methods. Passive thermography, which depends on natural ambient heat, is particularly sensitive to environmental temperature conditions, limiting its ability to detect voids. In contrast, active thermography employs artificial heat sources to enhance void detection. Radiography, employing X-rays or gamma rays, provides high-resolution and highly detectable images of voids but is often regulated due to concerns regarding radiation exposure during testing.
Terahertz (THz) electromagnetic waves, spanning the frequency range of 0.1 to 10 THz, are suitable for nondestructive testing of nonconductive materials due to their transparency to THz radiation [10,11]. THz waves exhibit low attenuation within the HDPE duct and a significant difference in reflectivity at the duct/grout and duct/void interfaces [12]. Thus, a THz A-scanner can be a promising tool for detecting voids between the duct and the grout in external tendons. In our previous study, we introduced a real-time THz A-scanner based on the optoelectronic frequency-modulated continuous-wave (FMCW) technique for this purpose [12]. The system employs a frequency-fixed laser and a frequency-swept laser for THz photomixing, enabling high-speed THz frequency sweeping in conjunction with the coherent detection technique [12,13,14,15,16,17]. We demonstrated the effectiveness of the system in detecting voids within external tendons.
This work presents an enhanced inspection method utilizing an electronic FMCW system operating in the D-band, the lowest frequency band within the THz region. Compared to the optoelectronic FMCW system reported in our previous study, the proposed D-band electronic FMCW system offers several advantages derived from its fully electronic architecture. These include greater potential for miniaturization and lower cost, as well as faster measurements enabled by its higher THz output power and increased sweep repetition rate [18,19,20,21,22,23]. In addition, the use of a narrow-linewidth oscillator extends the measurable A-scan range. The system also exhibits enhanced robustness against environmental conditions, such as temperature variations and mechanical vibrations, making it highly suitable for portable field applications. However, a key limitation of the electronic FMCW system, compared to the optoelectronic FMCW system, is its narrower frequency sweep range, which results in lower A-scan resolution. As most materials exhibit lower THz wave attenuation at lower frequencies, the D-band system can achieve a longer measurable A-scan range compared to systems operating at higher frequencies. Furthermore, the relatively low cost of electronic components renders the D-band system a more cost-effective solution compared to systems operating at higher frequencies [24,25,26,27,28,29,30]. Ultimately, this study demonstrates that the developed D-band THz A-scanner, with the aforementioned advantages, is capable of effectively detecting grout voids in external bridge tendons.
2. Development of a D-Band THz A-Scanner
Figure 1 illustrates the schematic configuration of our D-band THz A-scanner. As shown in Figure 1a, the THz A-scanner consists of a signal source and a THz A-scanner head, which are interconnected via microwave cables. The THz A-scanner head acts as a handheld probe for target inspection. As depicted in Figure 1b, the signal source generates FMCW signals in the 10–14 GHz frequency range, which are transmitted to the THz A-scanner head through the connecting cables. The THz A-scanner head emits and receives FMCW THz radiation in the 120–168 GHz range, which is 12 times the input frequency.
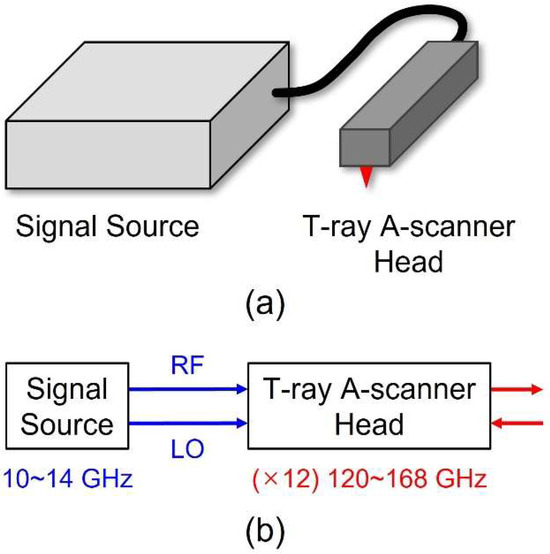
Figure 1.
Schematic configuration of our D-band THz A-scanner. (a) The system comprises a signal source and a THz A-scanner head, interconnected via microwave cables. (b) The signal source generates FMCW signals in the 10–14 GHz range, while the THz A-scanner head transmits and receives FMCW THz radiation in the 120–168 GHz range.
Figure 2 illustrates the overall configuration and operation method of the THz A-scanner. We describe the signal source composed of commercially available electronic components in more detail as follows: As shown in Figure 2, a direct digital synthesizer (DDS), driven by a field-programmable gate array (FPGA) board, generates signals in the 2.5–3.5 GHz frequency range. These signals are passed through a filter and an attenuator before being fed into a 4× frequency multiplier. The attenuator adjusts the signal power to match the input requirements of the frequency multiplier. The frequency-multiplied signals in the 10–14 GHz range are then amplified, filtered, and subsequently divided into radio-frequency (RF) and local-oscillator (LO) paths using a power divider. These RF and LO signals are delivered to the transceiver (TRx) module, located in the THz A-scanner head. The amplifier ensures that the signal level is within the acceptable input range of the TRx. Within the TRx, 12× frequency multipliers convert the 10–14 GHz signals into the 120–168 GHz signals in the D-band. The D-band THz waves are transmitted and received via an integrated antenna. Although we did not measure the TRx output power, the manufacturer’s specifications indicate that the typical output power of the TRx is 13 dBm [31]. A D-band frequency mixer within the TRx downconverts the received signals to intermediate-frequency (IF) signals.
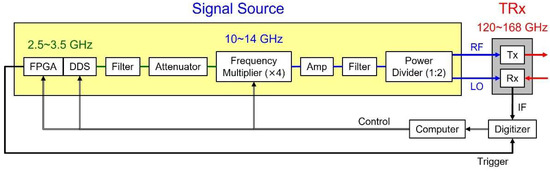
Figure 2.
Configuration of our D-band THz A-scanner. FPGA: field-programmable gate array board; DDS: direct digital synthesizer; Amp: amplifier; RF: radio-frequency signal; LO: local-oscillator signal; Tx: transmitter; Rx: receiver; TRx: transceiver; IF: intermediate-frequency signal.
The IF signals output from the D-band frequency mixer within the TRx are acquired by a digitizer with a bandwidth of 100 MHz, a sampling rate of 500 MS/s, and a resolution of 12 bits. Frequency modulation of the DDS signal is driven by the FPGA board, which also generates a trigger signal to synchronize the digitizer with each modulation cycle. The digitizer repeatedly captures frequency-domain data, which is transmitted to a laptop computer for further processing. To enhance the signal-to-noise ratio (SNR), the laptop averages multiple traces of the frequency-domain data. The corresponding THz A-scan data is then derived by applying a fast Fourier transform (FFT) to the averaged data. Figure 3 shows the three-dimensional (3D) design schematics of the signal source, which is implemented in the form of a portable suitcase. Photographs of the fabricated signal source are also presented. The suitcase contains the digitizer, the laptop computer, and all associated electronic components.
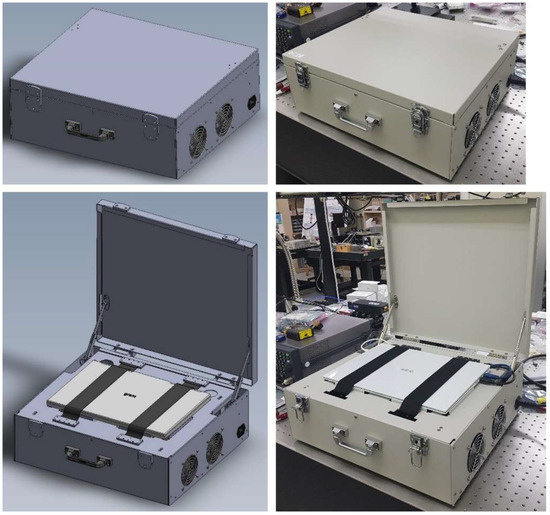
Figure 3.
Three-dimensional design schematics and photographs of the fabricated signal source.
Figure 4 presents the measurement results of signals in the 10–14 GHz frequency range generated by the signal source and supplied to the TRx. Figure 4a shows the power spectrum of a continuous-wave (CW) signal at a fixed frequency of 12.0 GHz. The signal exhibits a power level of 10.5 dBm at 12.0 GHz, while a spurious component at 13.0 GHz is observed at −37.3 dBm, resulting in a spurious level of −47.8 dBc. Figure 4b,c show the measured signal power and spurious level, respectively, as functions of frequency for frequency-fixed CW signals in the 10–14 GHz range. Within this frequency range, the signal power satisfies the TRx input requirement of 10 ± 3 dBm, and the spurious level remains below −26 dBc. Figure 4d displays the power spectrum of a 10–14 GHz FMCW signal with a sweep repetition rate of approximately 244 kHz, indicating that the signal power gradually decreases with increasing frequency, which is consistent with the trend observed in Figure 4b.
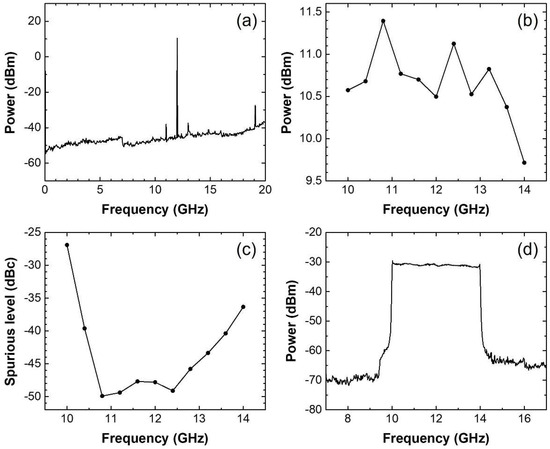
Figure 4.
Measurement results of signals in the 10–14 GHz frequency range generated by the signal source and supplied to the TRx. (a) Power spectrum of a CW signal at a fixed frequency of 12.0 GHz. (b) Signal power and (c) spurious level as functions of frequency for frequency-fixed CW signals in the 10–14 GHz range. (d) Power spectrum of a 10–14 GHz FMCW signal.
To verify the quality of the 10–14 GHz FMCW signal generated by the signal source, the RF and LO signals output from the signal source were input to a frequency mixer via microwave cables of 2.5 m and 0.3 m in length, respectively. The resulting IF signal output from the mixer was measured, as illustrated in Figure 5a. Figure 5b presents the frequency-domain data obtained by digitizing the IF signal and converting time into frequency based on the known frequency sweep rate. Figure 5c shows the corresponding time-domain data, obtained by applying an FFT to the frequency-domain data. In Figure 5c, the distinct peak at 9.5 ns indicates that the transmission time difference between the two microwave cables is 9.5 ns. Both the frequency- and time-domain data exhibit very low noise levels, confirming the high quality of the generated FMCW signal.
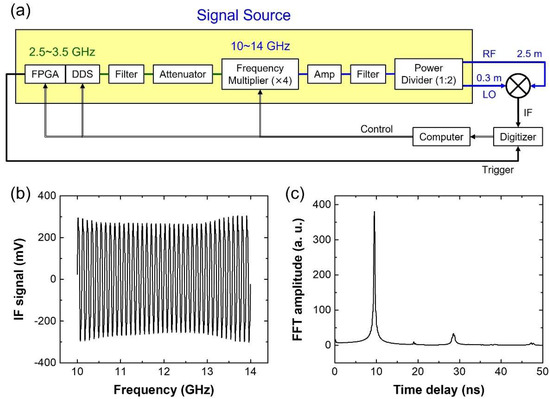
Figure 5.
(a) Experimental setup for evaluating the 10–14 GHz FMCW signal generated by the signal source. The RF and LO signals output from the signal source are input to a frequency mixer via microwave cables of 2.5 m and 0.3 m in length, respectively. (b) Frequency-domain data obtained by digitizing the IF signal from the frequency mixer and converting time into frequency based on the known frequency sweep rate. (c) Corresponding time-domain data obtained by applying an FFT to the frequency-domain data.
Figure 6 presents the design schematics of the THz A-scanner head. Figure 6a,b show lateral views of the design, while Figure 6c,d depict its 3D views. As illustrated in Figure 6b, the THz A-scanner head comprises a TRx, a waveguide, a lens horn antenna, and an off-axis parabolic mirror. THz radiation emitted from the TRx propagates through the waveguide and is nearly collimated by the lens horn antenna. The off-axis parabolic mirror then focuses the THz beam downward, which then exits and enters through a hole in the base plate, as depicted in Figure 6c,d. The height of the THz A-scanner head can be adjusted using four supporting posts, allowing the focal point of the THz beam to align with the underside of the base plate. Figure 7 shows a photograph of the fabricated D-band THz A-scanner, which consists of the signal source presented in Figure 3 and the THz A-scanner head manufactured following the design schematics presented in Figure 6.
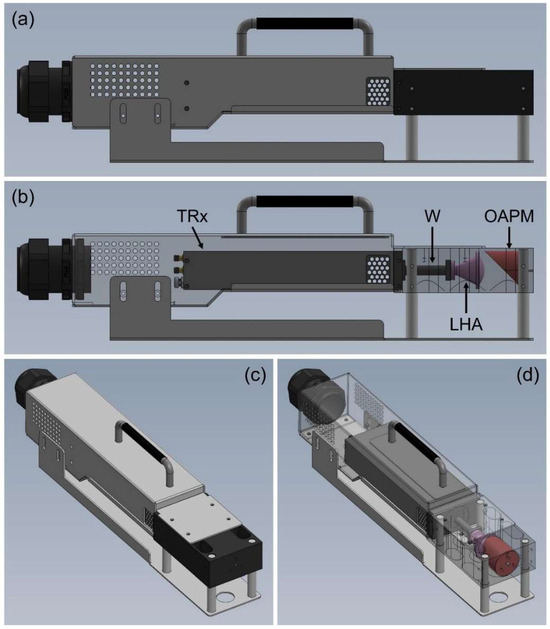
Figure 6.
Design schematics of the THz A-scanner head. (a,b) Lateral views and (c,d) 3D views of the designed THz A-scanner head. In (b), W = waveguide, LHA = lens horn antenna, and OAPM = off-axis parabolic mirror.
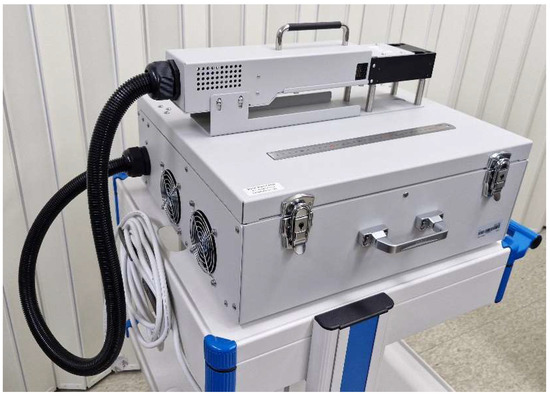
Figure 7.
Photograph of the fabricated D-band THz A-scanner, with a 30 cm ruler included for scale reference.
To evaluate the performance of the D-band THz A-scanner, a THz A-scan measurement was conducted on a metal target placed in contact with the underside of the base plate of the THz A-scanner head. Figure 8a presents the frequency-domain data measured in the 120–168 GHz range. Compared to the result shown in Figure 5b, the magnitude of the IF signal exhibits greater fluctuations across the frequency range. Figure 8b shows the corresponding THz A-scan data, which was derived from the frequency-domain data using FFT. Unlike the time-domain data in Figure 5c, the THz A-scan data in Figure 8b displays ripples throughout the entire time delay range. The peak at 1.77 ns corresponds to the reflection from the metal surface, and the peak at 0.88 ns is likely attributed to the interface between the waveguide and the lens horn antenna, while the peak at 2.66 ns is presumably the result of multiple reflections between this interface and the metal surface. However, since the peaks at 0.88 ns and 2.66 ns fall outside the time delay window of interest, they are considered negligible. Figure 8c provides a magnified view of the main peak at 1.77 ns. The full width at half maximum (FWHM) of the peak is approximately 37 ps, corresponding to a THz A-scan resolution of approximately 5.6 mm, which was calculated using the relation R = c·FWHM/2, where c is the speed of light. In addition, noise data is presented in Figure 8c, which was measured without a target. From the THz A-scan data and the noise data, the SNR was estimated to be about 240.
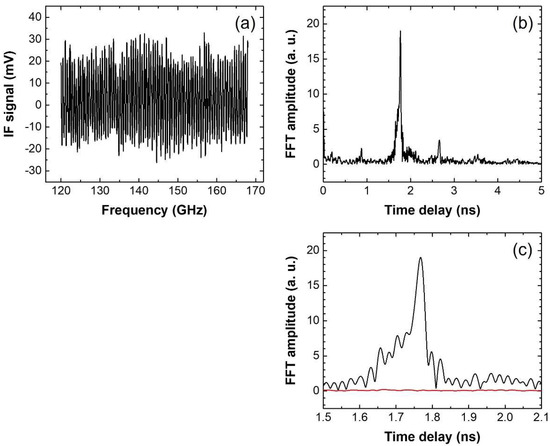
Figure 8.
(a) Frequency-domain data acquired from a metal target using the D-band THz A-scanner. (b) Corresponding THz A-scan data derived from the frequency-domain data using FFT. (c) Enlarged view (black line) of the peak at 1.77 ns in (b) and noise data (red line) measured without a target.
3. Nondestructive Inspection of an External Bridge Tendon Specimen
Figure 9a,b show the lateral and cross-sectional views, respectively, of a constructed bridge tendon specimen. The specimen was prepared by embedding fifteen steel strands, each with a nominal diameter of 15.2 mm, into an HDPE duct with an outer diameter of 110 mm. The duct was subsequently filled with cementitious grout, thereby replicating the structural configuration of an external tendon in post-tensioned bridges. During the grout curing process, voids—which can serve as reservoirs for moisture—were formed in the upper interior region of the HDPE duct. If cracks develop in the grout, moisture may penetrate through the cracks and reach the steel strands, thereby initiating corrosion. Accordingly, a nondestructive inspection technique capable of detecting the presence of such voids is essential. We investigated the applicability of the D-band THz A-scanner for detecting voids beneath the duct in external bridge tendons.
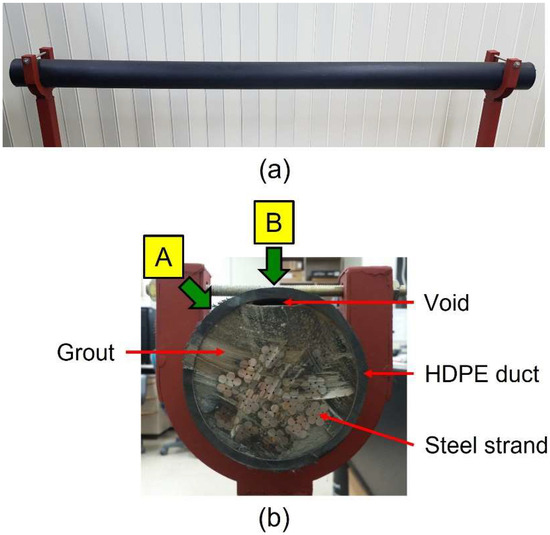
Figure 9.
(a) Lateral view and (b) cross-sectional view of the external bridge tendon specimen. In (b), A and B indicate the void-free and void-containing regions of the specimen, respectively.
Before conducting measurements on the external tendon specimen using the D-band THz A-scanner, we measured the refractive index of HDPE. For this purpose, THz A-scan measurements were performed for HDPE blocks with thicknesses of 10, 20, 30, 40, 50, and 60 mm. Figure 10a presents the THz A-scan data measured on the HDPE blocks. The thickness of each HDPE block was estimated from the time delay difference (Δτ) between the front (P1) and back (P2) surface reflections in the A-scan data, based on the relation d = c·Δτ/(2n), where c is the speed of light and n is the refractive index of HDPE. The optimal refractive index value was determined by minimizing the sum of squared differences between the estimated thickness values and the reference measurements obtained using a vernier caliper, resulting in a refractive index of 1.534. Figure 10b shows the estimated thicknesses of the HDPE blocks using this refractive index.
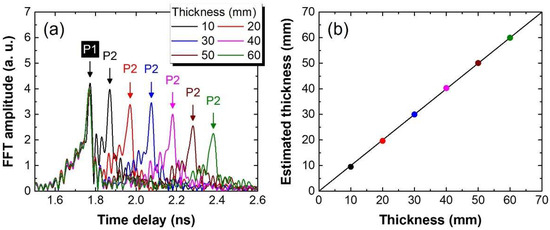
Figure 10.
(a) The THz A-scan data were measured on HDPE blocks with different thicknesses. (b) Thickness values of the HDPE blocks estimated from the THz A-scan data.
Figure 11 presents the THz A-scan data of the bridge tendon specimen measured using the D-band THz A-scanner. The THz A-scanner head was placed horizontally on the surface of the tendon specimen to acquire the THz A-scan data. Figure 11a shows the THz A-scan data acquired from the void-free region (A) indicated in Figure 9b. In the data, two distinct reflection signals are observed: P1, corresponding to the surface of the HDPE duct, and P2, corresponding to the duct/grout interface. Using the measured refractive index of HDPE and the time delay difference between P1 and P2, the thickness of the HDPE duct was estimated to be 5.7 mm, which was in excellent agreement with the reference value measured using a vernier caliper. The amplitude ratio of P2 to P1 was approximately 75%.
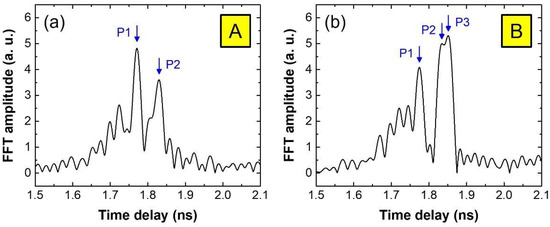
Figure 11.
THz A-scan data acquired from (a) the void-free region and (b) the void-containing region of the external tendon specimen using the D-band THz A-scanner.
Figure 11b shows the THz A-scan data acquired from the void-containing region (B) indicated in Figure 9b. In this data, three reflection signals are observed: P1 from the surface of the HDPE duct, P2 from the duct/void interface, and P3 from the void/grout interface. Given the THz A-scan resolution of 5.6 mm, the partial overlap of P2 and P3 suggests that the void thickness is less than 5.6 mm. The void thickness was estimated to be approximately 2.5 mm using the time delay difference (Δτ) between P2 and P3, according to the equation d = c·Δτ/2, where c is the speed of light. Due to the limited resolution and overlap between P2 and P3, their individual amplitudes could not be accurately determined. If P2 and P3 were fully resolved and their amplitudes were accurately determined, both the attenuation coefficient of the HDPE duct and the refractive index of the grout could be estimated. Specifically, the attenuation coefficient of the HDPE duct could be derived from the amplitude ratio of P2 to P1, along with the refractive index and thickness of the HDPE duct. Also, the refractive index of the grout could be estimated from the amplitude ratio of P3 to P2 and the refractive index of the HDPE duct.
As shown in Figure 11b, when P2 and P3 are not resolved in the THz A-scan data acquired from the void-containing region, the combined amplitude of P2 and P3 relative to P1 exceeds 100%. This is clearly distinguishable from the amplitude ratio of P2 to P1 in the void-free region, which is approximately 75%. When the void thickness is significantly smaller than the resolution and approaches zero, the measured THz A-scan data would become indistinguishable from that of the void-free region, making such voids difficult to detect. If the void thickness exceeds the A-scan resolution and P2 and P3 are fully resolved, the presence of P3 alone would be sufficient to identify the void-containing region [12]. These observations indicate that voids with a thickness of approximately 2.5 mm or greater can be detected using THz A-scan data obtained from the bridge tendon specimen. The likelihood of steel strand corrosion would increase with larger void thickness. Hence, the developed D-band THz A-scanner can be regarded as an effective tool for detecting voids beneath the HDPE duct in external bridge tendons.
4. Conclusions
We have successfully developed a D-band THz A-scanner based on the electronic FMCW technique for the nondestructive inspection of external bridge tendons. Operating in the 120–168 GHz frequency range, the system enables real-time acquisition of THz A-scan data with a spatial resolution of 5.6 mm. We demonstrated that the D-band THz A-scanner can effectively detect the presence of voids between the protective duct and the grout in external bridge tendons. It was indicated that voids with a thickness of approximately 2.5 mm or larger can be identified using THz A-scan measurements, although the precise detection limit remains to be clarified. Compared to the optoelectronic FMCW system reported in our previous study, the developed system offers significant advantages, including greater potential for miniaturization, cost-effective implementation, and enhanced robustness. Integrating the D-band THz A-scanner with automated C-scan equipment is expected to improve inspection coverage and speed, thereby facilitating comprehensive inspection of external bridge tendons.
Author Contributions
Conceptualization, D.-S.Y. and S.H.C.; data curation, D.-S.Y.; formal analysis, D.-S.Y.; funding acquisition, D.-S.Y.; investigation, D.-S.Y., J.S.Y. and S.H.C.; methodology, D.-S.Y. and J.S.Y.; project administration, D.-S.Y.; resources, D.-S.Y. and J.S.Y.; software, D.-S.Y.; supervision, D.-S.Y. and J.S.Y.; validation, D.-S.Y. and J.S.Y.; visualization, D.-S.Y.; writing—original draft, D.-S.Y.; writing—review and editing, D.-S.Y., J.S.Y. and S.H.C. All authors have read and agreed to the published version of the manuscript.
Funding
This research was supported by a project titled “Developing digital safety measurement to enhance the availability of smart structural monitoring of facilities”, funded by Korea Research Institute of Standards and Science (KRISS—2025—GP2025-0009).
Institutional Review Board Statement
Not applicable.
Informed Consent Statement
Not applicable.
Data Availability Statement
The raw data supporting the conclusions of this article will be made available by the authors upon request.
Acknowledgments
We used ChatGPT (GPT-4o and GPT-5) for English correction.
Conflicts of Interest
The authors declare no conflicts of interest.
References
- Hansen, B. Tendon failure raises questions about grout in posttensioned bridges. Civ. Eng. 2007, 77, 17–18. [Google Scholar]
- Taeby, M.; Mehrabi, A.B. Risk-based selection of inspection method for external post-tensioning system of bridges. Appl. Sci. 2022, 12, 7103. [Google Scholar] [CrossRef]
- Terzioglu, T.; Karthik, M.M.; Hurlebaus, S.; Hueste, M.B.D. Nondestructive evaluation of external post-tensioning systems to detect grout defects. J. Struct. Eng. 2019, 145, 05018002. [Google Scholar] [CrossRef]
- Martin, J.; Broughton, K.J.; Giannopolous, A.; Hardy, M.S.A.; Forde, M.C. Ultrasonic tomography of grouted duct post-tensioned reinforced concrete bridge beams. NDT E Int. 2001, 34, 107–113. [Google Scholar] [CrossRef]
- Angst, U.M. Challenges and opportunities in corrosion of steel in concrete. Mater. Struct. 2018, 51, 4. [Google Scholar] [CrossRef]
- FHWA. Post-Tensioning Tendon Installation and Grouting Manual; Federal Highway Administration: Washington, DC, USA, 2013; p. 61.
- Im, S.B.; Hurlebaus, S. Non-destructive testing methods to identify voids in external post-tensioned tendons. KSCE J. Civ. Eng. 2012, 16, 388–397. [Google Scholar] [CrossRef]
- Muldoon, R.; Chalker, A.; Forde, M.C.; Ohtsu, M.; Kunisue, F. Identifying voids in plastic ducts in post-tensioning prestressed concrete members by resonant frequency of impact–echo, SIBIE and tomography. Constr. Build. Mater. 2007, 21, 527–537. [Google Scholar] [CrossRef]
- Hurlebaus, S.; Hueste, M.B.D.; Karthik, M.M.; Terzioglu, T. Condition Assessment of Bridge Post-Tensioning and Stay Cable Systems Using NDE Methods; Transportation Research Board of the National Academies, Texas A&M Transportation Institute: College Station, TX, USA, 2016. [Google Scholar]
- Zhong, H.; Xu, J.; Xie, X.; Yuan, T.; Reightler, R.; Madaras, E.; Zhang, X.-C. Nondestructive defect identification with terahertz time-of-flight tomography. IEEE Sens. J. 2005, 5, 203–208. [Google Scholar] [CrossRef]
- Stoik, C.; Bohn, M.; Blackshire, J. Nondestructive evaluation of aircraft composites using reflective terahertz time domain spec-troscopy. NDT E Int. 2010, 43, 106–115. [Google Scholar] [CrossRef]
- Yee, D.-S.; Yahng, J.S.; Cho, S.H. Inspection for voids in the grout below the protective duct of an external post-tensioning bridge tendon using a THz A-scanner. Appl. Sci. 2023, 13, 12119. [Google Scholar] [CrossRef]
- Yee, D.-S.; Yahng, J.S.; Park, C.-S.; Lee, H.D.; Kim, C.-S. High-speed broadband frequency sweep of continuous-wave terahertz radiation. Opt. Express 2015, 23, 14806–14814. [Google Scholar] [CrossRef]
- Liebermeister, L.; Nellen, S.; Kohlhaas, R.; Breuer, S.; Schell, M.; Globisch, B. Ultra-fast, high-bandwidth coherent cw THz spectrometer for non-destructive testing. J. Infrared Millim. Terahertz Waves 2019, 40, 288–296. [Google Scholar] [CrossRef]
- Liebermeister, L.; Nellen, S.; Kohlhaas, R.B.; Lauck, S.; Deumer, M.; Breuer, S.; Schell, M.; Globisch, B. Optoelectronic frequency-modulated continuous-wave terahertz spectroscopy with 4 THz bandwidth. Nat. Commun. 2021, 12, 1071. [Google Scholar] [CrossRef]
- Yi, L.; Kaname, R.; Mizuno, R.; Li, Y.; Fujita, M.; Ito, H.; Nagatsuma, T. Ultra-wideband frequency modulated continuous wave photonic radar system for three-dimensional terahertz synthetic aperture radar imaging. J. Light. Technol. 2022, 40, 6719–6728. [Google Scholar] [CrossRef]
- Mohammadzadeh, S.; Keil, A.; Kocybik, M.; Schwenson, L.M.; Liebermeister, L.; Kohlhaas, R.; Globisch, B.; Freymann, G.; Seewig, J.; Friederich, F. Extreme ultra-wideband optoelectronic frequency-modulated continuous-wave terahertz radar. Laser Photonics Rev. 2023, 17, 2300396. [Google Scholar] [CrossRef]
- Jaeschke, T.; Bredendiek, C.; Küppers, S.; Pohl, N. High-precision D-band FMCW-radar sensor based on a wideband SiGe-transceiver MMIC. IEEE Trans. Microw. Theory Tech. 2014, 62, 3582–3597. [Google Scholar] [CrossRef]
- Zhang, X.; Chang, T.; Wang, Z.; Cui, H.-L. Three-dimensional terahertz continuous wave imaging radar for nondestructive testing. IEEE Access 2020, 8, 144259–144276. [Google Scholar] [CrossRef]
- Kueppers, S.; Jaeschke, T.; Pohl, N.; Barowski, J. Versatile 126–182 GHz UWB D-band FMCW radar for industrial and scientific applications. IEEE Sens. Lett. 2022, 6, 3500204. [Google Scholar] [CrossRef]
- Hansen, S.; Bredendiek, C.; Briese, G.; Froehly, A.; Herschel, R.; Pohl, N. A SiGe-chip-based D-band FMCW-radar sensor with 53-GHz tuning range for high resolution measurements in industrial applications. IEEE Trans. Microw. Theory Tech. 2022, 70, 719–731. [Google Scholar] [CrossRef]
- Carré, B.; Chopard, A.; Guillet, J.-P.; Fauquet, F.; Mounaix, P.; Gellie, P. Terahertz nondestructive testing with ultra-wideband FMCW radar. Sensors 2023, 23, 187. [Google Scholar] [CrossRef]
- Fauquet, F.; Galluzzi, F.; Chapoulie, R.; Mounier, A.; Amara, A.B.; Mounaix, P. Terahertz frequency-modulated continuous-wave inspection of an ancient enamel plate. Sensors 2025, 25, 2928. [Google Scholar] [CrossRef] [PubMed]
- Cooper, K.B.; Dengler, R.J.; Chattopadhyay, G.; Schlecht, E.; Gill, J.; Skalare, A.; Mehdi, I.; Siegel, P.H. A high-resolution imaging radar at 580 GHz. IEEE Microw. Wirel. Compon. Lett. 2008, 18, 64–66. [Google Scholar] [CrossRef]
- Cristofani, E.; Friederich, F.; Wohnsiedler, S.; Matheis, C.; Jonuscheit, J.; Vandewal, M.; Beigang, R. Nondestructive testing potential evaluation of a terahertz frequency-modulated continuous-wave imager for composite materials inspection. Opt. Eng. 2014, 53, 031211. [Google Scholar] [CrossRef]
- Zhou, Y.; Wang, T.; Dai, B.; Li, W.; Wang, W.; You, C.; Wang, K.; Liu, J.; Wang, S.; Yang, Z. High-precision terahertz frequency modulated continuous wave imaging method using continuous wavelet transform. Opt. Eng. 2018, 57, 023108. [Google Scholar] [CrossRef]
- Dandolo, C.L.K.; Guillet, J.P.; Ma, X.; Fauquet, F.; Roux, M.; Mounaix, P. Terahertz frequency modulated continuous wave imaging advanced data processing for art painting analysis. Opt. Express 2018, 26, 5358–5367. [Google Scholar] [CrossRef]
- Wong, T.M.; Kahl, M.; Bolívar, P.H.; Kolb, A. Computational image enhancement for frequency modulated continuous wave (FMCW) THz image. J. Infrared Millim. Terahertz Waves 2019, 40, 775–800. [Google Scholar] [CrossRef]
- Bauer, M.; Hussung, R.; Matheis, C.; Reichert, H.; Weichenberger, P.; Beck, J.; Matuschczyk, U.; Jonuscheit, J.; Friederich, F. Fast FMCW terahertz imaging for in-process defect detection in press sleeves for the paper industry and image evaluation with a machine learning approach. Sensors 2021, 21, 6569. [Google Scholar] [CrossRef]
- Xu, J.; Zhang, Z.; Yang, P.; Dong, L.; Zhao, Y. Nondestructive testing and 3D imaging of PE pipes using terahertz frequency-modulated continuous wave. Appl. Opt. 2022, 61, 10230–10239. [Google Scholar] [CrossRef]
- VNA Extender—VDI Model: WR6.5-VNAX. Available online: https://www.vadiodes.com/index.php/en/products/vector-network-analyzer?id=852 (accessed on 2 October 2025).
Disclaimer/Publisher’s Note: The statements, opinions and data contained in all publications are solely those of the individual author(s) and contributor(s) and not of MDPI and/or the editor(s). MDPI and/or the editor(s) disclaim responsibility for any injury to people or property resulting from any ideas, methods, instructions or products referred to in the content. |
© 2025 by the authors. Licensee MDPI, Basel, Switzerland. This article is an open access article distributed under the terms and conditions of the Creative Commons Attribution (CC BY) license (https://creativecommons.org/licenses/by/4.0/).