Featured Application
This coating-free optoacoustic focusing configuration is suited for contamination-sensitive biomedical applications that require sterile, localized pressure pulses. For example, the MHz-band, MPa-level pulses can be directed subdermally to microscopically shear fibrous septa (noninvasive acoustic subcision), an approach that has shown durable cellulite improvement in multicenter clinical studies using rapid acoustic pulses. Our method offers a similarly localized, contact-mediated acoustic action without shed coatings. The same focused field can trigger on-demand drug release from ultrasound-responsive carriers—e.g., thermosensitive liposomes in which clinical trials have demonstrated significant intratumoral drug enhancement, activated by acoustic waves in the MHz regime enabling subsurface therapy while limiting off-target exposure.
Abstract
We demonstrate coating-free optoacoustic generation and focusing of ultrasound using a mechanically Q-switched (MQS) erbium-doped yttrium aluminum garnet (Er:YAG) source (~100 ns, ≤20 mJ) combined with a concave water interface that simultaneously serves as converter and acoustic lens. Axial, lateral, and focal-point measurements mapped the pressure field while varying beam diameter (2w = 5–15 mm) and pulse energy (E = 10–20 mJ). The maximum focal positive pressure (Pmax = 7 MPa) occurs at an intermediate diameter (~10 mm), whereas the tightest lateral/axial confinement and strongest spectral enhancement arise at larger diameters (14–15 mm) with fc = ~5 MHz and −6 dB bandwidth up to 7 MHz. Pressure increases nearly monotonically with energy. For equal fluence, larger diameters yield higher focal pressures due to greater focusing gain. Small beams (2w ≈ 5–7 mm) show shorter apparent time-of-flight (TOF) and waveform broadening, consistent with early shock-like emission from locally vaporizing region. These results provide practical rules for tuning amplitude, spectrum, and confinement, enabling sub-millimeter focusing for contamination-sensitive and therapeutic applications.
1. Introduction
Ultrasonic techniques have widespread applications in biomedicine, industry, and scientific research. High-intensity focused ultrasound (HIFU) has been extensively utilized for therapeutic applications such as tumour ablation [1,2,3], lithotripsy [4] and sonothrombolysis [5] due to its ability to deliver localized mechanical and thermal effects. However, conventional HIFU transducers operate at low frequencies (a few MHz), resulting in relatively large focal zones (>2 mm laterally, >10 mm axially), which limit spatial precision and increase the risk of collateral damage to surrounding tissues. Additionally, achieving therapeutic pressure amplitudes at high frequencies (>10 MHz) is challenging due to acoustic attenuation and increased cavitation threshold. To address these limitations, laser-generated focused ultrasound (LGFU) has emerged as a high-precision alternative, offering significantly smaller focal spots (<100 µm), higher acoustic pressures (>50 MPa), and the ability to induce both pressure waves and controlled cavitation [6]. LGFU employs optoacoustic conversion, where a short-pulsed laser induces sudden thermal expansion in an absorbing material, generating high-frequency, high-amplitude ultrasound, enabling superior spatial accuracy compared to HIFU [7].
State-of-the-art LGFU systems predominantly rely on optoacoustic (OA) lenses incorporating an additional conversion layer for efficient ultrasound generation. This layer typically consists of composite materials, where an elastic matrix (usually polymer) is infused with optically absorptive carbon nanomaterials, such as carbon nanotubes (CNTs), reduced graphene oxide (rGO), graphene or similar nanostructures [8,9,10]. These absorptive layers are typically deposited onto a concave substrate that is transparent to the laser wavelength used, typically 1064 nm or 532 nm. Those photoacoustic transducers are photoexcited with a nanosecond laser relying on the thermoelastic effect, which leads to a photoacoustic conversion on the level of 10−3 at laser fluence often less than 100 mJ/cm2, and bandwidth ranking from 10 to 80 MHz.
Photoacoustic conversion efficiencies exceeding 10−2 are more typical of ablative than of thermoelastic regimes [9,11], despite the ablative regime’s lower central frequency and narrower bandwidth. To simplify fabrication and avoid the challenge of uniformly depositing an absorber layer on curved surfaces, alternative LGFU implementations have also been investigated. One such approach fabricates the ablative lens by cold-drawing titanium foil into a concave substrate and subsequently laser-processing it in water to form a hydrogenated titanium oxide (black-TiOx) light-absorbing layer. Nanosecond excitation at 400 mJ/cm2 produced 10 MPa focused pressure waves, sufficient to localize cavitation [7,12].
To improve adaptability, planar manufacturing techniques have been explored for producing OA transmitters as an alternative to processing concave surfaces. These methods eliminate the need for precisely moulded curved substrates by utilizing planar deposition and structuring techniques. One approach employs elastomeric moulding to create a flat yet deformable OA layer that allows real-time adaptation of the focal length [13]. Another method patterns a structured light-absorbing layer onto a flat substrate, forming a planar photoacoustic (PA) source capable of generating a focused acoustic field [14].
Many of these PA emitters operate over a broad range of laser fluences and have been employed in preclinical applications requiring high-pressure, MHz-range ultrasound, such as biological cell permeabilization [15,16], neurostimulation and ablation of soft tissue [17,18]. On the other hand, photoacoustic imaging systems for clinical and preclinical studies operate at low laser fluences, rely on sensitive detection systems and often employ wavelength-tunable lasers in the visible and near-infrared range [19,20]. Although photoacoustics is well established in biomedicine, generating therapeutic high-intensity ultrasound through direct light–soft-tissue interaction requires a dedicated device, which could broaden the applicability scope of photoacoustic therapy.
Here, we explore a novel approach utilizing a mechanically Q-switched (MQS) erbium-doped yttrium aluminum garnet (Er:YAG) laser (2940 nm—a wavelength highly absorptive in water), achieving OA conversion and focusing of high-intensity pressure wave within the target material, without an additional absorbing layer. While commercial Er:YAG lasers are already widely employed in dentistry for generating localized pressure waves, particularly for endodontic [21,22,23] and periodontal [24,25,26] pocket cleaning, where laser energy is delivered via fibre tips to generate localized pressure waves, their conventional long-pulsed operation (~100 μs) limits their ability to generate and focus high-intensity pressure waves. Instead, this approach relies on cavitation effects induced by tensile stress leading to the rupture of water rather than controlled ultrasound focusing.
Previous studies have demonstrated the generation of nanosecond Er:YAG pulses using both mechanical and electro-optical Q-switching techniques. Bizjak et al. [27] developed a robust mechanically Q-switched Er:YAG system using a rotating mirror, achieving 270 ns pulses suitable for water-mediated optodynamic studies. Additional efforts have since pushed the boundaries of Q-switched Er:YAG laser performance further. Notably, a mechanically Q-switched system achieved record output energy of 805 mJ with 61 ns pulse duration and peak power exceeding 13 MW [28], confirming the scalability and precision of mechanical Q-switching at 2.94 μm. Electro-optically Q switched Er:YAG lasers using LiNbO3 Pockels cells have also achieved sub-100 ns pulses with >1 MW peak powers [29,30], yet suffer from complexity and component limitations in this spectral range. Compared to these, mechanically Q-switched designs remain attractive for their simplicity, wavelength insensitivity, and lower cost.
This work explores the potential of Q-switched Er:YAG as a light source for the generation of focused pressure waves without the need for using additional intermediate light-absorber additive material. The strong absorption of 2.94 μm radiation in water enables localized energy deposition at the interface, while the nanosecond pulse duration ensures thermal confinement, limiting heat diffusion and minimizing collateral thermal damage to surrounding material. Building on this, we introduce a focusing concept that uses a concave boundary geometry that shapes the pressure source in a focusing configuration, offering high reproducibility and reducing fabrication complexity. Furthermore, we characterized the pressure fields as a function of input beam diameter and fluence, demonstrating controlled modulation of the pressure response, which achieved an intensity of 7 MPa at relatively lower fluence (20 mJ/cm2). These results establish a new framework for the generation of pressure waves without the usage of light-absorbing dopants and propose the mid-infrared laser source as a novel approach for photoacoustic therapies.
2. Materials and Methods
To investigate OA conversion and the pressure waveforms a dedicated mechanically Q-switched Er:YAG laser system was developed and used in the experimental setup along with an OA interaction stage, and a measurement system for recording pressure signals, which were analysed to assess the spatial confinement of the generated pressure waves (see Figure 1).
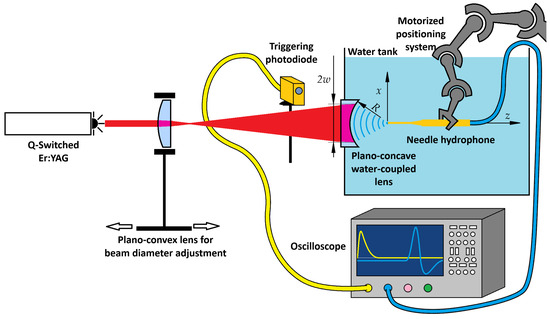
Figure 1.
Experimental setup for focused pressure wave generation and acquisition. The Q-switched Er:YAG laser beam passes through a plano-convex lens, which allows for adjustable beam diameter. Plano-concave water-coupled lens shapes a thin water layer into a spherical interface, enabling the generated optoacoustic pressure wave to focus. A photodetector monitors a back-reflection for triggering, while the water tank contains a needle hydrophone mounted on a collaborative robotic arm for three-dimensional scanning of the pressure field.
The OA interaction stage consisted solely of a plano-concave lens (Thorlabs LC4252, Ø25.4 mm, R = 13.8 mm, Thorlabs Inc., Newton, MA, USA) mounted with its concave surface facing the water, thereby shaping a stable spherical water interface that acted as both the OA conversion layer and the acoustic focusing element. UV-grade fused silica was chosen for its excellent surface quality, chemical robustness, and biocompatibility during prolonged water contact, and for its transparency in the visible spectrum. Although fused silica is not optimized for 2.94 µm, the ~3 mm thickness provided sufficient transmission of 70–80%, as measured with an energy meter (Ophir StarLab, PE50BF-DIF, Ophir Optronics Ltd., Jerusalem, Israel).
The acquisition of pressure waveforms was synchronised using a photodetector (Fotona, InAs Ser. No. 14000003, Fotona d.o.o., Ljubljana, Slovenia) positioned to detect a partially back-reflected laser pulse from the plano-concave lens. This signal served as a trigger for the oscilloscope, ensuring consistent temporal alignment of measurements. The pulse energy was measured with the energy meter for each laser setting used in the experiments. A needle hydrophone (Precision Acoustics Ltd., Dorchester, UK, model NH0200) was mounted on a collaborative robotic arm (Universal Robots, Odense, Denmark, UR5), which enabled precise positioning in the x, y, and z directions within the pressure field. Time-domain signals were recorded at multiple spatial locations, and the peak pressures from each trace were compiled to reconstruct the three-dimensional distribution of the focused pressure wave.
2.1. Development of the Q-Switched Er:YAG Laser System
To achieve nanosecond pulse operation, a commercially available Er:YAG laser system, Fotona Fidelis, originally operating in free-running mode, was modified with a mechanical Q-switching mechanism utilizing a motor-driven spinning high-reflective (HR) back mirror, reaching speeds up to 200 Hz.
To ensure precise timing of flashlamp triggering, a microcontroller-based control unit (ATmega328-PU, Atmel, Atmel Corporation, San Jose, CA, USA) monitored the angular position of the rotating mirror using a red laser pointer directed at the mirror, with its reflection detected by a photodiode (PDB-C154SM, Advanced Photonix, Camarillo, CA, USA), generating a signal upon each pass. By tracking the interval between successive detections, the controller calculated the mirror’s rotational speed. Using this data along with the set pumping duration, it determined the flashlamp triggering time, ensuring precise synchronization with the mirror alignment. The schematic representation of the system’s design and synchronization process is shown in Figure 2.
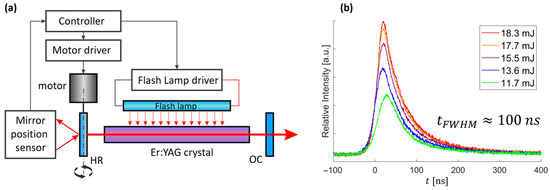
Figure 2.
Mechanically Q-switched (MQS) Er:YAG laser system. (a) Schematic of the laser setup, illustrating the synchronized triggering of the flashlamp based on a mirror position sensor composed of a laser pointer and a photodiode. The controller processes this signal to precisely activate flashlamp according to the motor’s rotational speed. The high-reflective (HR) mirror mounted on the rotating motor permits lasing of the Er:YAG crystal only when HR is aligned with the output coupler (OC). The rotational axis and arrows indicate the mirror’s motion. (b) Temporal profiles of MQS Er:YAG pulses (~100 ns FWHM) recorded at several output energies, illustrating the evolution of pulse characteristics with increasing energy.
The developed system allowed the setting of laser operation parameters, specifically flashlamp voltage and exposure duration, rotational speed of the motorized mirror, and pulse repetition rate, enabling precise tuning of the laser output characteristics, namely pulse energy, duration and mode structure. This configuration produced stable, short pulses with durations on the order of ~100 ns and a near-Gaussian temporal profile, as shown in Figure 2b. These example pulses were generated using a 500 V flashlamp voltage with a 540 µs pumping duration, triggered with a pre-delay of 540 µs relative to the optimal mirror alignment. With the HR mirror operated at 200 Hz, we tuned the pulse energy by adjusting the repetition rate between 1.36 Hz and 1.54 Hz. At 1.36 Hz the output energy was 10 mJ, rising to 20 mJ at 1.54 Hz, with an approximately linear trend in between due to increasing thermal lensing at higher energy. Above 1.54 Hz the pulse developed a non-repeatable, multi-peak temporal structure, whereas below 1.36 Hz the source became unstable and did not lase reliably. Pulses within the 1.36–1.54 Hz window were used as the source for all subsequent pressure-wave measurements. The flashlamp was driven by ~60 J of electrical energy per discharge (500 µF at 500 V), corresponding to an average input power of ~90 W at a 1.5 Hz repetition rate. The beam quality was estimated to be close to M2 ≈ 1, as assessed using thermosensitive-paper imprints. All subsequent pressure-wave generation and focusing experiments used the stable pulses generated under these conditions.
2.2. Generation, Focusing and Characterization of the Pressure Waves
The developed mechanically Q-switched Er:YAG laser system was employed for the generation of focused pressure waves on the experimental setup as shown in Figure 1. The Q-switched Er:YAG laser beam output was directed through a plano-convex lens, allowing for controlled adjustment of the beam diameter at the location of the plano-concave water-coupled lens. This configuration established a spherically concave OA water layer at the interface, leading to the formation of a focused pressure wave. The resulting pressure wave propagated through the water medium, with their characteristics influenced by the laser fluence, beam diameter, and optical focusing geometry. The pressure field was measured by scanning the needle hydrophone in both the axial z and lateral x directions to capture pressure signal variations with respect to the beam diameter (2w, 1/e2 intensity diameter). The focal position was defined as the origin of the coordinate system (see Figure 1). Time-domain waveforms were acquired at each position, allowing for quantitative characterization of the compression and rarefaction phases of the optoacoustic pressure waves.
The primary amplitude-based metrics were defined as the positive peak pressure (maximum compressional amplitude) and the negative peak pressure (minimum rarefactional amplitude) of each recorded waveform (see Figure 3a). These quantities provide direct information about the strength and asymmetry of the generated pressure transients.
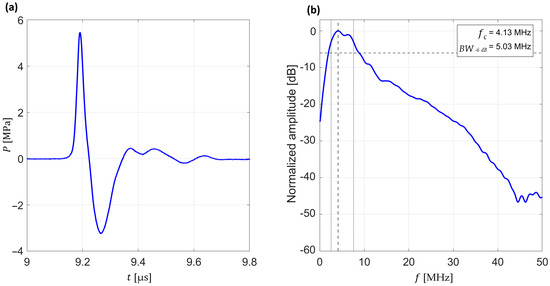
Figure 3.
Typical measurement of a generated pressure waveform and its frequency-domain spectrum. (a) Typical time-domain pressure waveform acquired with a needle hydrophone, showing the compression (positive peak pressure) and rarefaction (negative peak pressure) phases of the wave. (b) Frequency-domain spectrum obtained by Fast Fourier Transform (FFT) of the same waveform, normalized to the maximum amplitude and expressed in decibels (dB), with extracted central frequency (fc) and −6 dB bandwidth (BW−6 dB). Dashed horizontal line indicates the −6 dB level, whereas dashed vertical line indicates the central frequency.
To further assess the frequency content of the pressure waves, each waveform was transformed into the frequency domain by applying a Fast Fourier Transform (FFT). From these spectra, the central frequency (fc) and bandwidth at −6 dB relative to the peak spectral amplitude (BW−6 dB) were determined (see Figure 3b). These spectral metrics characterize the frequency distribution and effective bandwidth of the generated pressure waves, enabling comparisons across different excitation and focusing conditions.
2.3. Signal Processing and Data Analysis
At each measurement point, 50 consecutive pressure waveforms were averaged directly on the oscilloscope to reduce noise and ensure repeatability. This averaging procedure yielded a standard deviation of less than 0.2 MPa in the extracted peak pressures, confirming stable acquisition conditions.
For frequency-domain analysis, the time-windowed signals were transformed using a one-sided Fast Fourier Transform (FFT). The analysis window encompassed the entire pressure transient, including the compressional and rarefactional phases as well as the subsequent return to baseline, as illustrated in Figure 3. When axial scans were evaluated, the temporal window was shifted according to the expected propagation delay, assuming a sound speed of 1500 m/s, which was verified experimentally as seen in Figure 4.
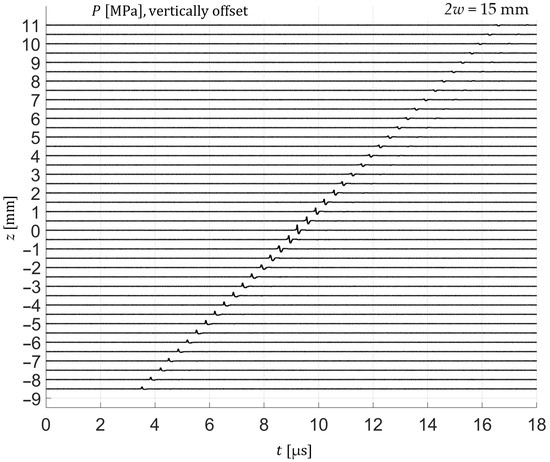
Figure 4.
Axial stack of time-windowed pressure waveforms (2w = 15 mm), acquired with a needle hydrophone at successive axial positions (z). The systematic propagation delay of the wavefront with increasing z confirms the expected sound speed in water and illustrates the axial evolution of the focused pressure wave.
Zero-padding up to 106 points was applied in order to increase frequency resolution in the FFT, allowing precise determination of spectral characteristics. From the normalized spectra, the central frequency (fc) was identified as the frequency at maximum amplitude. The BW−6 dB was obtained by linear interpolation between spectral points at which the normalized amplitude crossed the corresponding thresholds. This procedure ensured robust and reproducible estimation, even when spectral sampling points did not exactly coincide with the threshold crossings.
This processing routine was applied identically to all measurement positions. The resulting amplitude- and frequency-domain parameters were subsequently compiled into spatial maps of the pressure field, enabling systematic evaluation of wave focusing performance.
3. Results
The resulting dataset provided a comprehensive characterization of the pressure field structure, allowing optimization of laser parameters for improved pressure wave focusing and biomedical applicability. Axial and lateral characterizations were performed at the maximum available pulse energy (~20 mJ), whereas focal-point dynamics were investigated under systematically varied pulse energies.
3.1. Axial Characterization
The axial evolution of the pressure field is summarized in Figure 5, which shows the dependence of positive and negative peak pressures on axial position and beam diameter. The maps reveal that the compressional peak Pmax is maximized for an intermediate diameter (2w ≈ 10 mm), where it reaches 7 MPa. In contrast, the rarefactional peak Pmin reaches its largest magnitude −4 MPa already at the smallest diameter (2w = 5 mm). At small diameters (2w ≤ 8 mm), focusing is weak, the positive pressure decreases monotonically with distance, and no well-defined focal region is formed. In contrast, for larger diameters (2w ≥ 12 mm), the pressure distribution narrows, resulting in stronger axial confinement of the pressure field and enhanced positive peak amplitudes at the focal plane.
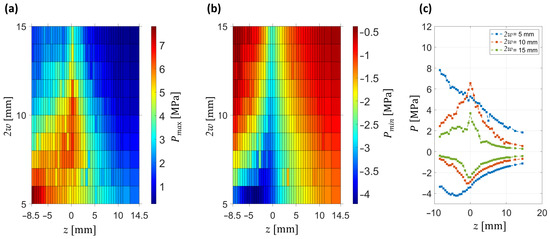
Figure 5.
Axial characterization of the pressure field for different beam diameters (2w). Geometrical focus is located at z = 0 mm. (a) Spatial map of peak positive pressures (Pmax) as a function of axial position z. (b) Spatial map of peak negative pressures (Pmin) under the same conditions. (c) Representative axial profiles of both positive and negative pressures at selected diameters (2w = 5, 10, and 15 mm).
Figure 5c illustrates representative axial profiles of both positive and negative pressures. For small beam diameters, the negative peak pressure occurs before the geometrical focus, with this pre-focal shift becoming more pronounced as 2w decreases. By comparison, the positive peak pressure dominates the response near the focal plane for intermediate-to-large diameters, where it exhibits the strongest enhancement.
The frequency-domain analysis is summarized in Figure 6. The maps of central frequency and −6 dB bandwidth show that both parameters exhibit a pronounced enhancement around the focal plane for intermediate-to-large beam diameters. In particular, the central frequency increases locally up to 5 MHz near focus, while remaining closer to 3.5–4 MHz away from it. The bandwidth follows a similar trend, reaching values above 6 MHz in the focal region, compared to only 4 MHz in defocused conditions.
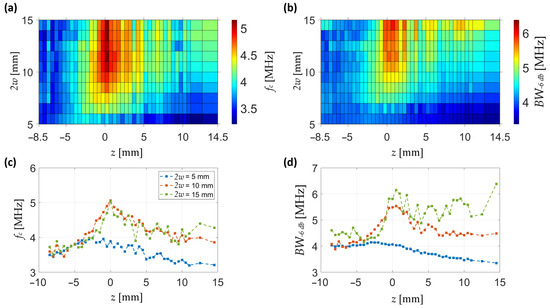
Figure 6.
Frequency-domain characterization of the pressure field. (a) Spatial map of central frequency as a function of axial position and beam diameter. (b) Spatial map of bandwidth at −6 dB under the same conditions. (c) Axial profiles of central frequency at selected beam diameters (2w = 5, 10, 15 mm). (d) Axial profiles of −6 dB bandwidth at the same beam diameters. Subfigures (c,d) share the same legend.
Axial profiles at selected diameters (Figure 6c,d) illustrate these behaviours more clearly. For small beams (2w = 5 mm), both the central frequency and bandwidth remain low and nearly flat across z, indicating poor spectral confinement. At 2w = 10 mm, a sharp rise in both parameters is observed around z = 0, consistent with strong focusing and enhanced frequency content. At larger diameters (2w = 15 mm), the enhancement is still present but broader and less pronounced, reflecting a wider but weaker focusing effect.
Together, these results demonstrate that spectral enhancement of the pressure wave is maximized near the pressure focus, with optimal conditions observed for intermediate beam diameters.
3.2. Lateral Characterization
Alongside the axial measurements, the lateral evolution of the pressure field was evaluated across the focal plane, providing insight into the transverse confinement of both positive and negative pressure components as well as the corresponding frequency-domain characteristics.
Lateral characterization of the pressure field, shown in Figure 7, reveals systematic narrowing of the pressure distributions with increasing beam diameter. At small diameters (2w = 5 mm), both positive and negative pressures are broadly distributed, indicating poor lateral focusing. With increasing diameter, the lateral width decreases and peak pressures rise, with the strongest confinement observed for 2w ≈ 10 mm.
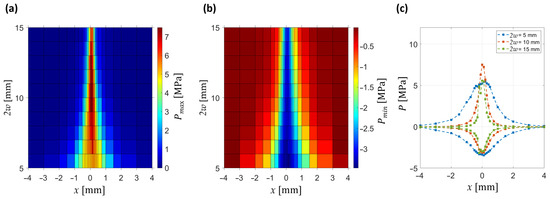
Figure 7.
Peak positive and negative pressures as a function of lateral position x and beam diameter. Focus point is located at x = 0 mm. (a) Spatial map of positive peak pressures (Pmax). (b) Spatial map of negative peak pressures (Pmin). (c) Lateral profiles of both positive and negative pressures at selected beam diameters (2w = 5, 10, 15 mm).
Figure 7c illustrates representative lateral profiles of both positive and negative pressures. At 2w = 5 mm, both profiles are broad and of low amplitude, whereas at 2w = 10 mm they become significantly narrower and the focal positive peak reaches 7 MPa at x = 0, z = 0 (consistent with the axial analysis in Figure 5). At the same location, the rarefactional peak reaches −3.5 MPa. At the largest diameter (2w = 15 mm), the profiles remain narrow, but the amplitude no longer increases further, with positive pressures still dominating over the negative ones. These observations confirm that lateral focusing improves systematically with increasing beam diameter, while the strongest amplitude enhancement is achieved at intermediate values (2w ≈ 10 mm).
The frequency-domain characterization of the lateral pressure distribution is summarized in Figure 8. The maps show that both the central frequency and the −6 dB bandwidth exhibit a clear lateral confinement that becomes stronger with increasing beam diameter. At 2w = 5 mm, central frequency remains low (<2 MHz) and broadly distributed, accompanied by a bandwidth of only 2–3 MHz, consistent with poor focusing. In contrast, at intermediate and larger diameters (2w ≥ 10 mm), the central frequency rises above 5 MHz and the bandwidth expands beyond 6 MHz, both sharply localized around the focal axis.
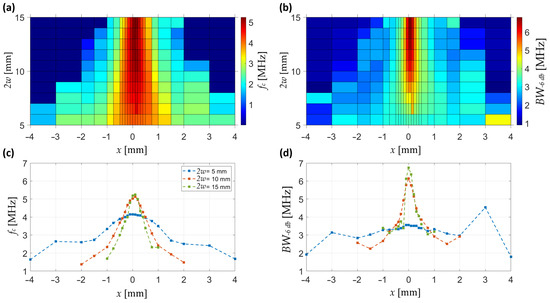
Figure 8.
Frequency-domain characterization of the pressure field. (a) Spatial map of central frequency as a function of lateral position x and beam diameter. (b) Spatial map of bandwidth at −6 dB under the same conditions. (c) Lateral profiles of central frequency at selected beam diameters (2w = 5, 10, 15 mm). (d) Lateral profiles of −6 dB bandwidth at the same beam diameters. Subfigures (c,d) share the same legend.
Figure 8c,d show representative lateral profiles. For small beams (2w = 5 mm), the profiles are flat and extended, reflecting limited spectral confinement, whereas with increasing diameter the central frequency and bandwidth both rise and sharpen laterally, reaching their highest values and narrowest distributions at 2w = 15 mm, which indicates the most efficient spectral focusing.
Together, these results demonstrate that the lateral spectral properties of the pressure wave are maximized near the focal axis, with optimal enhancement obtained for intermediate-to-large beam diameters.
3.3. Focal Point Dynamics
The final part of the analysis focuses on the acoustic focal point, where the pressure waveforms, spectral characteristics, and scaling with laser energy and fluence were examined. This approach highlights how the choice of beam diameter influences both intensity and frequency-domain of the signal.
Analysis of pressure wave signals at the focal point reveals that for small beam diameters the pressure transients arrive earlier. This trend is quantified in Figure 9b, where the time-of-flight (TOF) noticeably increases with beam diameter.
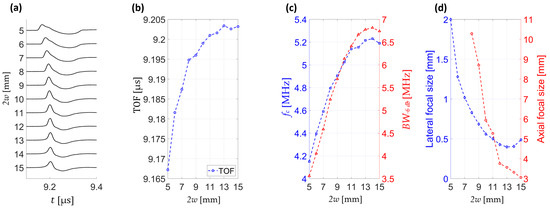
Figure 9.
Analysis of pressure wave signals at the acoustic focus (x = 0, z = 0). (a) Pressure waveforms for different beam diameters (2w = 5–15 mm), vertically offset for clarity. (b) Time-of-flight (TOF) of the pressure wave as a function of beam diameter. (c) Central frequency (fc) and −6 dB bandwidth (BW−6 dB) versus beam diameter. (d) Lateral and axial pressure focal size, expressed as full width at half maximum (FWHM) as a function of beam diameter.
Figure 9c demonstrates a systematic rise in both central frequency and −6 dB bandwidth with increasing diameter, reflecting stronger spatiotemporal focusing. Notably, both parameters reach their maximum values around 2w ≈ 14 mm, suggesting an optimal regime for spectral enhancement. Figure 9d summarizes the dependence of focal dimensions on beam diameter, showing progressive reduction in both lateral and axial extent. The smallest focal sizes are observed at large diameters, confirming that larger acoustic apertures focus better and yield superior confinement.
Figure 10a illustrates that the generated pressures continue to rise with increasing pulse energy, without clear saturation reached within the explored range, indicating that the maximum achievable amplitudes are still energy-limited. This trend is also reflected in Figure 10b, where the fluence-dependent curves remain upward-sloping. At the same time, the pressure–fluence curves exhibit a non-zero intercept, indicating that the scaling is not purely linear with fluence and suggesting an additional contribution from vaporization processes.
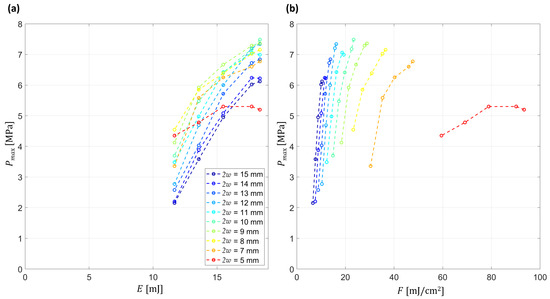
Figure 10.
Energy and fluence dependence of peak pressure amplitude (Pmax) for different beam diameters (2w = 5–15 mm). (a) Pmax as a function of pulse energy (E). (b) Pmax as a function of average fluence (F) across the illuminated area. Energies and fluences are referenced to the laser output before the lens. Due to the transmission of the fused-silica lens at 2.94 μm, the actual energy delivered to the water interface is 70–80% of these values, while the peak fluence at the beam center is 140–160% of the average values (F). Subfigures (a,b) share the same legend.
Comparison across beam diameters further reveals that, for equal fluence, larger diameters consistently produce stronger pressure waves. This effect arises from the increased focal confinement for larger beams. Together, these observations confirm that both energy scaling and beam geometry play key roles in determining the efficiency and regime of optoacoustic wave propagation.
4. Discussion
Using a Q-switched Er:YAG source at 2.94 µm with a spherically concave water interface enables generation and focusing in the target material without a dedicated absorber layer. This avoids coating complexity while maintaining strong absorption and thermal confinement in water on the 100 ns timescale.
A consistent picture emerges across axial, lateral and focal-point analyses (Figure 5, Figure 6, Figure 7, Figure 8 and Figure 9). Peak positive pressure is maximized for an intermediate beam diameter (~10 mm), whereas the strongest frequency-domain enhancement and the tightest lateral and axial focal confinement occur at larger diameters (between 14–15 mm). Increasing 2w enlarges the effective acoustic aperture and focusing gain [31], narrowing the focal region and boosting in-focus frequency consistent with lens-based LGFU reports showing higher central frequency and broader bandwidth when the effective aperture is increased [12]. Although increasing the beam diameter improves bandwidth and spatial confinement, it reduces the deposited laser fluence decreases which in turn also reduces the pressure amplitude. This trade-off between acoustic gain and beam diameter, at constant laser energy, could be overcome by employing a Q-switched Er:YAG delivering higher-energy pulses, thereby improving the operative condition. Beam diameter also sets the acoustic field configuration, transitioning from a focused source at diameters ≥ 8 mm to quasi-unfocused, distance-attenuated propagation at smaller diameters (Figure 5c). This trend can be attributed to the dependence of acoustic gain on the f-number of the lens [31].
For the smallest beams (2w ≈ 5–7 mm) the focal TOF is shorter, indicating faster initial propagation at higher laser fluence. Consistent with the onset of local water vaporization at higher fluence, an initially shock-like compressive front is launched from the central region, shortening the focal TOF, whereas thermoelastic peripheral regions add later-arriving components that broaden the focal pressure waveform and reduce the bandwidth [32].
Figure 10a,b show the peak pressure that rises across the explored energy range with no clear saturation, and pressure–fluence curves retain an upward slope. The pressure amplitude and the propagating regime can be switched by varying the laser energy and also the diameter of the beam. This is shown in Figure 10a and is clearly visible in Figure 5a, where above 8 mm beam diameter the acoustic field is focused and below 8 mm the intensity of the pressure decreases with distance. In the focal plane, for equivalent laser energy the decreasing diameter leads to a reduced pressure due to the absence of acoustic gain. On the other hand, increasing beam diameter widens the effective aperture at the lens–water interface, producing a focused acoustic field. The observed decrease in focal pressure at larger beam diameters (2w > 12 mm) arises from two concurrent effects: (i) the reduction in laser fluence and (ii) increased transmission losses caused by the longer optical path through the plano-concave fused-silica lens, which is thicker toward the periphery. Alternative IR materials (e.g., CaF2/MgF2, ZnSe, sapphire) were considered; however, CaF2 and MgF2 are chemically vulnerable in prolonged water contact, ZnSe raises biocompatibility concerns, and sapphire would require custom fabrication. For these reasons, fused silica was chosen for the present study. Nevertheless, future substitution with an IR-optimized substrate (e.g., sapphire or protected fluoride) could increase transmission while preserving the same focusing concept.
Figure 10b derives from the same dataset as Figure 10a, but with the abscissa converted to fluence. This representation makes the transition from a focused regime (larger diameters) to quasi-unfocused and, ultimately, to distance-attenuated behaviour (smaller diameters) evident.
In quantitative terms, our experiments reached fluences up to ~80 mJ/cm2 (average across the beam cross section), corresponding to ~160 mJ/cm2 at the beam center (Figure 10b). These values are close to or slightly above the ~100 mJ/cm2 vaporization threshold reported in the literature [33], suggesting that localized vaporization may contribute under these conditions, although a definitive separation from thermoelastic effects will require direct measurements in future studies.
Similar behaviour has been reported for laser-excited nanodroplets, which exhibit volume changes up to two orders of magnitude larger than those expected from purely thermoelastic expansion [34]. The transition depends on laser fluence, the optical absorption of water, and the efficiency of optical-to-thermal conversion with associated heat deposition in the liquid. In droplets, increasing fluence produces a discontinuity in the pressure–fluence curve with superlinear growth of peak pressure, indicating that local heating is sufficient to trigger vaporization [32]. Two practical constraints bounded our parameter space. At small beam diameters the fluence drove the system into strong ablative regime damaging the lens at 2w = 4 mm, which limited the high fluence end. A separate constraint was the available pulse energy. The laser source could deliver at most 20 mJ per pulse and was unstable below about 10 mJ. As a result, the pressure versus fluence curves end while still rising.
These trends suggest a simple tuning strategy: choose ~10 mm when maximizing pressure amplitude is key, and choose ~14–15 mm when spatial selectivity and spectral frequency components are paramount. The ability to modulate focusing behaviour by 2w alone without changing hardware makes the approach attractive wherever flexibility and rapid reconfiguration are desired. Moreover, modification of the output beam diameter is a common practise already adopted in many dermatological medical treatments and implemented in most industrial medical lasers.
The frequency bandwidth recorded with this system, ~7 MHz, is close to the inverse of the laser pulse (100 ns), demonstrating that an optimization of the system by compressing the laser pulse width could lead to higher-frequency components, beside the high-pressure wave.
With respect to cavitation safety, our peak rarefactional pressure reached −3.5 MPa, which is well below the cavitation threshold in water (−25 MPa) [35]. However, cavitation thresholds in biological tissues can be considerably lower [36]. Under our conditions, the mechanical index (MI) was 1.75, which remains below the FDA diagnostic ultrasound limit of 1.9 but exceeds the 0.3 level generally considered cavitation-free, indicating that cavitation in vivo cannot be excluded [37].
The coating-free, water-interface focusing concept is well suited for contamination-sensitive biomedical applications. Two representative examples include (i) subdermal, contact-mediated acoustic subcision [38], where MHz-band, MPa-level, sub-millimetre foci enable localized shearing of fibrous septa while sparing overlying tissue, and (ii) on-demand drug release from ultrasound-responsive carriers (e.g., thermosensitive liposomes) [39], where the ~5 MHz center frequency and 0.35–0.5 mm lateral FWHM support subsurface activation with minimal off-target exposure.
In comparison, LGFU systems that employ optimized absorber coatings can achieve high optical-to-acoustic conversion efficiency, often yielding broader bandwidths and higher peak pressures [9,10,40]. In our coating-free design, the center frequency is somewhat lower; however, the data in Figure 10 indicate that with higher available pulse energies, comparable pressure levels could be attained. Regarding system complexity, the absence of an additional absorbing layer represents a significant simplification, reducing fabrication steps, stability concerns, and sterilization challenges. Excluding the absorber coating also eliminates issues related to coating degradation. Finally, this simplification translates into improved cost-effectiveness and greater practical flexibility, particularly in biomedical applications where sterility, reproducibility, and rapid reconfiguration are essential. Overall, while coating-based LGFU retains an advantage in conversion efficiency, the present coating-free, water-interface approach provides a robust and streamlined alternative that prioritizes simplicity and adaptability without compromising the ability to reach therapeutically relevant pressure and frequency regimes.
5. Conclusions
We implemented a mechanically Q-switched Er:YAG laser (~100 ns, up to ~20 mJ) which, when combined with a concave water interface, enables coating-free optoacoustic generation of focused ultrasound. Performance was investigated versus pulse energy and beam diameter in the context of potential medical applications.
Comprehensive axial, lateral and focal-point measurements showed that the largest focal positive pressure Pmax = 7 MPa occurs at an intermediate beam diameter of ~10 mm, whereas the smallest focal dimensions and strongest spectral enhancement, due to spatial-temporal confinement, are achieved for larger diameters in the range of 14–15 mm (lateral FWHM 0.35–0.5 mm, axial FWHM 3–4 mm, fc ≈ 5 MHz; BW−6 dB up to 6–7 MHz). Peak pressures increased nearly monotonically across the explored energy range, and pressure-fluence curves exhibited a non-zero intercept, consistent with a minor vaporization-driven contribution at higher local fluence. For equal fluence, larger diameters produced higher focal pressures, reflecting the gain of a larger acoustic aperture. These results show the potential of combining an Er:YAG laser and optoacoustic properties, and provide essential information for tuning the photoacoustic wave amplitude, the spectral frequency bandwidth and the propagating regime. This approach enables sub-millimetre focusing and it is a promising basis for medical laser treatment and contamination-sensitive biomedical uses. Future studies are needed to quantify cavitation thresholds and safety margins and to assess translation to tissue-relevant conditions.
Author Contributions
Conceptualization, D.Š., A.B., D.V. and M.J.; methodology, D.Š., A.B., D.V. and M.J.; software, D.Š.; validation, D.V. and M.J.; formal analysis, D.Š., A.B., D.V. and M.J.; investigation, D.Š.; resources, M.J.; data curation, D.Š.; writing—original draft preparation, D.Š.; writing—review and editing, D.V. and M.J.; supervision, M.J.; project administration, M.J.; funding acquisition, M.J. All authors have read and agreed to the published version of the manuscript.
Funding
The work was supported by the Slovenian Research and Innovation Agency (ARIS) (research project, J7-50094), national program (Grant Nr. P2-0392), and within the framework of the GREENTECH project, co-financed by the European Union–NextGenerationEU.
Data Availability Statement
The original contributions presented in this study are included in the article. Further inquiries can be directed to the corresponding author.
Acknowledgments
The authors acknowledge Fotona d.o.o. for providing the Er:YAG Fidelis laser system, which was upgraded with a mechanical quality switch, enabling this research.
Conflicts of Interest
The authors declare no conflicts of interest.
Abbreviations
The following abbreviations are used in this manuscript:
| OA | Optoacoustic (photoacoustic) |
| FWHM | Full width at half maximum |
| TOF | Time-of-flight |
| HIFU | High-intensity focused ultrasound |
| LGFU | Laser-generated focused ultrasound |
| HR | High-reflectivity (high-reflector) mirror |
| OC | Output coupler |
| MQS | Mechanically Q-switched |
| FFT | Fast Fourier transform |
References
- Zhou, Y.-F. High intensity focused ultrasound in clinical tumor ablation. World J. Clin. Oncol. 2011, 2, 8. [Google Scholar] [CrossRef]
- Kennedy, J.E. High-intensity focused ultrasound in the treatment of solid tumours. Nat. Rev. Cancer 2005, 5, 321–327. [Google Scholar] [CrossRef] [PubMed]
- Dubinsky, T.J.; Cuevas, C.; Dighe, M.K.; Kolokythas, O.; Hwang, J.H. High-Intensity Focused Ultrasound: Current Potential and Oncologic Applications. Am. J. Roentgenol. 2008, 190, 191–199. [Google Scholar] [CrossRef]
- Yoshizawa, S.; Ikeda, T.; Ito, A.; Ota, R.; Takagi, S.; Matsumoto, Y. High intensity focused ultrasound lithotripsy with cavitating microbubbles. Med. Biol. Eng. Comput. 2009, 47, 851–860. [Google Scholar] [CrossRef]
- Guo, S.; Ya, Z.; Wu, P.; Zhang, L.; Wan, M. Enhanced Sonothrombolysis Induced by High-Intensity Focused Acoustic Vortex. Ultrasound Med. Biol. 2022, 48, 1907–1917. [Google Scholar] [CrossRef] [PubMed]
- Baac, H.W.; Frampton, J.; Ok, J.G.; Takayama, S.; Guo, L.J. Localized micro-scale disruption of cells using laser-generated focused ultrasound. J. Biophotonics 2013, 6, 905–910. [Google Scholar] [CrossRef]
- Muc, B.T.; Vella, D.; Lukač, N.; Kos, M.; Jezeršek, M. Generation of a focused pressure wave and localized cavitation clouds using a metal-semiconductor Ti/black-TiOx optoacoustic lens. Results Phys. 2021, 20, 103721. [Google Scholar] [CrossRef]
- Vella, D.; Vengust, D.; Umek, P.; Rezaei, A.; Jezeršek, M.; Mrzel, A. Efficient decoration of graphene oxide with a narrow size distribution of noble metal nanoparticles: Green reduction and integration into a thermoelastic composite. Synth. Met. 2025, 313, 117894. [Google Scholar] [CrossRef]
- Vella, D.; Pereira, D.A.; Mrzel, A.; Vengust, D.; Drnovšek, A.; Arnaut, L.G.; Serpa, C.; Jezeršek, M. Picosecond photoacoustic generation of ultrasounds with composites of graphene-decorated gold nanoparticles. Nano Energy 2024, 131, 110236. [Google Scholar] [CrossRef]
- Vella, D.; Mrzel, A.; Drnovšek, A.; Shvalya, V.; Jezeršek, M. Ultrasonic photoacoustic emitter of graphene-nanocomposites film on a flexible substrate. Photoacoustics 2022, 28, 100413. [Google Scholar] [CrossRef]
- Doukas, A.G.; Kollias, N. Transdermal drug delivery with a pressure wave. Adv. Drug Deliv. Rev. 2004, 56, 559–579. [Google Scholar] [CrossRef] [PubMed]
- Muc, B.T.; Vella, D.; Lukač, N.; Kos, M.; Jezeršek, M. Amplification of high-intensity pressure waves and cavitation in water using a multi-pulsed laser excitation and black-TiOx optoacoustic lens. Biomed. Opt. Express 2022, 13, 3993–4006. [Google Scholar] [CrossRef]
- Li, Q.; Li, J.; Zhu, H.; Chen, Y.; Zhu, B.; Yu, H. Dynamic acoustic focusing in photoacoustic transmitter. Photoacoustics 2021, 21, 100224. [Google Scholar] [CrossRef] [PubMed]
- Chen, Y.; Wang, Y.; Hu, J.; Lv, T.; Yu, H. Fully planar laser-generated focused ultrasound transmitter. Sens. Actuators Phys. 2023, 349, 113929. [Google Scholar] [CrossRef]
- Pereira, D.A.; Silva, A.D.; Martins, P.A.T.; Piedade, A.P.; Martynowych, D.; Veysset, D.; Moreno, M.J.; Serpa, C.; Nelson, K.A.; Arnaut, L.G. Imaging of photoacoustic-mediated permeabilization of giant unilamellar vesicles (GUVs). Sci. Rep. 2021, 11, 2775. [Google Scholar] [CrossRef]
- Silva, A.D.; Serpa, C.; Arnaut, L.G. Photoacoustic transfection of DNA encoding GFP. Sci. Rep. 2019, 9, 2553. [Google Scholar] [CrossRef]
- Shi, L.; Jiang, Y.; Fernandez, F.R.; Chen, G.; Lan, L.; Man, H.-Y.; White, J.A.; Cheng, J.-X.; Yang, C. Non-genetic photoacoustic stimulation of single neurons by a tapered fiber optoacoustic emitter. Light Sci. Appl. 2021, 10, 143. [Google Scholar] [CrossRef] [PubMed]
- Lee, T.; Luo, W.; Li, Q.; Demirci, H.; Guo, L.J. Laser-Induced Focused Ultrasound for Cavitation Treatment: Toward High-Precision Invisible Sonic Scalpel. Small 2017, 13, 1701555. [Google Scholar] [CrossRef]
- Wang, L.V.; Yao, J. A practical guide to photoacoustic tomography in the life sciences. Nat. Methods 2016, 13, 627–638. [Google Scholar] [CrossRef]
- Wissmeyer, G.; Pleitez, M.A.; Rosenthal, A.; Ntziachristos, V. Looking at sound: Optoacoustics with all-optical ultrasound detection. Light Sci. Appl. 2018, 7, 53. [Google Scholar] [CrossRef]
- Jezeršek, M.; Lukač, N.; Lukač, M. Measurement of Simulated Debris Removal Rates in an Artificial Root Canal to Optimize Laser—Activated Irrigation Parameters. Lasers Surg. Med. 2021, 53, 411–417. [Google Scholar] [CrossRef] [PubMed]
- Jezeršek, M.; Lukač, N.; Lukač, M.; Tenyi, A.; Olivi, G.; Fidler, A. Measurement of Pressures Generated in Root Canal During Er:YAG Laser-Activated Irrigation. Photobiomodul. Photomed. Laser Surg. 2020, 38, 625–631. [Google Scholar] [CrossRef] [PubMed]
- Lukač, N.; Jezeršek, M. Amplification of pressure waves in laser-assisted endodontics with synchronized delivery of Er:YAG laser pulses. Lasers Med. Sci. 2018, 33, 823–833. [Google Scholar] [CrossRef]
- Šavli, D.; Volk, M.; Molan, K.; Terlep, S.; Levičnik-Höfferle, Š.; Babnik, A.; Trost, M.; Gašpirc, B.; Lukač, M.; Stopar, D.; et al. The effect of surface roughness on the Er:YAG laser-induced photoacoustic removal of bacteria in zero-gap periodontal/peri-implant pocket model. Ultrason. Sonochem. 2025, 120, 107458. [Google Scholar] [CrossRef]
- Volk, M.; Šavli, D.; Molan, K.; Terlep, S.; Levičnik-Höfferle, Š.; Trost, M.; Gašpirc, B.; Lukač, M.; Jezeršek, M.; Stopar, D. Er:YAG laser biofilm removal from zero-gap periodontal/peri-implant model system mimicking clinical attachment loss. J. Biomed. Opt. 2025, 30, 025002. [Google Scholar] [CrossRef]
- Volk, M.; Molan, K.; Šavli, D.; Terlep, S.; Levičnik-Höfferle, Š.; Gašpirc, B.; Lukač, M.; Jezeršek, M.; Stopar, D. Biofilm removal from Difficult-to-Reach places via secondary cavitation within a constrained geometry mimicking a Periodontal/Peri-Implant pocket. Ultrason. Sonochem. 2024, 104, 106832. [Google Scholar] [CrossRef]
- Bizjak, A.; Nemeš, K.; Možina, J. Rotating-Mirror Q-Switched Er:YAG Laser for Optodynamic Studies. Stroj. Vestn.–J. Mech. Eng. 2011, 57, 3–10. [Google Scholar] [CrossRef][Green Version]
- Karki, K.; Fedorov, V.; Martyshkin, D.; Mirov, S. High energy (0.8 J) mechanically Q-switched 2.94 μm Er:YAG laser. Opt. Express 2021, 29, 4287. [Google Scholar] [CrossRef]
- Koranda, P.; Nemec, M.; Jelínková, H.; Šulc, J.; Cech, M. Electro-Optically Q-Switched Er:YAG laser. In Proceedings of the Advanced Solid-State Photonics (TOPS), Vienna Austria, 6–9 February 2005; OSA: Vienna, Austria, 2005; p. 359. [Google Scholar]
- Yang, J.; Wang, L.; Wu, X.; Cheng, T.; Jiang, H. High peak power Q-switched Er:YAG laser with two polarizers and its ablation performance for hard dental tissues. Opt. Express 2014, 22, 15686. [Google Scholar] [CrossRef]
- Lee, T.; Ok, J.G.; Guo, L.J.; Baac, H.W. Low f-number photoacoustic lens for tight ultrasonic focusing and free-field micro-cavitation in water. Appl. Phys. Lett. 2016, 108, 104102. [Google Scholar] [CrossRef]
- Rajagopal, S.; Sainsbury, T.; Treeby, B.E.; Cox, B.T. Laser generated ultrasound sources using carbon-polymer nanocomposites for high frequency metrology. J. Acoust. Soc. Am. 2018, 144, 584–597. [Google Scholar] [CrossRef]
- Kurz, T.; Parlitz, U.; Kaatze, U.; Georg-August-Universität Göttingen (Eds.) Oscillations, Waves, and Interactions: Sixty Years Drittes Physikalisches Institut: A Festschrift; Univ.-Verl. Göttingen: Göttingen, Germany, 2007; ISBN 978-3-938616-96-3. [Google Scholar]
- Mendes, M.I.P.; Coelho, C.D.F.; Schaberle, F.A.; Moreno, M.J.; Calvete, M.J.F.; Arnaut, L.G. Nanodroplet vaporization with pulsed-laser excitation repeatedly amplifies photoacoustic signals at low vaporization thresholds. RSC Adv. 2023, 13, 35040–35049. [Google Scholar] [CrossRef]
- Li, B.; Gu, Y.; Chen, M. An experimental study on the cavitation of water with dissolved gases. Exp. Fluids 2017, 58, 164. [Google Scholar] [CrossRef]
- Miller, D.L. Overview of experimental studies of biological effects of medical ultrasound caused by gas body activation and inertial cavitation. Prog. Biophys. Mol. Biol. 2007, 93, 314–330. [Google Scholar] [CrossRef] [PubMed]
- Sen, T.; Tufekcioglu, O.; Koza, Y. Mechanical index. Anadolu Kardiyol. Derg. Anatol. J. Cardiol. 2015, 15, 334–336. [Google Scholar] [CrossRef]
- Biesman, B.S.; Capelli, C.C. Comparing safety and efficacy of acoustic subcision at two different rapid acoustic pulse rates to improve the appearance of cellulite. Lasers Surg. Med. 2024, 56, 32–38. [Google Scholar] [CrossRef] [PubMed]
- Gray, M.D.; Lyon, P.C.; Mannaris, C.; Folkes, L.K.; Stratford, M.; Campo, L.; Chung, D.Y.F.; Scott, S.; Anderson, M.; Goldin, R.; et al. Focused Ultrasound Hyperthermia for Targeted Drug Release from Thermosensitive Liposomes: Results from a Phase I Trial. Radiology 2019, 291, 232–238. [Google Scholar] [CrossRef] [PubMed]
- Kim, J.; Chang, W.-Y.; Lindsey, B.D.; Dayton, P.A.; Dai, X.; Stavas, J.M.; Jiang, X. Laser-Generated-Focused Ultrasound Transducers for Microbubble-Mediated, Dual-Excitation Sonothrombolysis. In Proceedings of the 2016 IEEE International Ultrasonics Symposium (IUS), Tours, France, 18–21 September 2016; IEEE: Tours, France, 2016; pp. 1–4. [Google Scholar]
Disclaimer/Publisher’s Note: The statements, opinions and data contained in all publications are solely those of the individual author(s) and contributor(s) and not of MDPI and/or the editor(s). MDPI and/or the editor(s) disclaim responsibility for any injury to people or property resulting from any ideas, methods, instructions or products referred to in the content. |
© 2025 by the authors. Licensee MDPI, Basel, Switzerland. This article is an open access article distributed under the terms and conditions of the Creative Commons Attribution (CC BY) license (https://creativecommons.org/licenses/by/4.0/).