Article

Enhancing Tree-Based Machine Learning for Personalized Drug Assignment

by
Katyna Sada Del Real
1 and
Angel Rubio
1,2,*
1
Departamento de Ingeniería Biomédica y Ciencias, TECNUN, Universidad de Navarra, 20018 San Sebastian, Spain
2
Instituto de Ciencia de Datos e Inteligencia Artificial (DATAI), Universidad de Navarra, 31080 Pamplona, Spain
*
Author to whom correspondence should be addressed.
Appl. Sci. 2025, 15(19), 10853; https://doi.org/10.3390/app151910853
Submission received: 3 September 2025 / Revised: 7 October 2025 / Accepted: 9 October 2025 / Published: 9 October 2025
(This article belongs to the Special Issue Recent Advances in Biomedical Data Analysis)

Abstract

Personalized drug selection is crucial for treating complex diseases such as Acute Myeloid Leukemia, where maximizing therapeutic efficacy is essential. Although precision medicine aims to tailor treatments to individual molecular profiles, existing machine learning models often fall short in selecting the best drug from multiple candidates. We present SEATS (Systematic Efficacy Assignment with Treatment Seats), which adapts conventional models like Random Forest and XGBoost for multiclass drug assignment by allocating probabilistic “treatment seats” to drugs based on efficacy. This approach helps models learn clinically relevant distinctions. Additionally, we assess an interpretable Optimal Decision Tree (ODT) model designed specifically for drug assignment. Trained on the BeatAML2 cohort and validated on the GDSC AML cell line dataset, integrating SEATS with Random Forest and XGBoost improved prediction accuracy and consistency. The ODT model offered competitive performance with clear, interpretable decision paths and minimal feature requirements, facilitating clinical use. SEATS reorients standard models towards personalized drug selection. Combined with the ODT framework it provides effective, interpretable strategies for precision oncology, underscoring the potential of tailored machine learning solutions in supporting real-world treatment decisions.

1. Introduction

Acute Myeloid Leukemia (AML) is a highly aggressive and heterogeneous hematological malignancy. In 2021, the global burden of acute myeloid leukemia included approximately 145,000 new cases and 130,000 deaths, highlighting its major public health impact [1]. In the United States alone, an estimated 20,050 new cases and 11,540 deaths were reported in the following year (2022) [2]. Its treatment remains a major clinical challenge due to the extensive variability in patient-specific responses to therapies [3,4,5,6]. Despite advances in precision oncology and the availability of ex vivo drug screening data, selecting the most effective therapy for each patient remains an unresolved and pressing problem.
Machine learning (ML) offers significant promise in addressing this challenge by helping identify effective treatments. However, the structure of precision oncology problems deviates from conventional ML tasks like classification or regression. Instead, it presents a complex assignment problem, where the goal is to recommend the most effective drug—or drug combination—for an individual based on high-dimensional molecular and clinical data.
From a supervised learning standpoint, this challenge goes beyond estimating general drug efficacy. It requires making a targeted recommendation, selecting the single most effective drug from a pool of candidates for each patient [7]. In principle, if drug efficacy could be modeled precisely through regression, the assignment problem would reduce to selecting the drug with the highest predicted response. However, this theoretical simplicity often breaks down in practice.
Most traditional approaches rely on regression-based models to estimate continuous drug response metrics such as IC50 or AUC for each drug–cell line pair [8,9,10,11,12,13,14,15,16,17]. While informative, these models do not directly optimize for the ultimate clinical goal: identifying the most effective drug for a patient [18]. Furthermore, regression models tend to perform best around average response values but struggle at the extremes [19], which is particularly problematic in clinical settings where the aim is to identify highly sensitive drugs.
To better align modeling objectives with clinical decision-making, some researchers have reframed the task as a binary classification problem, distinguishing between “sensitive” and “resistant” responses. Models like CDSML [20] and others [21,22,23] have shown strong performance using both traditional algorithms (e.g., Random Forest, KNN) and deep learning architectures (e.g., RefDNN). Yet, this binary classification approach remains overly simplistic—while identifying a drug as “sensitive” provides useful information, it does not prioritize among multiple effective options. As a result, it offers limited utility in guiding optimal treatment decisions where ranking efficacy is crucial.
Hybrid strategies offer more granularity. For example, SAURON-RF integrates classification and regression within a Random Forest framework to prioritize effective drugs while accounting for data imbalance [19]. Meanwhile, ranking-based approaches attempt to model the relative efficacy of drugs rather than absolute values. Kernelized Rank Learning (KRL), for instance, optimizes a ranking loss function to approximate drug sensitivities using kernelized linear regression [18]. Similarly, Ref. [14] proposed neural ranking strategies—Pair-PushC to prioritize effective drugs, List-One to identify the best drug, and List-All to rank all effective options. These methods aim to improve model alignment with the task of drug prioritization.
Reinforcement learning (RL) introduces another promising avenue. Rather than directly predicting response values, RL-based models treat drug assignment as a sequential decision-making problem, optimizing a policy that maximizes long-term outcomes. Methods like PPO-Rank [24] use a Markov Decision Process to rank drugs in a way that maximizes a clinical reward signal. A broader review of RL applications in oncology underscores its potential to develop adaptive treatment strategies focused on maximizing therapeutic benefit [25].
Unsupervised learning approaches, while less common, also show promise. When appropriate features are selected, patients who respond optimally to similar drugs may cluster, suggesting potential for precision drug matching based on intrinsic structure in the data [26,27]. Altogether, these diverse methodologies—classification, regression, ranking, RL, and clustering—highlight the multifaceted nature of precision medicine and its deep ties to multiple areas of machine learning.
In this study, we address the drug assignment problem by developing and evaluating tree-based models for multiclass drug assignment, where the target labels are the most effective drugs for a given tumor. This formulation shifts away from classifying drugs as merely sensitive or resistant and instead treats drug recommendation as a multiclass prediction task.
We leverage the well-known advantages of ensemble models like Random Forest and XGBoost, which offer robustness, interpretability, and strong performance with tabular multi-omics data. However, these off-the-shelf models are not inherently designed to distinguish the best drug among many—they typically predict outcomes per instance, rather than optimizing over a comparative set.
To overcome this limitation, we introduce SEATS (Systematic Efficacy Assignment with Treatment Seats), a novel method that repurposes standard classifiers for personalized drug recommendation. SEATS works by assigning a fixed number of “treatment seats” to each sample, distributed among candidate drugs in proportion to their measured or estimated efficacy. These weighted seat allocations guide training by adjusting the label structure, ensuring that both the top drug and other highly effective candidates contribute to the learning process. This framework enables tree-based models to better handle multiclass drug selection while preserving their interpretability and ease of use.
In addition to SEATS, we include an Optimal Decision Tree (ODT) model in our evaluation to represent a more transparent, rule-based approach to treatment assignment. While SEATS adapts existing models (RF, XGBoost) to solve the assignment model, ODT is a newly tailored model to address directly this problem. We evaluate all models based on their ability to correctly identify the optimal drug, their generalizability to unseen patients, and their practical deployability in real-world clinical contexts. Validation is conducted on the BeatAML2 dataset (Waves 1 and 2 for training, Waves 3 and 4 for testing) and externally tested on AML cell lines from GDSC.
Through this work, we demonstrate that enhanced tree-based models, guided by our SEATS framework, can bridge the gap between predictive modeling and actionable treatment recommendation—delivering a scalable, interpretable, and clinically relevant solution for precision oncology. In this work, we make two main contributions: (1) the introduction of SEATS (Systematic Efficacy Assignment with Treatment Seats), which adapts standard tree-based models such as Random Forest and XGBoost to the drug assignment problem; (2) the evaluation of an Optimal Decision Tree (ODT), a novel interpretable framework tailored to multiclass drug selection. Together, these contributions address both performance and interpretability, key challenges in precision oncology.

2. Materials and Methods

2.1. Datasets

The models were trained using the BeatAML2 dataset, a comprehensive resource encompassing AML patient specimen with integrated molecular, clinical, and drug response data. The dataset includes ex vivo drug sensitivity profiles for an extensive panel of compounds, detailed clinical annotations, and DNA and RNA sequencing data. Drug sensitivity was quantified by fitting dose–response curves using probit analysis across seven concentration points, measuring the relationship between drug concentration and cell viability. Quality control procedures were applied to ensure the reliability of measurements, particularly in cases with replicate data points [28].
The full dataset includes responses from 389 patient-derived cell lines treated with 166 experimental and approved oncology drugs. Genomic profiles consist of 2279 nonsynonymous mutations and 22,843 gene expression features. To focus on biologically relevant features and reduce noise, we retained only mutations present in at least 1% of patients and selected the top 5000 most variable genes by expression. We further excluded drugs that were either highly toxic or insufficiently tested (i.e., administered to fewer than 70% of patients), and removed cell lines treated with fewer than 80% of the available drugs.
For model development and internal validation, we used Waves 1 and 2 of the BeatAML2 cohort, comprising drug response data from 257 AML cell lines. For external testing, we used Waves 3 and 4, which include 142 additional cell lines. After filtering, the resulting dataset included 119 drugs, 70 coding-region mutations, and 5000 gene expression features per cell line.
For external validation, we used the Genomics of Drug Sensitivity in Cancer (GDSC) dataset, a large-scale pharmacogenomics resource containing drug response profiles and genomic features across numerous cancer cell lines [29]. We identified 23 AML cell lines with available IC50 values for 53 drugs that overlapped with those in the BeatAML2 dataset. Due to the differences in experimental protocols, validation on GDSC was restricted to mutational features only. We chose to focus on mutations for this external test because they can be reliably derived from formalin-fixed paraffin-embedded samples. DNA is less prone to degradation than RNA, making mutation profiles more stable and transferrable across datasets.

2.2. Modeling Drug Response: Computation of IC50*

As we framed drug assignment as a multiclass classification problem, each patient or cell line must be assigned to a class corresponding to the most effective drug. Effectiveness was determined using the IC50* metric, a normalized version of the traditional IC50 (half-maximal inhibitory concentration) described in [30]. IC50* is computed by subtracting the mean l o g ( I C 50 ) across patients for each drug from the individual l o g ( I C 50 ) value:
I C 50 i j * = l o g I C 50 i j m e a n i l o g I C 50 i j .
This transformation centers the IC50 values of each drug around zero, allowing for comparisons across drugs while reducing biases due to systematic potency differences. Drugs with high variability in IC50* across patients are more informative for identifying personalized responses. The drug with the lowest IC50* for each patient is designated as the oracle drug, representing the most effective treatment. These oracle assignments serve as the ground truth for supervised training but are later refined using the SEATS method.

2.3. Machine Learning Models

2.3.1. Off-the-Shelf Models

Random Forest (RF) is a tree-based ensemble model that constructs multiple decision trees using bootstrap samples and random feature subsets at each node. This two-stage randomness reduces overfitting and enhances model generalization. RF models are well-suited for high-dimensional genomic data due to their ability to capture nonlinear feature interactions and handle multicollinearity [31].
XGBoost is a gradient-boosted decision tree algorithm that builds models sequentially, with each tree minimizing the errors of its predecessor. It introduces regularization to avoid overfitting, making it particularly robust in noisy or imbalanced settings [32]. While XGBoost has been widely applied in other domains, its application in drug response prediction has been limited, warranting further exploration.
Both RF and XGBoost models were first trained using the oracle labels and later retrained using SEATS-derived labels to compare performance.

2.3.2. The SEATS Method

To better reflect the complexity inherent in biological systems, we developed SEATS (Systematic Efficacy Assignment with Treatment Seats), a label generation method inspired by voting systems. Rather than assigning a single optimal drug per patient, SEATS allocates a fixed number of “seats” across multiple drugs based on their relative efficacy, allowing the model to learn from a probabilistic label distribution.
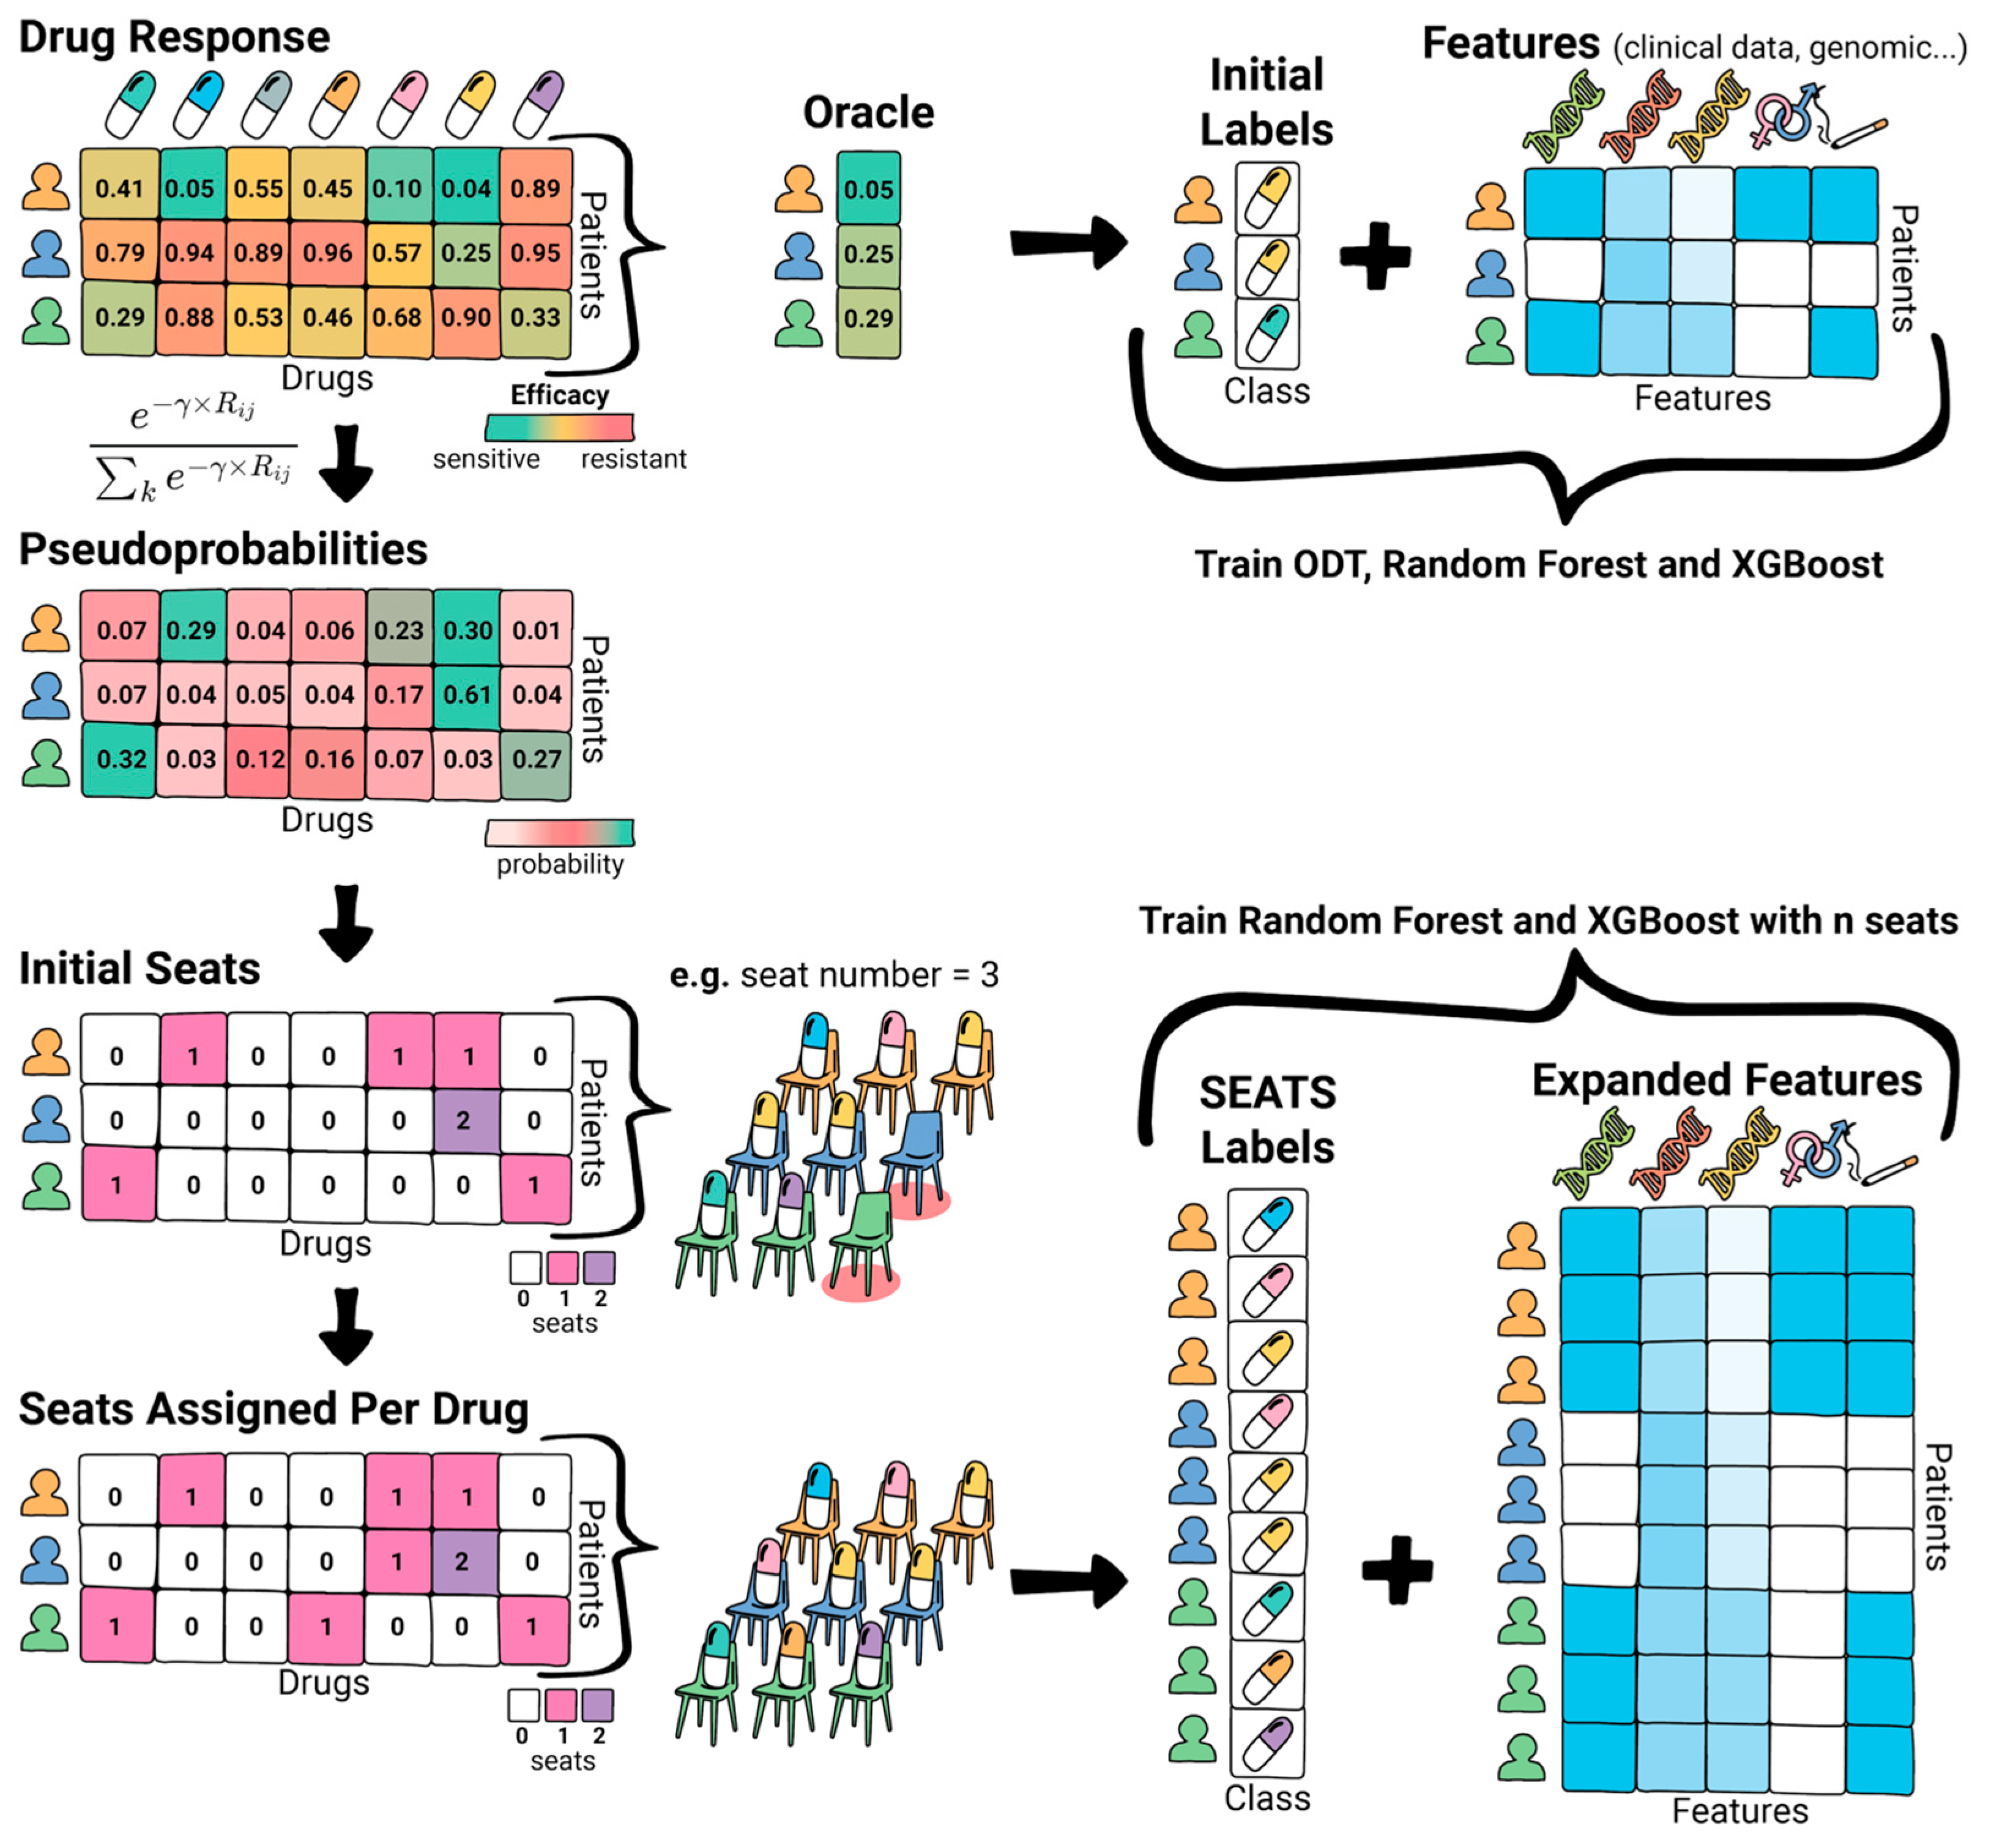
The process begins by converting drug response scores (e.g., IC50*) into pseudoprobabilities using a softmax-like transformation:
p s e u d o p r o b a b i l i t i e s = e γ ×   R i j k e γ ×   R i j .
where R i j is the IC50* for drug j in patient i , and γ is a tunable hyperparameter controlling the sharpness of the distribution. A high γ enforces a “winner-takes-all” dynamic, favoring the best-performing drug, while a low γ allows a more proportional distribution among several candidates (Figure 1).
As shown in Figure 2, next, each patient is assigned a fixed number of seats (e.g., 3), which are proportionally distributed among drugs according to the pseudoprobabilities. These fractional values are rounded to integers, and any discrepancy from the desired total number of seats is corrected via an adjustment process: excess seats are removed from drugs with the highest over-assignment, and deficits are filled by those with the largest under-assignment.
The final allocation determines the expanded training labels. For instance, if a patient assigns two seats to Drug A and one to Drug B, the dataset is expanded with three rows—two labeled as Drug A and one as Drug B. This expanded dataset is then used to train the RF and XGBoost models, effectively emphasizing drugs with partial efficacy while preserving the best-performing drug as the dominant signal. Tuning γ and the number of seats allows SEATS to control the granularity of the drug selection process, enabling more personalized and robust drug recommendation strategies.

2.3.3. Optimal Decision Trees

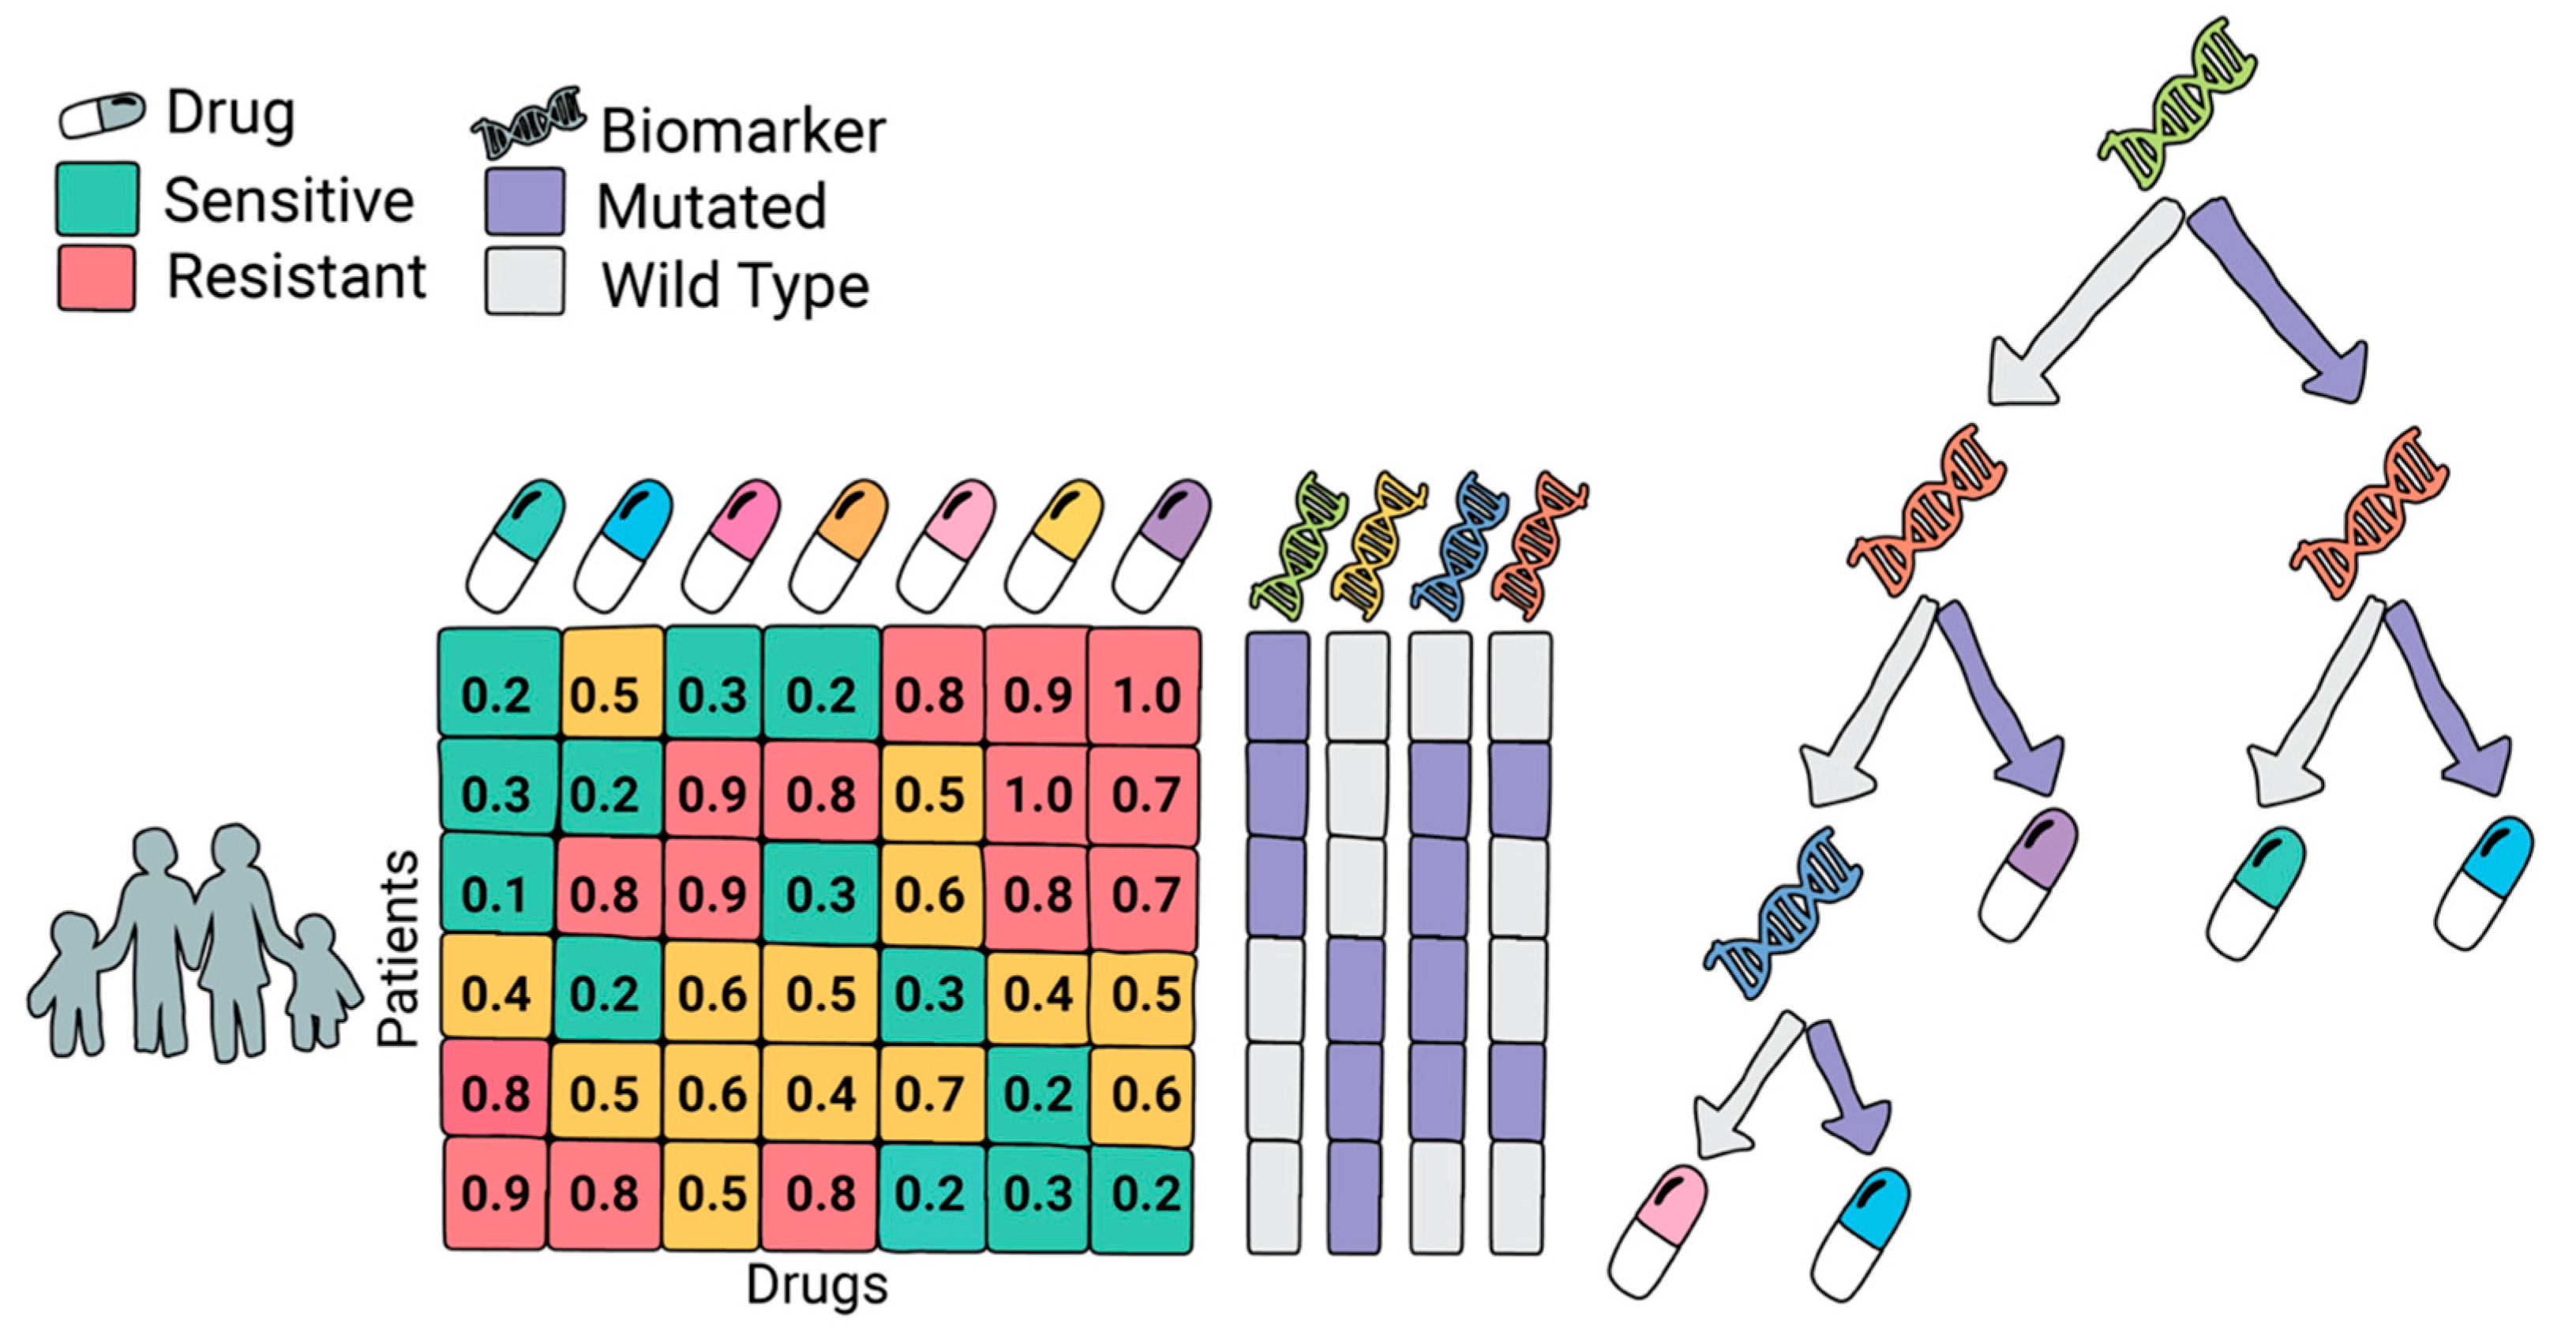
We also included Optimal Decision Trees, a model introduced in our previous work [33], specifically tailored for the drug assignment task. Unlike standard tree-based models, which aim to optimize label prediction, ODT explicitly selects both a splitting variable and a treatment at each node to maximize drug efficacy. This makes the model uniquely suited for clinical decision-making where the goal is not just prediction, but actionable treatment assignment.
At each decision point, the algorithm evaluates all candidate biomarkers (e.g., mutations or gene expression levels) and assigns different drugs to the resulting branches, depending on the patient subgroup (e.g., presence or absence of a mutation). The model optimizes for the total drug sensitivity within each subgroup, recursively splitting until no further gain can be made or a minimum number of patients per group is reached. This process yields compact, interpretable trees that directly link patient features to optimal therapies. Figure 3 illustrates the framework of ODT, detailing how it assigns drugs based on biomarker profiles.
For this study, we built ODT models using the same BeatAML2 training and validation splits as for the other models.
Hyperparameter tuning was performed for all models using 5-fold cross-validation. Only the best-performing models are reported, with their corresponding hyperparameters detailed in Table A1, Table A2 and Table A3.

2.4. Evaluation

To systematically compare the proposed algorithms, we evaluated each model based on four key criteria: accuracy, multi-omics suitability, explainability, and implementability. Accuracy was assessed using five-fold cross-validation on the BeatAML2 dataset with Waves 1 and 2. The dataset was divided into five subsets, ensuring that no patient in the training set was also included in the test set. This process was repeated five times, allowing each subset to serve as the test fold once. By training on some patients and testing on others not included in the training, this approach effectively simulates conditions for extrapolating data to untested patients, which is essential for drug repositioning and precision medicine. After cross-validation, the models were tested on an independent set comprising Waves 3 and 4, using models trained on the entirety of Waves 1 and 2. This evaluates the model’s performance on unseen patients.
External validation was performed using AML cell lines from the GDSC dataset, which provided an opportunity to test the generalizability of the models in an independent cohort subject to different experimental protocols, novel cell lines, and measurement platforms.
To assess multi-omics suitability, we examined the predictive performance of models trained separately with either gene expression or mutation data. This allowed us to evaluate the versatility of each algorithm in integrating different types of molecular information, which is critical for personalized treatment strategies.
Explainability was evaluated by analyzing the number of variables used by each model and determining the ease with which predictions could be interpreted. This involved assessing whether the model logic could be transparently visualized—as with decision trees—or if informative feature importance metrics could be extracted. Finally, implementability was assessed by measuring training times, considering prediction latency, and evaluating the potential to convert model outputs into practical clinical tools, such as visual decision aids or biomarker panels.

3. Results

3.1. Accuracy and Multi-Omics Suitability

3.1.1. Test and Validation in BeatAML2

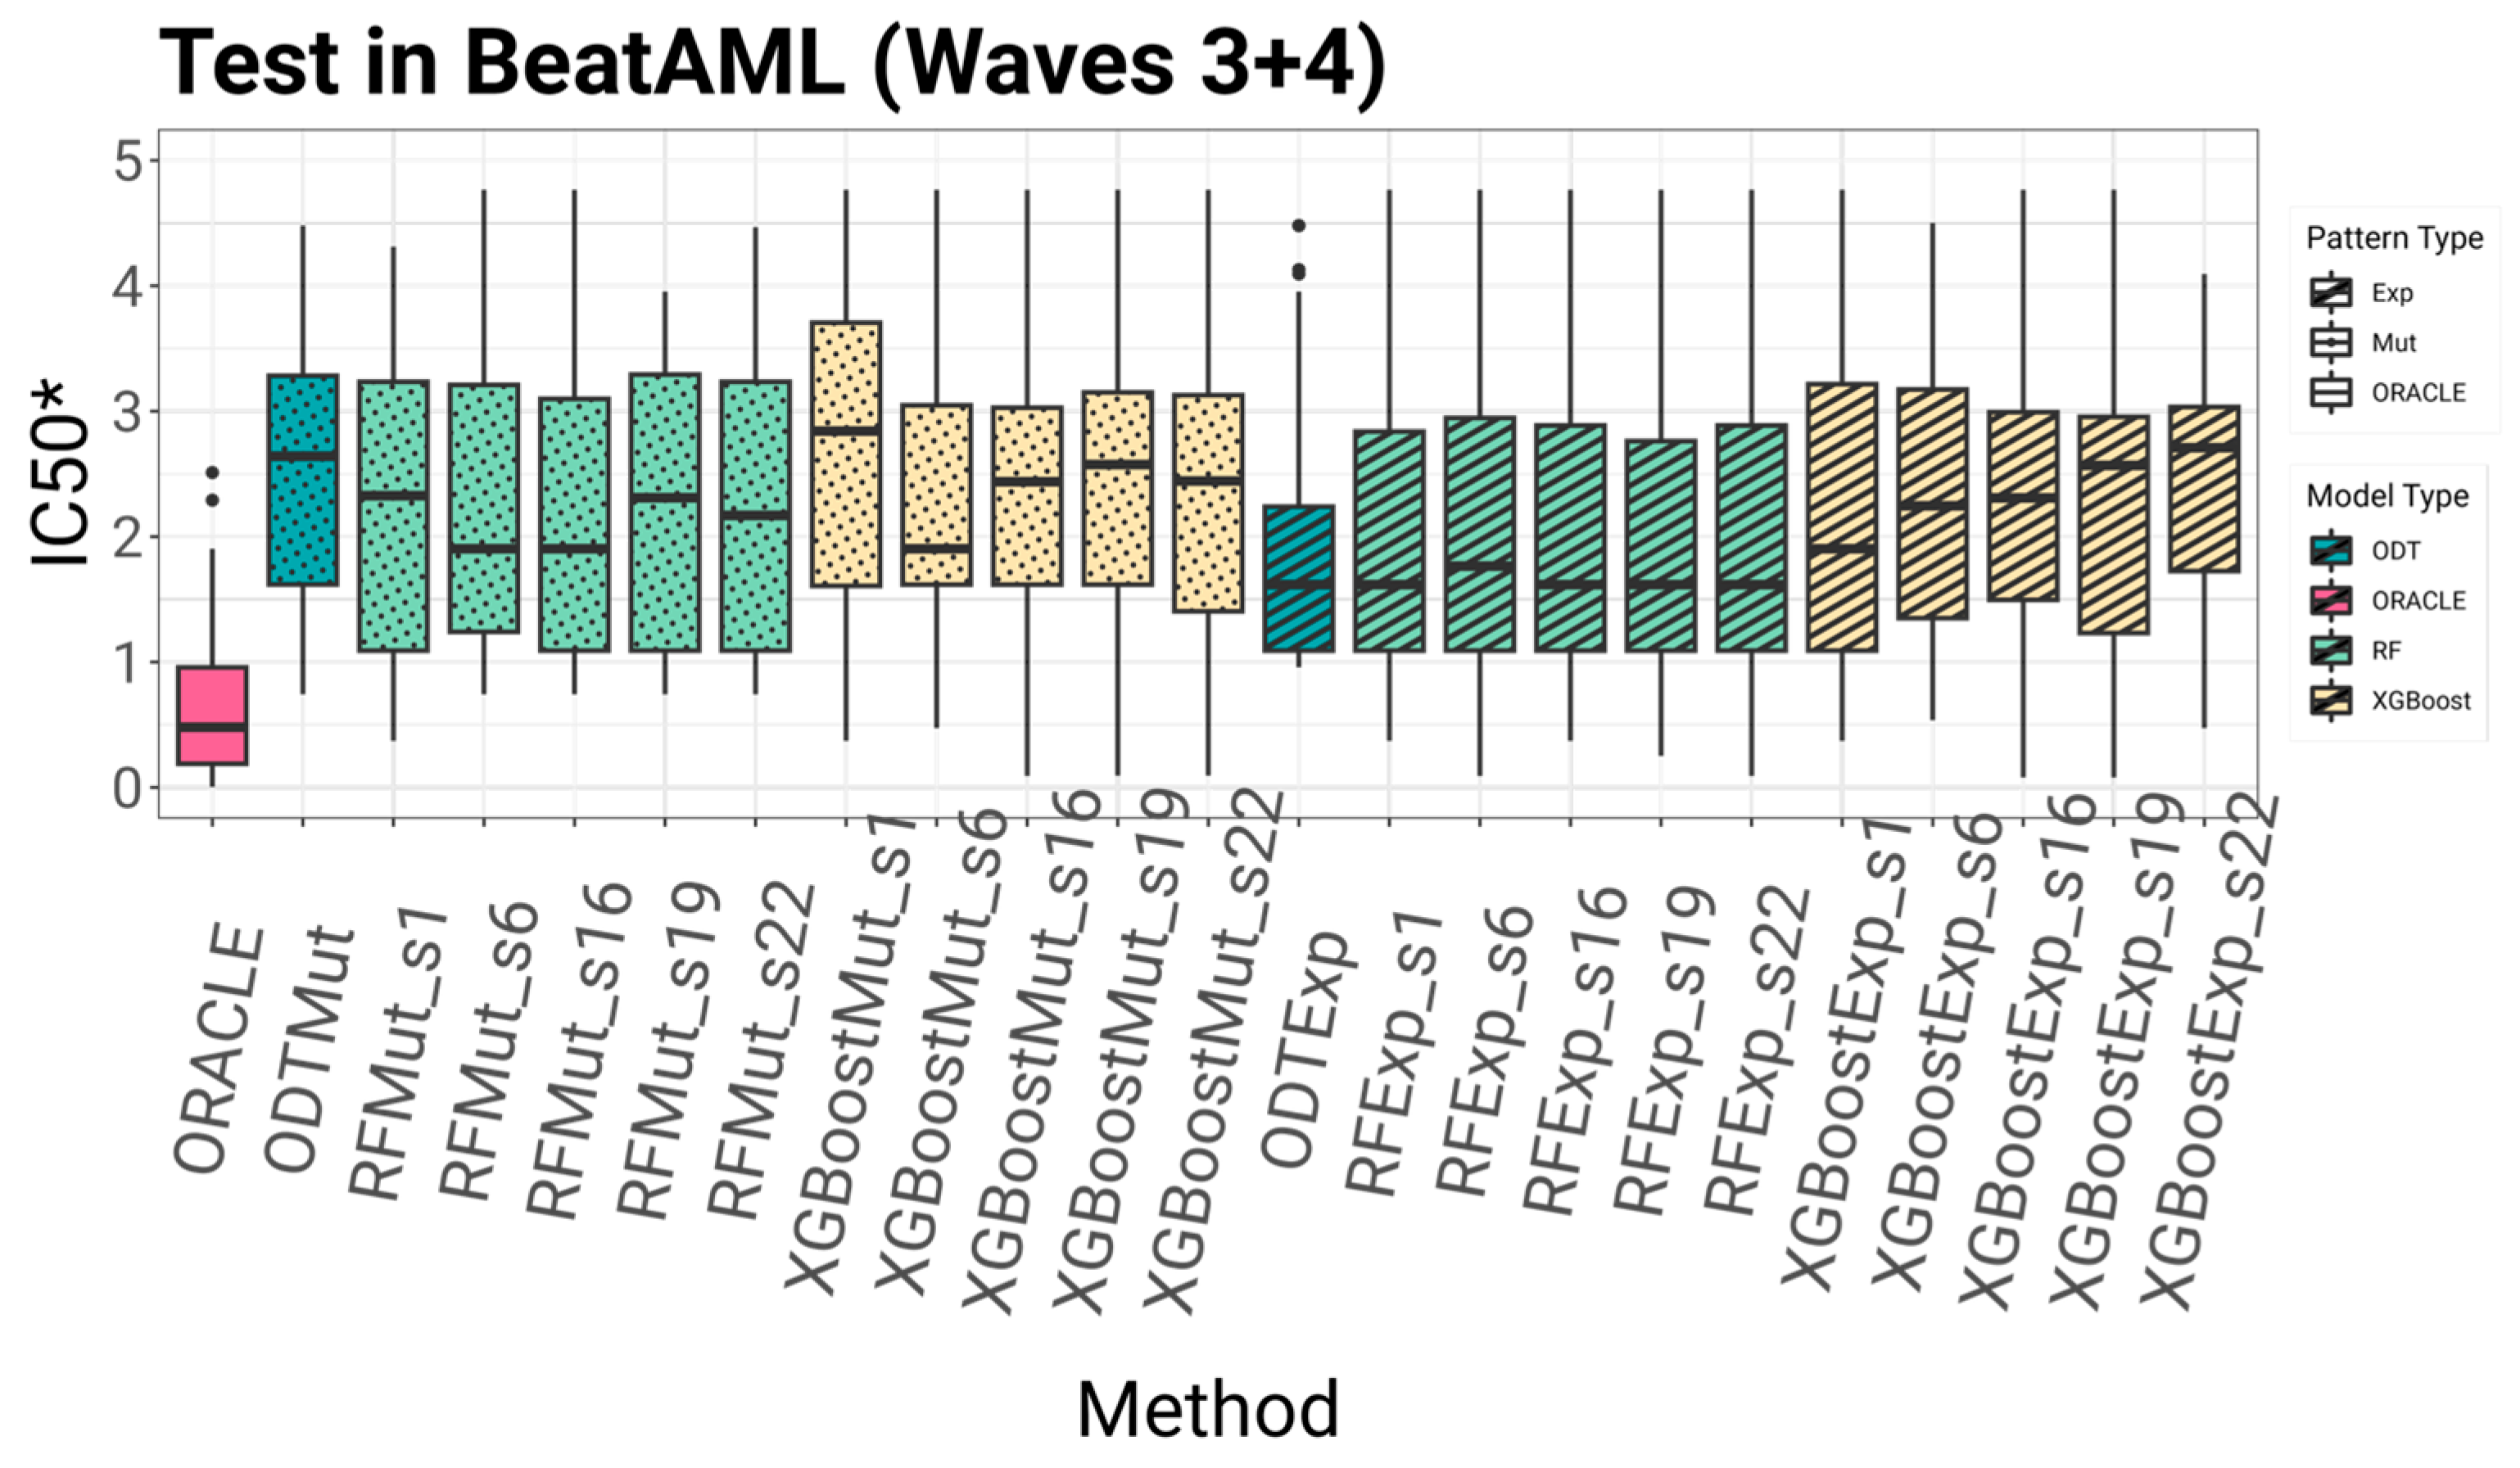
The performance of the models in terms of accuracy and data modality is summarized in Figure 4, Figure 5 and Figure 6. Boxplots display the measured IC50* values for the drugs predicted as the best choices by the different models. Validation on Waves 1 and 2 revealed that expression-based models outperformed mutation-based ones across all methods. As shown in Figure 4, the XGBoost model with 16 seats (XGBoostExp_s16) and the Random Forest model with 6 seats (RFExp_s6), both trained on gene expression data, achieved mean IC50 values of 2.44 and 2.45, respectively. The Optimal Decision Tree using expression data (ODTExp) also demonstrated strong performance, achieving a mean IC50* of 2.46, highlighting its effectiveness despite its simpler structure.
Models trained solely with mutation data displayed inferior predictive performance. The best among them—ODTMut and RFMut_s6—produced mean IC50* values of 2.5 and 2.62, respectively. While not as accurate as their expression-based counterparts, they still provided viable drug recommendations, indicating that mutational information, although less comprehensive, can still be informative.
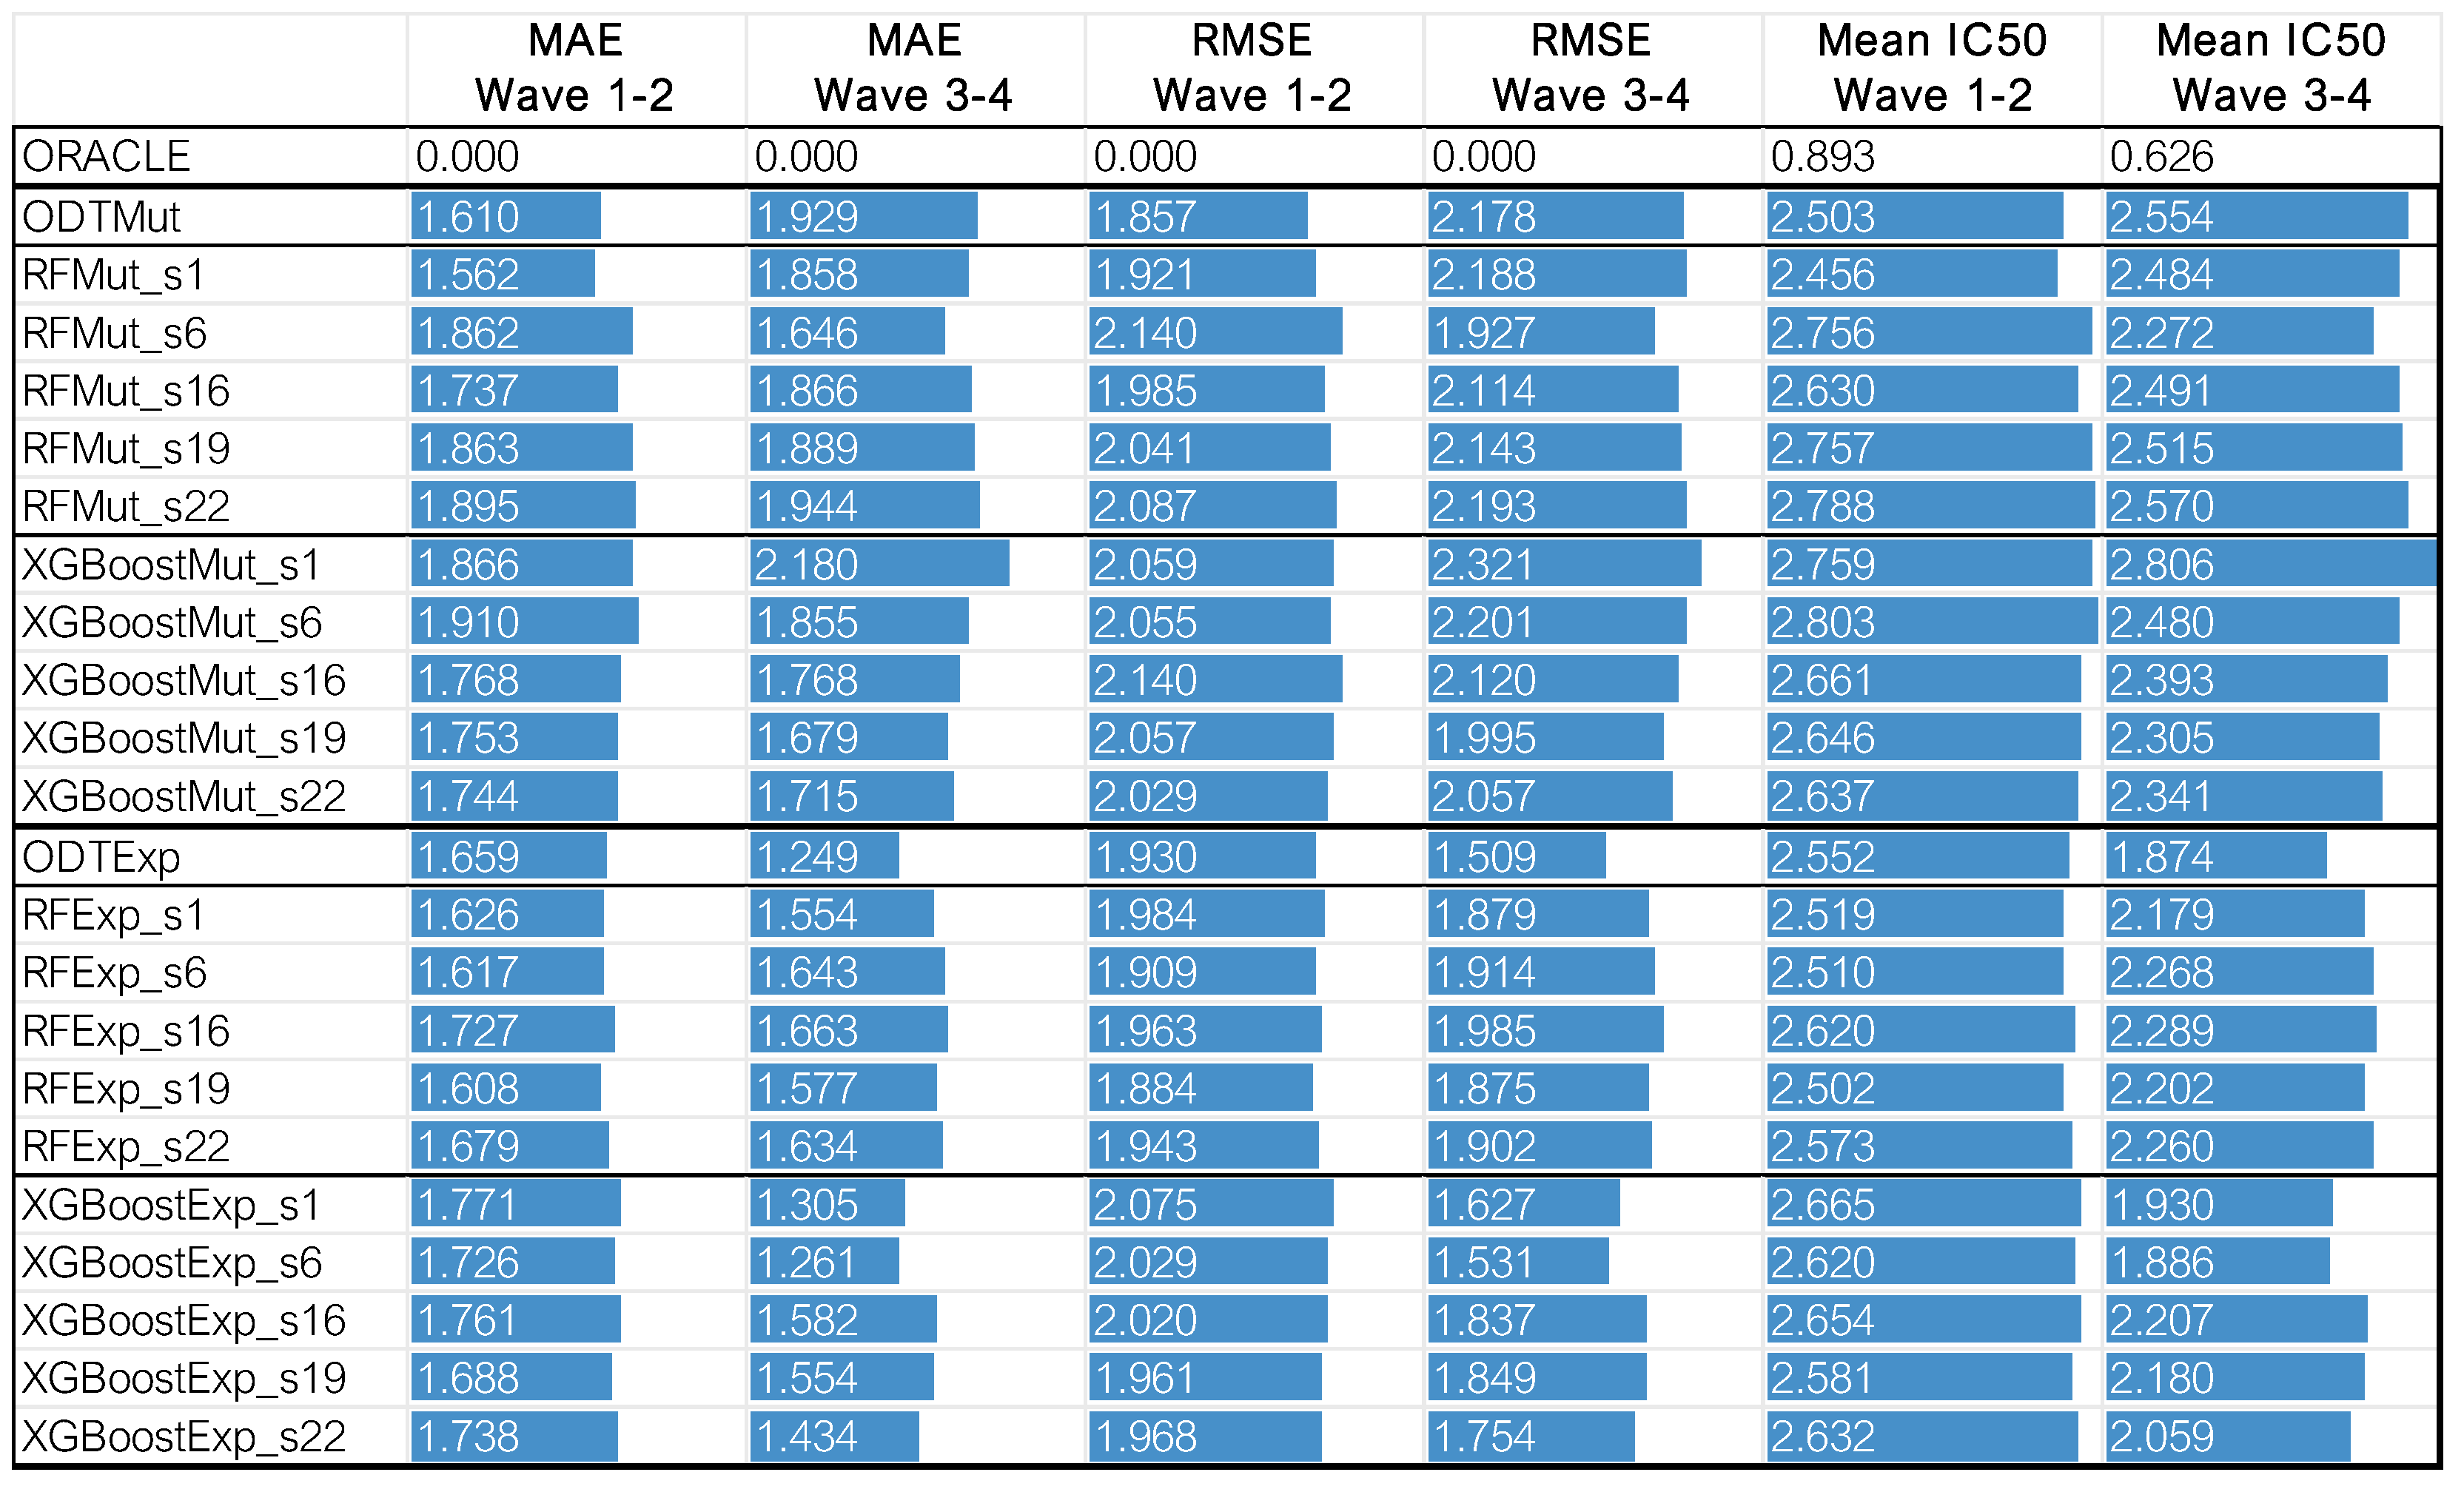
Testing on Waves 3 and 4 confirmed these trends. As shown in Figure 5, ODTExp achieved the lowest mean IC50 of 1.87, outperforming all other models and demonstrating strong generalization to unseen patient data. RFExp_s19 and RFExp_s1 followed closely, both with mean IC50 values of 1.88. In this case, the application of the SEATS method did not result in substantial differences. For completeness, we also computed root mean square error (RMSE) between predicted IC50 values and the oracle drug IC50*. These results are included in Figure A1, providing a conventional regression-style metric for comparison with prior literature.
In contrast, models trained on mutation data exhibited more pronounced improvements. The best-performing Random Forest model, RFMut_s16, achieved a mean IC50* of 2.18, compared to 2.32 for the equivalent model without SEATS—a statistically significant improvement (Wilcoxon p-value = 2.85 × 10⁻²). Among XGBoost models trained on mutations, XGBoostMut_s6 yielded the lowest mean IC50* of 2.35, outperforming its counterpart without SEATS, which achieved a mean of 2.60 (Wilcoxon p-value = 6.73 × 10⁻²).
However, since our goal is to assess the models’ capacity to identify the optimal therapeutic option for each patient, we conducted an evaluation of their ability to recommend the oracle drug or other top-ranking alternatives—drugs with the lowest IC50* for a given patient. This analysis considered the top 20 drugs out of a total of 119 candidates, focusing on the frequency with which these leading options were selected as optimal by each model. The results of this evaluation are presented in the heatmap shown in Figure 6.
To evaluate if the models were identifying the best drugs, we analyzed how frequently their top prediction matched the top three oracle drugs for each patient (Figure 6). Among the Random Forest models, RFExp_s1 and RFExp_s22 performed best, correctly selecting the top drug for 18 and 17 patients, respectively. RFExp_s1 also identified the second-best drug for 11 patients and the third-best for 10 patients, while RFExp_s22 selected the second-best for 14 patients and the third-best for 9.
For the XGBoost models trained on gene expression data, the SEATS method did not yield a substantial improvement. However, in mutation-based models, the impact of SEATS was more pronounced. The best-performing model, RFMut_s22, correctly identified the oracle drug for 13 patients, the second-best for 10, and the third-best for 8, whereas the standard RFMut model (without SEATS) identified the oracle, second-best, and third-best drugs for only 4, 8, and 6 patients, respectively. This is particularly notable because—as will be discussed in the next section—mutation-based models demonstrate superior transferability to other data types, an important consideration for clinical applications.
The ODTExp model also showed competitive performance, selecting the top drug for 10 patients, the second-best for 8, and the third-best for 13.

3.1.2. External Test

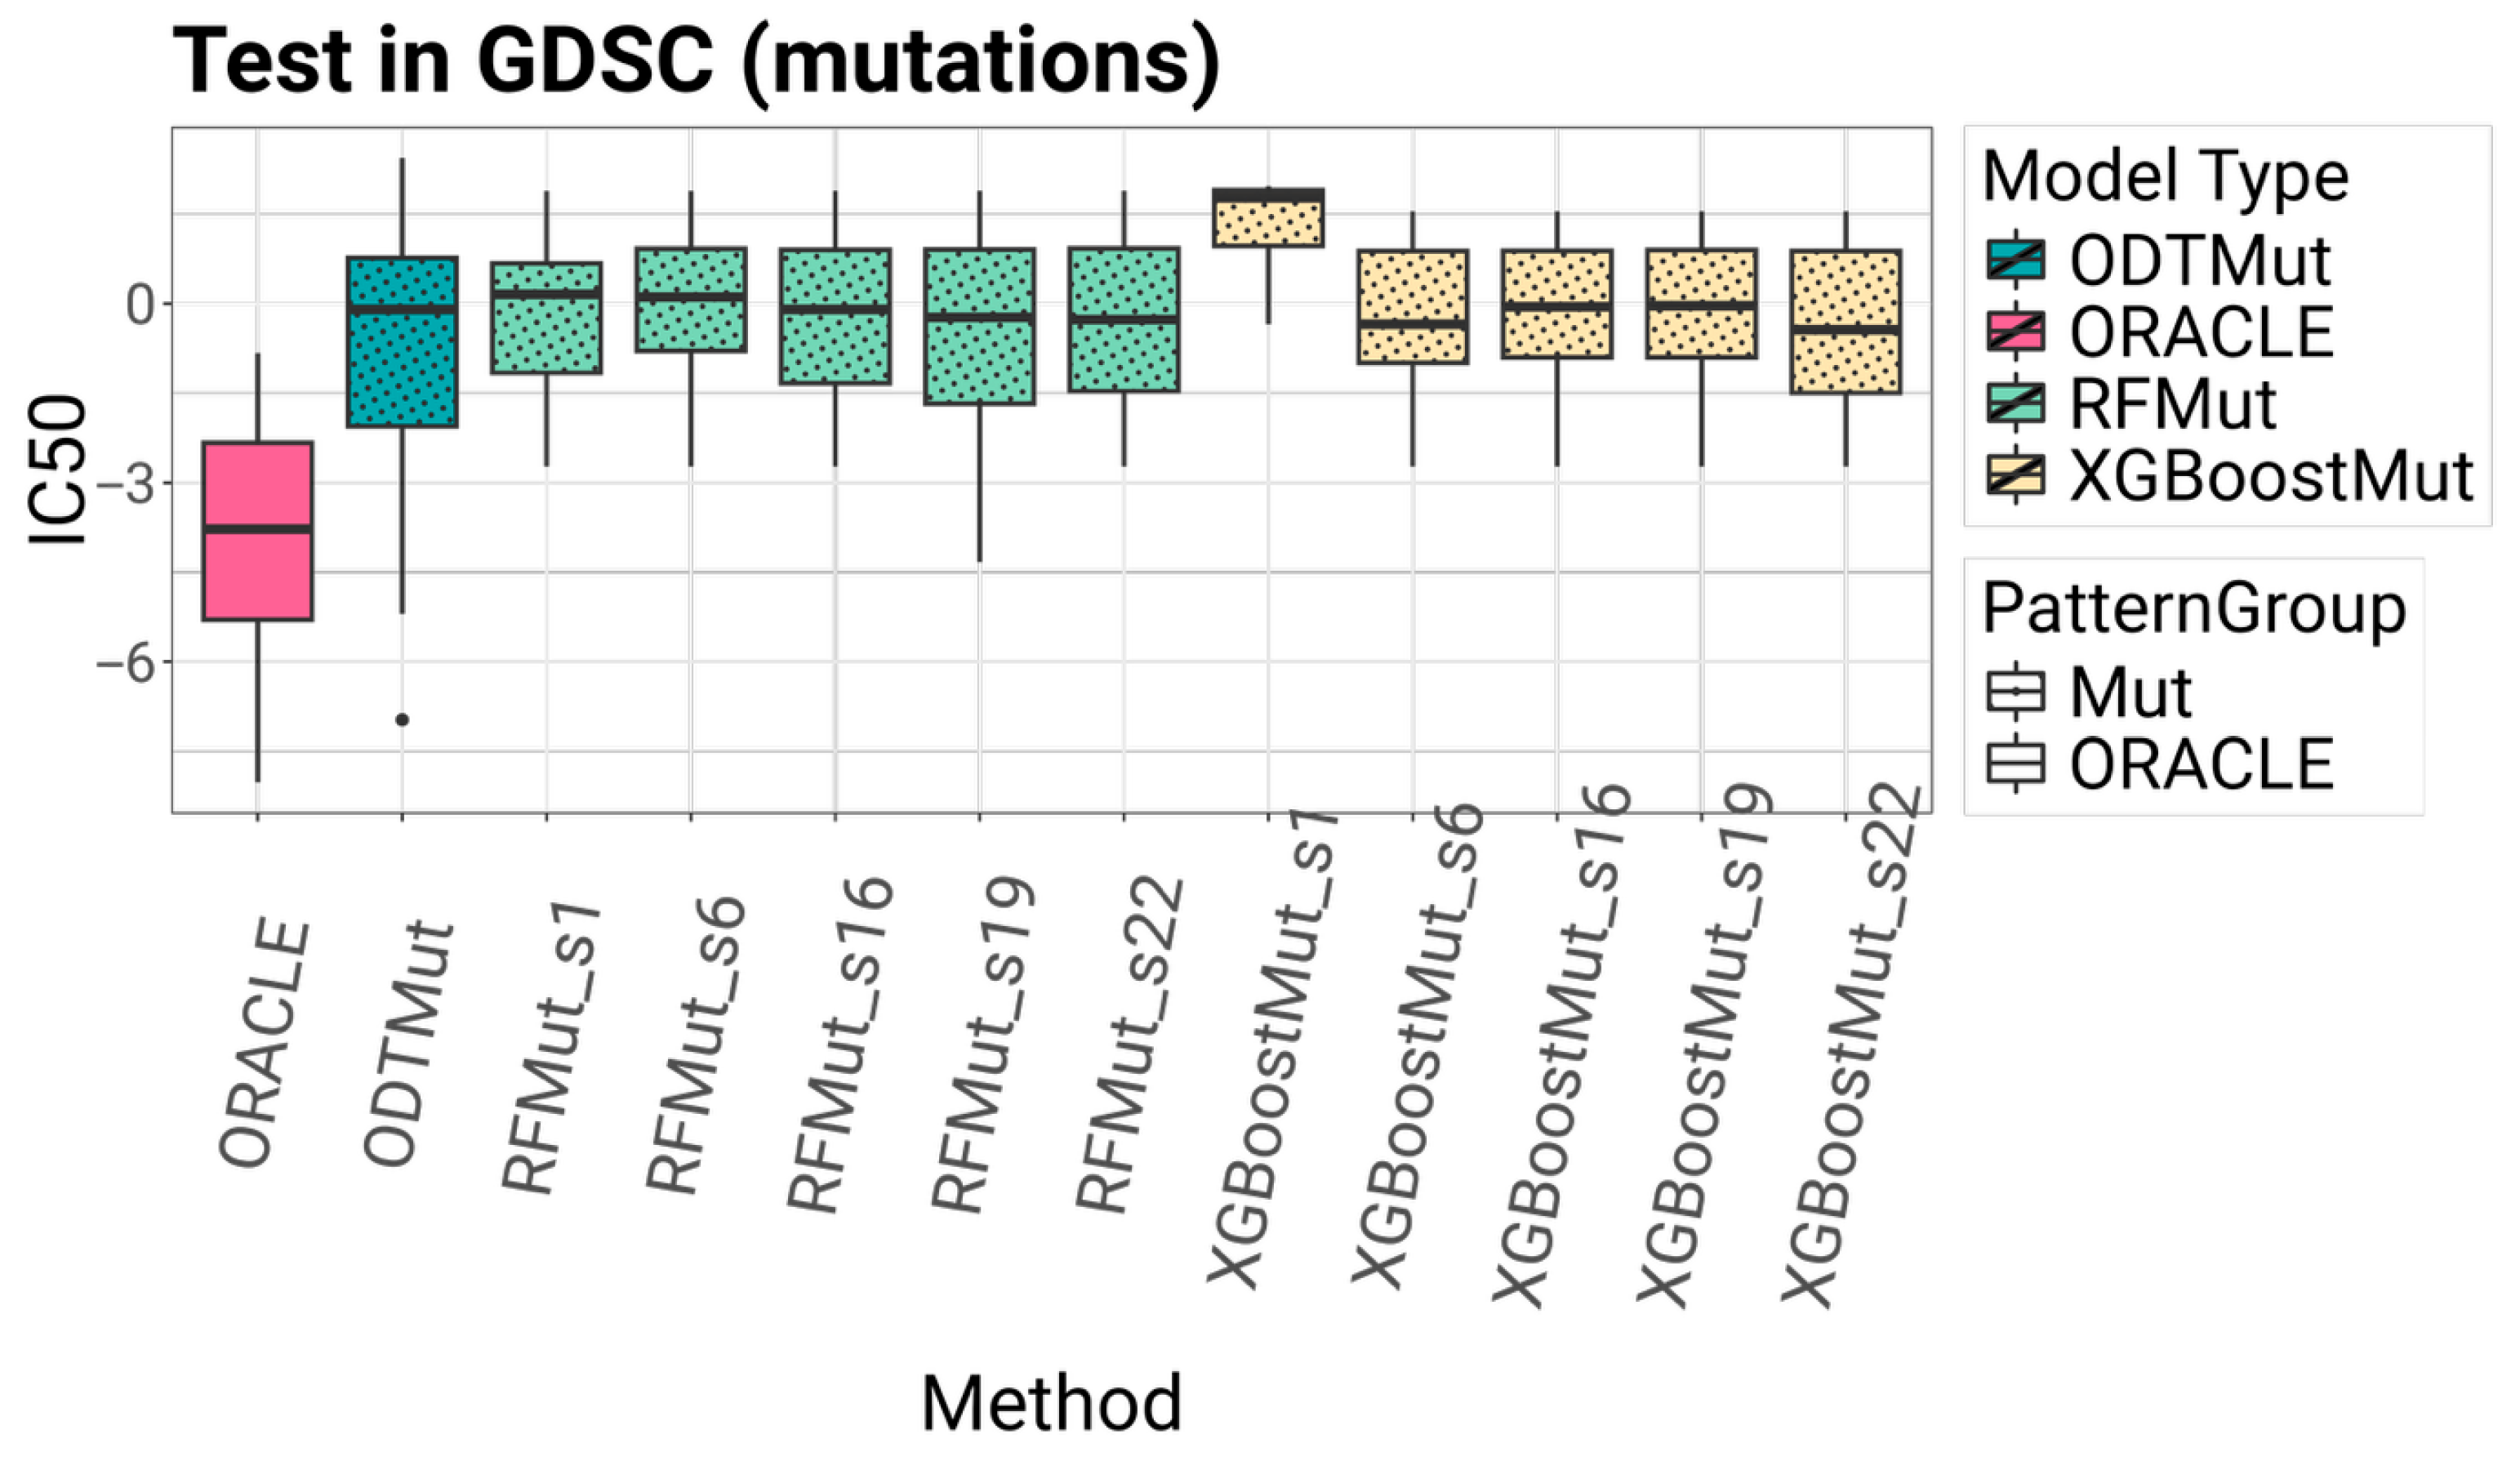
External validation using the GDSC dataset is presented in Figure 7. Among all models, ODTMut and XGBoostMut_s22 achieved the lowest mean IC50 values of −0.966 and −0.457, respectively. For XGBoost, the application of the SEATS method had a notable impact, as the model without SEATS yielded a substantially higher mean IC50 of 1.3, a difference that was statistically significant (Wilcoxon p-value = 2.23 × 10⁻³). The best-performing Random Forest model, RFMut_s19, achieved a mean IC50* of −0.426, compared to −0.146 for its counterpart without SEATS; however, this difference was not statistically significant. Despite inherent differences in experimental protocols and measurement platforms between GDSC and BeatAML2, the results demonstrate the robustness of the models and highlight the substantial contribution of the SEATS method.

3.1.3. Explainability and Implementability

Model explainability and implementability were evaluated based on the number of features required, training time, and interpretability of outputs, with results depicted in Figure 8, Figure 9 and Figure 10. Training times were uniformly fast across all models, with even the most computationally intensive methods completing in under a minute. Prediction times were negligible for all approaches, indicating practical feasibility for clinical use.
The number of variables required by each model, however, revealed stark differences. ODT models, particularly ODTExp, used as few as five genes while maintaining high predictive accuracy. This remarkable parsimony suggests that robust drug recommendations could be made by testing only a small gene panel, significantly simplifying clinical workflows. By contrast, RF and XGBoost models typically relied on hundreds of features, complicating downstream implementation.
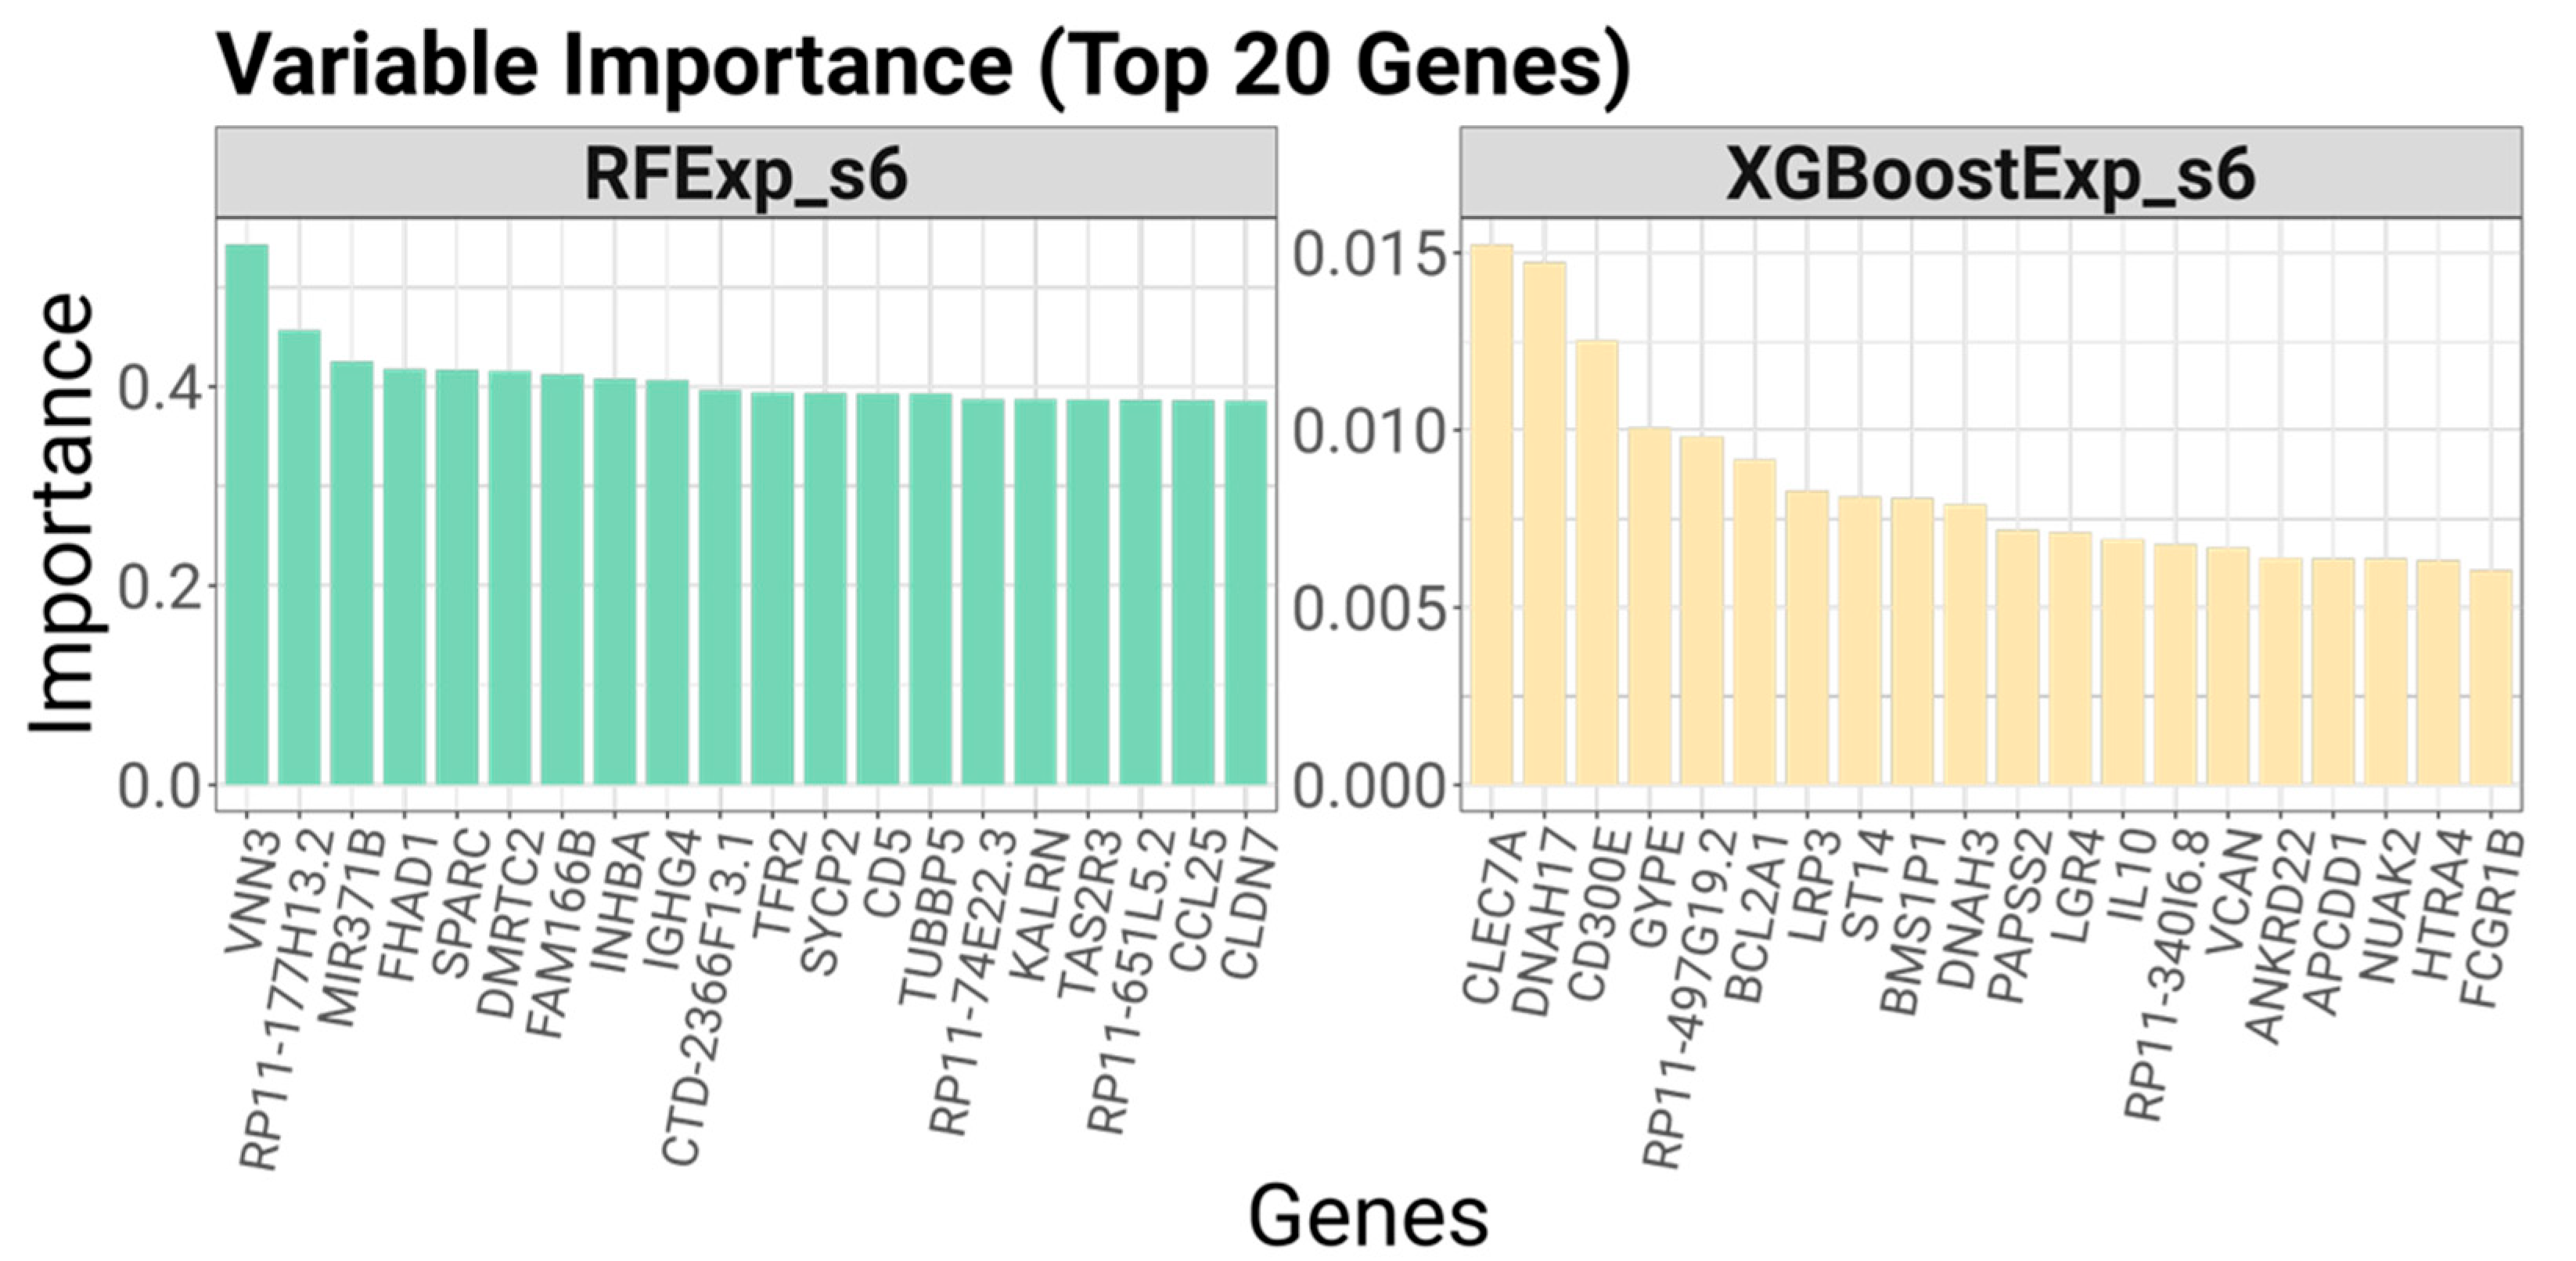
Interpretability was another domain where the ODT approach excelled. As shown in Figure 9, the ODT structure allows clinicians to follow a clear decision path, linking specific biomarker thresholds to drug recommendations. This transparent structure can be directly translated into a visual decision aid, supporting clinical adoption. In contrast, the decision-making process of RF and XGBoost models is less transparent due to their ensemble nature. Nonetheless, these models can still provide biologically relevant insights through feature importance metrics. Tree-based models provide intrinsic importance measures—Gini index for Random Forest and Gain factor for XGBoost—which we report in Figure 10. SHAP values are also a valid measure to explain the model. One key difference between SHAP and tree-specific feature importance methods is that the SHAP values are computed for a specific prediction. The overall importance of each feature must be computed using a summarized version of the SHAP values. Xgboost package, the one used in this work, provides the SHAP values directly. The package treeshap [34,35] can be used to obtain SHAP values for Random Forests. More importantly, the ODT provides a transparent, rule-based decision path (Figure 9) that is immediately actionable, achieving strong performance with as few as five genes. This inherent transparency makes it an ideal tool for clinical settings, which is one of the main objectives.
Figure 10 highlights the top 20 most influential genes for the best-performing RF and XGBoost models, offering clues about the biological signals driving predictions.
Collectively, these results demonstrate that while RF and XGBoost models benefit from SEATS to enhance accuracy, the Optimal Decision Tree approach uniquely balances strong performance with high interpretability and minimal feature requirements—an ideal combination for real-world clinical deployment.

4. Discussion

Personalized treatment selection in AML or other cancers remains a major challenge due to the disease’s complexity and heterogeneity. This study addresses that challenge by introducing SEATS (Systematic Efficacy Assignment with Treatment Seats), a novel strategy that improves drug recommendation performance by enhancing how machine learning models are trained. Our findings support the hypothesis that drug selection can be treated as a multiclassification task, where the model learns to predict the single most effective therapy for each patient based on their molecular features.
SEATS redefines the learning signal by allocating multiple top-performing drugs—or “seats”—to each patient during training, rather than just the single best option. This allows models like Random Forest and XGBoost to capture richer, more generalizable relationships between molecular features and drug efficacy. Across both internal validation and external testing, SEATS consistently led to improvements in predictive performance, particularly when models were trained on mutations data.
Results emphasize the critical role of data modality. Models trained on gene expression data outperformed those using mutation data, reinforcing previous findings [28] that transcriptomic profiles capture essential biological signals such as differentiation state and lineage identity in AML. This highlights the importance of leveraging dynamic molecular information in predictive modeling for drug response.
Model generalizability was evaluated through external validation on AML cell lines from the GDSC dataset. Despite differences in biological context and experimental protocols, the models maintained reasonable predictive accuracy, with those incorporating the SEATS method consistently outperforming their counterparts.
Tree-based approaches offered a balance between accuracy and interpretability. SEATS is especially valuable in this context because it augments standard ensemble models without requiring complex modifications. However, ODT stands out for its simplicity and transparency. As shown, the decision path within the ODT clearly links biomarker status to treatment decisions, facilitating intuitive understanding for clinicians. Remarkably, ODTExp achieved strong predictive performance using as few as five genes, demonstrating its capacity to support cost-effective and actionable clinical workflows.
In terms of clinical applicability, both SEATS-enhanced models and ODT demonstrated practical advantages. SEATS-compatible methods can offer biological insight through feature importance metrics. Additionally, all models demonstrated efficient training and inference times, typically under a minute, reinforcing their suitability for rapid clinical decision support. SEATS did not substantially increase computational complexity, which makes it an appealing addition to traditional algorithms.
While this work is focused on AML, the underlying methodology—particularly the SEATS strategy and the ODT framework—is generalizable to other cancers and diseases where treatment choices can be driven by patient-level omics data. It is important to clarify that the claim of clinical feasibility in this study is based solely on computational performance and interpretability. No formal validation with oncologists or prospective clinical trials was performed; such efforts represent a necessary direction for future work. Future directions should also include extension to other cancer types, or experimental validation of the proposed drug assignments. Integrating additional data types such as proteomics or single-cell transcriptomics may also enhance model precision.
In conclusion, this study introduces SEATS as a robust enhancement to traditional machine learning models for precision treatment assignment. Combined with evidence supporting the value of gene expression features, SEATS lays the groundwork for more effective, transparent, and clinically relevant predictive models.
5. Conclusions

This study introduces SEATS, a method that enhances standard tree-based models for personalized drug assignment by reformulating the task as multiclass prediction. Across internal and external validation, SEATS improved predictive performance, particularly when applied to mutation data. We also evaluated Optimal Decision Trees, which combined competitive accuracy with exceptional interpretability and parsimony, requiring as few as five genes to deliver actionable recommendations. These findings highlight the superiority of gene expression over mutation data for drug selection, while demonstrating that transparent and efficient models can support real-world clinical decision making. Future work should include prospective validation in clinical settings and extension to other cancer types.
The datasets employed in this study are publicly accessible. The BeatAML2 cohort, which served as the training, validation, and testing data, is available at https://biodev.github.io/BeatAML2/ accessed on 2 September 2025. Additionally, we utilized the GDSC drug screening dataset for AML cell lines, which is publicly available at https://www.cancerrxgene.org/ accessed on 2 September 2025.
All code necessary to reproduce the methods and analyses presented in this study is available on GitHub: https://github.com/KatynaSada/TreesAndDemocracy accessed on 2 September 2025. Models were constructed using R libraries: randomForest, xgboost, and our team’s ODT library. The ODT R library developed is publicly available on CRAN at https://cran.r-project.org/web/packages/ODT/ accessed on 2 September 2025 and is associated with the DOI: 10.5281/zenodo.8037213.

Author Contributions

Conceptualization, A.R.; methodology, A.R.; software, K.S.D.R.; validation, A.R. and K.S.D.R.; formal analysis, K.S.D.R.; investigation, K.S.D.R.; resources, A.R.; data curation, K.S.D.R.; writing—original draft preparation, K.S.D.R.; writing—review and editing, A.R.; visualization, K.S.D.R.; supervision, A.R.; project administration, A.R. All authors have read and agreed to the published version of the manuscript.

Funding

This research was funded by Cancer Research UK, grant number C355/A26819; Fundación Científica Asociación Española Contra el Cáncer (FC AECC) and Associazione Italiana per la Ricerca sul Cancro (AIRC) under the Accelerator Award Program; the Basque Government, project PIBA_2020_1_0055; and the Spanish Government, RETOS Investigación (Synlethal Project).

Institutional Review Board Statement

Not applicable.

Informed Consent Statement

Not applicable.

Data Availability Statement

The datasets used in this study are publicly available. The BeatAML2 cohort, which was used for training, validation, and testing, can be accessed at https://biodev.github.io/BeatAML2/ accessed on 2 September 2025. The GDSC drug screening dataset for AML cell lines is available at https://www.cancerrxgene.org/. All code supporting the findings of this study is openly available at https://github.com/KatynaSada/TreesAndDemocracy accessed on 2 September 2025. The ODT R library developed by our team is publicly available on CRAN at https://cran.r-project.org/web/packages/ODT/ accessed on 2 September 2025 and is associated with DOI 10.5281/zenodo.15082102.

Acknowledgments

We extend our gratitude to Djuliana Imperio, Enrique Montal, Paula Azqueta, María Peña, and Itziar Abadía for their contributions to the development of the code and the tuning of hyperparameters in this research.

Conflicts of Interest

The authors declare no conflicts of interest. The funders had no role in the design of the study; in the collection, analyses, or interpretation of data; in the writing of the manuscript; or in the decision to publish the results.

Appendix A

Table A1. ODT Hyperparameters.
Typemin_bucket
Mutations6
Expression17
Table A2. Random Forest Hyperparameters.
Typenum_seatsgamma_seatsnum_treesmtrymin_node_sizemax_depth
Mutations61.650045100
Expression61050025100
Table A3. XGBoost Hyperparameters.
Typenum_
seats
gamma_seatsmax_depthbetagammamin_child_
Weight
Subsamplecolsample_bytree
Mutations61.630.01150.70.8
Expression161.670.01010.81
Figure A1. Performance of each of the models across different experimental settings. MAE denotes the mean absolute error, RMSE the root mean squared error, and mean IC50 the average predicted inhibitory concentration. Metrics are reported separately for waves 1–2 and 3–4, comparing the performance of the ODT, RF, and XGBoost models. Results are presented both with and without application of the SEATS method for RF and XGBoost, using either mutation or expression data as input features. The width of each blue bar represents the magnitude of the corresponding metric value.
Applsci 15 10853 g0a1

References

  1. Zhou, Y.; Huang, G.; Cai, X.; Liu, Y.; Qian, B.; Li, D. Global, regional, and national burden of acute myeloid leukemia, 1990–2021: A systematic analysis for the global burden of disease study 2021. Biomark. Res. 2024, 12, 1–18. [Google Scholar] [CrossRef]
  2. Siegel, R.L.; Miller, K.D.; Fuchs, H.E.; Jemal, A. Cancer statistics, 2022. CA Cancer J. Clin. 2022, 72, 7–33. [Google Scholar] [CrossRef]
  3. Zeisig, B.B.; Kulasekararaj, A.G.; Mufti, G.J.; So, C.W.E. SnapShot: Acute Myeloid Leukemia. Cancer Cell 2012, 22, 698–698.e1. [Google Scholar] [CrossRef] [PubMed]
  4. Döhner, H.; Estey, E.; Grimwade, D.; Amadori, S.; Appelbaum, F.R.; Büchner, T.; Dombret, H.; Ebert, B.L.; Fenaux, P.; Larson, R.A.; et al. Diagnosis and management of AML in adults: 2017 ELN recommendations from an international expert panel. Blood 2017, 129, 424–447. [Google Scholar] [CrossRef] [PubMed]
  5. Biankin, A.V. The road to precision oncology. Nat. Genet. 2017, 49, 320–321. [Google Scholar] [CrossRef] [PubMed]
  6. National Cancer Institute; Genomic Data Commons; National Institutes of Health. Acute Myeloid Leukemia—Cancer Stat Facts, (n.d.). Available online: https://seer.cancer.gov/statfacts/html/amyl.html (accessed on 8 October 2025).
  7. Adlung, L.; Cohen, Y.; Mor, U.; Elinav, E. Machine learning in clinical decision making. Med 2021, 2, 642–665. [Google Scholar] [CrossRef]
  8. Deng, L.; Cai, Y.; Zhang, W.; Yang, W.; Gao, B.; Liu, H. Pathway-guided deep neural network toward interpretable and predictive modeling of drug sensitivity. J. Chem. Inf. Model. 2020, 60, 4497–4505. [Google Scholar] [CrossRef]
  9. Hostallero, D.E.; Wei, L.; Wang, L.; Cairns, J.; Emad, A. Preclinical-to-clinical Anti-cancer Drug Response Prediction and Biomarker Identification Using TINDL. Genom. Proteom. Bioinform. 2023, 21, 535–550. [Google Scholar] [CrossRef]
  10. Manica, M.; Oskooei, A.; Born, J.; Subramanian, V.; Saéz-Rodríguez, J.; Martínez, M.R. Toward Explainable Anticancer Compound Sensitivity Prediction via Multimodal Attention-Based Convolutional Encoders. Mol. Pharm. 2019, 16, 4797–4806. [Google Scholar] [CrossRef]
  11. Jiang, L.; Jiang, C.; Yu, X.; Fu, R.; Jin, S.; Liu, X. DeepTTA: A transformer-based model for predicting cancer drug response. Brief. Bioinform. 2022, 23, bbac100. [Google Scholar] [CrossRef]
  12. Sharifi-Noghabi, H.; Zolotareva, O.; Collins, C.C.; Ester, M. MOLI: Multi-omics late integration with deep neural networks for drug response prediction. Bioinformatics 2019, 35, i501–i509. [Google Scholar] [CrossRef] [PubMed]
  13. Kuenzi, B.M.; Park, J.; Fong, S.H.; Kreisberg, J.F.; Ma, J. Predicting Drug Response and Synergy Using a Deep Learning Model of Human. Cancer Cells 2020, 38, 672–684.e6. [Google Scholar] [CrossRef] [PubMed]
  14. Dey, V.; Ning, X. Improving Anticancer Drug Selection and Prioritization via Neural Learning to Rank. J. Chem. Inf. Model 2024, 64, 4071–4088. [Google Scholar] [CrossRef] [PubMed]
  15. Lao, C.; Zheng, P.; Chen, H.; Liu, Q.; An, F.; Li, Z. DeepAEG: A model for predicting cancer drug response based on data enhancement and edge-collaborative update strategies. BMC Bioinform. 2024, 25, 105. [Google Scholar] [CrossRef]
  16. Huang, X.; Huang, K.; Johnson, T.; Radovich, M.; Zhang, J.; Ma, J.; Wang, Y. ParsVNN: Parsimony visible neural networks for uncovering cancer-specific and drug-sensitive genes and pathways. NAR Genom. Bioinform. 2021, 3, lqab097. [Google Scholar] [CrossRef]
  17. Taj, F.; Stein, L.D. MMDRP: Drug response prediction and biomarker discovery using multi-modal deep learning. Bioinform. Adv. 2024, 4, vbae010. [Google Scholar] [CrossRef]
  18. He, X.; Folkman, L.; Borgwardt, K. Kernelized rank learning for personalized drug recommendation. Bioinformatics 2018, 34, 2808–2816. [Google Scholar] [CrossRef]
  19. Lenhof, K.; Eckhart, L.; Gerstner, N.; Kehl, T.; Lenhof, H.P. Simultaneous regression and classification for drug sensitivity prediction using an advanced random forest method. Sci. Rep. 2022, 12, 13458. [Google Scholar] [CrossRef]
  20. Moughari, F.A.; Eslahchi, C. A computational method for drug sensitivity prediction of cancer cell lines based on various molecular information. PLoS ONE 2021, 16, e0250620. [Google Scholar] [CrossRef]
  21. Emdadi, A.; Eslahchi, C. DSPLMF: A Method for Cancer Drug Sensitivity Prediction Using a Novel Regularization Approach in Logistic Matrix Factorization. Front. Genet. 2020, 11, 75. [Google Scholar] [CrossRef]
  22. Choi, J.; Park, S.; Ahn, J. RefDNN: A reference drug based neural network for more accurate prediction of anticancer drug resistance. Sci. Rep. 2020, 10, 1861. [Google Scholar] [CrossRef]
  23. Zhang, F.; Wang, M.; Xi, J.; Yang, J.; Li, A. A novel heterogeneous network-based method for drug response prediction in cancer cell lines. Sci. Rep. 2018, 8, 3355. [Google Scholar] [CrossRef] [PubMed]
  24. Liu, M.; Shen, X.; Pan, W. Deep reinforcement learning for personalized treatment recommendation. Stat. Med. 2022, 41, 4034–4056. [Google Scholar] [CrossRef] [PubMed]
  25. Eckardt, J.-N.; Wendt, K.; Bornhäuser, M.; Middeke, J.M.; Stadlbauer, A.; Meyer-Baese, A.; Zimmermann, M. Reinforcement Learning for Precision Oncology. Cancers 2021, 13, 4624. [Google Scholar] [CrossRef] [PubMed]
  26. Shamout, F.; Zhu, T.; Clifton, D.A. Machine Learning for Clinical Outcome Prediction. IEEE. Rev. Biomed. Eng. 2021, 14, 116–126. [Google Scholar] [CrossRef]
  27. Scott, I.A.; Cook, D.; Coiera, E.W.; Richards, B. Machine learning in clinical practice: Prospects and pitfalls. Med. J. Aust. 2019, 211, 203–205.e1. [Google Scholar] [CrossRef]
  28. Bottomly, D.; Long, N.; Schultz, A.R.; Kurtz, S.E.; Tognon, C.E.; Johnson, K.; Abel, M.; Agarwal, A.; Avaylon, S.; Benton, E.; et al. Integrative analysis of drug response and clinical outcome in acute myeloid leukemia. Cancer Cell 2022, 40, 850–864.e9. [Google Scholar] [CrossRef]
  29. Yang, W.; Soares, J.; Greninger, P.; Edelman, E.J.; Lightfoot, H.; Forbes, S.; Bindal, N.; Beare, D.; Smith, J.A.; Thompson, I.R.; et al. Genomics of Drug Sensitivity in Cancer (GDSC): A resource for therapeutic biomarker discovery in cancer cells. Nucleic Acids Res. 2012, 41, D955–D961. [Google Scholar] [CrossRef]
  30. Gimeno, M.; José-Enériz, E.S.; Fernandez, S.V.; Agirre, X.; Prosper, F.; Rubio, A.; Carazo, F. Explainable Artificial Intelligence for Precision Medicine in Acute Myeloid Leukemia. Front. Immunol. 2022, 13, 977358. [Google Scholar] [CrossRef]
  31. Chen, X.; Ishwaran, H. Random forests for genomic data analysis. Genomics 2012, 99, 323–329. [Google Scholar] [CrossRef]
  32. Branson, N.; Cutillas, P.R.; Bessant, C. Comparison of multiple modalities for drug response prediction with learning curves using neural networks and XGBoost. Bioinform. Adv. 2023, 4, vbad190. [Google Scholar] [CrossRef]
  33. Gimeno, M.; del Real, K.S.; Rubio, A. Precision oncology: A review to assess interpretability in several explainable methods. Brief. Bioinform. 2023, 24, bbad200. [Google Scholar] [CrossRef]
  34. Lundberg, S.M.; Erion, G.; Chen, H.; DeGrave, A.; Prutkin, J.M.; Nair, B.; Katz, R.; Himmelfarb, J.; Bansal, N.; Lee, S.I. From local explanations to global understanding with explainable AI for trees. Nat. Mach. Intell. 2020, 2, 56–67. [Google Scholar] [CrossRef]
  35. Lundberg, S.M.; Allen, P.G. Consistent feature attribution for tree ensembles. arXiv 2017, arXiv:1706.06060. [Google Scholar] [CrossRef]
Figure 1. Influence of Gamma in Seats Distribution. This diagram illustrates the impact of the gamma parameter in distributing seats. A high gamma value enforces a ‘winner-takes-all’ approach, prioritizing the most effective drug. Conversely, a low gamma results in a balanced distribution, allowing all or almost all drugs to be considered.
Applsci 15 10853 g001
Figure 2. SEATS Method Overview. The SEATS method begins by converting drug response scores into pseudoprobabilities using IC50* values and a tunable parameter, which adjusts the distribution sharpness. Initial seats are assigned to drugs based on these pseudoprobabilities. The seats are then proportionally allocated and adjusted, creating an expanded dataset for model training. This process emphasizes partial efficacy while highlighting the top-performing drug.
Applsci 15 10853 g002
Figure 3. Optimal Decision Tree Framework. The diagram illustrates the ODT algorithm. It includes a matrix of drug response values. The tree iteratively splits based on biomarkers, optimizing treatment strategies by selecting the most effective drugs for each patient subgroup.
Applsci 15 10853 g003
Figure 4. Performance Evaluation of Prediction Models Following 5-Fold Cross-Validation on the BeatAML Waves 1 and 2 Cohort. The box plot displays the performance of various models, including ODT, RF, and XGBoost, across different genomic data types (expression and mutations). RF and XGBoost models are presented with 1 (none), 6, 16, 19 and 22 seats. The plot highlights variations in predictive accuracy in comparison to the oracle.
Applsci 15 10853 g004
Figure 5. Performance Evaluation of Prediction Models on the BeatAML Waves 3 and 4 Cohort. The box plot displays the performance of various models, including ODT, RF, and XGBoost, across different genomic data types (expression and mutations). RF and XGBoost models are presented with 1 (none), 6, 16, 19 and 22 seats. The plot highlights variations in predictive accuracy in comparison to the oracle.
Applsci 15 10853 g005
Figure 6. Heatmap of Drug Selection Frequencies for Waves 3 + 4. This heatmap illustrates the frequency with which each model’s top prediction corresponded to the oracle’s ranked drugs (where Rank 1 is the best drug). Warmer colors indicate higher frequencies of selection, highlighting the model’s ability to consistently identify the most effective drugs.
Applsci 15 10853 g006
Figure 7. Performance Evaluation of Prediction Models on the GDSC Dataset Using Mutations: The box plot displays the performance of various models, including ODT, RF, and XGBoost, all trained with mutation data. RF and XGBoost models are shown with 1 (none), 6, 16, 19 and 22 seats, highlighting variations in predictive accuracy compared to the oracle.
Applsci 15 10853 g007
Figure 8. Comparison of Model Training Time and Feature Utilization. The top panel displays training times for various models (ODT, RF, XGBoost) using expression (Exp) and mutation (Mut) data. The bottom panel shows the number of features used by each model type. Patterns and colors differentiate between data types and model.
Applsci 15 10853 g008
Figure 9. ODT Using Expression of Patients from Waves 1 and 2. This decision tree, generated by the ODT package in R, illustrates the splitting of nodes based on expression thresholds of biomarkers such as SLC7A7 and CYP2E1. The width of the lines indicates the number of patients in each split, with wider lines representing larger patient groups. Each branch leads to specific drug recommendations, such as Venetoclax, Flavopiridol, and Trametinib, based on these expression thresholds.
Applsci 15 10853 g009
Figure 10. Feature Importance Analysis. The bar charts display the top 20 most important genes for the RFExp_s10 and XGBoostExp_v5 models. The RF model uses the mean decrease in the Gini index, while the XGBoost model utilizes the gain factor to highlight the genes with the most significant influence on predictions.
Applsci 15 10853 g010
Disclaimer/Publisher’s Note: The statements, opinions and data contained in all publications are solely those of the individual author(s) and contributor(s) and not of MDPI and/or the editor(s). MDPI and/or the editor(s) disclaim responsibility for any injury to people or property resulting from any ideas, methods, instructions or products referred to in the content.