Article

Three-Dimensional Visualization of Product Manufacturing Information in a Web Browser Based on STEP AP242 and WebGL

1
School of Marine Equipment and Mechanical Engineering, Jimei University, Xiamen 361021, China
2
School of Computer Engineering, Jimei University, Xiamen 361021, China
*
Author to whom correspondence should be addressed.
Appl. Sci. 2025, 15(19), 10847; https://doi.org/10.3390/app151910847
Submission received: 2 August 2025 / Revised: 7 October 2025 / Accepted: 7 October 2025 / Published: 9 October 2025

Abstract

Featured Application

Semantic extraction of product manufacturing information and Web-based product manufacturing information visualization.

Abstract

Commercial computer-aided design (CAD) software is often expensive. This paper examines the use of product manufacturing information (PMI) web visualization to address the challenges faced by production site personnel and external partners collaborating on product development. These individuals need to be able to view or query PMI in model-based definition models without having to install professional CAD software. A detailed analysis of the relationships between PMI entity attributes in standard for the exchange of product model data (STEP) AP242 files was conducted. An algorithm for the automatic parsing and mapping of PMI semantics to a web browser is presented. Using linear sizes as an example, this paper introduces a prototype system with the following features: PMI web visualization; automatic linkage of PMI to associated geometry; browser-native rendering without the need for dedicated applications; and integration of graphical presentation and semantic representation. The effectiveness and feasibility of the prototype system are validated through case studies. However, the system has limitations when handling large assemblies with compound tolerances, curved dimension placements, and overlapping annotations, which presents areas for future research.

1. Introduction

Model-based definition (MBD) is an innovative approach of managing engineering and business processes. It utilizes the three-dimensional (3D) digital models as the sole source of information for design, manufacturing, assembly, inspection, and maintenance throughout the entire product lifecycle [1]. MBD facilitates the seamless and rapid flow of product information, enabling efficient, real-time data sharing, and ensuring safe and reliable traceability. This approach shortens the product research and development cycle, improves product quality, and reduces time-to-market [2,3]. Although MBD offers significant benefits, numerous challenges remain in adapting to the new demands of smart manufacturing and Industry 4.0 [4,5,6].
The number of people who only need to view information is ten times greater than those who create it [7]. Commercial computer-aided design (CAD) software is expensive, making it unaffordable for all departments within an enterprise, especially those that only need to browse or query an MBD model and do not require editing or modification capabilities. To implement MBD, a comprehensive infrastructure of low-end viewers (LEVs) is deployed on the shop floor to access MBD models that were previously provided in paper form [1,2,3]. However, accessing MBD models using LEVs without installing professional CAD software remains a challenge (Figure 1).
Complex products are developed through collaboration among multiple, geographically dispersed partners [8]. These partners may include original equipment manufacturers, market service providers, corporate parts, and component manufacturers, among others. Given the high cost of commercial CAD software, these partners may lack the budget to install it. Consequently, enabling them to access MBD models without installing professional CAD software remains a challenge (Figure 1).
The aforementioned issue could easily be addressed if the MBD model associated with the product manufacturing information (PMI) could be viewed via a web browser free of charge. This raises the first research question: Can PMI web visualization be realized?
Standard for the exchange of product model data (STEP) AP242 is the most widely adopted neutral standard [9]. Several open-source or free tools, such as eDrawings [10], Autodesk Forge [11], Open Cascade CAD Assistant [12], IDA-STEP Basic [13] and OpenSTEP Viewer [14], have already enabled users to visualize STEP AP242 models along with their associated PMI, eliminating the need for professional CAD software. However, thorough testing has revealed functional limitations of these tools concerning the automatic linking of PMI to associated geometry, the semantic representation (SR) of PMI, the integration of PMI graphical presentation (GP) and SR, and web-based PMI visualization. These limitations will be discussed in detail in Section 2.
Transmitting PMI semantics across different application systems could advance paperless manufacturing, digital twins, and smart manufacturing. This leads to another research question: Can PMI semantics be automatically extracted from STEP AP242 files and displayed in a web browser?
This paper addresses the aforementioned research questions by investigating the extraction of PMI semantics from a STEP AP242 file and WebGL-based PMI rendering. The main contributions of the paper include: the development of a parsing and mapping algorithm for PMI semantics in a STEP AP242 file using WebGL/Three.js, WebGL-based PMI rendering, and a prototype demonstration. However, this research has limitations in handling large assemblies with compound tolerances, surface dimension positioning, and overlapping annotations—all of which represent areas for future research.
The remainder of this paper is organized as follows: Section 2 provides a review of the recent work related to PMI GP and SR, the parsing and transformation of a STEP AP242 file, and PMI web visualization. Section 3 explains the process of parsing a STEP AP242 file to extract PMI semantics. Section 4 describes a parsing and mapping algorithm for PMI GP and SR using WebGL/Three.js and presents a prototype demonstration. The main results are presented in Section 5. Finally, Section 6 discusses the paper’s limitations and potential avenues for future research.

2. Related Works

2.1. Product Manufacturing Information Graphical Presentation and Semantic Representation

There are two forms of product manufacturing information (PMI) in Model-based definition (MBD): graphical presentation (GP) and semantic representation (SR) [15].
Most commercial computer-aided design software employs a method for three-dimensional (3D) PMI annotations that resemble the approach used for two-dimensional (2D) PMI annotations in traditional engineering drawings. As a result, PMIs are often represented as separate marks located near constrained geometric elements (GEs) [16,17]. In order to accurately interpret the data, readers must possess extensive knowledge of engineering design, manufacturing processes, and assembly. PMI GP is supported by standard for the exchange of product model data (STEP) AP203/AP214/AP242 [9]. Effective PMI GP requires the exact preservation of the color, shape, positioning, and style of geometrical dimensioning and tolerancing (GD&T). While PMI GP is suitable for human interpretation, it poses challenge for automatic processing by computers.
A PMI SR establishes the correct logical relationship with constrained GEs by employing a structured and standardized method of expression. Witherell posits that a PMI SR can provide the following: (1) semantics to manage process specifics across platforms while maintaining the ability to communicate reasonably interpretable information; (2) semantics to guide visual interpretations based on user interest; and (3) semantics to support automated inspection [18]. Among the various computer-aided design (CAD) standards, STEP AP242 is the most widely adopted neutral standard that supports PMI SR [9].
In MBD, achieving PMI SR depends on the following factors:
(1) Complete structural definition. Each symbol, parameter, and modifier in a 3D PMI annotation must have a clear, machine-readable semantic definition that complies with the relevant international standards (e.g., ISO 16792 [19] and ASME Y14.5 [20]). Non-compliance with these standards may introduce ambiguity, thereby hindering automatic process by machines.
(2) Logical association. Each PMI must be logically associated with its constrained GE. This relationship exists at the data level rather than the visual level. Agovic and Yang noted that PMI annotations on the MBD model must be associated with a processing or surface feature, as computer-aided manufacturing (CAM) and coordinate measuring machine (CMM) software cannot automatically process PMI associated with an auxiliary GE or edge [21,22]. Lipman pointed out that, in an MBD model, the hole diameter should be associated with the surfaces of the cylindrical hole rather than with its edges, to facilitate automatic inspection planning for tolerances [23]. Chen proposed a methodology for the precise representation of 3D annotation information in MBD for product digitization, aiming to prevent semantic annotation ambiguity [24]. However, how can we establish mechanisms to automatically determine whether the PMI has been logically associated with the constrained GEs? If PMI does not establish these associations, can algorithms automatically reconstruct them? These questions still require in-depth research.

2.2. Parsing and Transforming the STEP AP242 File

Accelerating collaborative product development requires clear and unambiguous communication of product data among design, manufacturing, assembly, and inspection processes [21,25]. As STEP AP242 is the most widely accepted standard for supporting PMI GP and SR, this discussion will focus on the automatic parsing and transforming of a STEP AP242 (edition 2.0) file.
(1) Extracting GD&T data. Martin proposed a novel method for mapping a tolerance feature from a STEP AP242 file onto a triangular surface mesh feature in an STL file for tolerance analysis [26]. Petruccioli suggests integrating computer-aided tolerancing (CAT) with product cost management tools and implementing a tolerance-cost optimization process through PMI transformation [27]. Urbas proposed using a PiXYZ plug-in to transfer a STEP AP242 file with PMI from SolidWorks to Unity 3D. In the converted model, tolerances can be displayed one by one on head-mounted devices to assist users with measurement operations [28].
(2) Feature recognition. PMI data in a STEP AP242 file can be extracted to identify the parts within an assembly, determine their positions relative to each other, and establish the assembly constraints and mating features. This information is useful for automatic robot programming [29]. To facilitate the sharing of product information across different applications, Al-Wswasi and Ivanov proposed an automatic feature recognition technique for converting product data between CAD and computer-aided process planning (CAPP). They introduced a STEP file parsing algorithm that identifies the number of faces, the type of each face, the relationships among the faces, and the surface types of the faces before and after feature transformation within a STEP file. This parser also automatically recognizes rotational part features [30]. Lupi proposed an automatic self-extraction method for 3D text annotation extraction from a STEP AP242 file using the National Institute of Standards and Technology (NIST) STEP Analyzer and Viewer, establishing a flexible vision inspection system [31,32].
(3) Semantic transformation. Hardwick proposed a five-phase roadmap for implementing semantic GD&T in manufacturing. The aim was to create a transparent manufacturing system and evaluate the effectiveness of GD&T in meeting design specifications within a production environment. The key lies in developing a set of transformation protocols between the normalized STEP AP242 model and the user-friendly JavaScript object notations of the virtual factory [33]. To create a unified information model from design to inspection, Kwon suggested merging as-designed data represented in STEP AP242 with as-inspected data represented in Quality Information Framework (QIF), leveraging knowledge graphs for decision-making [34]. Stéphane expanded on the transformation of a STEP AP242 file into an ontology model file to address methods for the semantic enrichment of CAD models [35].
Although numerous methods for parsing and transforming STEP AP242 files have been proposed, a universal PMI semantic parsing algorithm remains elusive due to the inherent diversity and complexity involved.

2.3. PMI Web Visualization

Achieving PMI web visualization is of significant practical importance for several reasons: (1) it eliminates the need to install and configure expensive, bulky professional CAD software, significantly expanding the scope of MBD applications; (2) it enables access to MBD models anytime, anywhere, on various software platforms (e.g., Windows, macOS, or Linux) and hardware devices (e.g., tablets, smartphones, or iPads); (3) it enables user to share and access MBD models via a single URL, enabling parts manufacturers, suppliers, and sales teams to immediately view the latest version of the MBD model; (4) it streamlined the MBD model review process, allowing team members and clients in different locations to collaborate, discuss, and annotate the same MBD model via a web browser [1,2,3].
There are two ways to implement PMI web visualization. The first method involves converting MBD models generated by proprietary CAD software into a format that viewable in a web browser. The second method involves converting standard-format MBD models into a format viewable in a web browser. Because the first method may lead to software lock-in [4,5,6], the second method is adopted in this paper. STEP AP242, being the most widely adopted international standard, has been selected for this purpose.
Although existing STEP visualization tools, such as eDrawings [10], Autodesk Forge [11], OpenCascade CAD Assistant [12], IDA-STEP Basic [13], and OpenSTEP Viewer [14], as well as other lightweight viewers, allow users to access PMI without requiring commercial CAD software, these tools exhibit functional limitations (Table 1). For example, the professional edition of eDrawings incorporates PMI web visualization capabilities, whereas the free basic edition does not. Using eDrawing to query or browse MBD models in a web browser is a cumbersome multi-step process:
(1) Install eDrawings and open an MBD model with PMI;
(2) Use eDrawings to convert the MBD model to an HML format file (not HTML);
(3) Install the allWebPlugin browser plug-in on the client computer;
(4) Load the HML-formatted MBD model file in a web browser to query or view it.
Autodesk Forge does not support PMI web visualization. When an MBD model with PMI is opened in a web browser using Open Cascade CAD Assistant, the PMI exhibits significant geometric association errors and appears disorganized (a case is illustrated in Appendix A). Therefore, this paper investigates a web visualization scheme for PMI that aims to achieve both GP and SR.

3. Extracting Product Manufacturing Information from a STEP AP242 File

3.1. How to Parse a STEP AP242 File

If the Model-based definition (MBD) model displayed in a web browser contains product manufacturing information (PMI) semantics, the extracted PMI data becomes human-readable and ready for automated processing. For example, when combined with virtual reality (VR) technology, these PMI semantics can be utilized for online coordinate measuring machine (CMM). National Institute of Standards and Technology (NIST) STEP Analyzer and Viewer is primarily used to implement geometrical dimensioning and tolerancing (GD&T) tests in Commercial computer-aided design (CAD) software. However, PMI semantic web visualization cannot be achieved simply by using the STEP Analyzer and Viewer, or other existing STEP AP242 parsing methods and tools. Therefore, new algorithms have been developed. When designing the STEP AP242 file parsing algorithm, the following factors were considered: complete extraction of PMI structure data; PMI semantic extraction; automatic linkage of PMI to associated geometry; and integration of PMI graphical presentation (GP) and semantic representation (SR).

3.2. Extracting Geometrical Dimensioning and Tolerancing Information from a STEP AP242 File

This section will focus on how to extract geometrical dimensioning and tolerancing (GD&T) information from a STEP AP242 file, considering the various types of PMI [24,36].

3.2.1. Extracting Dimension Information

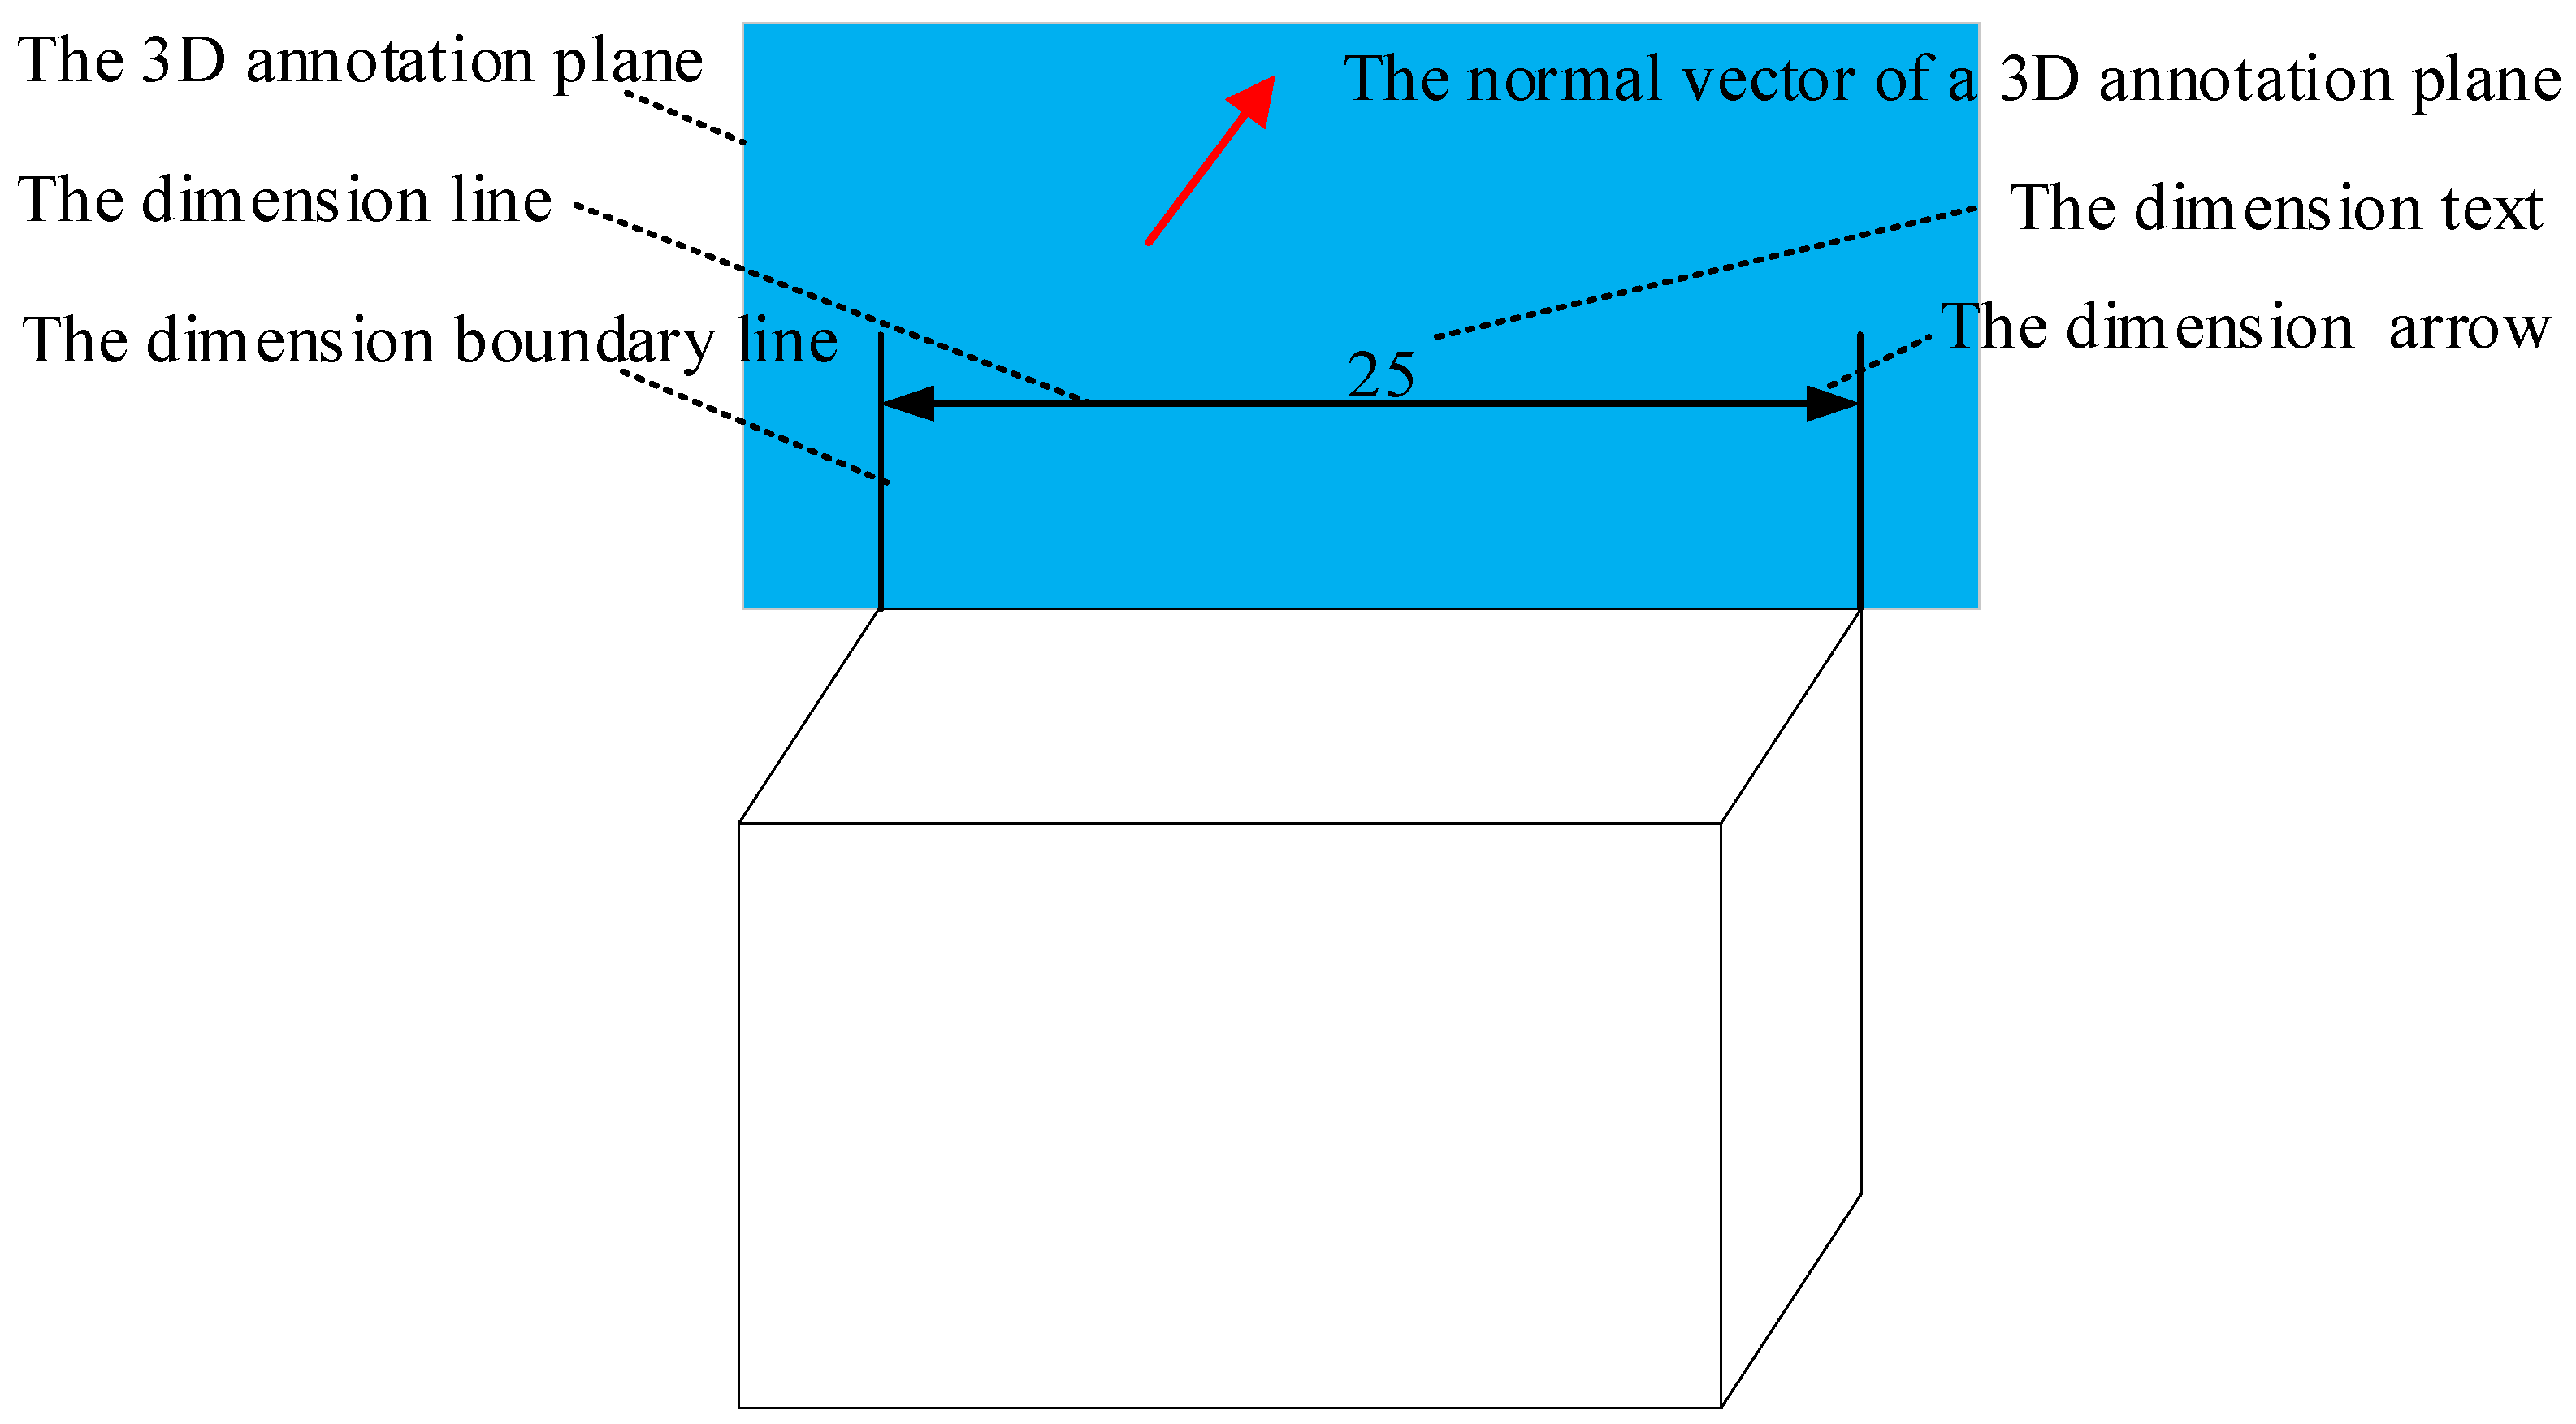
According to ISO 14405-1 [37] and ISO 14405-2 [38], the three-dimensional (3D) dimensions within a STEP AP242 file can be classified as either linear size or non-linear size dimensions (e.g., distance). A similar classification exists for angular dimensions, per ISO 14405-3 [39]. The methods for extracting these different types of 3D dimension information are analogous. For example, the annotation contents of a linear size include the geometric elements (GEs) with which the dimension is associated (a linear size must be associated with two distinct geometry feature surfaces), as well as a dimension text, a dimension line, a dimension arrow, a dimension position, and a dimension direction (Figure 2). A dimension text comprises the dimension value, the dimensional tolerancing (DT), and one or more modifiers. In order to accurately convey the original design intent of the 3D annotations in a web browser, these details must be extracted correctly.
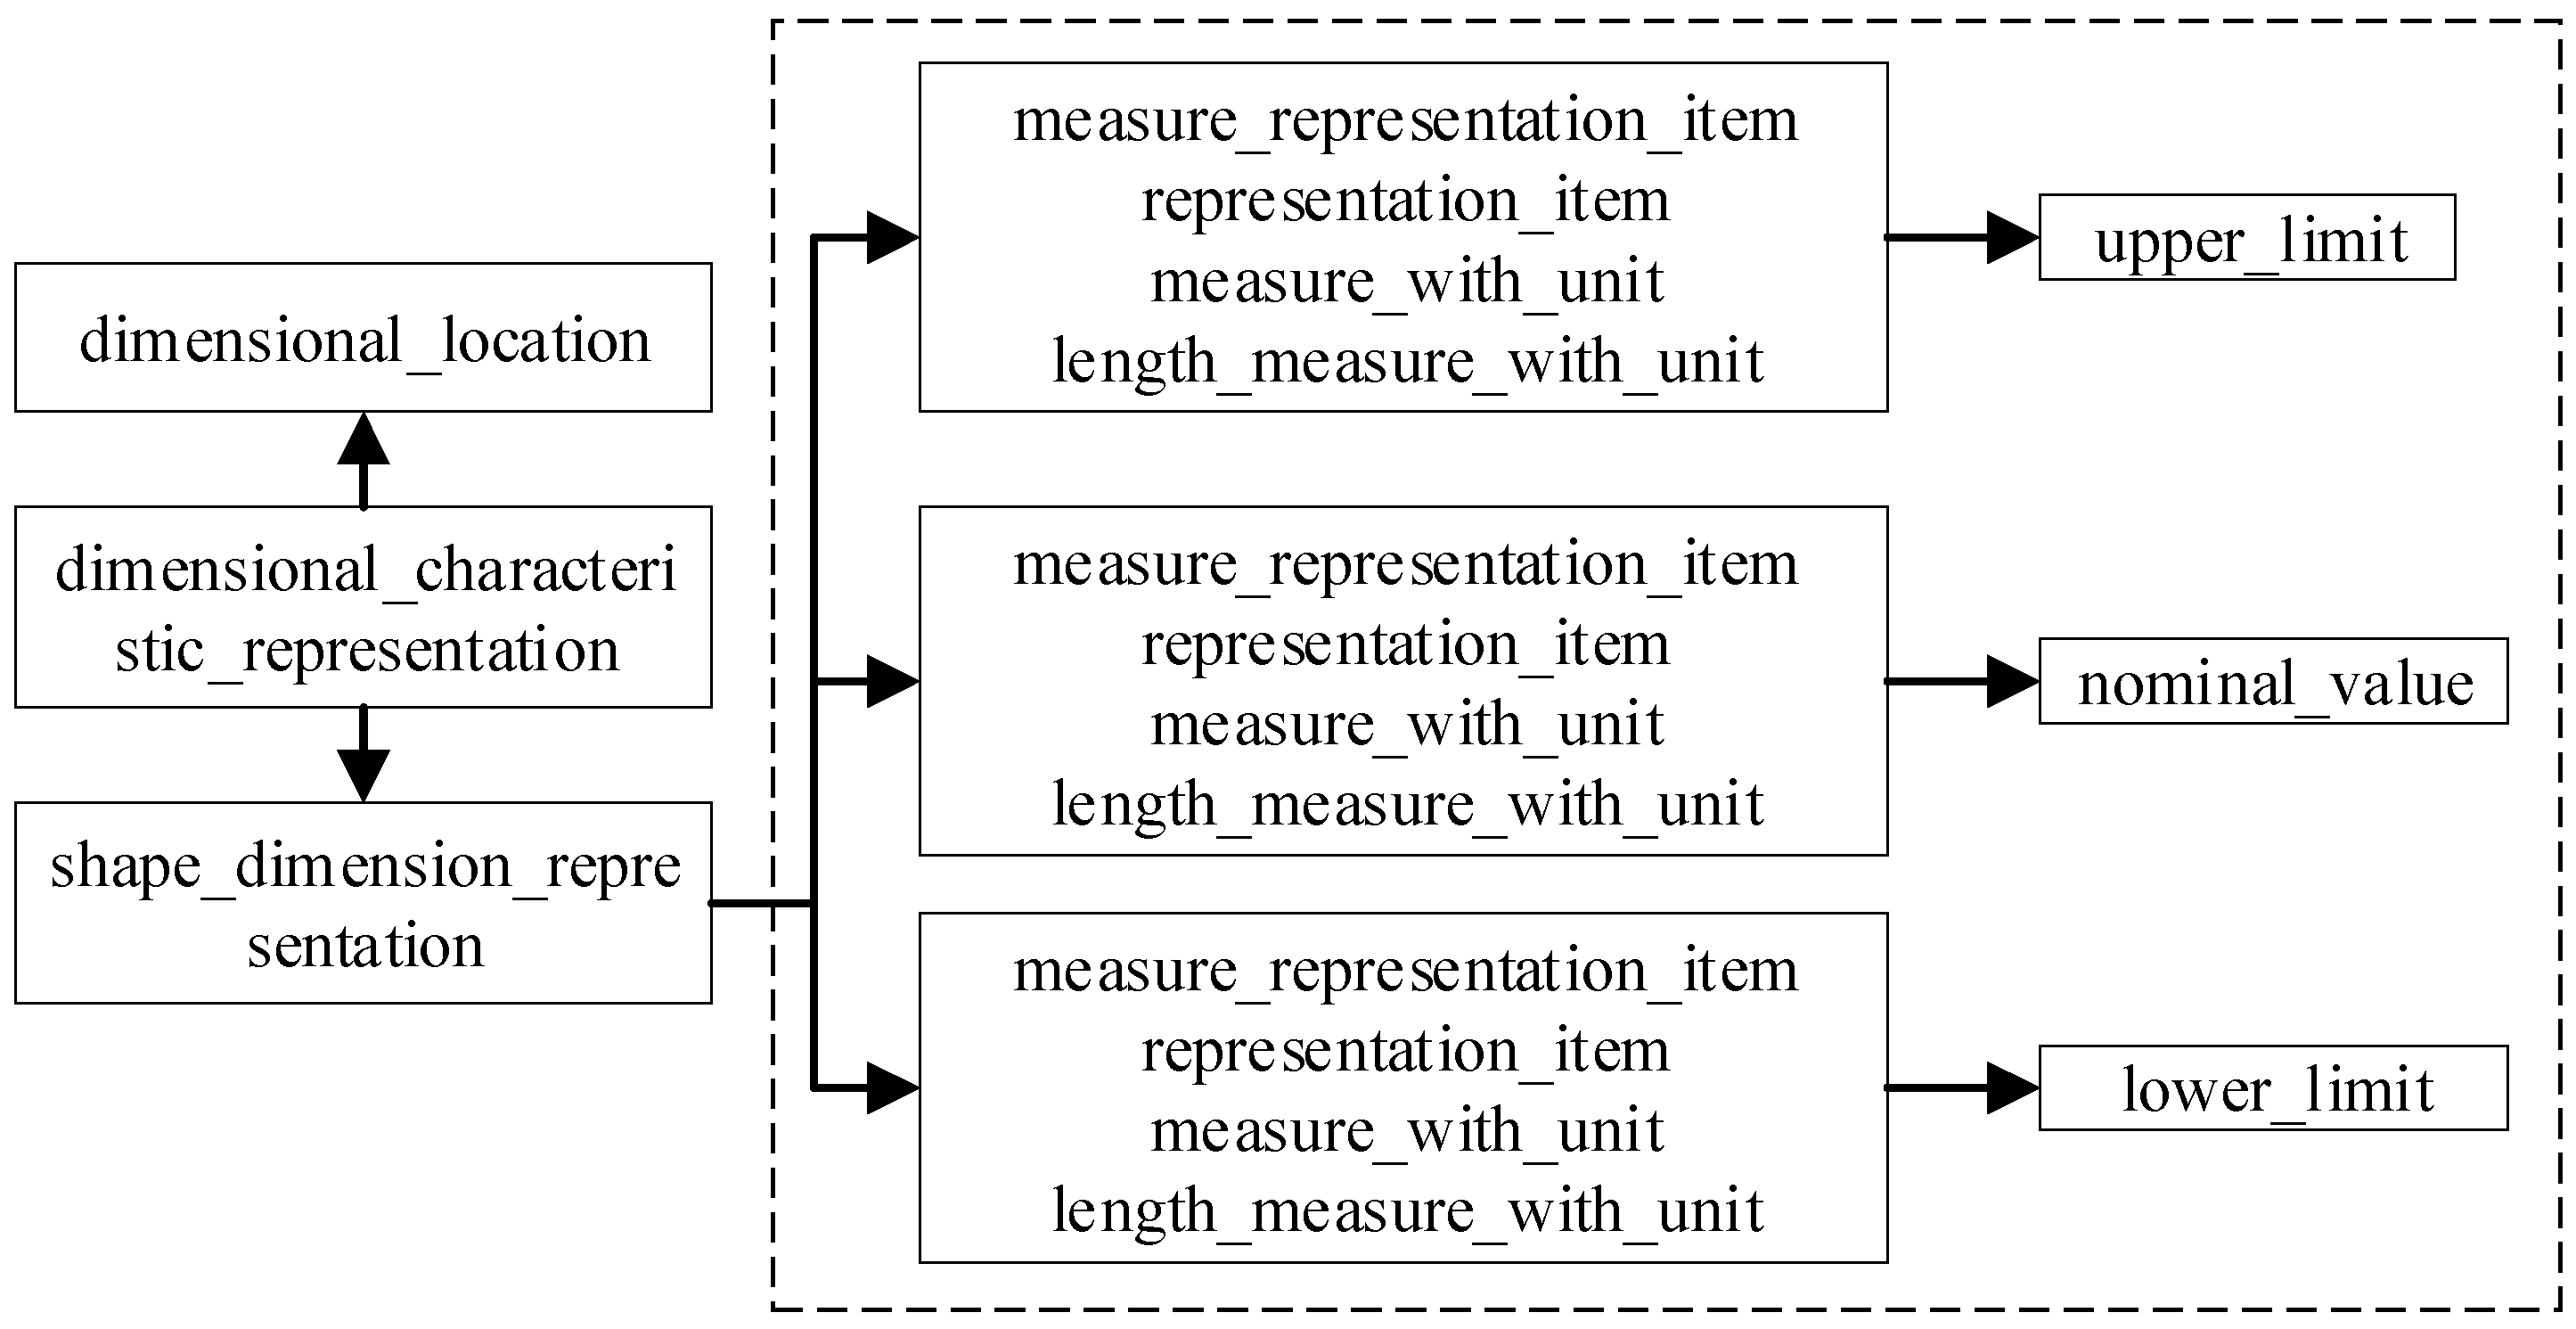
Figure 3 depicts the entity–attribute relationship within a STEP AP242 file [15]. The 3D dimension annotation is represented by the entity “DIMENSIONAL_CHARACTERISTIC_REPRESENTATION”, which specifies how dimension features are measured and the permissible variation for each dimension. The “DRAUGHTING_MODEL_ITEM_ASSOCIATION” entity indicates the geometric feature to which a 3D dimension is linked, and it references the “DRAUGHTING_CALLOUT” entity, which denotes the style of the 3D dimension and its annotation text. The “DIMENSIONAL_CHARACTERISTIC_REPRESENTATION” entity references the “SHAPE_DIMENSION_REPRESENTATION” entity, which encapsulates the 3D dimension value, DT, and dimension unit. The entities “DIMENSIONAL_CHARACTERISTIC_REPRESENTATION” and “DRAUGHTING_ MODEL_ITEM_ASSOCIATION” are connected through the “DIMENSIONAL_LOCATION” entity, enabling the sequential extraction of 3D dimension annotation information from a STEP AP242 file.
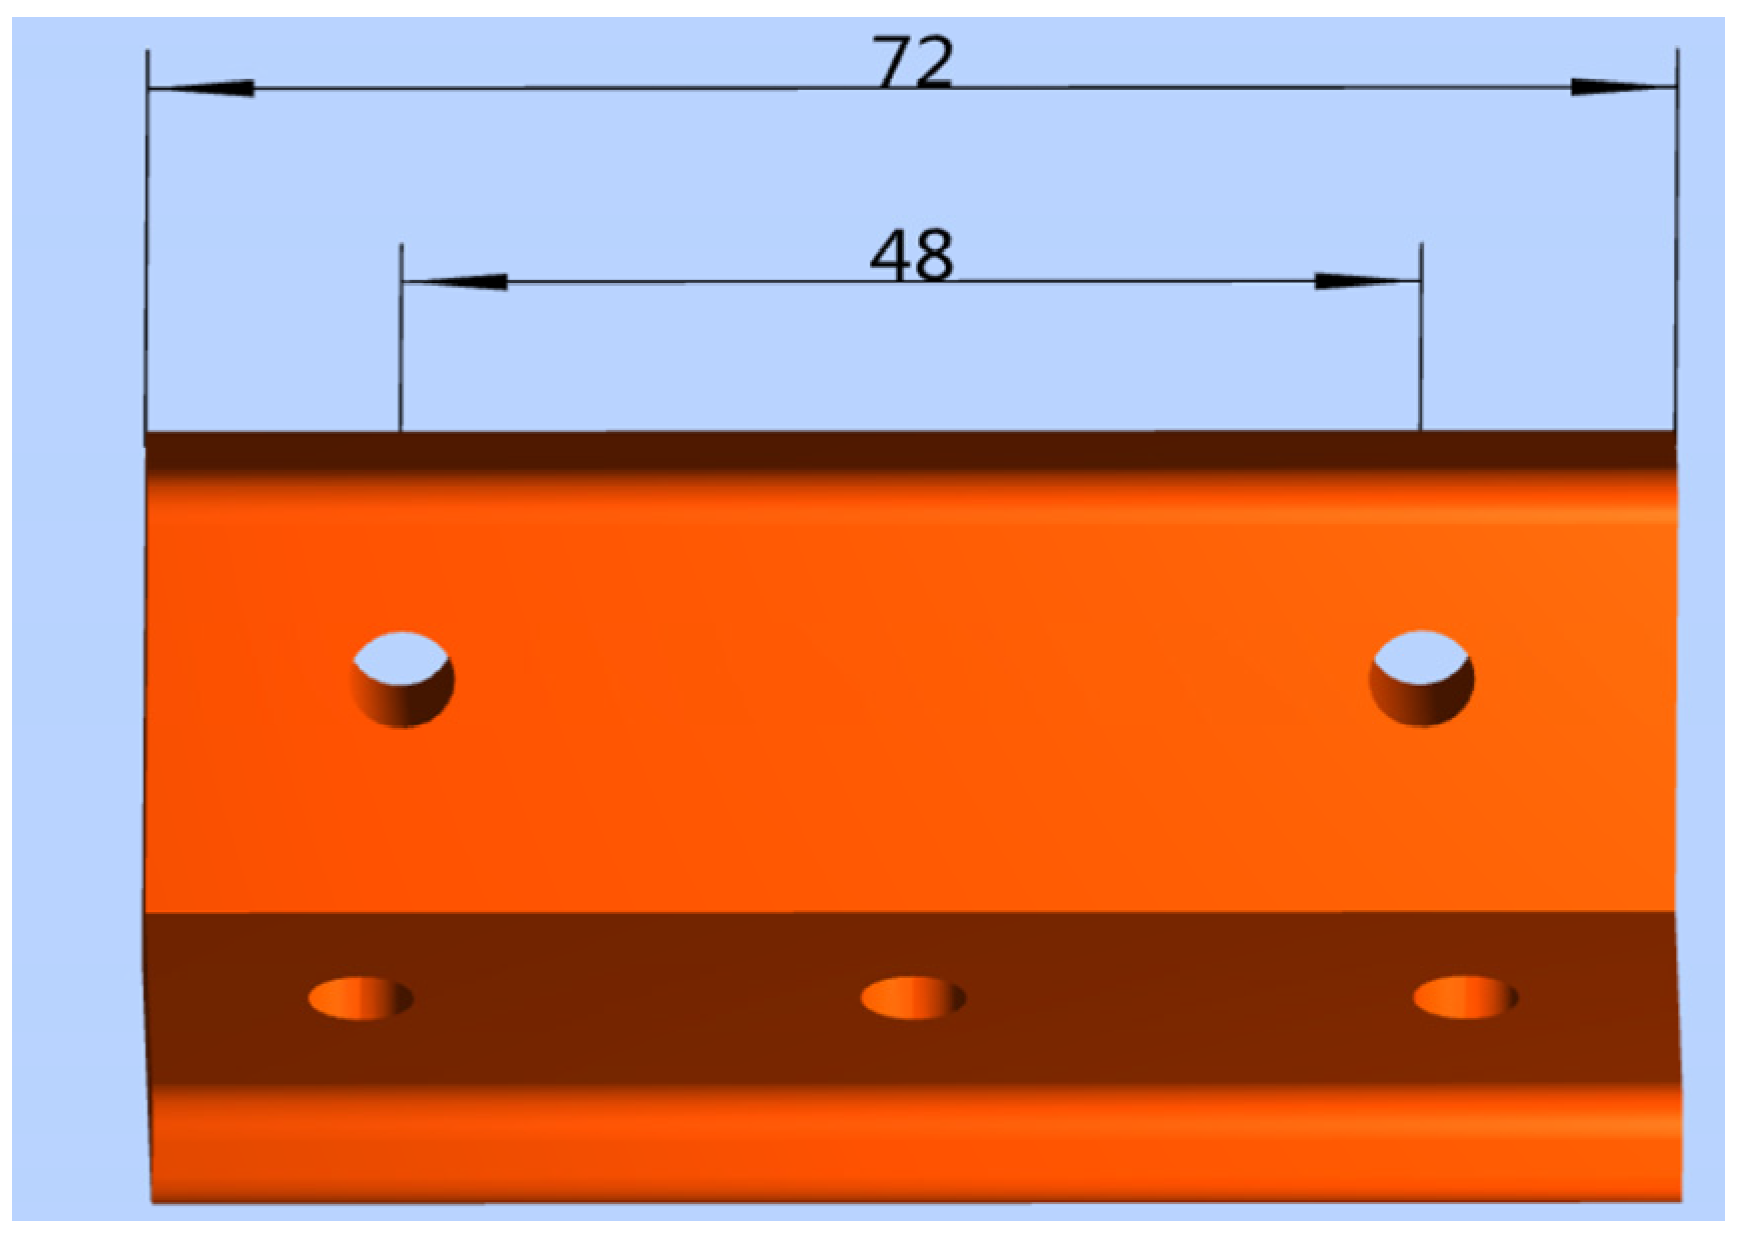
For example, using the part depicted in Figure 4, the process of extracting information for a linear size of “48” (in millimeters) is as follows. The entity reference relationship is illustrated in Figure 5, and a portion of the STEP AP242 file is provided in Appendix B.
Step 1: Search for the entity “DIMENSIONAL_CHARACTERISTIC_REPRESENTATION”. You will find a data line that reads: “#15=DIMENSIONAL_CHARACTERISTIC_REPRESENTATION (#17, #19)”. Parsing the contents of “#15” reveals another data line: “#17=DIMENSIONAL_LOCATION(‘linear distance’, ‘’, #153, #154)”, which describes a linear size, location, and associated objects. Additionally, you can identify another data line: “#19=SHAPE_DIMENSION_REPRESENTATION (‘’, #21, #993)”, which describes a linear size value and its unit of measurement.
Step 2: Search for the entity “DRAUGHTING_MODEL_ITEM_ASSOCIATION”, and you will find the following data line: “#24=DRAUGHTING_MODEL_ITEM_ASSOCIATION (‘PMI representation to presentation link’, ‘’, #17, #65, #37)”. Parse the contents of “#24”, and the data line “#37=DRAUGHTING_CALLOUT(‘’,(#39))” can be identified. Further parsing of the contents of “#37” yields the data line “#39=TESSELLATED_ ANNOTATION_OCCURRENCE(‘’,(#591),#46)”. Parsing the content of “#39” yields the identifier “#46”, which has the attribute “REPRESENTATION_ITEM(‘linear dimension’),” indicating that the type of this dimension is a “linear dimension”.
Step 3: Search for the entity “SHAPE_DIMENSION_REPRESENTATION” and identify the data line “#19=SHAPE_DIMENSION_REPRESENTATION (,#21,#993)”. The data line “#21” contains the dimension value and unit. Examining “#21” for “MEASURE_WITH_UNIT” yields a linear size value of “48” (in Appendix B, on line 623). Referencing “#21” against “SI_UNIT” in “#997” reveals that the unit of linear size is millimeters.
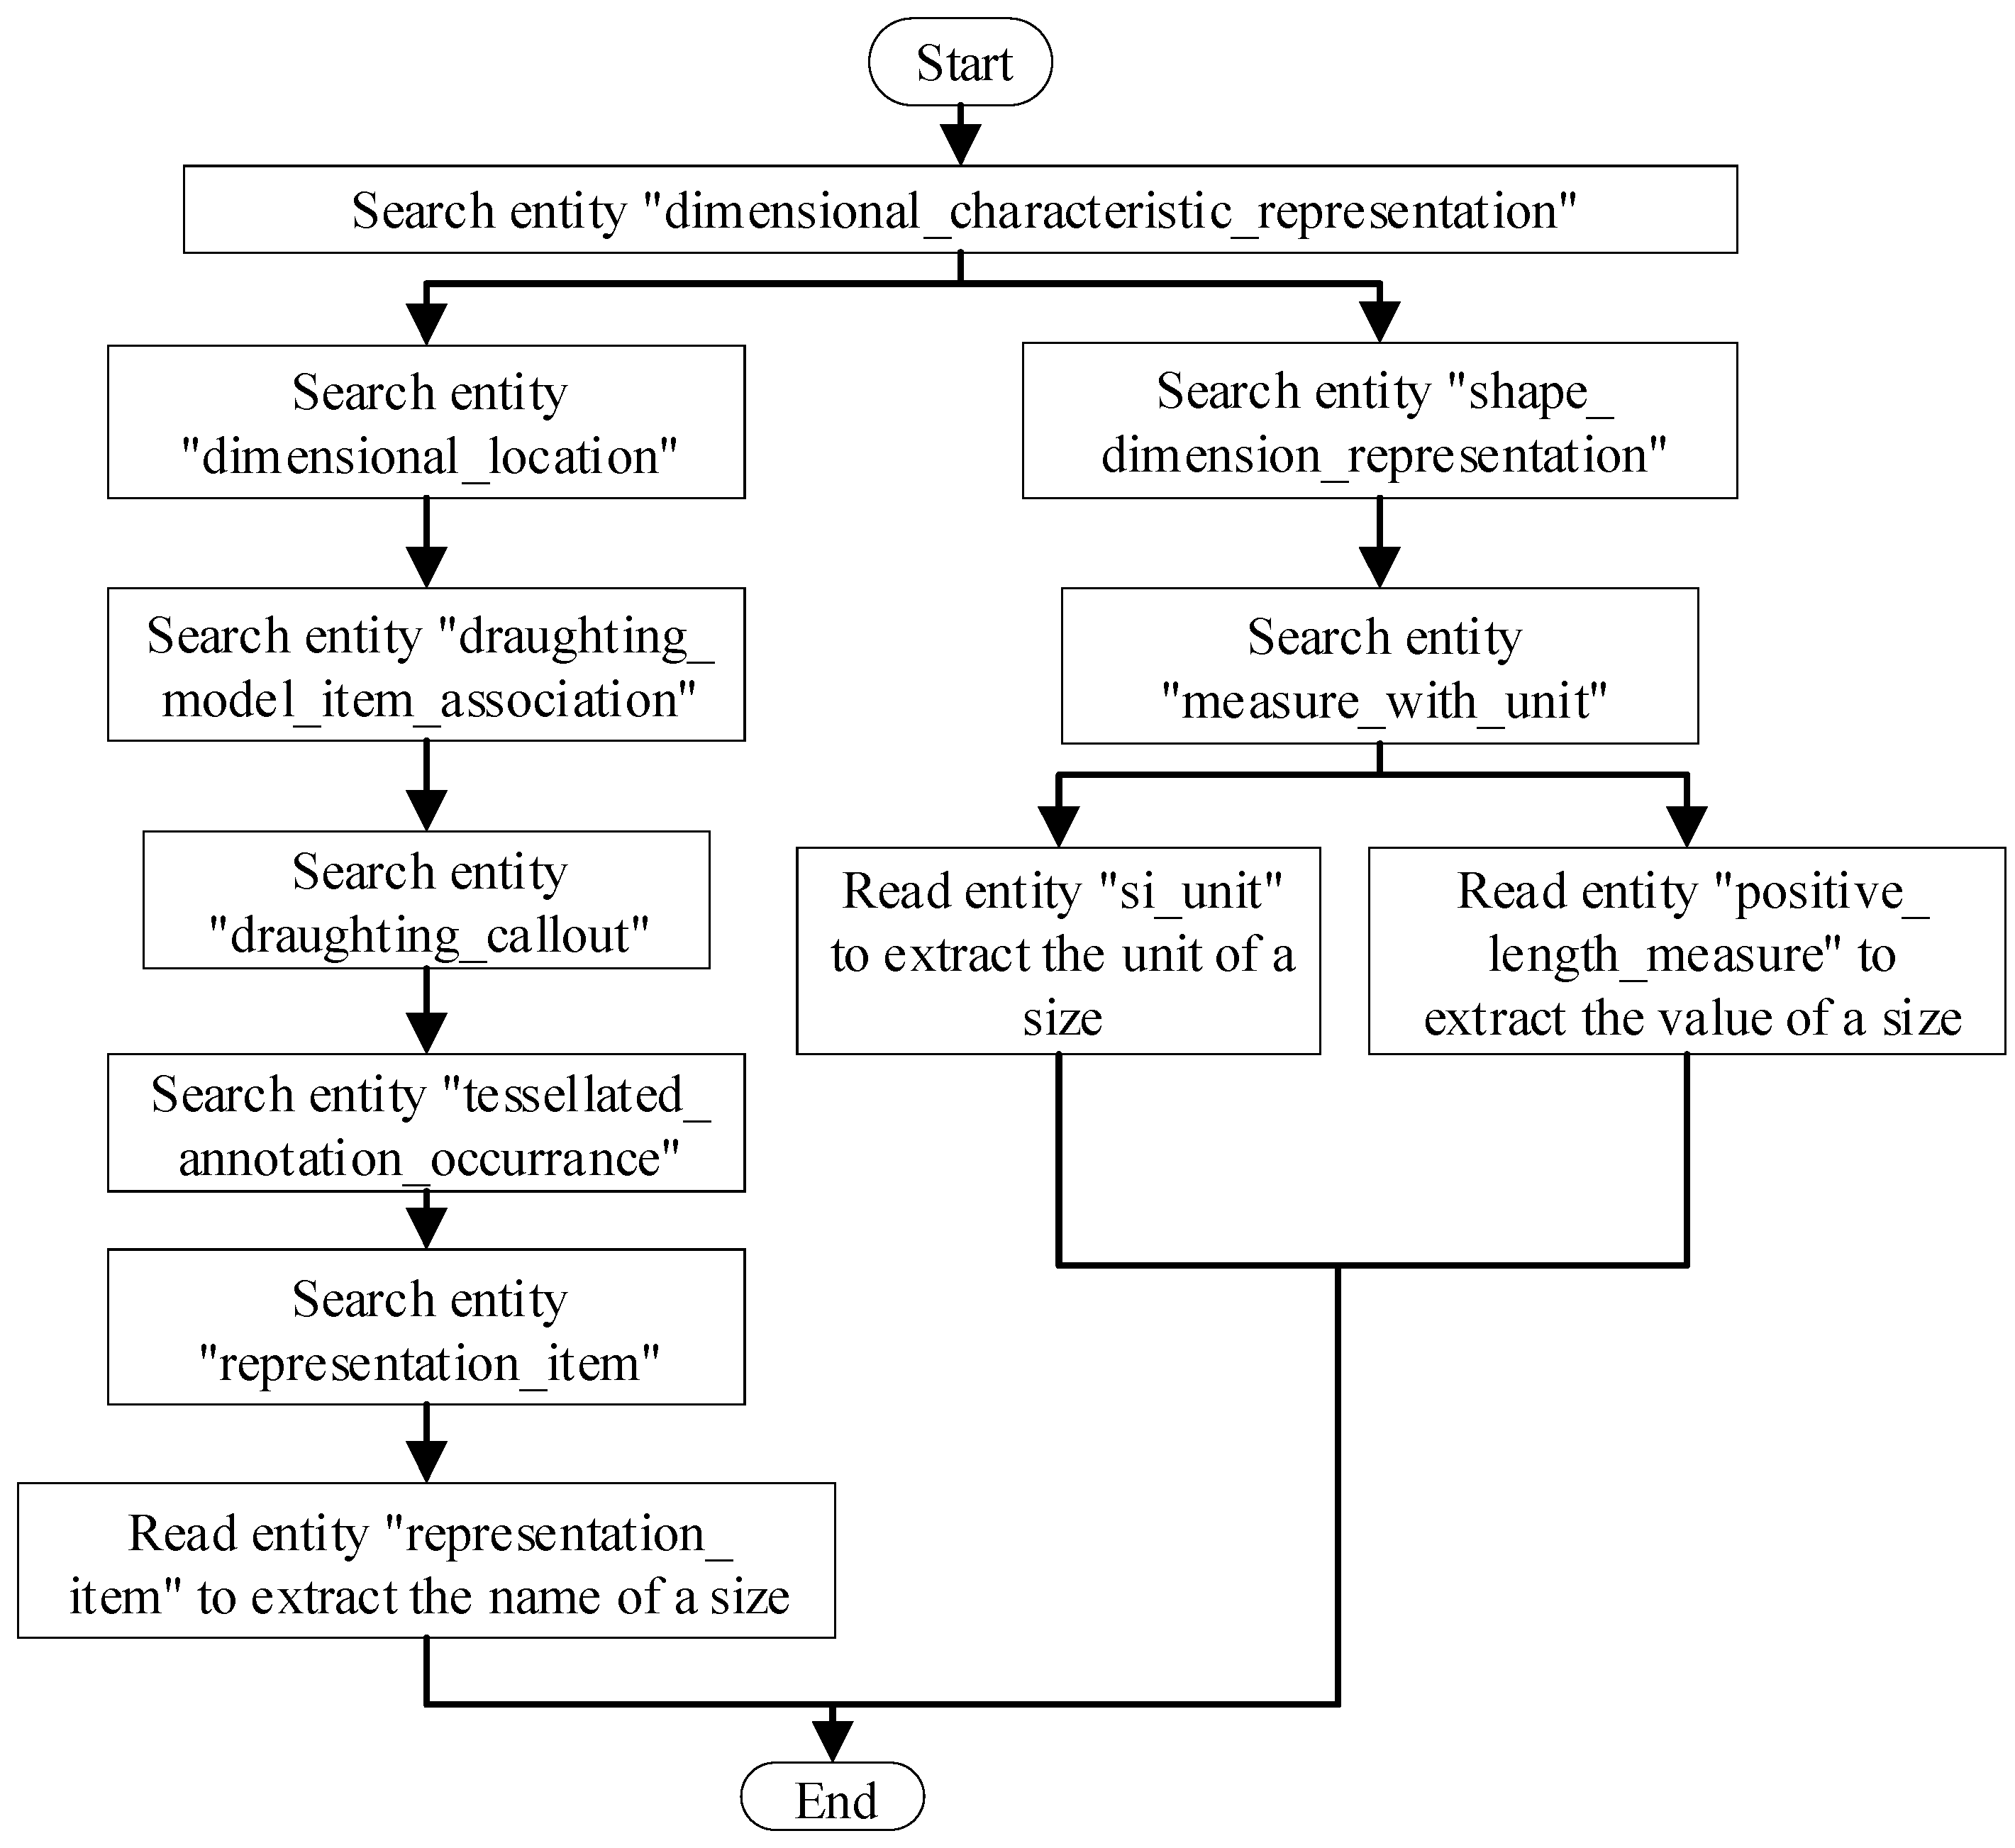
Step 4: If a part contains multiple 3D linear sizes, several “DIMENSION_CHARACTERISTIC_REPRESENTATION” entities will appear in the STEP AP242 file. Since each 3D dimension annotation has a unique identifier, the annotation information can be parsed by iterating through Steps 1–3 (Figure 6).

3.2.2. Extracting DT Information

In an MBD model, 3D annotation tolerance comprises both DT and geometric tolerance (GT). This section will cover the process of extracting DT information, while Section 3.2.3 will detail the extraction of GT information.
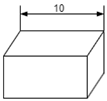
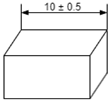
STEP AP242 files present DT information in four styles: nominal size, plus/minus deviation, value range, and tolerance class (Table 2) [15].
  • Nominal size (Table 2). The nominal size is the size specified during the design stage and represents the ideal size that the designer aims to achieve. In a STEP AP242 file, the entity-attribute relationship for a nominal size can be referenced on the right side of Figure 3.
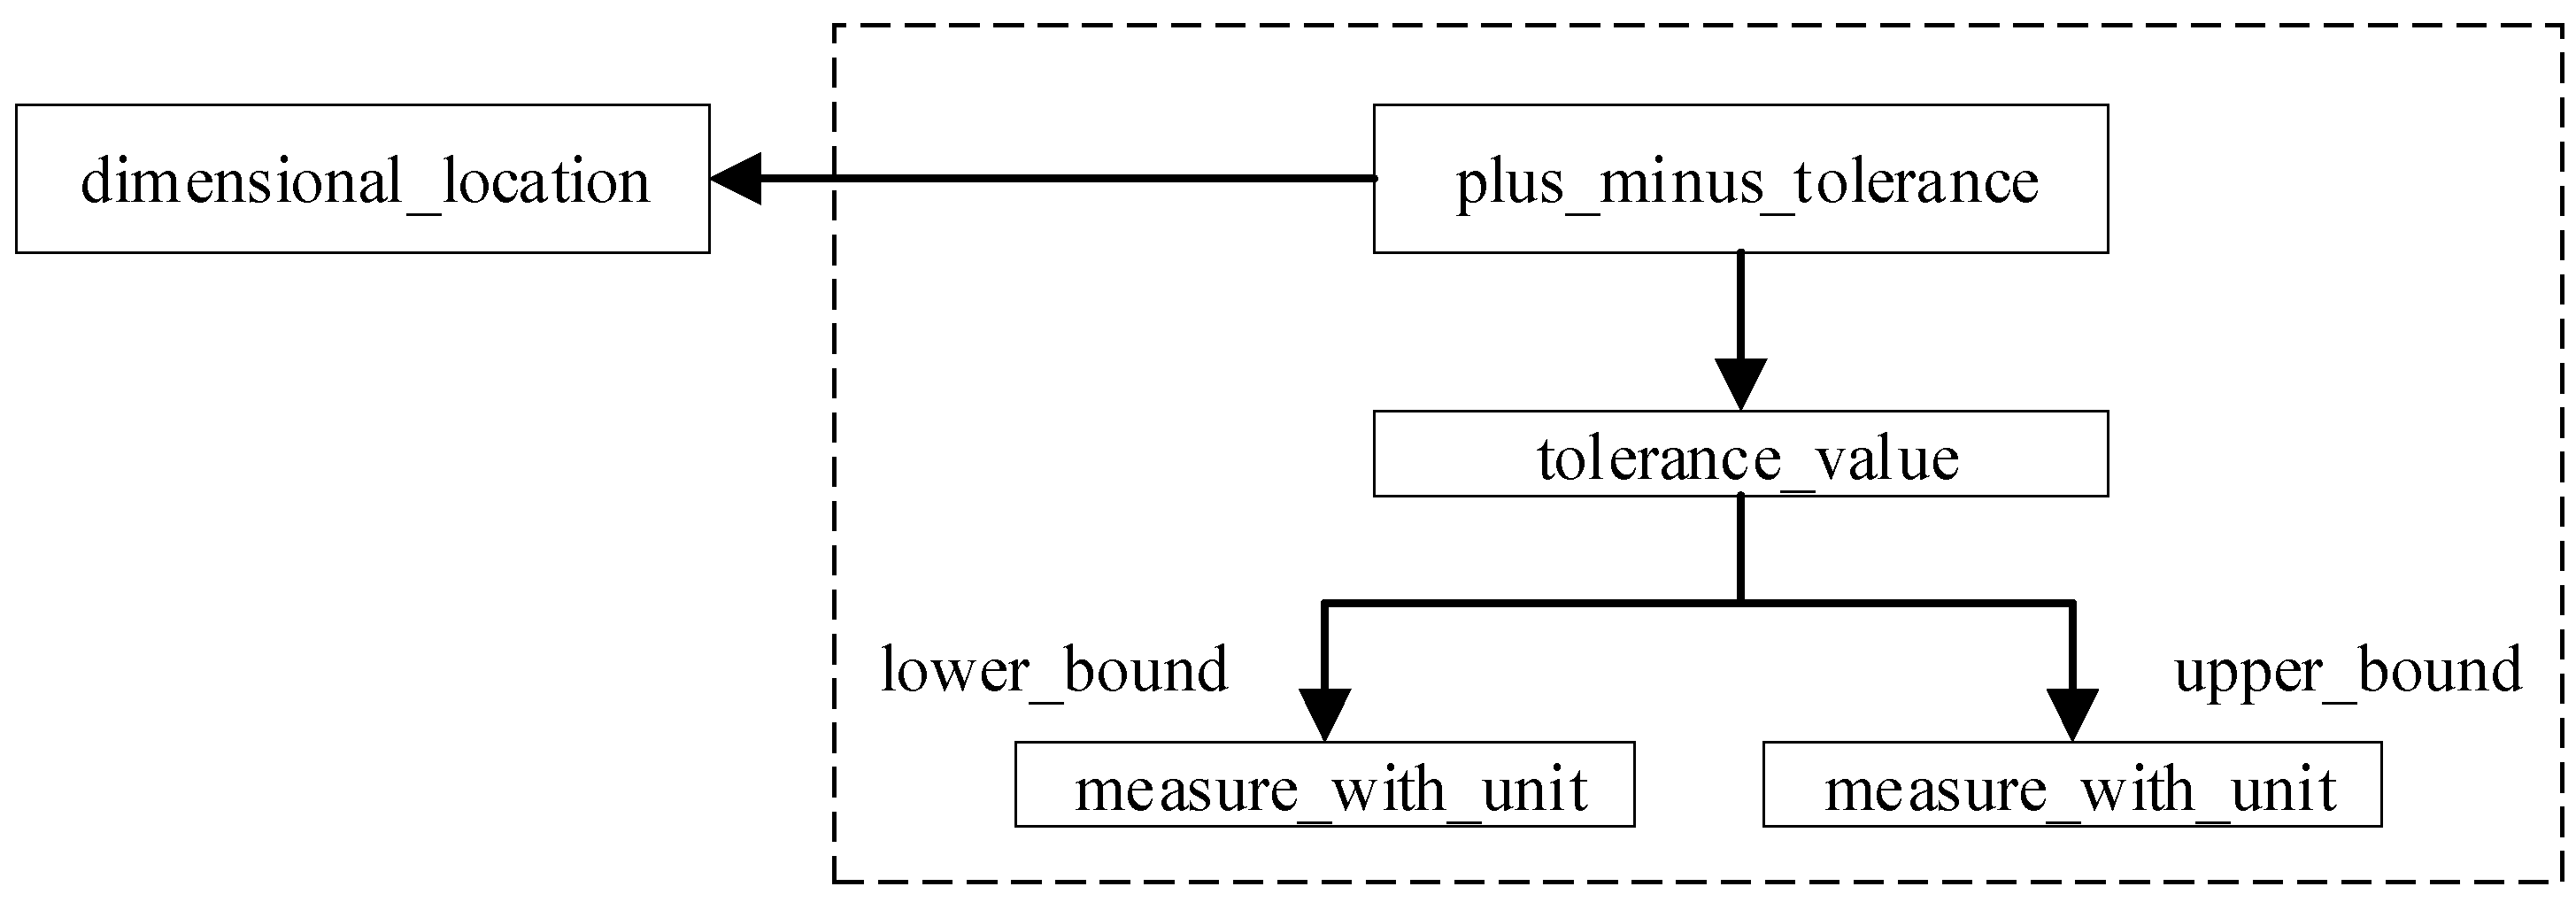
  • Plus/minus deviation (Table 2). The plus/minus deviation is defined by the entity “PLUS_MINUS_TOLERANCE”, which references the entities “TOLERANCE_VALUE” and “DIMENSIONAL_LOCATION” (Figure 7). The entity “TOLERANCE_VALUE” has two attributes: “UPPER_BOUND” and “LOWER_BOUND”, which specify the plus/minus deviation values individually.
  • Value range (Table 2). Detailed explanations can be found in Appendix C.
  • Tolerance class (Table 2). Detailed explanations can be found in Appendix C.
Due to the variety of presentation styles for DTs in STEP AP242 files, an algorithm was designed to automatically extract different types of DT data (Figure 8). Unlike previous tools, this algorithm can extract all the structural DT information, forming the basis for achieving PMI SR within a web browser.

3.2.3. Extracting GT Information

In addition to DT, there are various types of GT. These include form and orientation tolerances, which specify the deviation of a geometry feature’s form, orientation, or position within an MBD model. GTs are often presented within a feature control frame (FCF). There are different presentation styles for GTs within an FCF, and STEP AP242 uses distinct entity-attribute relationships to represent them (Table 3). This section will explain how to extract complete structural information on GTs.
(1) A GT without a modifier or datum reference
In an FCF, tolerances such as straightness, flatness, roundness, and cylindricity typically do not have a modifier or datum reference. The same extraction method can be applied to these GTs in a STEP AP242 file. Figure 9, for example, illustrates a portion of a STEP AP242 file for a part with a straightness tolerance.
In this file, the entity “LENGTH_MEASURE_WITH_UNIT” references the entity “LENGTH_MEASURE”, which specifies the GT value. The example value is “0.01” (in millimeters). The entity “STRAIGHTNESS_TOLERANCE” is named after its tolerance type and contains four attributes: “name”, “description”, “magnitude”, and “TOLERANCED_SHAPE_ASPECT”. The “name” is a user-defined identifier, “description” denotes the tolerance type, “magnitude” is a tolerance value that can be parsed through entity “#24” in this example, and “TOLERANCED_SHAPE_ASPECT” represents the geometric feature associated with this tolerance, which can be parsed through entity “#142” in this example. Figure 10 depicts the entity-attribute relationship of a GT without a modifier or a datum reference in a STEP AP242 file.
(2) A GT with one or more modifiers. Detailed entity–attribute relationships can be found in Appendix C.
(3) A GT with one or more datum. Detailed entity–attribute relationships can be found in Appendix C.
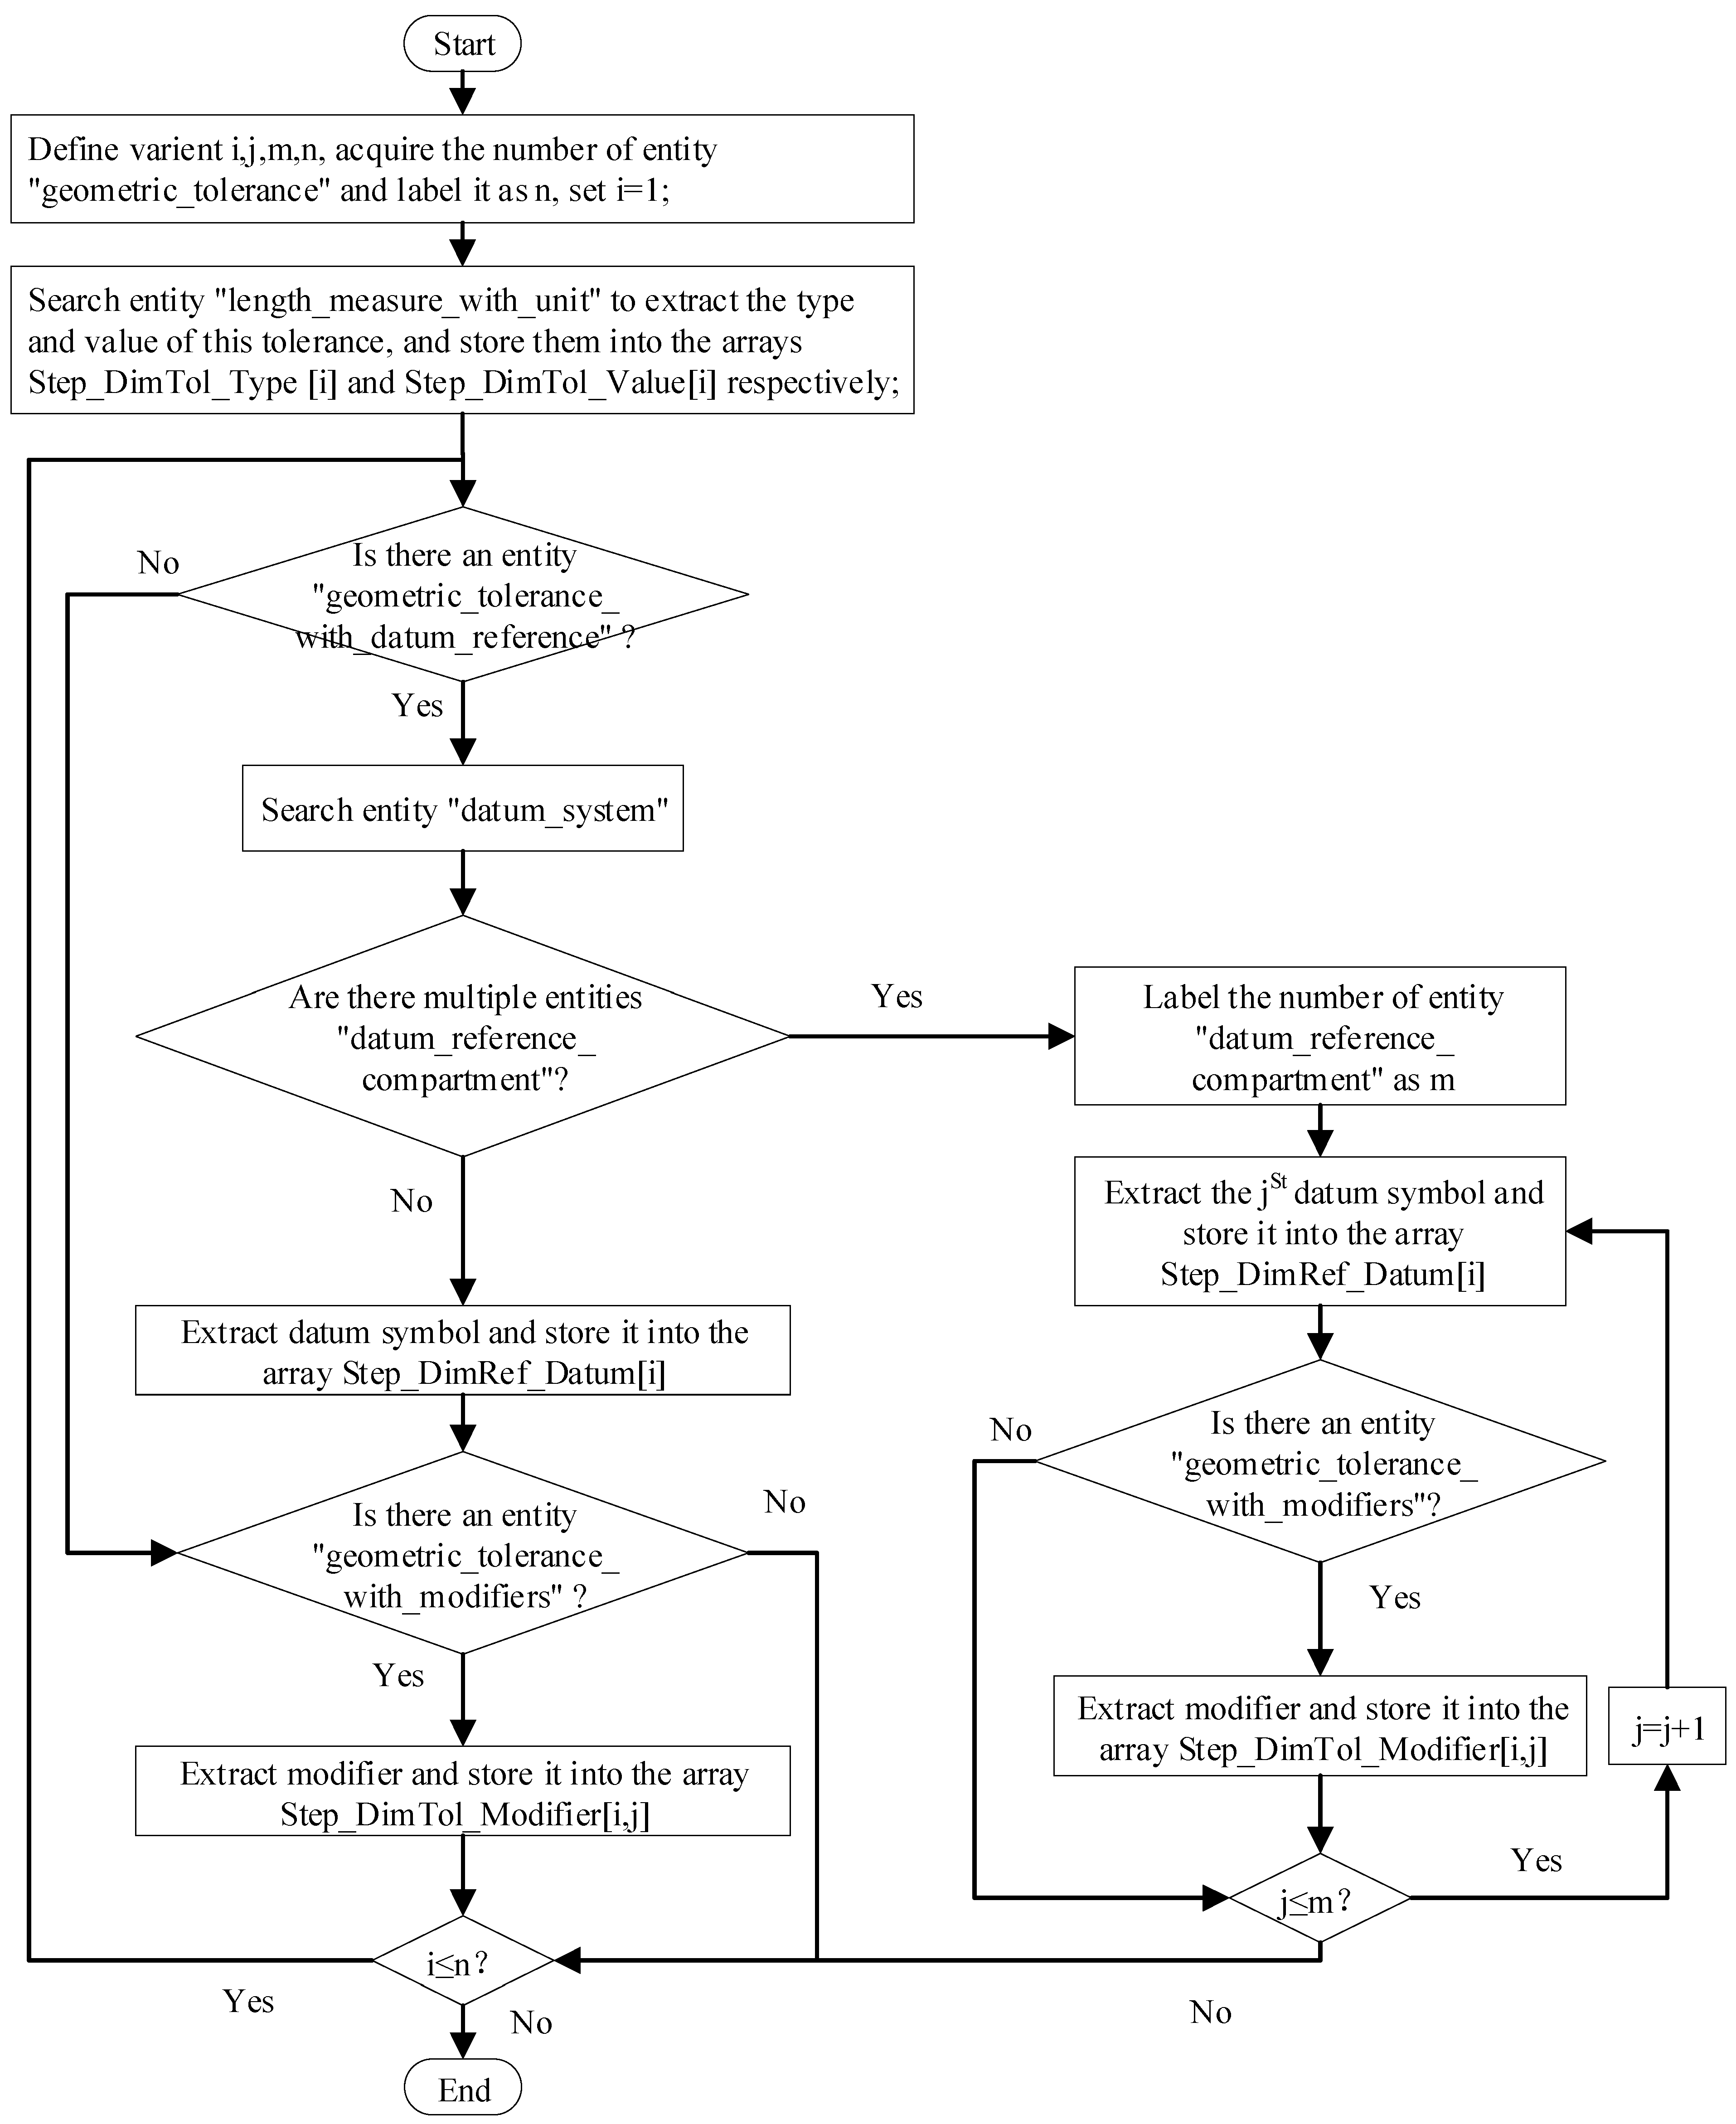
As there are different types of GT in a STEP AP242 file, an algorithm has been designed to automatically extract GT structure information for each type (Figure 11).

3.2.4. Extracting Associated Objects Information

In an MBD model, information about an object associated with a PMI feature is crucial, as it represents the design, manufacturing, or assembly intent. Therefore, this information must be extracted and transmitted accurately downstream. STEP AP242 supports both PMI GP and SR [15,24]. PMI GP relates to the style, position, and organization of displayed elements. PMI SR, on the other hand, outlines the relationships among dimensions, tolerances, datums, and measured GEs. Section 3.2.1, Section 3.2.2 and Section 3.2.3 cover the extraction of PMI style, position, and organization of displayed elements. The process of extracting PMI-associated objects is discussed below.
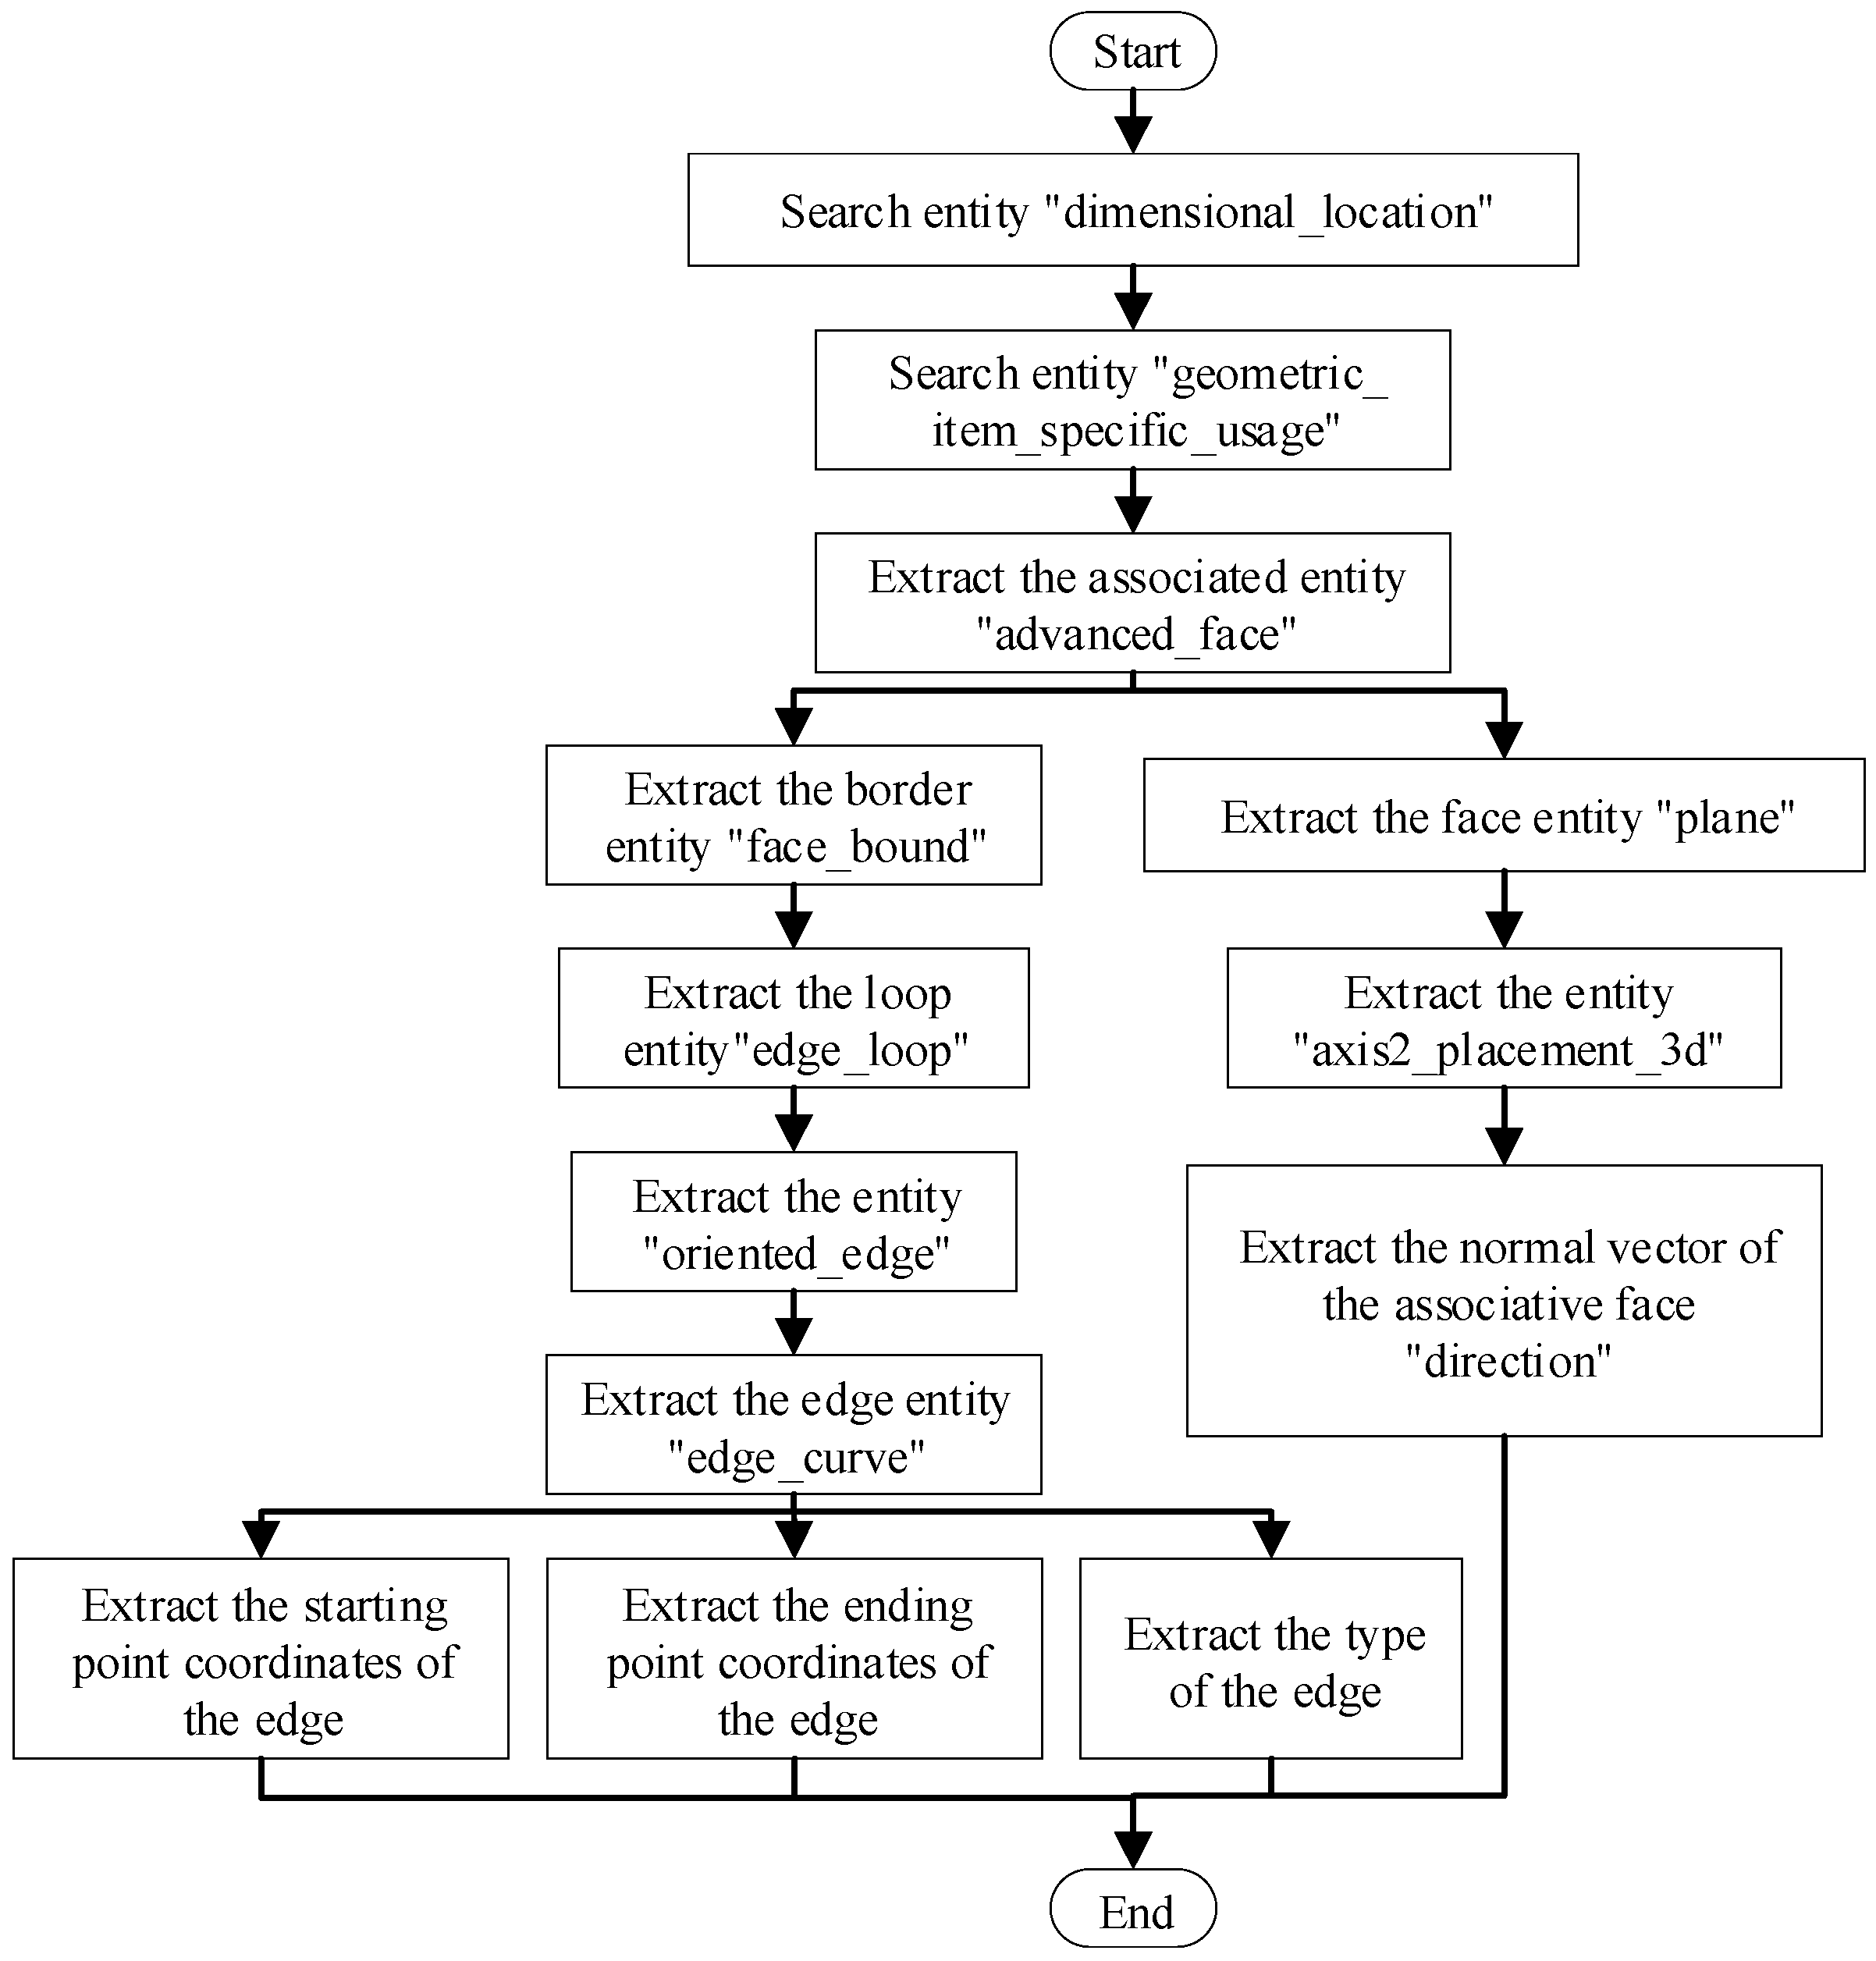
In a STEP AP242 file, the PMI GP and SR are linked through an entity called “DRAFTING_MODEL_ITEM_ASSOCIATION”. By following the path “DIMENSIONAL_LOCATION” → “SHAPE_ASPECT” → “GEOMETRIC_ITEM_SPECIFIC_USAGE” → “ADVANCED_FACE”, one can determine the objects associated with a PMI feature (Figure 12). To parse the “ADVANCED_FACE” entity, the representation method of geometric and topological information within a STEP AP242 file must be analyzed.
In a STEP AP242 file, the boundary representation method (B-rep) is used to organize a CAD model into bodies, shells, surfaces, loops, edges, and points (Figure 13) [24]. A body consists of a shell, and its entity name is “CLOSED_SHELL”, which represents all the surfaces within a CAD model. Each surface is identified by the entity “ADVANCED_FACE”, which includes an outer boundary and one or more inner boundaries. The boundary is represented by the entity “FACE_BOUND” and consists of an edge loop, identified by the entity “EDGE_LOOP”. An edge loop consists of one or more oriented edges, identified by the entity “ORIENTED_EDGE”. The “ORIENTED_EDGE” entity refers to the “EDGE_CURVE” and “VERTEX_POINT” entities, which describe the start and endpoints of an edge. The elements of an edge are represented by entities such as “LINE” and “CIRCLE”. The entity “LINE” is defined by one “VECTOR” entity and two “CARTESIAN_POINT” entities. The entity “VECTOR” is defined by the entities “DIRECTION” and “LENGTH”. All “CARTESIAN_POINT” entities are modeled in a Cartesian coordinate system. Based on this structure, the vector and position of a surface associated with a PMI feature can be determined.
An algorithm has been designed to automatically extract the object information associated with a PMI feature in a STEP AP242 file (Figure 14). Integration of PMI GP and SR is achieved through entity “DRAFTING_MODEL_ITEM_ASSOCIATION”. This algorithm enables the transfer of PMI semantics from a STEP AP242 file to a web browser. Consequently, automatic linking of PMI to the relevant geometry can be established in the web browser. Appendix D provides a detailed explanation of how to extract the associated object information using dimension “48” (in millimeters) in Figure 4 as an example.

4. Displaying Product Manufacturing Information on a Webpage

To ensure consistent design intent before and after conversion, the following analysis explains how to realize graphical presentation (GP) and semantic representation (SR) for product manufacturing information (PMI) in a web browser. In accordance with the ISO 16792 standard [19], this paper demonstrates how to dynamically display three-dimensional (3D) annotations in a web browser using data extracted from the STEP AP242 file, as discussed in Section 3.

4.1. Realizing the GP Function for PMI in a Web Browser

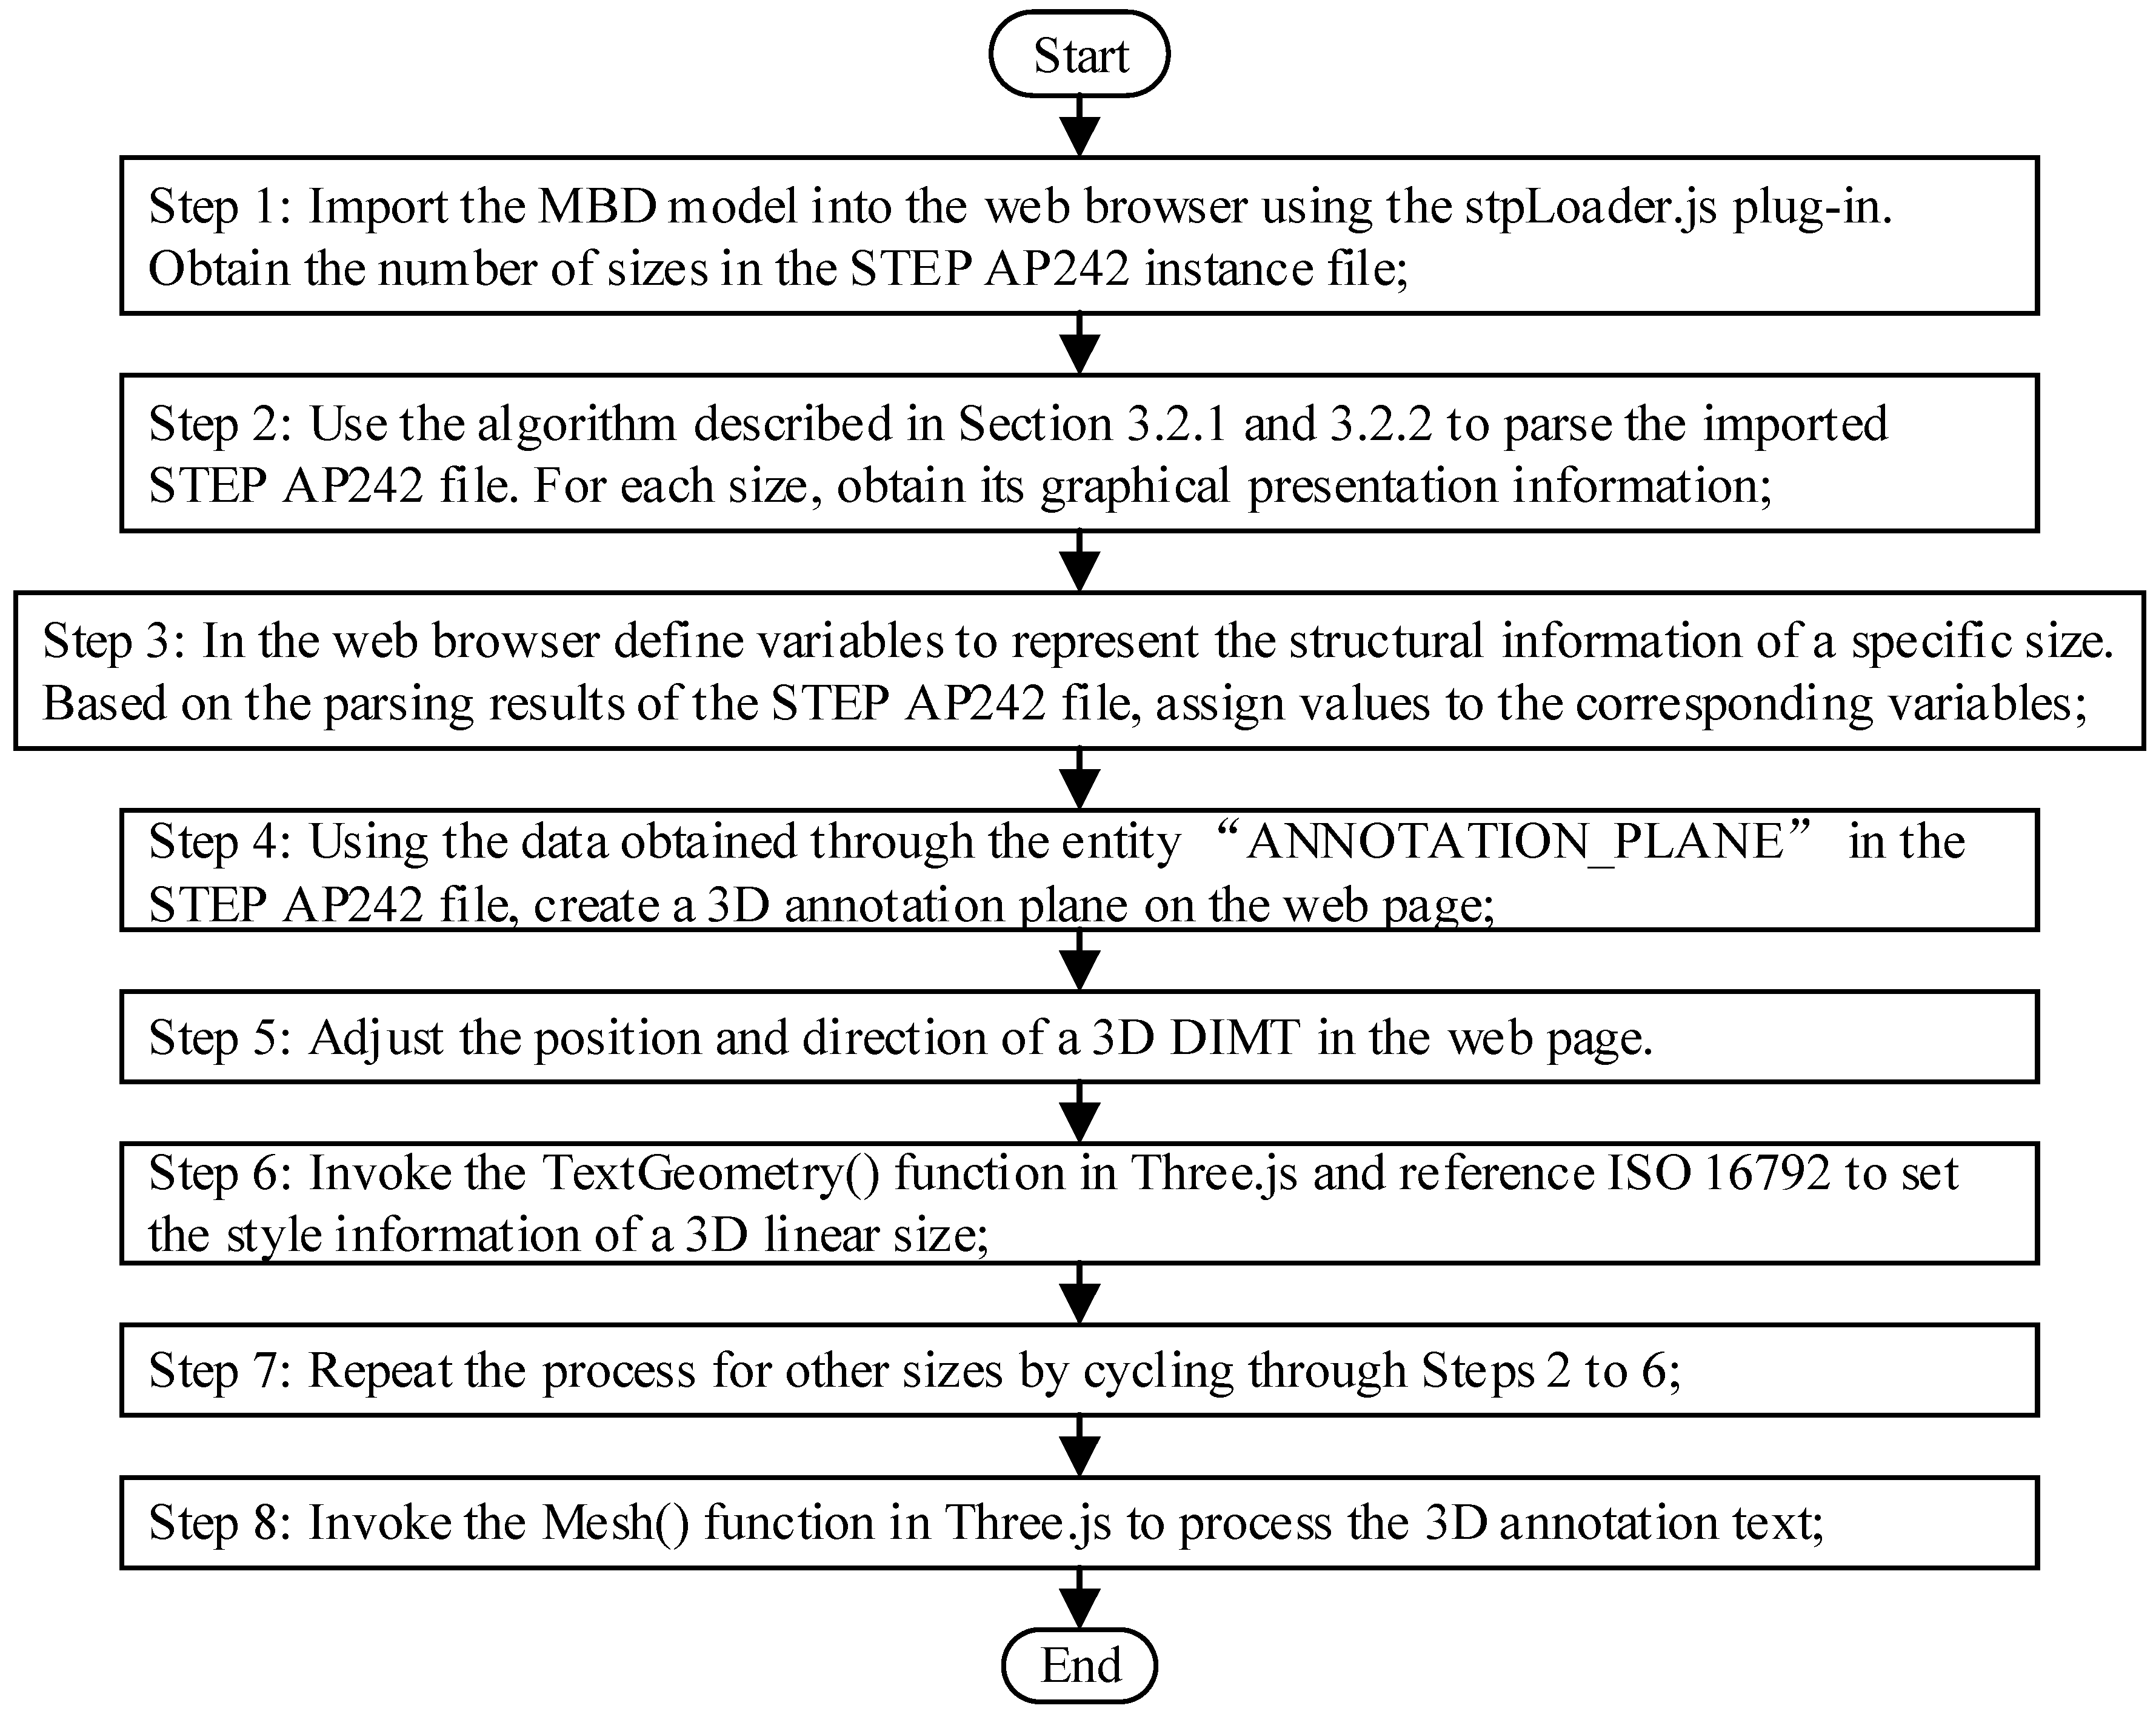
As previously mentioned, a Model-based definition (MBD) model can incorporate various types and styles of PMI. This section will focus on implementing the PMI GP function in a web browser, using a 3D linear size as an example. Firstly, a 3D annotation plane (3DAP) must be created, along with a dimension text, a dimension modifier, a dimension line, a dimension boundary line and a dimension arrow. Figure 15 shows the designed algorithm, and the primary steps are outlined below.
Step 1: Import the MBD model into the web browser using the stpLoader.js plug-in. Obtain the number of 3D linear sizes in the STEP AP242 instance file;
Step 2: Use the algorithm described in Section 3.2.1 and Section 3.2.2 to parse the imported STEP AP242 file. For each size, obtain the following information: annotation plane, dimension value, dimension type, DT identification, DT type, DT upper limit, DT lower limit, and other relevant parameters;
Step 3: In the web browser, define the variables that represent the structural information of a specific size. Based on the parsing results of the STEP AP242 file, assign values to the corresponding variables;
Step 4: Using the data obtained through the entity “ANNOTATION_PLANE” in the STEP AP242 file, create a 3DAP on the webpage;
Step 5: Adjust the position and direction of the text for the 3D dimension on the webpage. Upon testing, it was founded that the default position of a 3D dimension annotation text on the webpage is at the coordinate origin (0, 0, 0). The default writing direction vector is (1, 0, 0), which aligns with the X-axis. The default normal vector is (0, 0, −1), which is perpendicular to the XOY plane (Figure 16). Therefore, adjustments to their position and direction are necessary. Data obtained from the STEP AP242 file is used to invoke the refresh function in Three.js, dynamically adjusting the position and direction of the 3D dimension annotation text;
Step 6: Invoke the TextGeometry() function in Three.js and reference ISO 16792 to set the font style “font”, font size “size”, text thickness “height”, text weight, and other attributes of the 3D annotation text;
Step 7: Repeat the process for other sizes by cycling through Steps 2 to 6;
Step 8: Invoke the Mesh() function in Three.js to process the 3D annotation text;
Step 9: The end.

4.2. Realizing the SR Function for PMI in a Web Browser

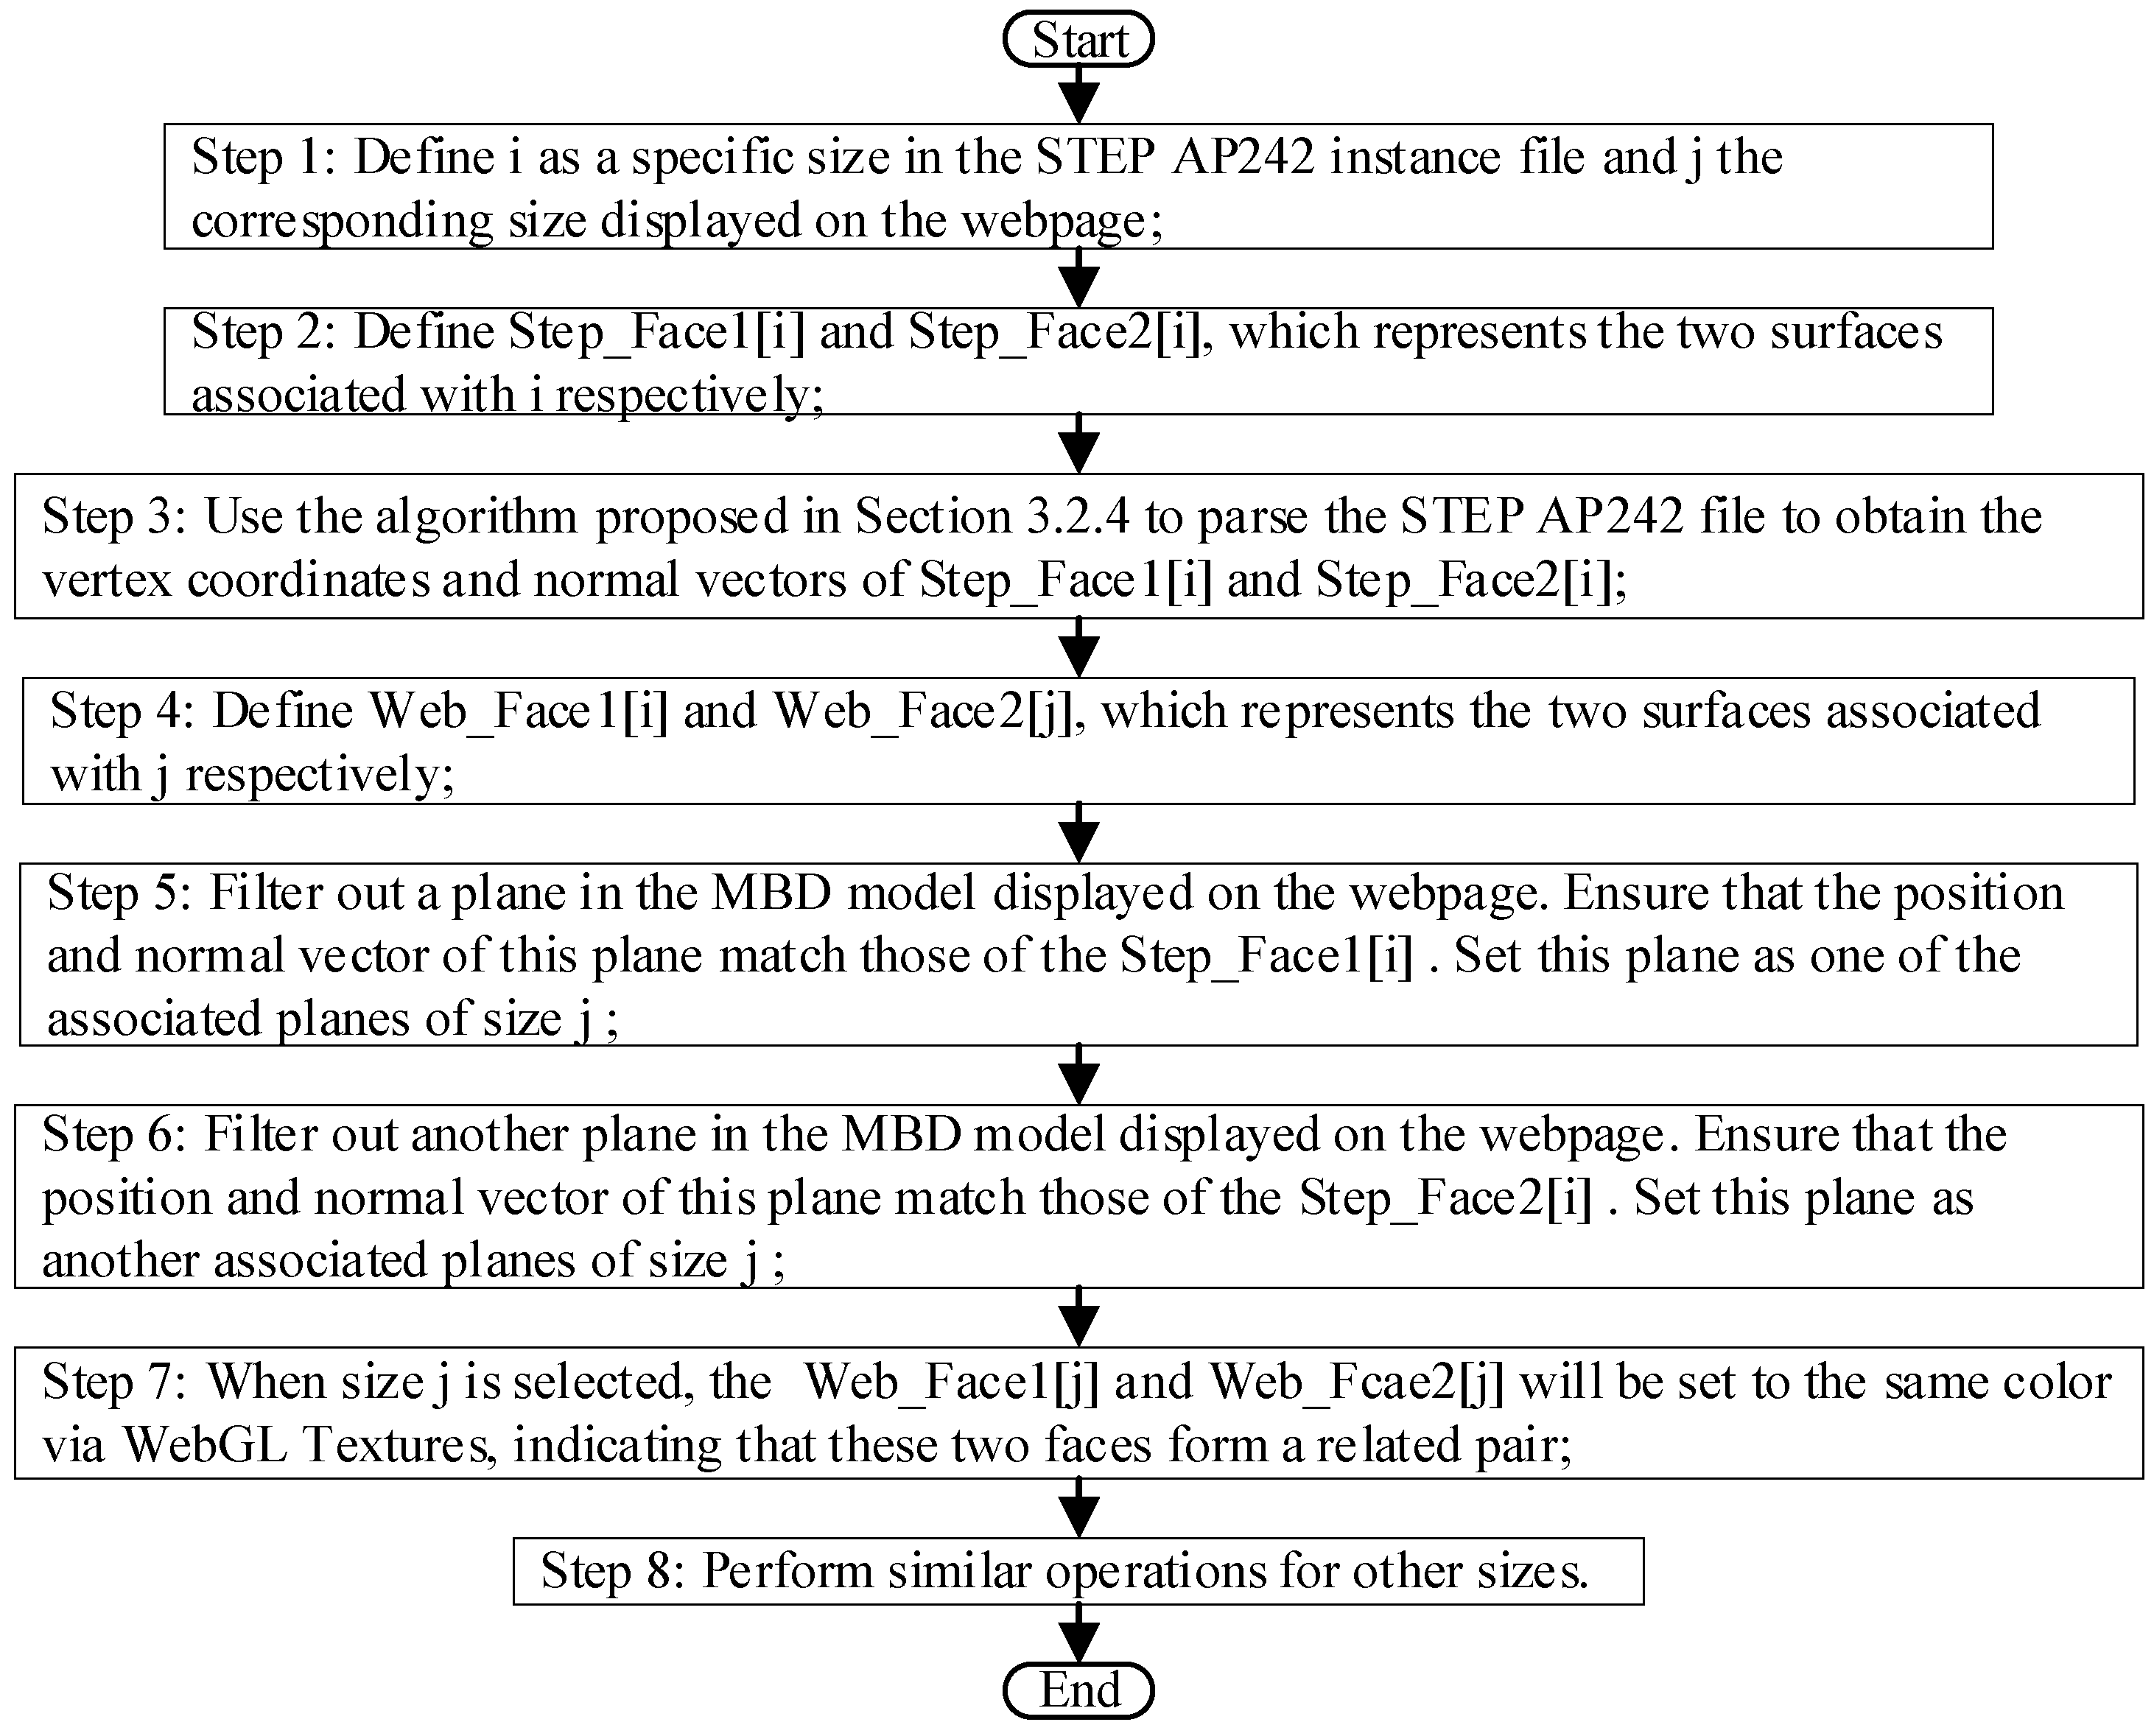
According to Section 2.2, PMI within an MBD model encompasses both GP and SR [15]. Therefore, integrating GP and SR of PMI in a web browser is crucial. In our implementation, “DRAUGHTING_MODEL_ITEM_ASSOCIATION” links PMI GP to SR. While Section 4.1 addresses the functionality of PMI GP on a webpage, this section will examine the functionality of PMI SR on a webpage (Figure 17).
In this paper, we use WebGL texture technology to highlight PMI-related objects on a webpage, utilizing the information about these objects extracted in Section 3.2.4. WebGL texture technology maps images onto the surface of a 3D model, providing color and other striking visual effects. This technology can be used to assign different colors to various 3D annotation objects on a webpage, achieving the SR of PMI within a 3D model. Since WebGL supports up to 255 × 255 × 255 colors, equating to over 16 million colors, it would be impractical for an MBD model to encompass more than 16 million 3D annotations. Therefore, color differentiation is a viable method. This section further explores linear size annotations as an example and proposes an algorithm (Figure 17). The primary steps are outlined below:
Step 1: In the STEP AP242 file, define i as a specific size and j as the corresponding size displayed on the webpage;
Step 2: Define S t e p _ F a c e 1 [ i ] and S t e p _ F a c e 2 [ i ] , which represents the two surfaces associated with i , respectively;
Step 3: Use the algorithm proposed in Section 3.2.4 to parse the STEP AP242 file and obtain the vertex coordinates and normal vectors of S t e p _ F a c e 1 [ i ] and S t e p _ F a c e 2 [ i ] ;
Step 4: Define W e b _ F a c e 1 [ j ] and W e b _ F a c e 2 [ j ] , which represents the two surfaces associated with j respectively on the webpage;
Step 5: Filter out a plane in the MBD model displayed on the webpage. Ensure that the position and normal vector of this plane match those of the S t e p _ F a c e 1 [ i ] . Set this plane as one of the associated planes of size j ;
Step 6: Filter out another plane from the MBD model displayed on the webpage. Ensure that the vertex coordinates and normal vector of this plane match those of the S t e p _ F a c e 2 [ i ] . Set this plane as another associated plane of size j ;
Step 7: When size j is selected, the W e b _ F a c e 1 [ j ] and W e b _ F a c e 2 [ j ] will be set to the same color via WebGL textures, indicating that these two faces form a related pair;
Step 8: Perform similar operations for other sizes.

4.3. Prototype System Development and Case Verification

4.3.1. System Development Tool

Given the robust functionality and broad application of NX, this paper uses NX 1847—the product lifecycle management solution offered by Siemens company—as the modelling platform for STEP AP242 files (Munich, Germany). These files are parsed using the C++ programming language. Chrome, the most popular and widely used browser, has been selected as the web display platform for PMI within an MBD model. For back-end development, IntelliJ IDEA 2024.1 software, created by JetBrains, has been selected to implement 3D annotated scenes and applications using JavaScript. System main development tools can be found in Appendix E.

4.3.2. System Functional Module

The prototype system comprises three main modules: the basic environment module, the resource output module, and the human–computer interaction module. (1) The basic environment module creates the necessary scene, camera, lighting and renderer to display 3D PMIs on a webpage using Three.js. Development was primarily completed using the IntelliJ IDEA software. (2) The resource output module loads a STEP AP242 file based on the selected directory. It parses the file using the algorithms detailed in Section 3 and Section 4, returning the results to the relevant Three.js module functions. This enables the dynamic display and navigation of 3D dimensions, DTs, GTs, and datums within a web browser. (3) The human–computer interaction module translates, rotates, and scales an MBD model in response to mouse and keyboard input from the user. The system developed in this paper can dynamically adjust the position of 3D PMIs to improve the readability of the 3D-annotated text.

4.3.3. Case Study

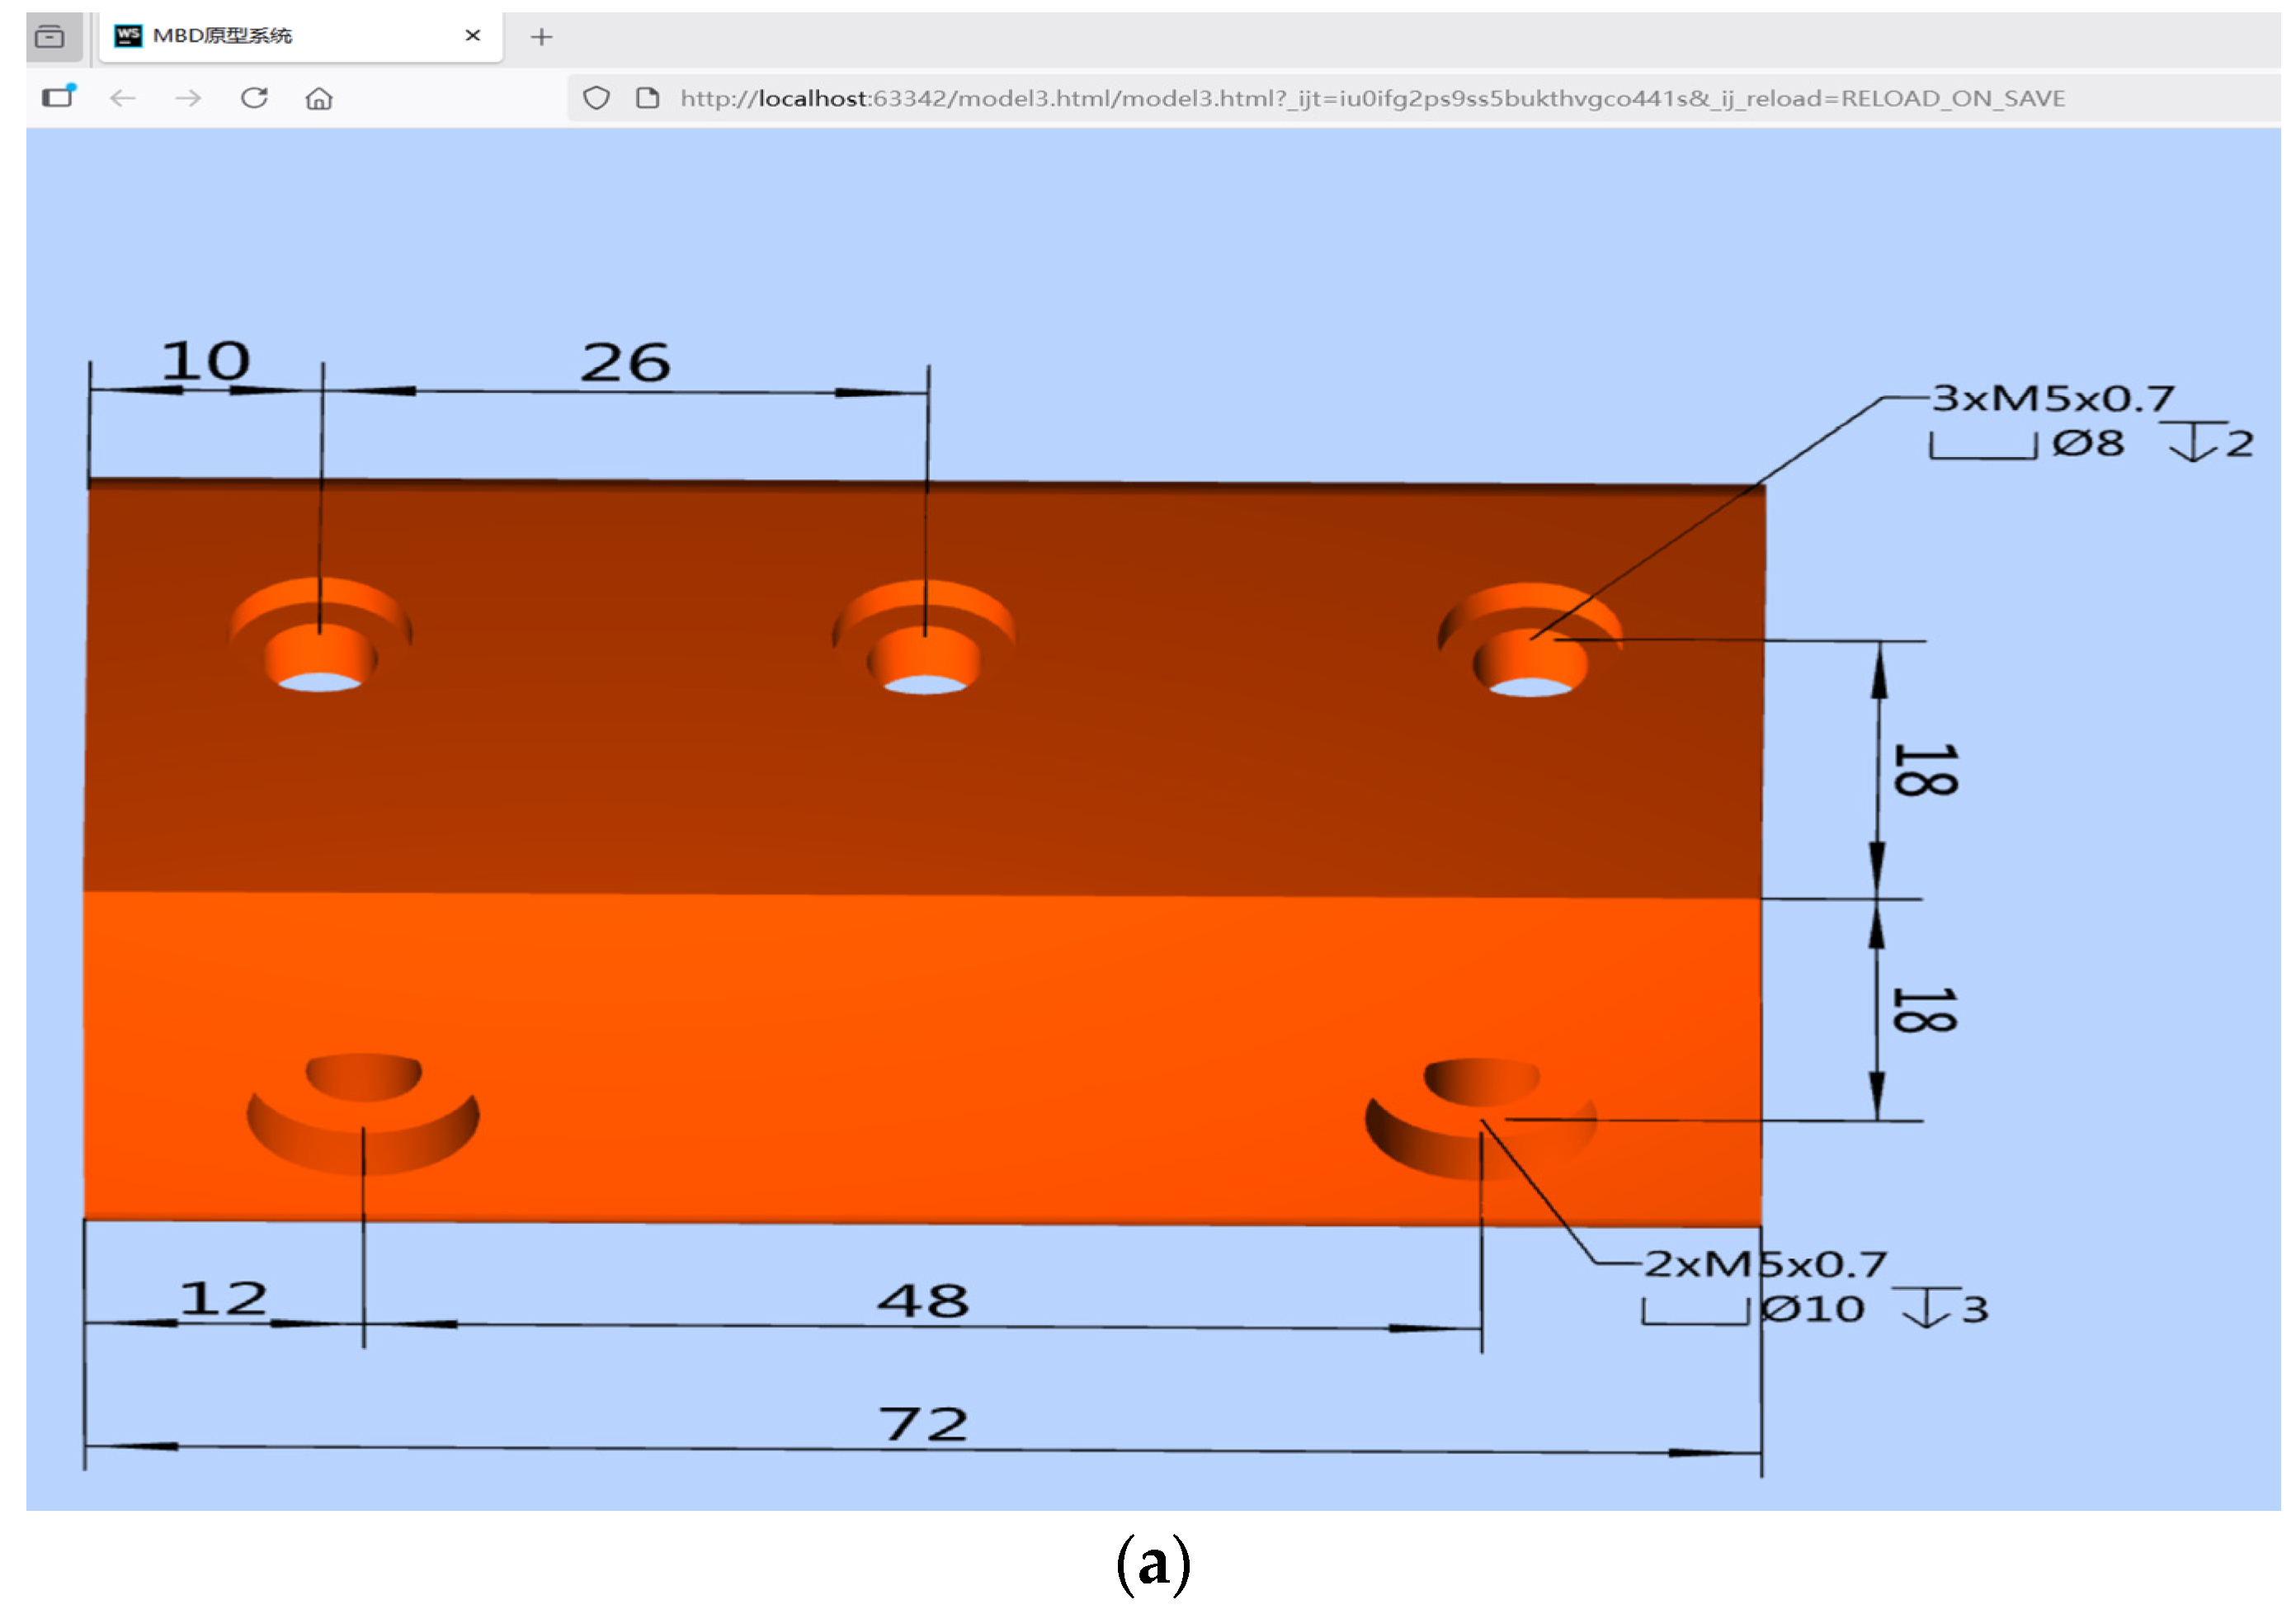
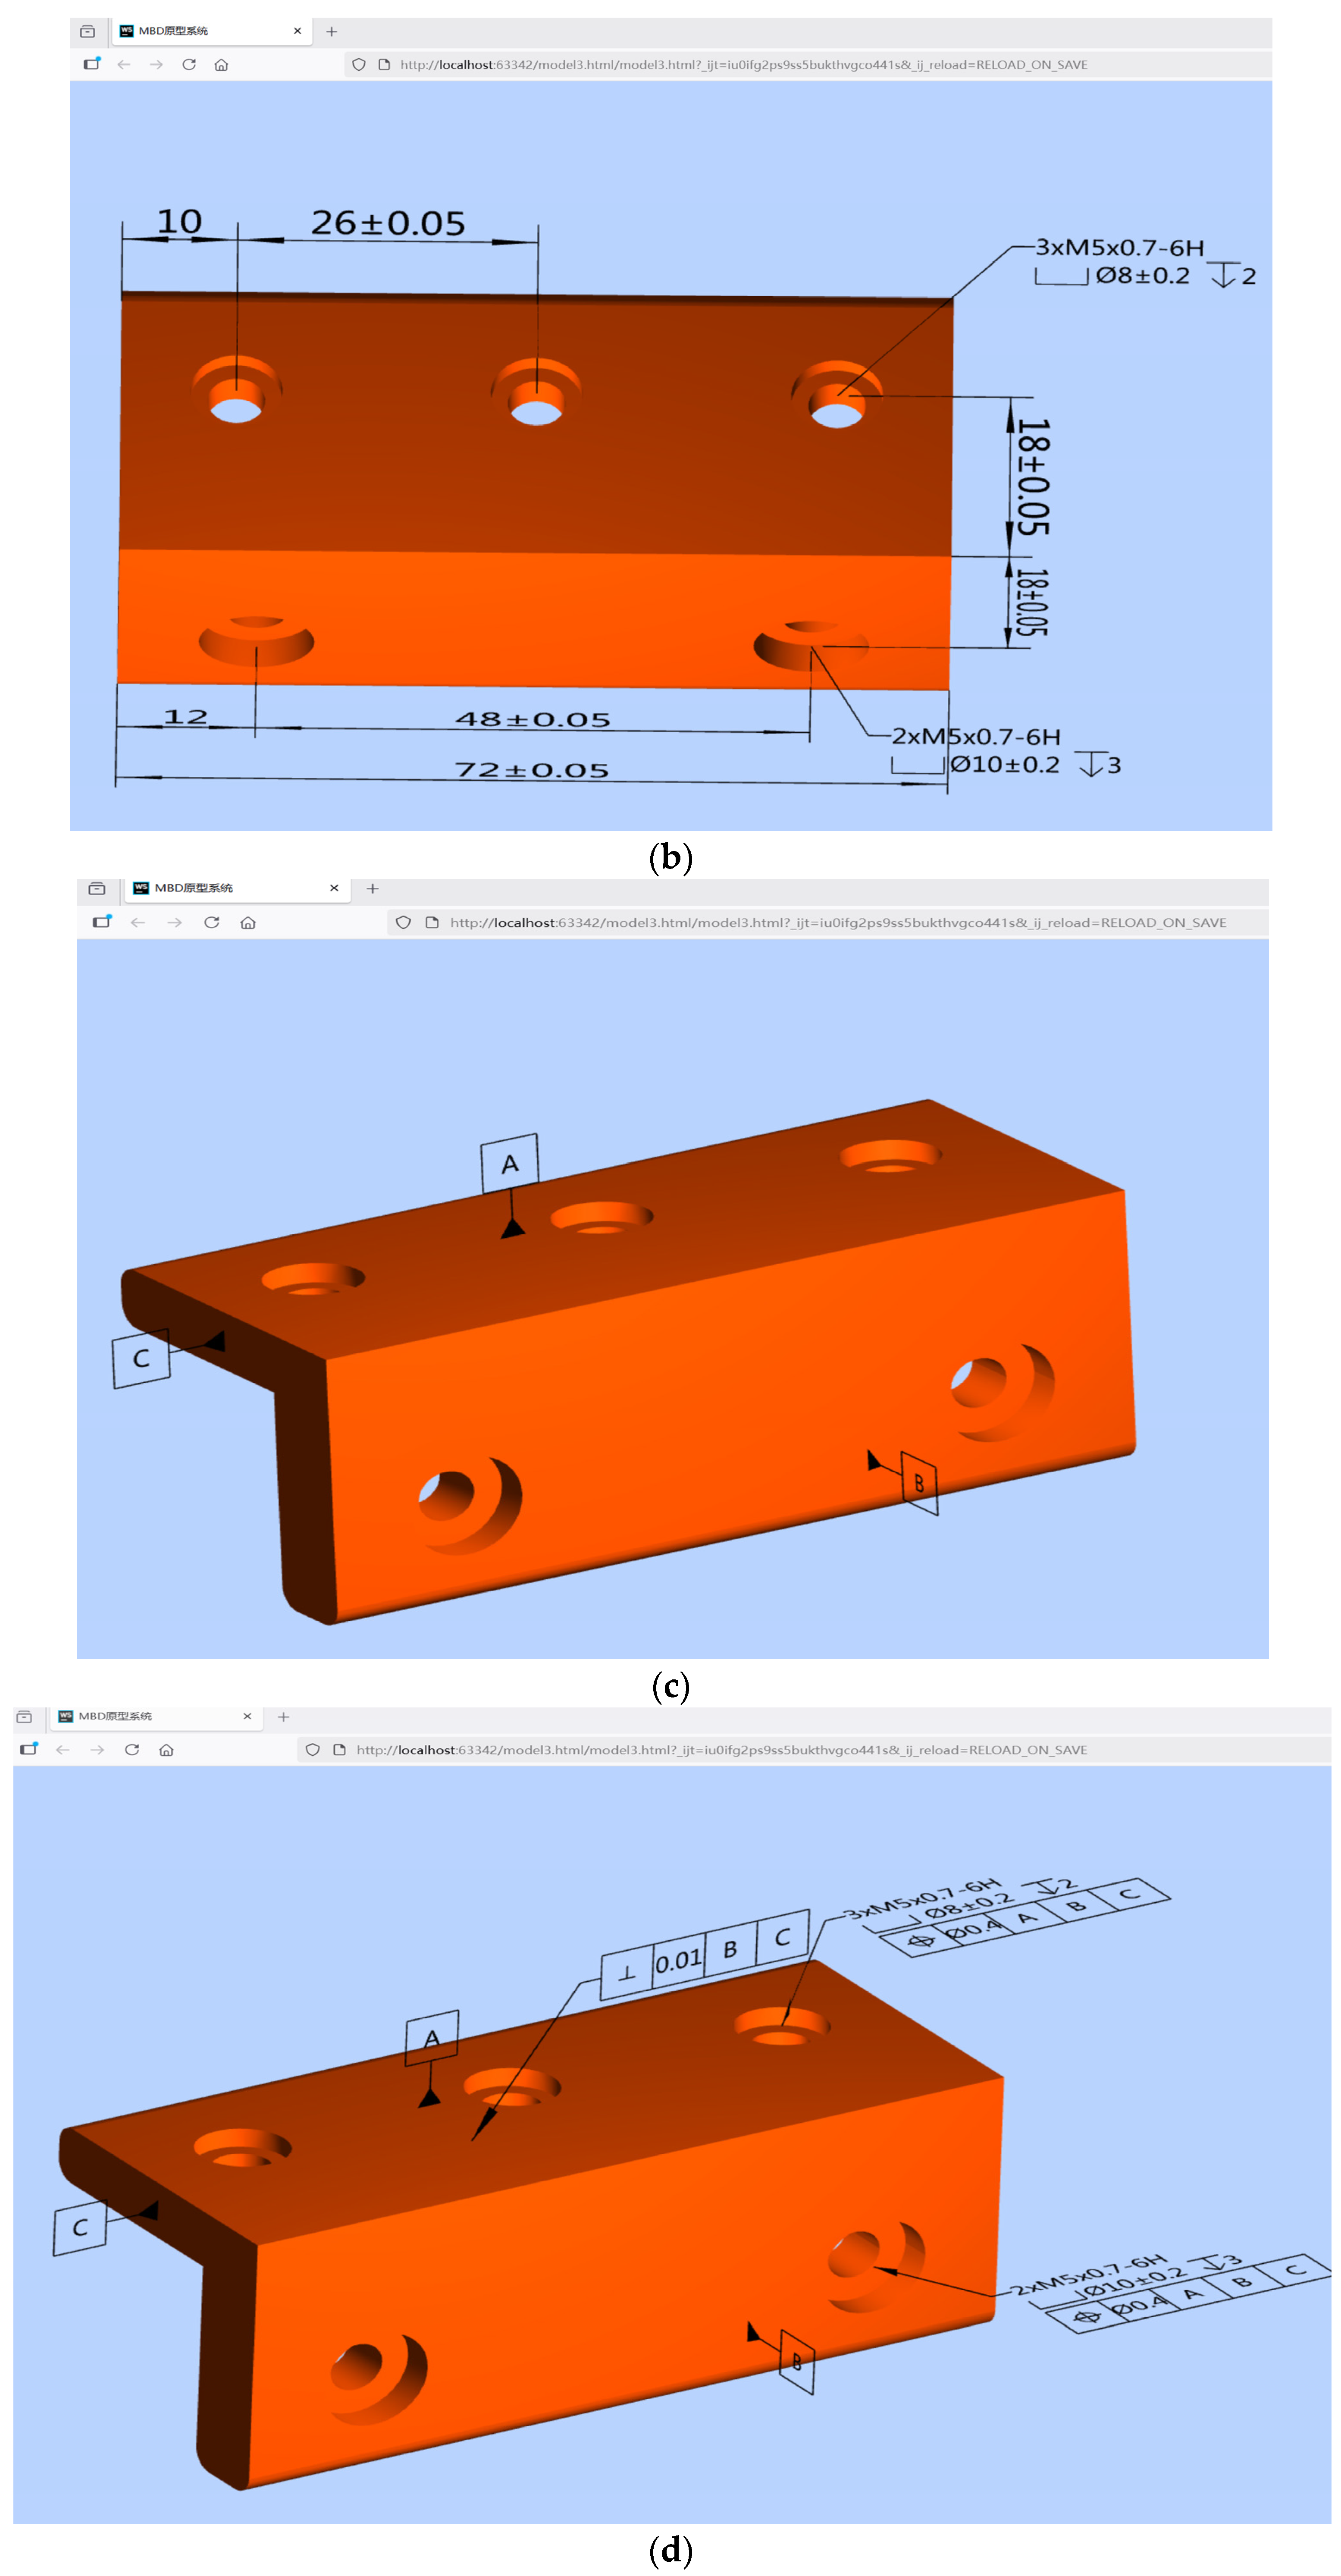
Model the part depicted in Figure 4 as an MBD model using NX 1847, and then export it as a STEP AP242 file. Next, use the developed prototype system in a web browser to parse the file. Figure 18a–d show examples of 3D dimension annotation, 3D DT, 3D datum symbol (DS), and 3D GT within a web browser, respectively. Additionally Figure 18e,f show the PMI SR results for 3D-annotated associated objects using WebGL texture technology.

4.4. Analysis and Benchmarking of Prototype System Performance

We conducted benchmark tests to assess the performance of our developed system. Using a Lenovo Legion Y7000 PG0 laptop (CPU: Intel® Core™ i5-9300H @ 2.40 GHz; GPU: NVIDIA GeForce GTX 1650; RAM: 8 GB), we performed 100 tests and found that the median parsing and rendering time in the web browser was 1.12 s, with the 95th percentile time being 1.52 s. Setting the timestamp at the start of the model loading process as 0, we observed frame rates of 12, 52, and 60 frames per second (FPS) at 22.073, 23.189, and 23.839 s, respectively, while orbiting the model. After 23.839 s, the frame rate consistently remained above 60 FPS during further model orbiting. Additionally, we were able to visualize form, direction, position, and runout tolerances on the web pages (Table 4), and there were no missing or misaligned 3D annotations, incorrect parameter values, or errors associated with PMI objects. While the original MBD model in Figure 18 is consistent with the one in Appendix A Figure A1, the case in Figure 18 demonstrates better linkage and semantic clarity.
Compared to existing STEP viewers and PMI extraction tools, this prototype system offers several advantages:
(1) MBD models can be viewed or queried by partners at any time and from anywhere using LEVs or mobile communication devices via a browser.
(2) Downstream stakeholders can easily understand the designer’s intent through web-based PMI SR, potentially improving the efficiency of collaborative product development.
(3) The PMI semantics displayed on the webpage can be further integrated into online product inspection or virtual assembly, thereby extending the scope of MBD applications.

5. Results

Existing open-source or free web-based product manufacturing information (PMI) viewers have limitations in the following areas: semantic PMI extraction; automatic linkage of PMI to associated geometry; browser-native rendering without the need for dedicated applications; and the integration of both graphical presentation (GP) and semantic representation (SR) (Table 1).
This paper therefore proposes a novel parsing and mapping algorithm for PMI GP and SR using WebGL/Three.js. Theoretical analysis and case studies have shown that the developed prototype system is both feasible and practical. Unlike existing tools, the main feature of this system is web-based PMI semantic mapping via a WebGL texture. By displaying PMI semantics on a webpage, stakeholders can better grasp the design intent of an MBD model. Design processes such as customization, configuration, review, and change can be carried out more efficiently using a web browser.
PMI semantic web visualization converts the geometric dimensioning and tolerancing (GD&T) information embedded in model-based definition (MBD) models into structured, meaningful data that machines can understand and process. Once machines can comprehend PMI semantics, they can automatically generate machining codes and inspection paths. They can also exercise greater control over the machining process by interpreting GD&T requirements and making adaptive adjustments based on real-time measurement data. PMI semantic visualization will significantly advance the development of smart manufacturing and digital twin technologies.
The most urgent future work is required for large assemblies involving compound tolerances, surface dimension positioning, overlapping annotations and tolerance stacking. The related functions need strengthening, and further research is required to enhance the robustness, scalability and compatibility of the prototype system.

6. Discussion

In this case study, it is assumed that the linear sizes are correctly associated with the two surfaces. Due to the flexibility of the 3D annotation function in CAD software, a linear size can be associated with two points, one point and one edge, two edges, one edge and one surface, or two surfaces. If a linear size is associated with any of the aforementioned combinations, the corresponding STEP AP242 file contains a PMI SR error. However, the algorithm designed in this paper for extracting and mapping PMI in the STEP AP242 file is unable to identify such errors. Consequently, the MBD model displayed on the webpage after conversion cannot achieve the correct SR of PMI. A similar situation exists with the GP of PMI in a STEP AP242 file. If an illegal association is detected in the linear sizes, a warning can be issued through validation rules, and the sizes can be flagged. Further research is required in this area.
In a STEP AP242 file, PMI encompasses not only GDs, DTs, GTs and DSs, but also roughness and weld symbols. Due to the complexity of the PMI semantic mapping process, this paper does not investigate methods for parsing these symbols. Further research is required to determine how to extract these symbols from the STEP AP242 file and display them correctly on a webpage.
Different CAD software packages provide varying levels of support for STEP AP242, leading to discrepancies in exported STEP AP242 files. The STEP AP242 standard covers a broad range of content and is subject to ongoing revisions. Therefore, further research is needed to address these inconsistencies and ensure the prototype system’s interoperability with various CAD sources.
The design semantics of GD&Ts in an MBD model cannot be simply mapped to manufacturing semantics due to the complexity of the product manufacturing process. Similarly, due to the complexity of the product assembly process, the design semantics of GD&Ts in an MBD model cannot be directly mapped to assembly semantics. Consequently, the PMI semantics displayed in web browsers cannot be applied directly to downstream domains. Substantial research efforts are therefore still required to effectively utilize PMI semantics in web browsers.

Author Contributions

Conceptualization, Y.C.; methodology, S.X. and H.W.; investigation, X.L. and L.W.; validation, H.W. and L.L.; writing—original draft preparation, L.W. and J.M.; writing—review and editing, Y.C. and L.L. All authors have read and agreed to the published version of the manuscript.

Funding

University-Industry Cooperation Project of Fujian Province Science and Technology Plan (2024H6012) and Natural Science Foundation of Fujian Province (2023J05158).

Institutional Review Board Statement

Not applicable.

Informed Consent Statement

Not applicable.

Data Availability Statement

The original contributions presented in the study are included in the article, further inquiries can be directed to the corresponding author.

Conflicts of Interest

The authors declare no conflicts of interest.

Abbreviations

The following abbreviations are used in this manuscript:
2Dtwo-dimensional
3Dthree-dimensional
3DAP3D annotation plane
B-REPboundary representation method
CADcomputer-aided design
CAMcomputer-aided manufacturing
CAPPcomputer-aided process planning
CATcomputer-aided tolerancing
CMMcoordinate measuring machine
DSdatum symbol
DTdimensional tolerancing
FCFfeature control frame
FPSframes per second
GD&Tgeometrical dimensioning and tolerancing
GEgeometric element
GPgraphical presentation
GTgeometric tolerance
LEVslow-end viewers
MBDmodel-based definition
NISTnational institute of standards and technology
PMIproduct manufacturing information
QIFquality information framework
SRsemantic representation
STEPstandard for the exchange of product model data
VRvirtual reality

Appendix A

Figure A1. Product manufacturing information appears disorganized in the Open Cascade CAD Assistant. The correct model is shown in Figure 18.
Applsci 15 10847 g0a1

Appendix B

……
#15=DIMENSIONAL_CHARACTERISTIC_REPRESENTATION(#17,#19);
#16=DIMENSIONAL_CHARACTERISTIC_REPRESENTATION(#18,#20);
#17=DIMENSIONAL_LOCATION(‘linear distance’,’’,#153,#154);
#18=DIMENSIONAL_LOCATION(‘linear distance’,’’,#157,#158);
#19=SHAPE_DIMENSION_REPRESENTATION(‘’,(#21),#993);
#20=SHAPE_DIMENSION_REPRESENTATION(‘’,(#22),#993);
#21=(LENGTH_MEASURE_WITH_UNIT()
MEASURE_REPRESENTATION_ITEM()
MEASURE_WITH_UNIT(POSITIVE_LENGTH_MEASURE(48.),#997)
REPRESENTATION_ITEM(‘nominal value’));
#22=(LENGTH_MEASURE_WITH_UNIT()
MEASURE_REPRESENTATION_ITEM()
MEASURE_WITH_UNIT(POSITIVE_LENGTH_MEASURE(72.),#997)
REPRESENTATION_ITEM(‘nominal value’));
……
#24=DRAUGHTING_MODEL_ITEM_ASSOCIATION(‘PMI representation to presentation link’,’’,#17,#65,#37);
#26=DRAUGHTING_MODEL_ITEM_ASSOCIATION(‘PMI representation to presentation link’,’’,#18,#65,#38);
……
#37=DRAUGHTING_CALLOUT(‘’,(#39));
#38=DRAUGHTING_CALLOUT(‘’,(#40));
#39=TESSELLATED_ANNOTATION_OCCURRENCE(‘’,(#591),#46);
#40=TESSELLATED_ANNOTATION_OCCURRENCE(‘’,(#593),#47);
……
#46=(GEOMETRIC_REPRESENTATION_ITEM()
REPOSITIONED_TESSELLATED_ITEM(#678)
REPRESENTATION_ITEM(‘linear dimension’)
TESSELLATED_GEOMETRIC_SET((#54,#48)));
#47=(GEOMETRIC_REPRESENTATION_ITEM()
REPOSITIONED_TESSELLATED_ITEM(#680)
REPRESENTATION_ITEM(‘linear dimension’)
TESSELLATED_GEOMETRIC_SET((#55,#49)));
……
#997=(LENGTH_UNIT()
NAMED_UNIT(*)
SI_UNIT(.MILLI.,.METRE.));

Appendix C

(1) Detailed entity-attribute relationships of value range
There are three “MEASURE_REPRESENTATION_ITEM” attributes referenced from the “SHAPE_DIMENSION_REPRESENTATION” entity. The attribute values are “UPPER_LIMIT”, “NOMINAL_VALUE”, and “LOWER_LIMIT”. These values can be used to differentiate the upper limit, nominal value, and lower limit of a dimension (Figure A2).
Figure A2. Dimension value range entity-attribute relationship in a STEP AP242 file.
Applsci 15 10847 g0a2
(2) Detailed entity-attribute relationships of Tolerance class
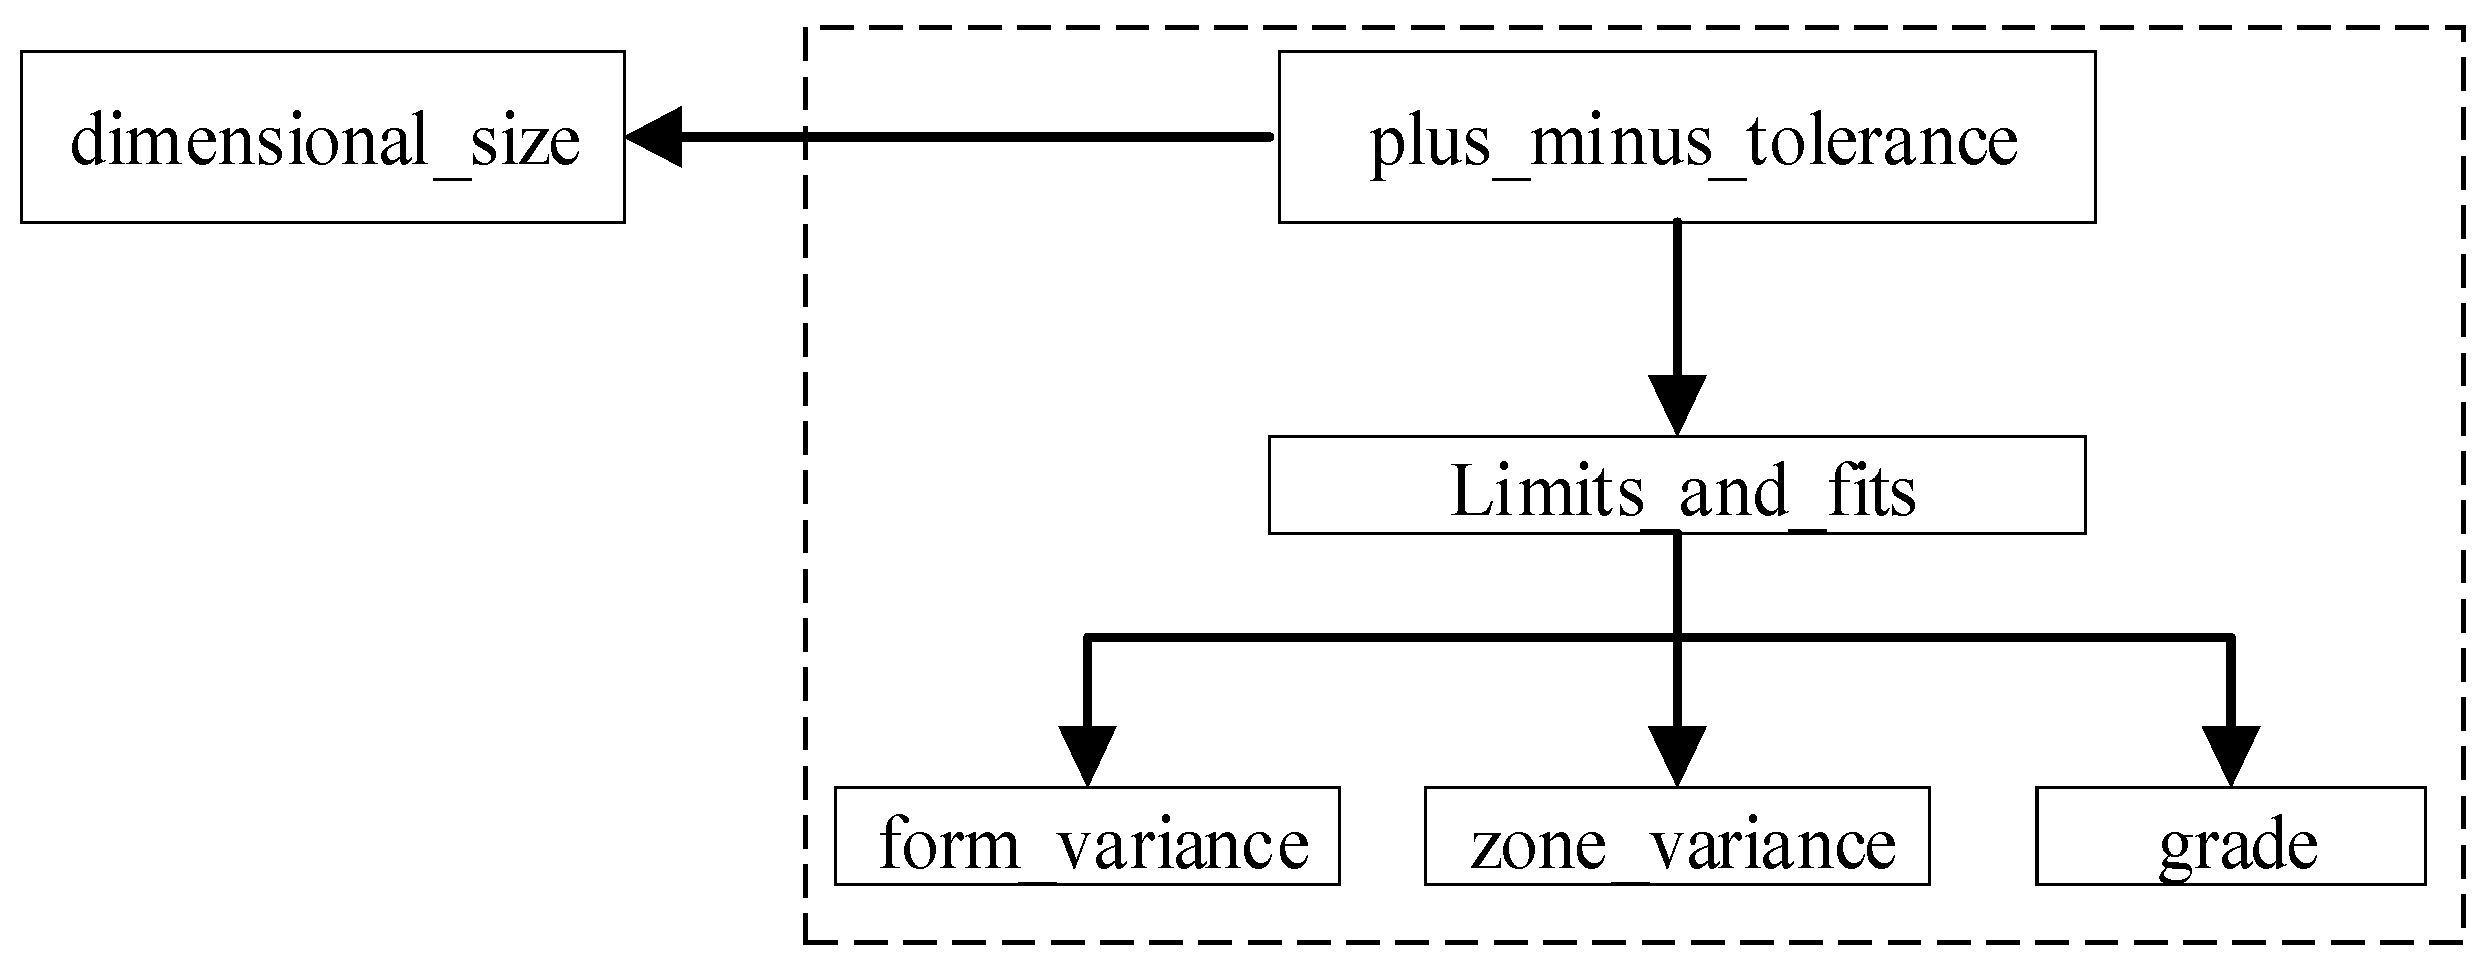
In a STEP AP242 file, the tolerance class is specified by the entity identifier “LIMITS_AND_FITS”, which contains three attributes: “FORM_VARIANCE”, “ZONE_VARIANCE”, and “GRADE”. “FORM_VARIANCE” represents the tolerance code; “ZONE_VARIANCE” the tolerance fit type; and “GRADE” the grade of the tolerance. Entity “LIMITS_AND_FITS” is referenced from entity “PLUS_MINUS_TOLERANCE”, which points to entity “DIMENSIONAL_SIZE”. This links the nominal dimension with the tolerance class. Figure A3 illustrates the entity-attribute relationship of the tolerance class in a STEP AP242 file.
Figure A3. The dimensional tolerancing class entity-attribute relationship in a STEP AP242 file.
Applsci 15 10847 g0a3
(3) Detailed entity-attribute relationships of a GT with one or more modifiers
In an FCF, if a GT has one or more modifiers, there will be one GT entity and one or more modifier entities. A modifier entity is named “GEOMETRIC_TOLERANCE_WITH_MODIFIERS”. Its “MODIFIERS” attribute specifies certain modifiers, such as “Ⓜ”. Figure A4 depicts the entity-attribute relationship of a GT with one or more modifiers in a STEP AP242 file.
Figure A4. The entity-attribute relationship of a geometry tolerance with one or more modifiers in a STEP AP242 file.
Applsci 15 10847 g0a4
(4) Detailed entity-attribute relationships of a GT with one or more datum
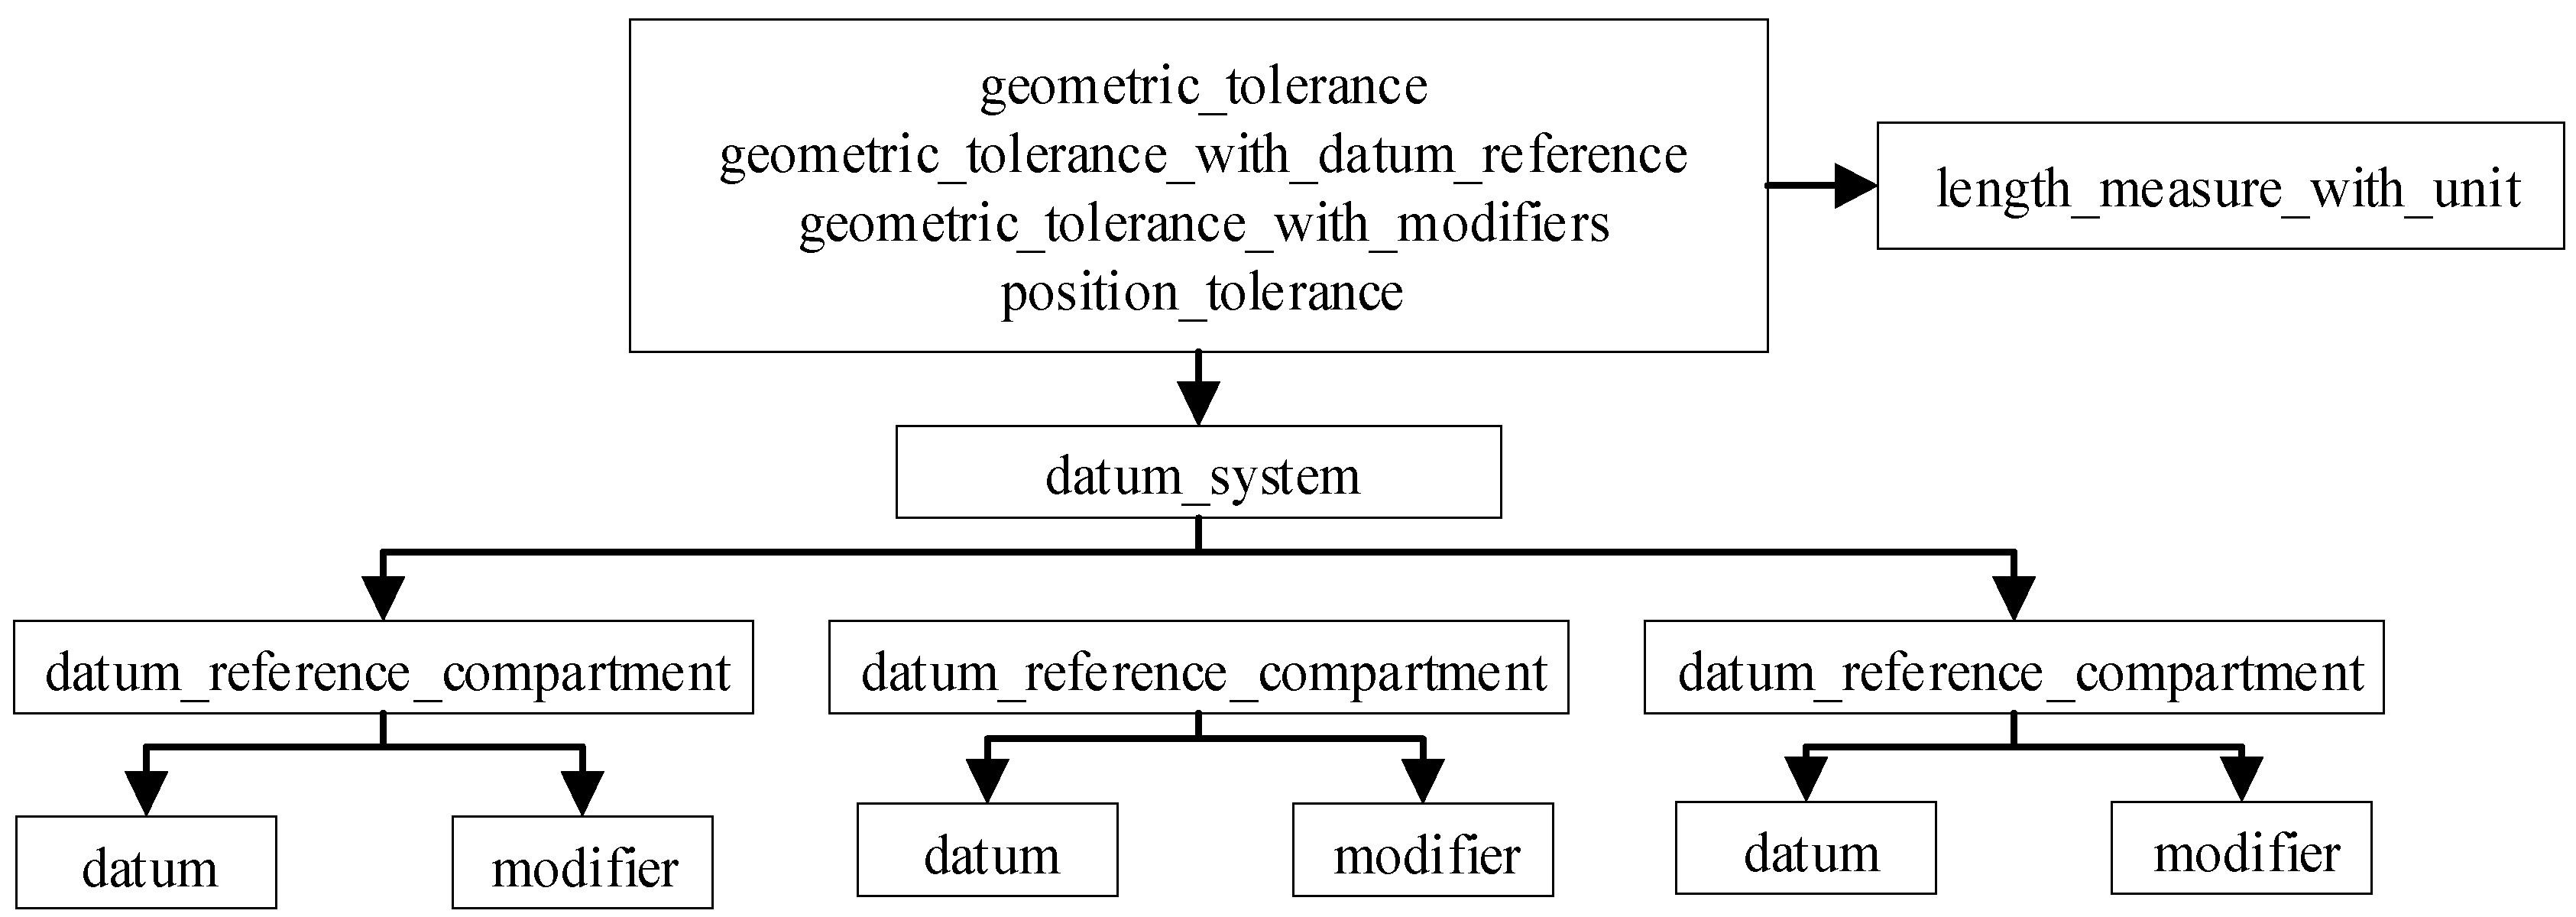
A GT, such as position, concentricity, parallelism, perpendicularity, or symmetry, may have one or more datums (no more than three) that are used to specify the tolerance measuring position. For example, in a STEP AP242 file with a datum, the entity “GEOMETRIC_TOLERANCE” represents objects associated with a GT, “GEOMETRIC_TOLERANCE_WITH_DATUM_REFERENCE” represents datums referenced by a GT, “GEOMETRIC_TOLERANCE_WITH_MODIFIERS” represents modifiers attached to a GT, and “POSITION_TOLERANCE” represents the GT type. Through the entity “GEOMETRIC_TOLERANCE_WITH_DATUM_REFERENCE”, the entities “DATUM_SYSTEM” and “DATUM_REFERENCE_COMPARTMENT” can be identified. By traversing the “DATUM” attribute of “DATUM_REFERENCE_COMPARTMENT”, certain DSs can be obtained (Figure A5).
Figure A5. The entity-attribute relationship of a geometry tolerance with one or more reference datum in a STEP AP242 file.
Applsci 15 10847 g0a5

Appendix D

Figure 4 shows an example of a 3D linear size of “48” (in millimeters). The identifiers “#124” and “#125” in the data line “#15=DIMENSIONAL_LOCATION (‘linear distance’, ‘’, #124, #125)” describe the two surfaces associated with this size. These identifiers allow us to determine the data lines “#119=GEOMETRIC_ITEM_SPECIFIC_USAGE (‘’, ‘PMI’, #124, #131, #528)” and “#120=GEOMETRIC_ITEM_SPECIFIC_USAGE (‘’, ‘PMI’, #125, #131, #530)”. The entities “#528” and “#530”, which refer to the data lines “ADVANCED_FACE (“, #462, #514, F.)” and “ADVANCED_FACE (“, #466, #516, F.)”, respectively, can also be determined.
The data line “ADVANCED_FACE (“, #462, #514, F.)” can be used to determine the data lines “#462=FACE_BOUND(,#410,.T.)” and “#514=PLANE(,#572)”. Identifier “#462” describes the boundary of the surface, and identifier “#514” shows that the surface type is a plane. Through “#514” the data line “#572=AXIS2_PLACEMENT_3D(‘’, #816, #657, #658)” can be determined. This data line specifies the position and orientation of a surface in 3D space based on a point and two coordinate axes. The data line “#816=CARTESIAN_POINT(““, (0, 0, 28))” represents the origin of the local coordinate system for this plane. The data lines “#657=DIRECTION(““, (0, 1, 0))” and “#658=DIRECTION(““, (0, 0, 1))” represent the Z-axis and X-axis directions of this local coordinate system, respectively. Thus, the position and normal vector of a 3D linear-size-associated surface can be determined.
Furthermore, using the data line “#462=FACE_BOUND(“,#410,.T.)” yields the data line “#410=EDGE_LOOP (‘’,(#182,#183, #184,#185,#186,#187,#188,#189,#190,#191))”, which represents the oriented edges of a surface. Taking the data line “#182=ORIENTED_EDGE (‘’,*,*,#276,.T.)” as an example, the data line “#276=EDGE_CURVE(‘’,#327,#326,#366,.T.)” can be determined. This data line describes the start point, end point, and type of the edge. Through the data line “#327=VERTEX_POINT (‘’,#805)”, the start coordinate “#805=CARTESIAN_POINT(‘’,(0.,0.,3.99999999999999))” can be determined. Through the data line “#326=VERTEX_POINT (‘’,#803)”, the end point coordinate “#803=CARTESIAN_POINT (‘’,(0.,0.,2.))” can be established. Through the data line “#366=LINE(‘’,#804,#388)”, the type of this edge, which is a line, can be determined. Searching for the entity “ANNOTATION_PLANE” yields the data line “#23=ANNOTATION_PLANE(‘PMI PLANE’, (#557), #525,(#25))”. Thus, the position and normal vector of a 3D linear size subordinate annotated plane can be determined.

Appendix E

Table A1. System Main development tools.
CategorySoftware or Tools
Operating systemWindows 11
STEP AP242 file modelingNX 1847
BrowserChrome 13.0
Back-end developmentJetBrains IntelliJ IDEA 2024.1
Development frameworkHTML5, CSS 3.0
Graphics processing libraryWebGL 2.0, Three.js r160
Primary programming languageC++14, JavaScript ES2024

Appendix F

……
#141=(
LENGTH_MEASURE_WITH_UNIT()
MEASURE_REPRESENTATION_ITEM()
MEASURE_WITH_UNIT(POSITIVE_LENGTH_MEASURE(0.1),#1430)
QUALIFIED_REPRESENTATION_ITEM((#131))
REPRESENTATION_ITEM(‘nominal value’)
);
#142=(
LENGTH_MEASURE_WITH_UNIT()
MEASURE_REPRESENTATION_ITEM()
MEASURE_WITH_UNIT(POSITIVE_LENGTH_MEASURE(72.),#1430)
QUALIFIED_REPRESENTATION_ITEM((#132))
REPRESENTATION_ITEM(‘nominal value’)
);
#143=(
LENGTH_MEASURE_WITH_UNIT()
MEASURE_REPRESENTATION_ITEM()
MEASURE_WITH_UNIT(POSITIVE_LENGTH_MEASURE(0.1),#1430)
QUALIFIED_REPRESENTATION_ITEM((#133))
REPRESENTATION_ITEM(‘nominal value’)
);
#144=(
LENGTH_MEASURE_WITH_UNIT()
MEASURE_REPRESENTATION_ITEM()
MEASURE_WITH_UNIT(POSITIVE_LENGTH_MEASURE(0.1),#1430)
QUALIFIED_REPRESENTATION_ITEM((#134))
REPRESENTATION_ITEM(‘nominal value’)
);
#145=(
LENGTH_MEASURE_WITH_UNIT()
MEASURE_REPRESENTATION_ITEM()
MEASURE_WITH_UNIT(POSITIVE_LENGTH_MEASURE(18.),#1430)
QUALIFIED_REPRESENTATION_ITEM((#135))
REPRESENTATION_ITEM(‘nominal value’)
);
#146=(
LENGTH_MEASURE_WITH_UNIT()
MEASURE_REPRESENTATION_ITEM()
MEASURE_WITH_UNIT(POSITIVE_LENGTH_MEASURE(18.),#1430)
QUALIFIED_REPRESENTATION_ITEM((#136))
REPRESENTATION_ITEM(‘nominal value’)
);
#147=(
LENGTH_MEASURE_WITH_UNIT()
MEASURE_REPRESENTATION_ITEM()
MEASURE_WITH_UNIT(POSITIVE_LENGTH_MEASURE(48.),#1430)
QUALIFIED_REPRESENTATION_ITEM((#137))
REPRESENTATION_ITEM(‘nominal value’)
);
#148=(
LENGTH_MEASURE_WITH_UNIT()
MEASURE_REPRESENTATION_ITEM()
MEASURE_WITH_UNIT(POSITIVE_LENGTH_MEASURE(10.),#1430)
QUALIFIED_REPRESENTATION_ITEM((#138))
REPRESENTATION_ITEM(‘nominal value’)
);
#149=(
LENGTH_MEASURE_WITH_UNIT()
MEASURE_REPRESENTATION_ITEM()
MEASURE_WITH_UNIT(POSITIVE_LENGTH_MEASURE(12.),#1430)
QUALIFIED_REPRESENTATION_ITEM((#139))
REPRESENTATION_ITEM(‘nominal value’)
);
#150=(
LENGTH_MEASURE_WITH_UNIT()
MEASURE_REPRESENTATION_ITEM()
MEASURE_WITH_UNIT(POSITIVE_LENGTH_MEASURE(26.),#1430)
QUALIFIED_REPRESENTATION_ITEM((#140))
REPRESENTATION_ITEM(‘nominal value’)
);
#151=(
GEOMETRIC_TOLERANCE(‘Feature Control Frame (113)’,
‘Geometric tolerance for feature’,#141,#223)
GEOMETRIC_TOLERANCE_WITH_DATUM_REFERENCE((#159))
POSITION_TOLERANCE()
);
#152=(
GEOMETRIC_TOLERANCE(‘Feature Control Frame (138)’,
‘Geometric tolerance for feature’,#143,#226)
GEOMETRIC_TOLERANCE_WITH_DATUM_REFERENCE((#159))
POSITION_TOLERANCE()
);
#153=DATUM(‘’,’’,#1431,.F.,’A’);
#154=DATUM(‘’,’’,#1431,.F.,’B’);
#155=DATUM(‘’,’’,#1431,.F.,’C’);
#156=DATUM_REFERENCE_COMPARTMENT(‘’,$,#1431,.F.,#153,$);
#157=DATUM_REFERENCE_COMPARTMENT(‘’,$,#1431,.F.,#154,$);
#158=DATUM_REFERENCE_COMPARTMENT(‘’,$,#1431,.F.,#155,$);
#159=DATUM_SYSTEM(‘’,’’,#1431,.F.,(#156,#157,#158));

References

  1. Goher, K.; Shehab, E.; Al-Ashaab, A. Model-based definition and Enterprise: State-of-the-art and future trends. Proc. Inst. Mech. Eng. Part B J. Eng. Manuf. 2021, 235, 2288–2299. [Google Scholar] [CrossRef]
  2. Goher, K.; Al-Ashaab, A.; Sarfraz, S. An uncertainty management framework to support model-based definition and enterprise. Comput. Ind. 2023, 150, 103944. [Google Scholar] [CrossRef]
  3. Ruemler, S.; Zimmerman, K.; Hartman, N. Promoting Model-Based definition to establish a complete product definition. J. Manuf. Sci. Eng. 2017, 139, 51–58. [Google Scholar] [CrossRef] [PubMed]
  4. Miller, A.; Alvarez, R.; Hartman, N. Towards an extended model-based definition for the digital twin. Comput. Aided Des. Appl. 2018, 15, 880–891. [Google Scholar] [CrossRef]
  5. Zhao, X.; Wei, S.; Ren, S. Integrating MBD with BOM for consistent data transformation during lifecycle synergetic decision-making of complex products. Adv. Eng. Inform. 2024, 61, 102491. [Google Scholar] [CrossRef]
  6. Zhou, Q.; Zhou, D.; Dai, C. Knowledge-driven innovation in industrial maintenance: A neural-enhanced model-based definition framework for lifecycle maintenance process information propagation. J. Manuf. Syst. 2025, 82, 976–999. [Google Scholar] [CrossRef]
  7. Pfouga, A.; Stjepandic, J. Leveraging 3D geometric knowledge in the product lifecycle based on industrial standards. J. Comput. Des. Eng. 2018, 5, 54–67. [Google Scholar] [CrossRef]
  8. Lenne, D.; Thouvenin, I.; Aubry, S. Supporting design with 3D-annotations in a collaborative virtual environment. Res. Eng. Des. 2009, 20, 149–155. [Google Scholar] [CrossRef]
  9. ISO 10303-242:2022; Industrial Automation Systems and Integration—Product Data Representation and Exchange—Part 242: Application Protocol: Managed Model-Based 3D Engineering. International Organization for Standardization: Geneva, Switzerland, 2022.
  10. eDrawings. Available online: https://www.edrawingsviewer.com/ (accessed on 2 August 2025).
  11. Autodesk Forge. Available online: https://aps.autodesk.com/ (accessed on 2 September 2025).
  12. Open Cascade CAD Assistant. Available online: https://www.opencascade.com/products/cad-assistant/ (accessed on 2 August 2025).
  13. IDA-STEP Basic. Available online: https://www.ida-step.net/ (accessed on 2 September 2025).
  14. OpenStep Viewer. Available online: https://openstepviewer.com/ (accessed on 2 September 2025).
  15. Cax-IF Recommended Practices for the Representation and Presentation of Product Manufacturing Information (PMI) (AP242). Available online: https://www.mbx-if.org/home/wp-content/uploads/2024/06/rec_pracs_pmi_v41.pdf (accessed on 2 July 2025).
  16. Cicconi, P.; Raffaeli, R.; Germani, M. An approach to support model based definition by PMI annotations. Comput. Aided Des. Appl. 2017, 14, 526–534. [Google Scholar] [CrossRef]
  17. Company, P.; Camba, J.; Patalano, S. A Functional Classification of Text Annotations for Engineering Design. Comput. Aided Des. 2023, 158, 103486. [Google Scholar] [CrossRef]
  18. Witherell, P.; Herron, J.; Ameta, G. Towards Annotations and Product Definitions for Additive Manufacturing. Procedia CIRP 2016, 43, 339–344. [Google Scholar] [CrossRef]
  19. ISO 16792:2021; Technical Product Documentation—Digital Product Definition Data Practices. International Organization for Standardization: Geneva, Switzerland, 2021. Available online: https://www.iso.org/standard/73871.html (accessed on 2 August 2025).
  20. ASME Y14.41; Digital Product Definition Data Practices. American Society of Mechanical Engineers: New York, NY, USA, 2019.
  21. Agovic, A.; Trautner, T.; Bleicher, F. Digital transformation-implementation of drawingless manufacturing: A Case Study. Procedia CIRP 2022, 107, 1479–1484. [Google Scholar] [CrossRef]
  22. Yang, W.; Fu, C.; Yan, X. A knowledge-based system for quality analysis in model-based design. J. Intel. Manuf. 2020, 31, 1579–1606. [Google Scholar] [CrossRef]
  23. Lipman, R.; Filliben, J. Testing implementations of geometric dimensioning and tolerancing in CAD Software. Comput. Aided Des. Appl. 2020, 17, 1241–1265. [Google Scholar] [CrossRef]
  24. Chen, Y.; Xu, S.; Gan, Y. Exact Representation Methodology of 3D Annotation Information in Model Based Definition for Product Digitization. Comput. Aided Des. Appl. 2023, 20, 856–871. [Google Scholar] [CrossRef]
  25. Peng, Z.; Huang, M.; Zhong, Y. A new method for interoperability and conformance checking of product manufacturing information. Comput. Electr. Eng. 2020, 85, 106650. [Google Scholar] [CrossRef]
  26. Martin, H.; Stefan, G.; Benjamin, S. Mapping of GD&T information and PMI between 3D product models in the STEP and STL format. Comput. Aided Des. 2019, 115, 293–306. [Google Scholar] [CrossRef]
  27. Petruccioli, A.; Pini, F.; Leali, F. Model-Based Approach for Optimal Allocation of GD&T. In Proceedings of the Second International Conference on Design Tools and Methods in Industrial Engineering, Rome, Italy, 9–10 September 2021. [Google Scholar] [CrossRef]
  28. Urbas, U.; Vrabič, R.; Vukašinović, N. Displaying Product Manufacturing Information in Augmented Reality for Inspection. Procedia CIRP 2019, 81, 832–837. [Google Scholar] [CrossRef]
  29. Mohammed, S.; Arbo, M.; Tingelstad, L. Leveraging model-based definition and STEP AP242 in task specification for robotic assembly. Procedia CIRP 2020, 97, 92–97. [Google Scholar] [CrossRef]
  30. Al-wswasi, M.; Ivanov, A. A novel and smart interactive feature recognition system for rotational parts using a STEP file. Int. J. Adv. Manuf. Tech. 2019, 104, 261–284. [Google Scholar] [CrossRef]
  31. STEP File Analyzer and Viewer. Available online: https://www.nist.gov/services-resources/software/step-file-analyzer-and-viewer (accessed on 12 March 2025).
  32. Lupi, F.; Maffei, A.; Lanzetta, M. CAD-based autonomous vision inspection systems. Procedia Comput. Sci. 2024, 232, 2127–2136. [Google Scholar] [CrossRef]
  33. Hardwick, M. Roadmap for deploying semantic GD&T in manufacturing. Procedia CIRP 2016, 52, 108–111. [Google Scholar] [CrossRef]
  34. Kwon, S.; Monnier, V.; Barbau, R. Enriching standards-based digital thread by fusing as-designed and as-inspected data using knowledge graphs. Adv. Eng. Inform. 2020, 46, 101102. [Google Scholar] [CrossRef]
  35. Nzetchou, S.; Durupt, A.; Remy, S. Semantic enrichment approach for low-level CAD models managed in PLM context: Literature review and research prospect. Comput. Ind. 2022, 135, 103575. [Google Scholar] [CrossRef]
  36. Chen, Y.; Bai, B.; Gan, Y. Ontology-based methodology for the intelligent detection of product manufacturing information semantic representation errors in the model-based definition. J. Adv. Mech. Des. Syst. 2024, 18, 32–42. [Google Scholar] [CrossRef]
  37. ISO 14405-1:2016; Geometrical Product Specifications (GPS)—Dimensional Tolerancing—Part 1: Linear Sizes. International Organization for Standardization: Geneva, Switzerland, 2016.
  38. ISO 14405-2:2018; Geometrical Product Specifications (GPS)—Dimensional Tolerancing—Part 2: Dimensions Other than Linear or Angular Sizes. International Organization for Standardization: Geneva, Switzerland, 2018.
  39. ISO 14405-3:2016; Geometrical Product Specifications (GPS)—Dimensional Tolerancing—Part 3: Angular Sizes. International Organization for Standardization: Geneva, Switzerland, 2016.
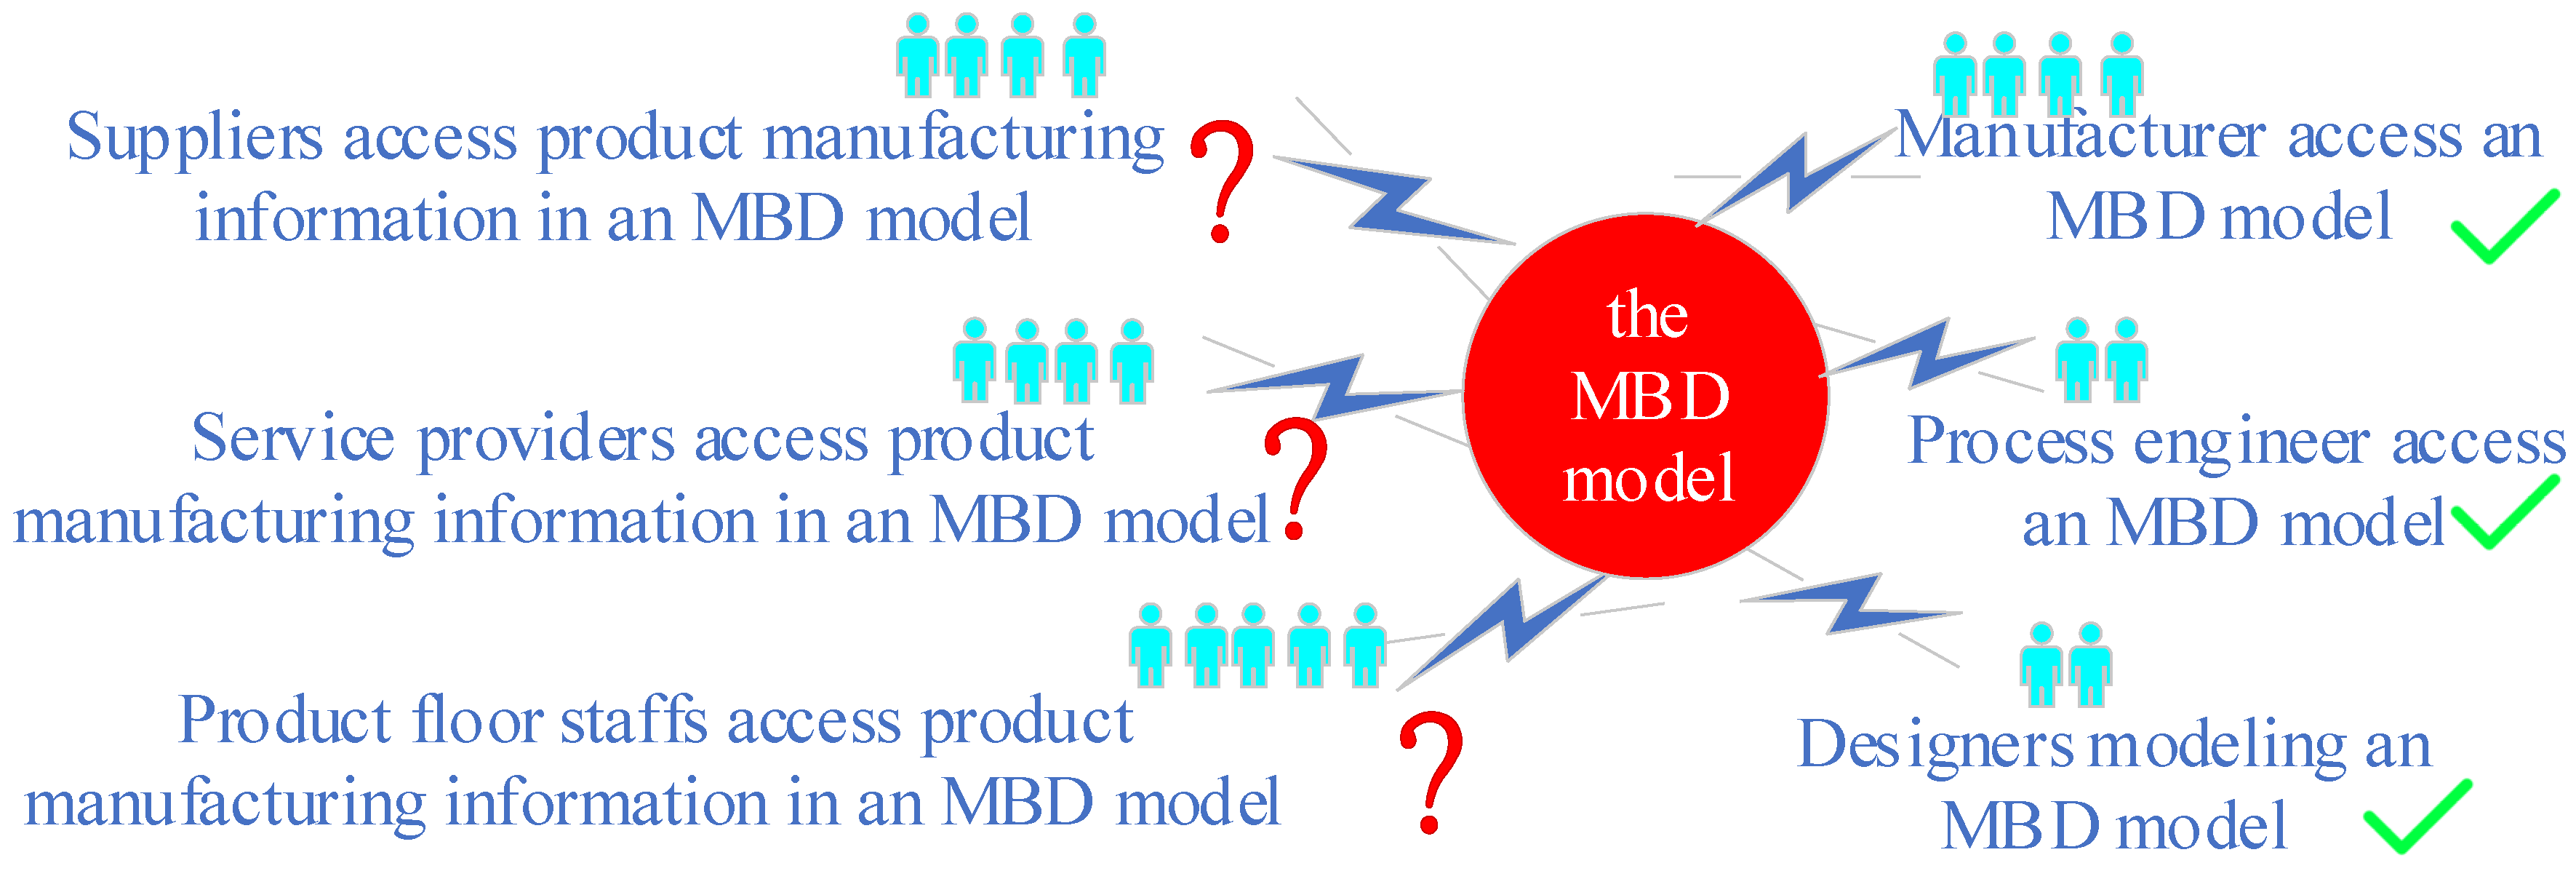
Figure 1. Product manufacturing information flow process in the model-based definition models.
Applsci 15 10847 g001
Figure 2. The content of a three-dimensional linear size annotation.
Applsci 15 10847 g002
Figure 3. Dimension entity-attribute relationship in a STEP AP242 file.
Applsci 15 10847 g003
Figure 4. Sample of three-dimensional dimension annotation.
Applsci 15 10847 g004
Figure 5. The entity reference relationship of a three-dimensional linear size in an example part.
Applsci 15 10847 g005
Figure 6. An algorithm for automatically extracting three-dimensional linear size information.
Applsci 15 10847 g006
Figure 7. Plus/minus deviation entity-attribute relationship in a STEP AP242 file.
Applsci 15 10847 g007
Figure 8. An algorithm to automatically extract dimensional tolerancing in a STEP AP242 file.
Applsci 15 10847 g008
Figure 9. Part of a STEP AP242 sample file including a straightness tolerance.
Applsci 15 10847 g009
Figure 10. The entity-attribute relationship of a geometry tolerance without a modifier or datum reference in a STEP AP242 file illustrated using a straightness tolerance as an example.
Applsci 15 10847 g010
Figure 11. An algorithm to automatically extract geometry tolerance information in a STEP AP242 file.
Applsci 15 10847 g011
Figure 12. Link to the PMI graphical presentation and semantic representation.
Applsci 15 10847 g012
Figure 13. The boundary representation model in STEP AP242 file.
Applsci 15 10847 g013
Figure 14. Automatic extraction algorithm for associated object information.
Applsci 15 10847 g014
Figure 15. The three-dimensional dimension annotations graphical presentation algorithm in a web browser.
Applsci 15 10847 g015
Figure 16. Default position of three-dimensional dimension annotation text.
Applsci 15 10847 g016
Figure 17. The three-dimensional dimension annotations semantic representation algorithm in a web browser.
Applsci 15 10847 g017
Figure 18. Demonstration of three-dimensional annotation within a web browser: (a) 3D dimension annotation (b) 3D dimensional tolerancing annotation (c) datum symbol annotation (d) 3D geometrical tolerance annotation (e) left associated surface of a 3D linear size (f) right associated surface of a 3D linear size.
Applsci 15 10847 g018aApplsci 15 10847 g018bApplsci 15 10847 g018c
Table 1. A comparison of typical STEP viewers.
Step ViewersPMI Web VisualizationAutomatic Linkage of PMI to Associated GeometryPMI SRIntegration of Both GP and SRBrowser Native RenderingFree or Not
eDrawingsXYYYXBasic version free
Autodesk ForgeXXXXXY
Open Cascade CAD AssistantXXXXXY
IDA-STEP BasicXYYYXX
OpenSTEP ViewerXYYYXY
This paperYYYYYY
Note: Y for Support, X for not.
Table 2. Types of dimensional tolerancing.
TypeNominal SizePlus/Minus DeviationValue RangeTolerance Class
Related
entity
“MEASURE_REPRESENTATION_ITEM”“PLUS_MINUS_TOLERANCE”“UPPER_LIMIT”, “NOMINAL_VALUE” and “LOWER_LIMIT”“LIMITS_AND_FITS”
ExampleApplsci 15 10847 i001Applsci 15 10847 i002Applsci 15 10847 i003Applsci 15 10847 i004
Table 3. Types of geometrical tolerance.
TypeA GT Without a Modifier or Datum ReferenceA GT with One or More
Modifiers
A GT with One or More Datum
Related
entity
“STRAIGHTNESS_TOLERANCE” and so on“GEOMETRIC_TOLERANCE_WITH_MODIFIERS”“GEOMETRIC_TOLERANCE_WITH_DATUM_REFERENCE”
ExampleApplsci 15 10847 i005Applsci 15 10847 i006Applsci 15 10847 i007
Table 4. Prototype system performance analysis.
TypeSub TypeWeb-Based PMI Graphical PresentationAutomatic Linkage of PMI to Associated Geometry via WebGL Texture
Form toleranceStraightnessYY
FlatnessYY
RoundnessYY
CylindricityYY
Profile of a lineYY
Profile of a surfaceYY
Direction toleranceParallelismYY
PerpendicularityYY
InclinationYY
Position tolerancesLocationYY
Runout toleranceCircular runoutYY
Full runoutYY
Roughness symbolXX
Weld symbolXX
Note: Y for Support, X for not.
Disclaimer/Publisher’s Note: The statements, opinions and data contained in all publications are solely those of the individual author(s) and contributor(s) and not of MDPI and/or the editor(s). MDPI and/or the editor(s) disclaim responsibility for any injury to people or property resulting from any ideas, methods, instructions or products referred to in the content.