Article

Numerical Simulation Study on Shear Mechanical Properties of Unfilled Three-Dimensional Rough Joint Surfaces Under Constant Normal Stiffness Boundary Conditions

1
School of Resources and Environment Engineering, Jiangxi University of Science and Technology, Ganzhou 341000, China
2
School of Resources and Civil Engineering, Gannan University of Science and Technology, Ganzhou 341000, China
3
Ganzhou Key Laboratory of Mine Geological Disaster Prevention and Control and Ecological Restoration, Ganzhou 341000, China
4
Jiangxi Provincial Key Laboratory of Safe and Efficient Mining of Rare Metal Resources, Jiangxi University of Science and Technology, Ganzhou 341000, China
5
School of Resources and Safety Engineering, Central South University, Changsha 410083, China
*
Author to whom correspondence should be addressed.
Appl. Sci. 2025, 15(19), 10827; https://doi.org/10.3390/app151910827
Submission received: 27 August 2025 / Revised: 30 September 2025 / Accepted: 30 September 2025 / Published: 9 October 2025
(This article belongs to the Section Earth Sciences)

Abstract

When jointed rock masses are in a high-stress environment, the roughness of the joints is the key factor controlling their shear strength. Their loading behavior is also different from the constant normal load (CNL) conditions controlled in conventional laboratories; rather, they follow the constant normal stiffness (CNS) conditions. To investigate the effects of normal stiffness and roughness on the shear mechanical properties of unfilled joint surfaces, shear tests were simulated using PFC3D (5.0) software under CNS conditions. The effects of normal stiffness of 0 (constant normal stress of 4 MPa), 0.028 GPa/m (low normal stiffness), 0.28 GPa/m (medium normal stiffness), and 2.8 GPa/m (high normal stiffness), and joint roughness coefficients (JRC) of 2~4 (low roughness), 10~12 (medium roughness), and 18~20 (high roughness) on the shear stress, normal stress, normal deformation, surface resistance index, and block failure characteristics of the joint surface were obtained. The results indicate that for different combinations of normal stiffness—JRC—the shear simulation process primarily exhibits three deformation stages: linear stage, yield stage, and post-peak stage. Shear stress increases initially and then decreases as shear displacement increases. When normal stiffness is no less than 0.28 GPa/m, both normal stress and JRC increase gradually with increasing JRC and normal stiffness. When the normal stiffness is no greater than 0.028 GPa/m, the normal stress shows no significant change. The normal displacement changes from “shear contraction” to “shear expansion” with increasing shear displacement and from positive to negative values while the displacement gradually increases; the maximum normal displacement decreases with increasing normal stiffness and increases with increasing JRC. The peak SRI value increases with increasing JRC and decreases with increasing normal stiffness. As normal stiffness increases, the number of tensile cracks for JRC 2~4 first decreases and then increases, while the number of shear cracks gradually increases; for JRC 10~12 and 18~20, both the number of shear cracks and tensile cracks increase with increasing normal stiffness. This paper simulates the actual mechanical environment of deep underground joints to expound the influence of normal stiffness and joint roughness on the stability of deep rock masses. The research results can provide certain theoretical references for predicting the stability of deep surrounding rocks and the stress of support structures.

1. Introduction

The widespread presence of various joints in rock masses weakens the integrity of rock slopes, tunnels, dams, underground caverns, mines, and other excavation projects, significantly reducing the strength of the rock mass. Shear slippage along joint surfaces can lead to severe engineering instability, making it a common failure mode in rock masses [1,2,3,4]. In actual engineering projects, shear failure of jointed rock masses may occur under two boundary conditions [5,6]. For tunnels, dams, slopes, and other engineering structures located in shallow rock masses, the normal stress during the shear process of rock mass joints remains essentially constant. In this case, the effect of shear expansion on normal stress is not considered, and this is referred to as the CNL boundary condition; however, for deep underground engineering projects such as deep mines and underground chambers, under shear loads, joint surfaces cannot freely shear due to surrounding rock constraints, causing the normal stress acting on the rock mass to continuously increase, which falls under the CNS boundary condition.
In practice, corresponding to different engineering practices, two typical boundary conditions, CNL and CNS, are also configured in the laboratory [7,8,9,10]. Regarding the shear failure characteristics of rock joint surfaces under CNL boundary conditions, numerous scholars have conducted extensive research on the morphological features and failure patterns of joint surfaces [11,12,13,14,15]. As rock engineering projects move toward deeper excavation, jointed rock shear tests have gradually evolved from CNL boundary conditions to CNS boundary conditions that more closely resemble real underground engineering conditions [16,17,18,19,20]. Some scholars have also compared test results under CNS boundary conditions with those under CNL conditions. For example, Indraratna et al. [21] studied the shear characteristics of regular sawtooth-shaped rock joints made of gypsum and compared the test results under CNS boundary conditions with those under CNL conditions. The results showed that the peak shear stress under CNS conditions exhibited significant differences compared to that under CNL conditions. Cui et al. [5] conducted direct shear tests on two types of normal boundary conditions with different roughness structures. The results showed that the shear displacement curve under CNS conditions exhibited obvious hardening characteristics, with peak shear stress, residual strength, peak shear displacement, and normal displacement all greater than those under CNL conditions. With the rapid development of measurement technologies such as acoustic emission, laser scanning, and photographic image analysis, researchers have also begun to focus on real-time monitoring of shear processes and surface wear and damage characteristics of joint surfaces under different normal stiffness conditions. For example, Liu et al. [22] conducted cyclic shear tests on three-dimensional rough joint surfaces under CNS boundary conditions, revealing the shear mechanical properties and acoustic emission energy characteristics of three-dimensional jointed rock bodies under different stress paths. Jiao et al. [23] conducted direct shear tests on artificial joint surfaces under CNS conditions. By combining three-dimensional point cloud data of the joint surface with the normal displacement values at corresponding shear displacement locations, they obtained a cloud map of the evolution of joint surface gap width at specific shear displacement locations. This allowed them to analyze the dynamic evolution process of the joint surface during shear and identify its failure mechanism.
Indeed, indoor experiments are an important means of studying the effect of normal stiffness on the shear properties of joint surfaces. However, considering the mathematical complexity of experimental methods or the difficulties associated with experimental work, as well as the stringent and high-cost characteristics of shear test data monitoring methods, it is necessary to use numerical software to study the shear mechanism of joint surfaces under constant normal stiffness conditions. Therefore, numerical methods have garnered significant attention in recent years, particularly the Discrete Element Method (DEM), which has proven particularly useful for addressing these issues through its implementation in particle flow codes (PFC) [24,25,26]. Compared to laboratory experiments, PFC can construct models of joints with different morphologies for testing under various conditions. The models can directly observe the initiation and propagation of microcracks in the specimen and precisely detect the correlation between shear stress and crack development at any given moment during the shear process, which is difficult to achieve in direct shear tests on real rock [27,28,29,30,31,32,33]. However, current research on joint surface shear using discrete element simulation is primarily focused on CNL conditions, with relatively few studies on shear response numerical simulations under CNS conditions. In particular, there is a lack of research comprehensively considering the shear characteristics of joints with low, medium, and high roughness, as well as under low, medium, and high normal stiffness conditions. In deep engineering projects, hard and intact surrounding rocks can provide the rock mass with a relatively high normal stiffness for bearing loads, while fragmented and soft surrounding rocks can offer a lower normal stiffness for the rock mass to bear loads. Considering the influence of joint roughness on the shear strength of the rock mass, it can provide certain reference for analyzing the shear behavior of jointed rock masses under real stress paths in different surrounding rock environments.
Therefore, this study utilized the PFC3D software to conduct three-dimensional shear test simulations of rough joint surfaces under CNS conditions, revealing the effects of normal stiffness (0, 0.028 GPa/m, 0.28 GPa/m, 2.8 GPa/m) and roughness (JRC 2~4, 10~12, 18~20) on the shear stress, normal stress, normal deformation, shear stress path, surface resistance index, and block failure characteristics of the joint surface. The aim is to provide a reference for evaluating shear instability of jointed rock bodies with different roughness under different normal stiffness conditions in underground engineering.

2. Simulation Scheme

2.1. Establishment of Numerical Model

This study utilized PFC3D to generate a numerical model, constructing a cubic box with dimensions of 100 mm × 100 mm × 100 mm, as shown in Figure 1a. Then, generalized roughness profiles with JRC of 2~4, 10~12, and 18~20 [34] were embedded along the x and y axes of the x-y plane, as shown in Figure 1b. Subsequently, all possible contacts between the “upper particle group” and the “lower particle group” were set as a frictionless linear model, the contact within the rock block was set as a flat joint model with 8 bonded units, and the contact between the upper and lower blocks was set as a smooth joint model in a non-bonded state.

2.2. Parameter Calibration

As shown in Table 1, the contact parameters were calibrated based on experimental data from Hawkesbury sandstone [35], with some parameters listed below: Young’s modulus is 4.2 GPa, Poisson’s ratio is 0.2, uniaxial compressive strength is 27.4 MPa, basic friction angle is 37.62°, and shear stiffness and normal stiffness are 6.420 GPa/m and 28.771 GPa/m, respectively. These planar joint parameters were used to construct shear specimens. A series of uniaxial compression tests were then conducted, yielding average values for the elastic modulus (GPa), Poisson’s ratio, and uniaxial compressive strength (MPa) of approximately 4.162, 0.208, and 27.404, respectively, with standard deviations of 0.161, 0.031, and 0.002, respectively. Finally, a series of direct shear tests were conducted under different normal stresses to align with the basic friction angle and shear stiffness of the Hawkesbury sandstone.

2.3. CNS Boundary Condition Settings

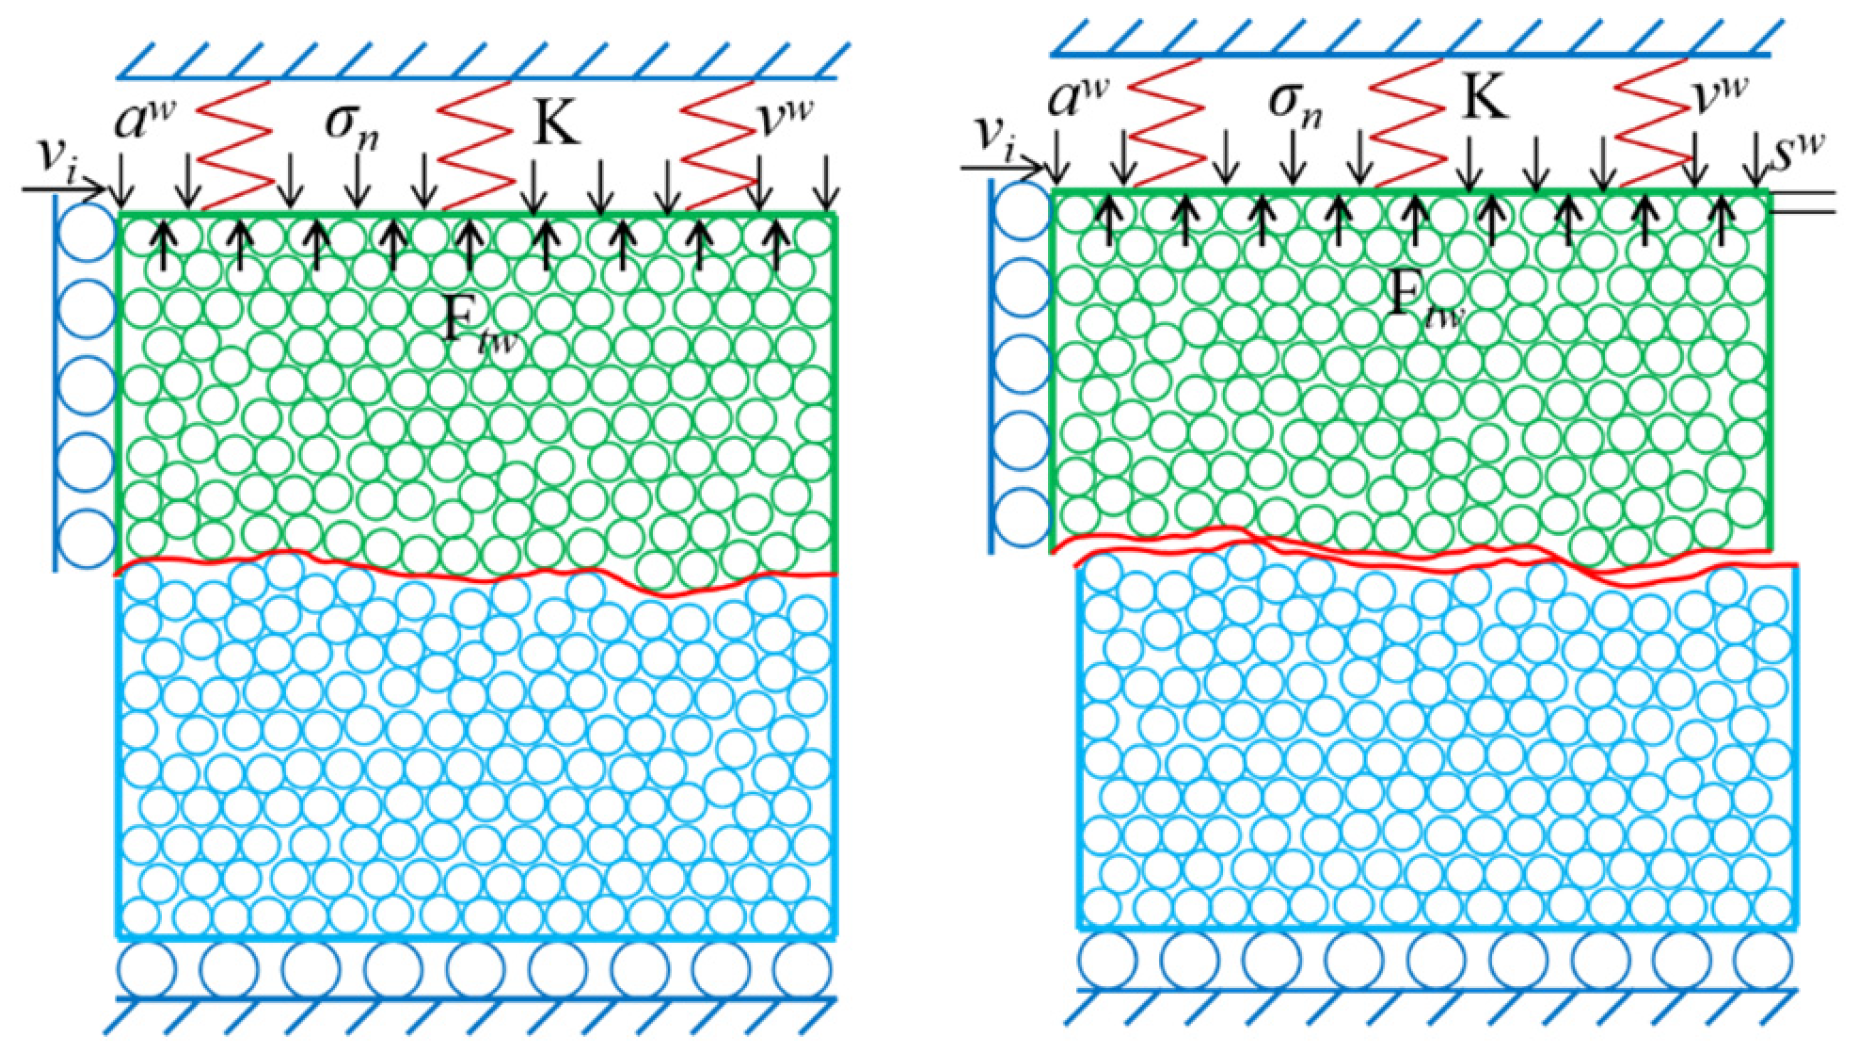
Existing discrete element numerical studies lack the necessary explicit equations for implementing CNS boundary conditions [6,8]. As shown in Equation (1), this paper adopts the method proposed in [36] to control the motion trajectory of the upper shear box using three explicit motion equations, thereby achieving CNS condition loading. As shown in Figure 2, the system is first run to balance the normal stress σ n applied to the upper block with the reaction force. Subsequently, the velocity v w , acceleration a w , and displacement s w of the top surface wall of the upper block during the shear process are monitored. By controlling the motion trajectory of the upper shear box to ensure the dynamic equilibrium of the system, the shear process is realized under CNS conditions. Meanwhile, in the numerical experiments, in order to dissipate the unnecessary kinetic energy of the particles, a local damping scheme with a ratio of 0.7 was also adopted.
v t + Δ t w = v t w + a t + Δ t w t a t + Δ t w = F t + Δ t w σ n × A K S t + Δ t w × A m m = ρ V
In the equation, v t + Δ t w , a t + Δ t w , s t + Δ t w , F t + Δ t w and K S t + Δ t w represent the velocity, acceleration (taking into account the damping effect), displacement, reaction force exerted and stiffness by particles on the top wall at time step t + Δ t , respectively; v t w represents the velocity of the top wall at time step t; t is the time step, with t = 1 × 10 5 s/step in this study; A is the area of the top wall, taken as 0.01 m2 in the 3D model; and m, ρ, and V are the mass, density, and volume of the sandstone, respectively, with ρ = 2205 kg/m3 and V = 0.001 m3 in this study.

2.4. Numerical Model Loading

Following the loading method used in indoor tests, the lower box remains fixed in all cases, with normal and shear loads applied solely by the upper box. Vertical loading is applied according to the CNS boundary conditions described in Section 2.3; horizontal loading is applied to the upper box along the +x direction with an increasing velocity (initial value of 0.02 m/s, final value of 0.1 m/s), moving the shear box as a whole from left to right until 9 mm. Additionally, during the loading process, the morphology of crack propagation is observed at the microscopic level, and the number of corresponding states and the resulting shear displacement are recorded. At the macroscopic level, the shear displacement, normal displacement, normal stress, and shear stress of the system are monitored at each time step.

3. Simulation Results and Analysis

3.1. Shear Stress Evolution

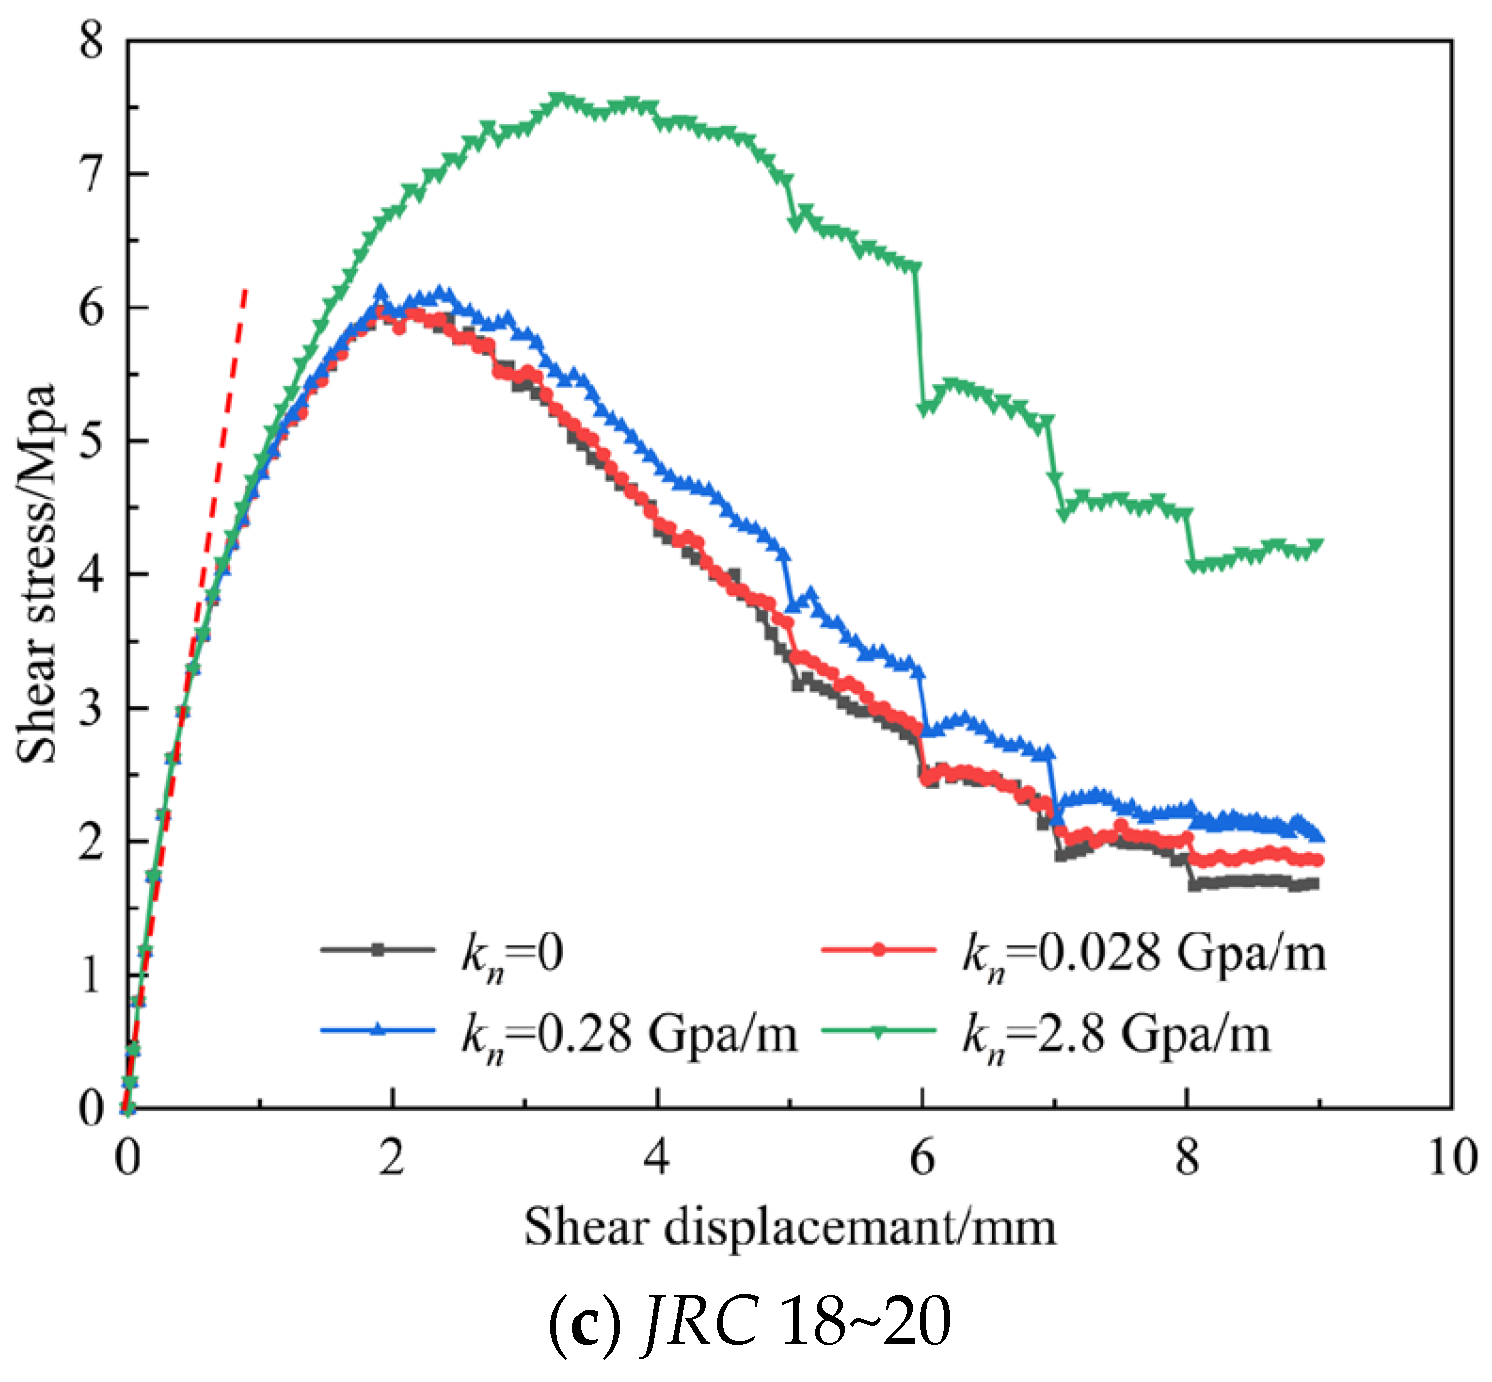
Figure 3 shows the stress-displacement curves under different normal stiffness (kn = 0, 0.028, 0.28, 2.8 GPa/m) under different roughness joint surfaces. The Stress-displacement curves for different normal stiffness-JRC combinations show that the shear deformation process primarily consists of three stages: the linear stage, the yield stage, and the post-peak stage. As JRC increases, the normal stiffness gradually expands the range of the stress-displacement curve. As shown in Figure 3, the evolution of the stress-displacement curves for different roughness joint surfaces is largely similar before the yield stage, and none exhibit a distinct compression stage. Instead, they increase from the onset of shear through the elastic stage to the yield stage. The primary differences are observed in the yield stage and post-peak stage. The three stages are described as follows:
Stage I: Linear stage. When shear displacement is small, shear stress increases rapidly with increasing shear displacement, exhibiting a clear linear trend. At this stage, the joint surface is in the elastic deformation stage. The slope of this stage (i.e., pre-peak shear stiffness, shown by the red dashed line in the figure) generally decreases with increasing JRC, exhibiting an inverse relationship with JRC. Normal stiffness has little effect on the growth rate of this stage.
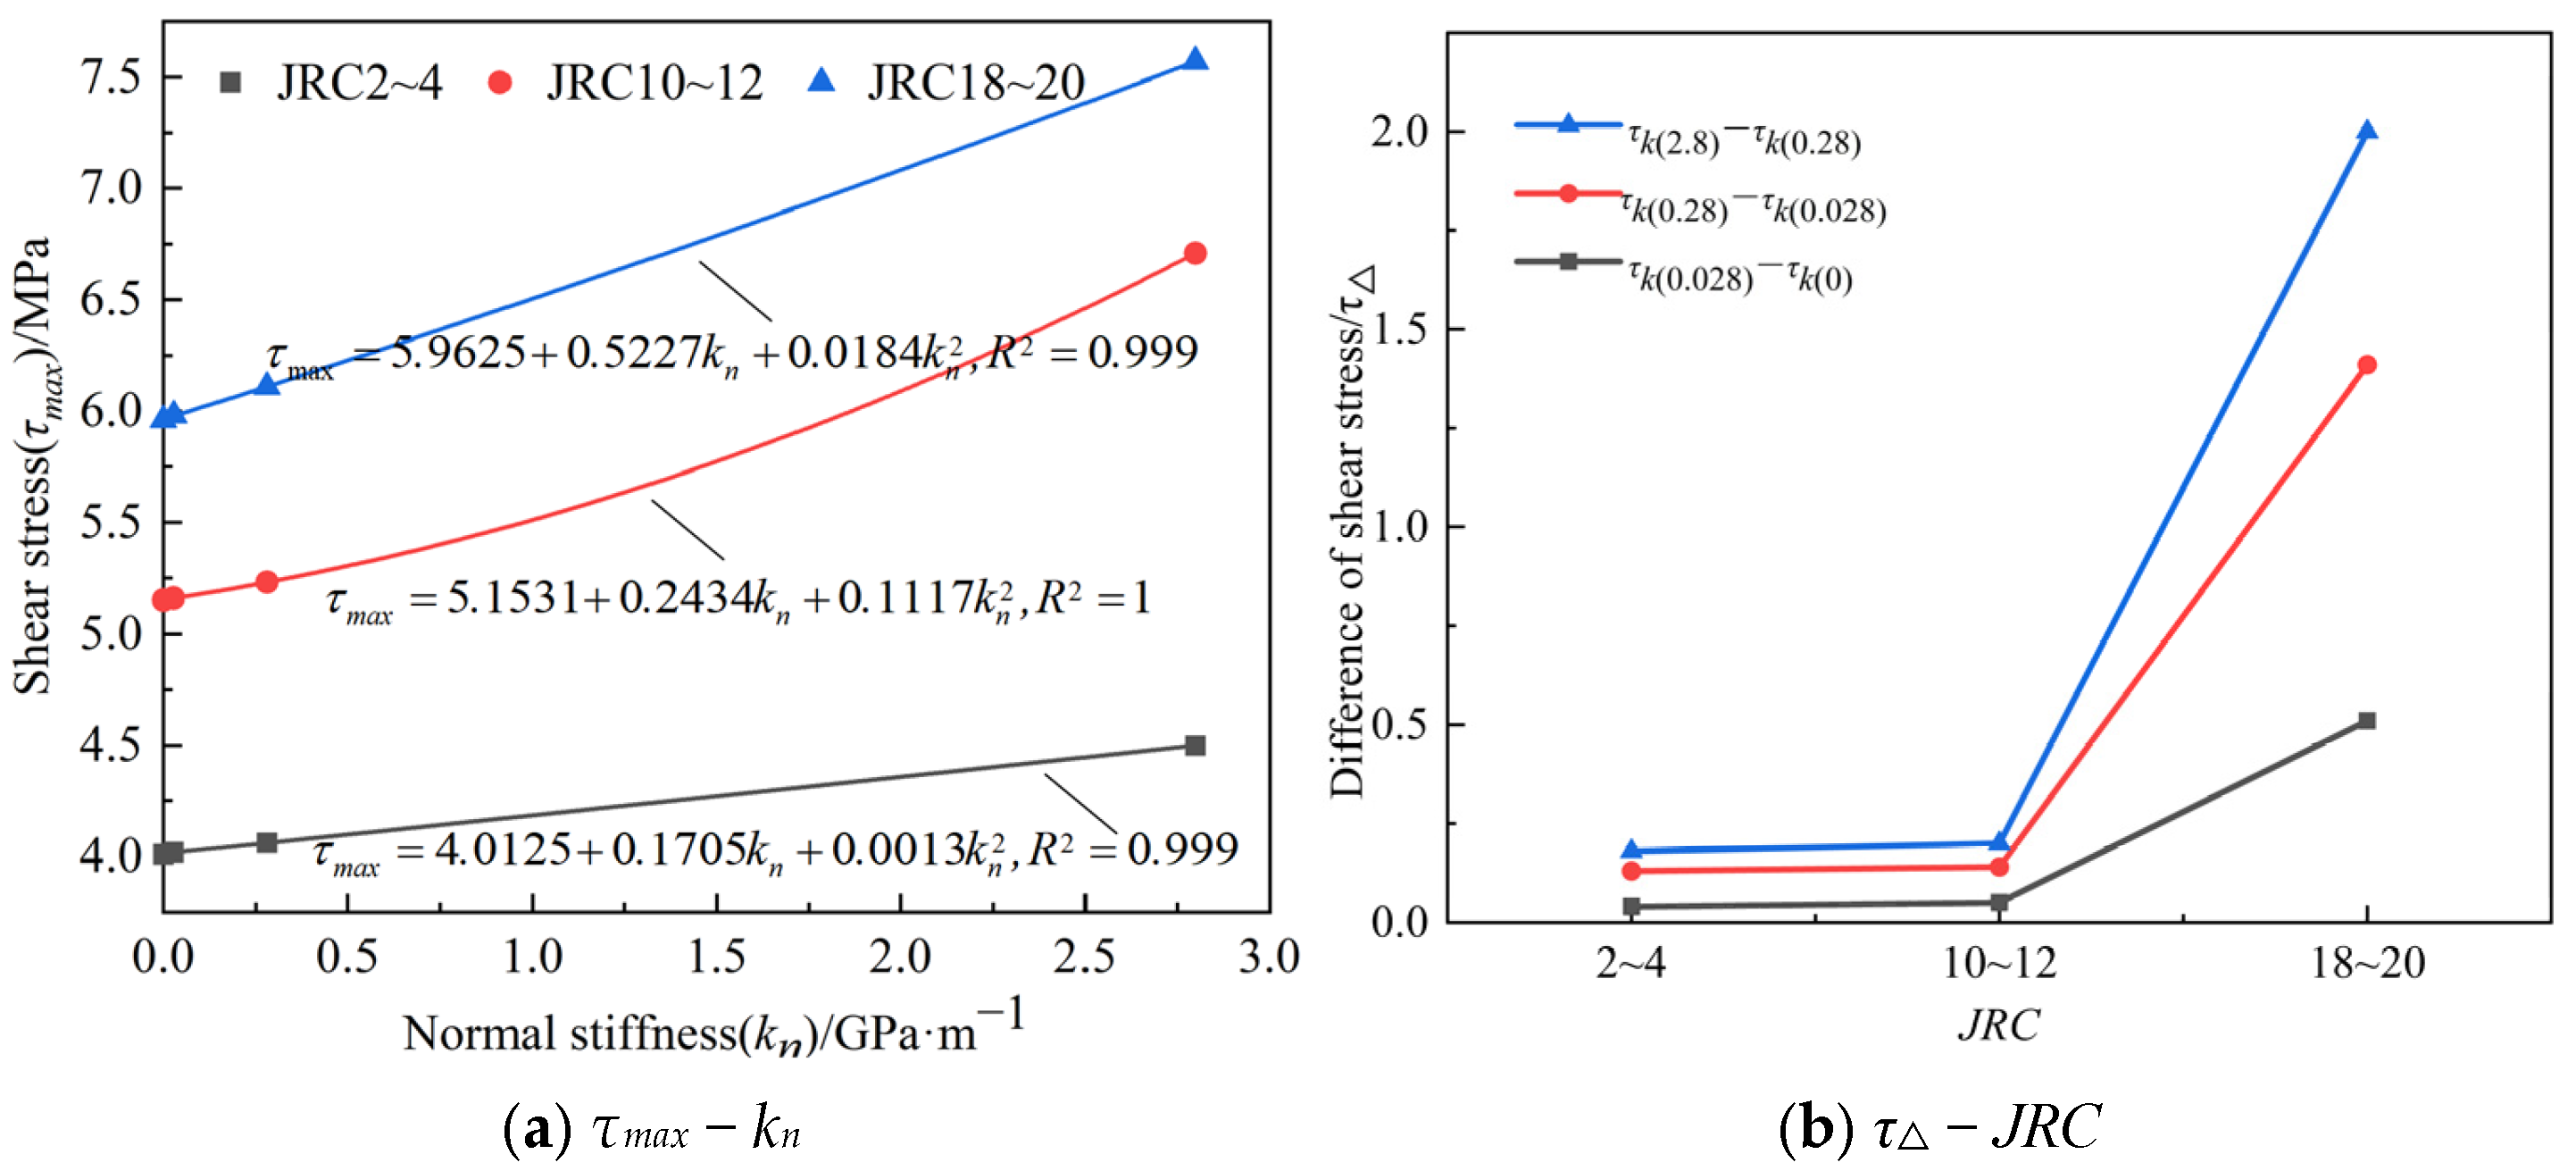
Stage II: Yield stage. Following the linear stage, the stress-displacement curve transitions to a nonlinear regime, with the slope of the shear stress decreasing gradually as shear displacement increases. A distinct pre-peak yield stage is observed on the joint surface. The slope of the stress-displacement curve decreases as JRC and normal stiffness increase, while the maximum shear stress shows an increasing trend. The influence of JRC on the increase or decrease of shear stress is primarily manifested as follows: as JRC increases, more surface protrusions form, and during shearing, these protrusions interlock, creating greater friction resistance and interlocking effects, leading to increased shear stress. However, the protrusions do not fracture simultaneously but are sheared or worn off in stages, resulting in a reduced decrease in shear stiffness (curve slope). An increase in the normal stiffness means that the joint surface is less likely to exhibit a climbing effect under normal stress, resulting in an increase in the effective contact area between the protrusions. During the shear process, the protrusions are forcibly sheared and crushed, thereby increasing the shear stress. Additionally, the greater the normal stiffness, the more it restricts the uplift of protrusions (shear expansion effect), forcing shear failure to occur through the shearing of more protrusions rather than sliding. This process requires greater shear stress, leading to a reduced rate of decline in shear stiffness and a smaller decrease in slope. The evolution of peak shear stress on different roughness joint surfaces with normal stiffness, as shown in Figure 4a, indicates that as normal stiffness increases, the peak shear stress on all roughness joint surfaces exhibits a quadratic increase trend, with fitting accuracies R2 of 0.999, 1, and 0.999, respectively. Generally, for the same JRC, when kn increases from 0 to 2.8 GPa/m, JRC 2~4, 10~12, and 18~20 increase by 10.89%, 30.29%, and 21.27%, respectively.
Stage III: Post-peak softening stage. Overall, the post-peak softening stage is clearly present under various normal stiffness conditions. As JRC increases, the increase in shear stress gradually increases with the increase in normal stiffness, as shown in Figure 4b. When the shear displacement is 9 mm, the shear stress difference τ between kn = 0.28 and kn = 0.028 for JRC 2~4, 10~12, and 18~20 is 0.05 MPa, 0.14 MPa, and 0.2 MPa, respectively. The shear stress difference τ between kn = 2.8 and kn = 0.28 is 0.51 MPa, 1.41 MPa, and 2 MPa, respectively.

3.2. Evolution of Normal Stress

Figure 5a–c show the variation characteristics of normal stress σn with shear displacement during the shear process. It can be observed that when kn is large (kn ≥ 0.28 GPa/m), both σn and JRC increase gradually with increasing kn and continue to increase with increasing shear displacement. This is because, under constant normal stiffness conditions, the shear expansion effect of the joint surface during the shear process is constrained by the normal stiffness, leading to an increase in normal stress as normal stiffness increases; on the other hand, as JRC increases, the “climbing effect” along the convex body during shear becomes more pronounced, leading to a gradual increase in the normal stress that restricts expansion deformation. When kn is small (kn ≤ 0.028 GPa/m), normal loading is equivalent to constant normal stress conditions, and σn shows no significant change, which is similar to the variation pattern of shear stress. As shown in Figure 5, with increasing JRC, there are more short-term fluctuation points on the normal stress variation curve, and the rate of change in normal stress before and after these fluctuation points is significantly higher than at other points on the curve. This is primarily because the normal stress on the joint surface depends on normal shear expansion, and the increase in normal stress further restricts deformation of the joint surface. Therefore, when relative displacement occurs, the main protruding body on the joint surface is sheared and destroyed, resulting in the most pronounced shear expansion effect and the highest rate of change in normal stress.
Figure 6a,b show the variation characteristics of the peak normal stress σmax with respect to kn and JRC, respectively. When kn increases from 0 to 2.8 GPa/m, the peak normal stress for JRC values of 2~4, 10~12, and 18~20 increases by 24.63%, 60.69%, and 102.15%, respectively. For the same kn, as JRC increases, σmax shows a linear increasing trend. The slopes of the fitted straight lines for JRC 2~4, 10~12, and 18~20 are 0.3486, 0.8817, and 1.5289, respectively, with a determination coefficient R2 = 0.999. Figure 6c shows the variation characteristics of the normal stress increment Δσmax with respect to kn throughout the entire shear process. It can be observed that for the same JRC, as kn increases, Δσmax exhibits a gradually increasing trend, which can be well fitted by a linear function, with correlation coefficients all being R2 = 0.999, and the magnitude of increase in Δσmax gradually increases with increasing JRC. For transitions from low normal stiffness to medium normal stiffness and from medium normal stiffness to high normal stiffness, as JRC increases, Δσmax also gradually increases, with an increase ranging from 70.37% to 154.65%.

3.3. Normal Displacement Evolution

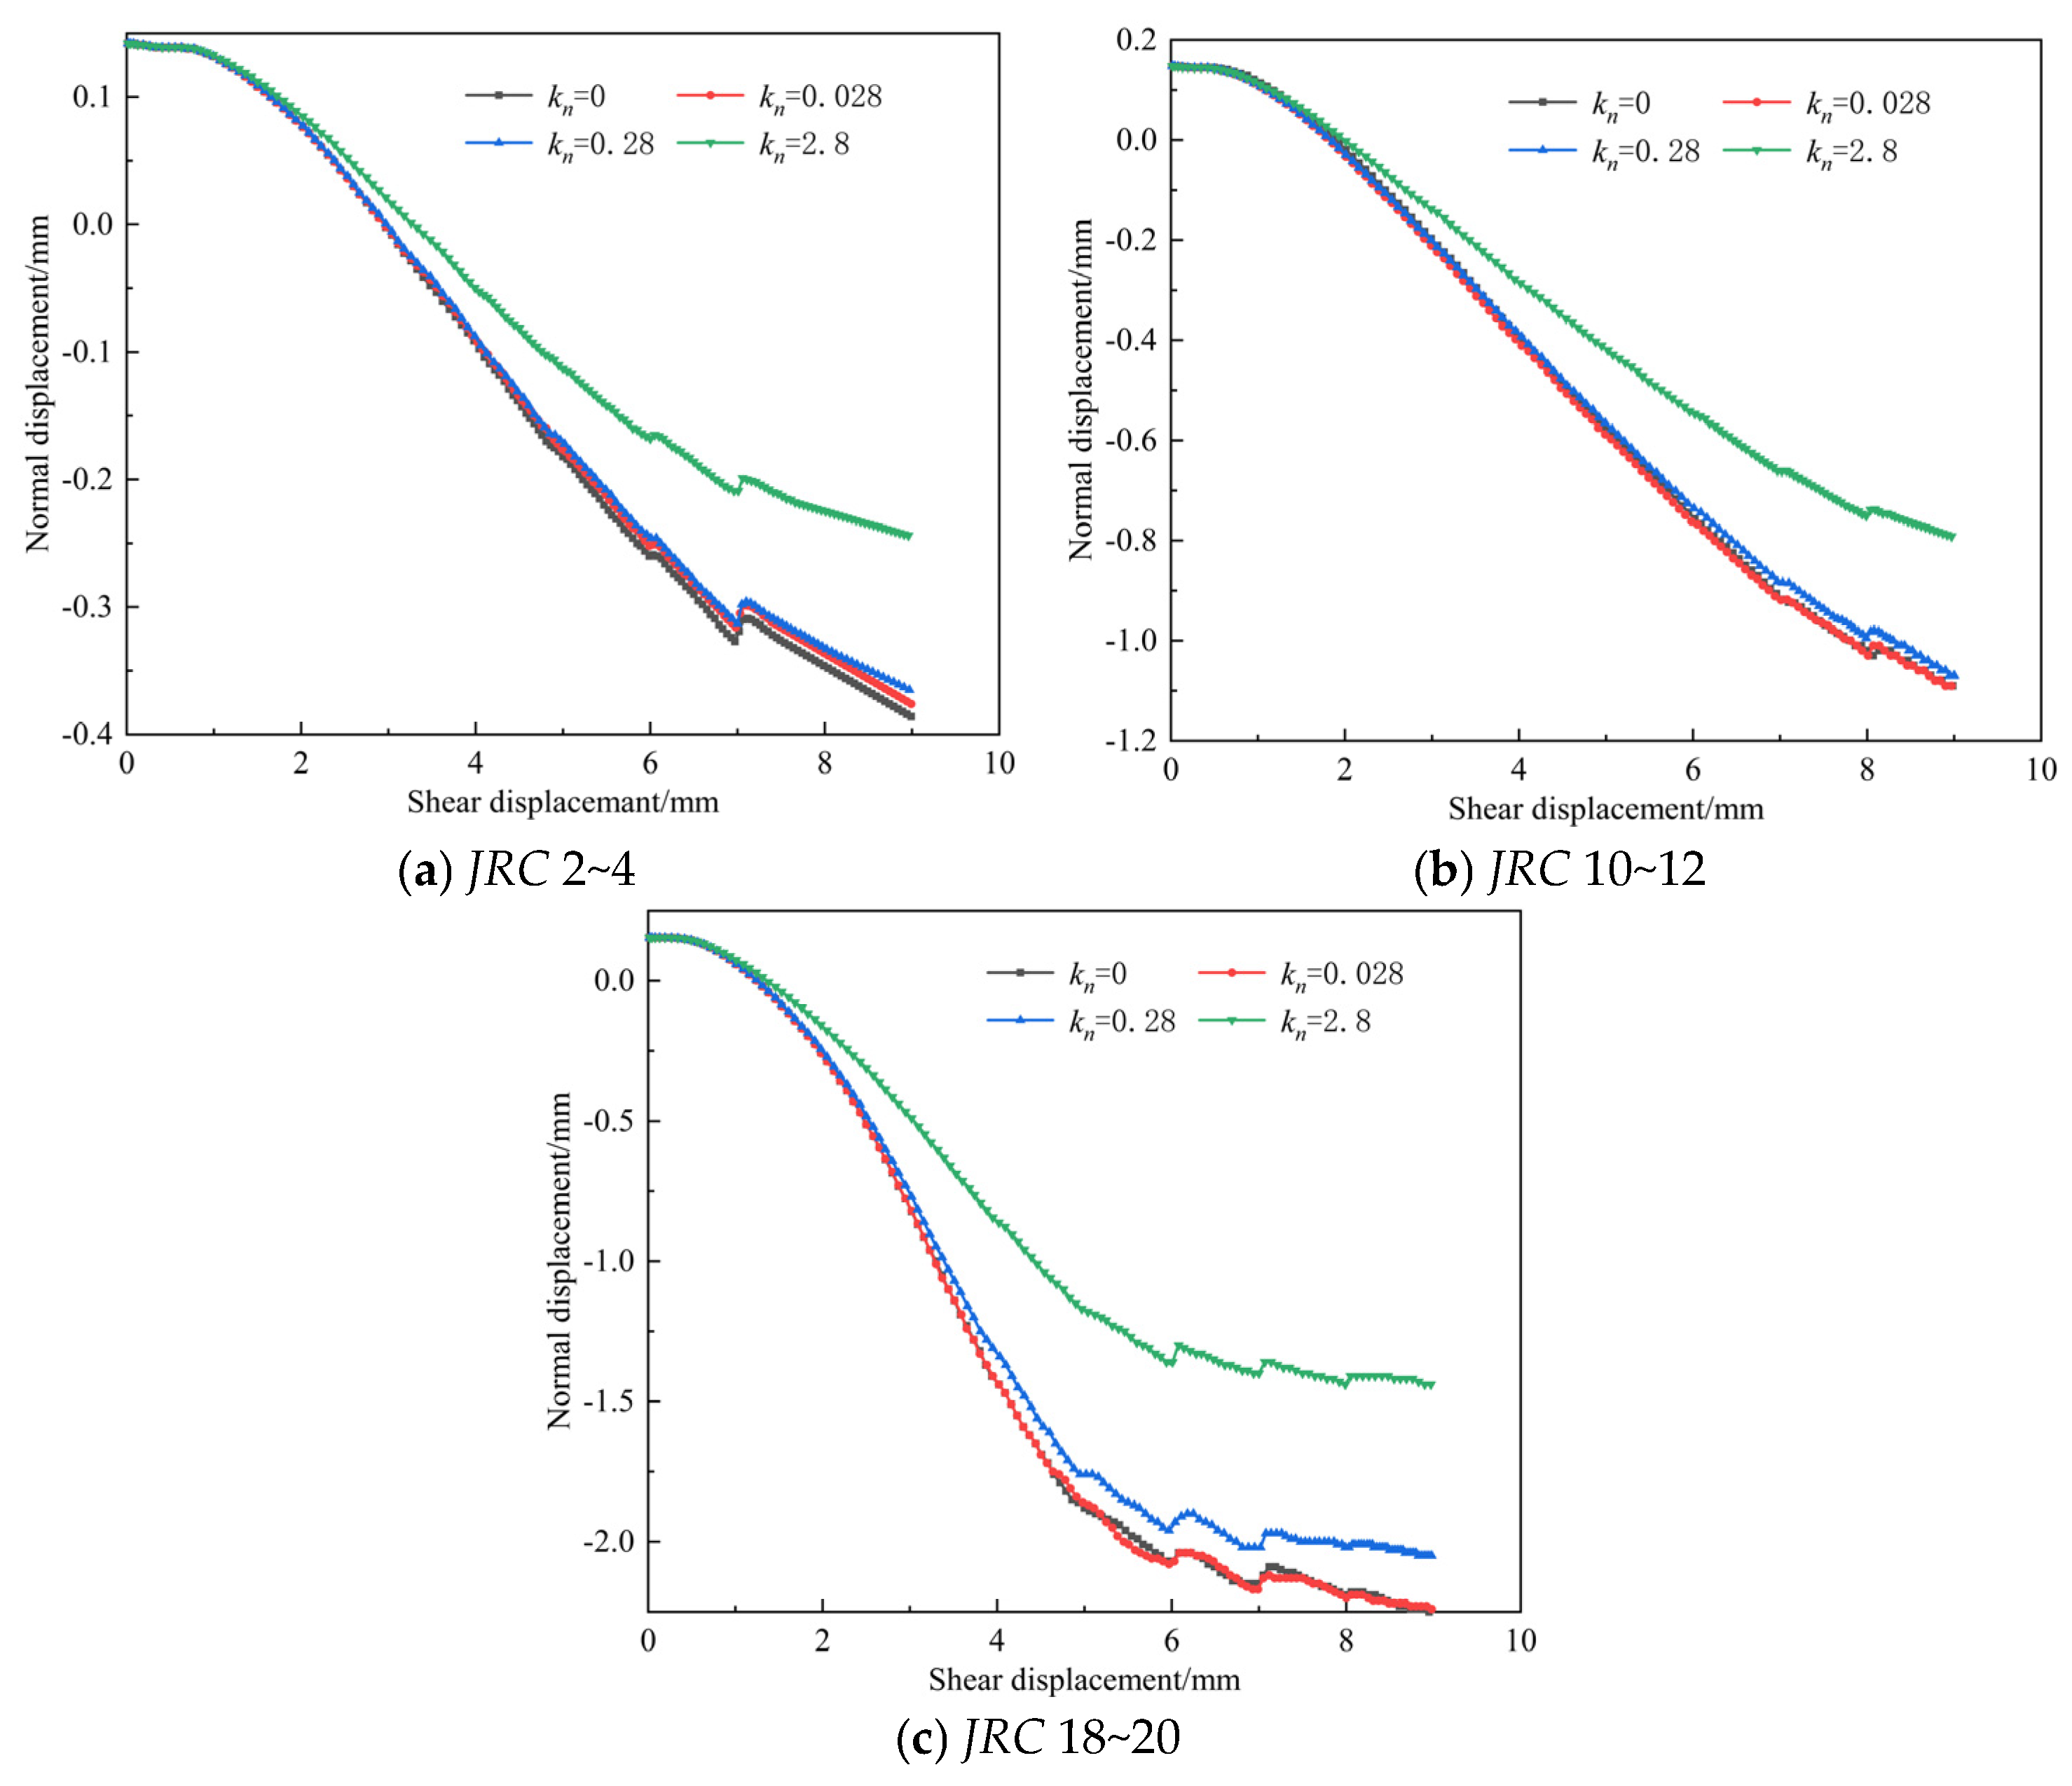
The variation characteristics of normal displacement (δn) of joint surfaces with different roughness as a function of shear displacement are shown in Figure 7a–c. In all cases, δn will change from the “shear contraction” state to the “shear expansion” state, which is similar to some of the research findings in reference [23]. Shear contraction refers to the phenomenon where the initial normal stress present at the onset of shear testing causes the gaps between joint surfaces to compress and close. As shear displacement continues to increase, δn changes from a positive value to a negative value and exhibits a trend of gradually increasing displacement. This is due to the presence of roughness on the joint surfaces, causing the rock mass to climb along the convex surfaces of the joints, thereby generating shear expansion deformation. However, as the shear test continues, the joint surfaces are continuously worn or sheared, resulting in reduced roughness compared to the unsheared state. The rate at which δn increases with shear displacement also decreases, particularly evident in JRC 18~20. Additionally, high-roughness joint surfaces have greater elevation differences and a higher number of protrusions compared to low-roughness surfaces. Therefore, during shear deformation, the height climbed along the protrusions on the joint surface increases, meaning that as JRC increases, the shear expansion phenomenon becomes more pronounced. However, as kn increases, δn shows a decreasing trend for the same JRC, indicating that normal stiffness suppresses shear expansion deformation of the joint surface during shear deformation.
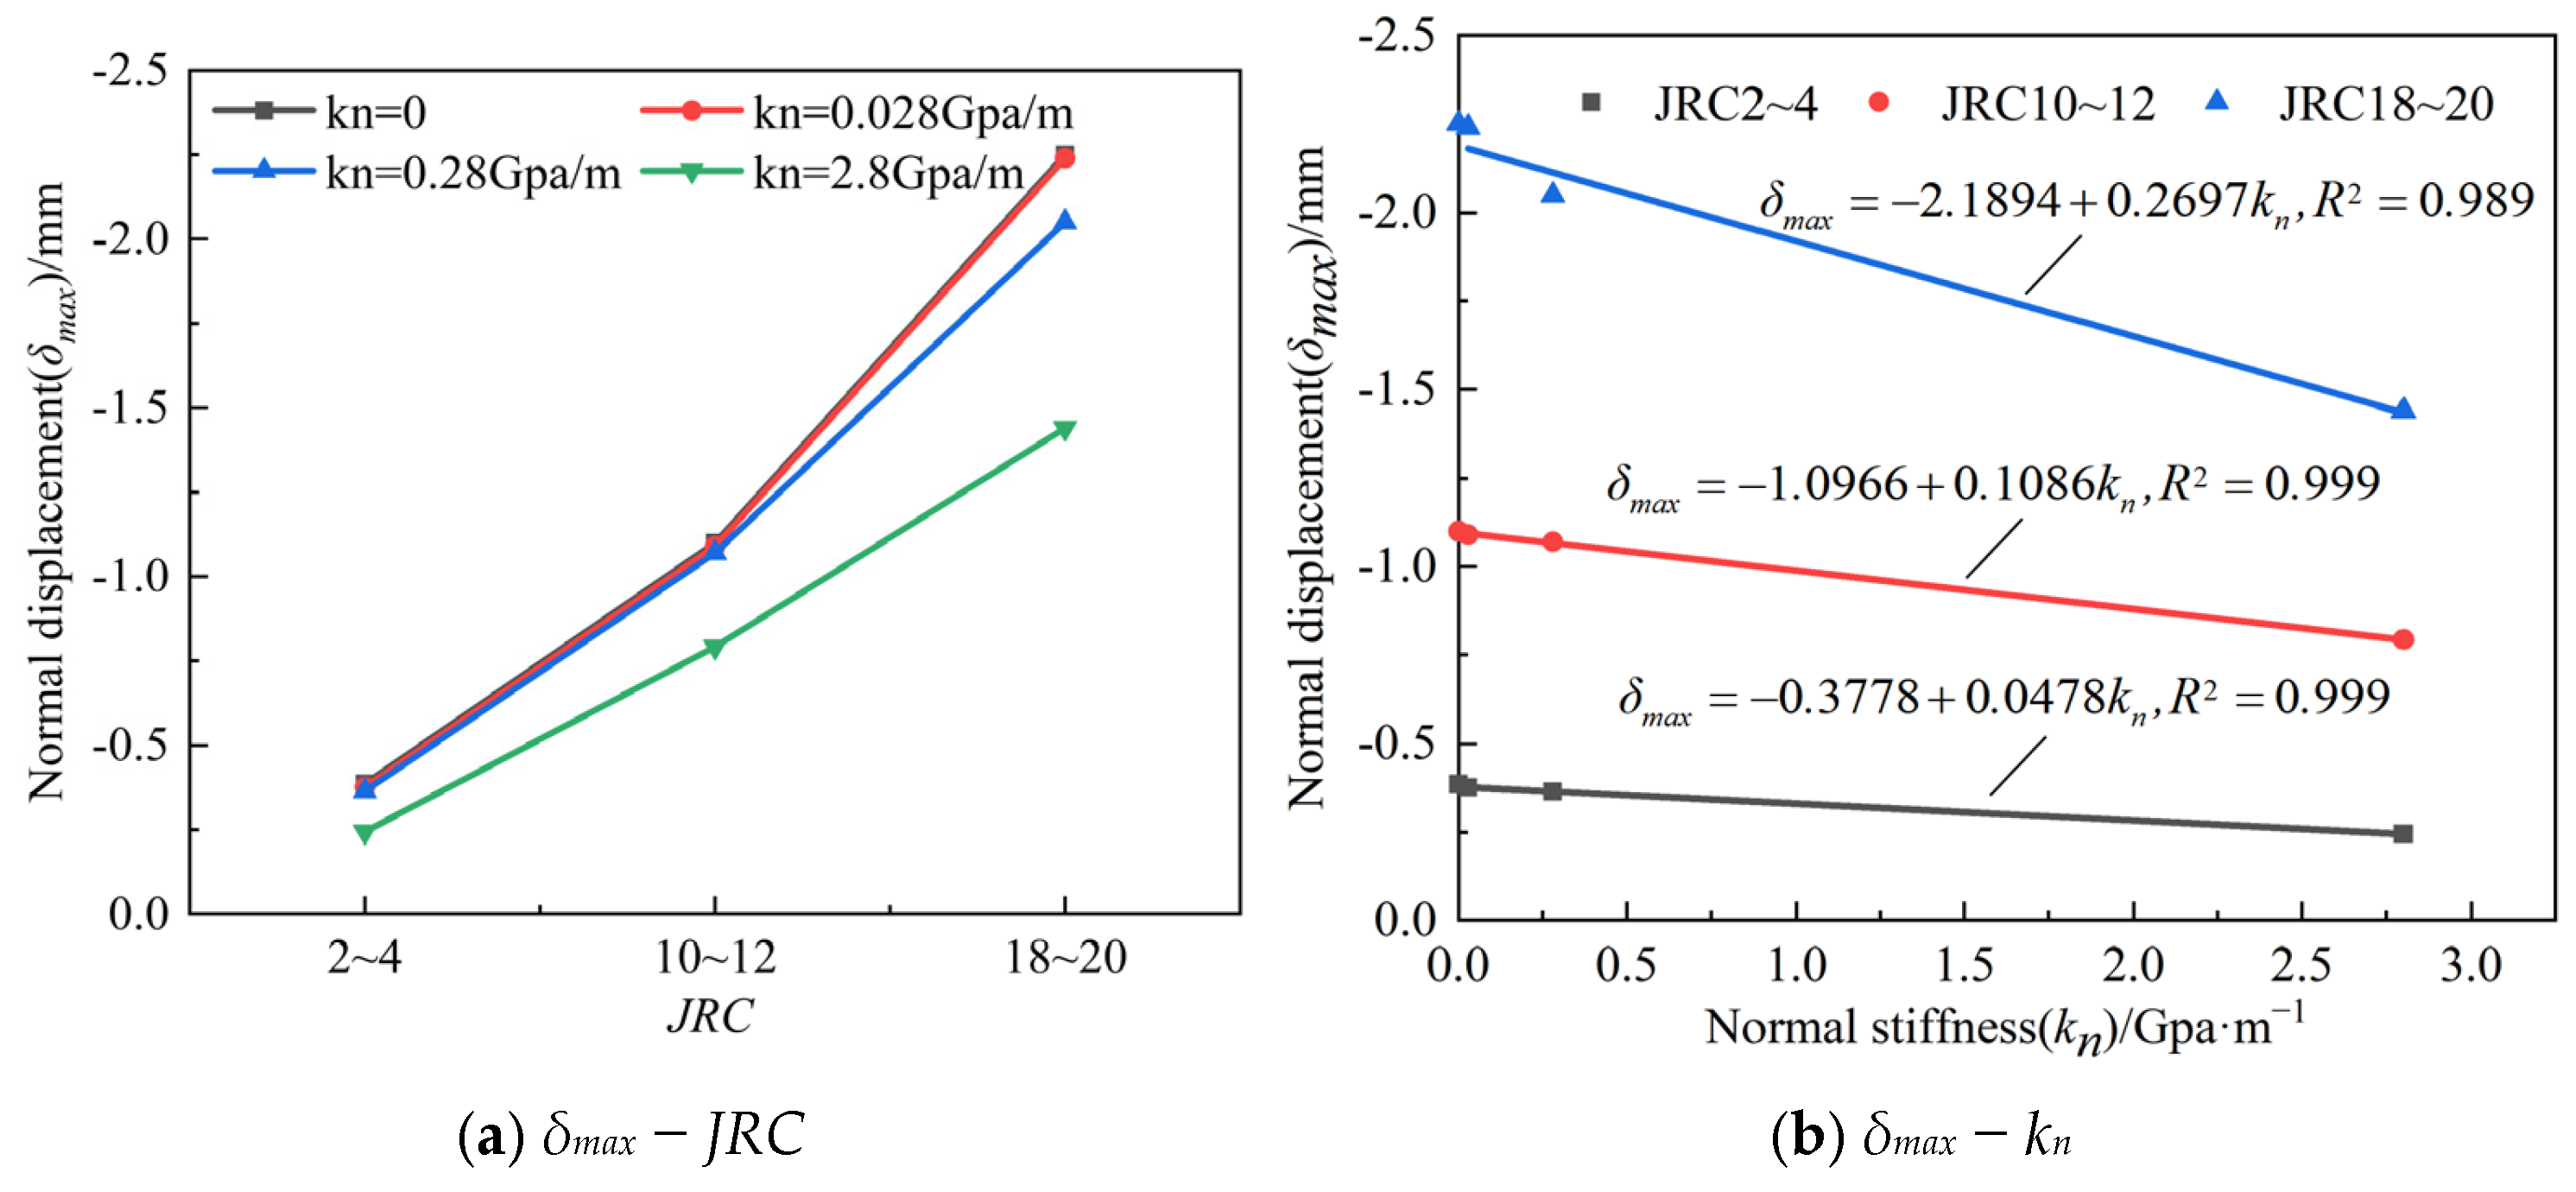
Figure 8a,b show the variation characteristics of the maximum normal displacement δmax with respect to JRC and kn. As kn increases from 0 to 2.8 GPa/m, δmax decreases by 36.79% (JRC 2~4), 28% (JRC 10~12), and 36% (JRC 18~20), respectively. For the same kn, as JRC increases, δmax shows a gradually increasing trend, with an increase of 461.64% to 495.74%. The variation characteristics can be well fitted by a linear function, with a coefficient of determination R2 = 0.989 to 0.999, as shown in Figure 8b.

3.4. Shear Stress-Normal Stress Path Evolution

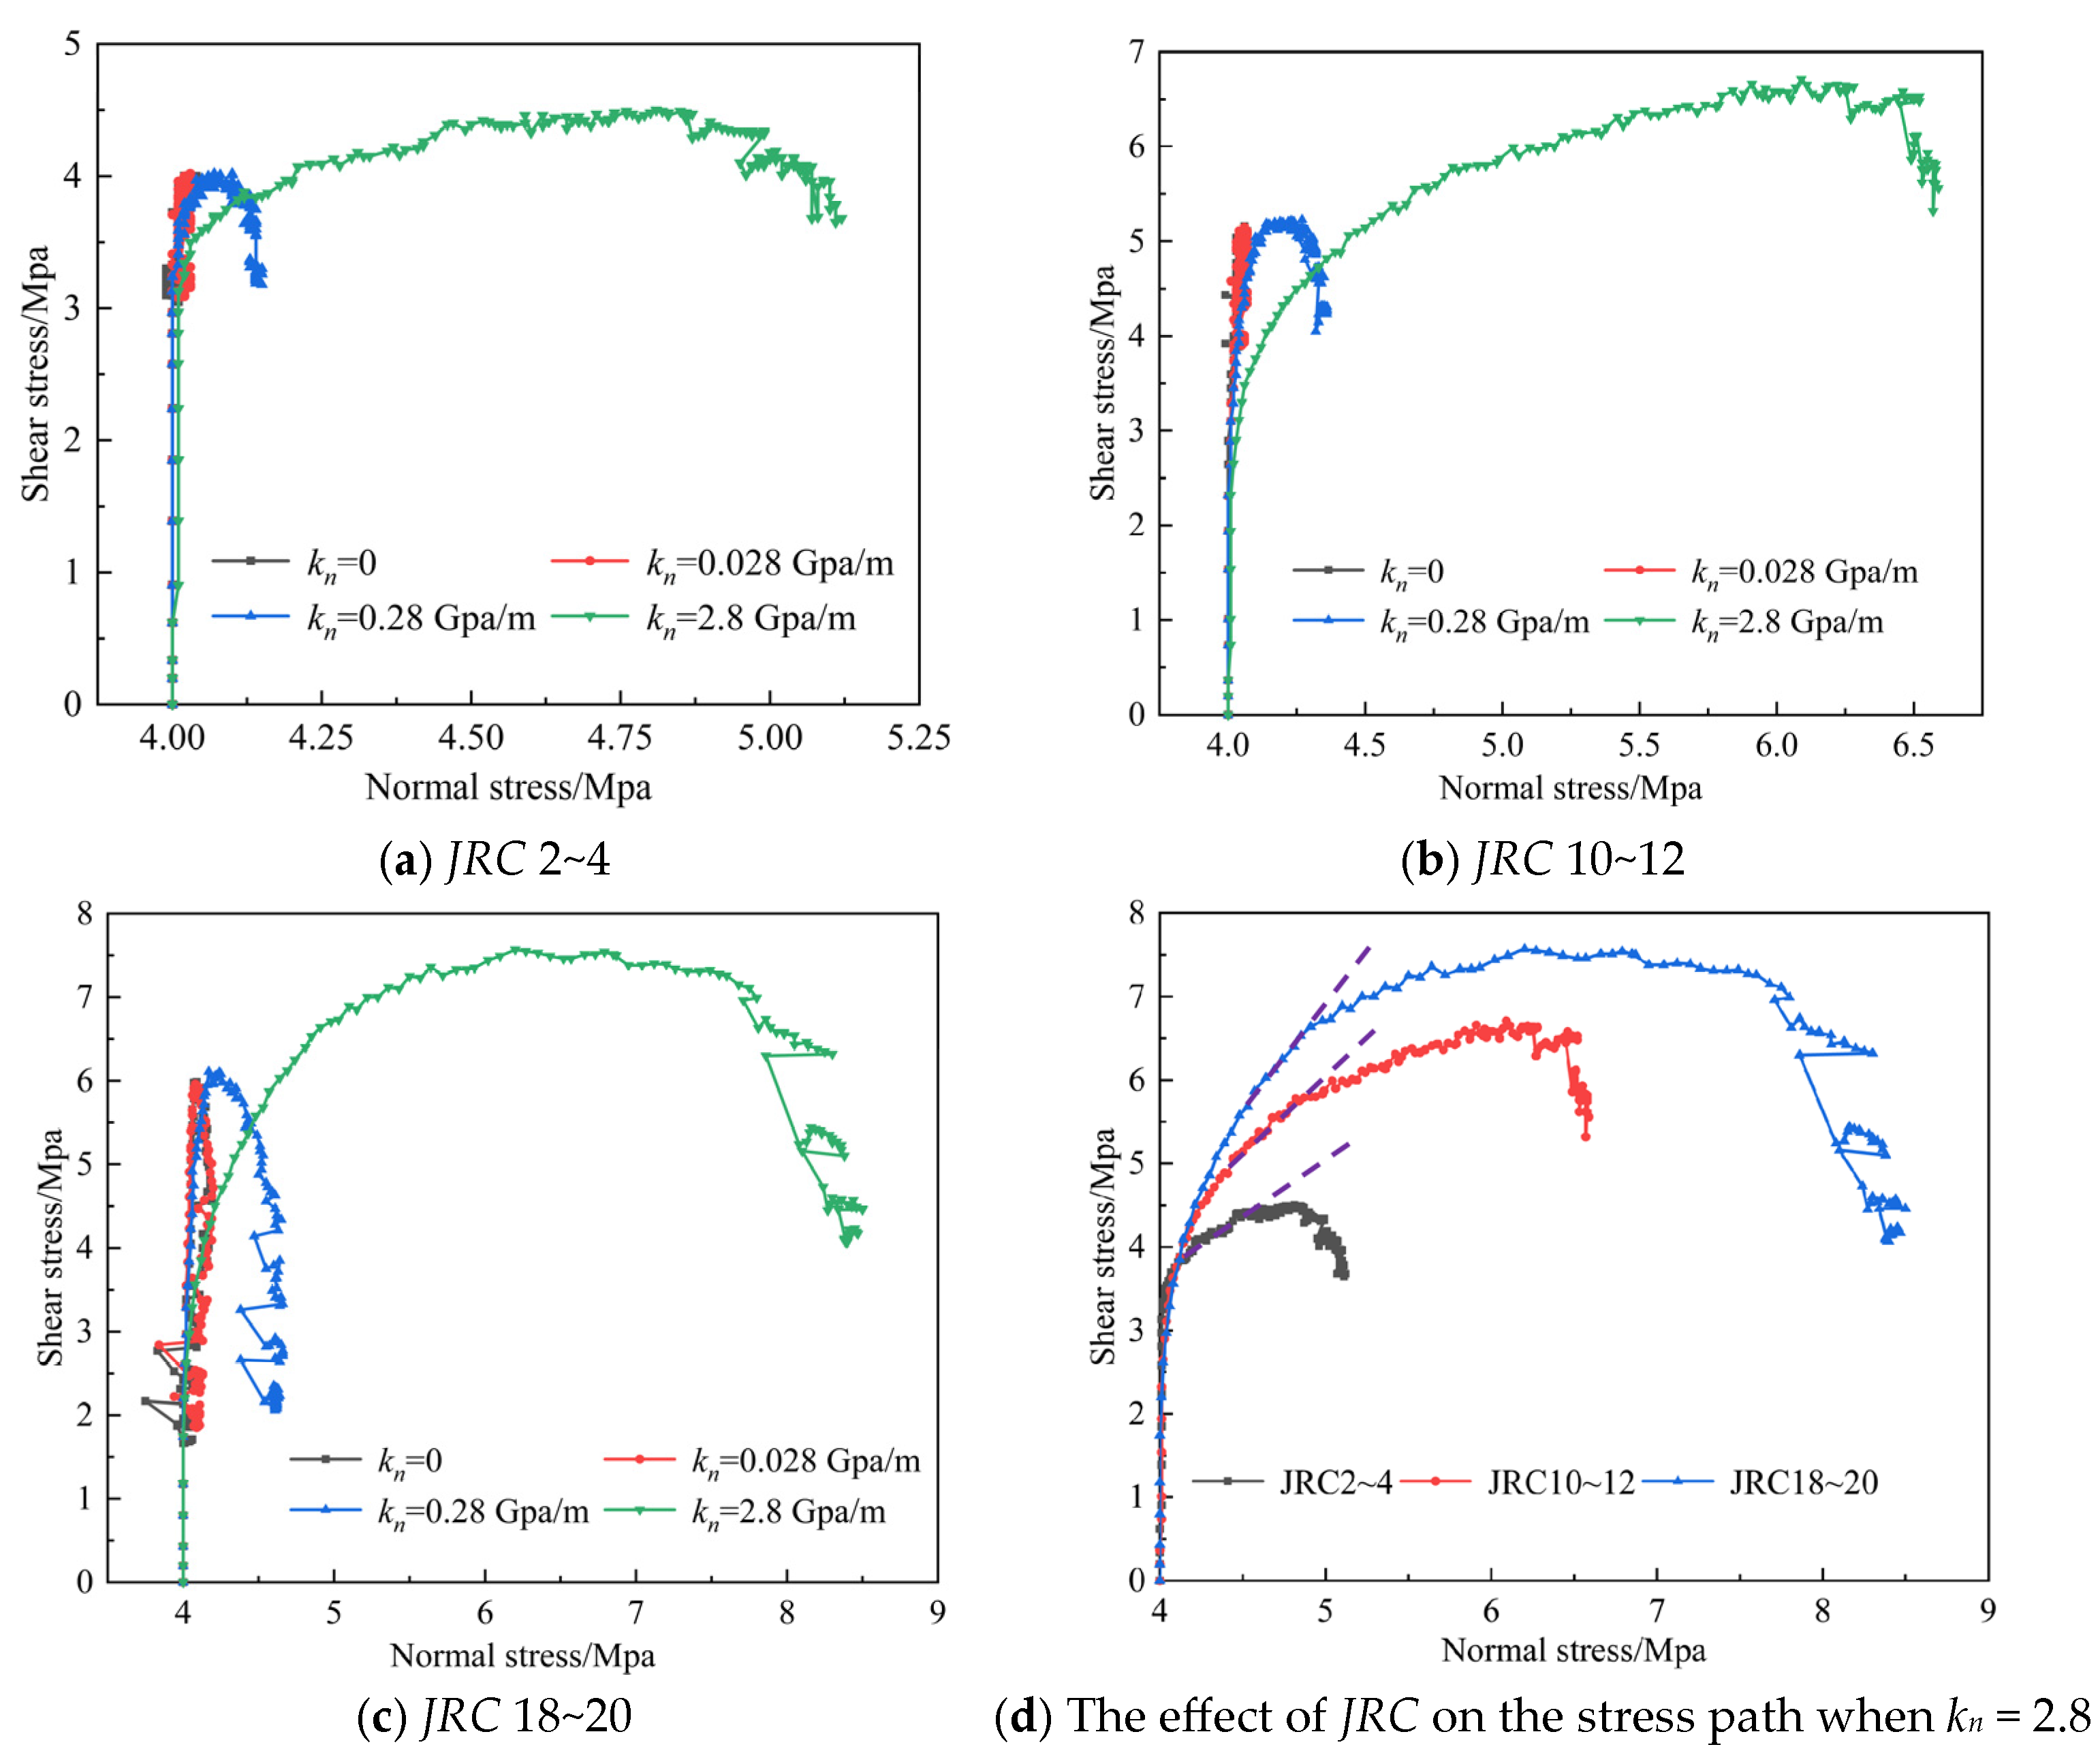
The evolution characteristics of the normal stress-shear stress path during the shear process of three-dimensional rough joint surfaces under different normal stiffness conditions are shown in Figure 9a–c. The normal stress–shear stress path curves exhibit an approximate “concave-up” shape. As JRC and kn increase, the “concave” envelope curve expands outward overall, and the joint surface’s resistance to shear failure gradually increases. Both the normal stress and shear stress ranges show a trend of gradual expansion.
To analyze the influence of JRC on the evolution characteristics of the normal stress-shear stress path, Figure 9d plots the shear stress path in the positive direction for different JRC values at kn = 2.8 GPa/m. As shown in the figure, the normal stress gradually increases during the shear process, while the shear stress first increases and then decreases during the shear process. Additionally, as JRC increases, the shear stress path gradually shifts upward. Following the research approach of B. Indraratna et al. [21], a linear function is used to fit the σnτ relationship curve during the stable ascending phase of the stress path, yielding the following equation:
y = 1.0636 + 0.7202 x R 2 = 0.9273 ,   J R C 2 ~ 4 y = 2.2752 + 0.7287 x R 2 = 0.9795 ,   J R C 10 ~ 12 y = 2.6451 + 0.8252 x R 2 = 0.9571 ,   J R C 18 ~ 20
The coefficient of determination R2 ranges from 0.9273 to 0.9795. Using the linear fitting relationship σnτ in Equation (2), the apparent cohesion cj during the shear process of different JRC joint surfaces can be calculated, which are 1.0636 MPa (JRC 2~4), 2.2752 MPa (JRC 10~12), and 2.6451 MPa (JRC 18~20). The apparent internal friction angle φj (the slope of the dashed line in Figure 9d) is 35.76° (JRC 2~4), 36.07° (JRC 10~12), and 39.53° (JRC 18~20), respectively. As JRC increases, both cj and φj show a gradual increasing trend, indicating that the shear resistance of the joint surface gradually enhances.
Y. Lee et al. [37] defined the ratio of shear stress to normal stress during joint surface shearing as the surface resistance index (SRI):
S R I = τ σ n
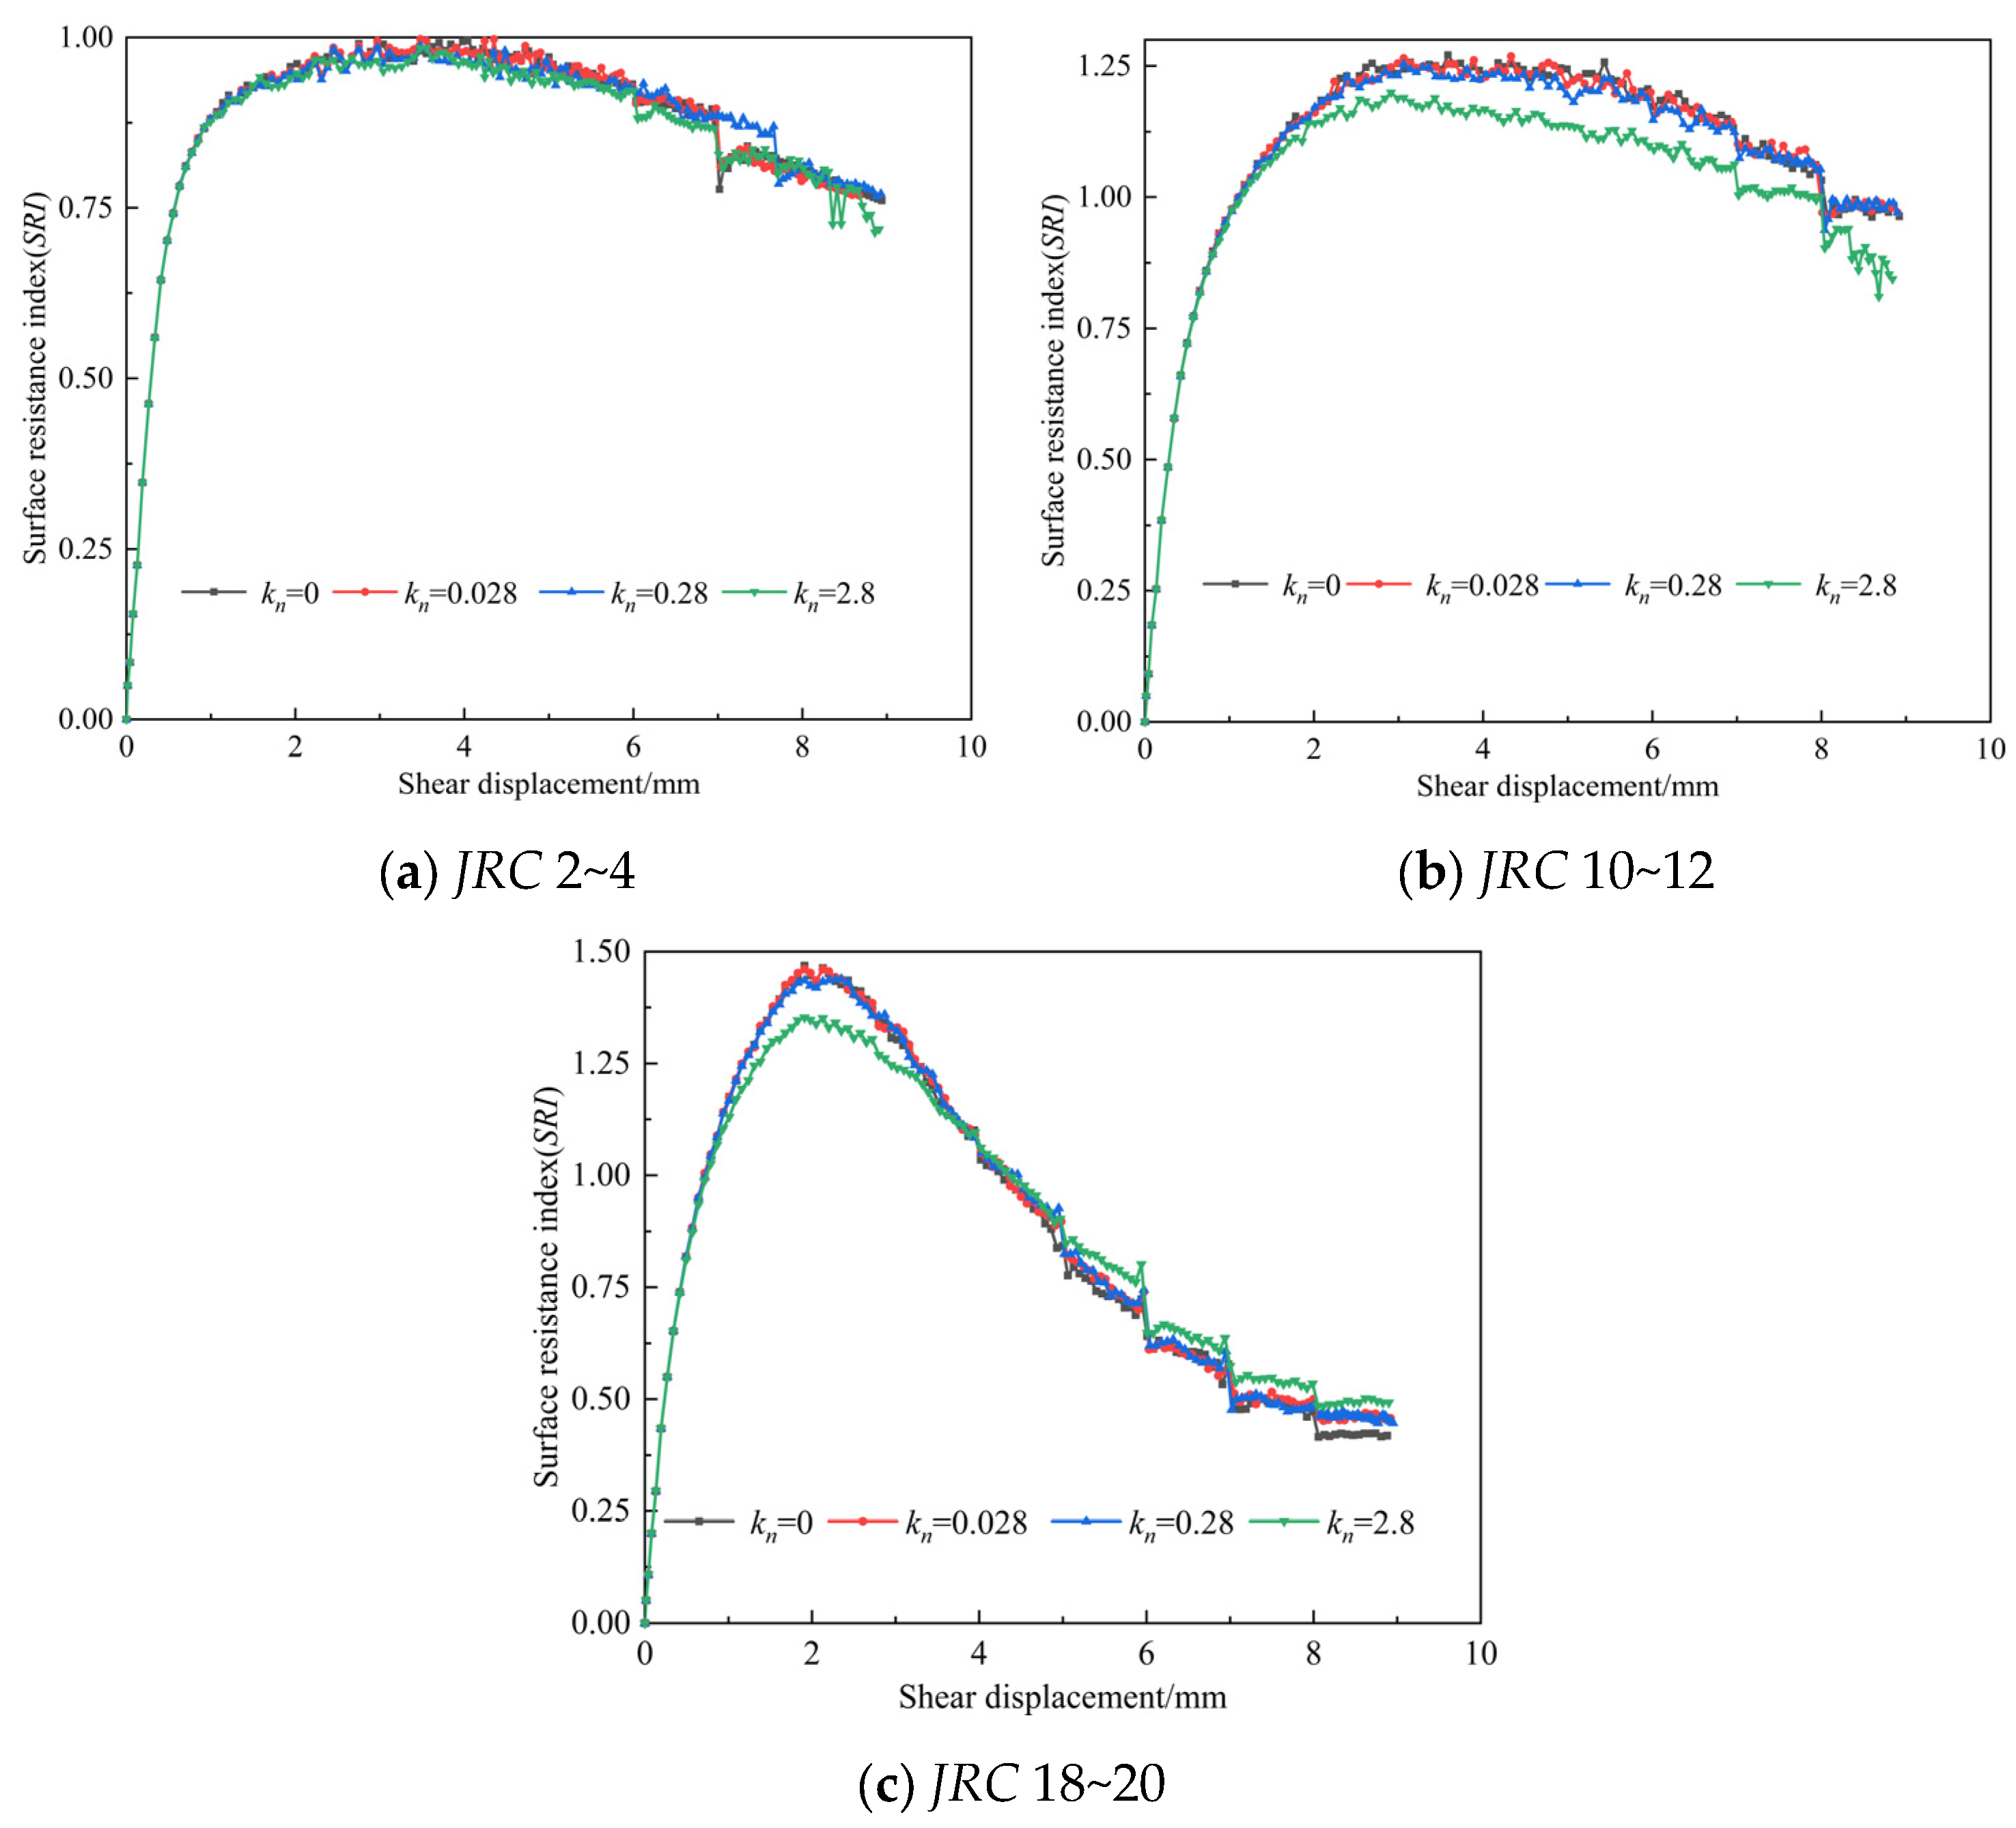
This index is closely related to the frictional force resisting shear displacement at the joint surface. Figure 10a–c show the variation characteristics of the index with respect to normal stiffness and JRC. As shown in the figures, under the same JRC conditions, the shapes of the index curves for different normal stiffness values are essentially the same. Under the same normal stiffness conditions, the shapes of the index curves for different JRC values are similar to those of the shear stress-shear displacement curves.
As shown in Figure 11, under the same kn value, the peak SRI value increases with increasing JRC. Under the same JRC, the peak SRI value decreases with increasing kn. The peak SRI values for each JRC are shown in Table 2.
A two-dimensional function is used to fit the knSRImax relationship curve of the peak SRI value as a function of kn. The calculation formula is:
y = 0.9979 0.0351 x + 0.0107 x 2 R 2 = 1 ,   J R C 2 ~ 4 y = 1.2696 0.0593 x + 0.0121 x 2 R 2 = 1 ,   J R C 10 ~ 12 y = 1.4637 0.0976 x + 0.0206 x 2 R 2 = 1 ,   J R C 18 ~ 20
The coefficient of determination R2 ranges from 0.9273 to 0.9795.
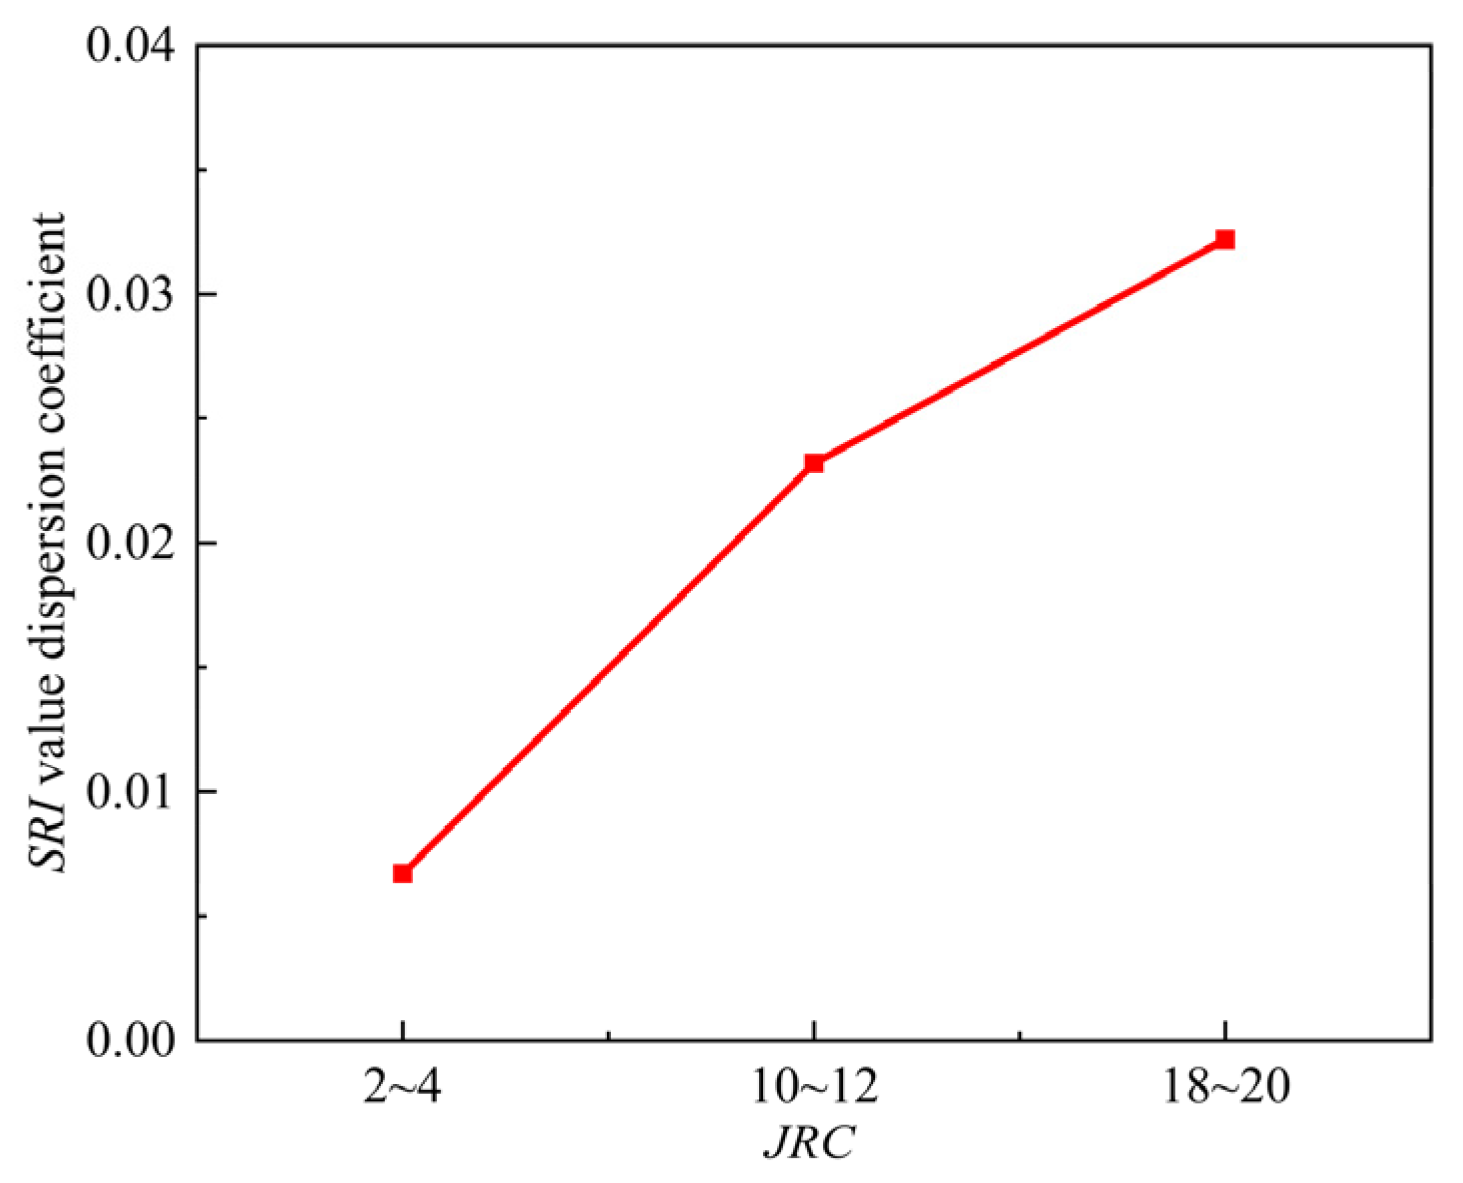
Figure 12 shows the variation in the coefficient of variation of peak SRI values for different kn values under the same JRC value. The coefficient of variation is defined as the ratio of the standard deviation of peak SRI values to their mean. It can be observed that as JRC increases, the influence of normal stiffness on the joint surface resistance index becomes more significant. When JRC is 2~4, the coefficient of variation of the peak SRI for different kn values is only 0.0067. When JRC is 10~12 and 18~20, the coefficient of variation increases to 0.0232 and 0.0322, respectively. This is primarily because, at lower roughness levels, the normal displacement and shear stress of the joint surface are largely unaffected by normal stiffness, and the trends in the increase of shear stress and normal stress are similar. At this point, normal stiffness has little effect on the joint surface resistance index; however, as roughness increases, near the peak shear stress, the shear direction must overcome more protruding bodies that are sheared off and destroyed when the specimen undergoes displacement, resulting in a faster growth rate of shear stress compared to normal stress. Therefore, the SRI value undergoes greater changes.

4. Discussion

4.1. Floater and Fragment Quantity Analysis

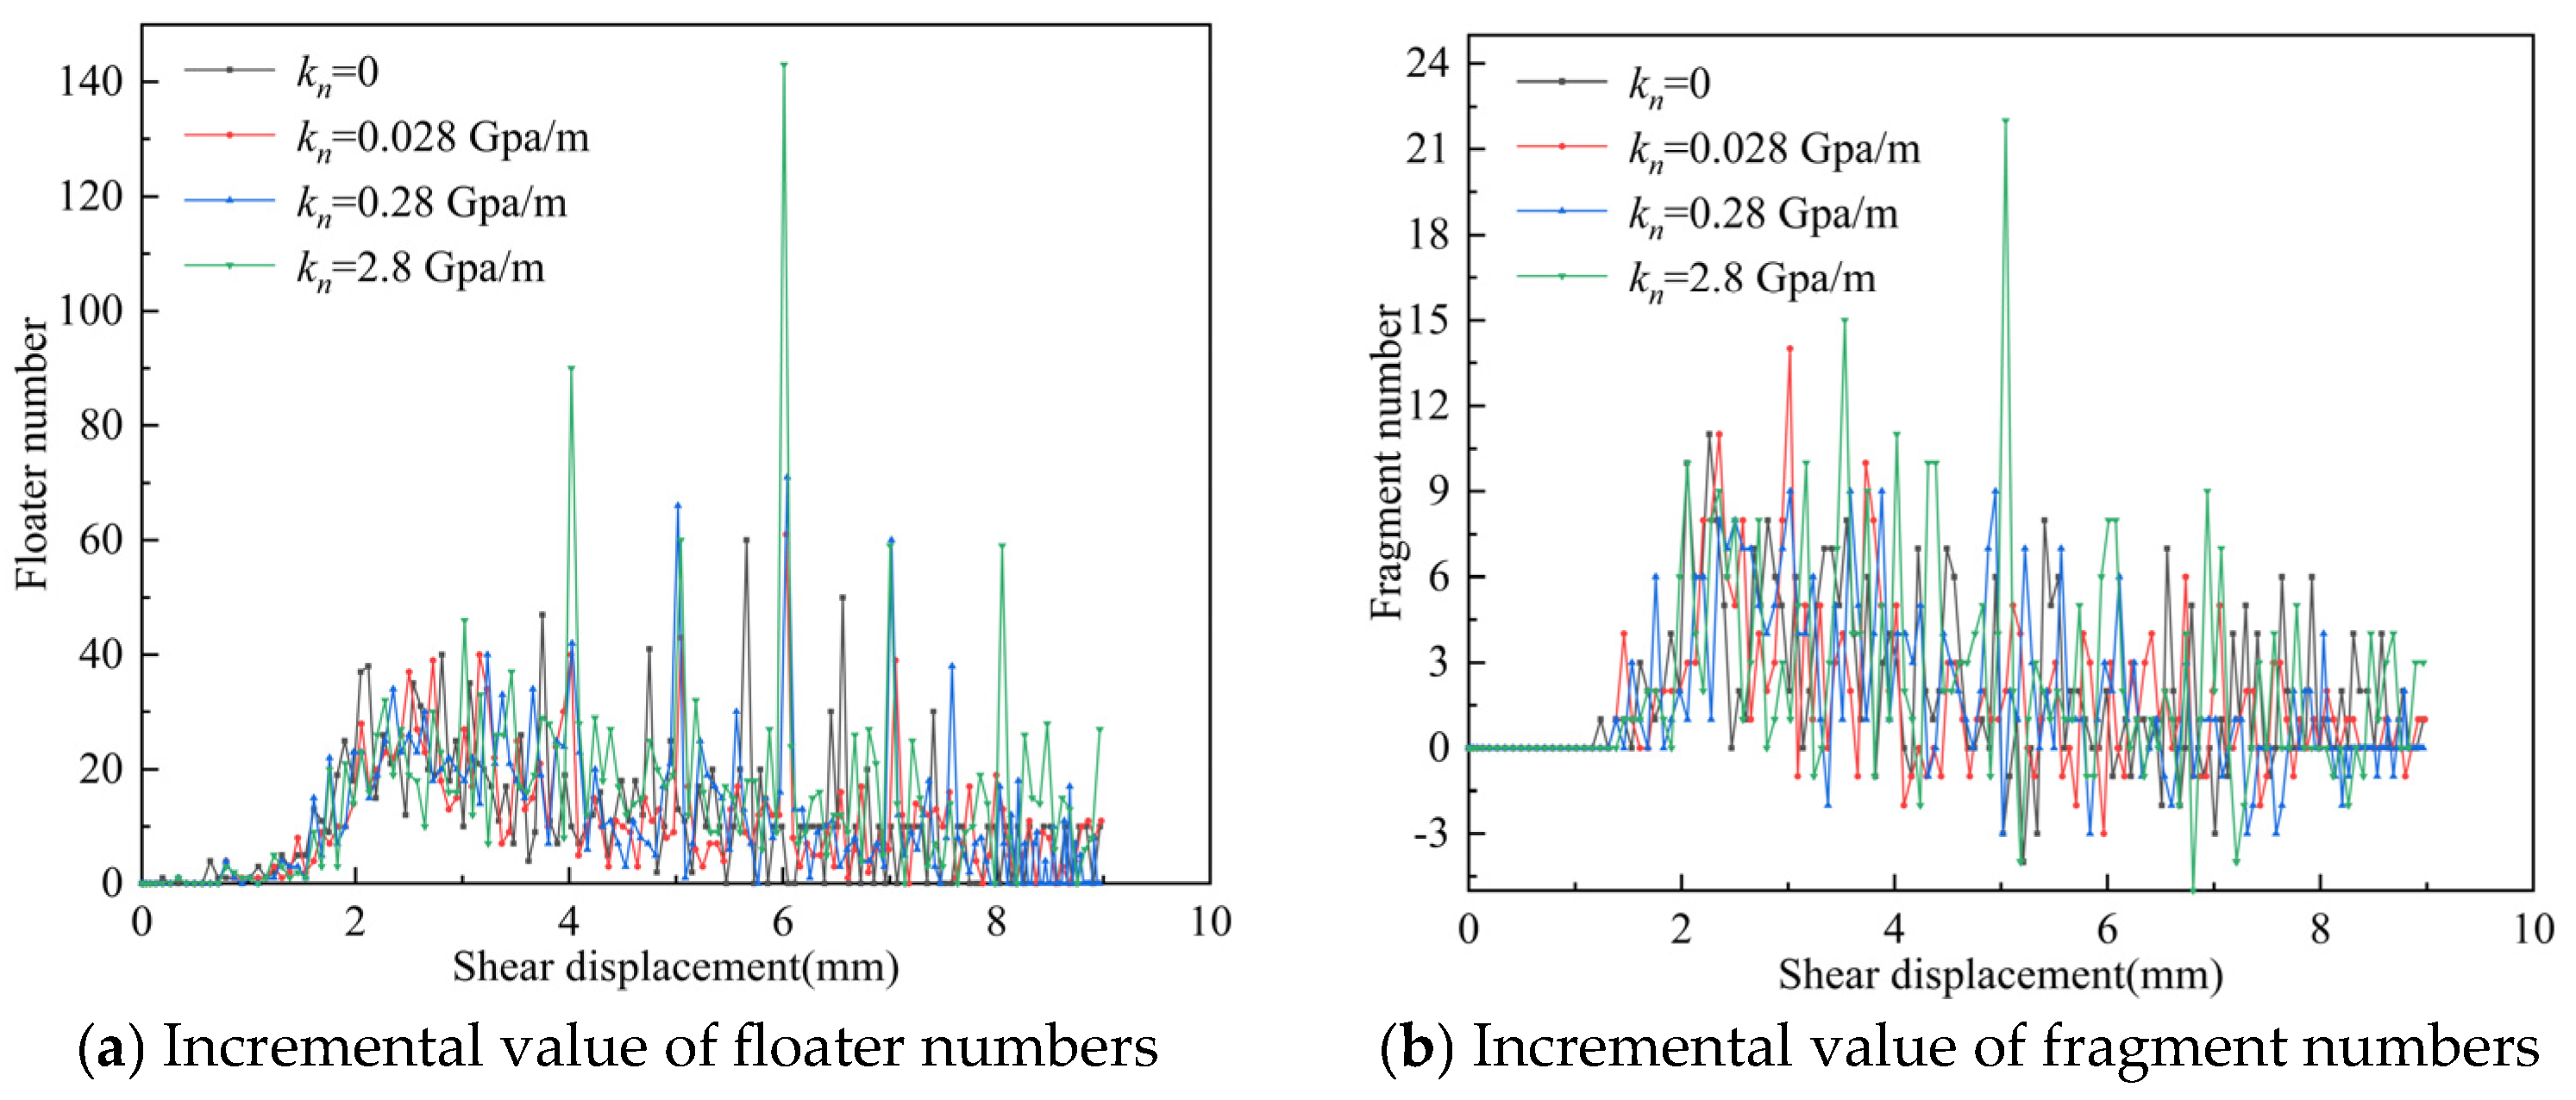
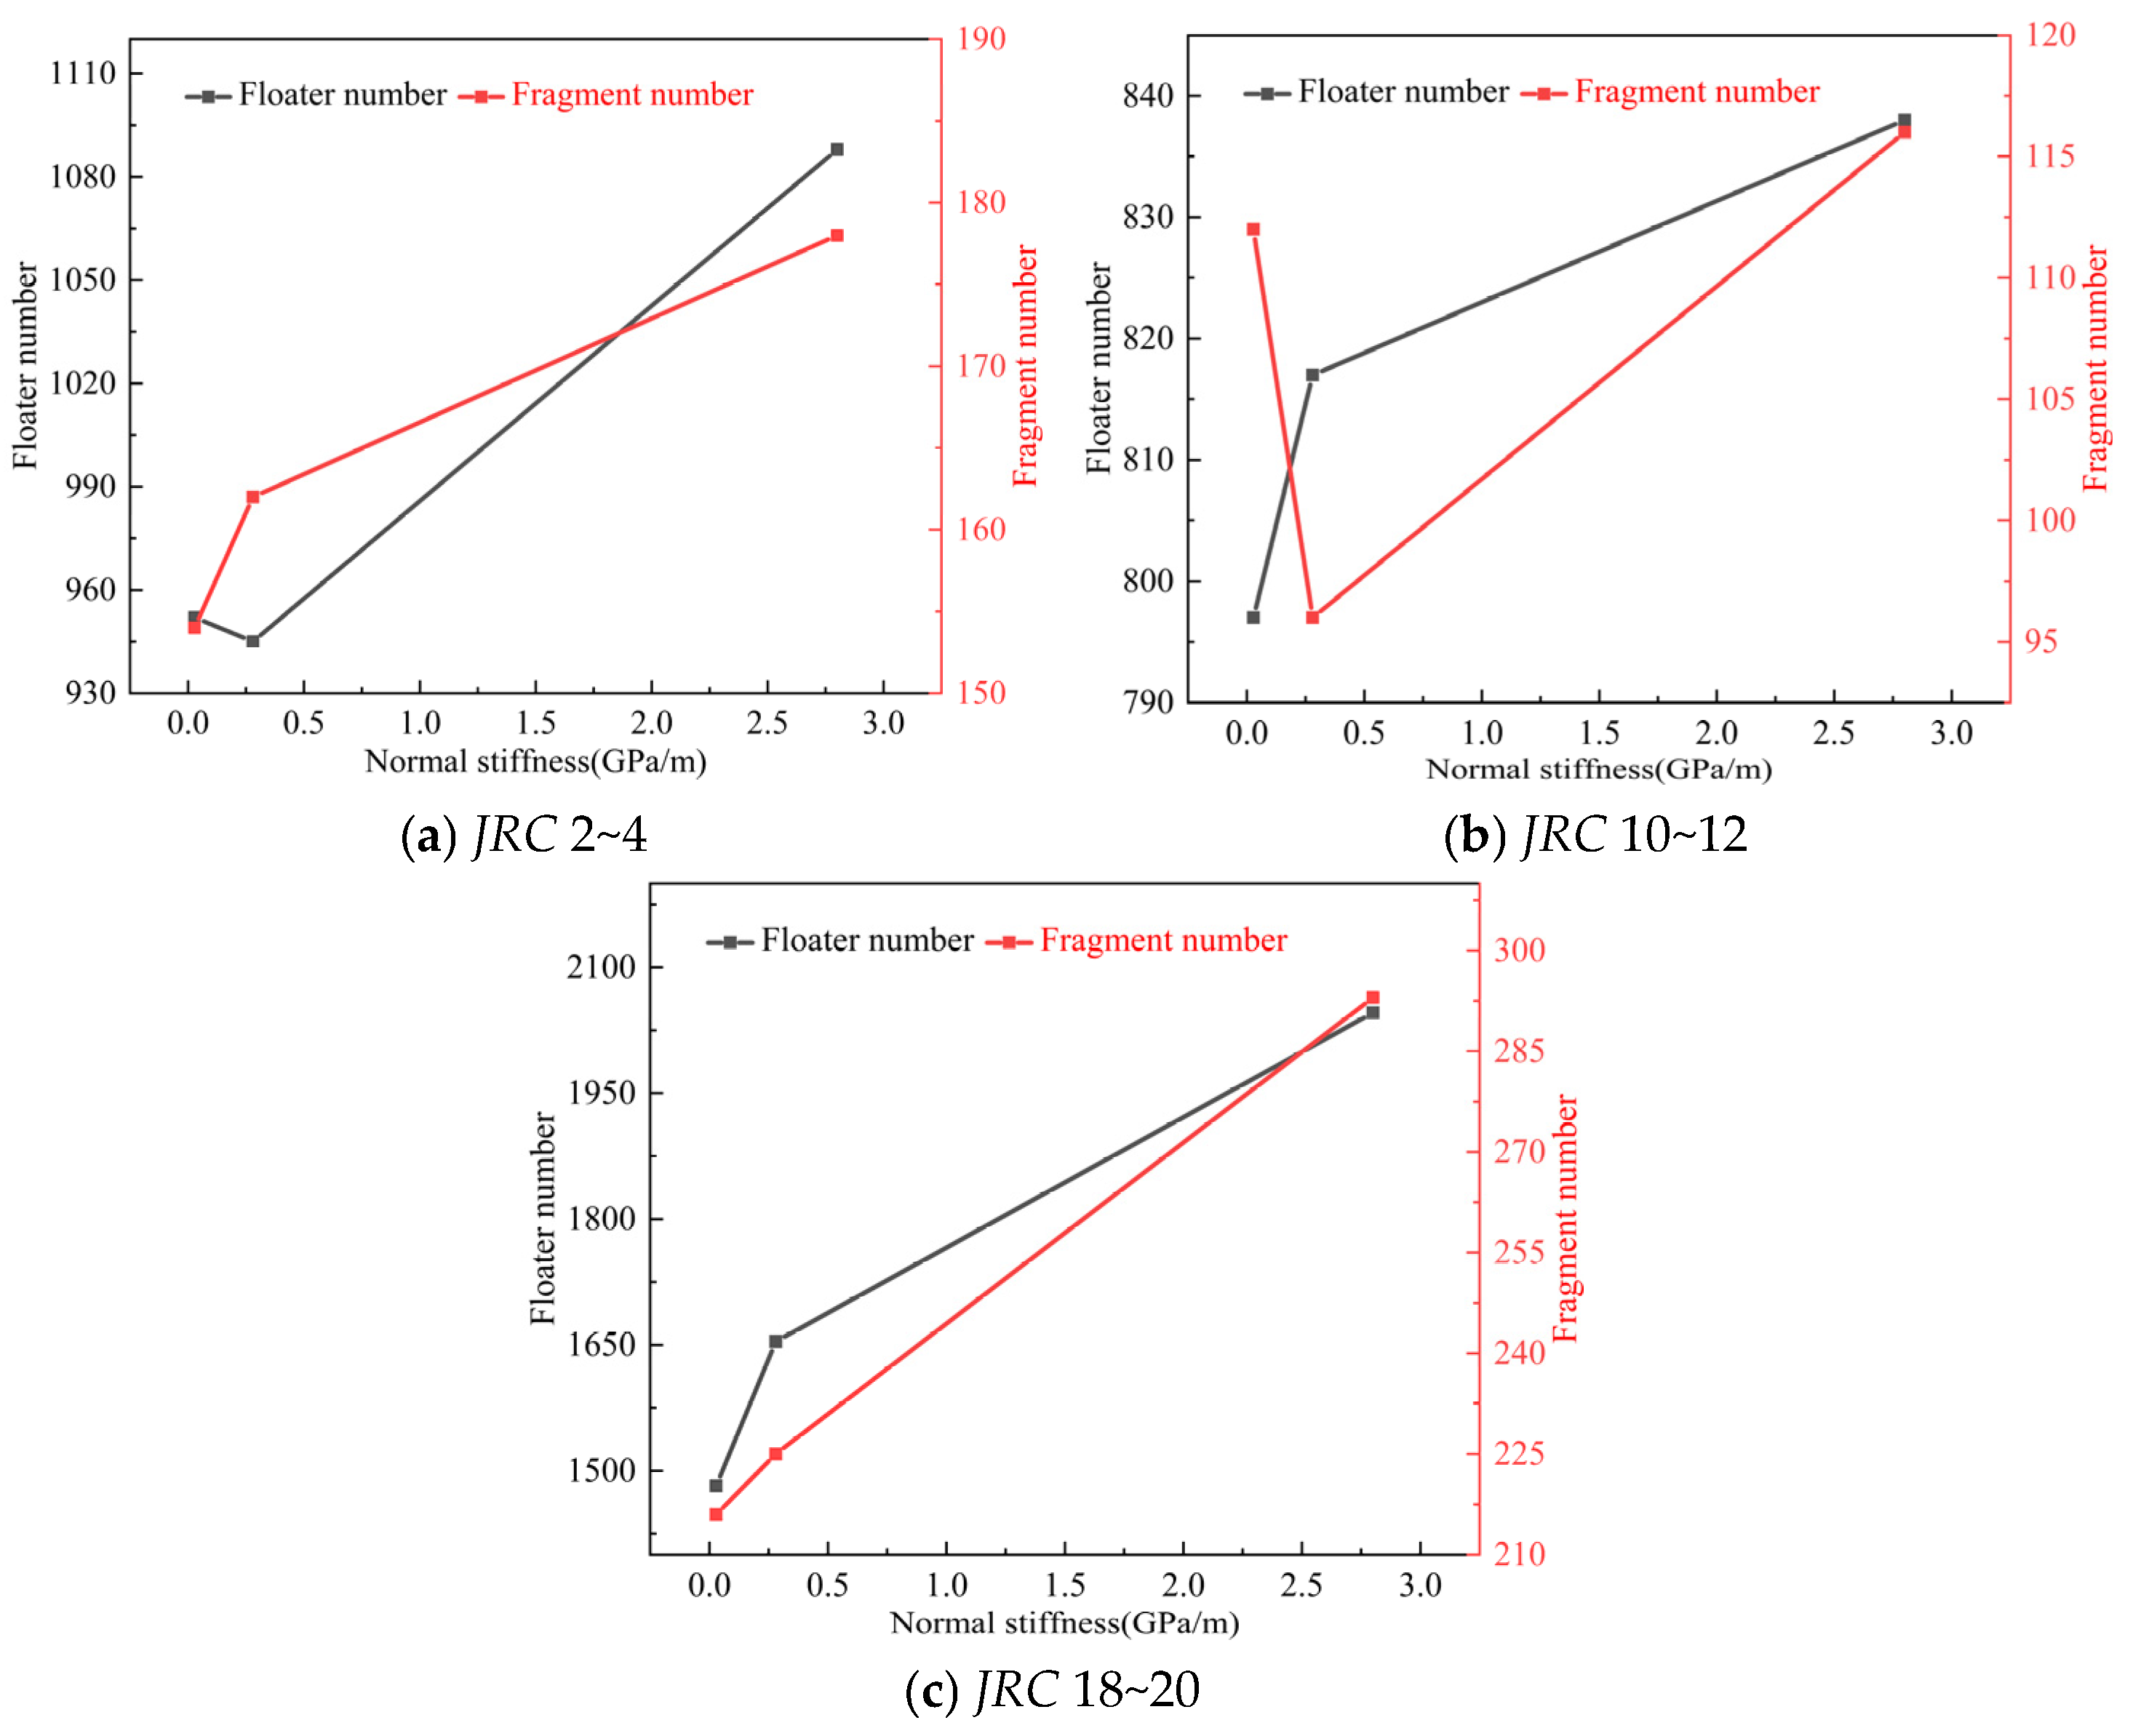
As microcracks form, an increasing number of fragments appear along the shear edge, with the resulting products referred to as fragments and floaters [38]. Fragments consist of several particles, while floaters consist of only one particle. Figure 13a,b show the changes in the increment values of floaters and fragments on the JRC 18~20 joint surfaces as the normal stiffness increases. In the early stages of shear, floaters always appear before fragments, regardless of the normal stiffness, and the number of floaters is relatively greater than that of fragments, indicating that the formation of floaters dominates the fragmentation of the block. As shearing progresses, fragments begin to form gradually. However, throughout the shearing process, the increment of floaters is always greater than that of fragments. The growth of floaters is typically a stable process, as the increment values of floaters are positive in most cases. In contrast, the increment of fragments occasionally becomes negative during a significant portion of the process, indicating that some fragments are extremely small and often transform into several floaters. Figure 14 shows the cumulative statistical quantities of fragments and floaters for various roughness levels. It can be observed that in JRC 2~4, an increase in normal stiffness promotes the formation of floaters, while the number of fragments first decreases and then increases; in JRC 10~12, an increase in normal stiffness promotes the formation of fragments, while the number of floaters first decreases and then increases; and in JRC 18~20, an increase in normal stiffness promotes the formation of both floaters and fragments. This is because at low roughness levels, there are fewer protrusions on the joint surface, resulting in more planar wear during shearing, which facilitates the growth of floaters. In contrast, joint surfaces with medium to high roughness have more protrusions, which are gradually sheared off during the process, forming fragments.

4.2. Block Crack Propagation Analysis

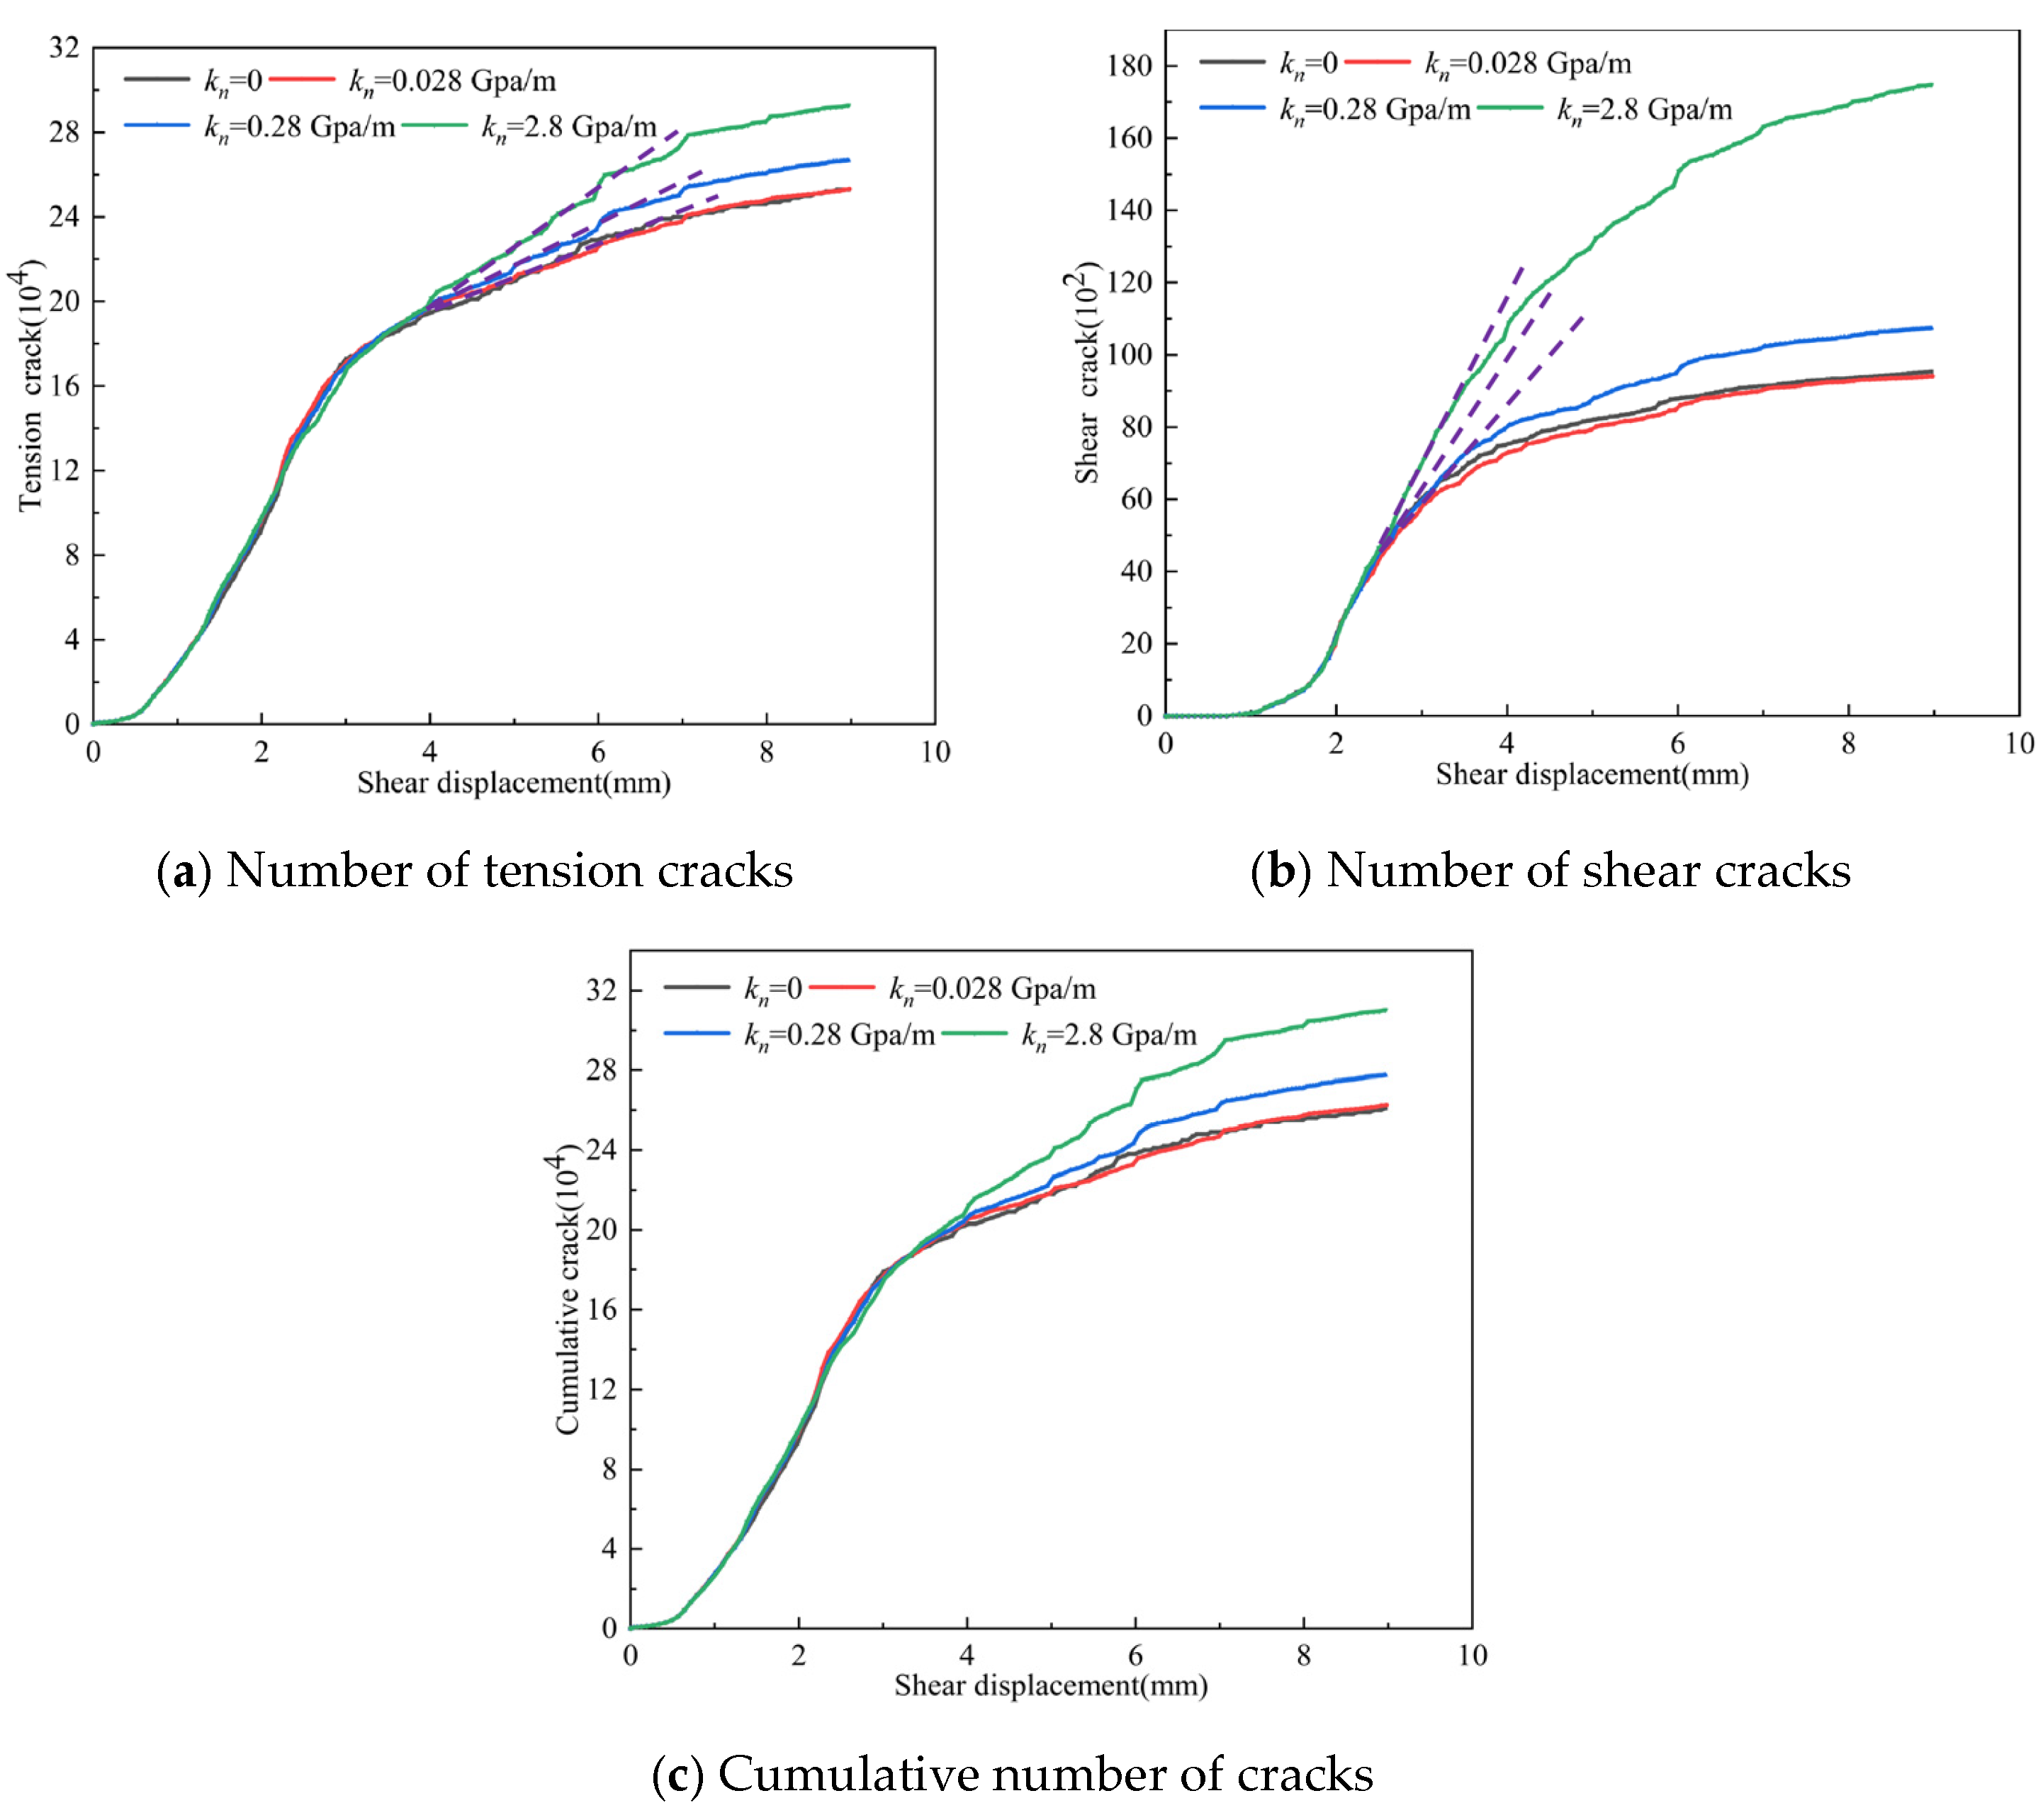
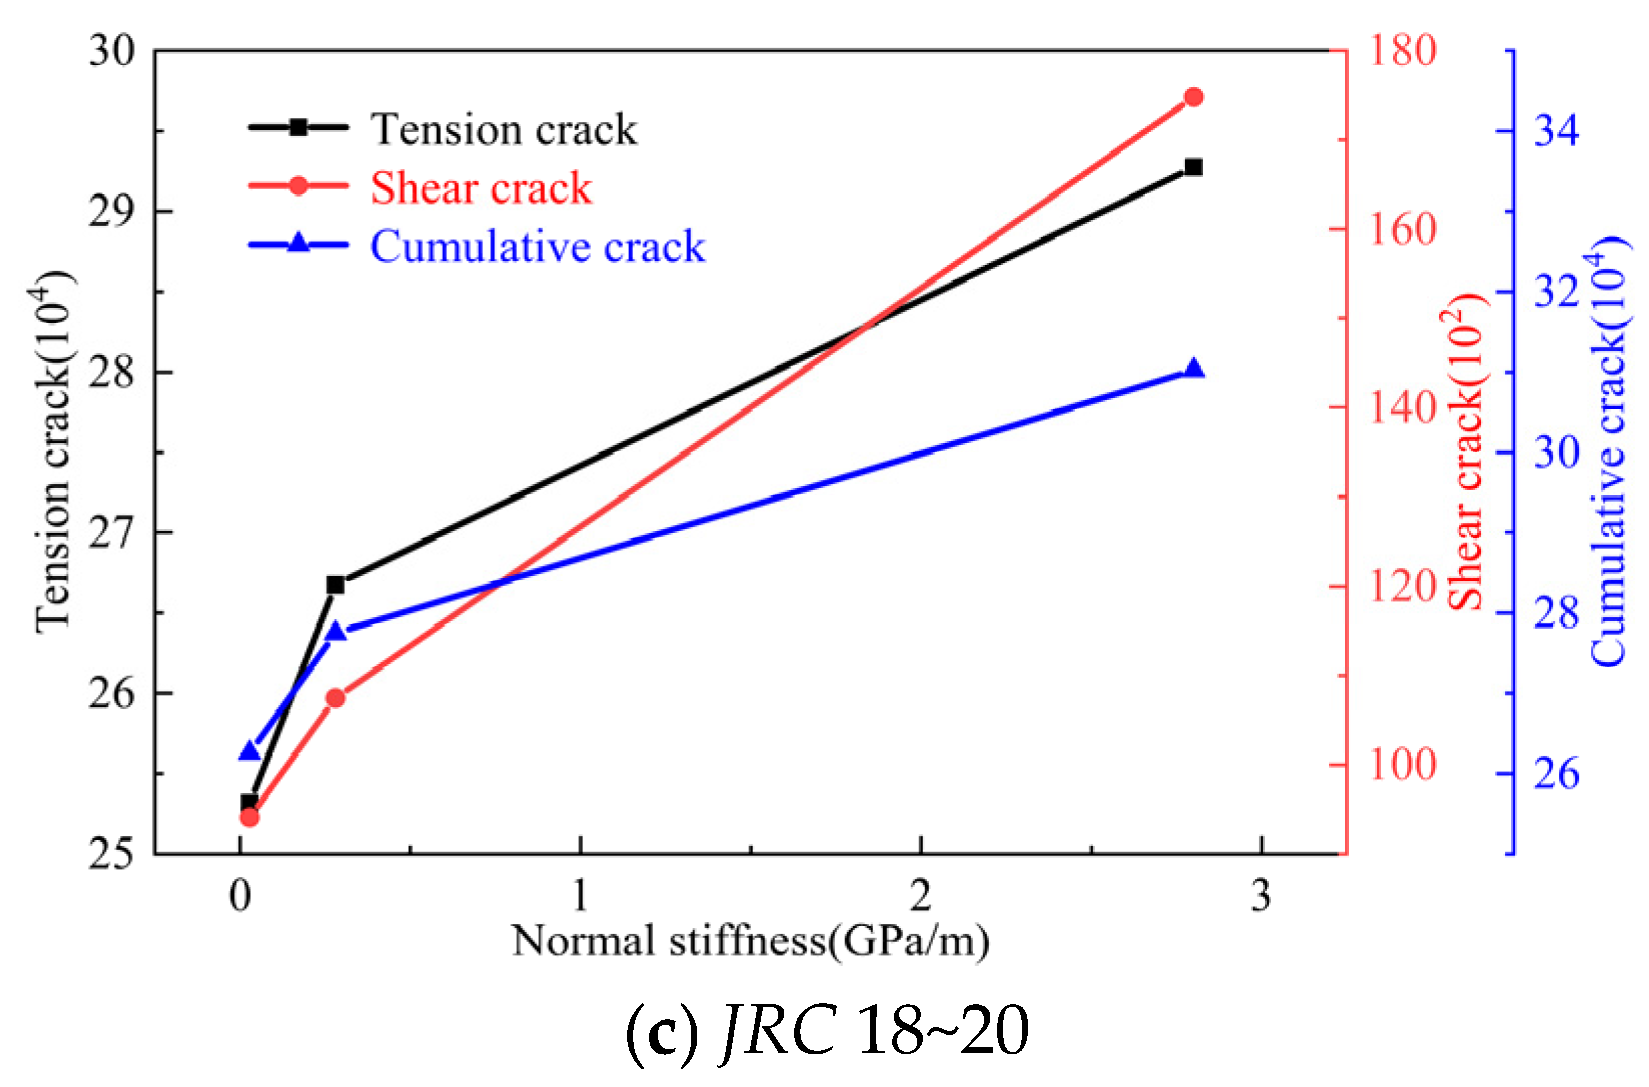
As shown in Figure 15a,b, in terms of the number of cracks, tensile cracks dominate throughout the entire shear process. The crack accumulation curves for the three cases with different normal stiffness can all be divided into three stages: a slow increase stage, a rapid increase stage, and a slow increase stage. As can be seen from the figure, normal stiffness has little effect on the growth rates of tensile cracks, shear cracks, and the total number of cracks during the first slow increase stage. The influence of normal stiffness on cracks primarily occurs in the latter two stages. The slope of the microcrack growth stage (the slope of the dashed line in Figure 15) indicates the growth rate of microcracks during that stage. For tensile cracks, normal stiffness has no effect on the first two stages but primarily influences the growth rate of the second slow increase stage, with higher normal stiffness resulting in a faster growth rate. For shear cracks, normal stiffness begins to affect the growth rate of cracks from the rapid increase stage, also showing that the higher the normal stiffness, the faster the growth rate. Additionally, as shown in Figure 16, as normal stiffness increases, the number of tensile cracks in JRC 2~4 first decreases and then increases, while the number of shear cracks increases with increasing normal stiffness. For JRC 10~12 and 18~20, both the number of shear cracks and tensile cracks increase with increasing normal stiffness.

4.3. Progressive Rock Block Fracturing Analysis

The fracture process of rock blocks with different roughness joint surfaces under various normal stiffnesses is shown in Figure 17. Microcracks are represented by small dots of the same size. The gray surface indicates the initial position of the joint interface, and the color of the dots is determined by the shear displacement at the time of crack initiation, as shown in the color bar at the bottom right of the figure (unit: mm). To facilitate observation of crack development, the upper and lower blocks are separated along the z-axis at a constant distance, and the total number of cracks is listed in each subfigure. It can be seen that, under the same normal stiffness, the total number of cracks and the number of cracks in the upper and lower blocks both increase with increasing JRC values. When JRC is 18~20, the total number of cracks and the number of cracks in the upper and lower blocks both increase with increasing kn values. However, when JRC is no greater than 10~12, the number of cracks in the upper and lower blocks shows no obvious pattern with changes in kn values.
Taking JRC 18~20 as an example, the distribution locations and projected areas of cracks under various normal stiffness conditions show no significant changes. The crack distributions in both the upper and lower blocks cover the entire interface, with the lower block typically exhibiting more cracks than the upper block. Under normal circumstances, regardless of the normal stiffness, initial cracks are generated near the outer edges of the blocks. When the shear displacement increases to 3.0 mm, newly generated cracks gradually develop toward the center of the blocks, beginning to form continuous wear zones. When the shear displacement increases to 6.0 mm, as the normal stiffness increases, the fracture zones of the upper and lower blocks become wider relative to the interface, while the penetration depth of both blocks increases. When the shear displacement increases to 9.0 mm, the deep fracture activity in the upper and lower blocks is largely at rest, with small-scale penetration becoming the primary mode. Additionally, as the normal stiffness increases, the red distribution area of the cracks expands, and the rate of crack formation also increases.
Under different JRC conditions, taking kn = 0.28 GPa/m as an example, as roughness increases, the total number of cracks and the number of cracks in the upper and lower blocks significantly increase. The crack distribution area expands notably. When JRC is no more than 10~12, cracks exhibit localized distribution in the upper and lower blocks, and both contain weak zones of cracks. At JRC 2~4, cracks generated during the shear process primarily distribute on both sides of the y-axis, with the weak zones of cracks located near the y-axis; when JRC is 10~12, the weak zones approach the trailing edge of the shear direction. When JRC is 18~20, the cracks generated by shear become continuous, with no obvious weak positions. From the analysis in the text, it can be seen that the evolution law of block cracks shows a significant discontinuous change as the JRC increases. This is also a limitation of this study. The paper only considered the shear properties of low, medium, and high roughness joint surfaces, and failed to fully consider the influence of more JRC values on the shear properties of the joint surfaces.

5. Conclusions

This paper simulates shear tests under CNS conditions using PFC3D software, revealing the effects of normal stiffness values of 0 (constant normal stress of 4 MPa), 0.028 GPa/m (low normal stiffness), 0.28 GPa/m (medium normal stiffness), and 2.8 GPa/m (high normal stiffness) on the shear stress, normal stress, normal deformation, and shear stress on the joint plane for JRC 2~4 (low roughness), 10~12 (medium roughness), and 18~20 (high roughness) joint surfaces. The study analyzed the evolution of mechanical behavior, including shear stress, normal stress, normal deformation, shear stress path, and surface resistance index, and examined the characteristics of block cracks. The specific conclusions are as follows:
  • The main deformation of the shear simulation process for different normal stiffness-JRC combinations is divided into three stages: the linear stage, the yield stage, and the post-peak stage. The shear stress increases first and then decreases as the shear displacement increases. When the normal stiffness exceeds 0.28 GPa/m, both normal stress and JRC increase gradually with increasing normal stiffness; when the normal stiffness is less than 0.028 GPa/m, normal stress shows no significant change.
  • The normal displacement changes from “shear contraction” to “shear expansion” as the shear displacement varies, and it changes from a positive value to a negative value, showing a trend of gradually increasing displacement. When the normal stiffness increases from 0 to 2.8 GPa/m, the maximum normal displacement decreases by 36.79% (JRC 2~4), 28% (JRC 10~12), and 36% (JRC 18~20), respectively. As JRC increases, the maximum normal displacement shows a gradually increasing trend, with an increase of 461.64% to 495.74%. The apparent cohesion cj and internal friction angle φj of the joint surface both show a gradually increasing trend as JRC increases; the peak SRI value increases with increasing JRC and decreases with increasing normal stiffness.
  • Under the same JRC, the shapes of the exponential curves for different normal stiffness values are basically the same. Under the same normal stiffness conditions, the shapes of the exponential curves for different JRC values are similar to the shapes of the shear stress-shear displacement curves. The peak SRI value increases with increasing JRC and decreases with increasing kn. As JRC increases, the influence of normal stiffness on the joint surface resistance index becomes greater.
  • In JRC 2~4, an increase in normal stiffness promotes the formation of floaters, while the number of fragments first decreases and then increases; in JRC 10~12, an increase in normal stiffness promotes the formation of fragments, while the number of floaters first decreases and then increases; and in JRC 18~20, an increase in normal stiffness promotes the formation of both floaters and fragments. As normal stiffness increases, the number of tensile cracks in JRC 2~4 first decreases and then increases, while the number of shear cracks increases with increasing normal stiffness; in JRC 10~12 and 18~20, both the number of shear cracks and tensile cracks increase with increasing normal stiffness.

Author Contributions

X.X.: Conceptualization, Methodology, Writing—original draft; K.Z.: Supervision, Formal analysis, Investigation; L.X.: Investigation, Writing—review and editing; P.Z.: Software, Visualization; C.G.: Investigation, Data curation; Y.C.: Supervision, Validation. All authors have read and agreed to the published version of the manuscript.

Funding

The authors gratefully acknowledge the financial support from the National Natural Science Foundation of China (52164004, 52304085), the China Postdoctoral Science Foundation [grant number 2024T170672], the Science and Technology Department of Jiangxi Province [grant number 2023SSY01031], the Science and Technology Project of Jiangxi Provincial Department of Education, China (GJJ2203604), and the Post-Doctoral Research Program of Jiangxi Province, China (2020KY39). We thank the anonymous reviewers for their comments on our paper.

Data Availability Statement

Some or all data or models that support the findings of this study are available from the corresponding author upon reasonable request.

Acknowledgments

We sincerely thank YaoPing Zhang for his expert advice on the simulation work and the paper’s structure, as well as for his partial financial contribution towards this research. His support is gratefully acknowledged.

Conflicts of Interest

The authors declare no conflicts of interest.

References

  1. Han, Z.Y.; Li, D.Y.; Zhou, T.; Zhu, Q.Q.; Ranjith, P.G. Experimental study of stress wave propagation and energy characteristics across rock specimens containing cemented mortar joint with various thicknesses. Int. J. Rock Mech. Min. Sci. Géoméch. Abstr. 2020, 131, 11. [Google Scholar] [CrossRef]
  2. Liu, Y.; Dai, F. A damage constitutive model for intermittent jointed rocks under cyclic uniaxial compression. Int. J. Rock Mech. Min. Sci. Géoméch. Abstr. 2018, 103, 289–301. [Google Scholar] [CrossRef]
  3. Xie, S.; Lin, H.; Wang, Y.; Cao, R.; Yong, R.; Du, S.; Li, J. Nonlinear shear constitutive model for peak shear-type joints based on improved Harris damage function. Arch. Civ. Mech. Eng. 2020, 20, 95. [Google Scholar] [CrossRef]
  4. Zhang, K.E.; Li, N.A.; Liu, W.; Xie, J. Experimental study of the mechanical, energy conversion and frictional heating characteristics of locking sections. Eng. Fract. Mech. 2020, 228, 106905. [Google Scholar] [CrossRef]
  5. Cui, G.J.; Zhang, C.Q.; Han, H.C. Experiment study on shear behavior of artificial joint under CNL and CNS boundary conditions. Chin. J. Rock Mech. Eng. 2019, 38 (Suppl. 2), 3384–3392. [Google Scholar]
  6. Bahaaddini, M. Effect of boundary condition on the shear behaviour of rock joints in the direct shear test. Rock Mech. Rock Eng. 2017, 50, 1141–1155. [Google Scholar] [CrossRef]
  7. Shang, J.; Zhao, Z.; Ma, S. On the shear failure of incipient rock discontinuities under CNL and CNS boundary conditions: Insights from DEM modelling. Eng. Geol. 2018, 234, 153–166. [Google Scholar] [CrossRef]
  8. Guti’errez-Ch, J.G.; Senent, S.; Melentijevic, S.; Jimenez, R. Distinct element method simulations of rock-concrete interfaces under different boundary conditions. Eng. Geol. 2018, 240, 123–139. [Google Scholar] [CrossRef]
  9. Haeri, H.; Sarfarazi, V.; Zhu, Z.M.; Marji, M.F.; Masoumi, A. Investigation of shear behavior of soil-concrete interface. Smart Struct. Syst. 2019, 23, 81–90. [Google Scholar]
  10. Saadat, M.; Taheri, A. A cohesive grain based model to simulate shear behaviour of rock joints with asperity damage in polycrystalline rock. Comput. Geotech. 2020, 117, 103254. [Google Scholar] [CrossRef]
  11. Liu, D.; Zhang, B.W.; Hong, C.J. Shear properties of two-order morphology of rock joints. Chin. J. Geotech. Eng. 2022, 44, 1434–1442. [Google Scholar]
  12. Lu, H.F.; Zhu, C.D.; Liu, Q.S. Study on shear mechanical properties of structural planes grouted with different materials. Chin. J. Rock Mech. Eng. 2021, 40, 1803–1811. [Google Scholar]
  13. Wang, S.; Pu, H.; Wang, L.G. Shear performance and damage mechanism of the grout-rock interface under high temperature in coal gasification grouting reinforcement of rock mass. J. Min. Saf. Eng. 2025, 1–16. [Google Scholar] [CrossRef]
  14. Zhang, X.B.; Yi, L.; Yao, C. Comparative Study on Shear Mechanical Properties and Failure Mechanism of Rough Structural Surfaces under CNL and DNL Boundary Conditions. Chin. J. Rock Mech. Eng. 2025, 44, 865–880. [Google Scholar] [CrossRef]
  15. Zhu, T.T.; Zhu, H.H.; Li, A. Morphological Characteristics and Anisotropy of Roughness of Shear Fracture Surfaces in Sandstone. J. Hunan Univ. (Nat. Sci). 2025, 52, 239–248. [Google Scholar]
  16. Heuze, F.E. Dilatant effects of rock joints. In Proceedings of the 4th International Congress on Rock Mechanics, Montreux, Switzerland, 2–8 September 1979; A. A. Balkema: Rotterdam, The Netherlands, 1979; pp. 169–175. [Google Scholar]
  17. Belem, T.; Souley, M.; Homand, F. Method for quantification of wear of sheared joint walls based on surfacemorphology. Rock Mech. Rock Eng. 2009, 42, 883–910. [Google Scholar] [CrossRef]
  18. Li, B.; Bao, R.; Wang, Y. Permeability evolution of two-dimensional fracture networks during shear under constant normal stiffness boundary conditions. Rock Mech. Rock Eng. 2020, 54, 409–428. [Google Scholar] [CrossRef]
  19. Han, G.S.; Xiong, F.; Zhou, Y. Research progress on shear characteristics of rock joints under constant normal stiffness boundary conditions. Shock. Vib. 2021, 2021, 9670151. [Google Scholar] [CrossRef]
  20. Jiang, Y.J.; Zhang, S.H.; Luan, H.J. Experimental study on shear characteristics of bolted rock joints under constant normal stiffness boundary conditions. Chin. J. Rock Mech. Eng. 2021, 40, 663–675. [Google Scholar]
  21. Indraratna, B.; Haque, A.; Aziz, N. Laboratory modelling of shear behaviour of soft joints under constant normal stiffness conditions. Comput Geotech. 1998, 16, 17–44. [Google Scholar] [CrossRef]
  22. Liu, R.C.; Yin, Q.; Yang, H.Q. Cyclic shear mechanical properties of 3D rough joint surfaces under constant normal stiffness (CNS) boundary conditions. Chin. J. Rock Mech. Eng. 2021, 40, 1092–1109. [Google Scholar]
  23. Jiao, F.; Xu, J.; Peng, S.J. Experimental Study on Shear Mechanical Properties and Damage Evolution Laws of Artificial Structural Surfaces under Normal Tangential Stiffness Conditions. J. China Coal Soc. 2023, 48, 4065–4077. [Google Scholar]
  24. Park, J.; Song, J. Numerical simulation of a direct shear test on a rock joint using a bonded-particle model. Int. J. Rock Mech. Min. Sci. Géoméch. Abstr. 2009, 46, 1315–1328. [Google Scholar] [CrossRef]
  25. Bahaaddini, M.; Sharrock, G.; Hebblewhite, B.K. Numerical direct shear tests to model the shear behaviour of rock joints. Comput. Geotech. 2013, 51, 101–115. [Google Scholar] [CrossRef]
  26. Asadi, M.S.; Rasouli, V.; Barla, G. A bonded particle model simulation of shear strength and asperity degradation for rough rock fractures. Rock Mech. Rock Eng. 2012, 45, 649–675. [Google Scholar] [CrossRef]
  27. Ge, Y.; Tang, H.; Eldin, M.A.M.E.; Wang, L.; Wu, Q.; Xiong, C. Evolution process of natural rock joint roughness during direct shear tests. Int. J. Geomech. 2017, 17, E4016013. [Google Scholar] [CrossRef]
  28. Yang, K.; Hu, Q.; Zhao, H.; Zhao, M.; Zhou, S. Numerical study on the shear behavior of concrete-rock joints with similar triangular asperities. Comput. Geotech. 2023, 159, 105468. [Google Scholar] [CrossRef]
  29. Oh, J.; Li, Y.; Mitra, R. A numerical study on dilation of a saw-toothed rock joint under direct shear. Rock Mech. Rock Eng. 2017, 50, 913–925. [Google Scholar] [CrossRef]
  30. Meng, F.; Song, J.; Yue, Z.; Zhou, H.; Wang, X.; Wang, Z. Failure mechanisms and damage evolution of hard rock joints under high stress: Insights from PFC2D modeling. Eng. Anal. Bound. Elem. 2022, 135, 394–411. [Google Scholar] [CrossRef]
  31. Peng, J.; Wong, L.N.Y.; Teh, C.I. Influence of grain size on strength of polymineralic crystalline rock: New insights from DEM grain-based modeling. J. Rock Mech. Geotech. Eng. 2021, 13, 755–766. [Google Scholar] [CrossRef]
  32. Fan, Z.; Zhou, Q.; Nie, X.; Yao, Z.; Li, C.; Wang, J.; Ren, L. 3D anisotropic microcracking mechanisms of shale subjected to direct shear loading: A numerical insight. Eng. Fract. Mech. 2024, 298, 109950. [Google Scholar] [CrossRef]
  33. Ríos-Bayona, F.; Johansson, F.; Mas-Ivars, D.; Sánchez-Juncal, A.; Bolin, A. Using PFC2D to simulate the shear behaviour of joints in hard crystalline rock. B Eng. Geol. Environ. 2022, 81, 381. [Google Scholar] [CrossRef]
  34. Barton, N.R.; Choubey, V. The shear strength of rock joints in theory and practice. Rock Mech. 1977, 10, 1–54. [Google Scholar] [CrossRef]
  35. Bahaaddini, M.; Hagan, P.C.; Mitra, R. Parametric study of smooth joint parameters on the shear behaviour of rock joints. Rock Mech. Rock Eng. 2015, 48, 923–940. [Google Scholar] [CrossRef]
  36. Yang, K.X.; Liu, Y.N.; Zhao, H. Experimental Study and Discrete Element Simulation on Shear Characteristics of Sandstone-Concrete Structural Interfaces. J. Hunan Univ. (Nat. Sci.) 2024, 51, 165–176. [Google Scholar]
  37. Lee, Y.; Park, J.; Song, J. Model for the shear behavior of rock joints under CNL and CNS conditions. Int. J. Rock Mech. Min. Sci. 2014, 70, 252–263. [Google Scholar] [CrossRef]
  38. Xiong, L.; Wu, S. Numerical simulation of micro-cracking and energy budget in porous rocks under contractional regimes across the brittle-ductile transition. J. Struct. Geol. 2021, 148, 104376. [Google Scholar] [CrossRef]
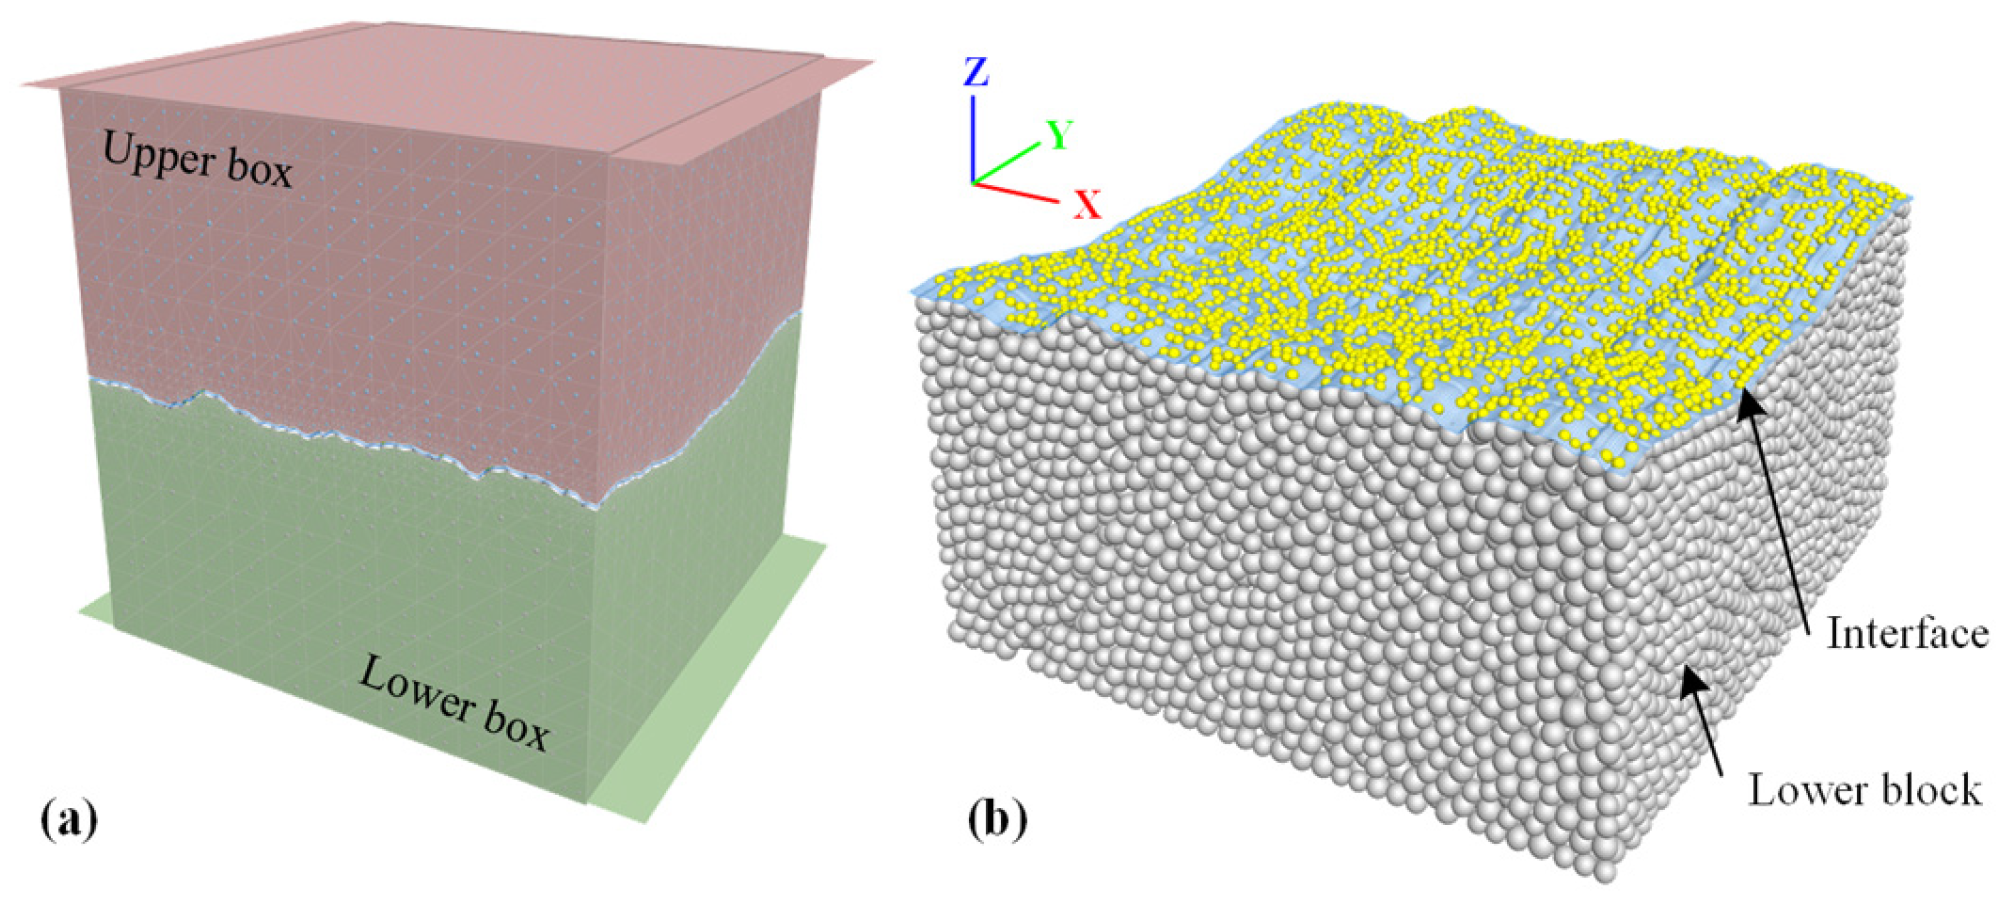
Figure 1. (a) Shear box, (b) Interfacial contacts.
Applsci 15 10827 g001
Figure 2. Diagram of CNS boundary conditions.
Applsci 15 10827 g002
Figure 3. Stress-displacement curves of joints with different levels of roughness.
Applsci 15 10827 g003aApplsci 15 10827 g003b
Figure 4. Characteristics of τmax and τ as functions of kn and JRC.
Applsci 15 10827 g004
Figure 5. Normal stress–shear displacement curves of different roughness joint surfaces.
Applsci 15 10827 g005
Figure 6. Characteristics of σmax as a function of kn and JRC.
Applsci 15 10827 g006
Figure 7. Normal displacement–shear displacement curves of joints with different roughness levels.
Applsci 15 10827 g007
Figure 8. Characteristics of δmax as a function of kn and JRC.
Applsci 15 10827 g008
Figure 9. Relationship between shear stress and normal stress on joints with different roughness (The slope of the dashed line in the figure represents the apparent internal friction angle φj).
Applsci 15 10827 g009
Figure 10. Characteristics of the variation of surface resistance index during the shearing process of the joint surface.
Applsci 15 10827 g010
Figure 11. Characteristics of the peak surface resistance index (SRI) changes.
Applsci 15 10827 g011
Figure 12. Variation of the dispersion coefficient of the peak SRI values of different JRC joint surfaces.
Applsci 15 10827 g012
Figure 13. Incremental values of floater and fragment numbers with increasing normal stiffness on the roughness joint surface of JRC 18~20.
Applsci 15 10827 g013
Figure 14. Statistical changes in the accumulation of floaters and fragments on joint surfaces with different roughness levels.
Applsci 15 10827 g014
Figure 15. Changes in the cumulative values of tensile cracks, shear cracks, and cumulative crack numbers on the JRC 18~20 joint surface with increasing normal stiffness (The slope of the dashed line in the figure represents the rate of microcrack propagation).
Applsci 15 10827 g015
Figure 16. Statistics on the changes in tensile cracks, shear cracks, and cumulative crack numbers on joint surfaces with different roughness as a function of normal stiffness.
Applsci 15 10827 g016aApplsci 15 10827 g016b
Figure 17. Crack distribution on the upper and lower blocks of each roughness sample under different normal stiffness conditions.
Applsci 15 10827 g017
Table 1. The parameter calibration values of sandstone.
Parameter TypeValue
Elastic modulus, GPa4.2
Poisson’s ratio0.2
Uniaxial compressive strength, MPa27.4
Friction angle, °37.62
Shear stiffness, GPa/m6.42
Normal stiffness, GPa/m28.771
Table 2. Peak SRI Value Varies with kn and JRC.
JRCJRC 2–4JRC 10–12JRC 18–20
kn
00.9981.2711.468
0.0280.9971.2681.461
0.280.9891.2541.438
2.80.9841.1991.352
Disclaimer/Publisher’s Note: The statements, opinions and data contained in all publications are solely those of the individual author(s) and contributor(s) and not of MDPI and/or the editor(s). MDPI and/or the editor(s) disclaim responsibility for any injury to people or property resulting from any ideas, methods, instructions or products referred to in the content.