Article

Architectural Anatomy and Application in an Ultra-Low-Permeability Reservoir: A Case Study from the Huang 57 Area, Jiyuan Oilfield

1
Key Laboratory of Exploration Technologies for Oil and Gas Resources, Ministry of Education, Yangtze University, Wuhan 430100, China
2
School of Geosciences, Yangtze University, Wuhan 430100, China
3
PetroChina Daqing Oilfield Co., Ltd., Daqing 163513, China
*
Author to whom correspondence should be addressed.
Appl. Sci. 2025, 15(19), 10828; https://doi.org/10.3390/app151910828
Submission received: 28 August 2025 / Revised: 25 September 2025 / Accepted: 29 September 2025 / Published: 9 October 2025

Abstract

Reservoir architecture significantly influences fluid flow in ultra-low permeability reservoirs, yet this critical factor is frequently neglected in development strategies. This study investigates the Huang 57 block within the Jiyuan Oilfield of China’s Ordos Basin, where we conducted detailed analysis of well logging data, production history, and sedimentological characteristics. Our research established five diagnostic criteria for identifying architectural boundaries of subaqueous distributary channels, enabling classification of two fundamental architectural patterns—isolated and amalgamated—with four distinctive stacking styles. Analysis reveals that architectural heterogeneity exerts primary control over residual oil distribution, with concentrated accumulation occurring at poorly connected channel margins, interlayer barriers, and unswept zones. We verified these findings through horizontal well data and production performance analysis. The study presents a comprehensive framework for architectural characterization in low-permeability reservoirs and proposes specific development strategies, including strategic well conversion and optimized infill drilling, to enhance injection–production connectivity and improve recovery efficiency. These practical solutions offer valuable guidance for developing similar reservoirs worldwide.

1. Introduction

The Ordos Basin is a multi-cyclic cratonic depression characterized by a stable tectonic evolution and six major structural units. The Yanchang Formation within the basin contains multiple oil-bearing strata, and recent exploration of the Chang 8 reservoir group has revealed large-scale, low-permeability lithologic hydrocarbon accumulations [1,2,3]. The Jiyuan area, located in the western segment of the central Shaanbei Slope, consists of shallow-water deltaic deposits [4,5]. These deposits accumulated in an open basin with gentle topography, abundant sediment supply, and slow subsidence, promoting frequent channel migration and multi-phase stacking of channel sands both laterally and vertically, ultimately forming extensive, thick sand bodies [6,7,8].
Although previous studies of high-permeability reservoirs have established architectural models based on vertical stacking and lateral contact relationships [9,10]. Regarding low-permeability and ultra-low-permeability reservoirs, scholars have conducted extensive research. Chen et al. through diagenetic studies, summarized the development characteristics and distribution patterns of low-permeability reservoirs [11]. Liao et al. systematically investigated the quantitative characterization and classification criteria for ultra-low permeability sandstone reservoir properties, using the Chang 6 member of the Ordos Basin as a case study [12]. Wang et al. conducted architectural studies on the Chang 8 oil group in the Jiyuan Oilfield, revealing the control of sedimentary microfacies on the connectivity of low-permeability reservoirs [4]. However, the majority of previous research has predominantly focused on engineering techniques such as acidification and fracturing. Zhang et al. proposed that the “step-by-step dissolution and separation” method can be implemented through gradual dissolution, ultimately achieving the goal of increasing porosity and permeability [13]. Li et al. effectively enhanced acid fracturing efficiency by combining pre-acid treatment technology with sand fracturing techniques [14]. In practice, however, the permeability contrast at architectural boundaries also significantly influences the distribution of remaining oil and gas in ultra-low permeability reservoirs. Recent work, however, indicates that the efficacy of these techniques is closely linked to the distribution of reservoir layers and interlayers [15,16,17]. Moreover, architectural boundaries exert a significant control on the distribution of remaining oil in ultra-low-permeability reservoirs [18,19,20]. Thus, detailed architectural analysis is essential for stabilizing production and controlling water cut.
The Huang 57 block of the Jiyuan Oilfield, which targets the Chang 8 member of the Yanchang Formation, displays poor reservoir properties and strong heterogeneity, typical of an ultra-low-permeability reservoir. Development challenges include rapid production decline, inefficient water injection, a high proportion of low-productivity wells, and difficulty in establishing an effective pressure displacement system. Therefore, detailed architectural characterization of individual sand bodies is urgently needed to clarify depositional mechanisms, establish identification criteria for channel boundaries, and develop robust architectural models.
This study integrates well logging and production data to analyze injector–producer connectivity and fluid-flow behavior under different architectural patterns. The objectives are to advance the understanding of oil–water migration, predict the distribution of remaining oil, and guide the optimization of recovery strategies. The results are expected to support more efficient development of ultra-low-permeability reservoirs in the Ordos Basin.

2. Geological Setting

The Ordos Basin is a large, multi-cycle cratonic depression basin with a relatively stable tectonic history [21,22,23]. It consists of six major structural units: the Jinxi Fold-Thrust Belt, Yishan Slope, Tianhuan Depression, Western Thrust Belt, Weibei Uplift, and Yimeng Uplift. Geographically, the basin extends from 106°20′ to 110°30′ E and from 35°00′ to 40°30′ N. It is bounded by the Yin Mountains and Daqing Mountains to the north, the Qinling Mountains to the south, the Helan and Liupan Mountains to the west, and the Lüliang and Taihang Mountains to the east.
The study area is situated in the Huang 57 well block in the southeastern part of the Jiyuan Oilfield, spanning Dingbian County in Shaanxi Province and Yanchi County in Ningxia. Structurally, it is located on the eastern flank of the Tianhuan Depression and the western part of the Yishan Slope, encompassing two structural units with elevations ranging from 1100 to 1600 m (Figure 1).
Sedimentologically, the area belongs to a shallow-water delta front subfacies, with sediment sourced from the northwest. It covers approximately 66.5 km2 and includes 535 development wells, primarily targeting the Chang 81 oil reservoir group of the Upper Triassic Yanchang Formation. Trial production in the Chang 8 reservoir began in 2007, with an initial average daily oil production of 6.43 tons and a water cut of 6.54%. After more than ten years of water flooding, the region has entered a high water-cut stage, marked by inefficient water flooding and widespread poor injector–producer connectivity [24,25,26].
Well log interpretations indicate that the classification of subaqueous distributary channel phases leads to significant variations in hydrocarbon saturation between adjacent wells, and sandbody stacking patterns influence pressure maintenance. Therefore, fine architectural characterization of individual sand bodies—clarifying sedimentary microfacies, vertical stacking relationships, lateral connectivity, and integrating dynamic production data—is essential for assessing how architectural patterns affect well-group connectivity and for guiding future development strategies [27,28].

3. Materials and Methods

3.1. Sedimentary Facies and Reservoir Architecture

3.1.1. Types of Sedimentary Microfacies

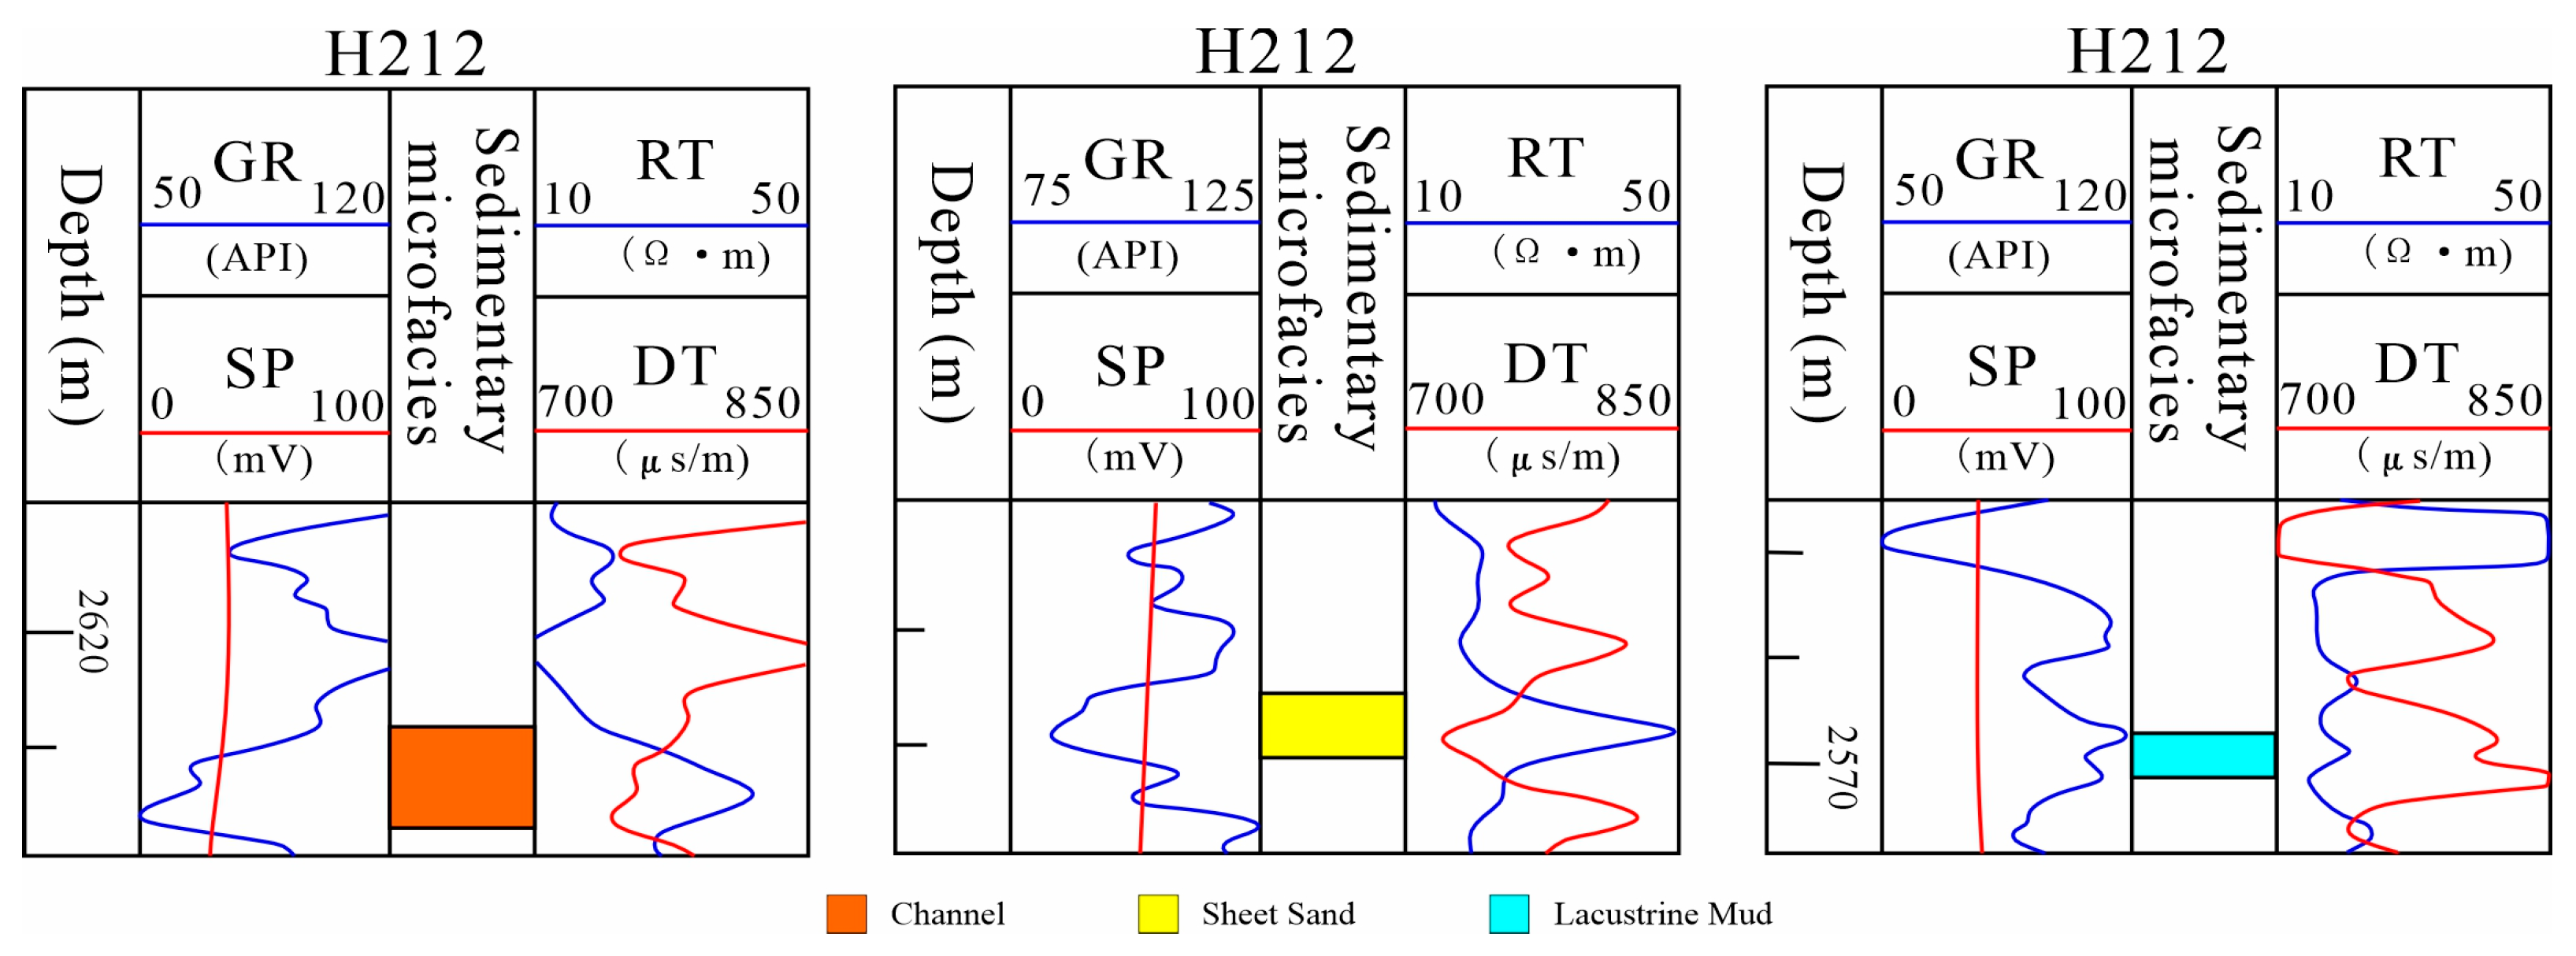
The study area is situated in a shallow-water deltaic depositional environment, mainly consisting of delta front subfacies. Three mains depositional microfacies are identified: subaqueous distributary channels, sheet sands, and lacustrine mud (Figure 2).
(1)
Subaqueous distributary channel
Subaqueous distributary channels are underwater extensions of fluvial channels entering the lake [29]. The stacking of channels from multiple depositional events forms the reservoir framework within individual flow units [30]. On gamma ray (GR) logs, these channels typically show blocky or bell-shaped patterns. Some intervals exhibit funnel-to-blocky shapes, indicating progradational episodes. Spontaneous potential (SP) logs mainly display blocky to bell-shaped responses with significant negative deflections. Multi-story stacked channel complexes are substantial, generally exceeding 8 m in thickness.
(2)
Sheet sand
Sheet sands consist of thin sand layers, including sheet-like deposits and distributary mouth bars, usually developing between the delta front and prodelta regions [31,32]. These sand bodies show notable lateral continuity and broad aerial distribution, with thickness generally under 2 m. On GR logs, they appear as medium-amplitude, thin funnel-shaped or finger-shaped patterns. SP logs commonly show funnel or finger-shaped responses.
(3)
Lacustrine mud
The lacustrine mud facies accumulate in interchannel areas. Variations in flow velocity and direction at channel confluences cause differential deposition, resulting in distinct small-scale sedimentary features. This facies primarily comprises silty mudstones and mudstones, lacking clear rhythmic bedding. GR logs in this facies show high, relatively flat readings, while SP logs deflect toward the baseline.

3.1.2. Sandbody Distribution Characteristics

Subaqueous distributary channel sands typically show bell-shaped GR and SP log responses, indicating fining-upward sequences. In contrast, mouth bar deposits generally exhibit funnel-shaped GR/SP patterns, reflecting coarsening-upward sequences. Statistical analysis of log curves from the Huang 57 well block reveals that >80% of sand units display normal grading signatures. This strong prevalence of fining-upward sequences provides clear evidence that mouth bar microfacies are nearly absent in the study area.
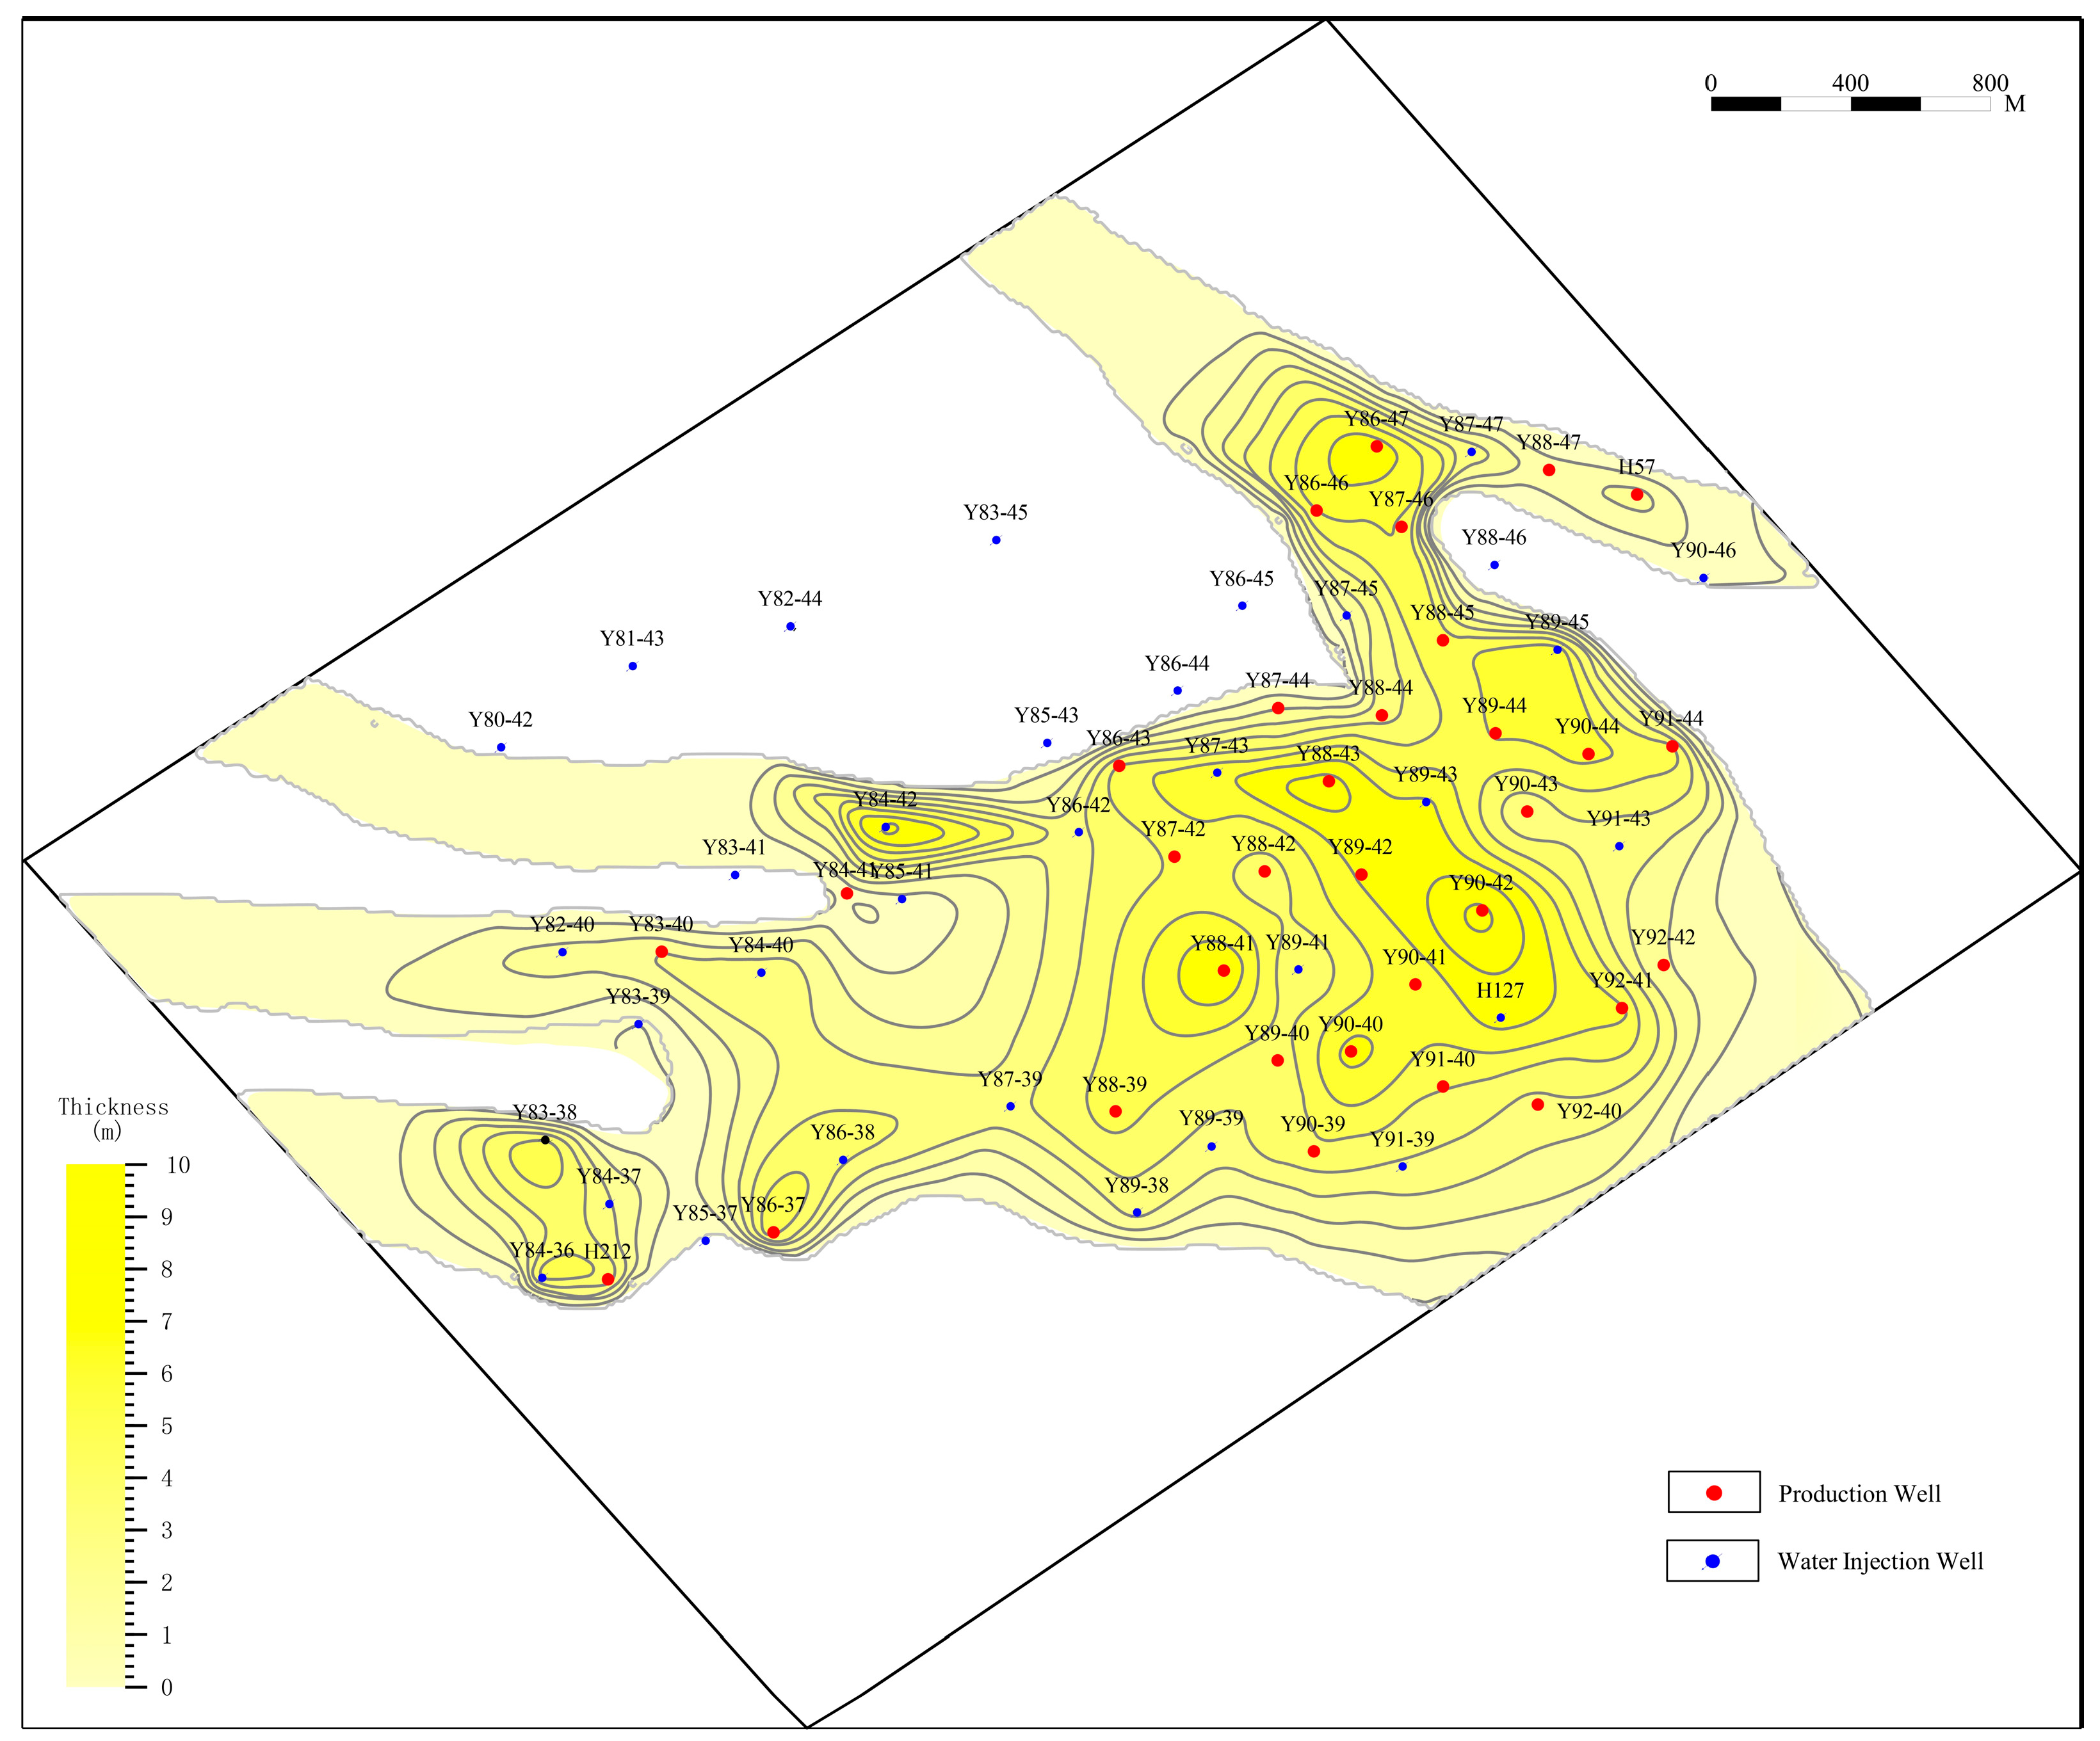
Delta systems dominated by distributary channels usually contain ribbon-shaped sand bodies aligned along depositional axes, with sediment thickness gradually thinning away from the source [20,29]. In the study area, sand bodies are well developed. As shown in the sand thickness map of the Chang 81212 single layer (Figure 3), these deposits form multiple ribbon-like belts. Several distinct depocenters are present in the central region, showing strong thickness variations. This architecture mainly results from the amalgamation of multiple channel phases.

3.1.3. Reservoir Architecture Recognition Criteria

Analysis of depositional microfacies indicates that the stacking of channel sands from successive depositional events, combined with mutual truncation of contemporaneous sand bodies, has resulted in laterally continuous sand packages [33,34,35]. This architectural complexity obscures critical flow barriers between sand units, significantly impairing subsequent development efficiency and necessitating adjustments to reservoir management strategies [36]. Consequently, a detailed architectural dissection of these sand bodies has been undertaken, adhering to the principle of “vertical staging and lateral boundary delineation”. This methodology involves identifying architectural units at individual wells and mapping structural boundaries across the reservoir.
Given that the study area has been delineated down to the individual sandbody scale, current architectural research prioritizes the identification of lateral boundaries. Through the construction of well correlation profiles, five diagnostic criteria for recognizing subaqueous distributary channel boundaries have been established.
(1)
Lateral Variation in Sedimentary Facies
The occurrence of mudstone belts or sheet sand deposits within vertical profiles serves as a diagnostic indicator of subaqueous distributary channel boundaries. Specifically, transitions to mudstone or sheet sands observed in lithofacies provide strong evidence for the lateral extent of channel margins.
(2)
Elevation Difference in Sandbody Top
Sand bodies formed within a single channel phase exhibit consistent top elevation, reflecting their contemporaneous deposition. In contrast, subaqueous distributary channel sands from different depositional events display elevation discrepancies due to variations in paleotopography and developmental stages. Thus, comparative analysis of sandbody top elevations can determine channel-phase differentiation.
For instance, an elevation difference is observed between the sand tops of Wells Y90-39 and Y90-40 (Figure 4), and similarly between Wells Y90-42 and Y90-43. These measured differences confirm that each well pair penetrates distinct channel phases, thereby delineating phase boundaries between Y90-39/Y90-40 and Y90-42/Y90-43.
(3)
Sandbody Thickness Variation
For channel-deposited sand bodies, the maximum thickness typically occurs near the channel center, thinning progressively toward the flanks. This thickness variation serves as a key indicator for identifying distinct channel phases. As shown in Figure 5, Well Y83-39 penetrates a relatively thin sandbody, while Wells Y85-41 to Y88-44 encounter significantly thicker accumulations, collectively displaying a pronounced lateral trend from thick to thin. This abrupt thickness differential indicates the presence of a channel boundary between Wells Y83-39 and Y85-41.
(4)
Log Curve Morphology Variations
Subaqueous distributary channels of the same depositional phase exhibit comparable log response characteristics due to compositional homogeneity and consistent diagenetic overprinting, resulting in an absence of abrupt log deviations. When exhibiting blocky-bell-shaped log motifs, this signature remains consistent across both channel axes and marginal facies. Furthermore, abrupt variations in curve amplitude contrast or serration intensity may indicate channel boundaries, enabling lateral boundary identification through systematic log morphology analysis.
As illustrated in Figure 6, adjacent wells display distinct log patterns: Well Y84-37 exhibits bell-to-funnel-shaped configurations, Well Y87-39 shows blocky-funnel-shaped signatures, Well Y90-41 demonstrates pronounced bell-shaped characteristics, and Well Y91-43 presents blocky-bell-shaped responses. The significant amplitude contrast among these proximal wells confirms the penetration of discrete channel bodies, demarcating individual channel boundaries between the well pairs.
(5)
Difference in Hydrocarbon Potential
Subaqueous distributary channel sands of the same depositional phase typically exhibit comparable hydrocarbon saturation when structural variations are accounted for. During production, these contemporaneous channels also demonstrate similar waterflood behavior. Consequently, significant discrepancies in hydrocarbon saturation between adjacent wells penetrating channel sands imply depositional phase heterogeneity. As evidenced in Figure 7, sands in Wells Y86-44 to Y89-41 are interpreted as oil-bearing zones, whereas Well Y90-40 yields a barren zone. This marked contrast confirms the existence of a phase boundary between these intervals.
While the five criteria were applied comprehensively, in practice, sedimentary facies transition and sandbody thickness variation were often the most decisive for lateral boundary identification. For example, a thickness change of >30% over an inter-well distance of <200 m was considered indicative of a channel boundary. Similarly, a GR amplitude contrast exceeding 20 API units between adjacent wells was treated as a significant variation.
Boundary identification requires comprehensive integration of all five diagnostic criteria with planar sandbody distribution patterns and channel width dimensions to accurately delineate subaqueous distributary channel margins. Based on these recognition indicators, channel phase classification is achieved through lateral-vertical integration. First, cross-source profiles (perpendicular to sediment transport direction) segment distributary channels, with interpreted boundaries projected onto plan-view maps. Subsequently, along-source profiles (parallel to transport direction) determine channel elongation distances, extending correlation ranges onto plan views. Finally, planar projections from both orientations are synthesized to establish definitive channel boundaries and spatial distributions. Cross-sections perpendicular to paleoflow clearly delineate lateral boundaries and extents of adjacent channel belts, while longitudinal sections parallel to transport direction verify downstream continuity of individual channel phases. This multi-directional validation rigorously constrains the three-dimensional distribution of each depositional unit.
Within the Huang 57 well block, the principal Chang 81212 reservoir unit comprises four discrete channel phases of limited dimensions. Laterally, the two leftmost channels exhibit mudstone-separated upper intervals while displaying lateral amalgamation in their lower sections. The third channel from the left demonstrates mutual truncation-stacking relationships with adjacent channels across its mid-lower intervals, characterized by upstream narrowing and abrupt mid-reach widening. The rightmost channel flows predominantly southward, developing a bifurcating secondary channel that diverges eastward at its central segment (Figure 8).
Architectural dissection reveals that individual channel phases within the study area have widths ranging from 117 to 1529 m, with a mean width of 372.4 m. Single-channel thickness varies between 1.4 and 6.1 m, averaging 3.6 m. The mean width-to-thickness ratio is approximately 105:1; however, channel width shows no statistically significant correlation with thickness (Figure 9).

3.1.4. Data Processing Hardware and Software

The study utilized a combination of specialized software tools for data processing and analytical tasks. Interpretations of well log data were carried out with Halliburton Landmark software. For characterizing sedimentary microfacies and analyzing the planar distribution of sandbodies, GPTMap(V4.5) was used to create thickness contour maps (Figure 3) and sedimentary facies distribution maps (Figure 4, Figure 5, Figure 6, Figure 7 and Figure 8). Production data statistics and dynamic performance validation involved initial data organization in Microsoft Excel, followed by trend analysis and correlation assessment of injection-production connectivity using MATLAB(R2020a).
These computations were facilitated by high-performance workstations (featuring Intel Xeon Gold 6338 processors and 128 GB DDR4 memory, Intel, Santa Clara, CA, USA), which handled the substantial well log dataset and enabled efficient data processing and model iterations.

3.2. Reservoir Architectural Analysis Results

3.2.1. Architectural Interpretation Validation

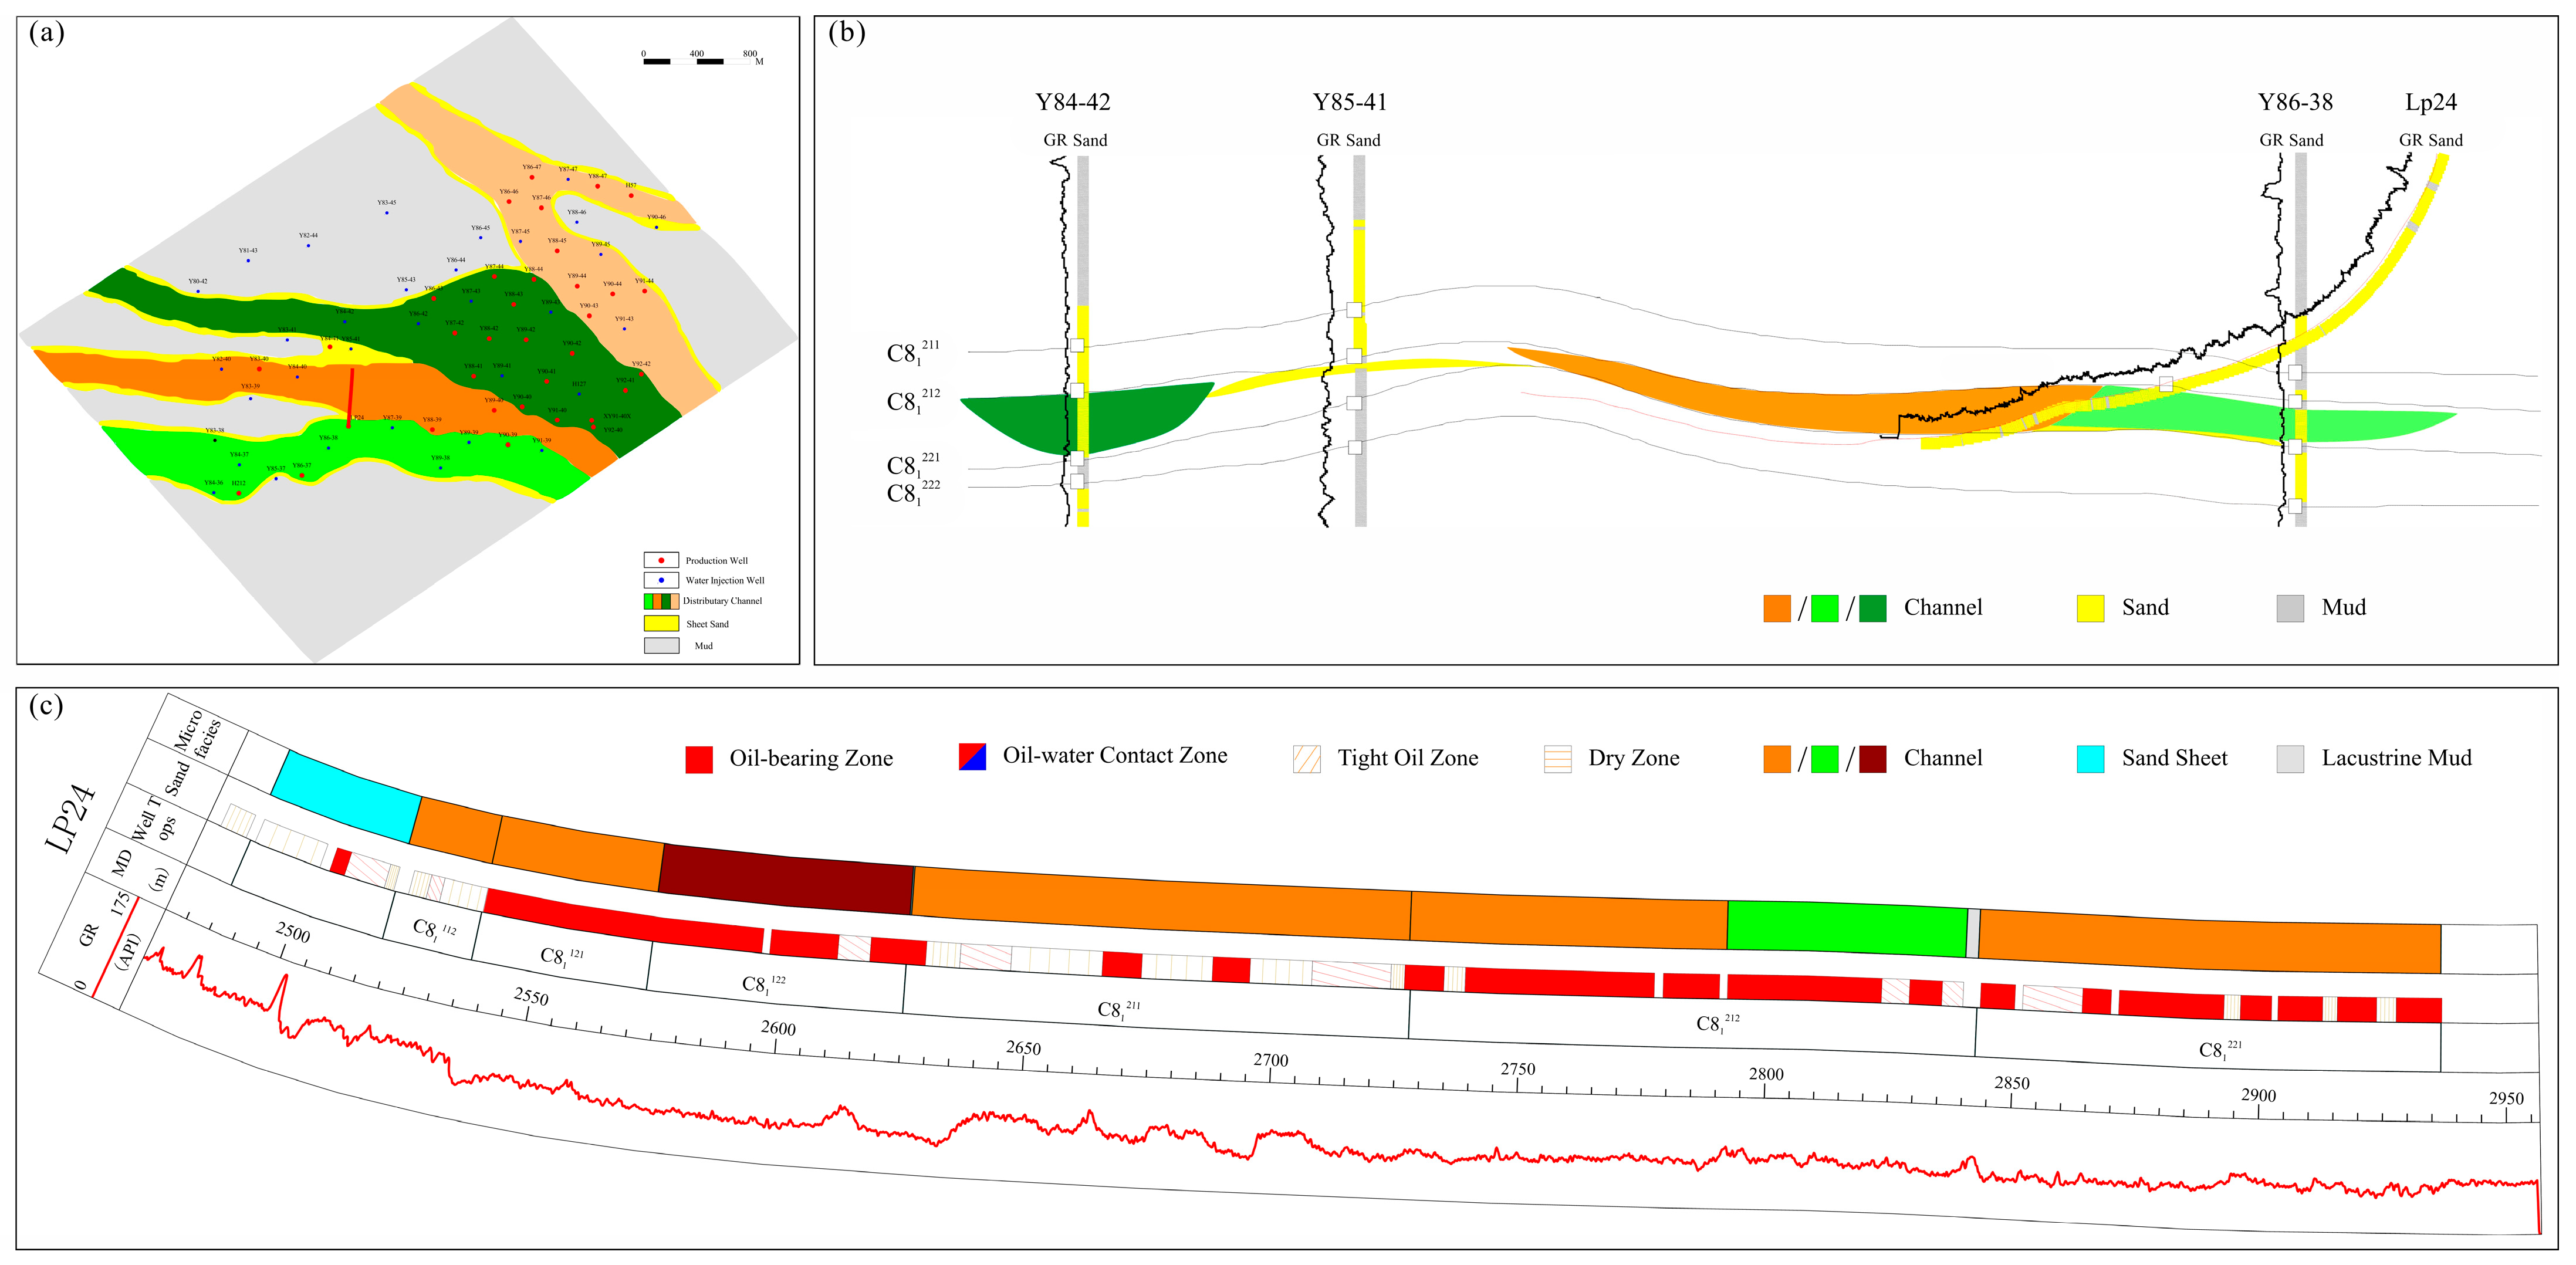
Building upon detailed architectural dissection, horizontal well data were employed to validate the reliability of identified phase boundaries. Within the Chang 81212 layer, horizontal well LP24 extends northward across two discrete channel phases, intersecting vertical well Y86-38 and terminating near well Y85-41, which penetrates sheet sands. GR log variations along the lateral section clearly delineate both channel units (Figure 10), showing strong alignment with plan-view facies maps. This multi-scale consistency confirms the high accuracy of single-channel architectural delineation.

3.2.2. Reservoir Architecture Model

Reservoir connectivity was evaluated through systematic analysis of sandbody architectural patterns and their diagnostic characteristics. Based on validated architectural classifications within the study area, two fundamental configuration modes were established: amalgamated channel patterns and isolated channel patterns. The amalgamated type comprises vertically stacked and laterally abutted subtypes, while the isolated category includes vertically disconnected and laterally detached configurations, each characterized by distinct sedimentological and spatial attributes.
(1)
Laterally Detached
As illustrated in Figure 11, the Chang 81212 layer demonstrates how subaqueous distributary channels in a shallow-water delta front become laterally segregated by intervening mudstone or sheet sand deposits. Vertical correlation profiles confirm persistent mudstone barriers between adjacent wells, delineating two hydraulically isolated channel phases. This compartmentalization suggests potential remaining oil accumulation along channel margins.
(2)
Vertically Disconnected
In shallow-water delta front environments, distributary channel sands are frequently compartmentalized by thick lacustrine mudstone intervals, resulting in vertical disconnection between superimposed sand bodies. Alternatively, channel accretion elements may be separated by thin mudstone layers or petrophysical baffles, creating internal flow barriers within individual sand units (Figure 12). Such architectural configurations promote potential remaining oil accumulation along sand–sand contact interfaces.
(3)
Vertical Stacking of Channels
Vertical stacking relationships between distributary channel sands primarily manifest as superimposition and truncation, where earlier channels undergo partial erosion by subsequent channels. The amalgamated intervals exhibit high vertical connectivity, forming thick, stacked sand complexes with minimal potential for remaining oil accumulation.
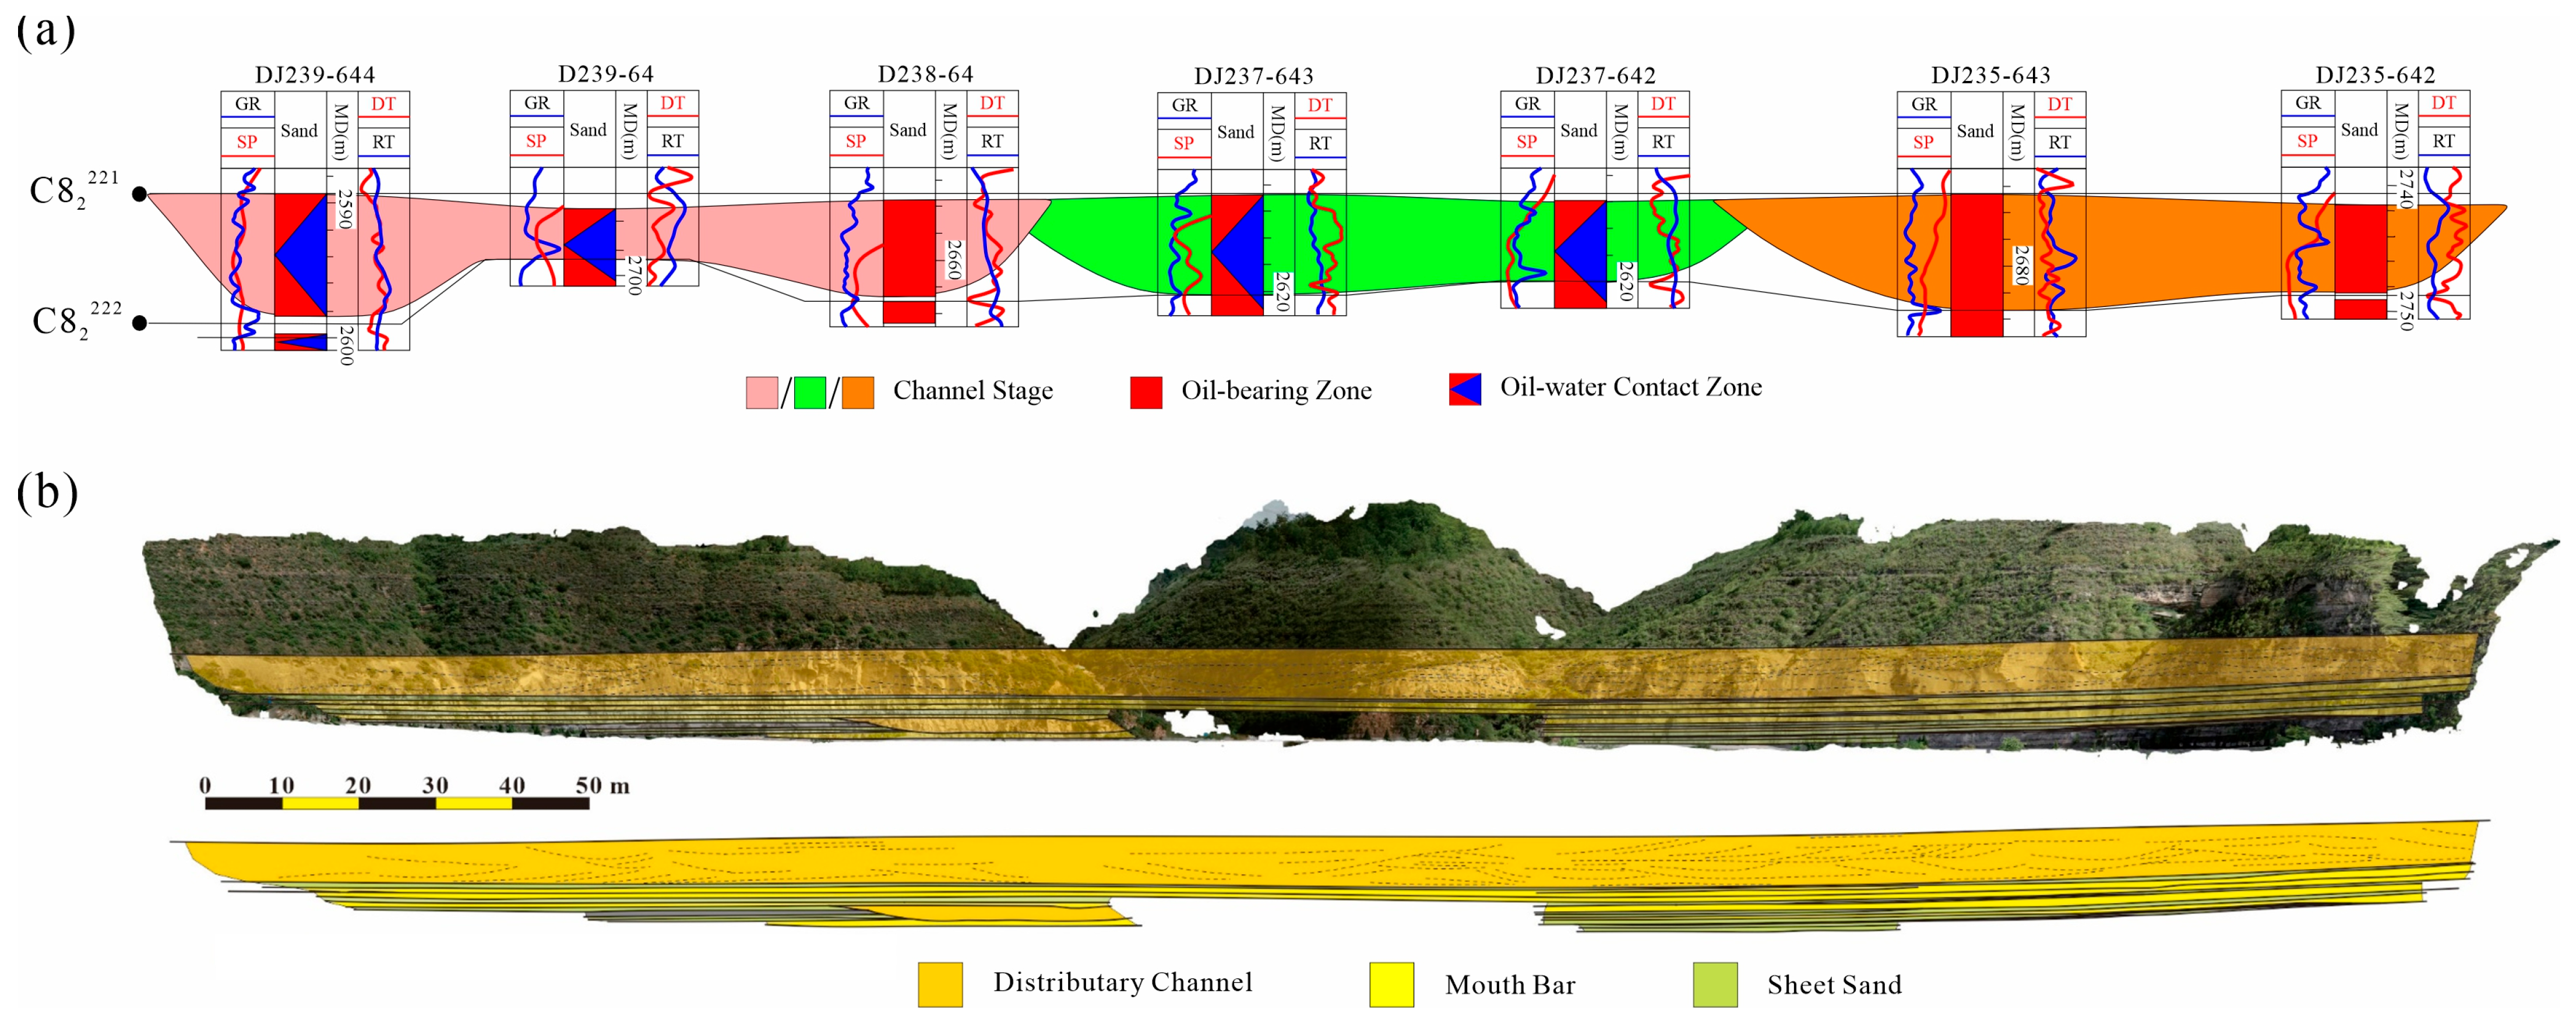
This architectural pattern is equally developed in outcrop exposures. As demonstrated in the eastern Shiwanghe-Hougou section (Figure 13), vertically stacked channel complexes dominate the depositional architecture. Stratigraphic surfaces exhibit overall planar geometries with minor concave-downward deflections. The sequence represents a shallow-water delta front environment, with principal microfacies comprising distributary channels and mouth bars. Frontal distributary channels exceed 400 m in width and 12 m in thickness, showing frequent internal channel migration. The outcrop reveals partial erosion of mouth bar deposits by channel incision. Localized channel abandonment during migration events formed abandoned channel fills, while vertically stacked multi-story channel sands constitute composite channel complexes that closely correspond to the architectural models established in our study area.
(4)
Vertical Stacking of Channel and Sheet Sand
During depositional sequences, younger distributary channels superimpose upon pre-existing sheet sands without complete erosion, forming a channel-sheet stacking configuration. This amalgamation generates composite sand packages of substantial thickness, where the contact interface frequently promotes remaining oil accumulation.
(5)
Lateral Splice of Channels
Under limited accommodation space in shallow-water delta fronts, lateral migration and abutment of distributary channels generate laterally extensive sand bodies. These predominantly exhibit inter-channel edge contacts characterized by abutting boundaries (upper panel, Figure 14). The resulting high inter-sand connectivity minimizes potential for remaining oil enrichment.
In comparison with the western Shiwanghe-Dacun outcrop profile (lower panel of Figure 14), this exposure exhibits a depositional architecture dominated by laterally stacked and incised migratory channels. The stratigraphic surfaces appear generally planar overall, with distributary channels displaying stacked and incised patterns internally. The sedimentary environment is interpreted as a shallow-water delta front, primarily consisting of subaqueous distributary channel microfacies. These channels are notably large-scale, with widths exceeding 500 m (ranging approximately 1–2 km) and thickness greater than 12 m. Frequent channel incision and stacking are observed, with individual erosional units being limited in scale, collectively forming a compound complex resulting from multiple small-scale cut-and-fill events. Additionally, extensive sheet sand deposits have developed along the channel margins.
(6)
Lateral Connection of Channel and Sheet Sand
The combined hydrodynamic processes of lacustrine wave action and fluvial currents rework and redistribute sandy sediments, resulting in the formation of digitate mouth bar complexes (sheet sands) along channel margins or distal frontal zones. These sedimentary bodies exhibit gradual facies transitions with adjacent distributary channels, forming laterally extensive but internally compartmentalized sand packages (Figure 15). The poorly defined lithofacies boundaries and restricted hydraulic connectivity between these depositional units create favorable conditions for remaining oil accumulation along channel marginal zones.
Among the six stacking styles, Lateral Splice of Channels configurations are the most prevalent, accounting for approximately 35% of the interpreted units, followed by Laterally Detached (25%), Vertical Stacking of Channels (20%), vertical stacking of channel and sheet sand (10%), Lateral Connection of Channel and Sheet Sand (5%), and Vertically Disconnected (5%). This distribution underscores the dominance of compartmentalized flow units in the study area.

4. Result

The formation and distribution of remaining oil result from multiple controlling factors, which can be categorized into intrinsic and extrinsic controls: (1) intrinsic factors primarily refer to reservoir heterogeneity, and (2) extrinsic factors involve the compatibility between development strategies (well patterns and production measures) and subsurface reservoir characteristics. Under given development conditions, the spatial distribution of remaining oil is predominantly controlled by reservoir architecture and its resulting heterogeneity in reservoir quality. Therefore, based on the established architectural models of subaqueous distributary channels, this study integrates analysis of perforation zone correlations and production performance data to evaluate injection-production connectivity. Combined with sedimentary facies characterization from cross-sections, these findings provide targeted recommendations for optimizing enhanced oil recovery strategies.
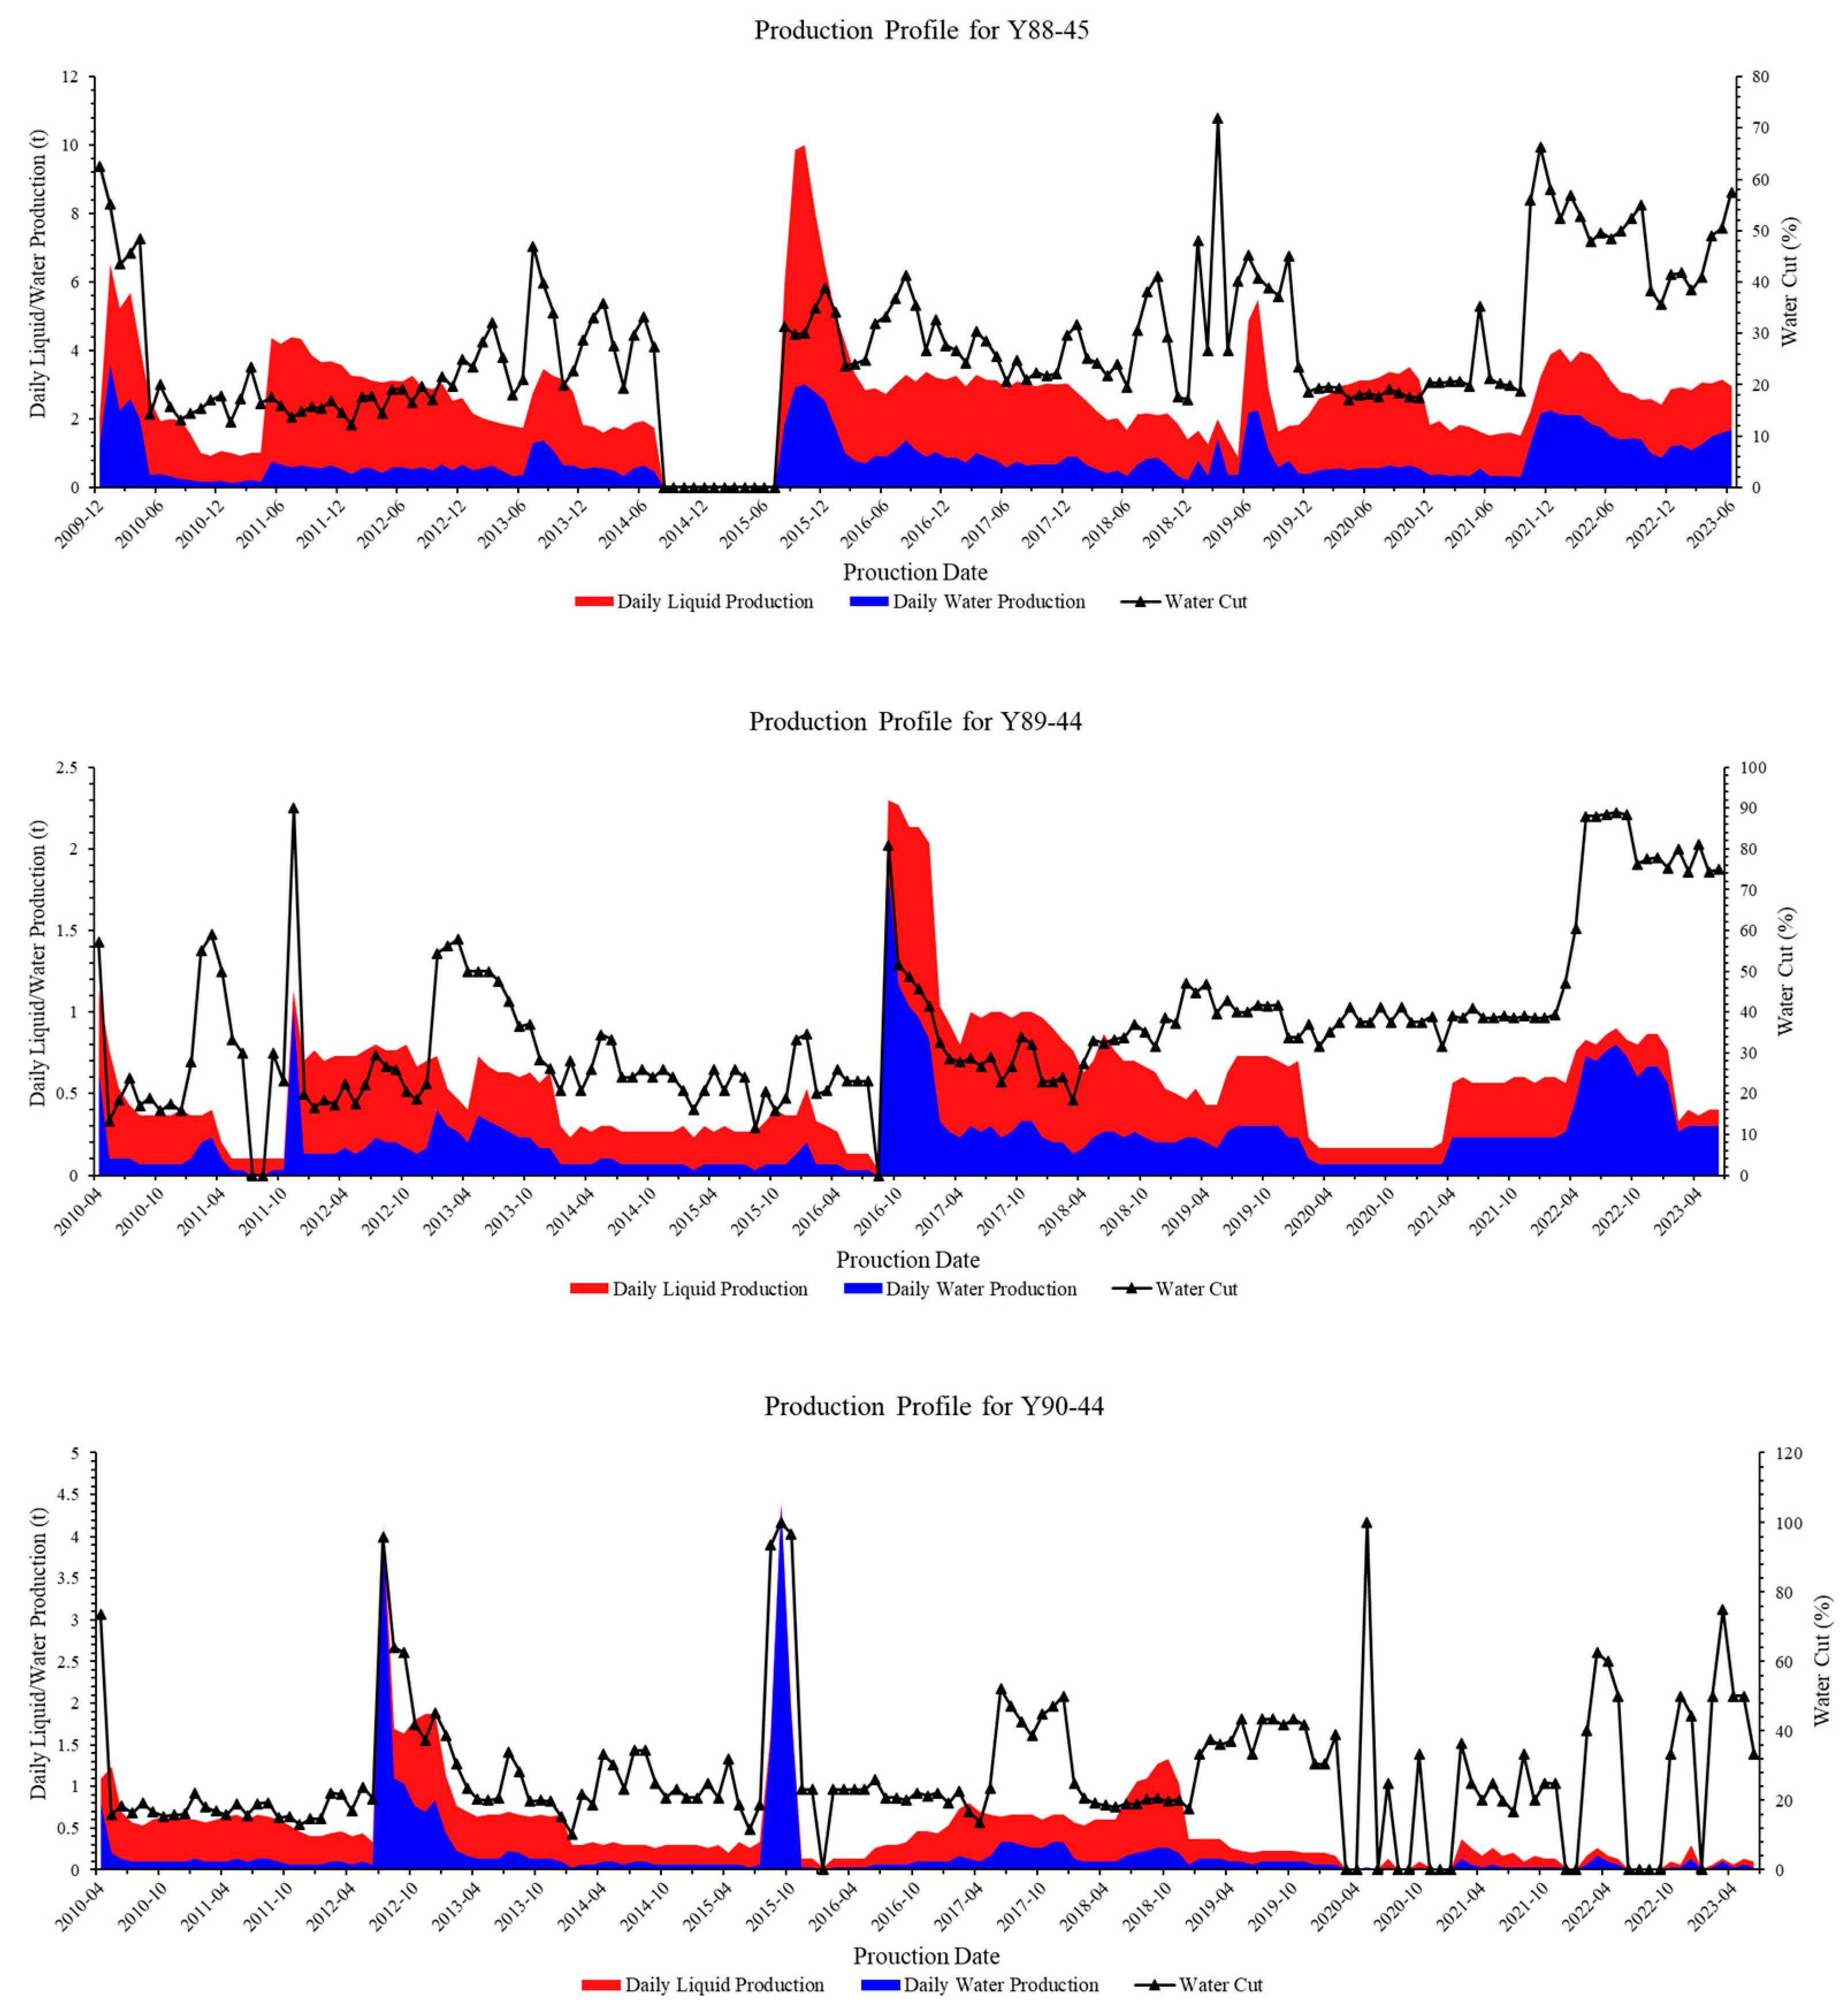
Production performance documented in Figure 16 demonstrates distinctive operational responses and phase connectivity relationships. Well Y88-45 underwent hydraulic fracturing in July 2013, triggering an abrupt surge in liquid production, with an analogous response observed following refracturing in May 2019. Well Y89-44 exhibited simultaneous increases in water cut and liquid production after fracturing during August–September 2016, while intermittent production commencing in May 2018 resulted in progressive output decline. Well Y90-44 displayed elevated production and water cut post-July 2012 fracturing, culminating in peak values during September 2015 following August refracturing, with late-stage intermittent operations subsequently reducing production.
The strikingly similar production trends between Y89-44 and Y90-44 indicate they penetrate the same channel phase. Furthermore, the rising water cut in Y88-45 correlating with increased injection at Y89-45 confirms their hydraulic connectivity within a shared channel system, validating the architectural phase delineation. These dynamic responses substantiate the reservoir compartmentalization model while highlighting pressure communication pathways essential for optimizing recovery strategies.
Additional production data analysis reveals that hydraulic fracturing of Well Y88-43 in October 2013 precipitated an abrupt liquid production surge in November, with an analogous production peak occurring following May 2016 refracturing. Commencing March 2018, intermittent production operations resulted in progressive output decline. Initial water cut measurements near 40% indicate early influence from injector Y87-43, while subsequent robust production responses to sustained water injection demonstrate effective hydraulic connectivity within the sandbody. Similarly, Well Y90-43 exhibits diagnostic production synchronization with injection activities at Y91-43, manifesting as correlated output fluctuations that confirm their occupation of an identical channel phase.
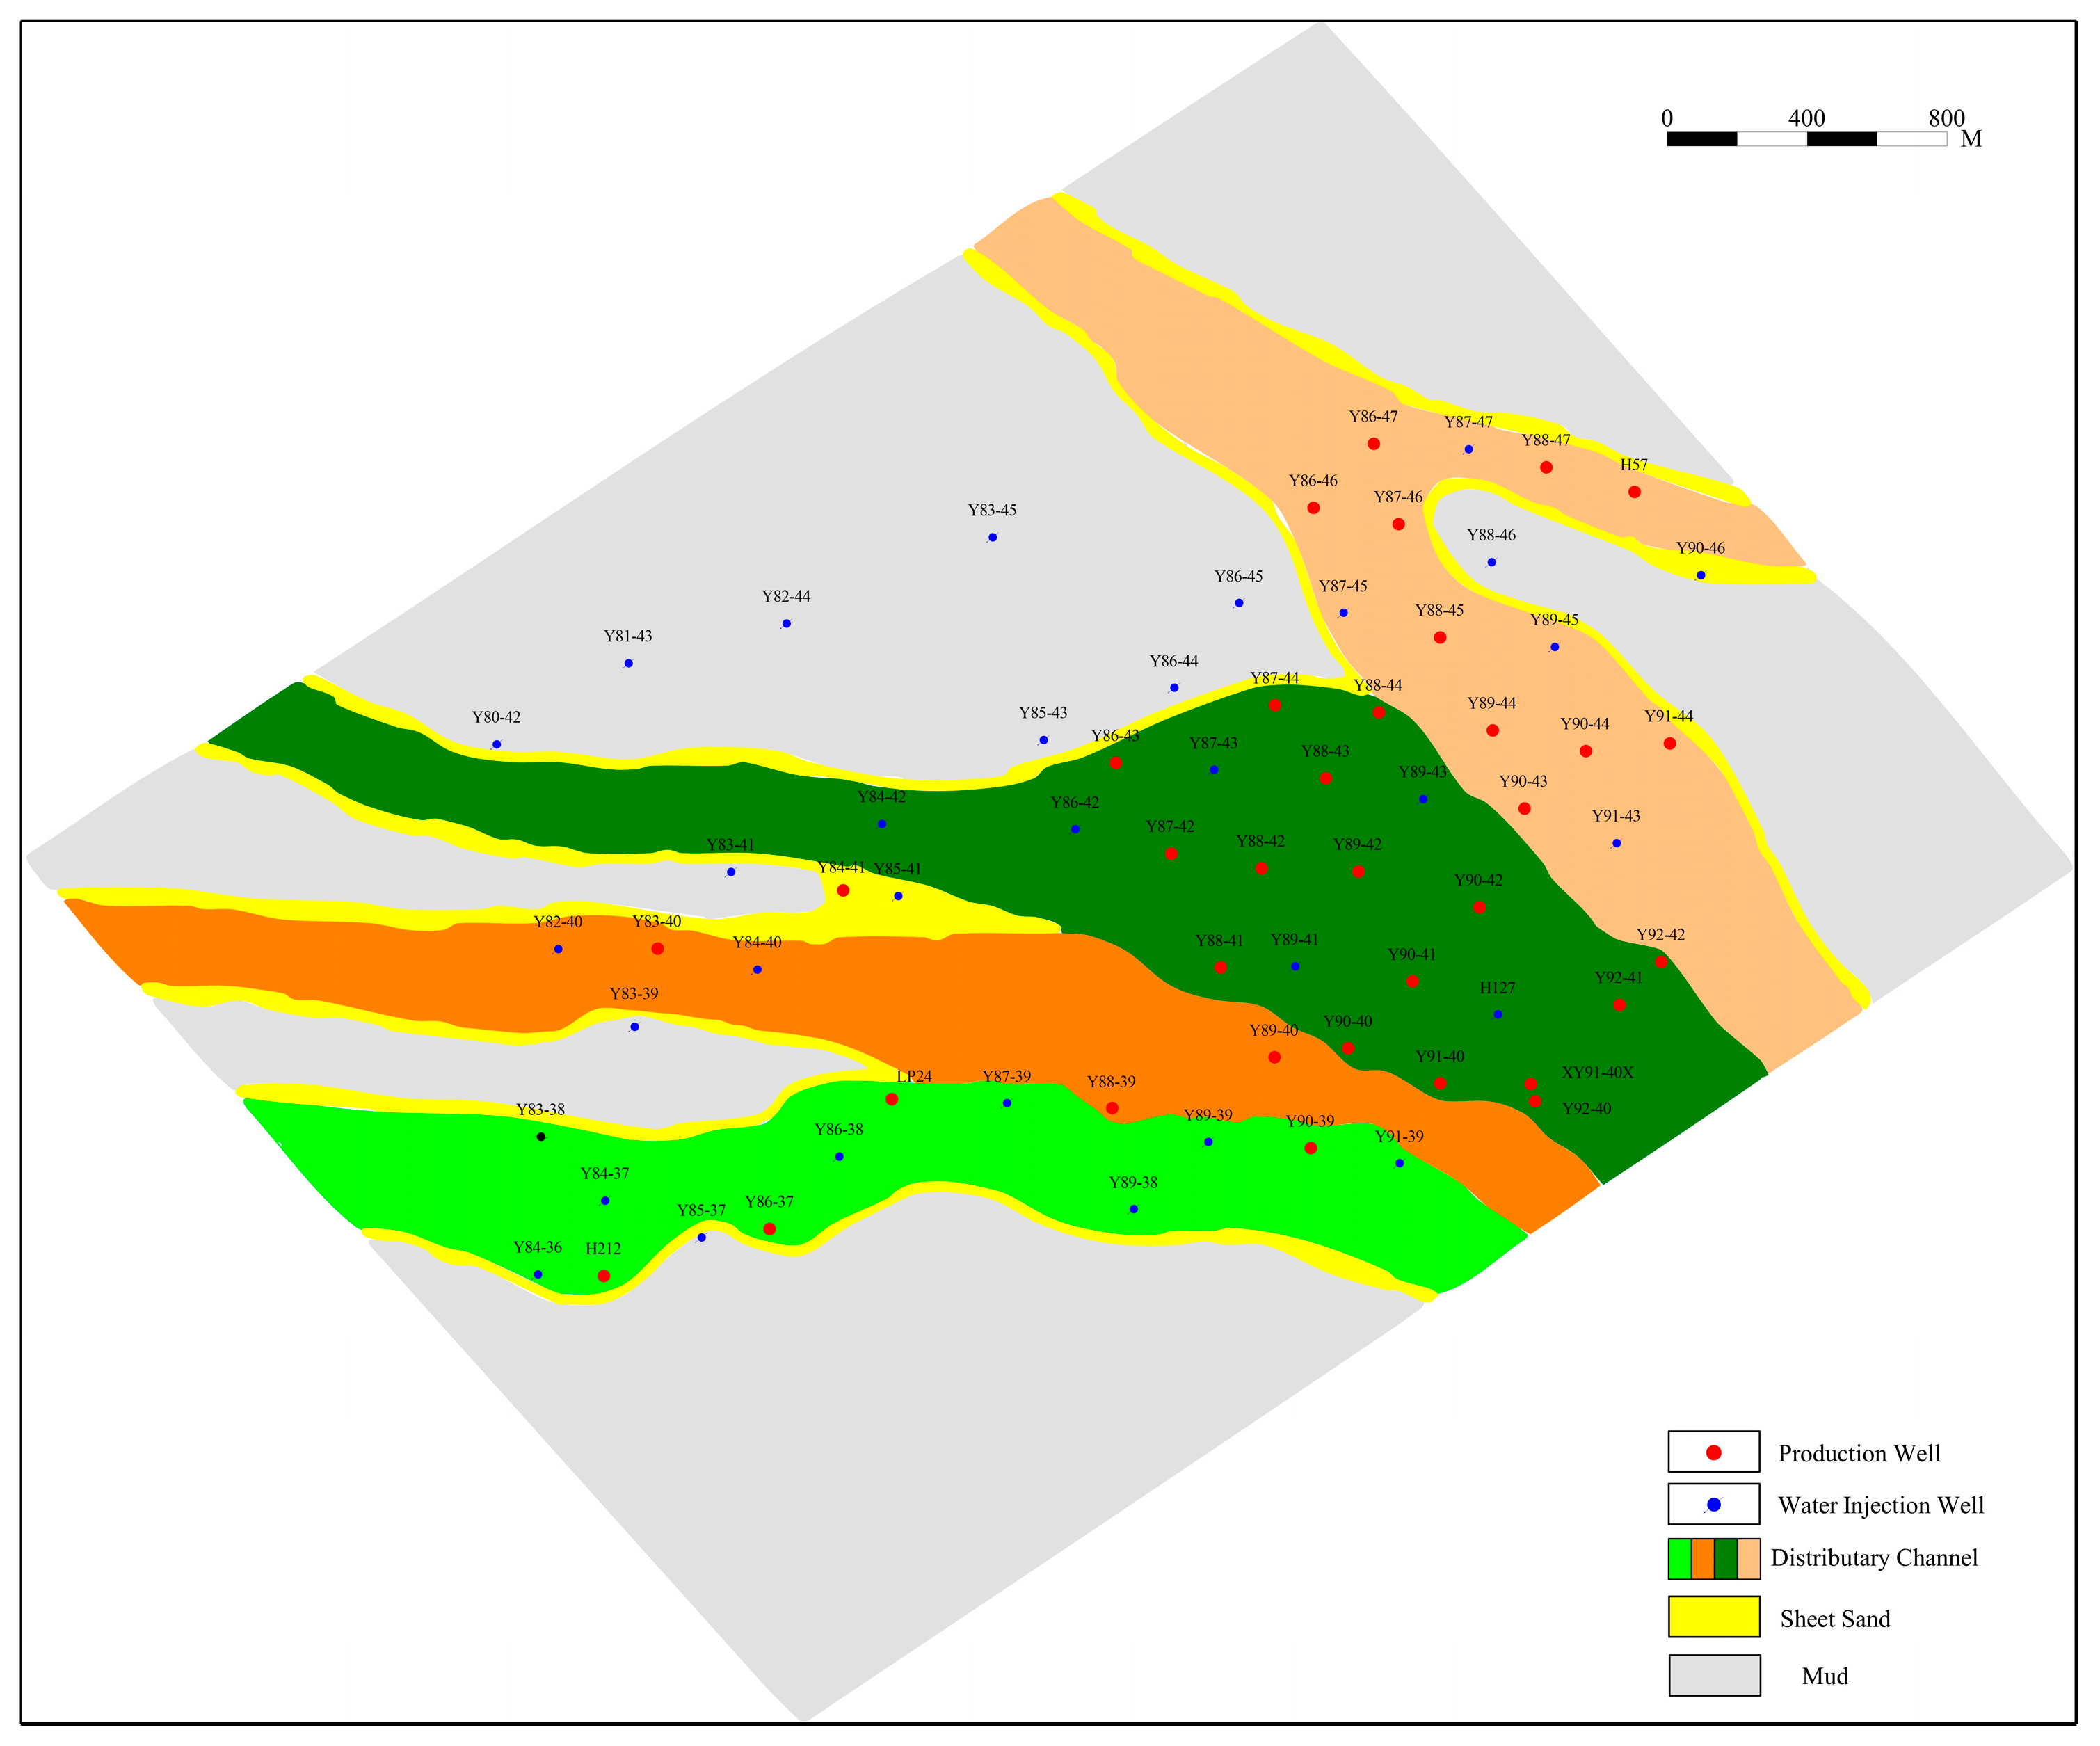
Comprehensive analysis indicates that the injection-production system within the Chang 81212 unit is largely optimized (Figure 17). However, a critical gap exists in the channel segment encompassing Wells Y88-39 and Y89-40, where the absence of dedicated injectors compromises systemic completeness. This configuration creates a potential remaining oil accumulation zone due to inadequate pressure support. To address this deficiency, future development strategies should prioritize either converting existing producers to injection service or deploying new injectors within this target interval, thereby enhancing volumetric sweep efficiency and recovery factor. Pressure data from the Y88-39 and Y89-40 segment confirm inadequate pressure support, with average reservoir pressure measurements 15% lower than in well-connected zones, corroborating the interpreted remaining oil accumulation.

5. Discussion

The reservoir architecture analysis framework and remaining oil distribution model established in this study both inherit from and significantly diverge from previous research. For instance, Zhang et al. and Li et al. achieved notable improvements in reservoir permeability and stimulation effectiveness through stepwise dissolution and integrated pre-acid treatment with proppant fracturing technologies [14], respectively. However, these studies primarily focused on engineering process optimization, paying insufficient attention to the mechanisms by which geological architecture controls fluid flow and remaining oil distribution. In contrast, this study is the first to comprehensively apply five diagnostic criteria for identifying architectural boundaries in the ultra-low permeability reservoirs of the Huang 57 block, clarifying the control of architectural heterogeneity on remaining oil distribution. This approach addresses the lack of geological guidance in conventional engineering techniques. Compared to the quantitative classification of the Chang 6 member reservoirs in the Ordos Basin by Liao Jianbo et al. [12] and the study on the relationship between sedimentary microfacies and connectivity in the Chang 8 group of the Jiyuan Oilfield by Wang Jing et al. [13], this research not only refines the classification of architectural patterns (identifying four stacking styles) but, more importantly, validates the accuracy of the architectural model through production performance data, achieving a transition from static description to dynamic prediction. This methodological advancement provides a directly transferable workflow for the refined development of similar highly heterogeneous reservoirs.

6. Conclusions

This study conducted a detailed investigation of reservoir architecture and remaining oil distribution in the ultra-low permeability reservoirs of the Huang 57 block, Jiyuan Oilfield, Ordos Basin, based on well logging, production data, and sedimentological analysis. The main conclusions are as follows:
(1)
Five logging identification criteria for architectural boundaries of subaqueous distributary channels were established, including lateral variation in sedimentary facies, elevation differences in sandbody tops, abrupt thickness changes, variations in log curve morphology, and differences in hydrocarbon potential, enabling quantitative identification of single-channel boundaries.
(2)
Two genetic architectural patterns—isolated and amalgamated—were identified in the study area, which can be further subdivided into four distinct stacking styles. Among these, the lateral connection of channel and sheet sand is the predominant configuration.
(3)
Architectural heterogeneity controls the distribution of remaining oil, which is primarily enriched along channel margins, near architectural boundaries, and in unswept areas with poor injection–production connectivity.
(4)
Dynamic production responses (e.g., changes in fluid production after fracturing in Well Y88-45 and water breakthrough patterns in Well Y89-44) effectively validated the reliability of the architectural classification, indicating that architectural interfaces are key barriers influencing fluid flow.
The practical significance of this study lies in providing targeted adjustment strategies based on architectural dissection for ultra-low permeability reservoirs. For isolated channels and poorly connected zones, measures such as diverting fracturing, precise water shut-off, or infill drilling are recommended. For areas with incomplete injection–production systems (e.g., the well segment between Y88-39 and Y89-40), converting producers to injectors or adding new injection points is suggested to enhance volumetric sweep efficiency and recovery factors. The findings are not only applicable to the Huang 57 block but also offer valuable insights for the efficient development of similar highly heterogeneous low- and ultra-low permeability reservoirs.
Future research should focus on (1) integrating architectural models with numerical simulation to quantitatively predict remaining oil distribution; (2) exploring optimized fracturing design methods guided by architectural characteristics; and (3) conducting development adjustment trials based on architectural models in this area and other analogous oilfields to further validate the applicability and economic benefits of the proposed methodology.

Author Contributions

Conceptualization, L.W.; methodology, Y.Y.; software, X.W.; validation, G.X. and P.X.; writing—original draft preparation, L.W. and G.X.; writing—review and editing, X.H.; supervision, Y.Y.; project administration, L.W.; funding acquisition, L.W. All authors have read and agreed to the published version of the manuscript.

Funding

This study was supported by the National Nature Science Foundation of China (42402153), and Open Fund of Key Laboratory of Exploration Technologies for Oil and Gas Resources (Yangtze University), Ministry of Education (No. K2023-06).

Data Availability Statement

All data generated or analyses during this study are included in this published article.

Conflicts of Interest

Xinyu Wang was employed by PetroChina Daqing Oilfield Co., Ltd. The remaining authors declare that the research was conducted in the absence of any commercial or financial relationships that could be construed as a potential conflict of interest.

References

  1. Zou, C.; Zhao, W.; Zhang, X.; Luo, P.; Wang, L.; Liu, L.; Xue, S.; Yuan, X.; Zhu, R.; Tao, S. Formation and Distribution of Shalow-water Deltas and Centra-basin Sandbodies in Large Open Depression Lake Basins. Acta Geol. Sin. 2008, 28, 813–825. [Google Scholar]
  2. Wang, C.; Dan, W.; Fang, Y.; Zhang, Z. Sedimentary characteristics and geological significance of shallow water delta of Chang8 oil formation in Ordos Basin. J. Oil Gas Technol. 2013, 35, 12–15. [Google Scholar]
  3. Guo, Y.; Li, B.; Li, B.; Li, W.; Cao, H.; Liao, Y.; Wu, Z.; Fei, S.; Zhang, Q.; Chen, Q. Sedimentary system and palaeogeographic evolution of ordos basin, northern china. J. Palaeogeogr. (Chin. Ed.) 2025, 14, 501–534. [Google Scholar] [CrossRef]
  4. Wang, J.; Wang, L.; Yin, Y.; Xie, P.; Xiong, G. Comprehensive Reservoir Architecture Dissection and Microfacies Analysis of the Chang 8 Oil Group in the Luo 1 Well Area, Jiyuan Oilfield. Appl. Sci. 2025, 15, 1082. [Google Scholar] [CrossRef]
  5. Liu, G.; Gao, W.; Zhang, D.; Chen, L.; Li, A. Sandbody structure and its genesis of shallow-water delta of Chang 8, reservoir in Jiyuan area, Ordos Basin. Lithol. Reserv. 2019, 31, 16–23. [Google Scholar]
  6. Li, Y.; Liu, C.; Du, Y.; Wang, X.; Huang, J. Sedimentary characteristics of shallow water delta and lake shoreline control on sandbodies of Chang 8 oil-bearing in tervalof the Upper Triassic Yanchang Fomation in northwestern Ordos Basin. J. Palaeogeogr. (Chin. Ed.) 2009, 11, 265–274. [Google Scholar]
  7. Liu, Z.; Li, X.; Zheng, R.; Liu, H.; Yang, Z. Sedimentary characteristics and models of shallow water delta front subfacies reservoirs: A case study of Sapugao oil layer in north-II block of Sabei oilfield, Daging placanticline. Lithol. Reserv. 2022, 34, 1–13. [Google Scholar]
  8. Zhou, X.; Liu, L.; Wang, J.; Dai, J.; Lan, C. Storm deposits in wide and shallow lacustrine environment in Yanchang Formation, Ordos Basin. Sci. Technol. Rev. 2016, 34, 203–208. [Google Scholar]
  9. Fu, C. Depositional architecture of aggrading delta front distributary channels and corresponding depositional evolution process in ordos basin: Implications for deltaic reservoir prediction. Water 2025, 17, 528. [Google Scholar] [CrossRef]
  10. Zhang, Y.; Bao, Z.; Dou, L.; Jiang, L.; Zhang, L. Hydrodynamics and deposition in lacustrine shallow-water delta front: A combination of numerical simulations and modern sedimentation measurements. Interpretation 2020, 8, SM39–SM52. [Google Scholar] [CrossRef]
  11. Chen, Z.; Zhang, J.; Yong, Z.; Ma, H. Tight Sandstone Reservoir Characteristics and Sand Body Distribution of the Eighth Member of Permian Shihezi Formation in the Longdong Area, Ordos Basin. Minerals 2025, 15, 463. [Google Scholar] [CrossRef]
  12. Liao, J.; Hong, L.; Li, Z.; Tan, K.; Zhao, L.; Yang, J.; Yu, P. Characterization of ultra-low permeability tight sandstone reservoir properties and criteria for hydrocarbon accumulation in Chang 6 member, Huaqing area, Ordos basin. Front. Earth Sci. 2022, 10, 1013776. [Google Scholar] [CrossRef]
  13. Zhang, S.; Fang, Z. Permeability damage micro-mechanisms and stimulation of low-permeability sandstone reservoirs: A case study from Jiyang Depression, Bohai Bay Basin, China. Pet. Explor. Dev. 2020, 47, 374–382. [Google Scholar] [CrossRef]
  14. Li, N.; Chen, F.; Yu, J.; Han, P.; Kang, J. Pre-acid system for improving the hydraulic fracturing effect in low-permeability tight gas reservoir. J. Pet. Explor. Prod. 2021, 11, 1761–1780. [Google Scholar] [CrossRef]
  15. Li, C.; Li, W.; Ye, H.; Zhu, Q.; Shan, X.; Wang, S.; Wang, D.; Zhang, Z.; Wang, H.; Zhou, X. Reservoir Architecture of Turbidite Lobes and Remaining Oil Distribution: A Study on the B Formation for Z Oilfield of the Illizi Basin, Algeria. Processes 2025, 13, 805. [Google Scholar] [CrossRef]
  16. Hicks, N.; Green, A. Sedimentology and depositional architecture of a submarine delta-fan complex in the Durban Basin, South Africa. Mar. Pet. Geol. 2016, 78, 390–404. [Google Scholar] [CrossRef]
  17. Zhao, J.; Zhang, L.; Tian, L.; Yang, Y.; Chen, G. Distributary channel type and high-quality reservoirs in tight sandstone—A case study on the outcrops and reservoirs of xujiahe formation in western sichuan basin. Energy Sci. Eng. 2024, 12, 5119–5144. [Google Scholar] [CrossRef]
  18. Miall, A.D. A review of the braided-river depositional environment. Earth-Sci. Rev. 1977, 13, 1–62. [Google Scholar] [CrossRef]
  19. Guo, J.; Li, J.; Wang, Z.; Gong, D. Architectural Characterization of Braided River Reservoirs in the Southern Area of the Gu Islands Oilfield. Sci. Technol. Eng. 2023, 23, 8148–8161. [Google Scholar]
  20. Xu, Z.; Wu, S.; Liu, Z. Sandbody architecture of the bar finger within shoal water delta front: Insights from the Lower Member of Minghuazhen Formation, Neogene, Bohai BZ25 Oilfield, Bohai Bay Basin, East China. Pet. Explor. Dev. 2019, 46, 322–333. [Google Scholar] [CrossRef]
  21. Wu, F.; Li, W.; Li, Y.; Xi, S. Delta sediments and evolution of the Yanchang Formation of Upper Triassic in Ordos Basin. J. Palaeogeogr. (Chin. Ed.) 2004, 6, 307–315. [Google Scholar]
  22. Yin, Y.; Ding, W.; An, X.; Xu, Z. Configuration characterization of Triassic Chang 611 reservoir in Sai 160 well area of Ansai oilfield, Ordos Basin. Lithol. Reserv. 2023, 35, 37–49. [Google Scholar]
  23. Zhu, Y.; Zhao, Z.; Zhang, D.; Chen, G.; Liu, C.; Zhang, L.; Yu, S.; Ma, X.; Li, Q. Accumulation conditions and accumulation laws of tight cas in Shenfu area. Northeast of Ordos Basin. China Offshore Oil Gas 2022, 34, 55–64. [Google Scholar]
  24. Liu, J.; Xu, S. Reservoir sedimentary model of fluvial facies and it’s control to remaining oil distribution. Acta Pet. Sin. 2003, 24, 58–62. [Google Scholar]
  25. Zhu, X.; Pan, R.; Zhao, D.; Liu, F.; Wu, D.; Li, Y.; Wang, R. Formation and development of shallow-water deltas in lacustrine basin and typical case analyses. J. China Univ. Pet. 2013, 37, 7–14. [Google Scholar]
  26. Mamdouh, M.; Othman, A.; Mostafa, T. Multidisciplinary 3D geological-petrophysical reservoir characterization of Abu Sennan Field, Abu Gharadig Basin, Egypt. Sci. Rep. 2025, 15, 28896. [Google Scholar] [CrossRef] [PubMed]
  27. Wu, S.; Xu, Z.; Liu, Z. Depositional architecture of fluvial-dominated shoal water delta. J. Palaeogeogr. (Chin. Ed.) 2019, 21, 202–215. [Google Scholar]
  28. Yang, Z.; Dong, G.; Zeng, L.; Qiu, Y.; Guo, C.; Ma, Z.; Wang, T.; Yang, X.; Ran, S.; Zhao, X. Identification and sedimentary model of shallow-water deltas: A case study of the funing formation, subei basin, northeast china. Minerals 2025, 15, 207. [Google Scholar] [CrossRef]
  29. Nichols, G.; Fisher, J. Processes, facies and architecture of fluvial distributary system deposits. Sediment. Geol. 2007, 195, 75–90. [Google Scholar] [CrossRef]
  30. Steel, R.; Osman, A.; Rossi, V.M.; Alabdullatif, J.; Olariu, C.; Peng, Y.; Rey, F. Subaqueous deltas in the stratigraphic record: Catching up with the marine geologists. Earth-Sci. Rev. 2024, 256, 104879. [Google Scholar] [CrossRef]
  31. Liu, Z.; Shen, F.; Zhu, X.; Liao, J.; Zhang, X.; Meng, H. Progress of shallow-water delta research and a case study of continental lake basin. Oil Gas Geol. 2015, 36, 596–604. [Google Scholar]
  32. Li, X.; Li, F.; Huang, Z.; Ji, H.; Wang, H.; Chen, L.; Zhang, Z.; Shi, X. Characterization and simulation of conglomerate reservoirs using core data of Triassic Baikouquan Formation, Mahu Depression. Sci. Rep. 2025, 15, 29293. [Google Scholar] [CrossRef]
  33. Cai, Q.; Hu, M.; Chen, X.; Hu, Z. Sedimentary characteristics and development model of fan delta in small faulted basin: A case of Shahezi Formation in northern Xujiaweizi Fault Depression, NE China. Lithol. Reserv. 2018, 30, 86–96. [Google Scholar]
  34. Li, W.; Zhu, X.; Chen, G.; Ma, Y. Research based on lsochronous Surface about Shallow-water Deltas and Fluvial Sedimentary System: A case from Duo1 Member of Paleogene in Huangjue Area, Gaoyou Sag. Acta Sedimentol. Sin. 2018, 36, 110–119. [Google Scholar]
  35. He, T.; Li, S.; Gao, X.; Song, C.; Zhou, X.; He, D. Types and superposed patterns of distributary channels in a shallow lacustrine delta plain. J. Palaeogeogr. (Chin. Ed.) 2014, 16, 597–604. [Google Scholar]
  36. Liu, Q.; Wang, B.; Ruan, J.; Yan, N.; Zhu, Y. Spatial combination modes of single sandbodies in underwater distributary channels and its influence on distribution characteristics of remaining oil of Chang8-2 in L158 Block, Huanjiang Oilfield. Pet. Geol. Recovery Effic. 2022, 29, 23–33. [Google Scholar]
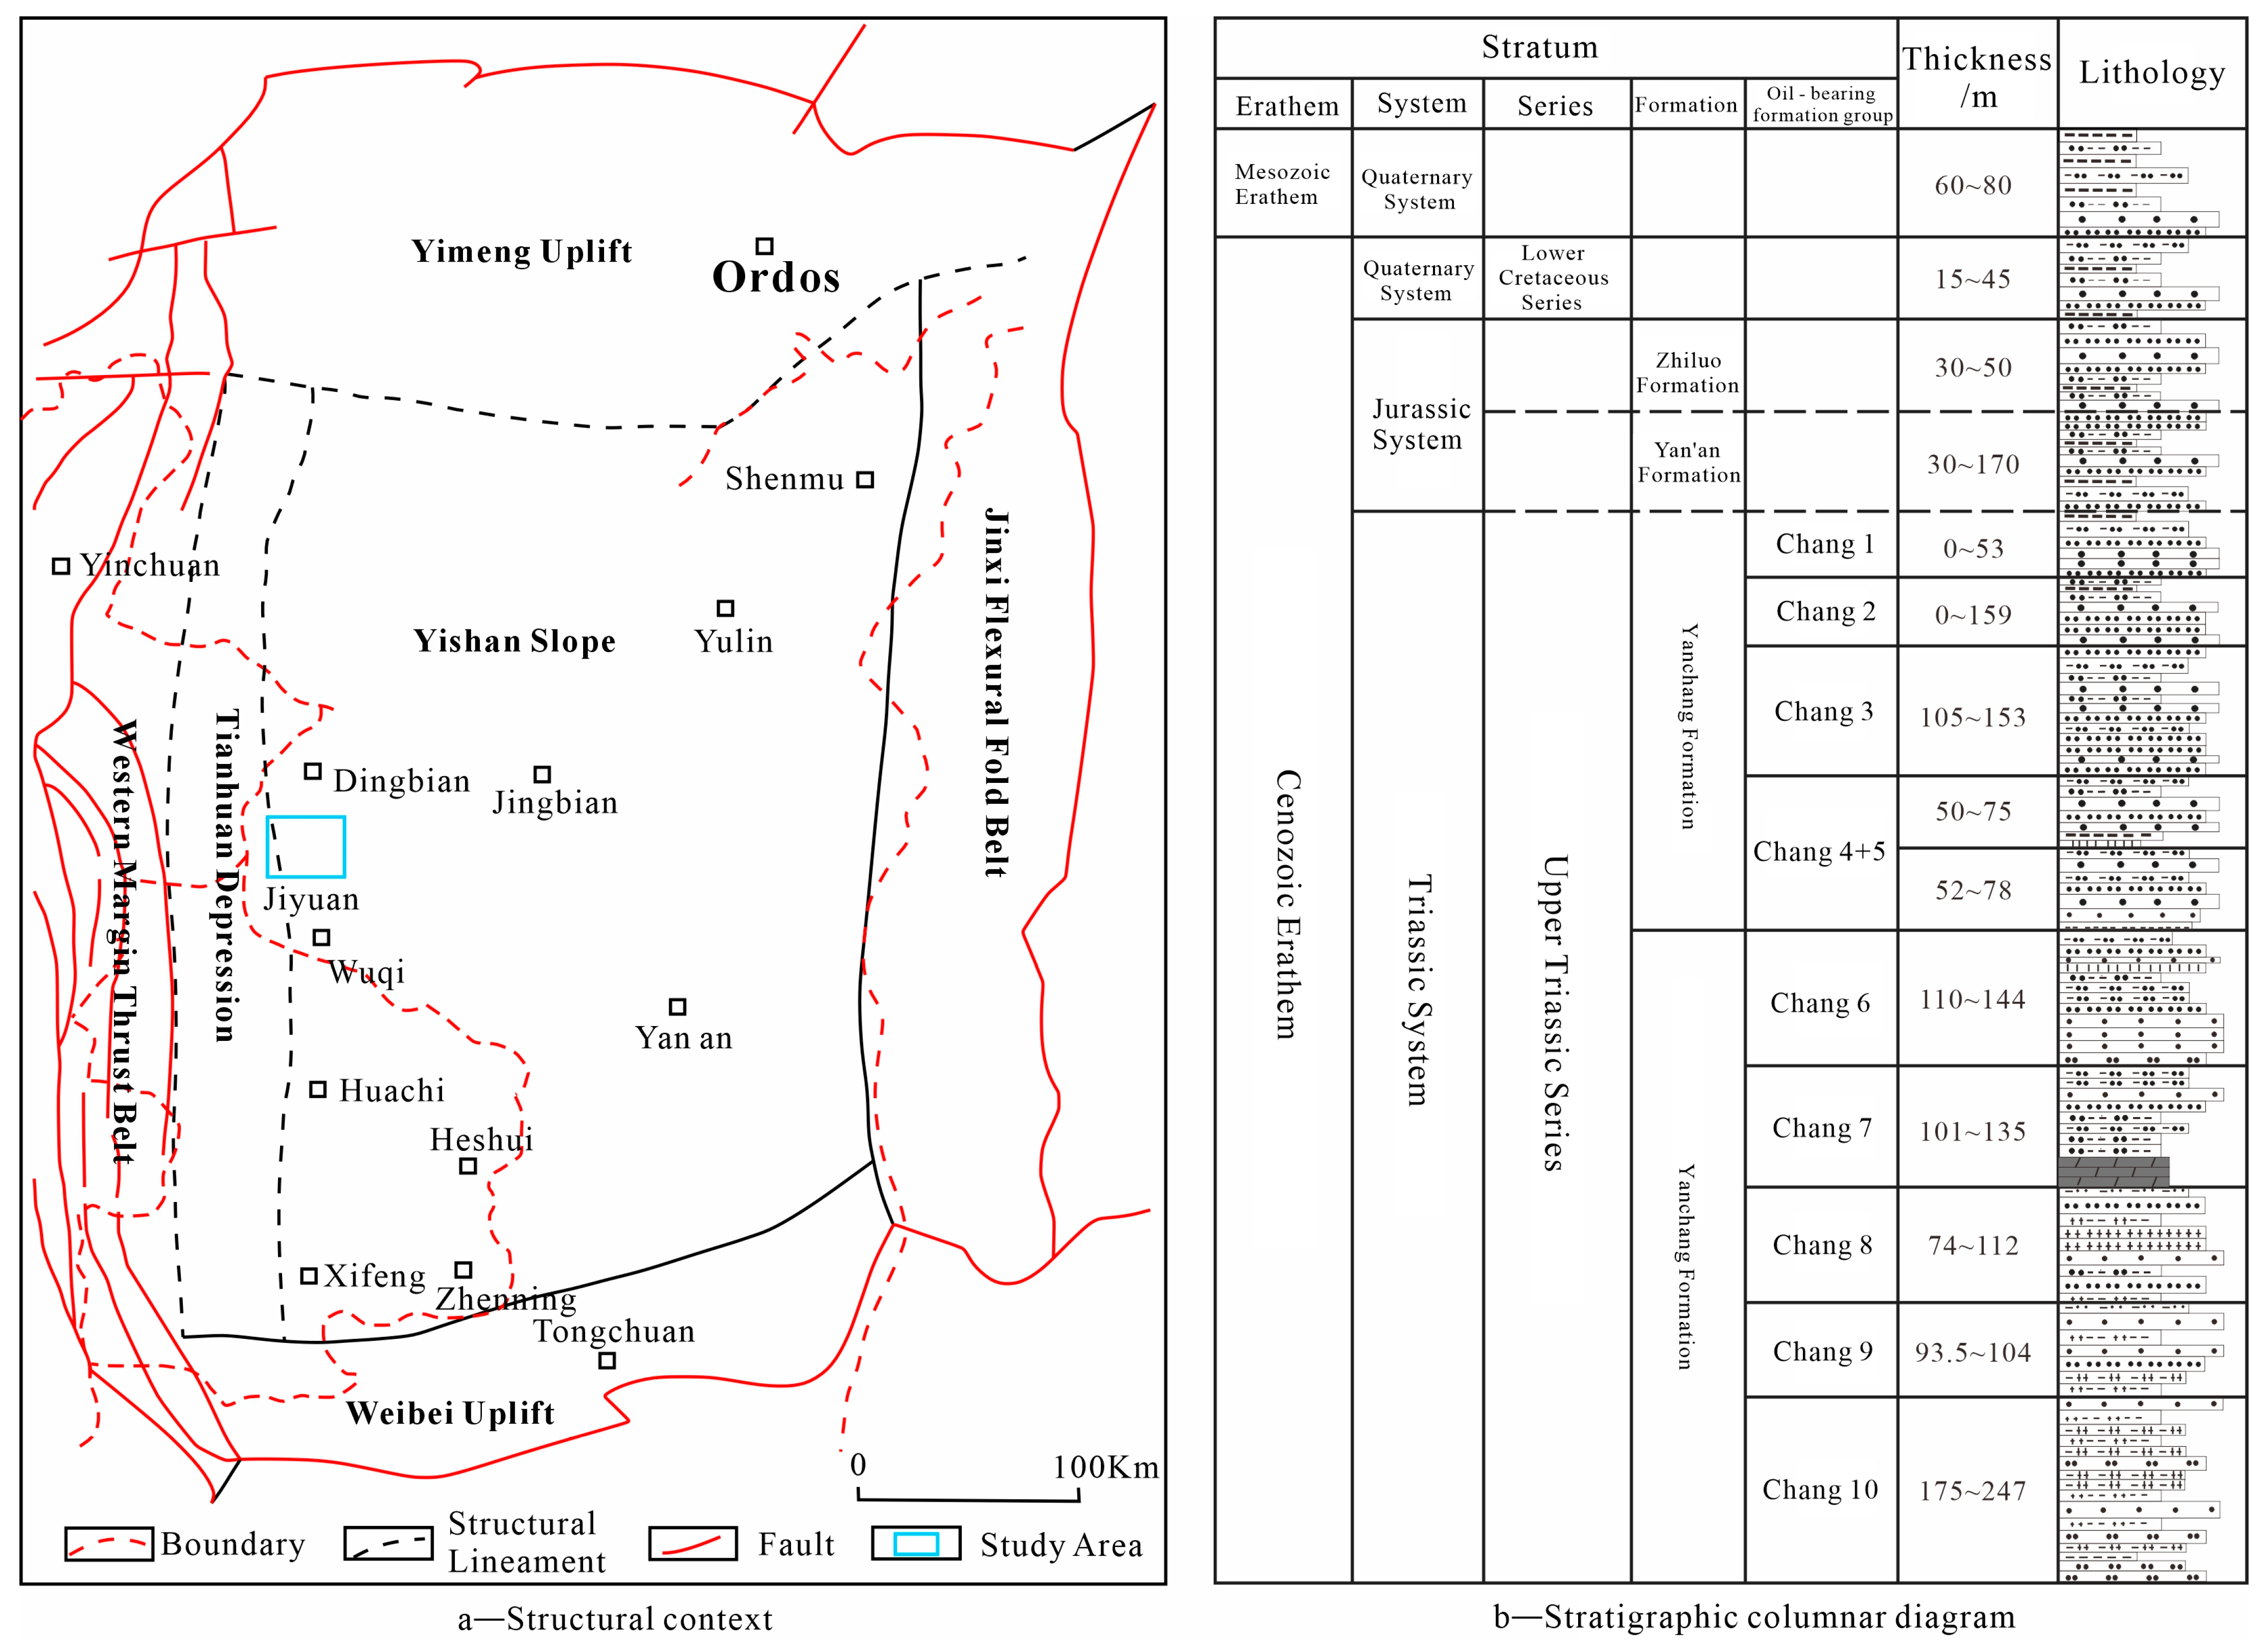
Figure 1. Structural location and stratigraphic column of the study area.
Applsci 15 10828 g001
Figure 2. Microfacies interpretation template.
Applsci 15 10828 g002
Figure 3. Sandbody thickness contour map of the Chang 81212 single sand layer.
Applsci 15 10828 g003
Figure 4. Elevation difference contour map of the sandbody top.
Applsci 15 10828 g004
Figure 5. Sandbody thickness variation map.
Applsci 15 10828 g005
Figure 6. Comparison of log curve morphologies.
Applsci 15 10828 g006
Figure 7. Comparison of sandbody hydrocarbon potential.
Applsci 15 10828 g007
Figure 8. Architectural analysis results of the Chang 81212 layer. (a) Sandbody architectural model-cross-sectional view; (b) Sandbody architectural model–plan view.
Applsci 15 10828 g008
Figure 9. Schematic diagram of channel width and thickness statistics and relationships.
Applsci 15 10828 g009
Figure 10. Validation results of horizontal well LP24. (a) Sandbody architectural model–plan view; (b) Sandbody architectural model-cross-sectional view; (c) Interpretation results of horizontal well.
Applsci 15 10828 g010
Figure 11. Architectural cross-section of laterally detached channels. (a) Sandbody architectural model-cross-sectional view; (b) Sandbody architectural model–plan view.
Applsci 15 10828 g011
Figure 12. Architectural cross-section of vertically isolated channels.
Applsci 15 10828 g012
Figure 13. Geological outcrop profile of the eastern Shiwang River-Hougou area.
Applsci 15 10828 g013
Figure 14. Outcrop interpretation of western Shiwanghe-Dacun area and well-tie interpretation of the study area. (a) channel-channel splicing (upper); (b) Shiwanghe-Dacunxi section (lower).
Applsci 15 10828 g014
Figure 15. Architectural interpretation of the well-tie profile for wells Y86-46—Y92-40.
Applsci 15 10828 g015
Figure 16. Historical production profiles for wells Y88-45, Y89-44, and Y90-44.
Applsci 15 10828 g016
Figure 17. Sedimentary microfacies distribution map of the Chang 81212 layer.
Applsci 15 10828 g017
Disclaimer/Publisher’s Note: The statements, opinions and data contained in all publications are solely those of the individual author(s) and contributor(s) and not of MDPI and/or the editor(s). MDPI and/or the editor(s) disclaim responsibility for any injury to people or property resulting from any ideas, methods, instructions or products referred to in the content.