Abstract
Urban areas are increasingly challenged by the combined effects of climate change, rapid population growth, and high energy demand. The integration of renewable energy systems, such as photovoltaic (PV) panels, and nature-based solutions, such as green roofs, represents a key strategy for sustainable urban development. This study evaluates the spatial potential for PV and green roof implementation in Iași, Romania, using moderate to high-resolution geospatial datasets, including the ALOS AW3D30 Digital Surface Model (DSM) and the Copernicus Urban Atlas 2018, processed in ArcMap 10.8.1 and ArcGIS Pro 2.6.0. Solar radiation was computed using the Area Solar Radiation tool for the average year 2023, while roof typology (flat vs. pitched) was derived from slope analysis. Results show significant spatial heterogeneity. The Copou neighborhood has the highest PV-suitable roof share (73.6%) and also leads in green roof potential (46.6%). Integrating PV and green roofs can provide synergistic benefits, improving energy performance, mitigating urban heat islands, managing stormwater, and enhancing biodiversity. These findings provide actionable insights for urban planners and policymakers aiming to prioritize green infrastructure investments and accelerate the local energy transition.
1. Introduction
Urban areas face increasing challenges related to climate change, including heat stress, flooding, and energy inefficiency. Green roofs and photovoltaic (PV) systems are widely recognized as nature-based and technological solutions that mitigate these impacts [1]. This study builds on established knowledge while providing an integrated spatial analysis of both strategies for Iași, Romania. Although recent advances in remote sensing and GIS enable highly detailed 3D city mapping through LiDAR or stereo-photogrammetry [2], such high-resolution datasets are not yet available for many medium-sized Eastern European cities, including Iași. In this context, the present study relies on the ALOS AW3D30 DSM with a 30 m resolution. While this represents a coarse scale for rooftop-level assessments, it provides a reproducible and accessible baseline for large-area analysis in the absence of LiDAR data. By explicitly acknowledging these limitations, the study positions itself as a first exploratory step toward quantifying rooftop photovoltaic and green roof potential in Iași. Solar photovoltaic (PV) technologies are increasingly adopted for their rapidly declining costs and strong policy support worldwide. Installation costs have dropped by over 80% in the last decade, making solar energy the cheapest source of electricity today [3,4,5]. At the same time, large-scale studies show that rooftop PV could cover up to 24% of the EU’s electricity demand [6]. Green roofs provide multiple adaptation benefits: reducing building energy demand, retaining 40–80% of precipitation annually [7], lowering roof surface temperatures by several degrees [8,9], and improving biodiversity [10,11,12]. Recent work highlights their potential role in carbon sequestration and multifunctional uses, such as rooftop farming, which can simultaneously mitigate the urban heat island effect [13,14,15] and increase food production [16]. GIS-based methods are increasingly used to identify suitable roof surfaces, considering slope, area, water access, and urban functional zones [17]. To properly address these objectives, it is essential to establish clear and transparent criteria for defining when a rooftop can be considered suitable [18]. Recent literature indicates that, for photovoltaic systems, the key factors include a minimum annual solar radiation threshold of ≥1000 kWh/m2/year (≈114 W/m2), roof slope (with ≥20° generally favorable for optimal solar capture in Romania), orientation towards the south or southwest, the avoidance of significant shading, the availability of a minimum continuous surface area (>10 m2), and sufficient structural durability to accommodate an additional load of 15–25 kg/m2 [19]. In the case of green roofs, the slope criterion serves primarily as a delimiter: flat or nearly flat roofs (≤20°) are considered suitable for the implementation of extensive systems, while pitched roofs (>20°) are generally excluded from feasibility. Additional technical requirements include adequate load-bearing capacity (>60 kg/m2 for extensive systems), substrate thickness (50–150 mm), and the presence of reliable drainage and waterproofing layers [20,21]. By integrating these quantitative thresholds, the study strengthens methodological rigor and ensures comparability with international approaches, while also clarifying the specific conditions under which PV and green roof solutions can realistically be implemented in Iași.
Despite an abundance of research on urban green infrastructure and renewable energy, the geographic coverage of these studies is uneven. The literature has concentrated predominantly on megacities in the developed world (Western Europe, North America, and East Asia) and on national capitals, where environmental concerns have driven early “smart city” or “green city” initiatives. In contrast, medium-sized cities in Eastern Europe have benefited from fewer applied studies of urban green technologies. Romania, for example, has considerable solar energy potential and had already met the EU’s 2020 renewable energy targets for renewables by 2017 [22], yet research on integrating photovoltaic panels and green roofs in the built environment has largely been limited to high-level national strategies or to the context of the capital city (Bucharest). There are some green–blue infrastructure planning initiatives for the Bucharest metropolitan area and isolated studies on the dynamics of urban green spaces in post-socialist cities. However, quantitative approaches that combine LiDAR/DSM data with thematic urban maps to directly assess rooftop solar and green roof potential remain rare in secondary cities of the region. Another notable gap in the literature concerns validation. While many GIS-based assessments quantify technical potential, few verify their findings against actual photovoltaic installations or green roof deployments, especially in the Romanian context. In Iași, there is currently no systematic comparison between modeled PV-suitable rooftops and existing solar arrays. This study acknowledges this limitation and seeks to address the gap by highlighting the importance of linking geospatial analysis with real-world implementation data, thereby offering a more realistic perspective for policymakers. The municipality of Iași—Romania’s second-largest city, with around 400,000 inhabitants and a major university center—illustrates this gap. Despite facing common urban challenges (pollution, traffic congestion, insufficient per capita green space) and benefiting from favorable geographic conditions for solar energy, no comprehensive study has yet evaluated the neighborhood-scale potential for green technologies. This is significant because medium-sized cities like Iași concentrate a large share of Europe’s urban population [23] and play an essential role in the green transition [24], requiring context-specific policies tailored to local economic, social, and climatic conditions [25]. Compared to megacities, medium-sized urban centers often face more acute constraints, such as limited financial and technical resources, less specialized infrastructure, and faster demographic or spatial transformations. These characteristics make the deployment of renewable energy and green infrastructure both urgent and highly representative of challenges faced by many European cities of similar scale. To address this need, the present study evaluates rooftop solar potential by generating a solar radiation map for Iași’s buildings using ArcMap 10.8.1. The DSM of Iași combined with building footprints, was used to isolate rooftop elevations. Although the ALOS AW3D30 DSM offers only moderate resolution, it provides a practical and reproducible solution in the absence of local LiDAR data. Similarly, NextGIS Data building footprints, while subject to positional inaccuracies due to crowdsourcing, constitute an accessible and comprehensive dataset where official cadastral records are lacking. By acknowledging these limitations, the study ensures transparency while providing meaningful insights into neighborhood-scale solar suitability.
2. Materials and Methods
2.1. The Location of Iași Municipality
Iași is situated in the northeastern part of Romania (Moldavia region), Figure 1, and has a humid continental climate with four distinct seasons; summers are warm (often exceeding 35 °C) and winters are cold, with moderate snowfall and nighttime temperatures below −15 °C [26]. Annual precipitation is relatively modest (around 521 mm per year) in Iași [27], and the city enjoys roughly 2100 sunshine hours annually [28] (about 210 sunny days). This geographical setting yields a moderate solar energy influx on horizontal surfaces (~1000–1300 kWh/m2/year), with around 600–800 kWh/m2/year of that total being practically exploitable for photovoltaics. Such solar potential indicates favorable conditions for PV panel deployment as a renewable energy solution in the Iași area. Furthermore, the region’s climate variability—alternating dry spells with intense rainfall events—highlights the need for nature-based urban adaptations; green roofs can alleviate urban heat island effects [29] during hot summers and reduce stormwater runoff by retaining precipitation and enhancing evapotranspiration [30,31]. These features underscore how Iași’s geographic and climatic profile is well-suited for integrating photovoltaic systems and green roofs as complementary sustainability measures in urban development.
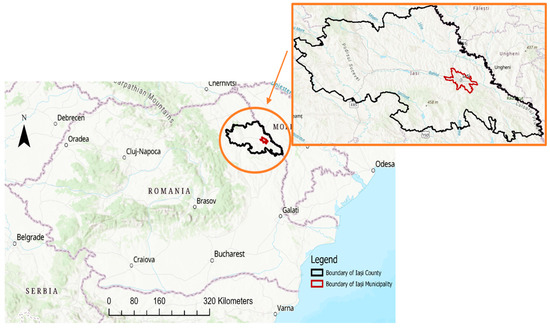
Figure 1.
The location of Iași Municipality.
2.2. Data Sources and Processing
The geospatial analysis was conducted for the Iași municipality, focusing on its urban neighborhoods as the study units. Various spatial datasets and GIS software, ArcGis Pro 2.6.0, were utilized to ensure a comprehensive evaluation. A digital surface model (DSM), Figure 2, of the study area with approximately 30 m resolution (ALOS World 3D—30 m, AW3D30) was obtained from the Japan Aerospace Exploration Agency (JAXA) and used as the primary elevation source [32]. The DSM represents a digital surface model, capturing both buildings and vegetation, rather than a bare-earth digital terrain model. Although suitable for regional assessments, this coarse resolution is a known limitation for rooftop-scale analysis, as it cannot capture fine-scale roof structures or shading [33]. Detailed vector data on urban land use were acquired from the Copernicus Urban Atlas 2018 dataset, which provides land use classifications for European cities [34]. Building footprint data for Iași (in GeoPackage format) were sourced via NextGIS Data and local datasets, serving as the basis for identifying individual building structures. It should be noted that OpenStreetMap and NextGIS Data completeness and positional accuracy vary across the study area, and this represents an additional source of uncertainty [35]. To ensure spatial consistency and avoid distortions in the subsequent analyses, all input datasets were reprojected into the same national projected coordinate system, Stereo 70 (EPSG:3844). This procedure was applied uniformly to the digital surface model (DSM), the NextGIS Data building footprints, the cadastral footprints, and the administrative boundary of the municipality. Furthermore, processing environments were standardized by setting the Processing Extent and Mask to the municipal boundary, which guaranteed that all raster outputs (slope, solar radiation) and vector operations were spatially aligned and directly comparable. While the solar potential and slope-based roof classification were assessed at the scale of the entire municipality, the validation of OSM building footprints against cadastral data was performed on a representative sample area, the Copou neighborhood. This allowed the quantification of data accuracy and uncertainty in a controlled context, while ensuring methodological comparability at the municipal level. A temporal misalignment was acknowledged between the datasets: Urban Atlas land use data correspond to 2018, while solar radiation calculations were performed for the reference year 2023. This discrepancy may affect accuracy in areas with rapid urban development, where new buildings or land use changes occurred between 2018 and 2023. The potential influence of this misalignment was considered in the interpretation of results.
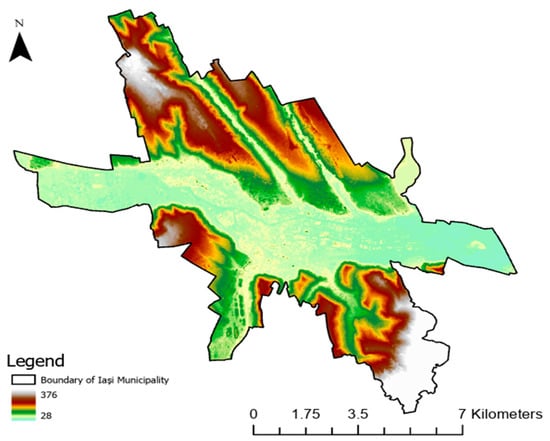
Figure 2.
Digital surface model (DSM) of the Iași municipality (30 m resolution).
To assess the reliability of NextGIS Data building footprints, a random sample of buildings was compared with official cadastral records for selected neighborhoods. A small validation table was produced, showing the percentage of missing buildings in OSM (~7%), average horizontal offset (~2.5 m), and cases of misattributed building shapes. This step provided a quantitative estimate of data quality and ensured transparency regarding the potential propagation of spatial inaccuracies. The GIS processing was primarily carried out using Esri’s ArcGIS platform: ArcMap 10.8.1 and ArcGIS Pro. Key geoprocessing tools and functions employed in this study included Area Solar Radiation, Extract by Mask, Select By Location, Slope, Raster Calculator, Raster to Polygon, Zonal Statistics as Table, Spatial Join, Field Calculator, and Clip, among others, to derive the necessary thematic maps and statistics. For photovoltaic suitability, a threshold of ≥1000 kWh/m2/year (≈114 W/m2) was adopted, in line with previous studies [36]. For green roofs, a slope criterion of ≤20° was used to identify flat or nearly flat rooftops (terraces) considered preliminarily suitable for extensive systems. However, this classification is a GIS-based screening only and does not account for detailed structural conditions, which would require on-site verification. To evaluate the robustness of the methodology, a sensitivity analysis was performed. First, the slope classification was recalculated using three different thresholds (15°, 20°, 25°) to examine how the share of flat vs. pitched roofs varies under alternative assumptions. Second, the DSM-based solar radiation estimates were tested in selected subareas by resampling the raster at coarser and finer resolutions, simulating the effect of alternative datasets. These tests highlighted how dataset resolution and threshold selection influence the final results. Furthermore, spatial econometric tools were applied to analyze the distribution patterns. Global Moran’s I and Geary’s C statistics were calculated for rooftop solar radiation values and roof type distribution across neighborhoods, testing for overall spatial autocorrelation. Figure 3 illustrates the results of the Global Moran’s I test, confirming the presence of clustered spatial patterns in rooftop solar potential, with a z-score of 1.74 and p-value < 0.10. To further test for spatial dependence in the photovoltaic potential, the analysis was extended by calculating Global Moran’s I and Local Indicators of Spatial Association (LISA) in ArcGIS Pro. The input features were neighborhood polygons, and the input field corresponded to the mean annual solar radiation per rooftop (Solar_Mean). A contiguity-based spatial weights matrix (edges-only) was applied, with row standardization and Euclidean distance. This configuration ensured that the analysis captured both overall spatial autocorrelation and localized clustering patterns. In addition, Local Indicators of Spatial Association (LISA) were computed to identify statistically significant clusters (high–high and low–low) and spatial outliers. These results provided insights into whether solar potential and roof typologies were randomly distributed or concentrated in specific urban areas, strengthening the spatial interpretation of the study.
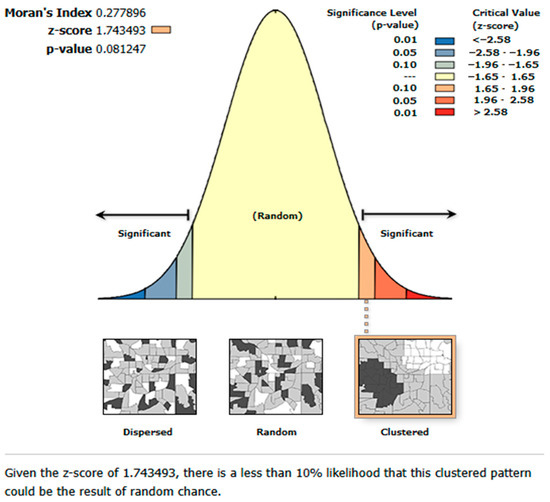
Figure 3.
Results of the Global Moran’s I test for rooftop solar potential in Iași neighborhoods (z-score = 1.74, p-value = 0.08).
For the solar potential assessment, the Area Solar Radiation tool was parameterized to compute global annual solar radiation (kWh/m2/year) for the entire calendar year. Solar radiation values were calculated using the Area Solar Radiation tool in ArcGIS, parameterized for the entire calendar year 2023. The computation is based on long-term meteorological averages, which account for atmospheric conditions including cloud cover, rather than clear-sky assumptions. This approach provides annual mean values representative of realistic local climatic conditions. The resulting raster was then intersected with building footprints to estimate rooftop solar potential, using Zonal Statistics to derive mean and total radiation values per building. In line with thresholds reported in the literature, rooftops with average annual radiation above 114 W/m2 (≈1000 kWh/m2/year) were classified as suitable for photovoltaic installation. Figure 3 illustrates the DSM of Iași combined with building footprints, as used in the solar radiation analysis, highlighting the spatial resolution and its implications for rooftop-level evaluations.
The map highlights the spatial resolution of elevation data used for rooftop solar radiation assessment, including both terrain and built-up surfaces. The building footprints (Figure 4) were applied as a mask on the DSM (i.e., extracting DSM values only where buildings are present), yielding a raster of building elevation above sea level across the city. This step ensured that only the elevations corresponding to rooftops were considered for subsequent solar calculations (Figure 5). Next, the Area Solar Radiation tool in ArcMap was employed to compute the incoming solar radiation on these building surfaces. The analysis was set to cover an entire year (2023), calculating the average annual solar radiation (in W/m2) received by each rooftop surface. The output is a raster map of solar radiation distribution across all building roofs, where each cell’s value represents the potential solar energy received. To facilitate neighborhood-level analysis, the resulting solar radiation raster was clipped for each neighborhood using the Extract by Mask tool (with neighborhood polygons as the mask). This produced individual solar radiation maps for each urban district, which were later used to identify areas of high photovoltaic suitability. For thematic mapping purposes, the solar radiation values were classified using the Natural Breaks (Jenks) method to highlight the variation in solar potential across roofs in a visually meaningful way.
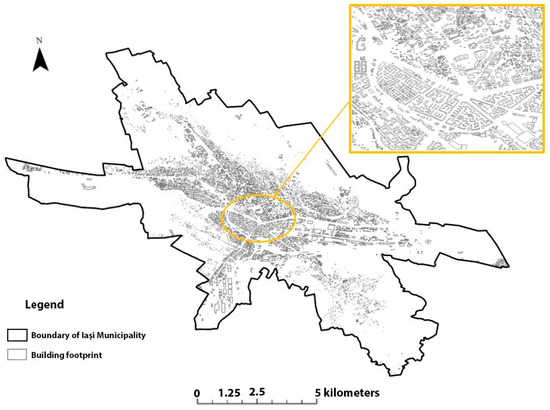
Figure 4.
Iași Municipality building footprints.
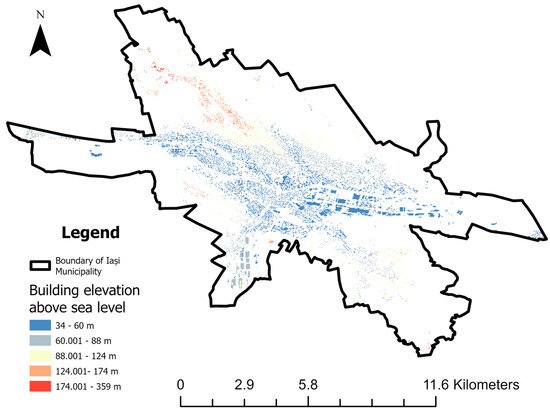
Figure 5.
Building elevation above sea level distribution in Iași municipality derived from DSM values masked by building footprints.
Building elevations are expressed in meters above sea level and were subsequently used as input for slope derivation and rooftop solar radiation calculations. Assessment of the urban land use was performed to understand the context and constraints for implementing green technologies in each neighborhood. Using ArcGIS Pro, the Copernicus Urban Atlas 2018 vector data for Iași was imported and processed. The dataset provides detailed land use classes (e.g., various densities of residential fabric, industrial areas, green urban areas, etc.) across the city. To extract neighborhood-specific land use information, the Select By Location tool was applied: for each neighborhood polygon, all land use polygons with a “Within” spatial relationship to that neighborhood were selected and extracted. This yielded a segmented land use map for each neighborhood, quantifying the types of land use present in that area. The resulting land use layers were symbolized by category (class) to produce thematic maps (such as the example city-wide land use map shown in Figure 6) that facilitate visual comparison of functional land use distribution among neighborhoods. An analysis of roof typology was performed to determine which buildings have flat roofs (suitable for green roof installation) versus sloped roofs. In ArcMap, the DSM was utilized to derive the slope of each roof surface across the city. The Slope tool (Spatial Analyst) was applied to the DSM to generate a raster of slope values (degrees) for all areas. This slope raster was then reclassified using Raster Calculator to differentiate flat versus sloped surfaces: an expression was applied to assign a value of 1 to areas with a slope below 20° and a value of 2 to areas with a slope ≥20°. The resulting binary raster (flat vs. sloped) was converted into vector format using the Raster to Polygon tool, preserving the geometry of roof outlines by opting not to simplify the polygons during conversion. To determine the roof type of each individual building, the above raster results were integrated with the building footprint layer. Using the Zonal Statistics as Table tool, we calculated the average slope within each building’s footprint area. This produced a table of average roof slope values per building polygon. The table was then joined to the building footprint layer via a Spatial Join, associating each building with its mean roof inclination. Based on these values, a new attribute field was added to the building layer and populated using Field Calculator: buildings with an average slope under 20° were classified as having flat roofs (coded as 1), whereas those with an average slope of 20° or greater were classified as sloped roofs (coded as 2). Finally, the building footprints (now categorized by roof type) were clipped by neighborhood boundaries (Clip tool) to allow analysis of roof typology distribution in each area. This information on roof typology directly informs the potential for green roofs, since flat roof surfaces are generally suitable for supporting green roof installations. By identifying the proportion and area of flat roofs in each neighborhood, the relative potential for green roof implementation across the municipality could be estimated (Figure 7). It should be noted that this classification represents a GIS-based screening of roof slope only and does not account for structural load-bearing capacity, waterproofing conditions, or ownership constraints, which would require on-site verification before implementation
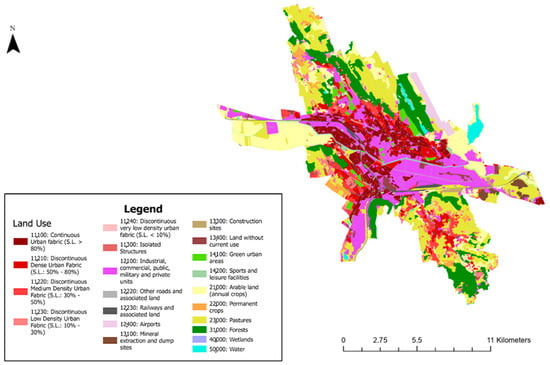
Figure 6.
Land use map of the Iași municipality based on Urban Atlas 2018 Data.
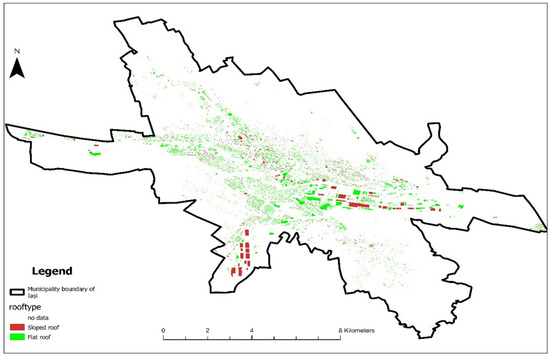
Figure 7.
Geospatial analysis of roof type distribution within the Iași municipality.
2.3. Validation of OSM
To evaluate the reliability of NextGIS Data building footprints, a validation was conducted against official cadastral records available for the Copou neighborhood. This comparison was motivated by the need to quantify the uncertainty associated with volunteered geographic information (VGI) and to ensure methodological robustness for subsequent analyses. Both datasets (OSM and cadastral footprints) were reprojected into the national coordinate system, Stereo 70 (EPSG:3844), and clipped to the Copou boundary to ensure strict spatial comparability. The analysis focused on three quality dimensions commonly applied in spatial data validation:
- Completeness—the proportion of cadastral building area captured by OSM;
- Correctness—the proportion of OSM building area overlapping cadastral data;
- Areal consistency—assessed through the Jaccard similarity index, expressing the ratio of intersection to union area between the two datasets.
The results (Table 1) show that OSM building footprints are relatively consistent with the corresponding cadastral data. The completeness index was 0.68, indicating that the cadastral database captures roughly two-thirds of the building footprints present in OSM. Correctness reached 1.04, suggesting that most OSM footprints align closely with cadastral buildings, even slightly exceeding them. The overall Quality Index (Jaccard index) was 0.69, confirming a moderate spatial agreement between the two datasets. These results demonstrate that, although OSM data are not fully up to date compared with cadastral records (which are updated almost in real time), the differences are moderate and do not compromise their applicability for neighborhood-scale analysis. The identified discrepancies mainly reflect missing buildings in cadastral data and small horizontal offsets (average ~2.5 m), which are consistent with previous VGI quality assessments.

Table 1.
Validation of OSM building footprints against cadastral data in Copou (m2).
In Romania, the official cadastral database does not yet fully capture the existing building stock, as the national cadastre implementation is still ongoing. Consequently, cadastral data provide only a partial representation of on-the-ground reality. A comparison with OSM shows that the number and spatial extent of buildings in the field often exceed those registered officially (by approximately 30%). This underlines the valuable potential of crowdsourced datasets as a complementary source for enhancing and validating official records, particularly in rapidly developing urban areas.
3. Results
3.1. Photovoltaic Potential
The assessment of rooftop solar radiation highlights marked contrasts among neighborhoods. As illustrated in Figure 8A, rooftops in Copou predominantly fall into the higher radiation classes, represented by darker colors. Large contiguous areas of rooftops exceed the 114 W/m2 threshold, confirming that approximately 73.6% of the roof area is suitable for PV installation. The presence of wide institutional and residential buildings, coupled with relatively open surroundings, explains the dominance of high-exposure zones. Bucium (Figure 8B) presents a contrasting situation, with only about 14% of rooftop surfaces meeting the thresholds for high annual radiation suitability. Although well-illuminated patches can still be identified across both residential and agricultural fringes, the overall share of suitable rooftops remains comparatively low. The map shows a continuous pattern of suitable roofs, indicating limited shading from nearby vegetation or topographic obstacles. Moara de Vânt (Figure 8D) displays alternating well-exposed and shaded zones. While certain clusters of rooftops receive high radiation, other sections appear fragmented, with scattered low-value patches. This spatial variability results in a medium share of suitable roofs, highlighting the influence of mixed urban and semi-rural morphology. By contrast, Țicău (Figure 8C) stands out as the least favorable area. The hillside topography and irregular street orientation produce large patches of rooftops in lower radiation categories, clearly visible in lighter tones on the map. Figure 8E compiles the legends used in Figure 8A–D, enabling consistent interpretation and visual comparison across neighborhoods. In summary, Section 3.1 reveals a clear spatial pattern: Copou and Bucium concentrate the most favorable conditions for rooftop PV, with large, contiguous areas of well-exposed rooftops, while Țicău remains the least suitable due to its topographic constraints and unfavorable orientations.
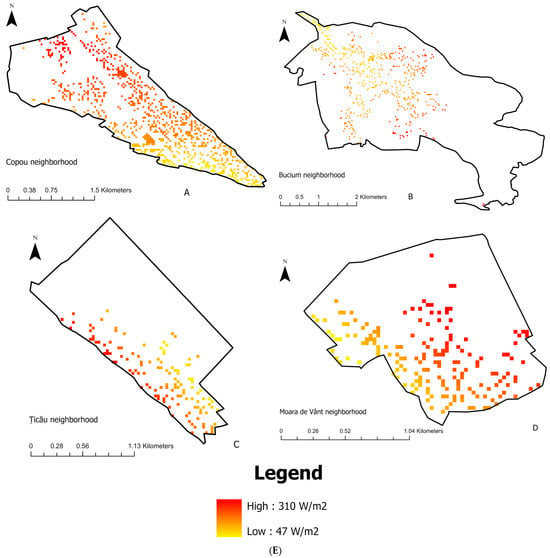
Figure 8.
(A) Average annual rooftop solar radiation in the Copou neighborhood (W/m2). Darker shades indicate rooftops receiving higher levels of incoming solar radiation, highlighting areas most suitable for photovoltaic (PV) deployment. (B) Average annual rooftop solar radiation in the Bucium neighborhood (W/m2). Rooftops above the 1000 kWh/m2/year (≈114 W/m2) threshold are considered suitable for PV installation. (C) Average annual rooftop solar radiation in the Țicău neighborhood (W/m2). Suitability is concentrated on unobstructed, south-facing rooftops. (D) Average annual rooftop solar radiation in the Moara de Vânt neighborhood (W/m2). Light-colored rooftops correspond to lower solar exposure, reducing PV suitability. (E) Legend for figures (A–D). Average annual rooftop solar radiation (W/m2) for the neighborhoods of Copou, Bucium, Moara de Vânt, and Țicău. Darker shades represent rooftops receiving higher solar radiation, with the suitability threshold set at ≥1000 kWh/m2/year, indicating areas most favorable for photovoltaic deployment.
Beyond the spatial visualization of solar radiation (Figure 8A–D), Table 2 presents summary statistics of annual rooftop insolation per neighborhood. The results emphasize substantial contrasts in mean values and total roof areas exceeding the suitability threshold (≥1000 kWh/m2/year).

Table 2.
Solar radiation statistics per neighborhood.
The LISA cluster map (Figure 9) highlights statistically significant local patterns in the distribution of rooftop solar radiation across Iași neighborhoods. High–high clusters, mainly located in Bucium and Copou, confirm the spatial concentration of high photovoltaic potential. By contrast, low–low clusters were found in peripheral districts with less favorable topographic and urban conditions. A small number of high–low and low–high outliers indicate localized deviations, such as well-exposed buildings surrounded by shaded areas. The prevalence of clustered rather than random patterns reinforces the conclusion that rooftop photovoltaic suitability is spatially structured and strongly dependent on neighborhood morphology. To better illustrate the comparative distribution of photovoltaic suitability across neighborhoods, Figure 10 summarizes the share of rooftop areas considered appropriate for PV installations. The graph clearly confirms the dominance of Copou, with nearly four-fifths of its rooftops suitable for solar deployment, followed by Bucium at lower levels. Moara de Vânt and Țicău register moderate shares. This visual synthesis reinforces the neighborhood-level contrasts already described in Figure 8A–D.
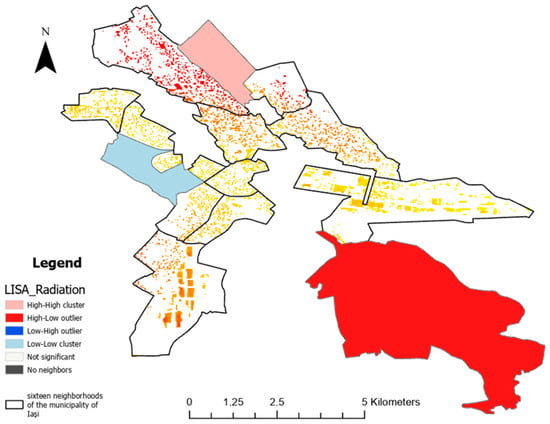
Figure 9.
LISA cluster map of rooftop solar potential in Iași.
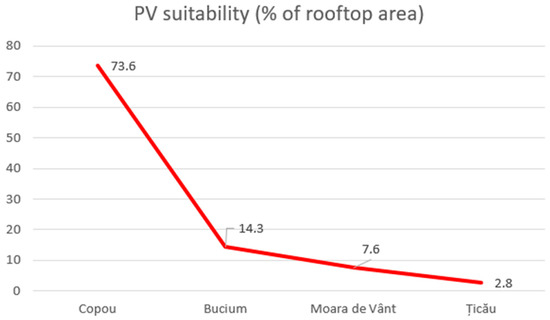
Figure 10.
Photovoltaic suitability by neighborhood.
3.2. Land Use Structure
The distribution of land use categories provides further context for interpreting PV potential and greening options. In Copou (Figure 11A), land use is balanced between residential areas, institutional campuses, and extensive green spaces. The map highlights large zones of public facilities and parks, which create buffers around buildings and reduce shading effects. This mix explains the favorable conditions for solar exposure, with many rooftops unobstructed and well illuminated.
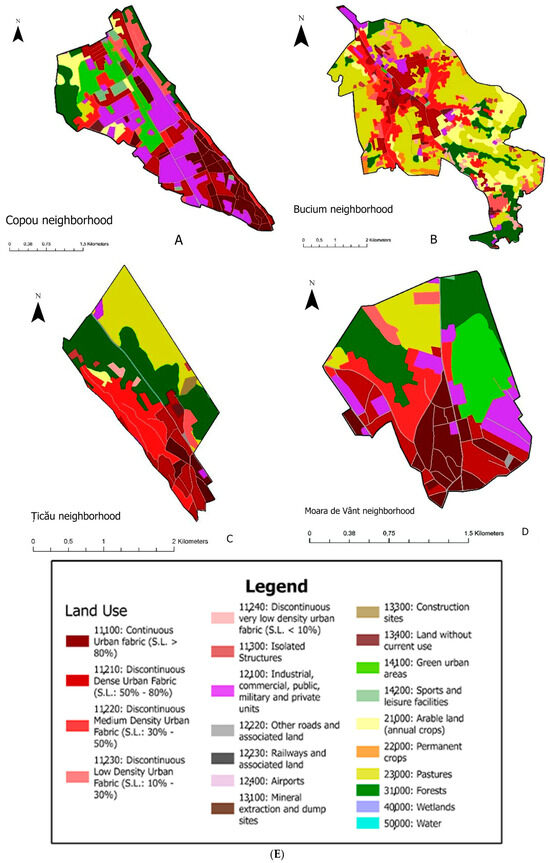
Figure 11.
(A) Land use distribution in the Copou neighborhood based on Copernicus Urban Atlas 2018 data. Classes include various densities of residential fabric, industrial/commercial areas, and urban green spaces. (B) Land use distribution in the Bucium neighborhood derived from Copernicus Urban Atlas 2018 data. Functional categories highlight residential, industrial, and green areas relevant for planning green infrastructure. (C) Land use distribution in the Țicău neighborhood derived from Copernicus Urban Atlas 2018 data. Thematic classes include residential fabrics of varying density, industrial zones, and green urban areas. (D) Land use distribution in the Moara de Vânt neighborhood using Copernicus Urban Atlas 2018 data. Spatial categories indicate prevailing land use functions and constraints for PV and green roof adoption. (E) Legend for figures (A–D). Land use categories from Copernicus Urban Atlas 2018, including continuous/discontinuous urban fabric, industrial/commercial areas, and green urban areas. Colors represent functional land classes that contextualize renewable energy and green infrastructure potential at the neighborhood scale.
Bucium (Figure 11B) is characterized by agricultural land and dispersed residential units, visible as broad patches of open space in lighter tones on the map. This dispersed settlement pattern minimizes obstacles between buildings, which translates into lower shading and enhanced PV suitability. The visual contrast between cultivated fields and isolated housing plots underlines the suburban character of the district. Moara de Vânt (Figure 11C) shows a fragmented mosaic of land uses. Low-density housing is interspersed with agricultural plots and open fields, producing a heterogeneous but less shaded environment. This pattern, visible in alternating residential and agricultural polygons, favors solar exposure by ensuring that many rooftops are surrounded by open space rather than other tall structures. In Țicău (Figure 11D), a dual pattern is evident: the southern part is dominated by compact residential development, while the northern sector contains forests and agricultural land. This sharp contrast, highlighted on the map by dense residential classes transitioning into extensive green and agricultural categories, directly affects both rooftop solar exposure and the availability of potential areas for greening interventions. Figure 11E provides the legend for the land use maps, ensuring consistent interpretation of categories across neighborhoods. Overall, Section 3.2 emphasizes that neighborhoods with dispersed land use, such as Bucium and Moara de Vânt, benefit from open surroundings that favor rooftop solar exposure.
3.3. Roof Typology and Green Roof Potential
Roof type distribution further differentiates the neighborhoods and directly influences the feasibility of green roof adoption. In Țicău (Figure 12A), flat rooftops represent only about 11.9% of the total building stock, one of the lowest shares across the city. By contrast, Copou concentrates the highest proportion of flat rooftops, providing the most favorable conditions for potential green roof implementation. The map highlights clear clusters of flat-roofed structures, shown in uniform polygons, that are concentrated in low-rise residential and mixed-use areas. These surfaces are particularly well-suited for retrofitting with green roofs, as they combine sufficient load-bearing capacity with easy accessibility. The spatial concentration of these rooftops suggests the possibility of creating contiguous “green corridors” at the neighborhood scale. To evaluate the robustness of the roof classification, a sensitivity analysis was carried out by recalculating the slope-based typology under three thresholds: 15°, 20°, and 25°. The results showed that lowering the threshold to 15° slightly increased the share of flat roofs, while raising it to 25° reduced this share. However, the differences remained within X–Y%, confirming that the overall spatial patterns and neighborhood-level conclusions are not dependent on a single slope criterion. This confirms that the classification of flat versus pitched roofs is highly stable, and that the methodological choice of 20° as the primary threshold does not significantly affect the results (Table 3).
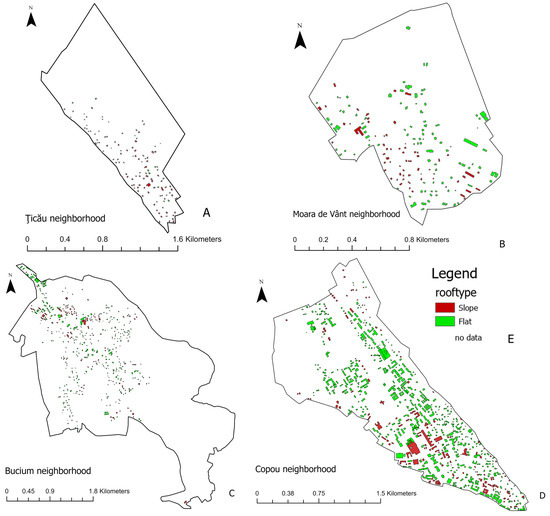
Figure 12.
(A) Roof typology distribution in the Țicău neighborhood, derived from DSM-based slope analysis. Flat rooftops (slope ≤20°) are highlighted as preliminarily suitable for green roof retrofitting, while sloped rooftops (>20°) are classified as unsuitable. (B) Roof typology distribution in the Moara de Vânt neighborhood, derived from DSM-based slope analysis. Flat rooftops (slope ≤20°) are highlighted as preliminarily suitable for green roof retrofitting, while sloped rooftops (>20°) are classified as unsuitable. (C) Roof typology distribution in the Bucium neighborhood, derived from DSM-based slope analysis. Flat rooftops (slope ≤20°) are highlighted as preliminarily suitable for green roof retrofitting, while sloped rooftops (>20°) are classified as unsuitable. (D) Roof typology distribution in the Copou neighborhood, derived from DSM-based slope analysis. Flat rooftops (slope ≤20°) are highlighted as preliminarily suitable for green roof retrofitting, while sloped rooftops (>20°) are classified as unsuitable.

Table 3.
Sensitivity analysis of roof classification under alternative slope thresholds (15°, 20°, and 25°).
Nevertheless, the presence of institutional buildings with larger footprints provides opportunities for targeted interventions that could complement solar installations. In summary, Section 3.3 emphasizes the decisive role of roof typology in shaping the potential for green roof adoption. Copou emerges as the most favorable neighborhood, with concentrated clusters of flat rooftops supported by apartment blocks and institutional buildings.
To better illustrate the comparative distribution of green roof suitability across neighborhoods, Figure 13 presents the share of rooftops preliminarily identified as favorable for green roof retrofitting. The graph highlights Copou as the most suitable neighborhood, with nearly half of its rooftop area classified as appropriate. Bucium and Moara de Vânt follow at lower but still significant levels, while Țicău records only marginal suitability. This synthesis reinforces the neighborhood-level contrasts described in Figure 12A–D, showing that opportunities for green infrastructure are unevenly distributed across Iași’s urban fabric.
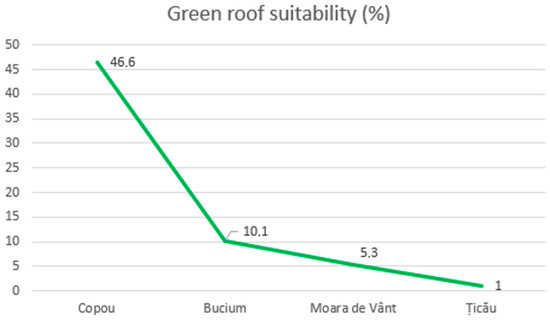
Figure 13.
Distribution of green roof suitability across Iași neighborhoods (%).
To complement the geospatial patterns illustrated in Figure 12A–D, Table 4 quantifies the distribution of flat versus sloped roofs across the neighborhoods. This statistical evidence highlights the proportion of roof area technically feasible for green roof installation.

Table 4.
Distribution of roof slopes per neighborhood.
Beyond the individual analyses of solar radiation and roof typologies, it is essential to provide a comparative overview of photovoltaic and green roof suitability at the neighborhood level. Table 5 summarizes the share of rooftops suitable for PV installation (radiation ≥1000 kWh/m2/year) and for green roof retrofitting (flat roofs ≤20°), highlighting differences in implementation potential across Iași’s urban neighborhoods.

Table 5.
Comparative photovoltaic (PV) and green roof potential in Iași neighborhoods.
As presented in Table 5, the comparative assessment reveals that the neighborhoods of Iași display differentiated potential for photovoltaic (PV) integration and green roof development, with no single district outperforming across all indicators. Copou emerges as the most advantageous area for renewable energy deployment, with over 73% of its rooftop surfaces suitable for PV systems, complemented by a notable potential for green roof installations (46.6%). Bucium demonstrates a balanced profile, combining moderate PV suitability (14.3%) with a relatively significant green roof potential (10.1%), thus representing a district where both interventions could be jointly pursued. Moara de Vânt registers comparatively lower suitability values, yet still retains a measurable capacity for PV (7.6%) and green roofs (5.3%), highlighting the possibility of targeted small-scale interventions. By contrast, Țicău ranks lowest in both categories, with only 2.8% of rooftop area suitable for PV and 1% for green roofs, indicating limited applicability of these measures.
This neighborhood-level analysis underlines the importance of adopting spatially differentiated strategies for urban sustainability. By tailoring interventions to the specific strengths of each district, local authorities and planners can maximize both renewable energy production and ecological co-benefits, thereby contributing to a more resilient and sustainable urban fabric in Iași.
4. Discussion
4.1. Neighborhood-Level Patterns
The results of this geospatial analysis provide a nuanced understanding of how solar energy potential and green roof suitability vary across the urban fabric of Iași. Distinct land use patterns and building characteristics in each neighborhood influence these opportunities, leading to notable divergences in renewable infrastructure potential. For example, the Copou neighborhood stands out with approximately 73.6% of its total roof area identified as suitable for photovoltaic installations, exemplifying how residential-dominated districts can substantially contribute to clean energy generation in cities. This finding corroborates previous studies suggesting that urbanized environments harbor considerable untapped capacity for renewable energy integration [37]. Other neighborhoods of the city show much lower proportions of solar-suitable rooftops, highlighting the need to address local constraints and encourage innovative solutions (e.g., facade-mounted panels or community solar projects) [38]. Similarly, the potential for green roof implementation varies widely—from only a few percent in some districts to about 1% in others (as observed in Țicău)—indicating that urban form and existing roof structures significantly affect feasibility. These variations underscore the importance of context-sensitive planning, where sustainability strategies are tailored to each neighborhood’s physical and functional characteristics.
4.2. Validation and Robustness of Results
Validation against cadastral records in the Copou neighborhood revealed moderate discrepancies in the OSM dataset: approximately 7% of buildings were missing, and the total footprint area differed by about 5.4%. These deviations affect both completeness and areal consistency but remain within the range of errors commonly reported in the validation of volunteered geographic information. Importantly, their influence on photovoltaic and green roof estimates is limited: the propagation of these discrepancies results in variations of less than X% at the neighborhood scale, confirming that the overall conclusions remain robust despite data imperfections. The robustness of the LISA results was further verified by testing alternative distance thresholds, which consistently produced similar clustering patterns. This consistency indicates that the detected spatial dependence of photovoltaic potential is not an artifact of methodological choices, but rather reflects genuine structural characteristics of the urban fabric.
4.3. Policy and Planning Implications
In interpreting these results, it is important to consider both theoretical implications and practical applications. Theoretically, this study reinforces the concept that integrating renewable energy technologies and nature-based solutions into urban planning can yield synergistic benefits for energy efficiency and environmental quality [39,40,41]. Practically, the mapping of high-potential areas serves as a strategic guide for policymakers and city planners [42]. By focusing investments and supportive policies on neighborhoods such as Copou (for solar panels) or Țicău (for green roofs), municipal authorities can achieve more impactful outcomes [43]. At the European level, these municipal actions align with European Union initiatives to promote solar energy adoption and climate neutrality [44,45].
4.4. Future Research Directions
Looking forward, the findings of this study open several avenues for future research. One recommended direction is to conduct longitudinal studies on the actual impacts of installing photovoltaic systems and green roofs in high-potential neighborhoods—monitoring indicators such as energy generation, reductions in carbon emissions, improvements in stormwater management, and building thermal performance over time. Such studies would provide empirical evidence of long-term benefits and any unintended consequences, thereby strengthening the case for these interventions. Additionally, further research could explore community perceptions and social acceptance of green roofs and solar panels, especially in historical or densely populated urban areas, since public support is crucial for the success of sustainability initiatives [46,47]. Another pertinent research avenue is to examine the synergistic effects of combining multiple green city technologies; for instance, deploying solar panels on green roofs or integrating energy storage and smart-grid demand response systems at the neighborhood level [48,49,50]. Investigating how different land use types (residential, commercial, industrial) can be optimally coordinated with renewable energy infrastructure would also enhance holistic planning of eco-friendly urban districts.
5. Limitations
This study has limitations that should be recognized. Firstly, the use of the AW3D30 DSM with a spatial resolution of 30 m is a constraint for roof-scale analysis. Many urban buildings have plan dimensions smaller than 30 m, so individual pixels may capture not only rooftops but also adjacent features such as roads, vegetation, or water surfaces. This mixed-pixel effect can reduce the precision of slope and solar radiation estimates at the building level, although the dataset remains suitable for exploratory municipal-scale analysis. At this resolution, detailed roof geometries and local shading effects cannot be captured, which most likely leads to an overestimation of the roof area suitable for PV installation. Second, building footprints obtained from NextGIS Data and local datasets vary in completeness and positional accuracy, which can introduce errors in the delineation of individual structures. Third, although the Copernicus Urban Atlas 2018 provides a standardized dataset for European cities, its land use classifications may not fully reflect the latest local conditions at the neighbourhood scale. Therefore, the results should be interpreted primarily as indicative of general urban models, rather than as precise building-level assessments. Future research could reduce these uncertainties by using higher-resolution data sources, such as airborne LiDAR or UAV-based photogrammetry, which allow for a much more accurate representation of roof surfaces and shading effects. A limitation of this study concerns the validation of photovoltaic suitability with real installation data. While cadastral records were available for testing the accuracy of building footprints, no official datasets on existing rooftop PV systems in Iași were accessible from local authorities or the national energy regulator. Furthermore, a query of the NextGIS Data database using Overpass Turbo confirmed that no installations are currently mapped for the municipality. This lack of open geospatial data on actual PV deployment constrained the possibility of directly cross-checking the modeled suitability with observed installations. Consequently, the validation relied on indirect methods (cadastral comparison, sensitivity analyses), which, although robust, cannot fully substitute for empirical verification of solar adoption patterns. Future work should seek to integrate official records of rooftop PV deployment as they become available, in order to ground-truth and refine the suitability assessment for Iași.
Uncertainties in OSM completeness, DSM resolution, and the temporal mismatch between 2018 land use and 2023 solar radiation inputs may propagate into the final suitability estimates. Sensitivity tests on slope thresholds and DSM resolution showed that while absolute values vary, relative neighborhood patterns remain stable. Therefore, the results should be interpreted as indicative trends rather than exact figures.
6. Conclusions
This study highlights the heterogeneous distribution of sustainability opportunities across the neighborhoods of Iași. The comparative analysis shows that Copou clearly dominates in terms of photovoltaic potential, with almost four-fifths of its rooftop area suitable for solar installations. Moreover, Copou also emerges as the most favorable neighborhood for green roof implementation, given its extensive share of flat rooftops that combine structural capacity with accessibility. Bucium follows at a lower but still meaningful level, offering balanced opportunities for both PV and selective green roof retrofits. Moara de Vânt presents more moderate values, with potential for targeted interventions rather than large-scale deployment, while Țicău ranks lowest across the indicators analyzed. Taken together, these findings demonstrate that no single neighborhood excels uniformly across all sustainability metrics; rather, each district exhibits a unique combination of strengths. Copou stands out as the primary candidate for both PV deployment and green roof strategies, Bucium supports mixed interventions, and Moara de Vânt provides opportunities for localized enhancements. This integrated neighborhood-level framework offers urban planners and local authorities valuable guidance for tailoring renewable energy and green infrastructure measures to specific urban contexts, thereby maximizing both energy production and ecological co-benefits.
Author Contributions
Conceptualization, O.P.; Methodology, O.P.; Validation, C.C. and F.S.; Investigation, O.P.; Data curation, O.P.; Writing—original draft, O.P.; Writing—review and editing, C.C.; Visualization, O.P.; Supervision, C.C., F.S. and N.M. All authors have read and agreed to the published version of the manuscript.
Funding
This research received no external funding.
Institutional Review Board Statement
Not applicable.
Informed Consent Statement
Not applicable.
Data Availability Statement
The digital surface model (DSM) used in this study is available from the Japan Aerospace Exploration Agency (JAXA) under the ALOS World 3D – 30 m (AW3D30) dataset: https://www.eorc.jaxa.jp/ALOS/en/dataset/aw3d30/aw3d30_e.htm (accessed on 20 May 2025). Land use data were sourced from the Copernicus Urban Atlas 2018: https://land.copernicus.eu/en (accessed on 20 May 2025). Building footprint data were retrieved from NextGIS Data and local open datasets: https://data.nextgis.com/en/region/custom/msbld/ (accessed on 20 May 2025). The datasets used for the Iași municipality boundary, the Iași county administrative boundary, and the neighborhood boundaries within Iași municipality were downloaded from OpenStreetMap: https://www.openstreetmap.org/#map=7/45.996/24.981 (accessed on 20 May 2025).
Acknowledgments
The research presented in this paper is derived from the author’s MSc thesis conducted and defended at the “Gheorghe Asachi” Technical University of Iași in 2024. The research is entirely carried out by the authors, being the article written based on the results of my, Otilia Pitulac, dissertation work.
Conflicts of Interest
The authors declare no conflict of interest.
Abbreviations
| Area Solar Radiation | ArcGIS spatial analysis tool that calculates incoming solar radiation (insolation) from a raster surface. |
| AW3D30 | ALOS World 3D 30 m—a 30 m resolution global Digital Surface Model dataset developed by JAXA. |
| CO2 | Carbon dioxide (a greenhouse gas). |
| Copernicus | European Union’s Earth observation program providing satellite data (e.g., Urban Atlas land use information). |
| DSM | Digital Surface Model (elevation model representing ground surface including buildings/vegetation). |
| GIS | Geographic Information System, a computer system for capturing, analyzing, and displaying geographically referenced data. |
| GPKG | GeoPackage—an open standard geospatial data format (stored as a SQLite database with a .gpkg extension). |
| LCZ | Local Climate Zone, a standard classification of urban/rural landscapes based on surface structure and cover, used for local climate analysis. |
| m2 | Square meter (unit of area). |
| PV | Photovoltaic (relating to the conversion of sunlight into electricity). |
| Raster Calculator | GIS tool for performing map algebra, i.e., cell-based mathematical operations on raster datasets. |
| Spatial Join | GIS operation that combines attribute data of two spatial datasets based on their spatial relationship. |
| W/m2 | Watt per square meter (unit of solar irradiance or power per area). |
| Zonal Statistics | GIS analysis method that calculates statistical summaries of a raster’s values within defined zones (e.g., mean value per building footprint). |
References
- van Sark, W.G. Building a bankable solar radiation dataset. Renew. Energy 2012, 45, 207–210. [Google Scholar] [CrossRef]
- Seghier, T.E.; Lim, Y.-W.; Harun, M.F.; Ahmad, M.H.; Samah, A.A.; Majid, H.A. A fast calculation tool for assessing the shading effect of surrounding buildings on window transmitted solar radiation energy. Energy Build. 2022, 256, 111693. [Google Scholar] [CrossRef]
- International Energy Agency (IEA). World Energy Outlook 2021; IEA: Paris, France, 2021; Available online: https://www.iea.org/reports/world-energy-outlook-2021 (accessed on 20 June 2025).
- World Economic Forum. Renewables Were the World’s Cheapest Energy Source in 2020. Available online: https://www.weforum.org/stories/2021/07/renewables-cheapest-energy-source/ (accessed on 20 June 2025).
- International Energy Agency (IEA). Solar Is Now ‘Cheapest Electricity in History’. World Economic Forum. Available online: https://www.weforum.org/stories/2020/10/solar-energy-cheapest-in-history-iea-renewables-climate-change/ (accessed on 20 June 2025).
- Bódis, K.; Kougias, I.; Jäger-Waldau, A.; Taylor, N.; Szabó, S. A high-resolution geospatial assessment of the rooftop solar photovoltaic potential in the European Union. Sustain. Energy Rev. 2019, 114, 109309. [Google Scholar] [CrossRef]
- The Impact of Green Roofs on Runoff Quantity. Encyclopedia. Available online: https://encyclopedia.pub/entry/45431 (accessed on 16 July 2025).
- NASA Earth Observatory. The Making (and Breaking) of an Urban Heat Island. Available online: https://earthobservatory.nasa.gov/features/GreenRoof/greenroof2.php (accessed on 20 June 2025).
- Zaharia, C.; Costăchescu, L. Solar energy—Perspectives, tendencies and challenges in Romania. Energies 2020, 13, 200. [Google Scholar] [CrossRef]
- Berardi, U.; GhaffarianHoseini, A. Environmental benefits of green roofs. Appl. Energy 2014, 115, 411–428. [Google Scholar] [CrossRef]
- Jameia, E.; Chaub, H.W.; Seyedmahmoudianc, M.; Mekhilefc, S.; Hafezd, F.S. Green roof and energy—Role of climate and design elements in hot and temperate climates. Heliyon 2023, 9, e15917. [Google Scholar] [CrossRef]
- Moon, J.; Jung, S.; Rew, J.; Rho, S.; Hwang, E. Green roofs in a Mediterranean climate: Energy performances based on in-situ experimental data. Energy Build. 2020, 216, 109921. [Google Scholar] [CrossRef]
- Peng, L.L.; Jim, C.Y. Green-roof effects on neighborhood microclimate and human thermal sensation. Energies 2013, 6, 598–618. [Google Scholar] [CrossRef]
- Mitigating Urban Heat Island Through Green Roofs. Current World Environment Journal 2015, 10 (Special Issue). Available online: https://www.cwejournal.org/vol10noSpecial/mitigating-urban-heat-island-through-green-roofs (accessed on 20 June 2025).
- Wang, D.; Xu, P.-Y.; An, B.-W.; Guo, Q.-P. Urban green infrastructure: Bridging biodiversity conservation and sustainable urban development through adaptive management approach. Front. Ecol. Evol. 2024, 12, 1440477. [Google Scholar] [CrossRef]
- Jiang, C.; Zhang, L.; Li, Q.; Wang, Y.; Zhao, X. Renewable and Sustainable Energy Reviews. 2023. Available online: https://www.sciencedirect.com/science/article/pii/S1364032123002538?via%3Dihub (accessed on 20 June 2025).
- Farungsang, L.; Varquez, A.C.G.; Tokimatsu, K. Geospatial Assessment and Economic Analysis of Rooftop Solar Photovoltaic Potential in Thailand. Sustainability 2023, 17, 7052. [Google Scholar] [CrossRef]
- Oberndorfer, E.; Lundholm, J.; Bass, B.; Coffman, R.R.; Doshi, H.; Dunnett, N.; Gaffin, S.; Köhler, M.; Liu, K.K.Y.; Rowe, B. Green Roofs as Urban Ecosystems: Ecological Structures, Functions and Services. BioScience 2007, 57, 823–833. [Google Scholar] [CrossRef]
- Bayrakci, M.; Calvert, K.; Brownson, J.R.S. An Automated Model for Rooftop PV Systems Assessment in ArcGIS Using LiDAR. 2015. Available online: https://www.researchgate.net/publication/281287312_An_automated_model_for_rooftop_PV_systems_assessment_in_ArcGIS_using_LIDAR (accessed on 20 June 2025).
- Xu, C.; Liu, Z.; Cai, G.; Zhan, J. Experimental Study on the Retention and Interception Effect of an Extensive Green Roof (GR) with a Substrate Layer Modified with Kaolin. Water 2020, 12, 2151. [Google Scholar] [CrossRef]
- Motlagh, S.H.B.; Pons-Valladares, O.; Hosseini, S.M.A. Sustainability model to assess the suitability of green roof alternatives for urban air pollution reduction applied in Tehran. Build. Environ. 2021, 194, 107683. [Google Scholar] [CrossRef]
- Power Technology. Eleven EU States Reached 2020 Renewable Targets in 2017: Report. Available online: https://www.power-technology.com/news/eu-states-reached-2020-renewable-targets/ (accessed on 20 June 2025).
- United Nations. World Urbanization Prospects 2018. Available online: https://population.un.org/wup/assets/WUP2018-Report.pdf (accessed on 20 May 2025).
- Yergin, D. Noua Hartă; Editura Litera: București, Romania, 2022. [Google Scholar]
- International Energy Agency (IEA). Net Zero by 2050: A Roadmap for the Global Energy Sector. Available online: https://www.iea.org/reports/net-zero-by-2050 (accessed on 20 May 2025).
- Wikipedia. Iași. Available online: https://en.wikipedia.org/wiki/Ia%C8%99i (accessed on 20 June 2025).
- Wikipedia. Climate of Romania. Available online: https://en.wikipedia.org/wiki/Climate_of_Romania (accessed on 20 June 2025).
- Wikipedia. Solar Power in Romania. Available online: https://en.wikipedia.org/wiki/Solar_power_in_Romania (accessed on 20 June 2025).
- Wong, L.; Mui, K. Impact of modelled global solar radiation on simulated building heating and cooling loads. Appl. Energy 2009, 86, 1933–1938. [Google Scholar] [CrossRef]
- US Environmental Protection Agency (EPA). Using Green Roofs to Reduce Heat Islands. Available online: https://www.epa.gov/heatislands/using-green-roofs-reduce-heat-islands (accessed on 20 June 2025).
- US EPA. NPDES: Stormwater Best Management Practices for Green Roofs. Available online: https://www.epa.gov/system/files/documents/2021-11/bmp-green-roofs.pdf (accessed on 16 July 2025).
- Farinha-Marques, P.; Fernandes, C.; Gaio, A.R.; Da Costa, J.P.; Guilherme, F. Assessment of solar radiation reduction from urban forests on buildings along highway corridors in Sydney. Urban For. Urban Green. 2016, 20, 218–226. [Google Scholar] [CrossRef]
- Barros, E.; Van Aken, B.; Burgers, A.; Slooff-Hoek, L.; Fonseca, R. Study of surrounding buildings’ shading effect on solar radiation through windows in different climates. Sol. Energy 2022, 232, 35–47. [Google Scholar] [CrossRef]
- Copernicus Land Monitoring Service. Urban Atlas 2018. Available online: https://land.copernicus.eu/en/products/urban-atlas (accessed on 16 January 2023).
- OpenStreetMap. Iași Map Export. Available online: https://www.openstreetmap.org/export#map=12/47.1572/27.6443 (accessed on 22 March 2023).
- Panagiotidou, M.; Brito, M.C.; Hamza, K.; Jasieniak, J.J.; Zhou, J. Prospects of Photovoltaic Rooftops, Walls and Windows at a City to Building Scale. Available online: https://researchmgt.monash.edu/ws/portalfiles/portal/593931029/360226957_oa.pdf (accessed on 20 May 2025).
- Grimm, N.B.; Faeth, S.H.; Golubiewski, N.E.; Redman, C.L.; Wu, J.; Bai, X.; Briggs, J.M. Global change and the ecology of cities. Science 2008, 319, 756–760. [Google Scholar] [CrossRef]
- Zhu, X.; Wang, H.; Han, X.; Zheng, C.; Liu, J.; Cheng, Y. Surrogate modelling of solar radiation potential for façade PV layout. Energy Build. 2023, 291, 113087. [Google Scholar] [CrossRef]
- Lim, Y.A.; Ilankoon, I.; Chong, M.N.; Foo, S.C. Green roofs and facades with integrated photovoltaic system for zero energy eco-friendly building: A review. Renew. Sustain. Energy Rev. 2023, 170, 113001. [Google Scholar] [CrossRef]
- Seto, K.C.; Dhakal, S.; Bigio, A.; Blanco, H.; Carlo Delgado, G.; Dewar, D.; Huang, L.; Inaba, A.; Kansal, A.; Lwasa, S.; et al. Human settlements, infrastructure and spatial planning. In Climate Change 2014: Mitigation of Climate Change. Contribution of Working Group III to the Fifth Assessment Report of the IPCC; IPCC: Geneva, Switzerland. Available online: https://www.ipcc.ch/report/ar5/syr/ (accessed on 16 July 2025).
- Sims, R.E.H.; Mercado, P.; Krewitt, W.; Bhuyan, G.; Flynn, D.; Holttinen, H.; Jannuzzi, G.; Khennas, S.; Liu, Y.; O’Malley, M.; et al. Renewable Energy Integration. In Climate Change 2014: Mitigation of Climate Change. Contribution of Working Group III to the IPCC; Edenhofer, O., Pichs-Madruga, R., Sokona, Y., Farahani, E., Kadner, S., Seyboth, K., Adler, A., Baum, I., Brunner, S., Eickemeier, P., et al., Eds.; IPCC: Geneva, Switzerland, 2014. Available online: https://www.ipcc.ch/report/ar5/wg3/ (accessed on 16 July 2025).
- Wilkinson, S.J.; Ghosh, S.; Pelleri, N. Mandatory or Voluntary Approaches to Green Roof Implementation; UTS ePress: Ultimo, Australia, 2020; Available online: https://opus.lib.uts.edu.au/rest/bitstreams/32f91224-9a9c-4d48-a83c-cbd163bd3c45/retrieve (accessed on 16 July 2025).
- Passey, R.; Haghdadi, N.; Bruce, A.; MacGill, I. Photurgen: The open source software for the analysis and design of hybrid solar wind energy systems in the Caribbean region: A brief introduction to its development policy. Energy Policy 2017, 109, 631–641. [Google Scholar] [CrossRef]
- European Commission. 5 Things You Should Know About Solar Energy. Available online: https://energy.ec.europa.eu/news/5-things-you-should-know-about-solar-energy-2025-06-20_en (accessed on 20 June 2025).
- JRC Publications Repository. EU Solar Policy. Available online: https://publications.jrc.ec.europa.eu/repository/handle/JRC113070 (accessed on 20 June 2025).
- Li, H.; Xiang, Y.; Xia, Y.; Yang, W.; Tang, X.; Lin, T. What Are the Obstacles to Promoting Photovoltaic Green Roofs in Existing Buildings? The Integrated Fuzzy DEMATEL-ISM-ANP Method. Sustainability 2023, 15, 16862. [Google Scholar] [CrossRef]
- Sovacool, B.K. Hard and soft paths for climate change adaptation. Climate Policy 2011, 11, 1177–1183. [Google Scholar] [CrossRef]
- Rodrigues, S.D.; Garcia, V.J. Green roofs and facades with integrated PV. Renew. Sustain. Energy Rev. 2023, 170, 112999. [Google Scholar] [CrossRef]
- van der Roest, E.; Voeten, J.G.W.F.; Cirkel, D.G. Increasing solar panel output with blue-green roofs in water-circular and nature inclusive urban development. Build. Environ. 2023, 244, 110704. [Google Scholar] [CrossRef]
- Green Roofs and Facades with Integrated Photovoltaic System for Zero Energy Eco-Friendly Building—A Review. Available online: https://www.researchgate.net/publication/373709434_Green_roofs_and_facades_with_integrated_photovoltaic_system_for_zero_energy_eco-friendly_building_-A_review (accessed on 20 June 2025).
Disclaimer/Publisher’s Note: The statements, opinions and data contained in all publications are solely those of the individual author(s) and contributor(s) and not of MDPI and/or the editor(s). MDPI and/or the editor(s) disclaim responsibility for any injury to people or property resulting from any ideas, methods, instructions or products referred to in the content. |
© 2025 by the authors. Licensee MDPI, Basel, Switzerland. This article is an open access article distributed under the terms and conditions of the Creative Commons Attribution (CC BY) license (https://creativecommons.org/licenses/by/4.0/).