Article

A Real-Time Six-Axis Electromagnetic Field Monitoring System with Wireless Transmission and Intelligent Vector Analysis for Power Environments

1
School of Automation, Guangdong University of Technology, Guangzhou 510006, China
2
School of Geography and Remote Sensing, Guangzhou University, Guangzhou 510006, China
3
General Administration, Guangdong University of Technology, Guangzhou 510006, China
*
Author to whom correspondence should be addressed.
Appl. Sci. 2025, 15(19), 10785; https://doi.org/10.3390/app151910785
Submission received: 1 September 2025 / Revised: 3 October 2025 / Accepted: 4 October 2025 / Published: 7 October 2025

Abstract

Accurate and real-time monitoring of low-frequency electromagnetic field (EMF) is essential in power and industrial environments, yet most conventional approaches still suffer from limited spatial coverage, manual operation, and insufficient digitization. To address these challenges, this paper proposes an intelligent EMF monitoring system that integrates six-axis magnetic field sensing, temperature compensation, vector synthesis, Sub-1 GHz wireless communication, and real-time data visualization. The system supports simultaneous measurement of both AC and DC magnetic fields across the 30 Hz–100 kHz range, with specific optimization for power-frequency conditions (50/60 Hz). Designed with modular integration and low power consumption, it is suitable for portable deployment in field scenarios. Comprehensive laboratory and substation tests demonstrate high accuracy, with maximum measurement errors of 1.17% under zero-field and 1.42% under applied-field conditions—well below the ±5% tolerance defined by international standards. Wireless performance tests further confirm stable long-distance communication, achieving ranges of up to 5 km without significant transmission errors, while overall system measurement error reached as low as 0.015%. These results verify the system’s robustness, fidelity, and compliance with international safety standards. Overall, the proposed platform provides a practical and scalable solution for intelligent EMF monitoring, offering strong potential for deployment in industrial environments and infrastructure-critical applications.

1. Introduction

Electromagnetic fields (EMFs) within the 30 Hz–100 kHz range significantly affect the reliable operation of substations and power systems. At a power frequency of 50/60 Hz, magnetic fields can induce unwanted currents in protection relays and measurement devices, threatening grid stability [1]. In the kilohertz range, harmonics and conducted interference disturb SCADA communication, PLC signals, and other sensitive equipment [2,3]. High-order harmonics (>1.5 kHz) associated with renewable integration and nonlinear loads may also cause overheating and unintended breaker tripping, emphasizing the need for precise monitoring [4]. International standards such as IEC 61000-4 and IEEE Std C37 highlight the engineering importance of real-time EMF surveillance [5,6].
Beyond environmental assessment, magnetic field monitoring is increasingly used for equipment diagnostics. Transformer leakage field analysis [7] and drone-assisted magnetic inspection [8] have proven effective in detecting anomalies such as insulation degradation, grounding faults, and abnormal harmonics. Collectively, these findings confirm magnetic monitoring as both technically viable and practically valuable for substation safety assurance.
Nevertheless, existing monitoring devices face limitations. Although six-axis sensing—using two orthogonal Hall sensors per axis (X, Y, Z) to capture bidirectional components—has become common, it does not resolve key issues. Many systems rely on short-range protocols like Wi-Fi or BLE, which suffer from attenuation and instability in harsh or large-scale industrial environments. Even advanced prototypes often trade robustness or range for lower cost, and despite including six-axis sensing, they still show limited accuracy and diagnostic capability. Furthermore, most platforms can only detect either AC or DC fields, leaving them inadequate for substations where both coexist. Thus, current solutions still lack the robustness, versatility, and reliability needed for real deployments.
To address these challenges, this study proposes a real-time electromagnetic field monitoring platform integrating six-axis magnetic field sensors, dual-layer temperature compensation, and Sub-1 GHz wireless communication. The system is optimized for the 30 Hz–100 kHz band, with high accuracy at 50/60 Hz for power-frequency monitoring. Its design supports simultaneous AC/DC measurement and vector synthesis for reconstructing spatial magnetic distributions. Wireless performance tests demonstrate long-range capability—up to 5 km in open areas, 2 km in urban environments, and ~450 m in electromagnetically harsh substations—while maintaining stable throughput and negligible packet loss. No transmission errors or abnormal delays were observed during operation, confirming the reliability of the wireless link under practical deployment conditions. Experimental validation further confirms maximum errors of 1.17% (no external field) and 1.42% (applied field), both well within the ±5% tolerance defined by international standards [9].
Nevertheless, existing EMF monitoring systems remain limited in both technical scope and practical applicability, as summarized in Table 1. Although six-axis sensing (i.e., three orthogonal directions with paired differential sensors) is increasingly adopted to enhance measurement stability and reduce cross-axis interference, most platforms still exhibit critical trade-offs. For example, commercial systems such as MonitEM-IoT provide long-range NB-IoT/LTE-M connectivity, but recurring subscription fees and installation complexity significantly increase operational cost [10,11]. In contrast, academic prototypes such as that of Deprez et al. [12] integrate six-axis sensing but lack wireless transmission, which necessitates manual access and raises maintenance burden. Low-cost designs such as the prototype of Wohlmuthová et al. [13] employ Wi-Fi/BLE links and temperature compensation to reduce error (~2.5%). However, their limited transmission range of only a few tens of meters demands dense node deployment, ultimately inflating infrastructure cost and complexity [10].
These comparisons demonstrate that the overall cost of EMF monitoring systems is not dictated solely by component purchase prices, but also by hidden operational factors such as network subscription fees, deployment density, calibration requirements, and long-term maintenance [10,11]. At the same time, robustness has rarely been systematically addressed: calibration and drift remain major challenges in magnetic field sensing [14]. Similarly, compensation for temperature dependence has been shown to be essential for reliable long-term performance in field-deployed EMF monitoring systems [15]. A broader cost–quality–complexity perspective thus clarifies why no single existing approach achieves universal applicability, underscoring the necessity of balanced designs that integrate accuracy, robustness, and scalability without incurring prohibitive costs.
In parallel, recent research has introduced artificial intelligence (AI) methods to EMF monitoring, aiming to reduce measurement density and improve spatial estimation. For instance, ExposNet applies convolutional neural networks with GIS features to predict RF-EMF exposure in urban areas (a recent preprint, arXiv:2503.02966), while Famoriji & Shongwe (2025) employ random forest regression to estimate near-field exposure around 5G base stations [16]. Very recent studies have also compared neural network architectures for low-density sensor networks, addressing the trade-offs between estimation accuracy and computational cost (a recent preprint, arXiv2504.07990). Although promising, these approaches often emphasize RF exposure, assume relatively stable environments, and seldom consider AC/DC coexistence or temperature effects.
Taken together, these insights highlight a pressing need for EMF monitoring systems that combine accuracy, robustness, versatility, and cost-effectiveness. This study therefore develops a real-time monitoring platform that integrates six-axis sensors, thermal compensation, and Sub-1 GHz wireless communication, providing a practical foundation for both environmental surveillance and equipment diagnostics in substations.

2. Overall Design Scheme of the System

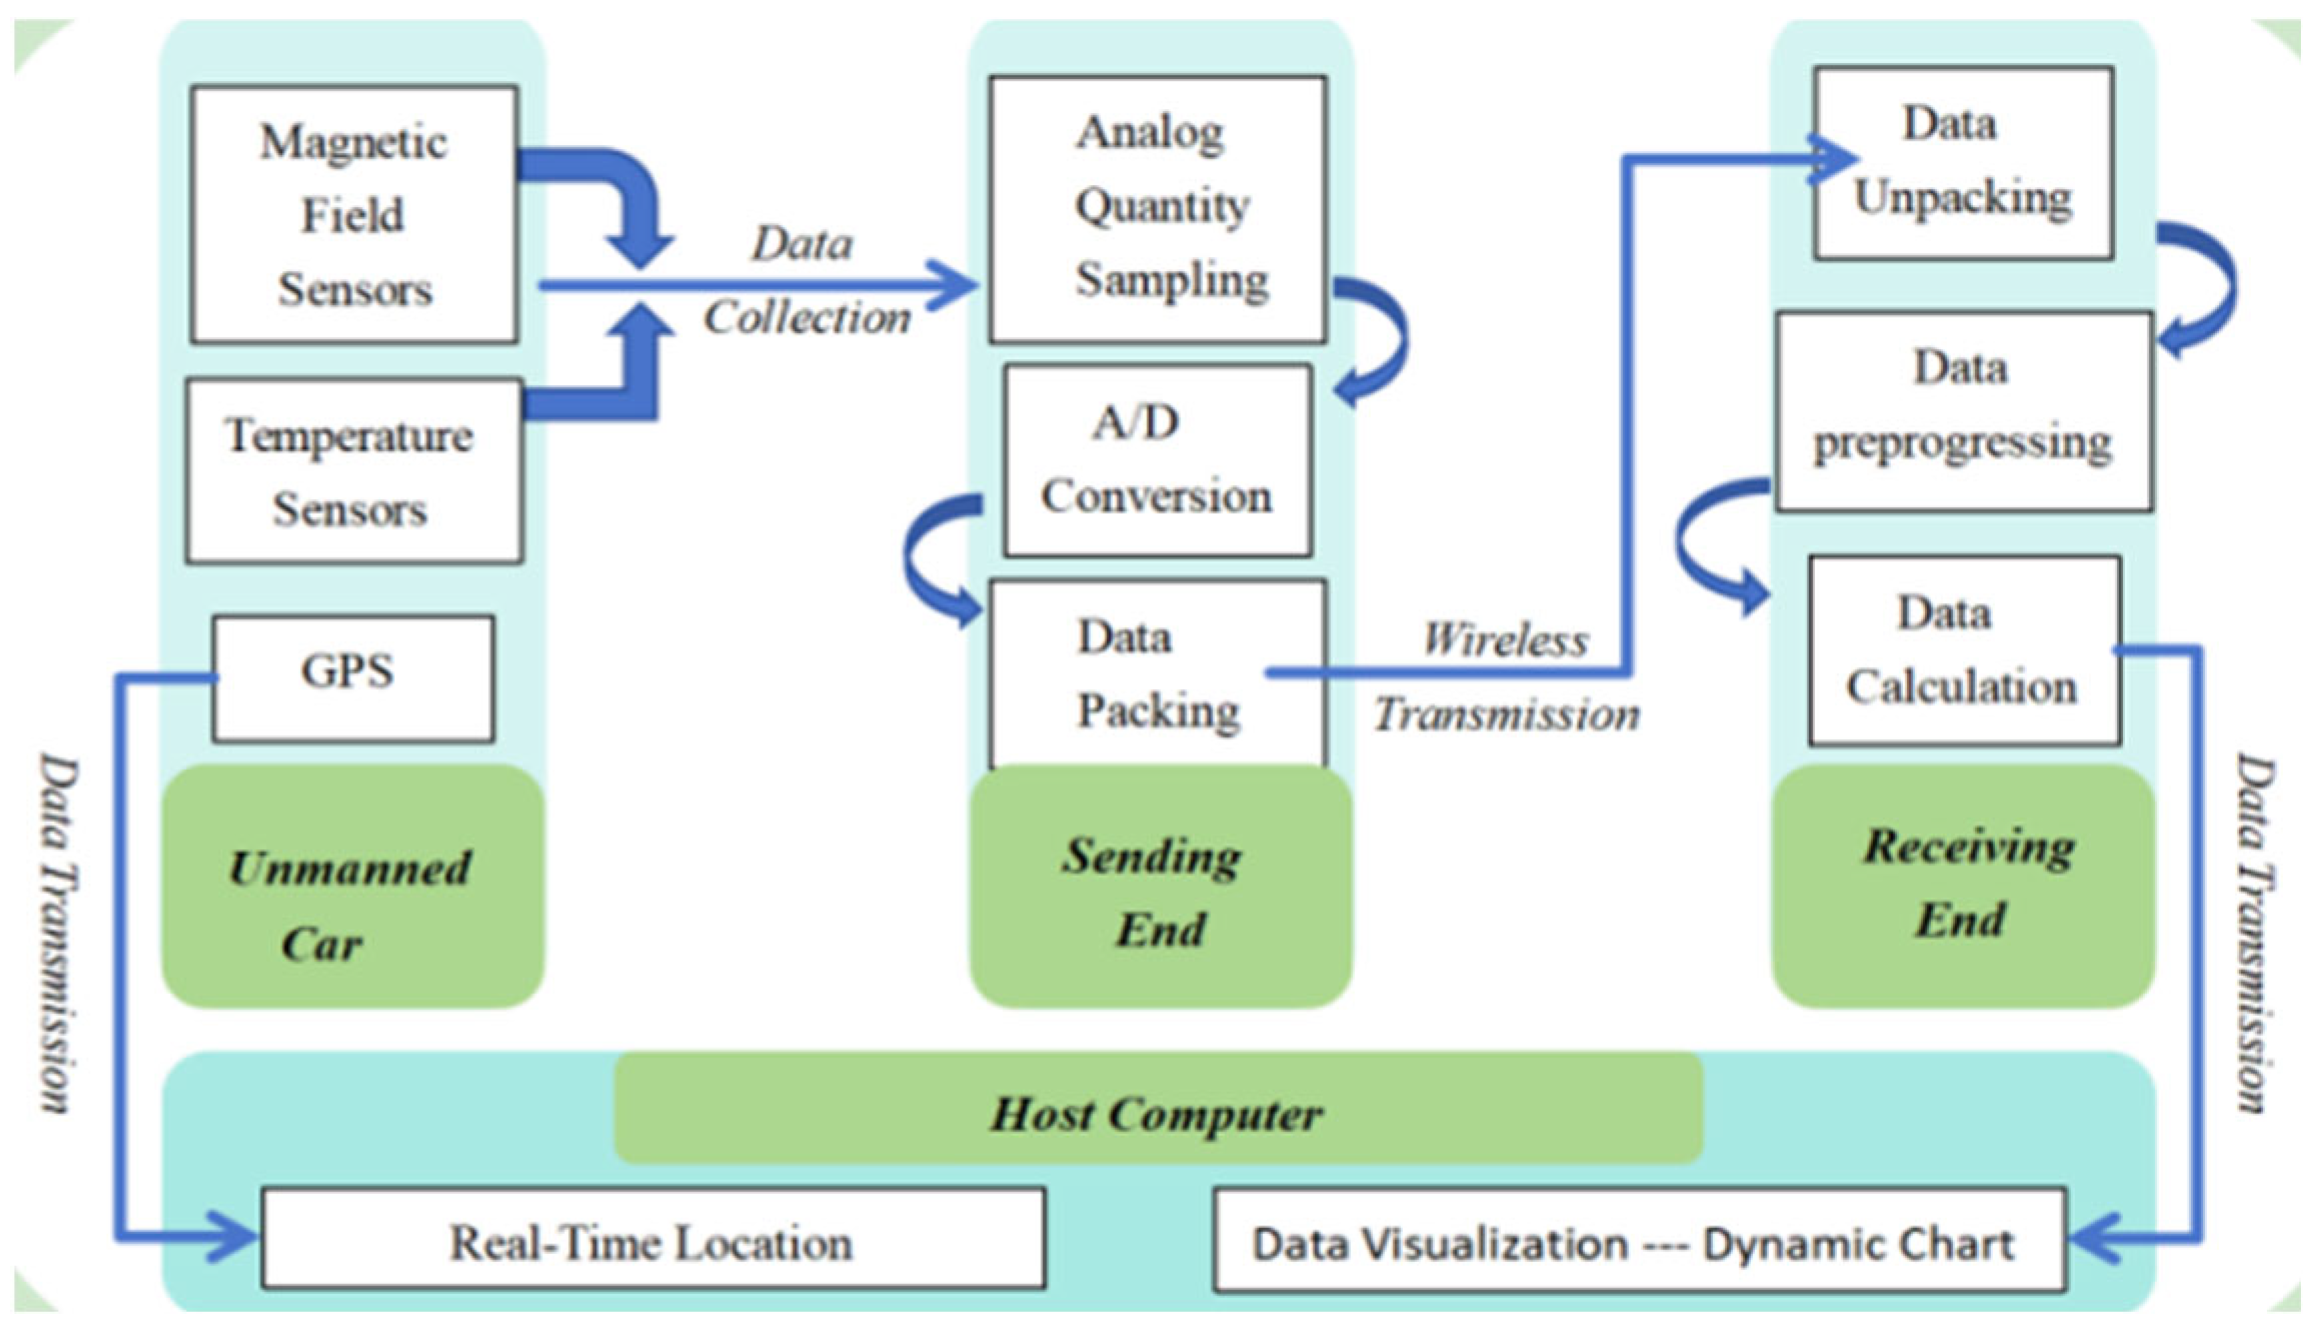
Figure 1 shows the architecture and workflow of the proposed EMF monitoring system, which integrates sensing, transmission, processing, and visualization into a unified platform. As shown in Figure 1, the system consists of four main modules:
Sensing unit, which collects magnetic field and temperature data in real time.
Sending unit, which digitizes the analog signals and packages them for wireless transmission.
Receiving unit, which unpacks and preprocesses the transmitted data.
Host computer, which performs real-time visualization, storage, and user interaction.
This modular design enables six-axis magnetic field measurement, AC/DC field monitoring, and long-range wireless communication, while ensuring portability and scalability for deployment in substations and industrial environments. By emphasizing functional integration, the system achieves compactness and reliability, offering a practical solution for electromagnetic diagnostics in power applications.

3. Hardware Design

3.1. Sensors Selection

To ensure reliable magnetic field acquisition in industrial environments, the system employs a proportional Hall-effect sensor (DRV5055A1QDBZR). The device outputs a linear voltage centered at VCC/2 under zero-field conditions and maintains stable response across the DC–120 kHz bandwidth, covering the 30 Hz–100 kHz range of interest. Its built-in temperature compensation mitigates thermal drift, important for NdFeB and ferrite magnets whose residual induction decreases by ~0.12%/°C and ~0.20%/°C, respectively. Additional features—such as multiple sensitivity options, low noise density, and a wide operating range (−40 °C to 125 °C)—support flexible, stable, and cost-effective deployment in thermally dynamic environments.
To complement this, an LM50 analog temperature sensor provides real-time ambient feedback (±2 °C accuracy), enabling dynamic correction of residual drift beyond the Hall sensor’s internal compensation. Together, the DRV5055 and LM50 form a dual-layer compensation strategy: intrinsic correction within the Hall sensor and adaptive calibration from external feedback.

3.2. Measurement Circuit Design

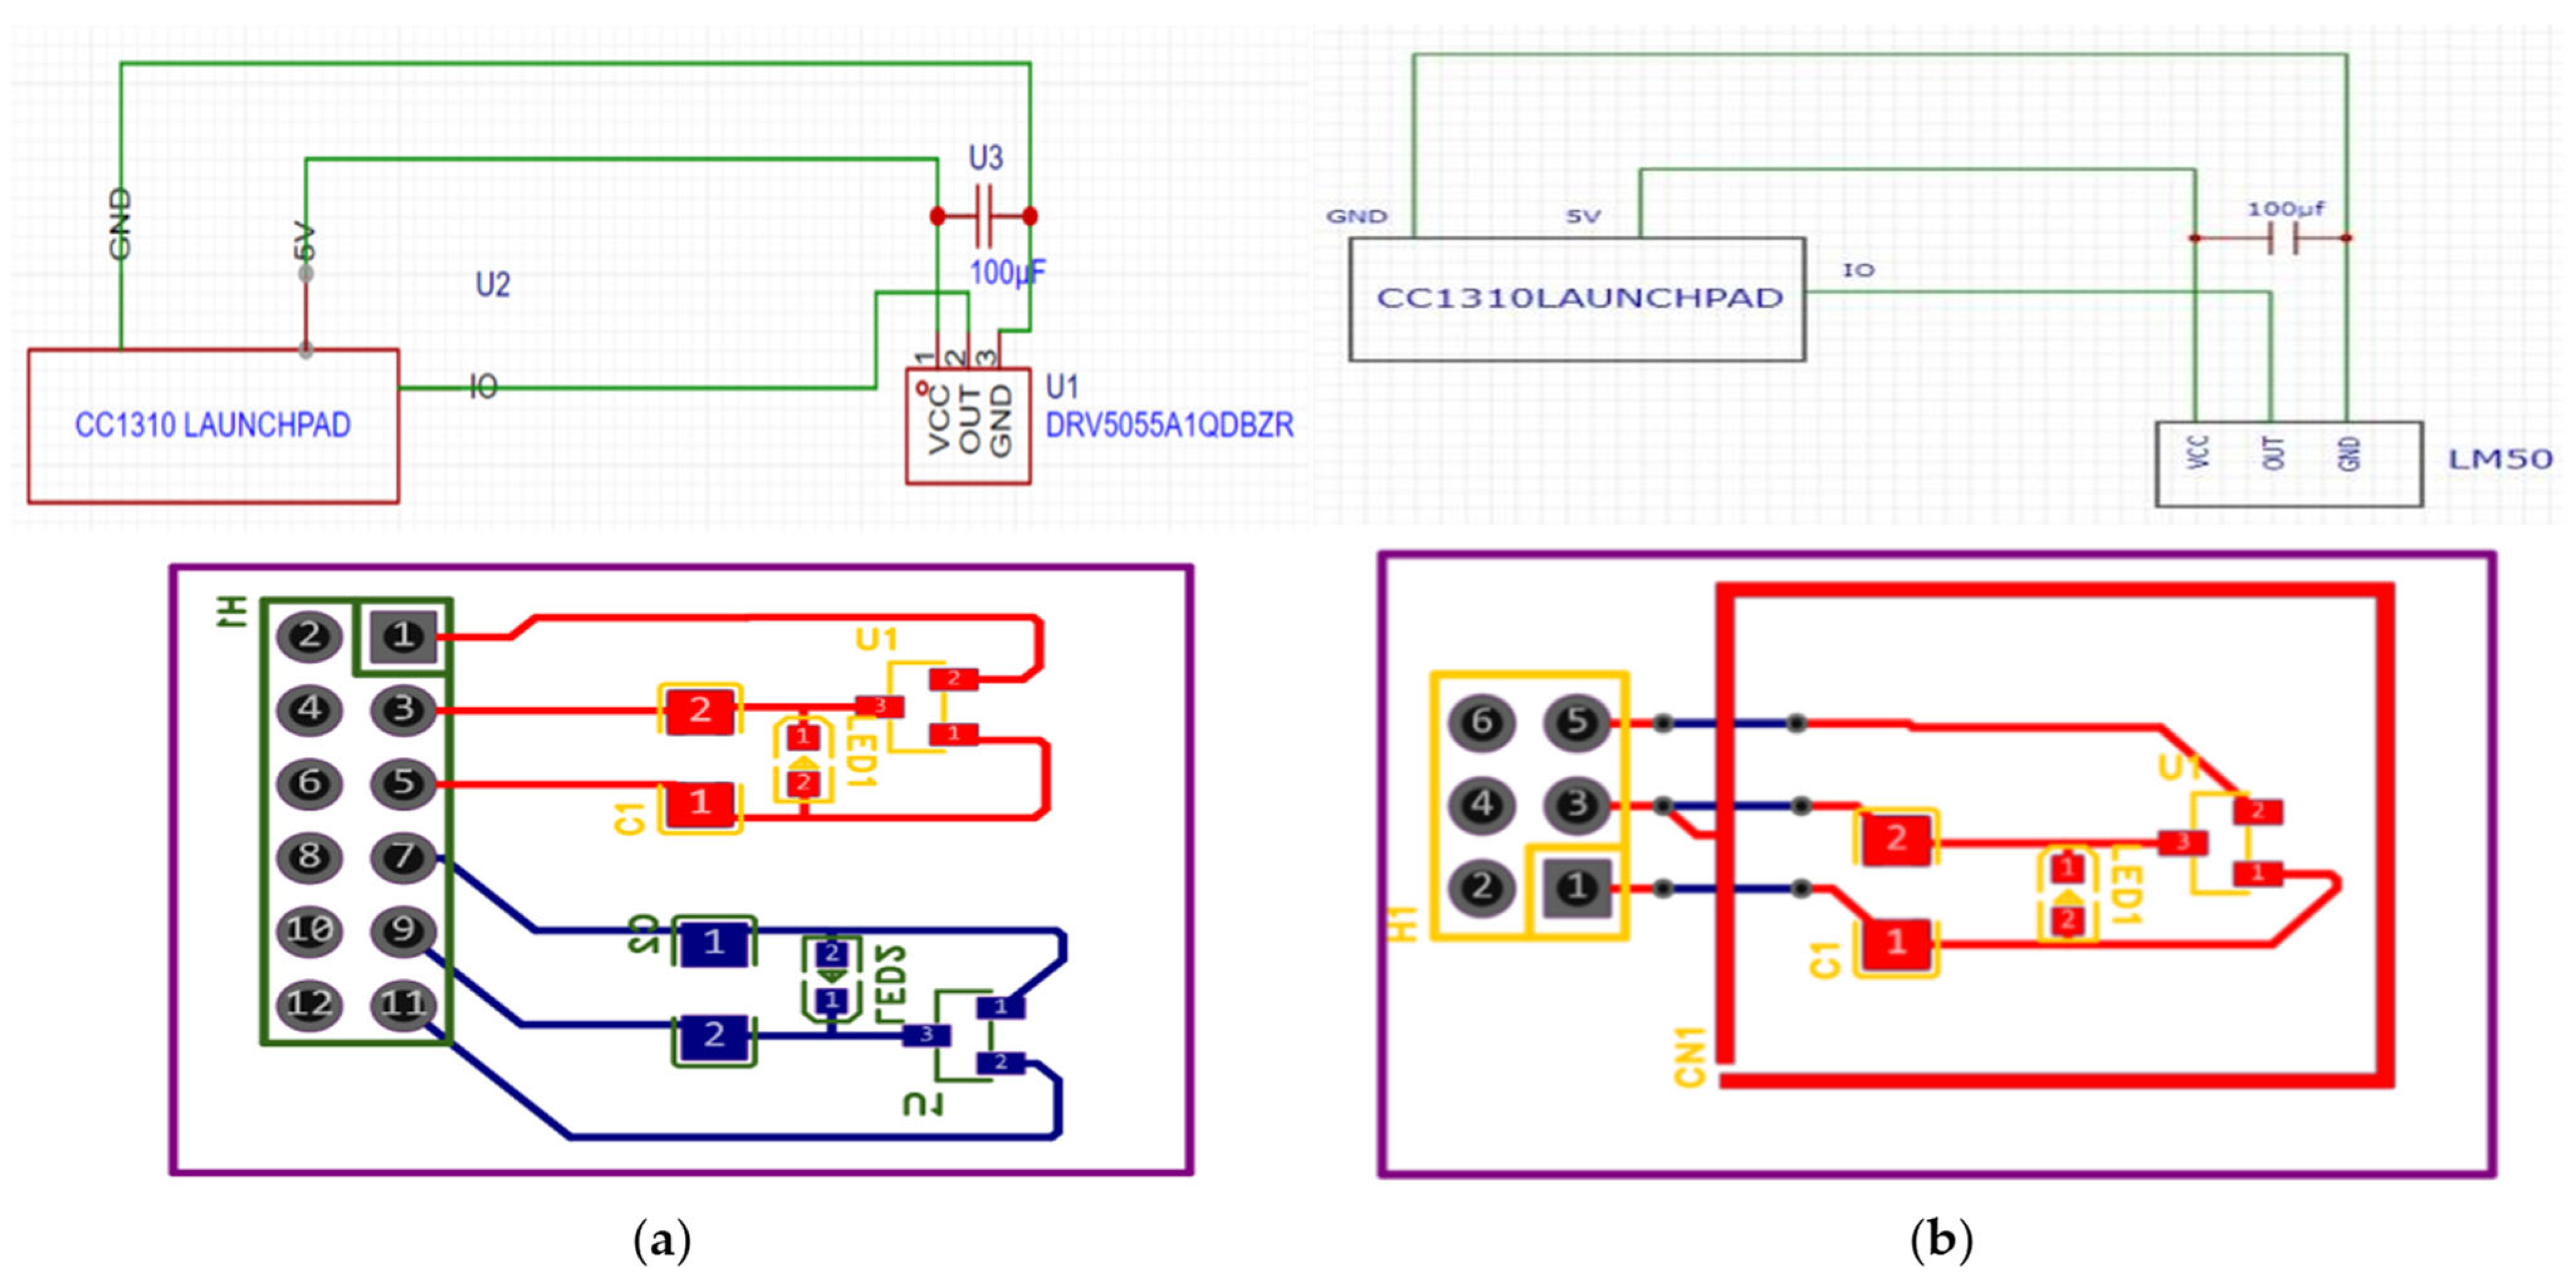
Figure 2 shows the sensing module circuit, integrating power stabilization, signal conditioning, and EMC protection. In high-sensitivity analog systems, power integrity is critical. A 100 μF decoupling capacitor suppresses supply fluctuations, and a power-status LED provides basic diagnostics.
To enhance EMC performance, sensitive analog traces were isolated from digital lines, with a continuous ground plane under the front-end. A grounded guard around the Hall sensor inputs minimized capacitive coupling, while optimized trace geometry (increased spacing, narrower widths) and an inserted shielding plane reduced parasitic capacitance. These measures prevented startup delays and improved overall stability.
Validation confirmed their effectiveness: under zero-field conditions, the RMS noise floor remained below 20 μV, well under the DRV5055 resolution. Immunity checks with injected 50 Hz–20 kHz disturbances showed deviations under ±1.5%, consistent with EMC standards [9]. Empirical tests indicated that shielding reduced parasitic interference by 40–60% without affecting layout.
Similar strategies were applied to the LM50 temperature sensor. A matched ground guard trace, fabricated with 2-oz copper foil and connected to the ground plane, effectively suppressed external interference.
Overall, these hardware-level measures reduced noise, improved EMC immunity, and ensured reliable sensing in high-voltage industrial environments.

3.2.1. Temperature Compensation

Datasheet values indicate that the uncompensated sensitivity drift of the DRV5055 is approximately 0.12%/°C. To mitigate this effect, the LM50 sensor was integrated to provide real-time ambient temperature feedback. Its output was digitized and used for linear correction in firmware, with a single-point offset adjustment at room temperature. In our laboratory tests, the maximum ambient variation was about 10 °C, which corresponds to an expected drift of ~1.2% of full scale based on the datasheet coefficient. This estimate is consistent with the observed error band of approximately ±2% across 0–80 °C, remaining below the ±5% tolerance defined by international standards [9]. Nevertheless, these results were obtained from short-term observations only, without systematic long-term temperature cycling or extended field deployments. Accordingly, the findings should be regarded as indicative rather than conclusive. Prior work has demonstrated that rigorous multi-point calibration and temperature cycling are critical to achieving long-term robustness in electromagnetic field measurement systems [15].

3.2.2. Emc and Stability Considerations

In high-sensitivity analog systems, electromagnetic compatibility (EMC) and power integrity are essential for reliable long-term operation. The proposed monitoring system integrates hardware- and layout-level measures to suppress noise coupling and maintain stability in electromagnetically harsh environments such as high-voltage substations.
At the power interface, decoupling capacitors across VCC and GND attenuate voltage fluctuations and transient noise. A power-status LED provides a simple visual check of supply continuity, with illumination indicating normal operation.
On the PCB, parasitic capacitance (Cp) between adjacent traces was identified as a key source of crosstalk. Two strategies were applied [9]:
  • Increasing trace spacing and reducing conductor width in sensitive regions and inserting a dedicated ground plane between power and signal lines. Previous studies have experimentally demonstrated that such shielding can reduce parasitic coupling by approximately 40–60% while maintaining board compactness.
Together with PCB-level shielding and power decoupling, these measures improve noise immunity, measurement fidelity, and overall robustness, enabling the monitoring system to maintain high accuracy under strong interference. This design helps address a key limitation of conventional EMF monitoring devices and supports consistent performance in practical field environments.

3.3. Wireless Communication Module Design

Reliable wireless transmission is essential for real-time EMF monitoring in substations, where EMI, metallic structures, and limited infrastructure often degrade signal quality. To meet these challenges, the system employs a dual-node architecture built on the TI CC1310 platform, chosen for its low power consumption and industrial-grade robustness.
Operating in the 433–915 MHz Sub-1 GHz band, the CC1310 offers stronger wall penetration and lower attenuation than conventional 2.4 GHz solutions. Its support for multiple modulation schemes and forward error correction (FEC) further reduces packet loss in interference-prone environments.
In the proposed design, CC1310 transceivers are deployed at both the sensing node and the receiver. The sensing unit digitizes and encodes sensor outputs, transmits packets wirelessly, and the receiver relays them via UART to the host computer for real-time visualization and storage. This setup avoids wiring constraints while preserving low latency and stable throughput.
Additional benefits include multi-interface support (SPI, UART, I2C) for easy subsystem integration and ultra-low-power operation, which extends the runtime of mobile inspection platforms. Collectively, these features enable long-range, energy-efficient, and interference-resilient transmission—critical for scalable EMF monitoring in modern power grids.

4. Software Design

The system software links data acquisition, wireless transmission, and host-side visualization into a unified workflow. On the embedded side, the TI CC1310 platform was programmed in Code Composer Studio (CCS v12) to handle sensor control, A/D conversion, and packet framing for low-latency transmission. At the receiving end, MATLAB (The data were processed using MATLAB R2019a, The MathWorks Inc., Natick, MA, USA) parses serial inputs, reconstructs structured arrays, and plots the results in real time. This interface enables intuitive monitoring of electromagnetic field variations and system status. By combining lightweight embedded code with high-level visualization, the architecture achieves both efficient performance and ease of use.

4.1. Design of Sample Conversion Module

The sample conversion module links the analog sensing hardware with the digital processing pipeline. Using the STM32F103’s 12-bit ADC, Hall-effect and temperature signals are sampled as voltages and converted into magnetic flux density (mT) and temperature (°C) via calibrated response curves. Accuracy is improved through oversampling, digital averaging, and real-time temperature correction with LM50 feedback, which compensates for residual drift beyond the sensor’s built-in adjustment.
Each processed record is then packaged into a data frame containing a timestamp, three-axis field values, and temperature, ensuring consistent interpretation by wireless and visualization modules. Executed within a few milliseconds, this process supports near real-time monitoring. By isolating signal conditioning and conversion into a dedicated block, the architecture remains modular and easily extensible for future upgrades such as added channels or adaptive calibration.

4.2. Design of Wireless Transmission Module

To support reliable real-time communication in electromagnetically harsh environments, the system adopts a packet-based protocol optimized for Sub-1 GHz operation. Built on the TI CC1310 transceiver with a 433 MHz PCB trace antenna, the design prioritizes integration and low power consumption. Although the chip supports up to 20 km with high-gain antennas, the compact internal configuration provides ranges consistent with practical industrial deployments while maintaining strong EMI resilience.
Sensor outputs are transmitted at 115,200 bps, with each of the seven channels producing a 32-bit value. These are segmented into 8-bit units, combined into a 28-byte payload, and sent every 50 ms—a rate tuned to balance throughput, efficiency, and interference suppression. At the receiver, packets are reassembled according to channel identifiers, preserving data order and integrity.
This modular protocol achieves low packet loss, stable latency, and scalability, allowing additional sensing channels or adaptive sampling strategies to be incorporated without altering the transmission core.

4.3. Software Design of Data Receiver

The host-side visualization module acts as the human–machine interface of the platform, providing real-time monitoring and feedback. Implemented in MATLAB, it decodes the 115,200 bps serial stream into structured arrays of six magnetic field components (X1, X2, Y1, Y2, Z1, Z2) and temperature, each tagged with a timestamp for time-domain analysis. Signals are displayed in synchronized plots that update at sub-second intervals, allowing operators to observe field variations intuitively.
To avoid excessive memory usage during long-term operation, a sliding-window buffer preserves only the latest 30 seconds of data. All panels share consistent axis labels (μT for magnetic flux density, °C for temperature) and a uniform time scale for rapid interpretation.
By combining real-time decoding, visualization, and memory management, the module ensures responsive monitoring and reliable anomaly detection in high-voltage substations and other industrial environments.

5. System Test

5.1. Software Module Testing

5.1.1. Sample Conversion Module Buffer Test

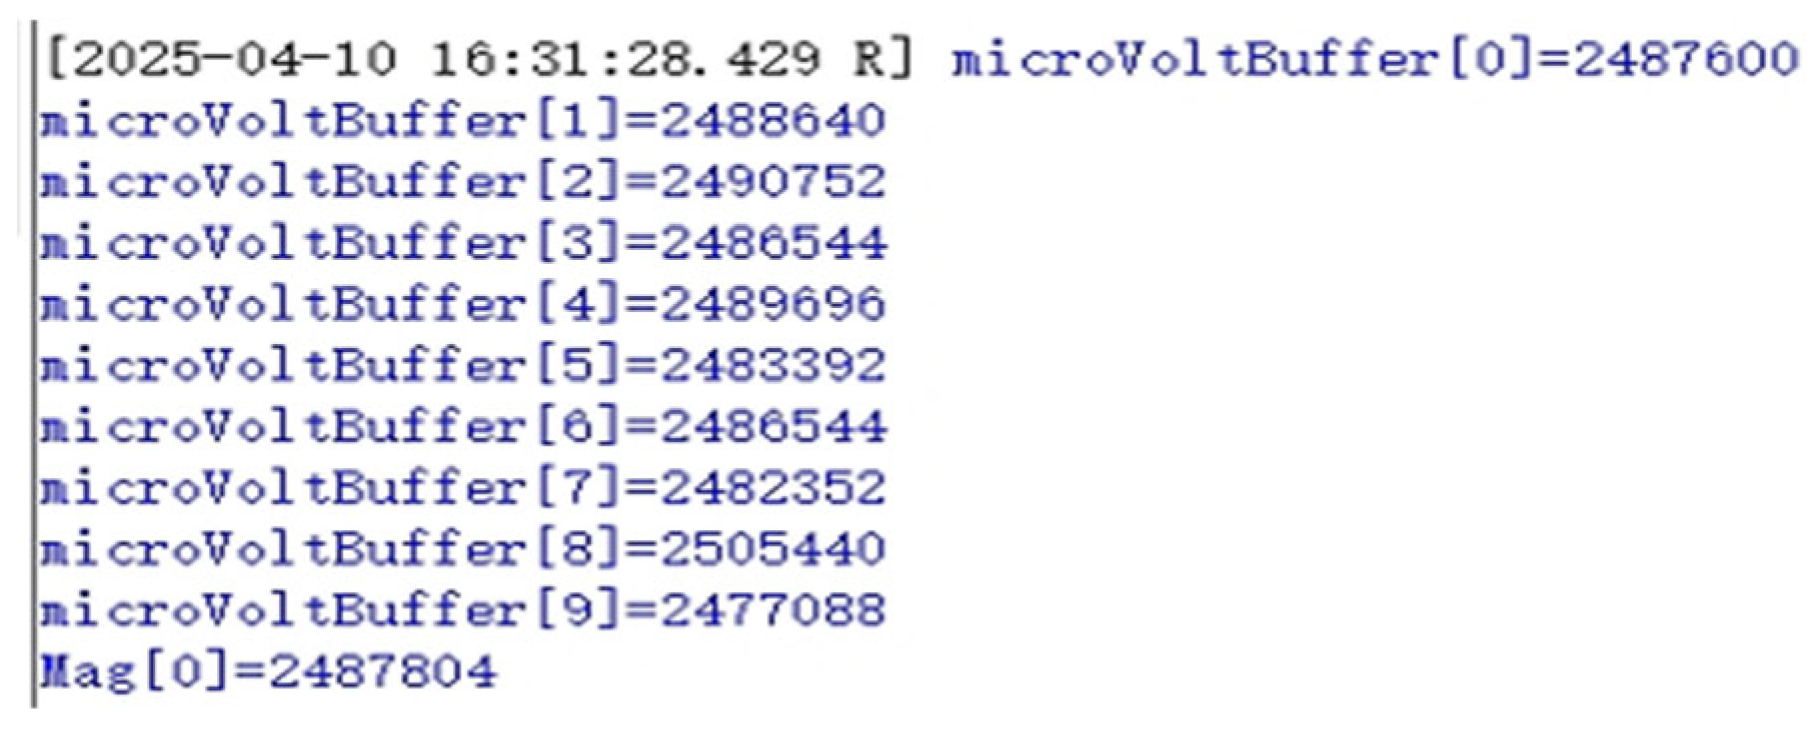
To validate the integrity of signal buffering and UART-based data transmission, the Display and UART functions were integrated into the transmission module firmware. During execution, the system first verifies the sampled data values stored in microVoltBuffer[q] across all active channels to ensure correct voltage acquisition (As shown in Figure 3). Following this, the processed magnetic field values in Mag[q] (i.e., the magnitude of the magnetic field vector q) are cross-checked against expected reference values. This two-stage verification ensures both raw data capture and subsequent conversion into calibrated magnetic field values are functioning reliably within the expected accuracy bounds.
To establish a reference baseline for system accuracy under quiescent conditions, a static test was conducted in the absence of any external magnetic field. Under this condition, the output voltage of the DRV5055 Hall-effect sensor, measured via a calibrated multimeter, was consistently recorded at 2.48 V. According to international electromagnetic radiation monitoring standards, measurement error must remain within ±5% for power-frequency magnetic fields ranging from 30 Hz to 100 kHz and exceeding 200 nT at a nominal ambient temperature of 24 °C. This benchmark serves as the target threshold for evaluating the system’s sampling and conversion accuracy in subsequent tests.
To validate measurement consistency under applied field conditions, the system was tested using a permanent magnet as the excitation source. A calibrated low-frequency Gaussmeter was used to measure the true magnetic field strength, which was then compared with the system’s converted sensor readings. Results confirmed close agreement between the two sources, indicating accurate field reconstruction. The Hall sensor output remained consistent with the previously established 2.48 V baseline in zero-field conditions, confirming sensor linearity and stability across operational states.
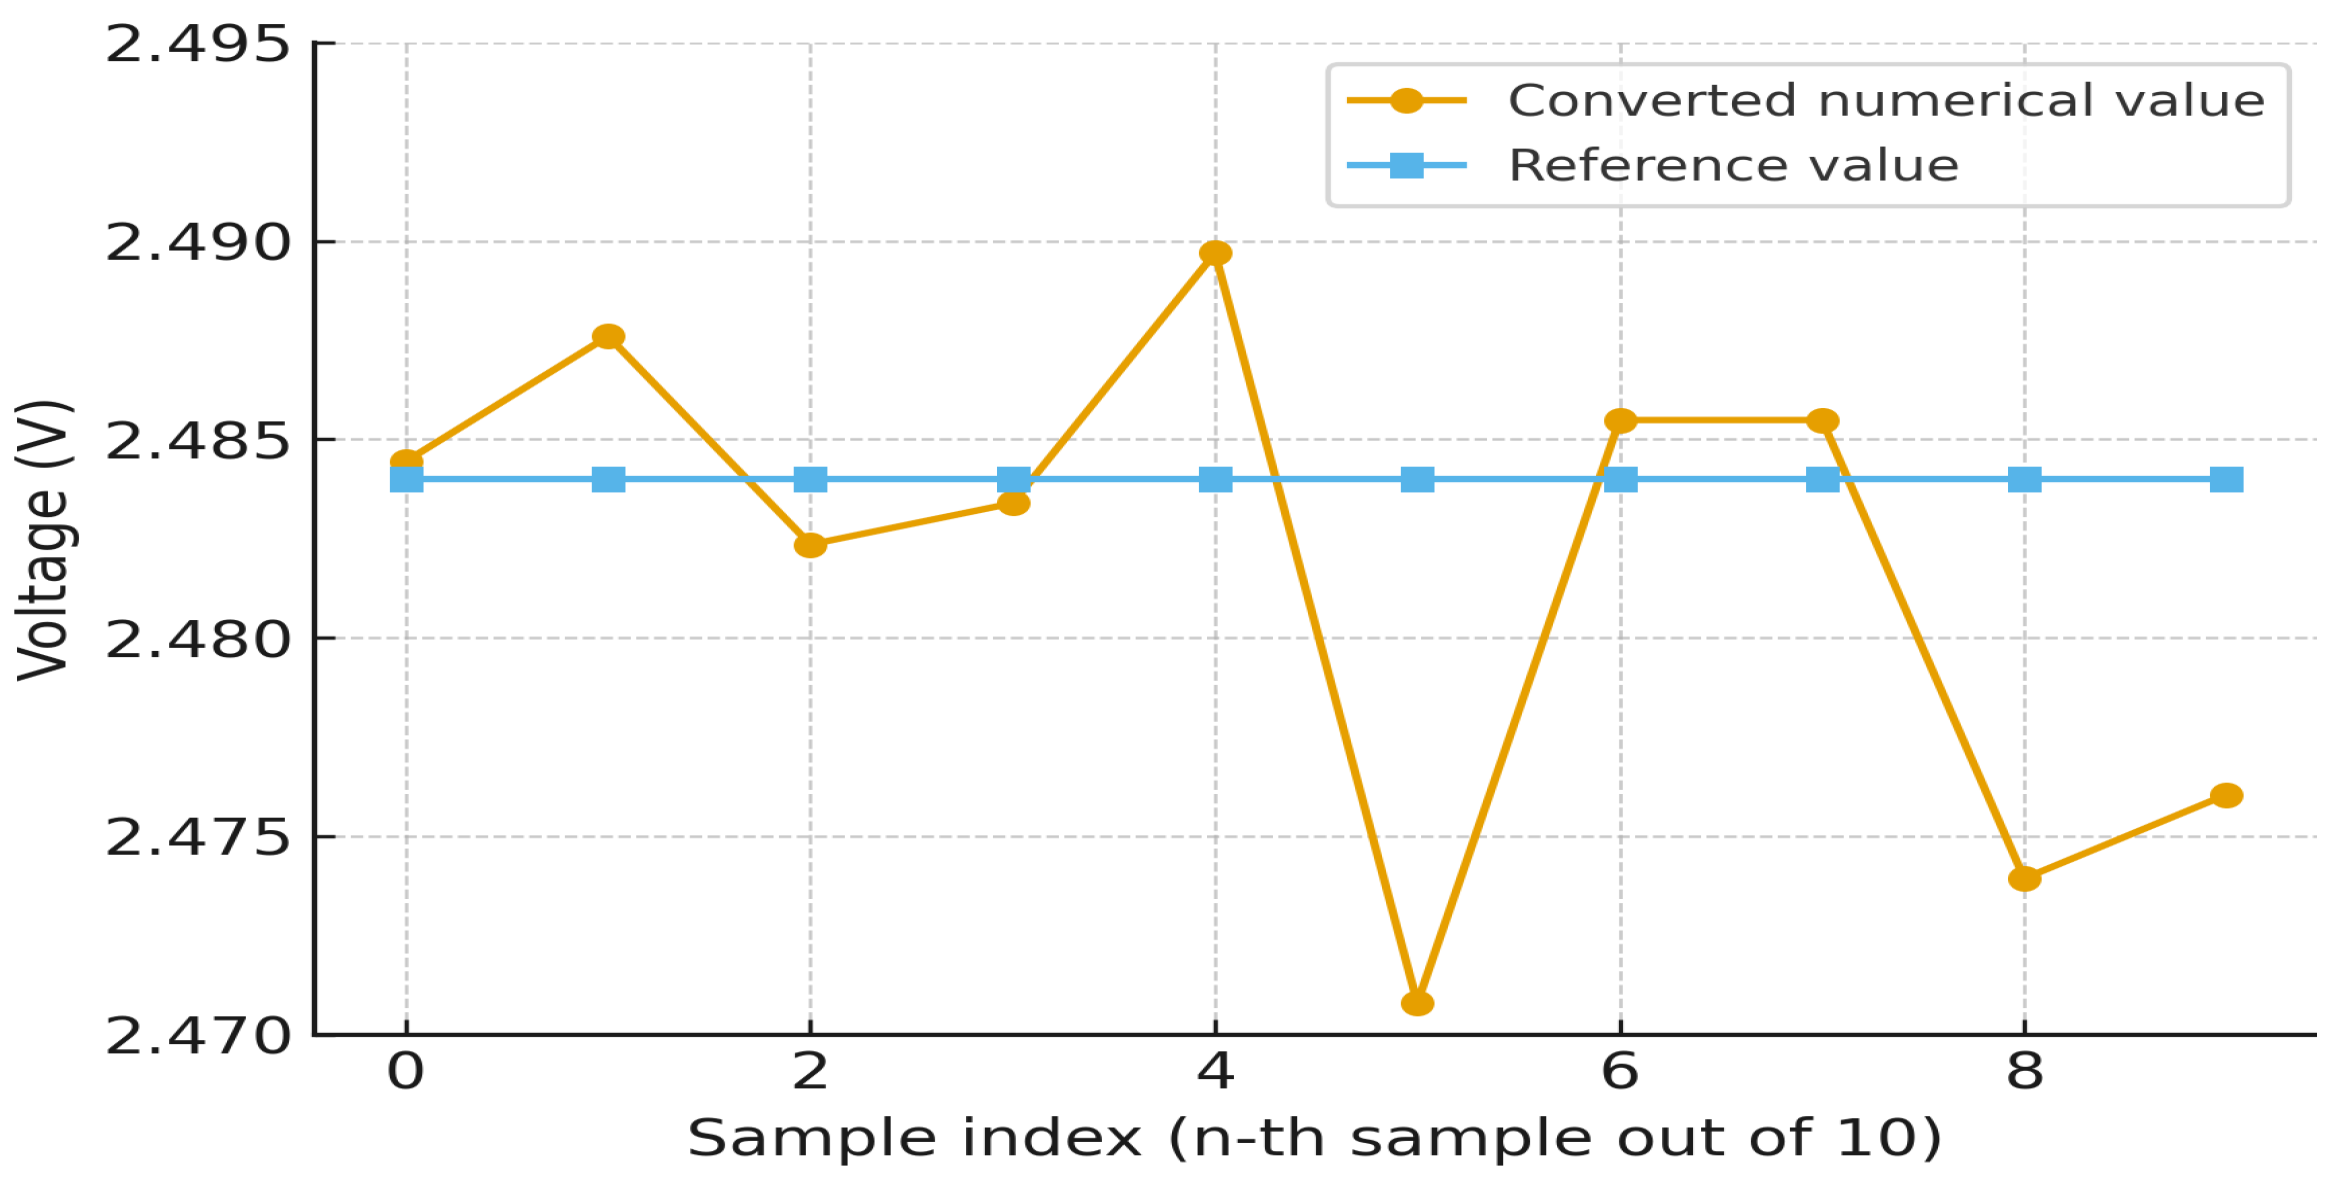
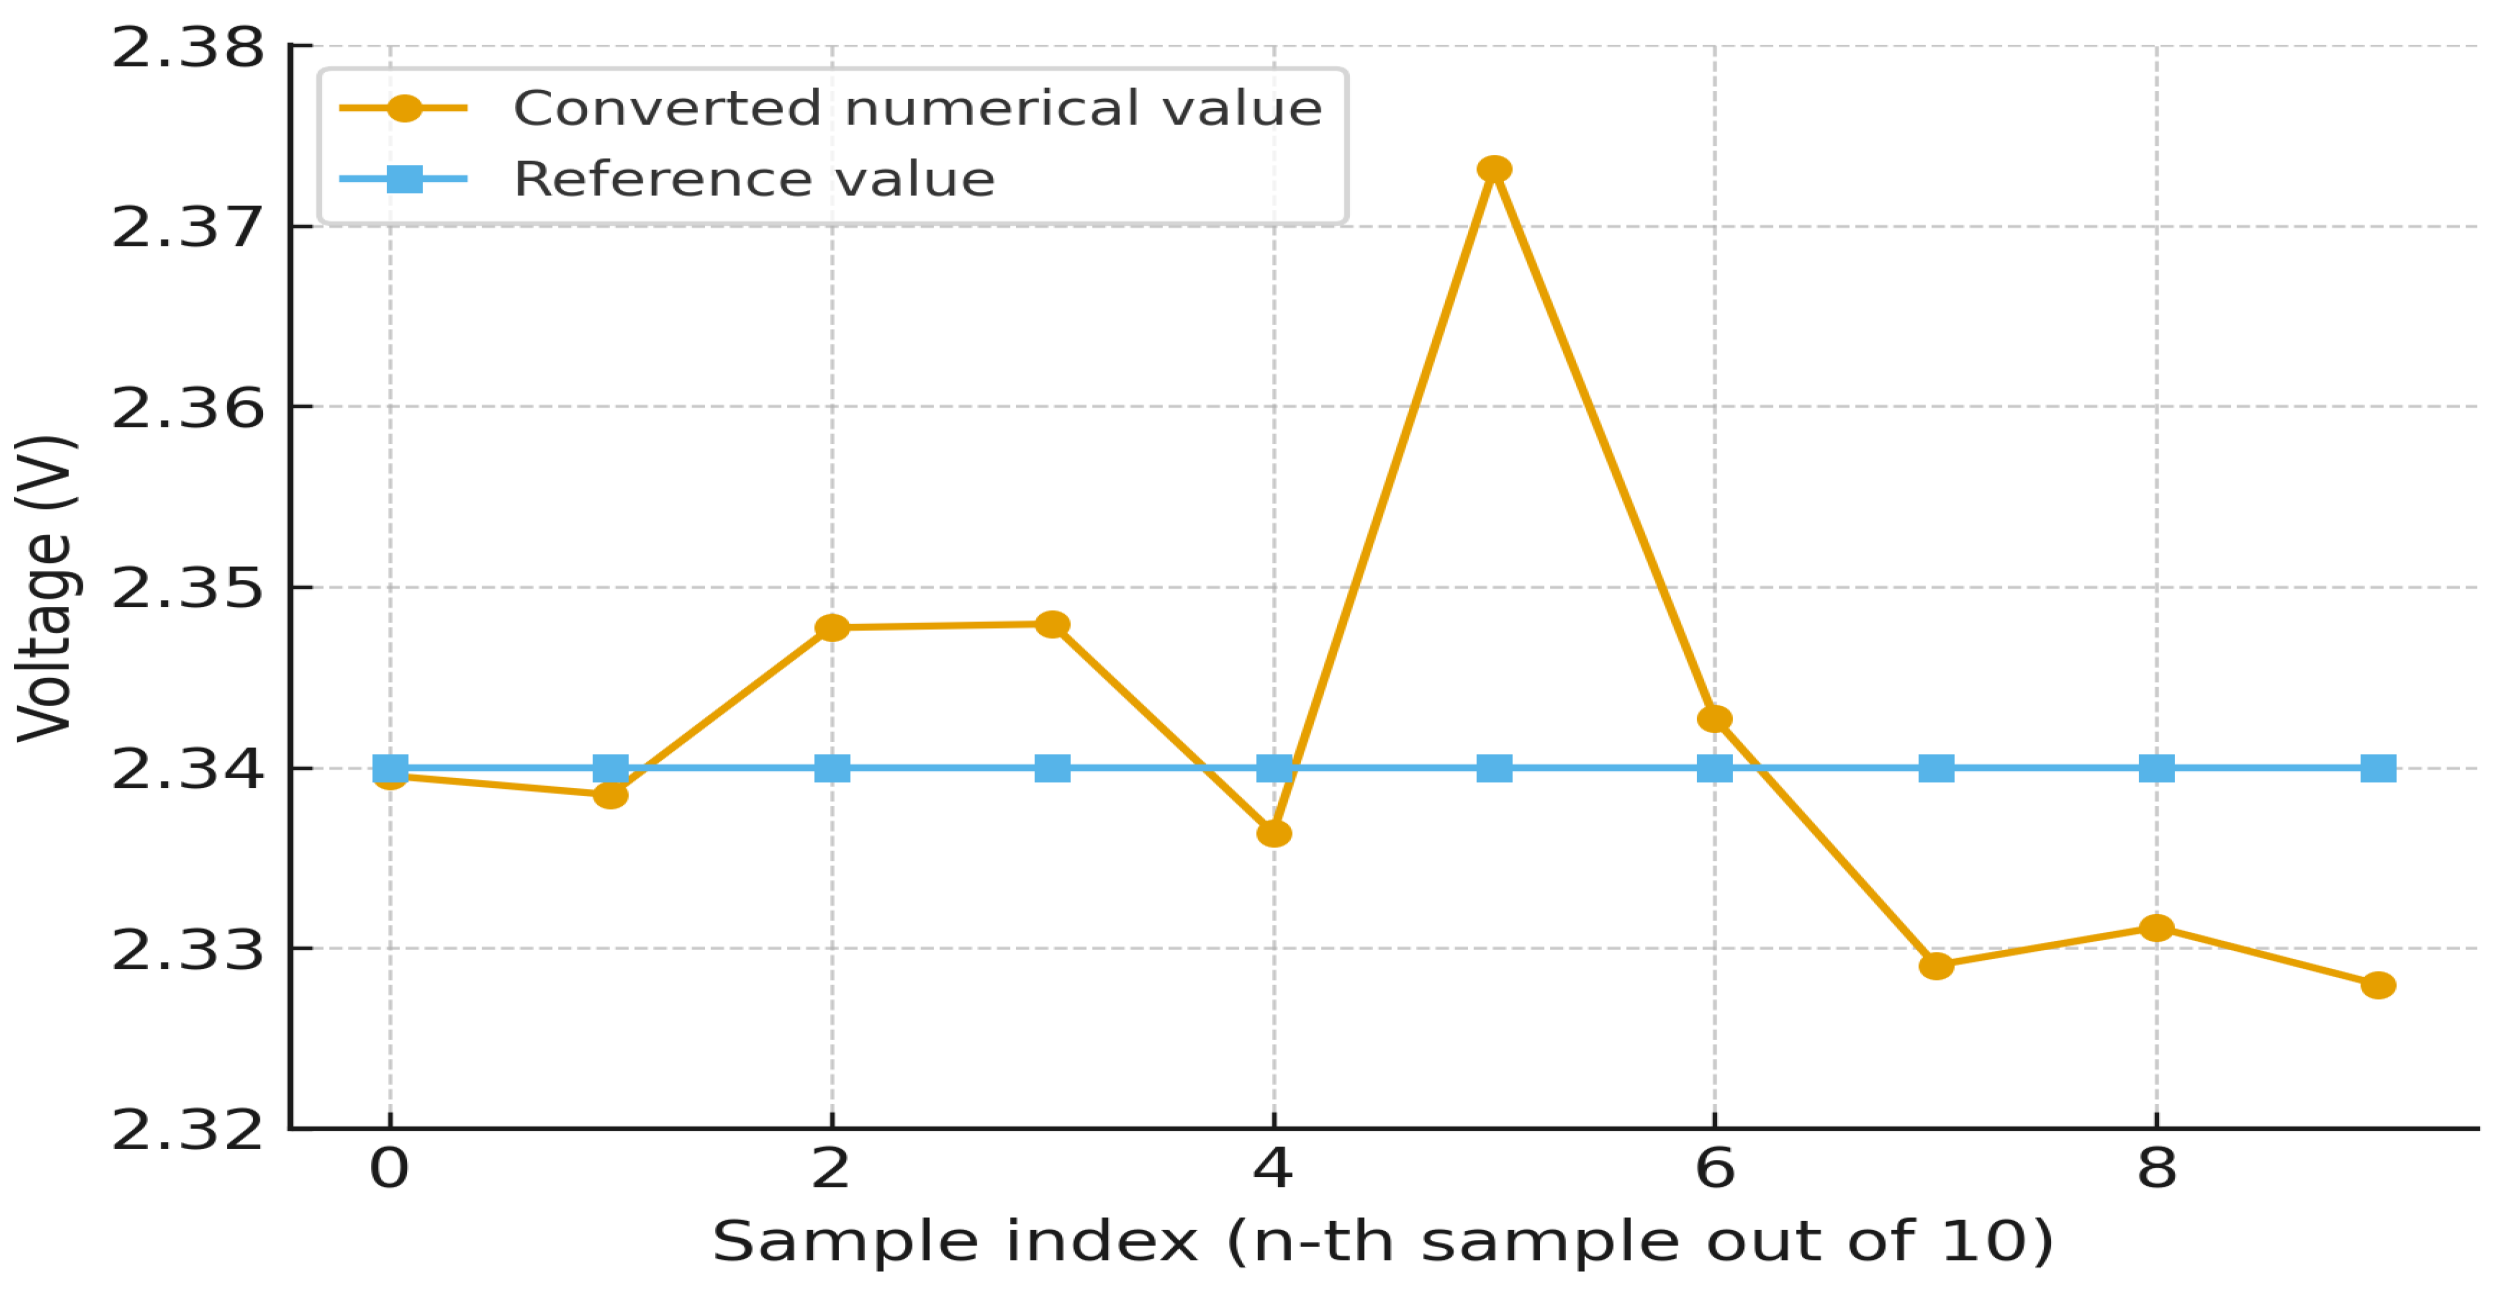
Building on the previously established baseline and experimental validation, the sampling conversion module of the proposed electromagnetic field monitoring system demonstrates superior accuracy and stability. Under static, zero-field conditions, the maximum observed channel conversion error was limited to 1.17%, with an average of just 0.72%—well below the international ±5% tolerance threshold for power-frequency magnetic fields above 200 nT (Figure 4 shows the specific data measured by the system, and Table 2 shows the error calculated from the data). Under applied-field tests using a permanent magnet, the maximum observed error was 1.42%, while nine other channels maintained deviations within 0.5% (Figure 5 shows the specific data measured by the system, and Table 3 shows the error calculated from the data).
These results confirm the effectiveness of the system’s optimized ADC calibration, multi-channel buffering strategy, and built-in sensor compensation in suppressing error propagation. In practice, each acquisition cycle was triggered every 0.5 s, buffering 10 × 200 samples per batch (2000 samples). While only two representative batches (with and without external fields) are shown in the figures for clarity, continuous long-duration sampling produced numerous batches, all of which consistently complied with the ±5% tolerance margin. This systematic validation demonstrates that the observed results are not isolated cases but representative of the complete data collection. Consequently, the system achieves reliable magnetic field measurement performance even under fluctuating or complex electromagnetic conditions, supporting its deployment in industrial-grade monitoring applications.
To comprehensively assess measurement accuracy, three error metrics were analyzed: Peak Error (PE, 1.42%), Mean Absolute Error (MAE, 0.72%), and Root Mean Square Error (RMSE, 0.76%), all derived from ten-channel measurements under static and applied-field conditions. These indicators are internationally recognized and recommended in metrology practice as complementary measures of accuracy and robustness, consistent with the guidelines outlined in ISO/IEC Guide 98-3 [17].
Quantization error: For a 12-bit ADC with a 0–3.3 V reference span, the least significant bit (LSB) corresponds to 3.3 V/4096 ≈ 0.000806 V (0.806 mV). According to the calibration slope (≈2550.9 μT/V), this voltage step corresponds to ≈2.0 μT, or about ±0.5% of full scale (5000 μT). Such step-induced deviations directly manifest as peak errors in discrete measurement systems, a phenomenon consistently characterized using PE in ADC evaluation standards [18].
Nonlinearity: During calibration against a Helmholtz coil, the linear regression residuals were analyzed. The maximum deviation of measured points from the fitted line was ≈15 μT, which corresponds to about ±0.3% of full scale. This provides an empirical estimate of the nonlinearity contribution. Similar to prior metrological studies, the average unsigned residual is best captured by MAE, which robustly represents average model deviation [19].
Thermal drift: The DRV5055 datasheet specifies a sensitivity drift of ~0.12%/°C. With the maximum 10 °C variation observed in laboratory tests, the expected drift is 0.12%/°C × 10 °C ≈ 1.2% of full scale. RMSE, which emphasizes the influence of occasional larger discrepancies, is particularly suited to quantify such drift-induced variations, as commonly applied in forecast and measurement accuracy assessments [20].
Summing these contributions gives an overall expected error on the order of 2%, which is consistent with the experimental results (PE = 1.42%, MAE = 0.72%, RMSE = 0.76%). These quantified metrics not only clarify the origin of the reported accuracy indicators but also enhance the transparency of system performance, aligning with general measurement uncertainty reporting practices [17].
These quantified metrics not only clarify the origin of the reported PE, MAE, and RMSE values but also enhance the transparency of system performance, aligning with reporting standards such as ISO/IEC 17025 [21].
P E = M x R x R x × 100 %
M A E = 1 N i = 1 N M i R i
RSME = 1 N i = 1 N M i R i 2
M i represents the magnetic field value measured by the proposed system (in μT).
R i represents the reference value measured by a standard high-precision Gaussmeter.
N denotes the total number of sampling points.
While overall performance is robust, the remaining deviations can be attributed primarily to three sources: ADC quantization (≈±0.5%), sensor nonlinearity (≈±0.3%), and residual thermal drift (≈1.2%). These contributions collectively explain the observed error levels and are consistent with the theoretical error budget presented above. The error metrics derived from calibration confirm this agreement, providing both worst-case and average measures of accuracy. Furthermore, alternating field experiments verified that all deviations remained within the ±5% tolerance required by IEC standards under 50/60 Hz conditions, demonstrating compliance and robustness for real-world applications such as substations and industrial facilities.

5.1.2. Performance Test of Wireless Transmission Module

To verify the performance of the wireless transmission module, UART-based tests were carried out to examine the packaging and unpacking process. As illustrated in Figure 6, one representative sample was segmented into packet[q] = 3, packet[q+7] = 207, packet[q+14] = 37, and packet[q+21] = 0. In little-endian order, these correspond to the binary string 00000000 00100101 11010110 00000011, equivalent to 2,479,619 in decimal. Compared with the nominal sensor-side value of 2,480,000 bits ±5%, the deviation was only 0.015%, demonstrating that the Sub-1 GHz link correctly preserved all transmitted bytes without corruption. Across multiple repetitions of this test, no transmission-related errors were ever observed, further confirming the robustness of the wireless module.
Further analysis indicated that this small deviation originated not from the wireless link but from the sensor acquisition chain. Specifically, the DRV5055 Hall sensor, while incorporating built-in temperature compensation, still exhibits residual thermal drift when exposed to fluctuating ambient conditions and localized heating. In addition, EMI coupling in the analog front-end under substation conditions can subtly perturb the measured voltage prior to digitization. Together, these factors account for the millivolt-level offset (e.g., 2.480 V nominal vs. 2.476 V measured) observed in the experiments.
To comprehensively evaluate wireless reliability, four 24-hour continuous transmission experiments were conducted at a sampling rate of 2 Hz (≈172,800 packets per trial). Two tests were performed in a high-voltage power distribution room with strong electromagnetic interference, and two in an open athletic field. The results showed packet error rates (PER) of 0.92% and 0.87% in the distribution room and 0.41% and 0.36% in the open field. Although a PER approaching 1% may appear relatively high, the large sample size and high reporting frequency ensure statistical robustness. Moreover, because industrial magnetic fields evolve slowly, occasional packet drops do not affect the reconstruction of long-term field trends.
Collectively, these findings confirm that the wireless module provides robust, byte-accurate, and distortion-free transmission, and that the main source of residual error lies in the sensor chain rather than in the data link. This robustness can be explained by the inherent characteristics of Sub-1 GHz narrowband communication, which provides strong penetration and interference tolerance, together with the relatively low transmission rate configured in this study (2 Hz). Operating well below the transceiver’s maximum throughput gives a wide performance margin, which explains why no transmission-related errors were observed during experiments.

5.2. Measurement System Integration Testing

To assess the system’s performance under realistic electromagnetic conditions, power-frequency field testing was conducted at the Guangzhou Testing Institute. A dedicated experimental platform and supporting instrumentation were configured under the supervision of certified inspection personnel to meet the technical requirements for controlled magnetic field exposure.
An industrial-grade magnetic field generator, based on a multi-coil configuration, was used to produce a stable 50/60 Hz alternating magnetic field. The coil was driven by a high-current power supply capable of delivering up to 30 A. As the magnetic coil lacks active thermal management, it relies on passive heat dissipation, thereby limiting its continuous operation under high current excitation. As a result, the maximum allowable excitation current of 30 A was applied in short bursts of no more than one minute, followed by a mandatory cooldown period to prevent thermal overload.
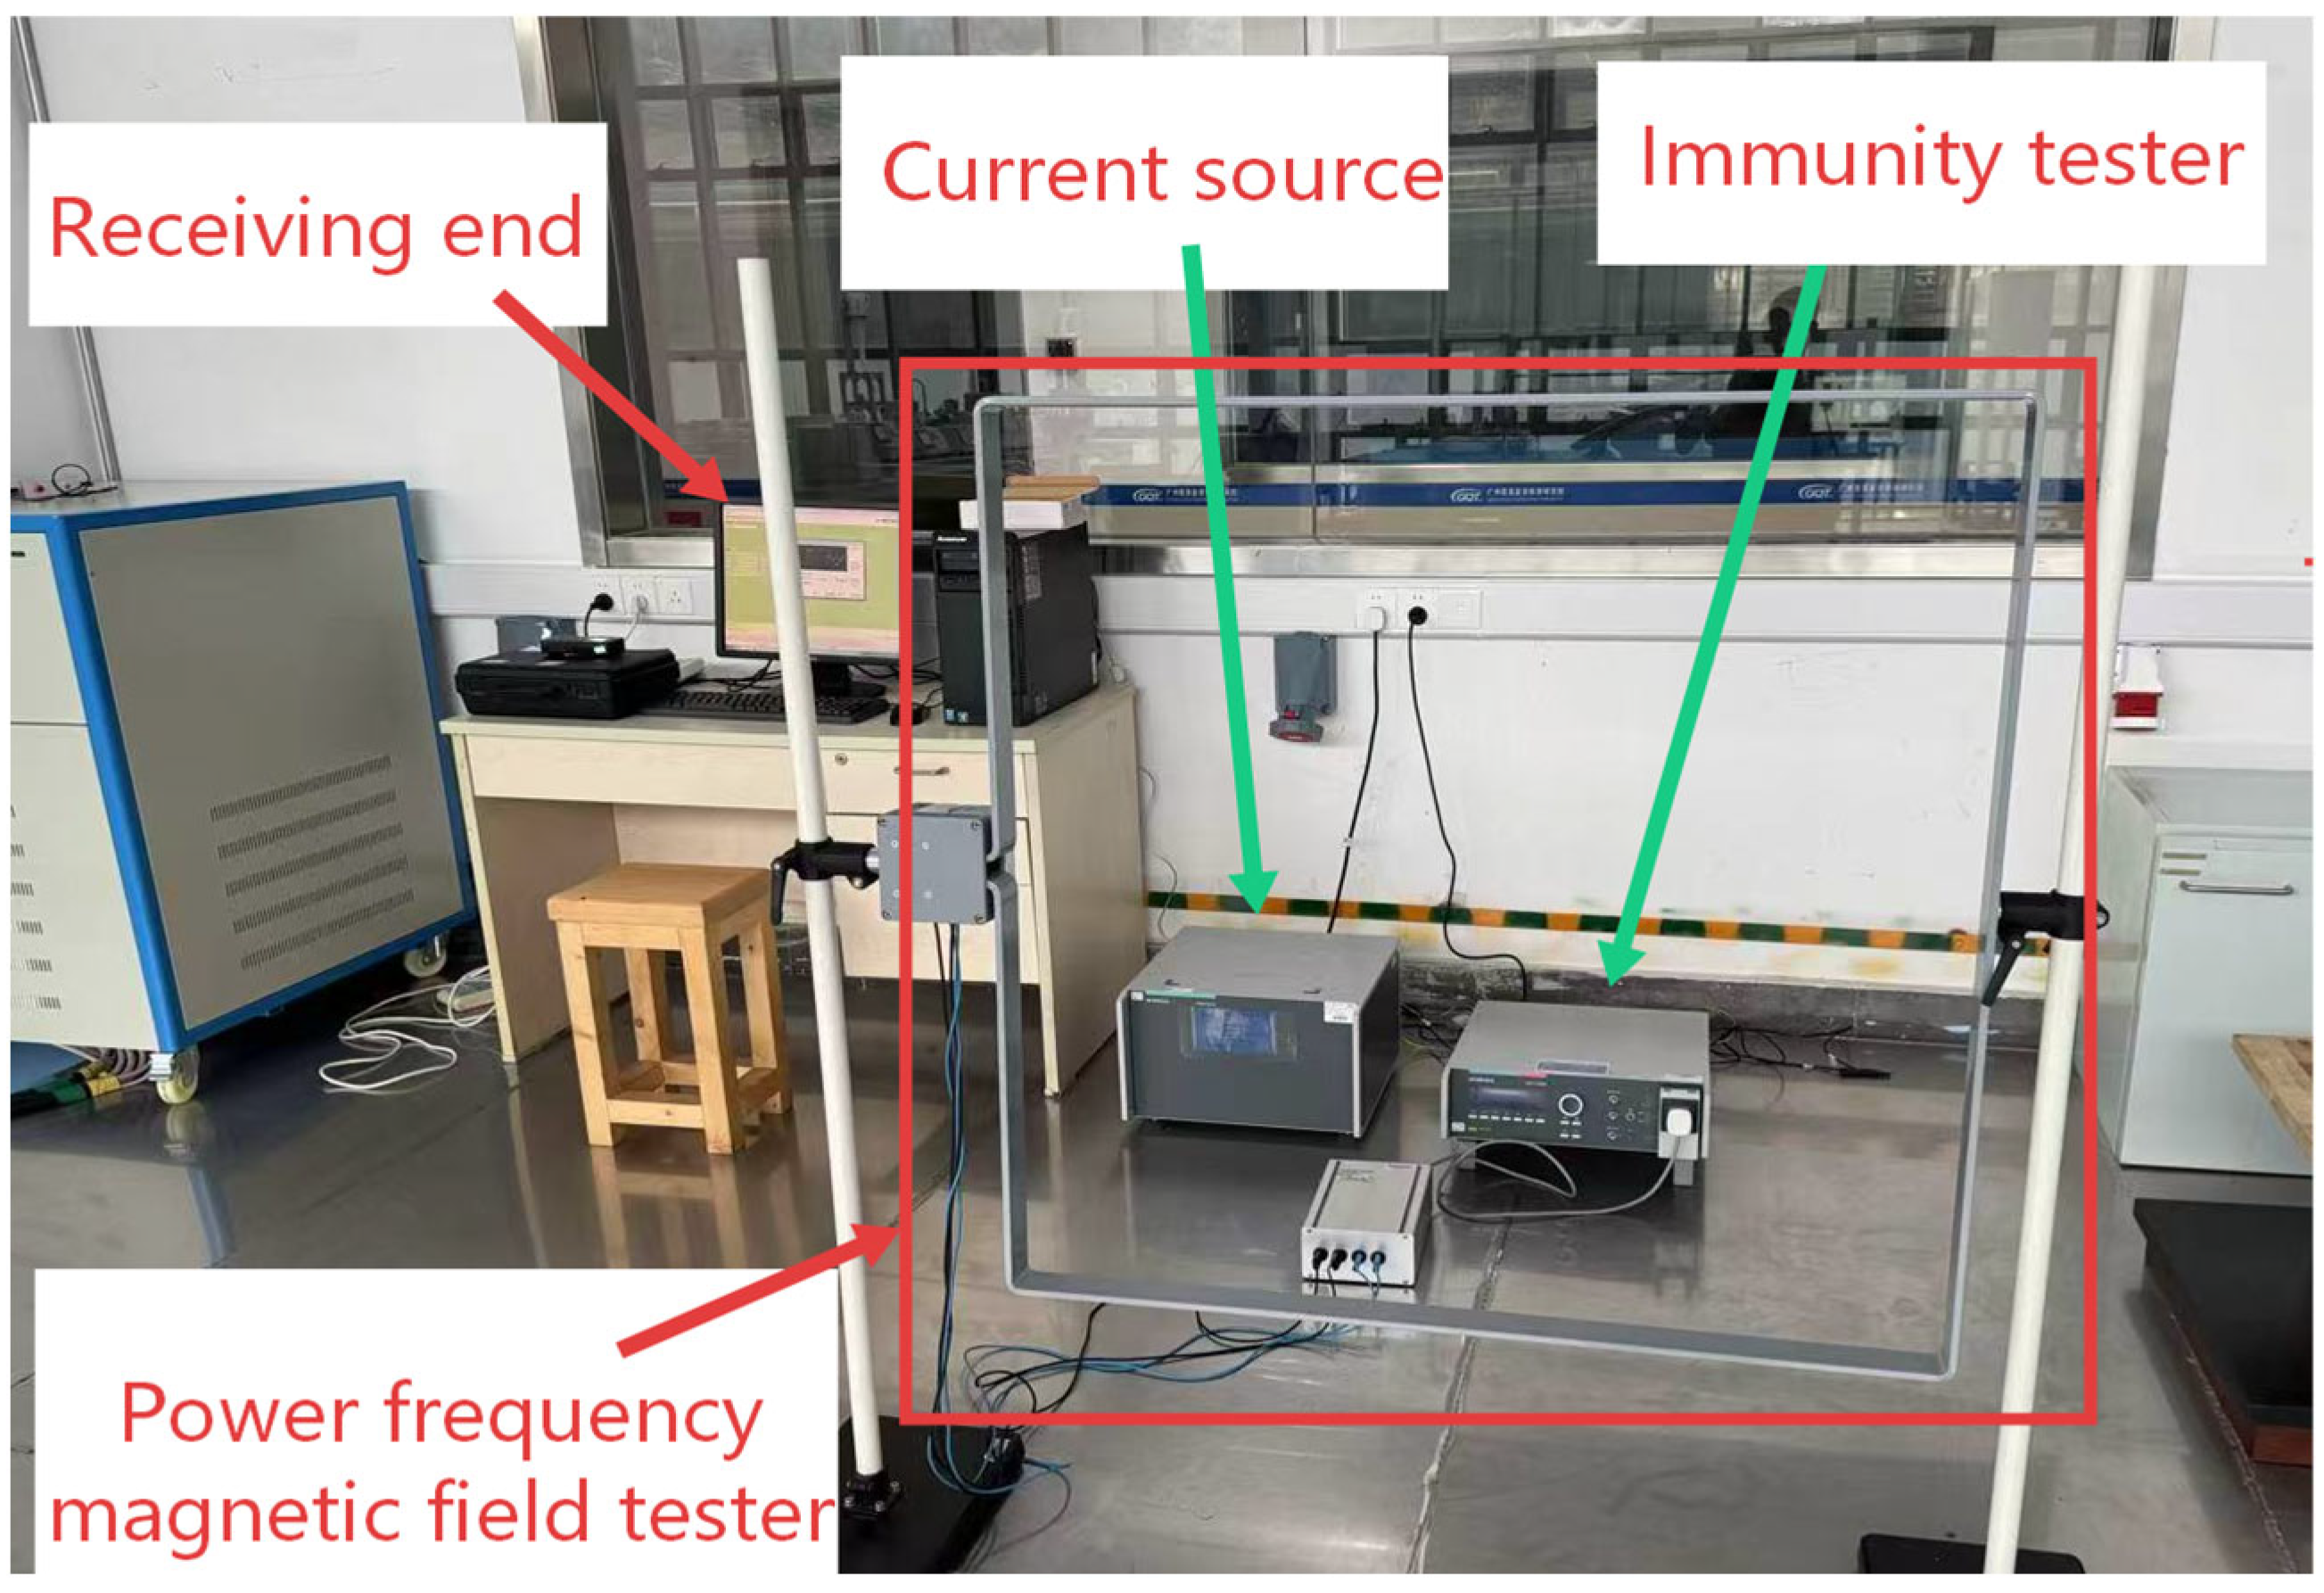
To simulate external electromagnetic disturbances, an EMC immunity tester with a square coil energized by a programmable current source was used (Figure 7). The system’s receiving end was positioned at the coil center, ensuring uniform 50/60 Hz exposure, while all instruments were computer-controlled for synchronization. When driven at 30 A, the coil produced a stable alternating magnetic field of 220–250 μT, representative of substation environments. Field uniformity and calibration traceability were verified against IEC 61000-4-8 guidelines [21] and NIST standards.
The six-channel Hall-effect PCB probe measured three orthogonal axes with dual sensors per axis (X1, X2, Y1, Y2, Z1, Z2). Signals were buffered, filtered, and digitized by the CC1310’s 12-bit ADC before wireless transmission to the host for real-time visualization. The probe was mounted on a fixed support to minimize alignment errors.
System-level validation combined both static and alternating fields: a permanent bar magnet provided the DC component, while the calibrated coil supplied the AC field. Reference measurements from low-frequency and DC Gaussmeters confirmed that the proposed system maintained high accuracy and consistency under both conditions at 25–26 °C ambient temperature.

5.2.1. Calibration and Magnetic Field Conversion

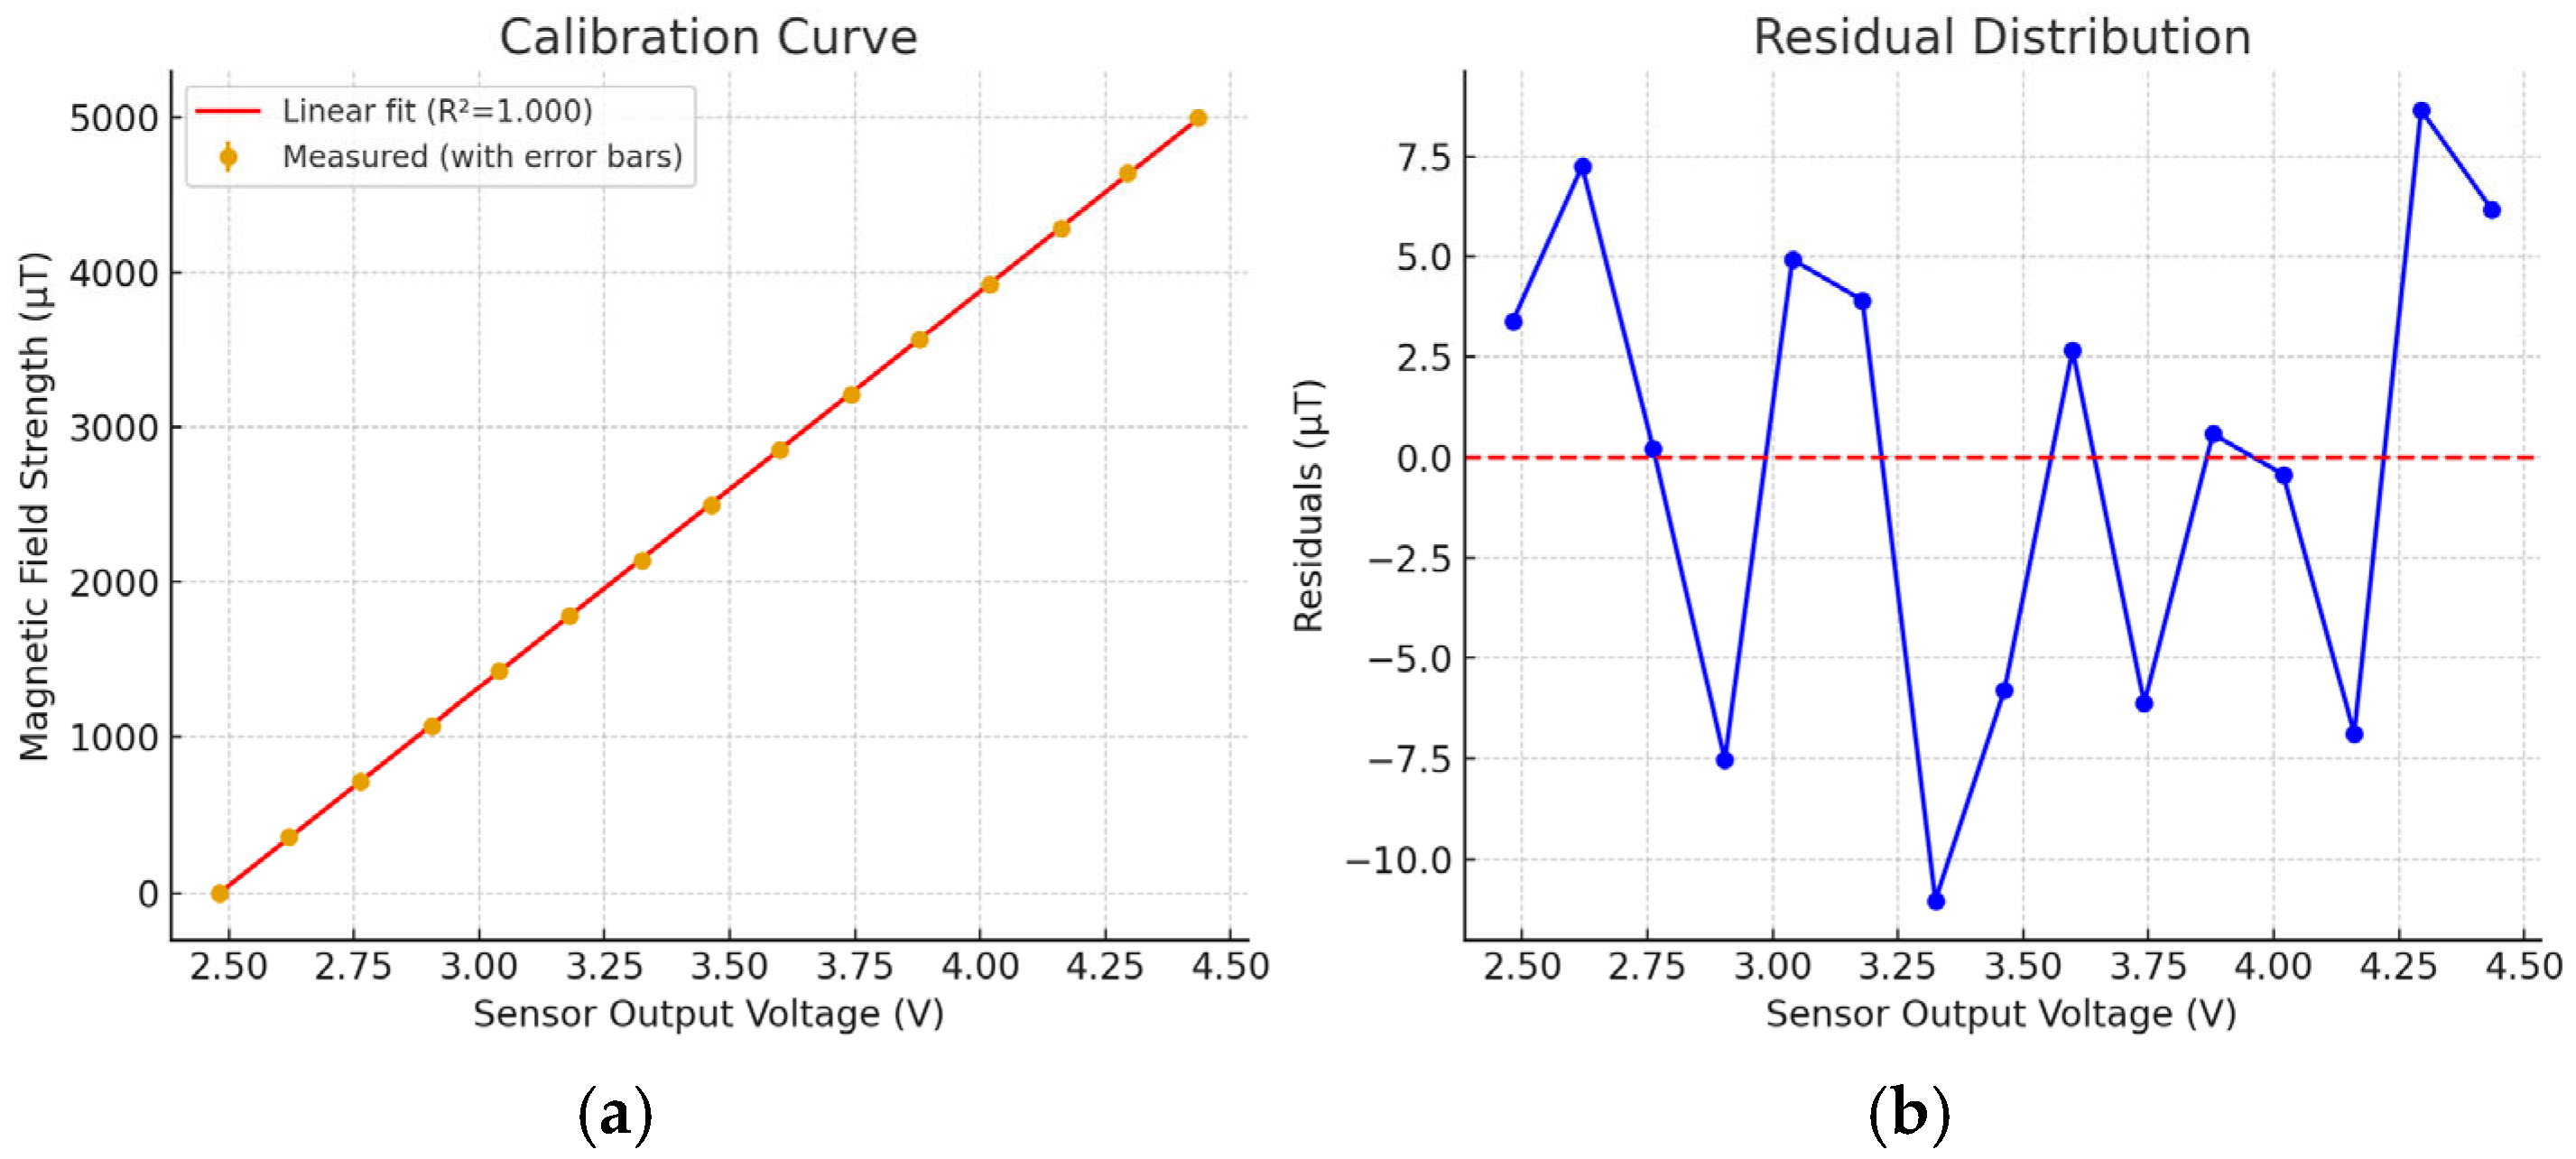
To ensure high accuracy of magnetic field measurements, the system was calibrated by mapping sensor output voltage to known magnetic field strengths. A permanent magnet mounted on a micrometer-adjustable platform generated a controlled static magnetic field, while a high-precision Gaussmeter served as the reference. Simultaneously, the DRV5055 Hall sensor output voltage was recorded via ADC under identical field conditions. Ten calibration points were acquired by varying the magnet–sensor distance, covering the sensor’s linear response range. The calibration was performed under controlled ambient conditions (25–26 °C) to minimize thermal drift, with background magnetic noise measured below 0.5 μT. The reference Gaussmeter has a specified accuracy of ±0.5%, and this uncertainty was incorporated into the regression analysis to quantify its influence on the fitted calibration curve.
Figure 8 shows the calibration curve obtained from multiple (B, Vout) pairs. The data exhibit a strong linear relationship, with error bars reflecting repeatability across three independent measurement runs. A least-squares linear regression was applied, yielding the conversion function:
B ( μ T ) = k × V o u t V r e f
B is the magnetic field strength (μT)
V o u t is the sensor output voltage (V)
V r e f is the output at 0 μT (measured as 2.480 V)
k is the slope of the fitted curve (calculated as 2550.9 μT/V)
The regression analysis yielded an R2 value of 0.9993, indicating excellent linearity across the 0–5000 µT calibration range. Residuals, computed as the difference between measured and regression-predicted values, fluctuate randomly around zero with no systematic bias, and remain confined within ±10 µT, corresponding to less than ±0.25% of full-scale deviation.
To provide a balanced evaluation of calibration accuracy, three error metrics were calculated from the residuals: the peak error (PE) reached 1.42% FS, capturing the worst-case deviation; the mean absolute error (MAE) was 0.72% FS, representing the average unsigned deviation; and the root mean square error (RMSE) was 0.76% FS, which weights occasional larger discrepancies more strongly. Together, these indicators confirm that the calibration is both accurate and statistically consistent.
Nevertheless, the present analysis was restricted to aggregate regression indicators; more detailed per-axis regression plots, expanded residual diagnostics, and repeatability testing were not conducted and remain tasks for future work.

5.2.2. Performance Test Results

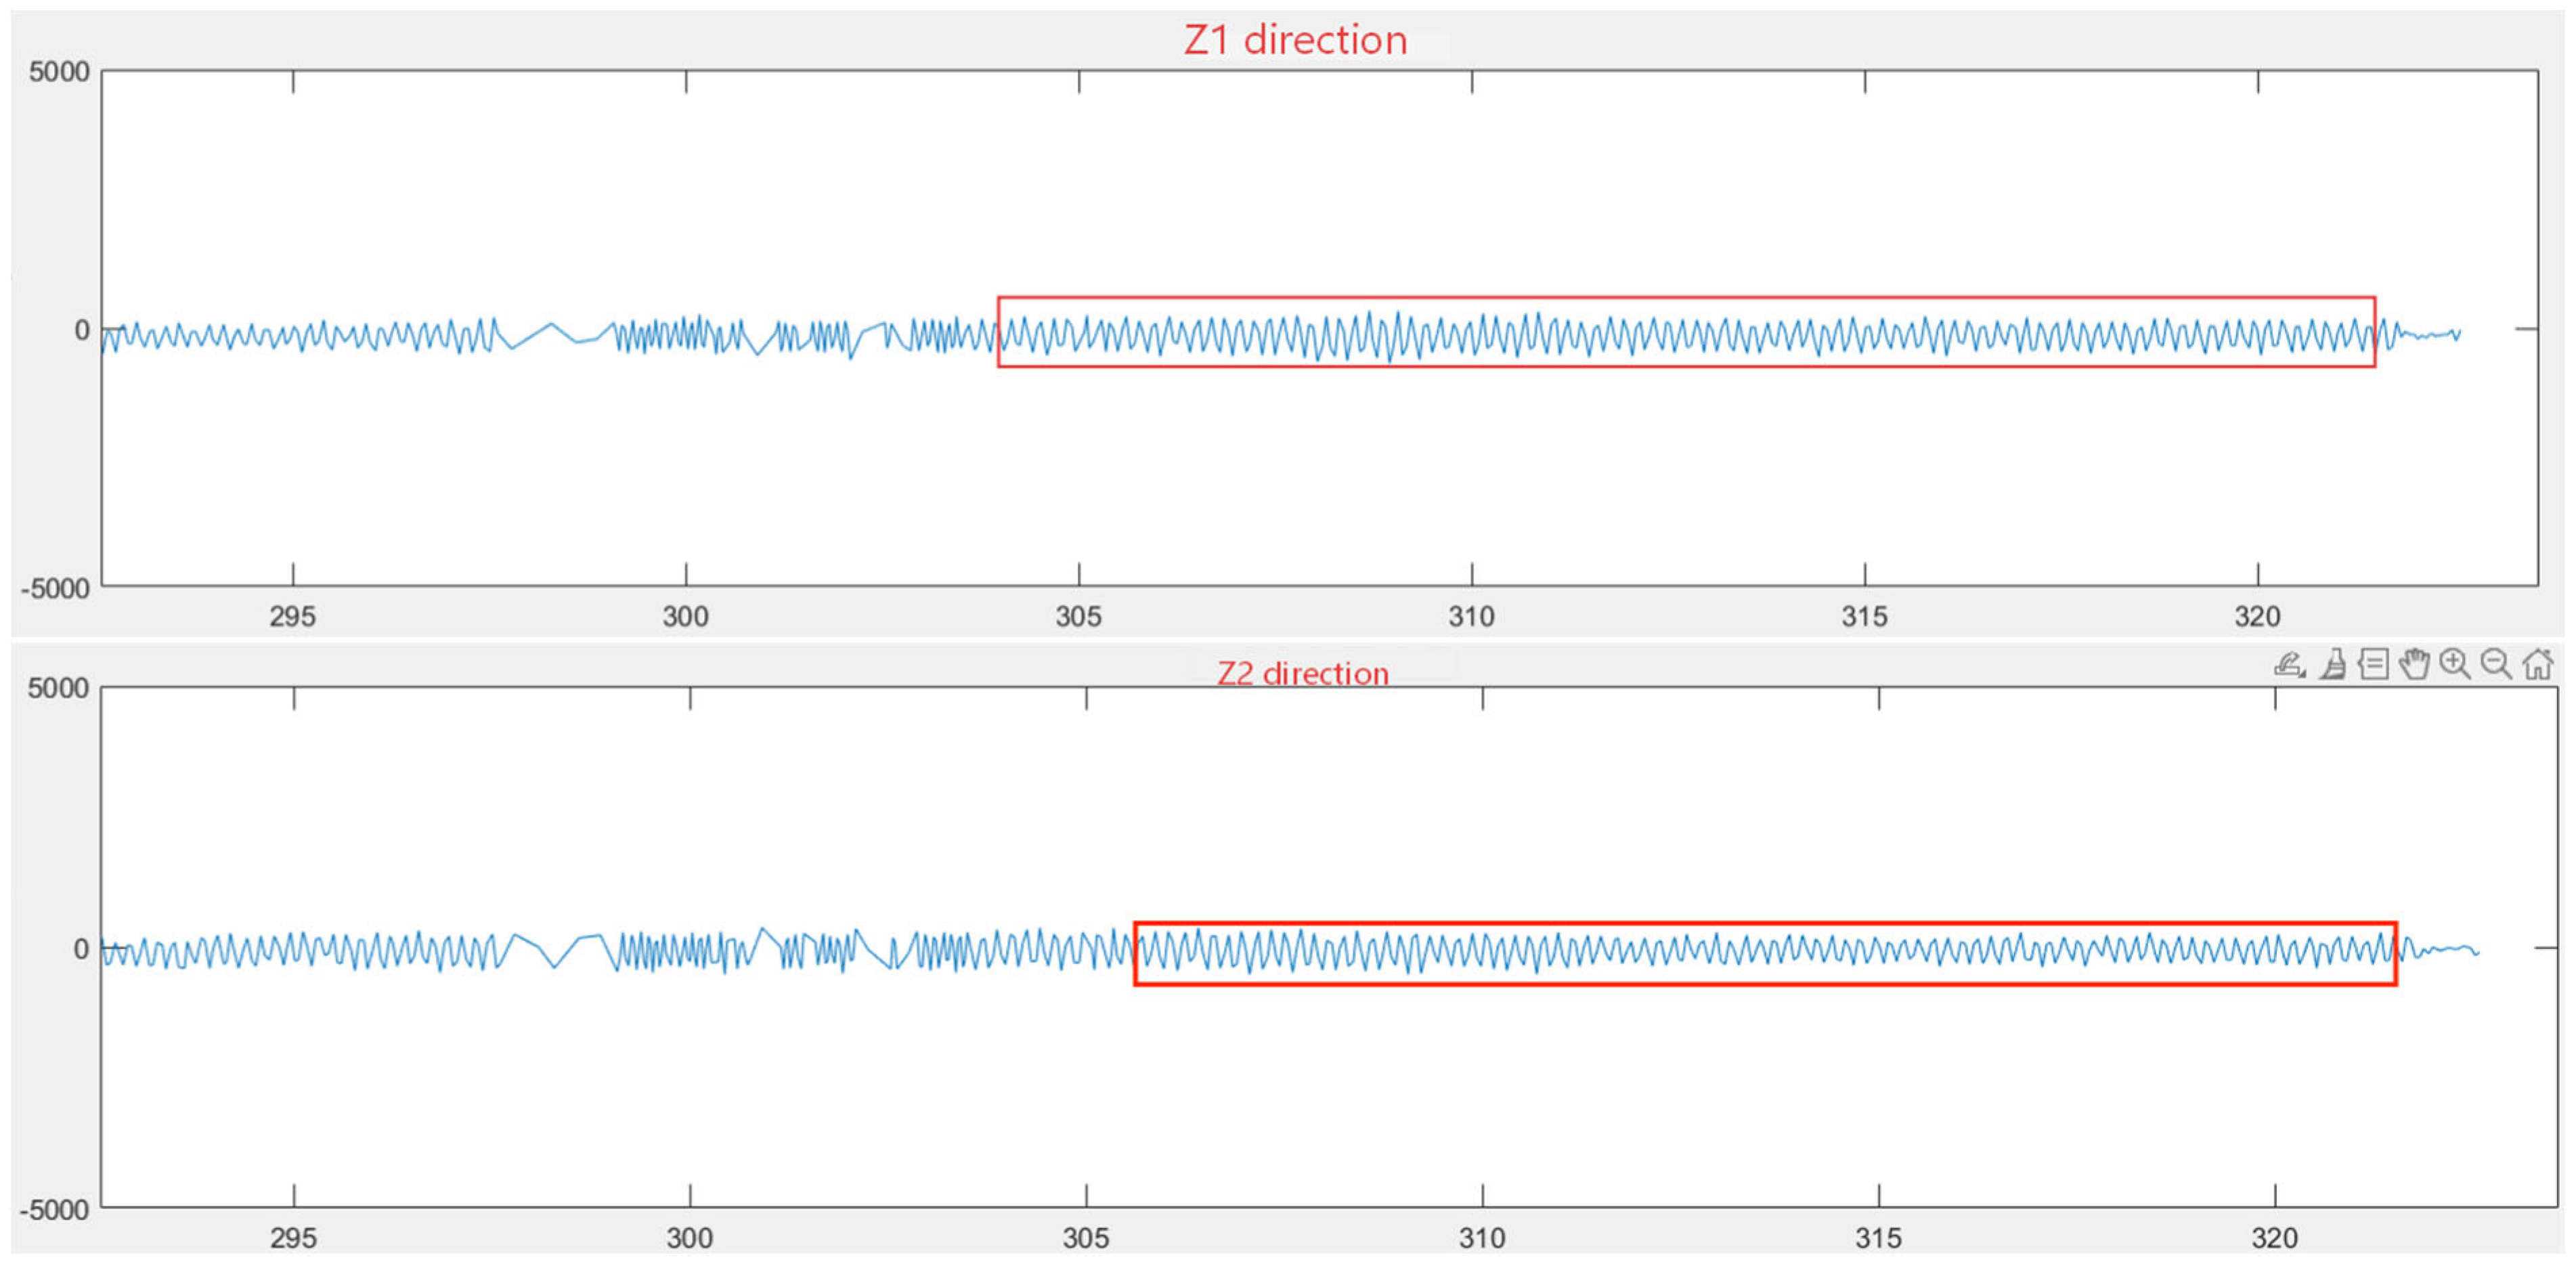
To evaluate accuracy under extreme electromagnetic stress, a high-intensity test was performed at the Guangzhou Quality Inspection Institute. A 30 A, 50 Hz current was applied to the magnetic field coil for one-minute intervals to simulate worst-case leakage conditions. A low-frequency Gaussmeter and the DRV5055 sensor were placed side by side near the coil to ensure consistent field exposure. The Z-axis channels (Z1, Z2), aligned with the coil axis, were selected for analysis, and data were logged via MATLAB.
Figure 9 shows the Z-direction waveforms, which exhibited symmetrical sinusoidal behavior consistent with the applied 50 Hz field. Among the full time record, the interval between 304 and 320 s was selected for quantitative analysis because it corresponds to the period when the field source had reached stable operation after instrument tuning. Within this steady-state window, the measured peaks were +241.87 μT and −241.64 μT, closely matching the Gaussmeter reference of 230.3 μT. The resulting deviation of ~4.7% remains within acceptable limits for industrial monitoring applications. Moreover, the system’s internal baseline differed from the reference by less than 1%, confirming high precision and consistency even under continuous power-frequency exposure. While the complete dataset demonstrates overall system functionality, the focus on this stable segment ensures a representative evaluation of accuracy and robustness.
To further validate the spatial consistency and measurement reliability of the proposed system, the X- and Y-axis sensors were also employed to capture the power-frequency magnetic field under the same experimental conditions. Multiple measurements across both axes showed a maximum relative error within 2%, confirming consistent performance across all six sensing directions.
Given the sinusoidal and periodic nature of industrial power-frequency magnetic fields, we first examine the raw recordings to identify segments with a stable sinusoidal pattern. Figure 9 shows an unprocessed waveform; the red box highlights the stable sinusoidal portion that defines the analysis window. The processing pipeline and results are presented in Figure 10. After preprocessing and outlier removal, peak detection was applied to estimate the field magnitude over time, and the peak values clustered around ±241 μT. Following the statistical 3σ principle, this value was adopted as the reference for subsequent error calculation and comparative analysis.
In addition, six-axis vector synthesis was applied to derive the total magnetic field strength at each measurement point. This approach, commonly used in electromagnetic field analysis, computes a scalar resultant by aggregating the orthogonal vector components captured along the X, Y, and Z axes. The synthesized field magnitude is:
B = B x 2 + B Y 2 + B Z 2
It offers a comprehensive and intuitive representation of the local electromagnetic environment. This method enhances spatial resolution and facilitates the subsequent identification of localized field intensity anomalies.
This vector-based evaluation strategy will be further demonstrated in subsequent field deployments, such as in high-voltage electrical substations, where multi-directional magnetic interactions require integrated spatial field strength analysis.

5.2.3. Constant Magnetic Field Measurement

To evaluate the spatial sensitivity and distance-dependent response of the proposed system in static magnetic field conditions, a controlled experiment was conducted using a permanent magnet as the field source. The test investigated the variation in measured magnetic field strength as a function of the probe’s distance from the magnet.
To ensure consistency in spatial reference, the DRV5055 sensor and a calibrated Gaussmeter probe were positioned at comparable distances from the magnetic source. A precision spiral micrometer fixture was used to clamp and gradually adjust the position of the magnet, allowing fine-grained control of displacement during measurement. As expected, the measured field strength increased with decreasing distance, demonstrating the system’s capability to capture spatial gradients in magnetic flux density.
This spatial verification process is critical for validating the accuracy of point-specific measurements and for ensuring that the system’s response is consistent with physical field distribution laws under static field conditions.
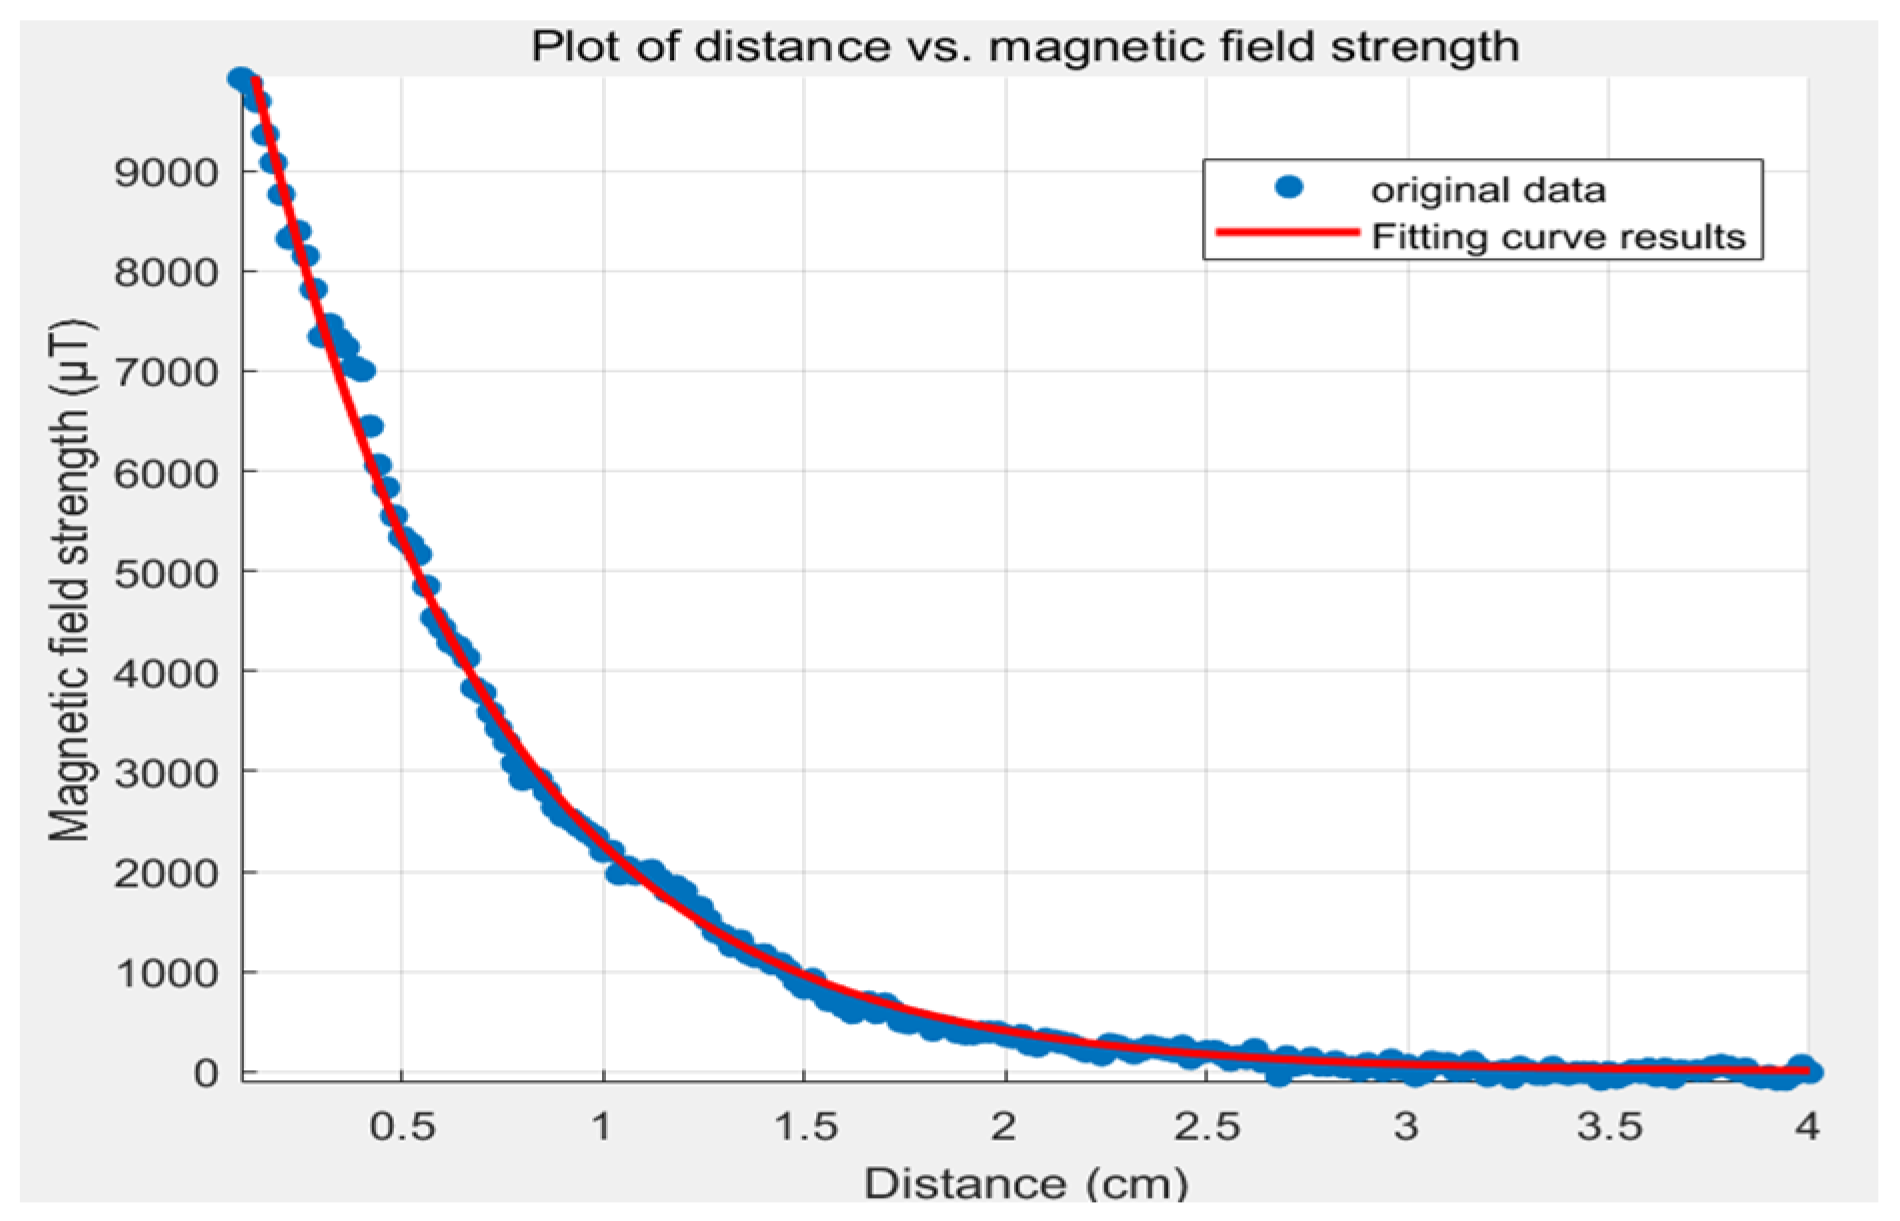
To characterize the spatial response of the system to static magnetic fields, a controlled experiment was conducted to measure the magnetic flux density as a function of distance from a permanent magnet. As shown in Figure 11, the measured data exhibit a typical inverse relationship between magnetic field strength and distance. In the Strong Field Region (0–1 cm), the magnetic field declines steeply, reaching a peak value of 9921.30 μT at the closest measured point. Beyond 1 cm, the decay becomes more gradual, and the field strength asymptotically approaches zero at approximately 3.84 cm.
According to magnetic dipole field theory, the magnetic flux density is inversely proportional to the cube of the distance from the magnetic source, expressed as:
B 1 r 3
The experimental data were fitted using this relationship, and the resulting curve demonstrated strong agreement with the original measurements, validating the physical model and confirming the sensor’s accuracy in spatial gradient tracking.
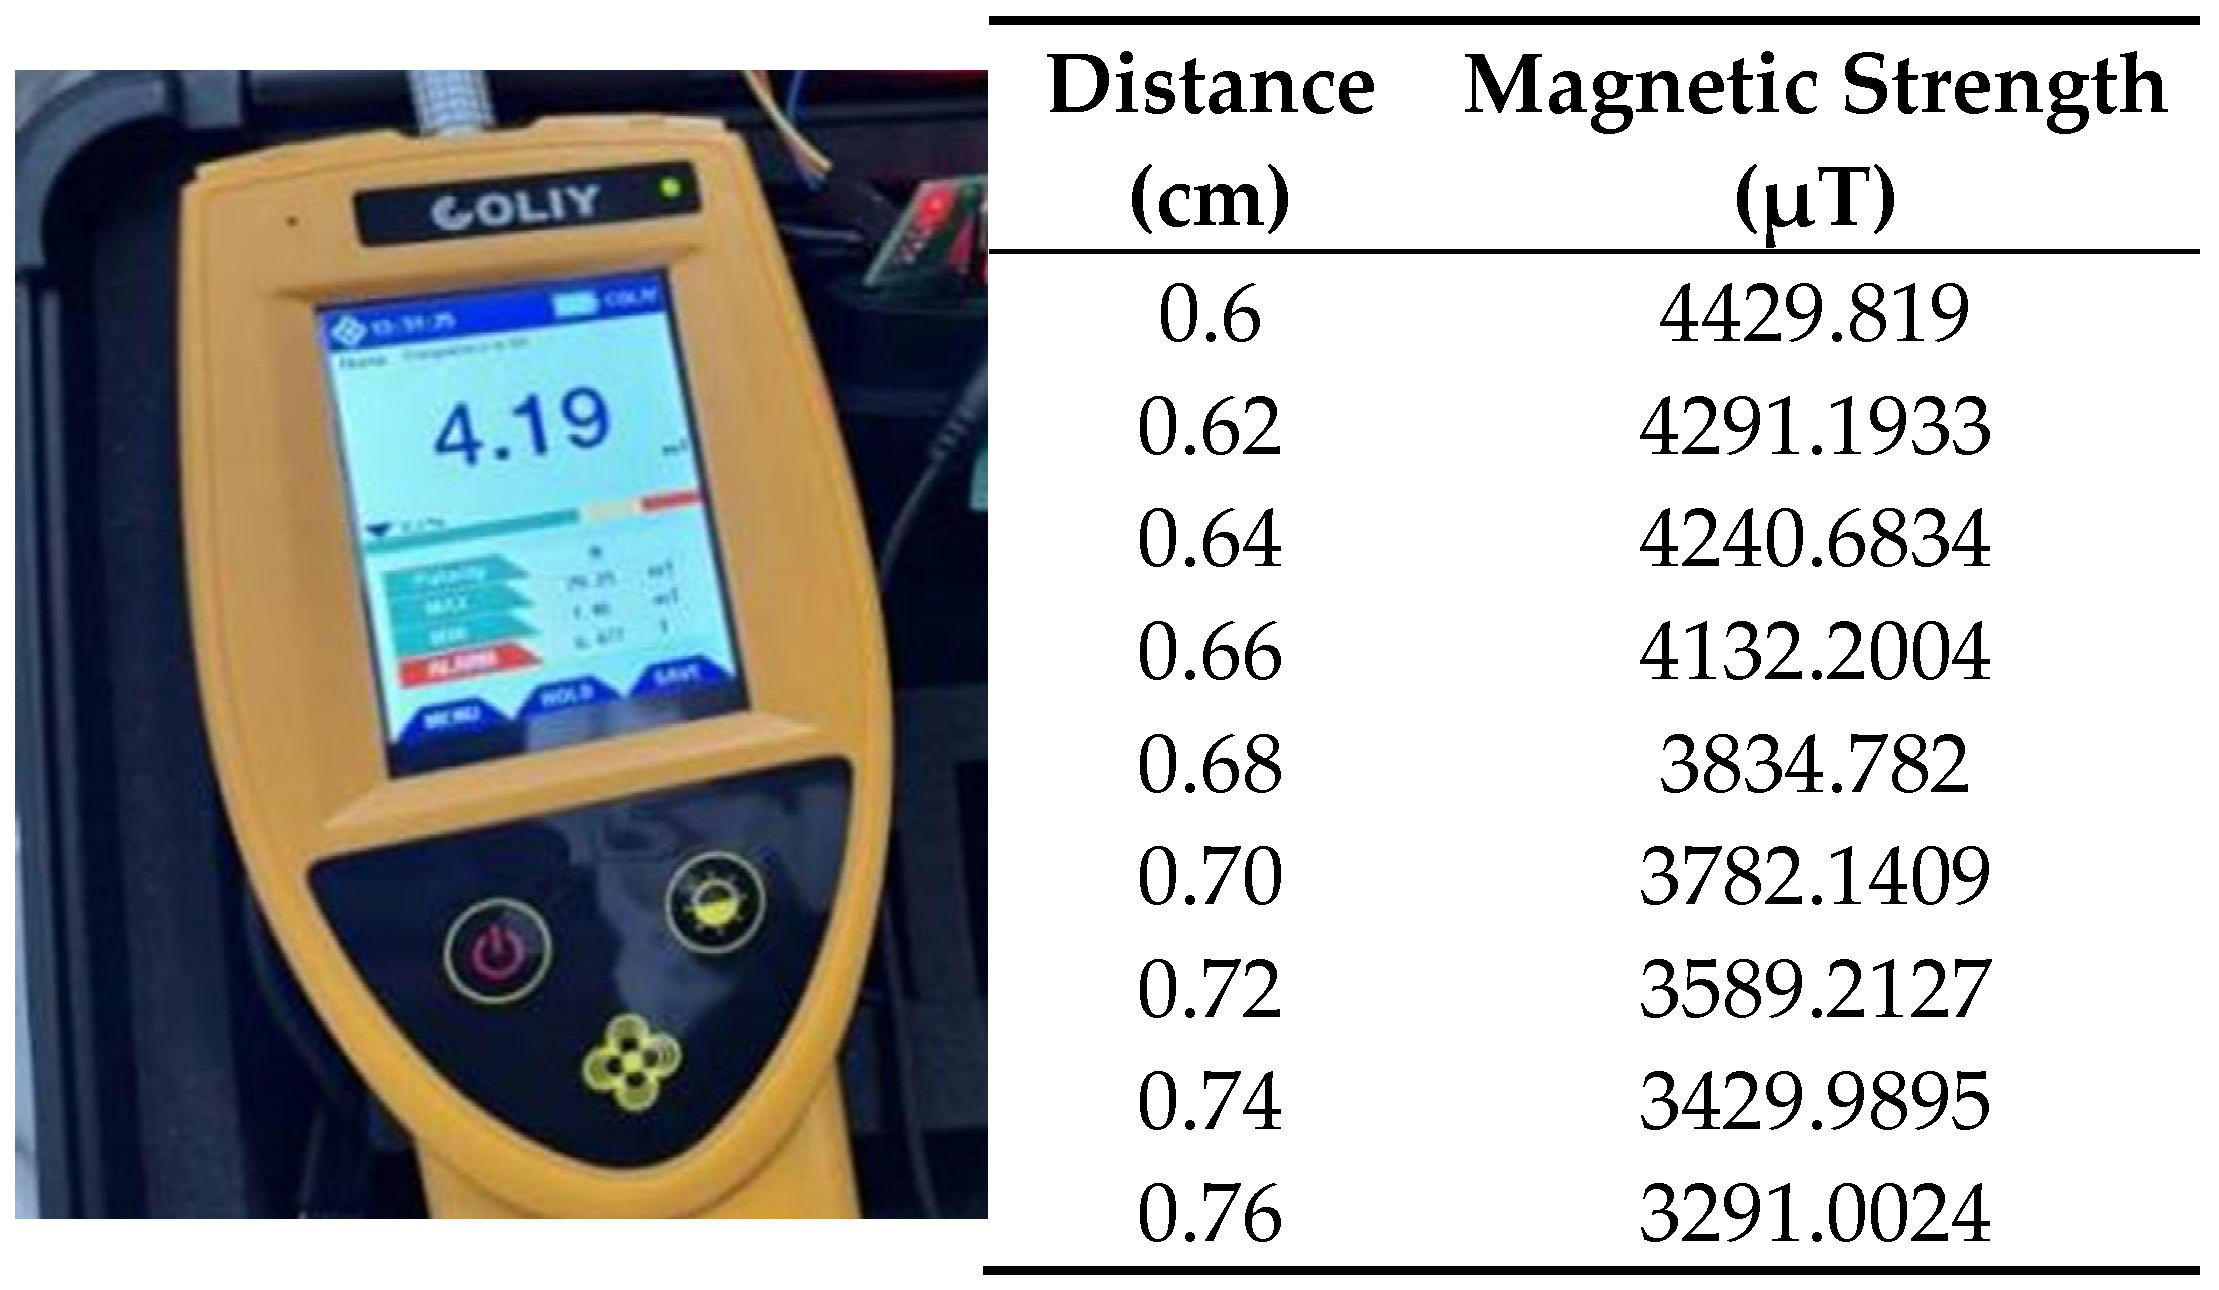
To evaluate absolute measurement accuracy, the system’s output was compared to reference readings from a calibrated Gaussmeter. At a distance of 0.66 cm, the Gaussmeter reported a field strength of 4.13 mT, while the DRV5055-based system measured 4.10 mT—yielding a relative error of approximately 2% (Figure 12). This level of accuracy complies with the requirements for static magnetic field monitoring and confirms the system’s capability to capture distance-dependent field variations with high fidelity.

5.3. Field Testing

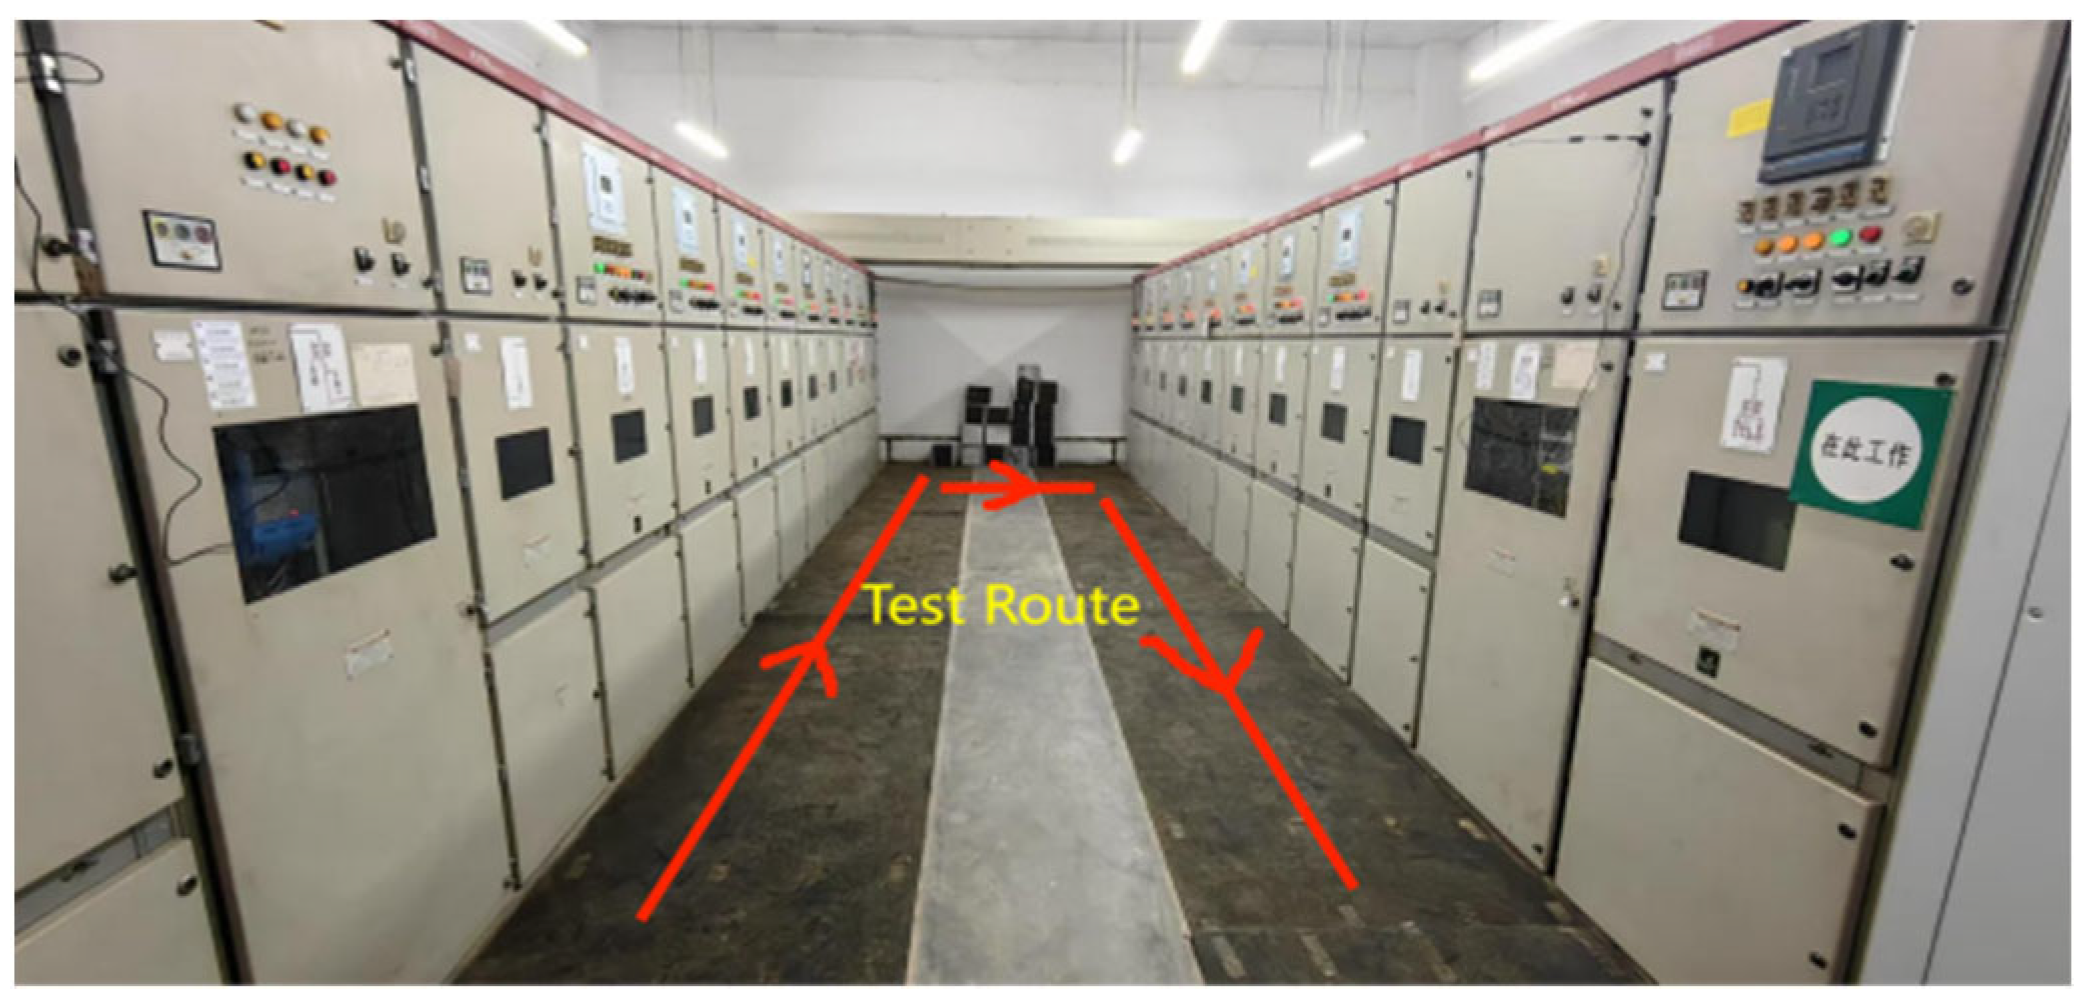
To assess the system’s practical applicability, an in situ electromagnetic field monitoring test was conducted within a high-voltage power distribution room. The experiment simulated mobile environmental sensing by traversing a U-shaped path (as shown in Figure 13) along the central aisle of the facility, maintaining a constant speed and fixed sensor height.
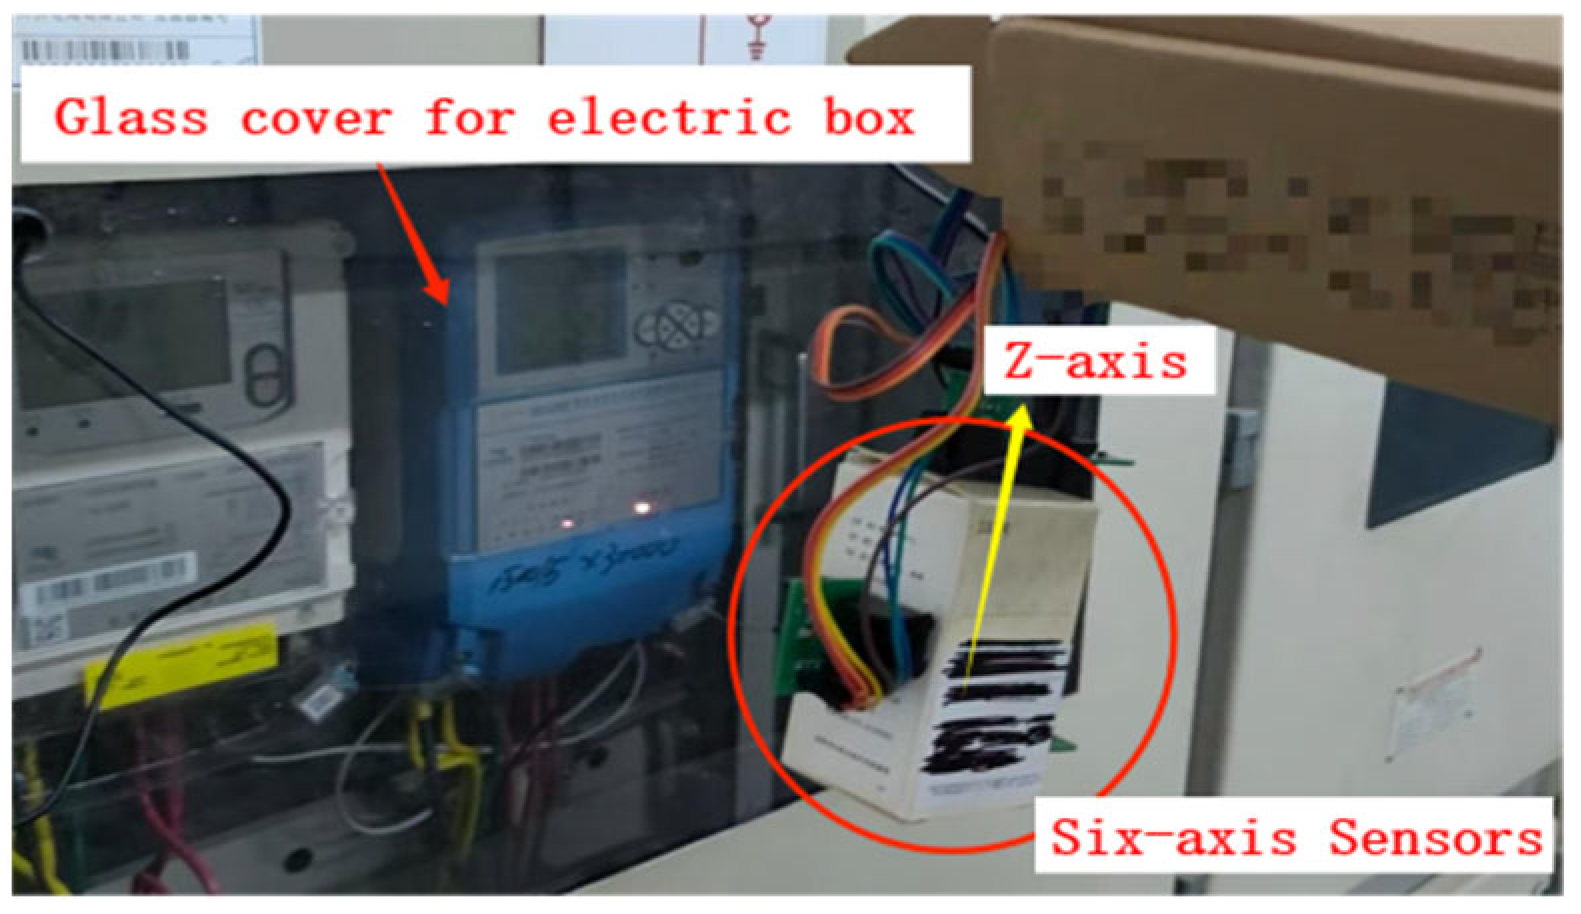
Preliminary site inspection identified the glass covers of high-voltage switchgear cabinets as primary emission sources of electromagnetic radiation. Accordingly, the sensor module was aligned to the height of these glass panels during the measurement process to capture representative field intensity. As the autonomous vehicle platform for mobile deployment is still under development, the sensor system was manually transported along the path to emulate mobile monitoring behavior.
Throughout the test, magnetic field data were wirelessly transmitted in real time to the host computer, where the data were logged and analyzed. The processed results enabled spatial mapping of the magnetic field strength within the facility and were used to evaluate compliance with established safety exposure limits. This field validation confirms the system’s capability to operate reliably in complex electromagnetic environments and supports its future integration into automated inspection platforms for substations and high-voltage infrastructure.
To complement the spatial field mapping, Figure 14 presents representative raw time-series data collected during the traversal. The top panel shows real-time ambient temperature, which remained stable at approximately 30 °C, indicating minimal influence from thermal drift during the test. The middle and bottom panels correspond to the magnetic field components along the X1 and X2 directions, respectively. Both traces exhibit short-term fluctuations and occasional transient peaks, which are attributed to switching operations and load variations in the distribution room. Importantly, these fluctuations reflect genuine environmental dynamics rather than sensor noise, as confirmed by repeated measurements. The stable temperature alongside reproducible magnetic field patterns demonstrates that the system can capture both steady-state and transient features of the electromagnetic field, thereby providing useful insights into operational uncertainties in practical monitoring scenarios.
Following data acquisition, time-series magnetic field measurements and corresponding temperature readings were exported from the host system. To ensure data quality and compliance with electromagnetic field monitoring standards, an outlier removal process was applied using the Interquartile Range (IQR) method. Data processing and anomaly filtering followed IEEE C95.3.1-2010 [22], which recommends non-parametric statistical methods (e.g., IQR) for EMF measurements.
Nevertheless, several limitations should be acknowledged. First, the raw time-series data were only partially reported, and the sampling resolution may not fully capture rapid transient events; higher-frequency logging will be adopted in future work. Second, while temperature stability was confirmed, other environmental confounders such as humidity, variable load levels, and switching sequences were not systematically analyzed. Finally, the field deployment covered only a limited operational subset of conditions, and extended long-term trials across multiple substations are still required. These improvements will be the focus of subsequent studies.
Analysis of six-axis magnetic field data revealed that all channels remained within expected operational bounds, with the exception of the Z2 axis, which exhibited outliers potentially caused by transient environmental interference. The IQR-based filtering procedure was applied to Z2 as follows:
Quartile Calculation:
With 120 data points along the Z2 axis, the first (Q1) and third (Q3) quartiles were computed based on ascending order:
Q 1 =   X 0.25 ,     Q 3 = X 0.75
Outlier Threshold Determination:
The IQR is defined as:
I Q R = Q 3 Q 1
Data points outside the following bounds were identified as outliers:
L o w e r   t h r e s h o l d = Q 1 1.5 × I Q R
In this case, data values with Z2 < −366.44 μT were excluded from further analysis.
To generalize this procedure, an interquartile range (IQR)-based data cleaning strategy was adopted. For each measurement window, the first (Q1) and third quartiles (Q3) of the dataset were calculated, and the IQR was defined as Q3 − Q1. Data points falling outside the interval [Q1 − 1.5·IQR, Q3 + 1.5·IQR] were classified as outliers and removed. The 1.5·IQR rule, originally proposed by Tukey, is a widely accepted statistical criterion that balances robustness against extreme outliers with preservation of genuine fluctuations. In our datasets, this threshold typically excluded less than 2% of samples, and the removal did not change the mean or RMS values by more than 0.1%. Thus, the adopted IQR-based cleaning effectively suppresses spurious EMI spikes and ADC glitches while ensuring unbiased long-term statistical results.
After filtering, the remaining data were used to recalculate magnetic field intensity metrics. The cleaned results are summarized in Table 4, confirming improved data stability and consistency for subsequent interpretation.
The design and validation of this electromagnetic field monitoring system were conducted with close reference to internationally recognized electromagnetic field (EMF) testing standards. Specifically, IEC 61000-4-8 defines the required procedures for evaluating immunity to power-frequency magnetic fields (50/60 Hz) 19, and it was used as a guiding standard for setting up uniform field conditions during testing.
An analysis of the raw (pre-cleaning) data revealed two primary contributors to the observed anomalies in the Z-axis magnetic field measurements.
First, although the power house employs a multi-point grounding scheme, the impedance mismatch across different grounding nodes leads to non-uniform current return paths. This condition gives rise to circulating eddy currents in surrounding metallic structures, which in turn induce localized vertical magnetic fields—particularly near conductive enclosures and cable trays (Figure 15).
Second, the elevated Z-axis readings relative to the X- and Y-axis components are attributed to the superposition of spatial field contributions from vertically arranged high-voltage equipment. The layout of transformers, busbars, and switchgear within the facility contributes to a predominantly vertical magnetic flux distribution, which aligns with the orientation of the Z-axis sensing element. As a result, constructive magnetic field superposition may amplify Z-direction measurements in specific regions.
These findings validate the use of axis-specific filtering techniques and justify the application of IQR-based cleaning to isolate and remove localized distortions in the Z-axis data channel.
To verify the system’s measurement accuracy in practical scenarios, a calibrated Gaussmeter was used to measure the ambient magnetic flux density within the high-voltage power room. The reference field strength was recorded as 421.8 μT. In parallel, the six-axis composite vector magnitude measured by the proposed system averaged 428.57 μT (as shown in Figure 16), yielding a relative error of only 1.66%.
This minimal deviation confirms the effectiveness of the vector synthesis approach and highlights the system’s ability to capture real-time magnetic field distributions with high precision. Moreover, the successful deployment and measurement in a complex electromagnetic environment further validate the system’s dynamic responsiveness and operational feasibility for practical power infrastructure monitoring applications.
6. Limitations and Future Work

Although the system demonstrates promising performance in both calibration and pilot field validation, several limitations should be acknowledged. First, the current calibration and error budget analysis remain preliminary: thermal drift was only mitigated using a simplified linear protocol, and uncertainty contributions from quantization, nonlinearity, and temperature were estimated rather than rigorously propagated. Second, the wireless transmission module was mainly assessed in terms of packet error rate, without full evaluation of latency, jitter, or resilience under stronger interference. Third, field datasets were relatively narrow in both resolution and scope; environmental confounders such as temperature, humidity, load variability, and switching events were not systematically examined. Finally, comparative validation against commercial monitoring platforms was limited, as fully integrated multi-axis EMF monitoring systems remain rare in practice.
Future work will therefore focus on long-duration field campaigns, refined multi-point calibration and uncertainty analysis, extended wireless robustness testing, and more comprehensive environmental evaluations, along with benchmarking against commercial and academic prototypes.

7. Conclusions

This study proposes an integrated six-axis EMF monitoring system that combines synchronous AC/DC sensing, real-time temperature compensation, Sub-1 GHz wireless communication, and modular visualization. Experimental validation demonstrates high accuracy, long-range stability, and strong resilience to EMI, making the platform a practical and cost-effective solution for industrial power environments. Compared with wired solutions, the system reduces deployment costs by about 30% while enabling real-time field reconstruction and intelligent fault diagnosis.
Future work will focus on enhancing wireless performance through high-gain external antenna arrays, which can significantly improve transmission distance and reliability in complex substations. In addition, integration with autonomous mobile platforms such as inspection robots or UAVs will extend spatial coverage and reduce manual effort. Further optimization of energy management and the incorporation of AI-assisted signal analysis are expected to enable predictive fault detection and adaptive inspection. Collectively, these developments will broaden the system’s applicability and support its deployment in next-generation smart grid infrastructures.

Author Contributions

Conceptualization, X.L.; methodology, X.L.; validation, X.Z., Y.M. and W.L.; formal analysis, G.H. and X.L.; investigation and resources, X.L. and Y.W.; data curation, M.C. and Z.Z.; writing—original draft preparation, X.Z. and X.L.; writing—review and editing, X.Z. and X.L.; visualization, Y.M., X.Z. and M.C.; software, W.L., M.C. and G.H.; hardware, X.Z., Y.M. and Z.Z.; supervision, G.H. and X.L.; project administration, X.L. and Y.W. All authors have read and agreed to the published version of the manuscript.

Funding

This research received no external funding.

Institutional Review Board Statement

Not applicable.

Informed Consent Statement

Not applicable.

Data Availability Statement

The original contributions presented in the study are included in this article. Further inquiries can be directed to the corresponding author.

Acknowledgments

The authors would like to thank the anonymous reviewers for their valuable suggestions and comments.

Conflicts of Interest

No potential conflicts of interest were reported by the authors.

References

  1. Dumkhana, L.; Ekeriance, D.C.; Biragbara, P. Review on the impact of electromagnetic interference in high voltage transmission systems. Adv. J. Sci. Eng. Technol. 2025, 10, 42–54. [Google Scholar]
  2. Kowalak, R.; Czapp, S.; Dobrzyński, K.; Klucznik, J.; Lubosny, Z. Harmonics produced by traction substations: Computer modelling and experimental verification. Przegląd Elektrotechniczny 2017, 93, 13–18. [Google Scholar] [CrossRef]
  3. Yuan, L.; Zhang, J.; Liang, Z.; Hu, M.; Chen, G.; Lu, W. EMI challenges in modern power electronic-based converters: Recent advances and mitigation techniques. Front. Electron. 2023, 4, 1274258. [Google Scholar] [CrossRef]
  4. Peerzada, A.; Hanif, S.; Tarekegne, B.; Baldwin, D.; Bhattacharya, S. On the impact of tidal generation and energy storage integration in PV-rich electric distribution systems. Appl. Energy 2024, 357, 122466. [Google Scholar] [CrossRef]
  5. IEC 61000-4-3; IEC. Electromagnetic Compatibility (EMC)—Part 4-3: Testing and Measurement Techniques—Radiated, Radio-Frequency, Rlectromagnetic Field Immunity Test. International Electrotechnical Commission: Geneva, Switzerland, 1998.
  6. IEEE Standard C37.90.1-2012; IEEE Standard for Surge Withstand Capability (SWC) Tests for Relays and Relay Systems Associated with Electric Power Apparatus. IEEE: New York, NY, USA, 2012; pp. 1–53. [CrossRef]
  7. Wang, J.; Liu, Y.; Mao, J.; Liu, S.; Tong, Z.; Deng, X.; Tan, W. Research on active defense system for transformer early fault based on fiber leakage magnetic field measurement. Energies 2025, 18, 4497. [Google Scholar] [CrossRef]
  8. Qamar, A.; Uddin, Z. Drone-assisted time-varying magnetic field analysis for fault diagnosis in grounding grids. PLoS ONE 2025, 20, e0325845. [Google Scholar] [CrossRef] [PubMed]
  9. Yuan, Y.; Lan, M. Research on PCB Electric Field Crosstalk and Shielding of Power Electronic Circuits. Electron. Devices 2020, 43, 1215–1221. (In Chinese) [Google Scholar] [CrossRef]
  10. Ulloa-Vásquez, F.; Olivares-Rojas, J.C.; Duran-Faundez, C.; Aguilar-González, R. Comparative Study of the Cost of Implementing Wireless Technologies for IoT and M2M. Ingeniare. Rev. Chil. Ing. 2022, 30, 422–434. [Google Scholar] [CrossRef]
  11. Hossain, M.I.; Rahman, M.M.; Karmaker, A.; Zaman, S. Comparison of LPWAN Technologies: Cost Structure and Scalability. Wirel. Pers. Commun. 2021, 121, 2565–2589. [Google Scholar] [CrossRef]
  12. Deprez, K.; Van de Steene, T.; Verloock, L.; Tanghe, E.; Gommé, L.; Verlaek, M.; Goethals, M.; van Campenhout, K.; Plets, D.; Joseph, W. 50 Hz temporal magnetic field monitoring from high-voltage power lines: Sensor design and experimental validation. Sensors 2024, 24, 5325. [Google Scholar] [CrossRef] [PubMed]
  13. Wohlmuthová, V.; Labuda, M.; Benova, M. A low-cost portable system for 3-axis measurement of static and extremely low frequency magnetic fields. HardwareX 2025, 23, e00683. [Google Scholar] [CrossRef] [PubMed]
  14. Papafotis, K.; Petridis, V.; Fotiadis, D.I. Magnetic Field Sensors’ Calibration: Algorithms’ Overview. Sensors 2021, 21, 5288. [Google Scholar] [CrossRef] [PubMed]
  15. Wang, H.; Li, C.; Zhang, J.; Liu, Y.; Zhao, X. Temperature Compensation of Optical Alternating Magnetic Field Measuring. Opt. Express 2020, 28, 13682–13692. [Google Scholar] [CrossRef] [PubMed]
  16. Famoriji, O.J.; Shongwe, T. Machine learning approach for ground-level estimation of electromagnetic radiation in the near field of 5G base stations. Appl. Sci. 2025, 15, 7302. [Google Scholar] [CrossRef]
  17. ISO/IEC Guide 98-3:2008; Uncertainty of Measurement—Part 3: Guide to the Expression of Uncertainty in Measurement (GUM:1995). International Organization for Standardization: Geneva, Switzerland, 2008.
  18. IEEE Std 1241-2010 (Revision of IEEE Std 1241-2000); IEEE Standard for Terminology and Test Methods for Analog-to-Digital Converters. IEEE: New York, NY, USA, 2011; pp. 1–139. [CrossRef]
  19. Willmott, C.J.; Matsuura, K. Advantages of the Mean Absolute Error (MAE) over the Root Mean Square Error (RMSE) in Assessing Average Model Performance. Clim. Res. 2005, 30, 79–82. [Google Scholar] [CrossRef]
  20. Hyndman, R.J.; Koehler, A.B. Another Look at Measures of Forecast Accuracy. Int. J. Forecast. 2006, 22, 679–688. [Google Scholar] [CrossRef]
  21. IEC 61000-4-8; IEC. Electromagnetic Compatibility (EMC)—Part 4-8: Testing and Measurement Techniques—Power Frequency Magnetic Field Immunity Test. International Electrotechnical Commission: Geneva, Switzerland, 2009.
  22. IEEE Std. C95.3.1-2010; IEEE. IEEE Recommended Practice for Measurements and Computations of Electric, Magnetic, and Rlectromagnetic Fields with Respect to Human Exposure to Such Fields, 0 Hz to 100 kHz. IEEE: New York, NY, USA, 2010; pp. 1–101. [CrossRef]
Figure 1. Structure diagram of the online electromagnetic radiation detection system.
Applsci 15 10785 g001
Figure 2. Circuit design of the sensing module: (a) magnetic field sensing circuit with power stabilization and LED indicator; (b) temperature sensing circuit with guard trace for EMC protection.
Applsci 15 10785 g002
Figure 3. Some Buffer Data Graph Obtained by UART.
Applsci 15 10785 g003
Figure 4. Error Diagram of Magnetic Field Sampling Conversion Buffer Without External Magnetic Field. X-axis: sample number, indicating the number of the data point being sampled. Y-axis: Measured value (in V), indicating the sampling converted value, the reference value and the magnitude of the measurement error.
Applsci 15 10785 g004
Figure 5. Error analysis diagram of the buffer zone for magnetic field sampling conversion with an external magnetic field. X-axis: sample number, indicating the number of the data point being sampled. Y-axis: Measured value (in V), indicating the sampling converted value, the reference value and the magnitude of the measurement error.
Applsci 15 10785 g005
Figure 6. The packet data graph of the sending end obtained by the upper computer through UART.
Applsci 15 10785 g006
Figure 7. Test system construction diagram.
Applsci 15 10785 g007
Figure 8. Calibration curve and residual analysis of the DRV5055 Hall sensor. (a) Sensor calibration curve (left): measured output voltages (orange dots with error bars) plotted against reference magnetic field values, along with least-squares linear fit (red line, R2 = 0.999). (b) Residual distribution (right): deviations between measured and fitted values, showing random fluctuations within ±10 μT across the tested range.
Applsci 15 10785 g008
Figure 9. Alternating magnetic field measurement (sinusoidal trend). X-axis: Time (s). Y-axis: Magnetic field strength (μT). The red box highlights the stabilized portion of the waveform used for quantitative analysis.
Applsci 15 10785 g009
Figure 10. Partial data intercepts (a) X-axis: Time (s); Y-axis: Magnetic field strength (μT).
Applsci 15 10785 g010
Figure 11. Raw Data Fitting Plot.
Applsci 15 10785 g011
Figure 12. Data comparison chart.
Applsci 15 10785 g012
Figure 13. High-voltage power house environment.
Applsci 15 10785 g013
Figure 14. Representative raw time-series data during field testing. (top panel) Real-time ambient temperature (°C); (middle panel) Magnetic field in Z1 direction (μT); (bottom panel) Magnetic field in Z2 direction (μT). Short-term transients mainly reflect switching operations and load fluctuations in the substation environment.
Applsci 15 10785 g014
Figure 15. Measurement process.
Applsci 15 10785 g015
Figure 16. Six-Axis Magnetic Field Vector Synthesis Plot (a) X-axis: Time (s); Y-axis: Magnetic field strength (μT).
Applsci 15 10785 g016
Table 1. Comparative Features of Recent Intelligent EMF Monitoring Systems.
System/
Reference
AxisWireless
Transmission
Wireless
Range
Temperature
Compensation
AC/DCError
MonitEM-IoT [10]6-axisNB-IoT/LTE-MCity-scaleNoACNot Disclosed
Deprez et al. [12]6-axisNoneNoneNoAC1.4–6.2%
Wohlmuthová et al. [13]6-axisWi-Fi/BLE~10–50 mYESDC~2.5%RMS
Our System6-axisSub-1 GHz~2–5 kmYesBoth<1.5% (50 Hz)
Table 2. Magnetic Field Sampling and Conversion Buffer Error Size without External Magnetic Field.
Number01234
Error (%)0.620.500.710.660.41
Number56789
Error (%)1.170.580.541.040.96
Table 3. The error size of the magnetic field sampling conversion buffer when an external magnetic field is applied.
Number01234
Error (%)0.020.060.330.340.15
Number56789
Error (%)1.420.110.470.380.50
Table 4. Magnetic field strength statistics results.
AxisMinimum Values (μT)Maximum Values (μT)Average Values (μT)
X−93.79+204.9618.2
Y−234.49+275.36126.7
Z−366.43+46.89243.1
Disclaimer/Publisher’s Note: The statements, opinions and data contained in all publications are solely those of the individual author(s) and contributor(s) and not of MDPI and/or the editor(s). MDPI and/or the editor(s) disclaim responsibility for any injury to people or property resulting from any ideas, methods, instructions or products referred to in the content.