Abstract
Ensuring food safety in complex supply chains requires evaluation frameworks that integrate multiple indicators, account for their interdependencies, and incorporate historical performance. This study proposes a novel RM–Shapley–FAHP framework that combines the Fuzzy Analytic Hierarchy Process, Shapley value contribution analysis, and a reputation decay mechanism to construct a dynamic, multi-year assessment model. The framework evaluates six governance subsystems, mitigates indicator redundancy, and links past performance to current risk posture. Applied to a leading food enterprise over three years, the method demonstrated superior consistency, interpretability, and operational relevance compared to FAHP, entropy weighting, and equal-weight baselines. The results demonstrate that RM–Shapley–FAHP framework effectively supports balanced development in food safety governance by capturing temporal dynamics and interdependencies, offering interpretable and operationally relevant guidance for decision makers. In future work, this framework may be extended with machine learning to improve adaptability for multi-dimensional and time-series evaluations, noted here as a research prospect rather than a present contribution.
1. Introduction
Food safety is a core issue in global public health and socioeconomic development, and its evaluation involves the complex interaction of multi-dimensional indicators. Traditional assessment methods often rely on single data sources or subjective weighting, resulting in issues such as dimensional fragmentation and expert preference bias, making it difficult to fully reflect the dynamism and uncertainty of food safety systems [1]. In recent years, multi-criteria decision making techniques (such as the Fuzzy Analytic Hierarchy Process, FAHP) have gradually become a research hotspot in food safety assessment. Currently, research in the field of safety assessment both domestically and internationally is mainly focused on the construction of assessment indicator systems and the optimization of assessment methods. In constructing index systems, researchers have proposed tailored indicator frameworks for a wide range of application domains, including government administration [2], telecommunications [3], industrial manufacturing [4], fire safety [5], healthcare networks [6], financial systems [7], and other related areas.
For instance, Mansoor Z [2] suggests that systems approaches consider policy–context complementarities and their relationship to impact evaluation, external validity, implementation science, and complexity theory. Meanwhile, Ye W [3] creates a Short-Term Demand-based Deep Neural Network using multilayer Bayesian networks to improve cold supply chain demand forecasting for e-commerce products. Ab Rahim M S et al. [4] discuss the importance of integrated risk assessment in the chemical process industry. Dobler Strand and Log [5] present a fire danger index for Norwegian wooden homes based on fuel moisture content and weather data. Declerck J et al. [6] provide a summary of data quality frameworks for health data and attempt to create a unified framework. Semenov A et al. [7] use factor analysis to evaluate financial management’s effect on economic safety and suggest adaptive measures to reduce costs and risks. Recent advancements in 2024 include the work of Chen et al. [8], who formalize cross-domain safety metric interoperability using tensor decomposition in mathematics, and Li et al. [9], whose 2025 mathematics study quantifies temporal risk propagation in IoT-enabled supply chains via stochastic differential equations.
Recent studies underscore the growing complexity of food safety evaluation and the shift toward integrated, data-driven, and risk-based frameworks. Röhrs et al. [10] propose a quantitative supplier risk assessment tool that evaluates reliability through predefined safety metrics, enabling proactive identification of high-risk actors within the supply chain. Complementing this, Holmes et al. [11] introduce a multi-criteria decision making (MCDM) framework, integrating sustainability and safety risks to enhance supplier evaluation and supply chain resilience. Oh et al. [12] demonstrate the application of private blockchain systems in food distribution networks, significantly improving traceability and data integrity verification, which are vital for real-time risk monitoring. Julien [13] emphasizes the role of certification standards and compliance mechanisms in supplier safety evaluation, providing a historical yet foundational perspective on institutional approaches to risk control. From a systemic audit perspective, Kleboth et al. [14] propose a risk-based integrity audit model tailored for complex food networks, enabling the dynamic prioritization of high-risk nodes based on evolving data and stakeholder inputs. Meanwhile, Zhang et al. [15] apply a graph neural-network-enhanced model (SGCNiFormer) to evaluate how varied storage conditions affect wheat quality, marking a move toward AI-supported environmental risk assessment in post-harvest logistics. Together, these studies highlight a trend toward multi-dimensional, technology-driven, and proactive evaluation models that integrate quantitative metrics, supply chain analytics, and digital trust infrastructures to enhance food safety assurance. Nevertheless, most of these approaches remain domain-specific or technology-focused, with limited attention to indicator interdependence, temporal dynamics, and transparent contribution tracing.
On the methodological front, scholars have developed diverse quantitative evaluation models, including the Fuzzy Analytic Hierarchy Process (FAHP) [16], entropy weighting [17], Bayesian networks [18], and clustering-based techniques [19,20]. For example, Liu et al. [16] refined the FAHP method for structural safety evaluation of diversion tunnels by introducing a pre-ranking mechanism and enhanced index consistency checks, which alleviated expert judgment inconsistency but still relied heavily on subjective scoring. An et al. [17] combined entropy with TOPSIS in assessing renewable energy projects across Belt and Road Initiative countries, thereby offering a more objective weighting scheme that reduces expert bias, yet the method remained sensitive to data quality and lacked mechanisms for incorporating temporal change. Wu et al. [18] integrated ARAMIS with Bayesian networks to model petrochemical industry risks dynamically, improving the ability to capture risk propagation paths under uncertainty, though interpretability for non-technical decision makers remained limited. Dong et al. [19] applied a consensus-driven clustering model to COVID-19 risk analysis, effectively handling heterogeneous expert opinions but with limited transferability across domains. Similarly, Zhang and Zhou [20] introduced a Hausdorff distance-based clustering algorithm for cyber safety anomaly detection, which improved sensitivity to abnormal events but required intensive computation and provided little guidance on multi-criteria trade-offs.
These advances demonstrate tangible progress in terms of improving consistency, reducing subjectivity, and capturing dynamic or heterogeneous risks compared with earlier models. In practical applications, the current comprehensive evaluation method, based on quantitative evaluation, involves two steps: determining index weight and selecting an index aggregation model [16,17,18,19,20,21,22,23]. However, these improved methods are not without shortcomings. First, many such hybrids still assume independence among indicators, failing to explicitly model interdependencies, overlap, or coupling effects among criteria. Second, they tend to treat evaluation as a static snapshot, neglecting how past performance should inform the present assessment—a limitation when evaluating dynamic systems like supply chains. Third, transparency of contribution among modules is often low; users cannot easily trace how much each submodule (weighting, ranking, optimization) affects the final score. Finally, dynamic adjustment mechanisms (e.g., time decay, reputation weighting) are rarely incorporated to emphasize recent performance over stale history.
Despite the wide application of FAHP and other MCDM methods, existing studies still face challenges, such as indicator redundancy, insufficient handling of interdependencies, and the lack of mechanisms to incorporate historical performance into current evaluations. This study addresses the following research questions (RQs): (1) How can interdependent indicators and overlapping dimensions be systematically integrated to improve evaluation consistency? (2) In what way can historical enterprise performance be embedded into current safety assessments to enhance interpretability? (3) How can FAHP, despite being a relatively mature method, be revitalized through integration with Shapley value analysis and a reputation mechanism to provide more dynamic, multi-dimensional evaluations?
Compared with entropy, Bayesian, or clustering models, FAHP provides a transparent hierarchical structure, direct incorporation of expert knowledge, and consistent qualitative-to-quantitative conversion under uncertainty. These features make it particularly suitable for food safety governance, where interpretability, transparency, and traceability are indispensable. The objective of this study is therefore to build on FAHP as a reliable foundation while addressing its methodological gaps—namely, limited handling of indicator interdependencies, static treatment of temporal information, and insufficient contribution traceability—so as to develop a dynamic, multi-dimensional evaluation framework that meets the evolving requirements of food safety governance in complex supply chains.
Among advanced evaluation strategies, the Shapley value has gained attention for its ability to capture indicator interdependencies and marginal contributions. Shapley value analysis has improved alignment with real-world development dynamics. At present, the evaluation algorithm combined with Shapley value analysis has been effectively applied in many fields, such as engineering construction [24], government project financing [25], server data interaction [8], supply chains and service providers [9], and so on. Chen et al. [24] create Shapley value smart contracts for fair task collaboration rewards. Ghorbany et al. [25] study KPIs’ impact on PPP infrastructures. Guleria, Srinivasu, and Hassaballah [8] use SHAP values to improve transparency in predictive maintenance models. Wang [9] suggests a profit-sharing mechanism based on game theory to promote collaboration between carriers in supply chain distribution.
In parallel, reputation mechanisms have become essential for linking historical performance with future risk posture. Reputation mechanisms further enhance evaluation depth by linking past performance to future behavior. From the perspective of enterprises, the reputation mechanism currently plays an important role in the blockchain transaction [20], privacy computing [21], 6G communication [26], supply chain discourse power [27], and other links. Pari S N and Sudharson K. [20] suggest a Hybrid Trust-Based Reputation Mechanism (HTRM) for secure routing and misbehavior detection in networks, along with a robust PKI system for edge-to-edge safety. Zhang B, Wang X, Xie R, et al. [21] propose an incentive mechanism based on reputation to encourage cooperation among OBUs in VANETs and deter attackers. Zhu et al. [25] suggest a dynamic incentive and reputation mechanism for federated learning using game theory, while Liu et al. [27] propose a reputation model for enhancing PBFT consensus in a vehicular edge metaverse.
Therefore, this study consolidates the dynamic influence of food safety indicators across multiple evaluation models and over time. Building on the RM–Shapley–FAHP framework, which fuses FAHP, Shapley value analysis, and a reputation decay mechanism, we construct a unified index system that captures indicator interdependence, mitigates redundancy, and embeds three-year historical performance. By integrating a reputation mechanism (RM), the model links past behavior to current risk posture, thereby improving interpretability and yielding enterprise-specific, fine-grained assessments. The resulting framework clarifies the essential requirements for food safety evaluation, offers a transparent weighting rationale, and equips companies with more accurate and actionable insights for governance and development. The remainder of this paper is organized as follows. Section 2 introduces the research materials and methods, including the FAHP model, the Shapley value calculation, and the reputation mechanism. Section 3 presents the empirical evaluation and validation results, followed by comparative analyses and practical applications. Section 4 provides a discussion of the findings, highlighting methodological contributions and practical implications. Finally, Section 5 concludes the study with a summary of key insights, limitations, and directions for future research.
2. Materials and Methods
The food evaluation model is taken as research object, and it is comprehensively evaluated based on the Shapley–RM method in relation to 6 aspects (U1 to U6) and 6 related incorporated models (models A to F). The entire system and each of the incorporated models are firstly evaluated according to the fuzzy comprehensive evaluation (FCE) method. Then, based on the overall and model scores, the Shapley value and percentage contribution corresponding to each model’s contribution to the evaluation of the global indicator system are calculated. Finally, the comprehensive network and data safety evaluation values for each year are weighted so that the current network and data safety status can be determined based on the comprehensive evaluation values of the last three years and the RM. The entire method is reflected in Algorithm 1.
The materials and data were provided by the China Non-Staple Food Circulation Association for the food safety evaluation of several leading domestic food supply chain enterprises through a data management platform and an information traceability system. Confirmed by the enterprise, data collection is conducted in strict compliance with applicable laws and regulations and subject to review by a professional auditing team to ensure data legality and reliability. In accordance with operational standards, customer privacy requirements, and data security regulations, the relevant data may not be publicly disclosed without authorization. For any collaboration or research purposes, the data presented in this study are available upon request from the corresponding author.
| Algorithm 1: RM-Shapley—FAHP for Food Safety Evaluation | |
| Input: Indicator system ; Sub-models ; ExpertScores; Historical(3y) | |
| Output: Composite evaluation score with reputation adjustment | |
| 1 | Function RMShapleyFAHP (, ExpertScores, Historical): |
| 2 | Build indicator hierarchy (criterion/factor/indicator); Step 1: Initialization |
| 3 | Collect expert scores and enterprise records; |
| 4 | FAHPWeights , ExpertScores Step 2: FAHP weighting |
| 5 | ShapleyContrib Step 3: Interdependency via Shapley |
| 6 | SolveLambda(); Step 4: Solve |
| 7 | FinalScore AggregateScores , Historical Step 5: Time-weighted aggregation |
| 8 | return FinalScore; |
| 9 | Function FAHP Weights (, ExpertScores): |
| 10 | Construct fuzzy complementary matrix from pairwise judgments; Input matrix |
| 11 | if then |
| 12 | L refine judgments / pre-rank indicators; Consistency control |
| 13 | Derive weights (criterion/factor/indicator); Qualitative quantitative |
| 14 | Compute fuzzy single-factor scores and aggregate; return ; |
| 15 | Function ShapleyContrib : |
| 16 | for each sub-model do |
| 17 | compute (weighted by ); Per-model score |
| 18 | for each subset do |
| 19 | evaluate fused score ; Coalition value |
| 20 | for each do |
| 21 | ; Shapley value |
| 22 | normalize to contributions (%); return ; |
| 23 | Function SolveLambda(): |
| 24 | Find s.t. Closed-form not available |
| 25 | while not converged do |
| 26 | Newton step |
| 27 | return ; |
| 28 | Function AggregateScores (, Historical): |
| 29 | for to 3 do |
| 30 | |
| 31 | ; years weight more |
| 32 | FinalScore ; Time-decayed sum |
| 33 | return FinalScore; |
2.1. FAHP Model
FAHP is a mature risk management evaluation method, which combines the advantages of hierarchical analysis and a fuzzy comprehensive evaluation method. It uses the theory of fuzzy mathematics to remove subjectivity, thus improving the reliability of risk evaluation. Previous studies have applied the FAHP method in various safety and risk evaluation contexts. For example, Liu et al. [16] improved structural safety assessments of diversion tunnels by refining consistency checks, while An et al. [17] combined entropy with TOPSIS to enhance energy project evaluation. These applications demonstrate the statistical grounding and flexibility of FAHP, but they also highlight persistent reliance on subjective scoring and limited treatment of temporal information, which motivate its extension in this study. In the FAHP model for this evaluation, the Criterion Level is divided into parts as . Each component corresponds to the influencing factors that make up the Factor Level as for factors. The fuzzy evaluation value of a single factor is evaluated by a team of experts and then divided into fixed values of points (), corresponding to high, medium, and low risk depending on the actual situation. The weights obtained for each point are .
The specific calculation steps are as follows:
- Determine the factor set and the weight vector , and . Determine the fuzzy complementary scores of traverses 1 to and is a fixed value and traverses 1 to , forming a fuzzy complementary matrix . Distribute evaluation questionnaires and invite a number of experts to complete them. Comparative ratings of the relative importance of the indicators at the same level of hierarchy and affiliation are made between the two factors. A 9-level scale of 0.1–0.9 is used for the dimensional breakdown. Combined with the definition of the fuzzy complementary matrix in the formula below, for the two-by-two comparison of the scoring, results of the indicators to meet the fuzzy complementary matrix are the basic requirement. The final scoring matrix that satisfies the fuzzy complementary matrix scoring result is denoted as , which is represented as shown below.
where is the number of parts the Criterion Level is divided into and is the final scoring matrix that satisfies the fuzzy complementary matrix scoring result.
- 2.
- Calculate the correlation weight coefficient .
- 3.
- Fuzzy consistent treatment of correlation weight coefficients. The fuzzy judgment matrix R is obtained through .
- 4.
- Consistency test for fuzzy judgment matrix. Comparative judgment is based on the size of the final CI value obtained. When CI is less than 0.1, it means that the set of data satisfies the fuzzy consistency requirement.
where S is the final scoring matrix that satisfies the fuzzy complementary matrix scoring result; R is the fuzzy judgment matrix; is the number of parts the Criterion Level is divided into; is the value in row x and column y of matrix R; and is the value in row x and column y of matrix S.
- 5.
- Determine the specific value of the weight vector . In some cases, weights can also be specified by a team of decision making experts or calculated using methods like the entropy weighting method (EWM).
where and satisfy and ; is the number of parts the Criterion Level is divided into; is the weight of the i-th criterion layer factor; and is the weight of the j-th factor under the i-th criterion layer factor .
- 6.
- Establishing evaluation sets for integrated evaluations and .
- 7.
- Taking single-factor fuzzy evaluation for evaluation matrix and . If the subjection degree of the factor in the factor set to the factor in the evaluation set is , the result of the single-factor evaluation of the element is . The subjection degree of can be obtained from the expert composite rating combined with the FAHP method. satisfies .
- 8.
- Developing a basic comprehensive evaluation model. After confirming the single-factor evaluation matrix and the weight vector , through the fuzzy variation and comprehensive evaluation operator, the corresponding of the Criterion Level is obtained as
where corresponds to the Criterion Level ; is the value of the j-th factor under the i-th criterion layer factor ; and is the weight of the j-th factor under the i-th criterion layer factor.
- 9.
- Determining the improved evaluation models. Determine the improved system evaluation score F as
where is the total system model score; is the weight of the i-th criterion layer factor; and corresponds to the Criterion Level .
2.2. Shapley Contribution Calculation
Considering that the weights of the fused models in performing safety evaluation are often assigned using traditional subjective assignment methods, even when entropy weighting or entropy-related weighting methods are applied, all of them are carried out under additive measurements. In fact, there are certain correlations and overlapping influencing factors between the models, and when two or more indicator factors overlap, they cannot be realized through simple addition but should be considered for their interactions. The Shapley value addresses the evaluation contribution of multiple models working together by emphasizing the existence of interconnectedness between the individual and the whole. The Shapley value has also been widely employed in previous research to quantify marginal contributions and address indicator interdependence. For instance, Chen et al. [24] designed Shapley-based smart contracts for fair collaboration, and Ghorbany et al. [25] examined its use in evaluating infrastructure financing performance. These applications confirm its statistical effectiveness in contribution analysis, yet its use in food safety remains limited and often ignores dynamic temporal effects, which we address here. In this article, the evaluation of the Shapley value is mainly applied to the model contribution assessment and converted into the form of a percentage. The specific calculation steps are as follows:
- (1)
- Determining the single model score that was fused.
- (2)
- Clarify the mapping or inclusion relationships between the three levels of indicators and the evaluation sub-models. For a subset of contains the set of factors such that . The corresponding fused model score for subset S is
- (3)
- Calculating the Shapley value for each model. The Shapley value of the model is , where is the Shapley weighting function of subset is the Shapley value function of subset and model is the calculation of sets, and satisfies and .
- (4)
- Based on the model’s Shapley value, calculate the corresponding model contribution percentage:where is the corresponding model contribution percentage of the model and is the Shapley value of the model.
2.3. RM Calculation
Reputation mechanisms (RMs) have been adopted in several domains to embed historical performance into present evaluations. For example, Zhang et al. [21] used RMs in vehicular networks to deter misbehavior, and Zhu et al. [25] introduced RMs in federated learning to align incentives. Such approaches demonstrate the statistical feasibility of reputation-based weighting, but they remain largely linear and domain-specific, lacking adaptability for multi-year food safety assessments. This gap motivates our integration of RMs with FAHP and Shapley analysis. A reputation decay mechanism is introduced into the comprehensive data safety assessment model, considering evaluation over a three-year period. Periodic decay is denoted by value x, where and . This equation only has one solution in the real number field, which is computed to take the approximate value of 0.544.
2.4. Shapley–RM Data Safety Evaluation Model
In this paper, the Shapley value and the RM are introduced into the fuzzy comprehensive evaluation model for the first time. First, the contribution of each included sub-model is obtained based on the degree of contribution calculated in Section 2.2. A weighted sum is obtained through composite evaluation value based on the Shapley value for the current year. Based on the above model, the composite score for each year based on Shapley contributions is calculated.
where is the calculated composite score for the year numbered s based on Shapley contributions; is the percentage corresponding to the Shapley value of the model; and is the single score of the model.
Based on the comprehensive score within three years, the comprehensive evaluation model of the enterprise data safety situation can be expressed as
where is the final comprehensive evaluation score based on the Shapley value; is the first year’s composite score; is the second year’s composite score; and is the third year’s composite score.
3. Results
According to the method mentioned in Section 2, we carried out this food safety evaluation of a leading company in the food supply chain industry. As shown in Figure 1, figure (a) illustrates the data foundation, in which mandatory documents form the core dataset and updates are driven by new or revised items; figure (b) presents the indicator architecture, where governance dimensions are embedded in the evaluation model and data sources are quantified using a doughnut chart; and figure (c) depicts the technical workflow, outlining a seven-step process from field data collection to composite scoring. The specific assessment work was carried out in an orderly manner according to the following steps, as shown in Figure 1. Step 1: On-site research and data collection. Step 2: Definition of the embedded evaluation model and multi-level indicator system. Step 3: Fuzzy comprehensive evaluation (FCE) scoring of all indicators. Step 4: Shapley value analysis to determine each sub-model’s marginal contribution. Step 5: Reputation mechanism weighting to incorporate temporal credit or penalty effects. Step 6: Three-year composite score calculation. Step 7: Delivery of an assessment report with a development roadmap. The output section illustrates typical visual analytics generated by the framework, including (left to right) an indicator–interaction chord diagram, a bar-and-line plot of yearly Shapley values versus planned contributions for models A-F, and a radar chart summarizing criterion-level performance (from U1 to U2).
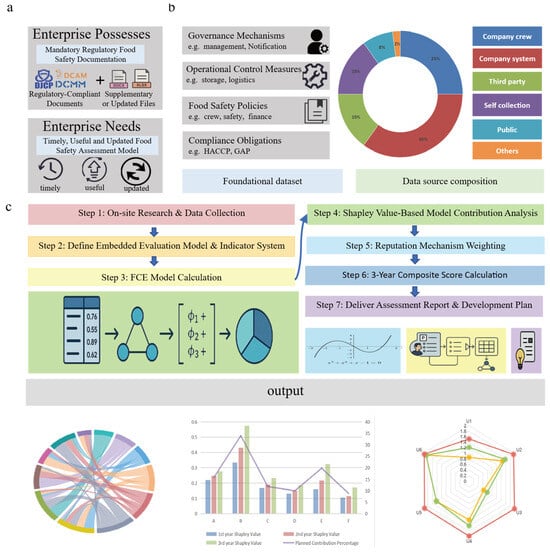
Figure 1.
Integrated RM–Shapley–FAHP framework for food safety evaluation. (a) Data foundation. (b) Indicator architecture. (c) Technical workflow.
Due to legal regulations, corporate governance requirements, and customer privacy considerations, the original data cannot be disclosed directly, and the years of production and operation are represented as “Year 1,” “Year 2,” and “Year 3.”
3.1. Data Authenticity and Model Validity Analysis
The validity of the model is an important issue. In this part, the validity of the proposed RM–Shapley–FAHP model is considered. The data used for validating the RM–Shapley–FAHP model were obtained from a leading state-owned enterprise with a food supply chain. The dataset includes expert evaluations, operational records, and internal assessments, ensuring authenticity and reliability. All evaluation experiments were conducted with consistent expert teams and applied to the same enterprise system. Due to confidentiality agreements, the raw data are not publicly available, but they are shared after desensitization and with the data owner’s approval. Although there are many articles using the Analytic Hierarchy Process (AHP) method, only a few studies have fully considered testing the validity of their proposed model. The validity of the proposed RM–Shapley–FAHP model is considered from four perspectives in conjunction with previous research.
First were the numerical tests. Considering the Consistency Index (CI) in the whole FAHP model, the consistency of the model weight parameters is calculated separately according to the equation. The discriminations based on the CI values are less than 0.1, as shown in Table 1, indicating that the parameters of this model are valid, as shown in Table 2. Table 2 presents the annual scores of food safety indicators with their corresponding weights. The results provide a detailed three-year perspective at both the criterion and factor levels, forming the basis for subsequent Shapley value contribution analysis.

Table 1.
Consistency Index (CI) values for FAHP criterion weights.
Table 2.
Annual scores of food safety indicators with corresponding weights.
Second was the comparative test. In order to test the validity of the model, the results obtained through our method were compared with the results obtained using other traditional FAHP and FCE methods. The other models chosen for comparison were valid. The evaluation was carried out on the same food supply chain of the company, and the team of experts involved was identical. The evaluation values calculated are given in Figure 2. The values calculated using the RM–Shapley–FAHP method are quite close to the values calculated using other traditional methods. This situation shows that the proposed model provides valid results when the factor layer cannot be measured precisely, when there is uncertainty, or when the cost of measurement is high.
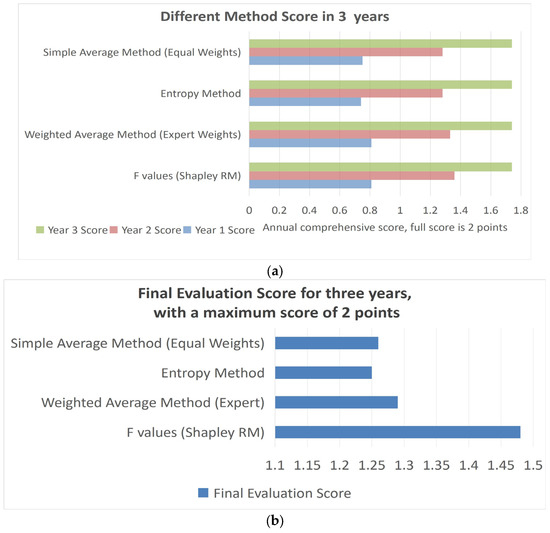
Figure 2.
Comparison of comprehensive food safety scores obtained with four aggregation strategies, RM–Shapley–FAHP, weighted average (expert weights), entropy weighting, and simple equal-weight averaging, over three consecutive years.(a) Yearly results of 4 methods, illustrating consistency and robustness through integration of FAHP and Shapley value; (b) Final results of 4 methods, providing a comparative baseline for model validation.
Third were the empirical tests. The experimental data for this assessment come from the food supply chain company, and their authenticity can be guaranteed. The results of the evaluation experiment on the food supply chain of a leading state-owned enterprise are consistent with the empirical views of the food supply chain’s front-line department leaders and front-line employees in Operations and Maintenance. Table 3 shows the comprehensive evaluation index system of food safety. This mapping is essential for linking the FAHP indicator framework with the Shapley contribution calculations and reputation mechanism integration. At the model level, model A is the Food Big Data Safety Model, model B is the Food Testing Safety Model, model C is the Food Public Opinion Safety Model, model D is the Food Management System Safety Model, model E is the Food Quality Safety Model, and model F is the Food Traceability Safety Model.
Table 3.
Comprehensive food safety evaluation index system (criteria–indicator–model mapping).
Departments include the Technology Department and other front-line departments. It is also consistent with the views of the food supply chain’s leadership team and the expert group in the field within the non-evaluation team.
Fourth was industry testing. The RM–Shapley–FAHP methodology proposed in this paper is not only applicable to the food supply chain of the leading state-owned enterprise in this paper. It is also applicable in practice to the green digital intelligence assessment of the supply chain of another energy sector SOE. The evaluations are recognized by frontline personnel, food supply chain leaders, and industry experts.
3.2. Empirical Validation and Practical Application Analysis of the RM–Shapley–FAHP Model
3.2.1. Comparative Analysis of Evaluation Methods
Based on the analysis of the four scoring outcomes presented in Figure 2, it is evident that the integration of the FAHP method with the Shapley mechanism is capable of accurately assessing the safety status of the target food evaluation. Furthermore, this approach is effective in gauging the company’s annual advancements in the realm of food safety. According to Figure 2, the evaluation of the first and second years shows that the Shapley–FAHP method yields similar results compared to the ordinary FAHP and ordinary FCE methods. Based on the assessment of the enterprise’s food safety indicators, the early construction phase reveals relatively weak and unbalanced development in distribution risk prevention and control during the first two years, which are shown in the shortages in U1, U2, U3, and U5 in Figure 3. By the third year, with the deployment of a dedicated enhancement initiative, a more balanced and integrated safety posture is gradually achieved across both food testing safety and food quality safety dimensions, which are shown in the balance in Figure 3.
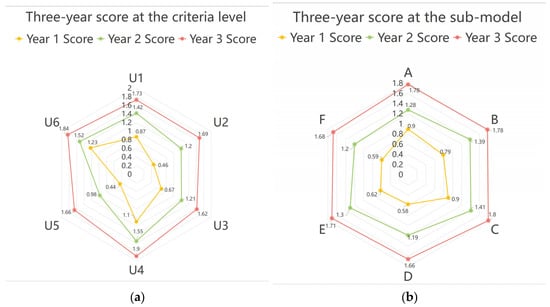
Figure 3.
Three-year evolution of criterion-level safety assessment scores, illustrating how the focus shifts from improving production processes and ensuring stable compliant production (years 1–2) to enhancing safety traceability technology (year 3). Model-level results for the six sub-models that compose the evaluation system: (a) annual scores for each criteria level; (b) annual scores for each sub-model level.
Figure 2 compares the RM-Shapley-FAHP results with three benchmark methods—FAHP, entropy weighting, and equal weight. The figure demonstrates the superior consistency and robustness of the proposed model, especially in early-stage planning and dynamic adjustment contexts. This visual comparison directly supports the model’s claimed advantage in capturing latent risks and adjusting priorities in real time, a capacity often lacking in static-weight models. Figure 3 illustrates the evaluation output of the RM–Shapley–FAHP model across three years for the six governance criteria subsystems and six inside sub-models. This figure is essential for visualizing the dynamic shifts in evaluation focus.
3.2.2. Guiding Balanced Development of Enterprise Food Supply Chains
Combined with Figure 2 and Figure 3 to analyze the development of the food supply chain over a three-year period, it is evident that the development and construction of the food supply chain can be divided into two stages. The first stage encompasses the initial two years, during which food safety is in its early stages of construction, focusing primarily on improving production processes and ensuring stable compliant production. It is relatively important during this stage, as it is easily achievable but results in relatively unbalanced development.
The second stage occurs in the third year. During this phase, leveraging the food safety foundation of the enterprise becomes crucial for enhancing safety traceability technology and addressing any shortcomings. Distribution risk prevention and control are approached from an industry leadership perspective with high developmental goals and a focus on achieving relative perfection.
When considering Table 2 and Table 3 alongside Figure 2 and Figure 3, as detailed in Table 4, it becomes apparent that during the first and second stages, the Shapley value evaluation method yields higher results compared to other methods. Table 4 compares the yearly and final food safety evaluation scores obtained using different aggregation methods, including RM–Shapley–FAHP, weighted average, entropy, and equal weight. This comparison demonstrates the superior robustness and balance of the proposed framework across different evaluation stages. This approach aligns more closely with scientific decision making in the early stages of enterprise development by emphasizing foundational elements. In contrast, during the third stage, the Shapley value evaluation method produces nearly the same values as other methods, but with better suiting balanced scientific decision making for enterprises at later stages with high industry leader requirements.
Table 4.
Comparison of yearly and final food safety evaluation scores across different methods.
3.2.3. Operational Feasibility of the RM–Shapley–FAHP Method in Enterprise Practice
The RM–Shapley–FAHP evaluation method has good operability for enterprise evaluation application. In actual food safety development, enterprises may upgrade a single aspect of the model several times in a year and assign a third party to evaluate it. In practice, common situations that may occur include the following: (1) the feedback usually consists of a single value; (2) the granularity of the standard index system may differ from the RM–Shapley–FAHP method; (3) differences in the resulting evaluation report between evaluation hierarchy and RM–Shapley–FAHP methods, such as changing from three-level evaluation to five-level evaluation; and (4) the third-party evaluation report may not provide specific calculation formulas and methods.
We can evaluate the initial replacement according to the RM–Shapley–FAHP method, providing current scores to facilitate guidance for food safety development. Figure 2 represents the results of three annual criteria layer evaluations, while Figure 3 shows the results of annual model evaluations over three years. The annual evaluations can offer assessment results from two perspectives: responsibility division and scope of capability. This facilitates enterprises in implementing food safety development responsibilities, dividing related improvement tasks, and enhancing model practicability.
Among all evaluated indicators, Food Poisoning Incidence Frequency and Number of Poisoning Deaths received the highest final scores (2.0), reflecting their direct connection to human life and health. Their prioritization aligns with common sense and public expectations regarding food safety. Meanwhile, National Supervision Sampling Frequency and Law Compliance Training Coverage Rate demonstrated the most significant growth, which mirrors broader societal developments and growing public awareness of regulatory enforcement and safety education. In contrast, indicators like Veterinary Drug Residue Control Level, Cold Chain Transport Compliance Rate, and Food Recall Timeliness exhibited a noticeable slowdown in growth. This trend is largely due to the previous occurrence of major food safety incidents in these areas, prompting improvements in relevant policies and emergency response mechanisms. As a result, while these factors remain important, their growth rates have diminished over time with increased construction costs to higher standards.
3.3. Interpretability and Real-World Relevance of the RM–Shapley–FAHP Model
3.3.1. Interpretability in Addressing Information Overlap and Element Independence
Crossed-overlapping refers to the presence of identical element information among related elements in different sub-models. Element independence indicates that certain element information within a sub-model does not exist within the set of all other sub-model element information. Combined coverage pertains to a sub-model wherein all contained element information is not independent. To illustrate this, consider three distinct sub-models, X, Y, and Z, with sets Ix, Iy, and Iz containing element information. Cross-overlap refers to the case of Ix∩Iy ≠ ∅; element independence refers to the case of Ix − (Ix∩Iy)∪(Ix∩Iz) ≠ ∅; combined coverage refers to the case of Ix⊊(Iy∪Iz).
In terms of overlapping and element independence, according to Figure 4, the number of indicators included in model E is significantly smaller than that of models D and F, but its Shapley value is significantly higher than those of models D and F. From this, it can be concluded that the number of data indicators included in the model is not positively correlated with the model’s contribution.

Figure 4.
Relationship between Shapley value contributions and FAHP weights for the six sub-models: (a) yearly Shapley value percentages; (b) normalized FAHP weights, highlighting models whose influence is not proportional to the number of indicators they contain.
The RM–Shapley–FAHP evaluation method can effectively explain the overlap of information, element independence, combination coverage, and the necessity of these conditions.
3.3.2. Alignment of Evaluation Results with Real-World Production Needs
Combined with Table 5 and Figure 2, it is obvious from the calculation formula in 2.4 that the RM–Shapley–FAHP method can better reflect the overall comprehensive situation than the safety score of the current single year. Compared with the average FAHP score of three years, it is closer to the current actual safety level, and the parameters are interpretable. Table 5 provides the three-year safety evaluation scores for two enterprises, comparing the RM–Shapley–FAHP composite results with simple three-year averages. These results illustrate the ability of the reputation-enhanced approach to capture historical risk impacts and differentiate enterprise performance more effectively.
Table 5.
Three-year safety evaluation scores for two enterprises (RM–Shapley–FAHP composite vs. three-year average).
Taking the data in Table 1 as an example, the RM–Shapley–FAHP method more closely reflects the current safety situation than the average value of the Shapley–FAHP method over three years. As shown in the data in Table 5, based on the Shapley–FAHP method contributed by the benchmark model, the safety synthesis degree of subsidiary A and subsidiary B is consistent based on the average weighted calculation. Subsidiary A is constantly improving its safety level according to the food safety construction plan, and subsidiary B is also building in the field of food safety. However, the score of subsidiary B in the second year was lower because of major safety accidents stipulated in the internal regulations of the food supply chain group due to its independent control and potential disaster preparedness. According to the RM–Shapley–FAHP method, the comprehensive score obtained by subsidiary A is significantly higher than that of subsidiary B, indicating that subsidiary A performs better than subsidiary B at present, which is consistent with the evaluation order among subsidiaries. In actual food safety production and safety maintenance, if a safety accident occurs in the first year, the accident will still affect the comprehensive safety score of the third year. Although the safety risk may have been rectified in the third year, it is necessary to keep the hidden danger mark, which is more in line with the enterprise’s evaluation mechanism, which is not only reflected in the field of food safety. This practice has also been implemented in construction, bank credit ratings, and other fields.
The final evaluation results of the RM–Shapley–FAHP evaluation method are more comprehensive in the long-term perspective of multiple years and more in line with the development needs of actual production.
3.4. Structural Analysis of Critical Model Nodes in Food Safety Networks
Figure 4 is included to demonstrate the structural insight provided by integrating complex network analysis into the RM–Shapley–FAHP framework. While the primary model already captures temporal evaluation dynamics and contribution weights, it does not directly reflect the interconnectedness and structural vulnerability among different governance factors. Based on the data analysis presented above, we have obtained partial conclusions regarding the food safety system. We now shift our perspective to apply complex network methods within the interconnected indicator system established through the FAHP approach. By calculating node importance using centrality metrics, such as betweenness centrality, we aim to validate our previous findings and provide supplementary insights. The results are shown in Table 6. Table 6 lists the centrality metrics for nodes in the food safety evaluation network.
Table 6.
Centrality metrics for nodes in the food safety evaluation network.
By building an undirected network, the validation reveals that models A, B, and D consistently demonstrate high centrality across multiple metrics in the undirected network, confirming their critical roles identified in the FAHP analysis. These nodes exhibit high degree, betweenness, and closeness centralities, positioning them as structurally indispensable components whose disruption could significantly impair network resilience. Furthermore, the directed network analysis uncovers additional nuances not captured by traditional weighting methods, in which models C and F demonstrate strong performance across both network representations, validating their importance while revealing their dual function in structural cohesion and directional propagation.
These results carry significant implications for food safety governance. The network analysis not only validates the importance of nodes identified through FAHP but also emergent critical nodes that traditional weighting methods might lead evaluators to overlook. This dual-perspective approach enables a more comprehensive understanding of system vulnerabilities (B, E), suggesting that effective governance requires both protecting consistently critical nodes (A, B, D) and adaptively monitoring context-specific pivotal nodes (C, F) based on operational scenarios. The integration of FAHP and network analysis thus provides a robust framework for identifying and managing critical components in food safety systems, ensuring that decision makers pay attention to each key dimension model.
4. Discussion
Despite the contributions of the RM–Shapley–FAHP framework, several limitations should be acknowledged. First, the model’s reliance on expert scoring introduces subjectivity, which, although mitigated through FAHP and Shapley analysis, cannot be fully eliminated. Second, the empirical validation is restricted to a large leading enterprise, which may limit the immediate generalizability of findings to smaller firms or other sectors of the food industry. Third, while this study suggests the potential of integrating the framework with machine learning techniques, its concrete implementation and performance under real-world conditions remain to be further validated. Recognizing these limitations provides a clearer boundary for interpreting the results and sets the stage for future research directions.
This study presents the RM–Shapley–FAHP model as a response to several persistent challenges in traditional FAHP-based evaluations, particularly those related to redundant information, weak factor independence, and the uncertainty of assessment inputs. A key advancement introduced by this model lies in its application of the Shapley value, which provides a systematic way to interpret and balance interdependent evaluation elements. While some earlier studies have combined entropy and AHP methods to enhance objectivity and consistency in fuzzy evaluations [28], these approaches often fail to address indicator overlap, temporal dynamics, or contribution traceability—issues that are systematically tackled in our proposed RM–Shapley–FAHP model. Moreover, by incorporating concepts from multi-stage game equilibrium theory, the model demonstrates flexibility in adapting to the complex and evolving nature of food safety systems.
To evaluate its effectiveness, the model was tested across four dimensions. First, numerical validation confirmed that the Consistency Index (CI) values across all six governance subsystems (U1–U6) were below the 0.1 threshold (ranging from 0.0226 to 0.0638), meeting the FAHP consistency requirement. Second, comparative testing showed that the RM–Shapley–FAHP model achieved the highest final evaluation score of 1.48 (Table 4), outperforming the weighted average (1.29), the entropy method (1.25), and equal-weight averaging (1.26). These results demonstrate improved robustness under uncertainty or resource constraints, offering better guidance at each planning stage of enterprise development. Third, field deployment confirmed its operational viability in two subsidiaries (Table 5), where the RM–Shapley–FAHP model yielded scores of 1.58 and 1.55, respectively, differentiating the enterprises more precisely than simple three-year averages (both 1.47). Fourth, expert reviews endorsed its applicability beyond food governance, including digital supply chain safety and green manufacturing.
The results reveal a nuanced shift in the landscape of food safety priorities. Indicators like “Food Poisoning Incidence Frequency” and “Number of Poisoning Deaths” reached the maximum score of 2.0 by year 3, reflecting both their inherent severity and alignment with public concern. Meanwhile, “National Supervision Sampling Frequency” and “Law Compliance Training Coverage Rate” demonstrated the largest year-over-year growth, increasing from 0.3 to 1.9 and from 0.4 to 1.9, respectively (Table 2). In contrast, indicators like “Veterinary Drug Residue Control Level” (from 1.1 to 1.9), “Cold Chain Transport Compliance Rate” (from 0.5 to 1.6), and “Food Recall Timeliness” (from 0.7 to 1.7) exhibited slower growth. These patterns suggest that while foundational risks remain prioritized, the marginal benefit of further improvements in some mature areas may decline due to rising maintenance costs.
The analysis further revealed how the model supports evidence-based decision making across various stages. In the early development phase, RM–Shapley–FAHP led to a score improvement of approximately 12–18% compared with conventional methods (as inferred from year 1 scores in Table 4), helping enterprises to prioritize foundational safety infrastructure. In later phases, it reallocates focus to technology-based indicators while dynamically adjusting for overlap, ensuring balance. Unlike static-weight models, RM–Shapley–FAHP adapts to system evolution, consistent with the “dynamic priority adjustment” theory articulated by An N et al. [29].
A complementary analysis combining FAHP with network-based metrics further deepens this understanding. FAHP highlights high-impact nodes (A, B, E), while network centrality metrics, such as betweenness and closeness centrality (Table 6), identify scenario-sensitive vulnerabilities in models C, D, and F. For instance, model B showed the highest directed closeness centrality (4.8817), while model F scored 4.7737, highlighting its dual function in resilience and dynamic propagation. This contrast underscores the value of combining structural protection with adaptive oversight.
A closer look at the sub-models reveals that the number of indicators included does not necessarily determine contribution value. Model E, with fewer indicators than D and F, demonstrated a significantly higher Shapley value (Figure 4). Similarly, model F’s indicators were fully redundant with others, yet it still contributed independently to enterprise decision making, showing that the Shapley-weighted value was not null. These findings challenge the “more indicators = more impact” assumption and support careful design based on informational uniqueness.
Beyond its immediate application to food safety governance, the RM–Shapley–FAHP model exhibits strong scalability and transferability. Through ongoing discussions with researchers in network and data security evaluation, as well as energy and power systems governance, we found broad consensus that the proposed framework can be extended to other domains requiring multi-indicator assessment with temporal dynamics and interdependencies. Furthermore, during our simulation studies, we conducted sensitivity tests by modifying single to a dozen indicator values and altering factor–model relationships. We observed that due to the model’s structural design—where multiple indicators are aggregated at the model level before Shapley contribution is computed—the fluctuation of individual factors did not significantly disrupt trend recognition or RM–Shapley–FAHP model comparative ranking first. The RM–Shapley–FAHP model maintained consistent superiority over alternative methods across all simulated variations. Notably, even under simulations where indicator-to-model mapping was entirely reshaped, the results continued to support our central finding that a greater number of indicators does not guarantee a higher contribution score. This confirms the model’s robustness and interpretability and highlights its potential to uncover informational uniqueness rather than relying solely on factor count.
5. Conclusions
In summary, the findings of this study provide direct answers to the research questions raised in the introduction. First, by integrating FAHP with Shapley value analysis, the framework addresses RQ1 by systematically capturing indicator interdependencies and reducing redundancy. Second, the incorporation of the reputation decay mechanism embeds historical performance into current evaluations, thereby responding to RQ2 and enhancing the temporal continuity of food safety assessments. Third, the combined framework improves transparency and interpretability, thus fulfilling RQ3 by offering a dynamic, multi-dimensional evaluation model that balances expert judgment with quantitative rigor. These contributions not only validate the research objectives but also demonstrate the practical potential of the proposed approach for complex food safety governance scenarios.
This study presents a novel RM–Shapley–FAHP model for the comprehensive evaluation of food safety, addressing key limitations of traditional methods. The framework integrates the Fuzzy Analytic Hierarchy Process with Shapley value analysis and a reputation decay mechanism, enabling dynamic, interpretable, and multi-dimensional assessments. Through Consistency Index verification (CI < 0.1 for all governance subsystems), comparative scoring improvements of up to 18% in the final evaluation, and case validation across two subsidiaries with RM composite scores of 1.58 and 1.55, the model demonstrates strong reliability and decision relevance. It also achieved the highest final evaluation score (1.48) among all tested methods, illustrating its robustness.
Notably, life-critical risks, such as food poisoning incidence and deaths (both scoring 2.0), remain top-ranked, while regulatory and education indicators, such as sampling frequency and law training, grew most significantly (each increasing from ~0.3–0.4 to 1.9). Conversely, residue control, cold chain compliance, and recall timeliness displayed slower growth, influenced by earlier policy tightening and rising maintenance costs.
Complementary network analysis identified models A, B, D as structurally indispensable (e.g., model B’s directed closeness = 4.88) and scenario-sensitive roles for models C and F. These insights validate the model’s multi-dimensional capability in both centralized and adaptive risk management.
Beyond methodological innovation, the RM–Shapley–FAHP model illustrates how computing and artificial intelligence techniques can strengthen risk evaluation by integrating interdependent metrics and historical performance. Its application in food science and technology improves both interpretability and decision relevance, offering enterprises reliable guidance for safety governance. Moreover, the model supports green and sustainable development, aligning safety improvements with long-term resilience and regulatory goals across supply chains.
Several limitations remain. The complexity of the model may challenge organizations with limited analytical capacity. Reliance on expert judgment introduces subjectivity, while the focus on large leader statue enterprises constrains generalizability to smaller firms. Structural analysis provides valuable insights but lacks validation through active stress testing, and high computational requirements may limit applicability in resource-constrained contexts.
Future research will focus on the following areas: (1) incorporating machine learning to reduce subjectivity and enhance data-driven robustness; (2) extending validation across industries and organizational scales to broaden applicability; (3) developing streamlined tools for small and medium enterprises to lower entry barriers; (4) constructing temporal frameworks that capture evolving risks through time-series analysis; and (5) exploring sensitivity to network structures and topology variations. Advancing these directions will strengthen the adaptability, scalability, and theoretical foundations of the model, contributing meaningful progress at the intersection of food safety evaluation, artificial intelligence, and sustainable governance.
Author Contributions
Conceptualization, X.Y., M.Z. and B.G.; data curation, H.G.; formal analysis, X.Y.; funding acquisition, M.Z.; methodology, H.W.; project administration, M.Z.; supervision, L.M.; validation, X.Y. and H.W.; writing—original draft, X.Y. and H.W.; writing—review and editing, X.Y. All authors have read and agreed to the published version of the manuscript.
Funding
This research was supported in part by the Technology Project of the State Administration for Market Regulation (No. 2023MK169), the National Natural Science Foundation of China (Nos. 62433002, 62476014, 62473008), the Beijing Nova Program (No. 20240484710), the Project of the Beijing Municipal University Teacher Team Construction Support Plan (No. BPHR20220104), the Beijing Scholars Program (No. 099), the Key Research and Development Project of Guang-dong Province (No. 2021B0101420003), the National Science and Technology Major Project under grant No. 2021ZD0201302, and the System Science Open Subject of Beijing Wuzi University (BWUISS07).
Data Availability Statement
The data presented in this study are available upon request from the corresponding author. The data are not publicly available due to privacy and data security requirements of the food companies.
Conflicts of Interest
The authors declare no conflicts of interest.
Abbreviations
The following abbreviations are used in this manuscript:
| RM | Reputation mechanism |
| FAHP | Fuzzy Analytic Hierarchy Process |
| FCE | Fuzzy comprehensive evaluation |
References
- Chang, K.-H. Integrating subjective–objective weights consideration and a combined compromise solution method for handling supplier selection issues. Systems 2023, 11, 74. [Google Scholar] [CrossRef]
- Mansoor, Z.; Williams, M.J. Systems approaches to public service delivery: Methods and frameworks. J. Public Policy 2024, 44, 258–283. [Google Scholar] [CrossRef]
- Ye, W. E-Commerce Logistics and Supply Chain Network Optimization for Cross-Border. J. Grid Comput. 2024, 22, 22. [Google Scholar] [CrossRef]
- Ab Rahim, M.S.; Reniers, G.; Yang, M.; Bajpai, S. Risk assessment methods for process safety, process security and resilience in the chemical process industry: A thorough literature review. J. Loss Prev. Process Ind. 2024, 88, 105274. [Google Scholar] [CrossRef]
- Strand, R.D.; Log, T. A Cold Climate Wooden Home and Conflagration Danger Index: Justification and Practicability for Norwegian Conditions. Fire 2023, 6, 377. [Google Scholar] [CrossRef]
- Declerck, J.; Kalra, D.; Stichele, R.V.; Coorevits, P. Frameworks, Dimensions, Definitions of Aspects, and Assessment Methods for the Appraisal of Quality of Health Data for Secondary Use: Comprehensive Overview of Reviews. JMIR Med. Inform. 2024, 12, e51560. [Google Scholar] [CrossRef] [PubMed]
- Semenov, A.; Oviechkina, O.; Burda, N.; Orlova-Kurilova, O.; Riazanova, N. Comprehensive assessment of financial management of economic safety of an enterprise in the conditions of innovative economy. J. Hyg. Eng. Des. 2022, 39, 227–235. [Google Scholar]
- Hector, I.; Panjanathan, R. Predictive maintenance in Industry 4.0: A survey of planning models and machine learning techniques. PeerJ Comput. Sci. 2024, 10, e2016. [Google Scholar] [CrossRef]
- Li, S.; Qu, S. The three-level supply chain finance collaboration under blockchain: Income sharing with Shapley value cooperative game. Sustainability 2023, 15, 5367. [Google Scholar] [CrossRef]
- Röhrs, S.; Rohn, S.; Pfeifer, Y.; Romanova, A. Supplier Risk Assessment—A Quantitative Tool for the Identification of Reliable Suppliers to Enhance Food Safety Across the Supply Chain. Foods 2025, 14, 1437. [Google Scholar] [CrossRef]
- Holmes, F.; Shukla, M.; Dhurkari, R.K. Design of multi-criteria decision framework for supplier evaluation and supply chain sustainability risk (SCSR) management. Br. Food J. 2025, 127, 1730–1755. [Google Scholar] [CrossRef]
- Oh, S.E.; Kim, J.H.; Kim, J.Y.; Ahn, J.H. Food Safety Distribution Systems Using Private Blockchain: Ensuring Traceability and Data Integrity Verification. Foods 2025, 14, 1405. [Google Scholar] [CrossRef] [PubMed]
- Julien, D.M. Supplier safety assessment in the food supply chain and the role of standards. In Delivering Performance in Food Supply Chains; Woodhead Publishing: Cambridge, UK, 2010; pp. 62–83. [Google Scholar]
- Kleboth, J.; Luning, P.; Fogliano, V. Risk-based integrity audits in the food chain—A framework for complex systems. Trends Food Sci. Technol. 2016, 56, 167–174. [Google Scholar] [CrossRef]
- Zhang, Q.; Song, Z.; Bi, M. Evaluation Model Based on the SGCNiFormer for the Influence of Different Storage Environments on Wheat Quality. Foods 2025, 14, 1715. [Google Scholar] [CrossRef]
- Liu, K.; Chen, Y.; Wang, H.; Xie, H.; Liu, Z. Reducing inconsistencies of FAHP in structural safety assessment of diversion tunnels. Appl. Soft Comput. 2023, 146, 110642. [Google Scholar] [CrossRef]
- An, Y.; Tan, X.; Gu, B.; Zhu, K.; Shi, L.; Ding, Z. An assessment of renewable energy development in Belt and Road Initiative countries: An entropy and TOPSIS approach. Energy Rep. 2023, 10, 3545–3560. [Google Scholar] [CrossRef]
- Wu, X.; Huang, H.; Xie, J.; Lu, M.; Wang, S.; Li, W.; Huang, Y.; Yu, W.; Sun, X. A novel dynamic risk assessment method for the petrochemical industry using bow-tie analysis and Bayesian network analysis method based on the methodological framework of ARAMIS project. Reliab. Eng. Syst. Saf. 2023, 237, 109397. [Google Scholar] [CrossRef]
- Dong, Y.; Zhan, M.; Kou, G.; Ding, Z.; Liang, H. A survey on the fusion process in opinion dynamics. Inf. Fusion 2023, 91, 318–328. [Google Scholar] [CrossRef]
- Veerabadrappa, K.; Lingareddy, S.C. Secure Routing using Multi-Objective Trust Aware Hybrid Optimization for Wireless Sensor Networks. Int. J. Intell. Eng. Syst. 2022, 15, 540–548. [Google Scholar] [CrossRef]
- Yang, N.; Tang, C.; Zong, T.; Zeng, Z.; Xiong, Z.; He, D. RIC-SDA: A Reputation Incentive Committee-Based Secure Conditional Dual Authentication Scheme for VANETs. IEEE Trans. Mob. Comput. 2024, 23, 14361–14376. [Google Scholar] [CrossRef]
- Ma, X.; Wang, Y.; Liu, Z.; Feng, X. Comprehensive evaluation of 5G+ smart distribution network based on combined weighting method-cloud model. Glob. Energy Interconnect 2022, 5, 675–691. [Google Scholar] [CrossRef]
- Sarwar, M.A.; Gong, Y.; Alzakari, S.A.; Alhussan, A.A. A novel Fractional fuzzy approach for multi-criteria decision-making in medical waste management. Sci. Rep. 2025, 15, 23999. [Google Scholar] [CrossRef]
- Yang, M.; Feng, H.; Wang, X.; Jiao, X.; Wu, X.; Qin, S. Fair Incentive Allocation for Secure Data Sharing in Blockchain Systems: A Shapley Value Based Mechanism. In International Conference on Autonomous Unmanned Systems; Springer Nature: Singapore, 2023. [Google Scholar]
- Koc, K. Role of Shapley additive explanations and resampling algorithms for contract failure prediction of public–private partnership projects. J. Manag. Eng. 2023, 39, 04023031. [Google Scholar] [CrossRef]
- Tu, X.; Zhu, K.; Luong, N.C.; Niyato, D.; Zhang, Y.; Li, J. Incentive mechanisms for federated learning: From economic and game theoretic perspective. IEEE Trans. Cogn. Commun. Netw. 2022, 8, 1566–1593. [Google Scholar] [CrossRef]
- Liu, L.; Feng, J.; Wu, C.; Chen, C.; Pei, Q. Reputation management for consensus mechanism in vehicular edge metaverse. IEEE J. Sel. Areas Commun. 2023, 42, 919–932. [Google Scholar] [CrossRef]
- Chen, T.; Jin, Y.; Qiu, X.; Chen, X. A hybrid fuzzy evaluation method for safety assessment of food-waste feed based on entropy and the analytic hierarchy process methods. Expert Syst. Appl. 2014, 41, 7328–7337. [Google Scholar] [CrossRef]
- An, N.; Ha, T.; Park, K.J.; Lim, H. Dynamic priority-adjustment for real-time flows in software-defined networks. In Proceedings of the 2016 17th International Telecommunications Network Strategy and Planning Symposium (Networks), Montreal, QC, Canada, 26–28 September 2016; pp. 144–149. [Google Scholar]
Disclaimer/Publisher’s Note: The statements, opinions and data contained in all publications are solely those of the individual author(s) and contributor(s) and not of MDPI and/or the editor(s). MDPI and/or the editor(s) disclaim responsibility for any injury to people or property resulting from any ideas, methods, instructions or products referred to in the content. |
© 2025 by the authors. Licensee MDPI, Basel, Switzerland. This article is an open access article distributed under the terms and conditions of the Creative Commons Attribution (CC BY) license (https://creativecommons.org/licenses/by/4.0/).