Article

Photodynamic and Sonodynamic Antibacterial Activity of Grape Leaf Extracts

1
Department of Chemical Engineering, Ariel University, Ariel 4070000, Israel
2
Department of Molecular Biology, Institute for Personalized and Translational Medicine, Ariel University, Ariel 4070000, Israel
*
Author to whom correspondence should be addressed.
Appl. Sci. 2025, 15(19), 10738; https://doi.org/10.3390/app151910738
Submission received: 25 August 2025 / Revised: 25 September 2025 / Accepted: 29 September 2025 / Published: 5 October 2025

Abstract

Food spoilage and contamination are major global challenges, reducing food quality, safety, and availability, causing significant economic losses. This study evaluates the photodynamic and sonodynamic antibacterial activities of grape leaf extracts from Beer and Hanut Orcha varieties. The extracts were tested against Staphylococcus aureus and Escherichia coli under illumination and ultrasonic activation. The results demonstrated that the photodynamic and sonodynamic treatments significantly enhanced the antibacterial efficacy of the extracts when higher concentrations of the extracts and prolonged exposure led to complete bacterial eradication. Separation of the extracts using RP-18 cartridges (Yicozoo Energy Technology Co., Ltd., Xi’an, China) enabled us to get an active fraction containing components responsible for antimicrobial effects. Singlet oxygen generation measurements confirmed the involvement of reactive oxygen species in bacterial inactivation under illumination. Using HPLC/MS, the active components responsible for the photodynamic properties of the extracts were identified as quercetin 3’-O-glucuronide and pheophorbide a. The findings suggest that these natural extracts, in combination with photodynamic and sonodynamic activation, represent promising alternatives to conventional antibiotics. Further studies should focus on the isolation of active individual compounds, the improvement of treatment parameters, and the investigation of molecular mechanisms to facilitate the development of practical applications in medicine and food preservation.

1. Introduction

Food spoilage and contamination are major global challenges, reducing food quality, safety, and availability, causing significant economic losses. Effective food preservation offers numerous benefits, including increased food availability, reduced food waste, and a more sustainable food system [1]. However, the methods and processes for food preservation vary depending on the type of food, desired shelf life, and specific preservation goals [2]. The main causes of food spoilage include microbiological contamination, physicochemical alterations, enzymatic activity, and other factors that can reduce the nutritional value, quality, and safety, leading to undesirable changes in physicochemical and sensory characteristics [3]. To address these challenges, biological, physical, and chemical methods for food preservation have been developed to enhance food safety and extend shelf life.
The U.S. Food and Drug Administration (FDA) has approved several food preservative compounds, including hydrogen peroxide, sodium benzoate, and organic acids such as acetic, benzoic, lactic, and sorbic acids, based on their physicochemical properties. These compounds inhibit bacterial growth, mold, and yeast [4]. Effective preservatives must exhibit specific physical properties, including water solubility, stability, tastelessness, and odorlessness [4,5]. However, despite FDA approval, some chemical preservatives are highly toxic and potentially carcinogenic. For instance, benzoates and sulfites are commonly added to processed and packaged foods to prevent bacterial growth and spoilage. Nevertheless, excessive use of these preservatives poses health risks, including allergic contact dermatitis, hypersensitivity reactions, liver disease, and cellular damage [5].
The drawbacks of synthetic preservatives have encouraged interest in natural alternatives derived from animal sources, plants, algae, mushrooms, and microorganisms [3,6]. These natural preservatives offer several advantages regarding health, environmental impact, and safety. Plants are rich sources of bioactive compounds with antimicrobial activity against a broad spectrum of bacteria, including both Gram-positive and Gram-negative species [7]. Bioactive compounds such as alkaloids, flavonoids, terpenoids, and phenolic compounds hold potential as novel agents for both food preservation and treatment of bacterial contaminations, including those caused by antibiotic-resistant strains [8,9].
Grape leaves have been reported as valuable sources of antimicrobial compounds. Extracts of Vitis vinifera leaves show inhibitory effects against both Gram-positive and Gram-negative bacteria, including Staphylococcus aureus and Escherichia coli [10]. Methanolic and ethanolic grape leaf extracts demonstrated antibacterial activity in vitro, when the effects depended on solvents, concentration, and bacterial strain [11]. These findings provide a strong rationale to investigate grape leaves further as potential antimicrobial agents.
A number of natural bioactive compounds exhibit antibacterial photodynamic properties, meaning their antimicrobial effects are enhanced by light exposure. Photodynamic treatment (PDT) utilizes light-activated photosensitizers to generate reactive oxygen species (ROS) for effective bacterial inactivation [12,13]. Photodynamic treatment destroys bacteria and disrupts biofilms [12,13]. Light-activated photosensitizers, triggered by specific wavelengths, generate ROS that enable rapid and effective disinfection of medical and dental devices [13]. Photodynamic inactivation is particularly effective against multidrug-resistant strains, utilizing ROS to eradicate pathogens [12,13]. Moreover, photodynamic decontamination, based on light-activated photosensitizers, has applications in water treatment and air purification, as ROS efficiently eliminate pathogens in contaminated environments [13].
Recent studies highlight the potential of plant-derived compounds as natural photosensitizers for PDT. Mikulich et al. reported significant bactericidal effects of medicinal plant extracts upon light activation, attributed to membrane disruption that facilitates ROS penetration [14]. Similarly, Bonifácio et al. demonstrated that Curcuma longa extract effectively inactivated Listeria innocua biofilms under photodynamic conditions [15]. Blue light has also been shown to enhance the antimicrobial efficacy of essential oils against bacteria and fungi [16]. In addition, phytochemicals from plants such as Sanguisorba officinalis L. and Uncaria gambir Roxb. displayed up to a four-fold increase in antibacterial activity under visible light [17], while extracts from medicinal plants in Nepal exhibited comparable light-enhanced antimicrobial and antifungal effects [18].
Sonodynamic treatment (SDT) is a non-invasive antimicrobial approach that combines ultrasound waves with sonosensitizers to eliminate pathogenic bacteria and cancer cells [19]. Ultrasound waves penetrate tissues, inducing cavitation, where microbubble oscillation or collapse generates mechanical stress, heat, and ROS. The activation of sonosensitizers triggers ROS production, including hydroxyl radicals, singlet oxygen, and superoxide anions, which play a crucial role in the antimicrobial effects of SDT [19,20]. These ROS induce oxidative damage to bacterial membranes, proteins, and DNA, leading to the effective elimination of pathogenic microorganisms [20].
Increasing attention has also been directed toward natural compounds as potential sonosensitizers. For example, curcumin, a polyphenolic compound from Curcuma longa, has demonstrated significant sonodynamic antimicrobial activity. When activated by ultrasound, curcumin efficiently generates ROS that inactivate Bacillus cereus, E. coli [21], and Streptococcus mutans [22]. Likewise, resveratrol, a polyphenol found in grapes, has shown promise as a natural sonosensitizer: resveratrol-mediated SDT disrupted multispecies biofilms containing C. albicans, S. aureus, S. sobrinus, and A. naeslundii, underscoring its potential in antimicrobial therapy [23].
The aim of this research was to develop natural and effective antimicrobial treatments using grape leaf extracts under photodynamic and sonodynamic activation. The study focused on the extraction of active antibacterial compounds from Beer and Hanut Orcha grape leaves, followed by an evaluation of their effects on Gram-positive and Gram-negative bacteria and identification of bioactive compounds with antibacterial efficacy by investigating the chemical composition of the plant extracts.
To the best of our knowledge, Beer and Hanut Orcha grape leaf extracts have not been studied for antibacterial effects under photodynamic and sonodynamic activation. Previous studies on other grape species, Vitis vinifera, highlighted the antibacterial activity of grape leaves [24,25], but photo- or sono-activation of the extracts was not investigated. Our study addresses these gaps by applying both PDT and SDT to the same botanical source, performing fractionation and characterization of grape leaf extracts, and testing their activity against Gram-positive and Gram-negative strains. This approach highlights Beer and Hanut Orcha grape leaves as a novel, chemically traceable platform with possible applications for food decontamination and disinfection of production lines.

2. Results and Discussion

This study investigated the antibacterial effects of Beer and Hanut Orcha grape leaf extracts on Escherichia coli (E. coli) and Staphylococcus aureus (S. aureus) under light exposure and ultrasonication.

2.1. Effect of Grape Leaf Extracts on Bacteria Under Illumination

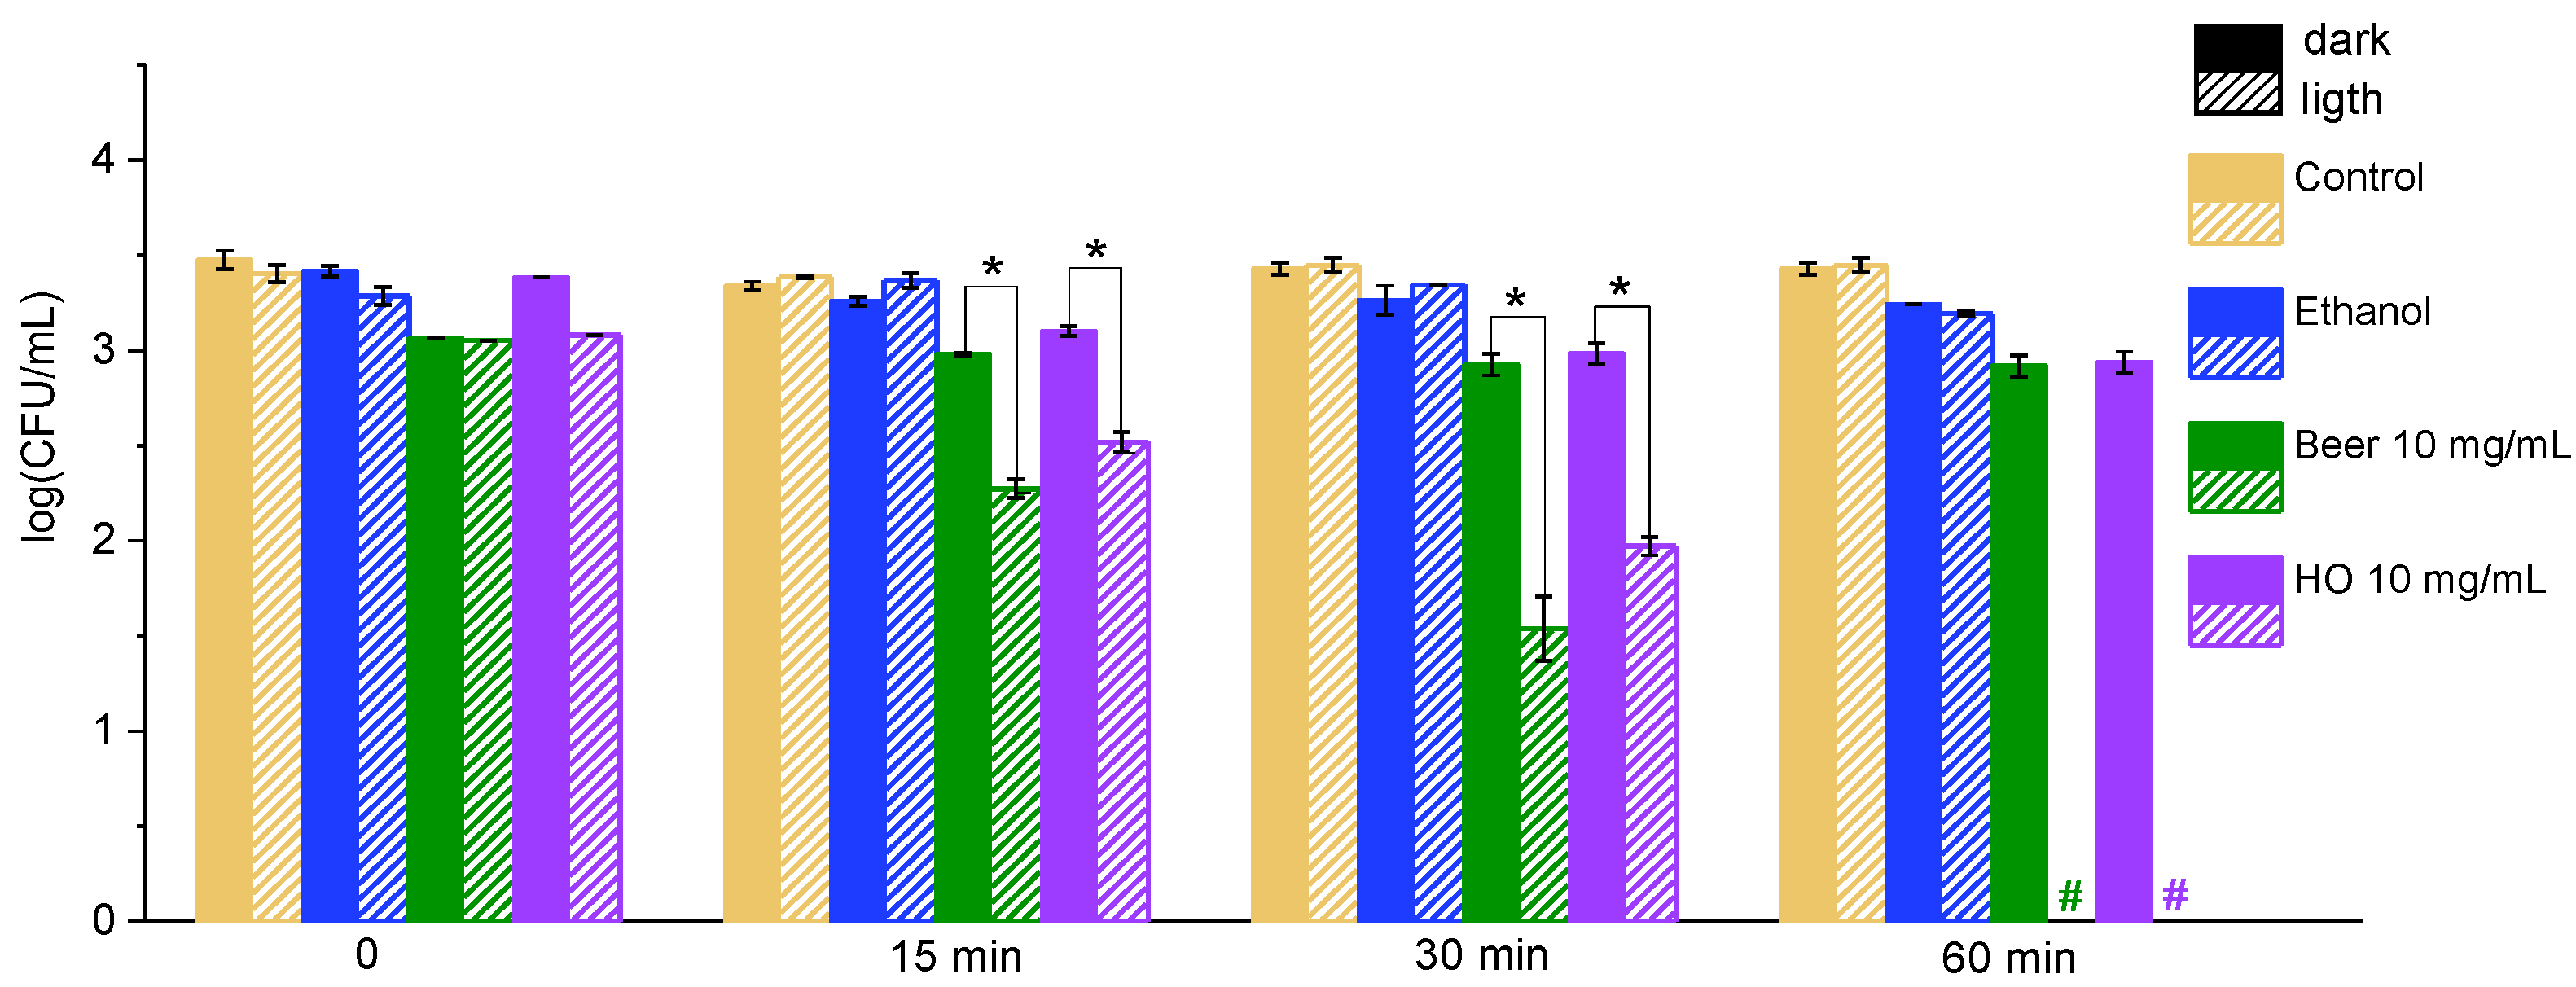
To evaluate the antibacterial photodynamic activity of Hanut Orcha and Beer leaf extracts against Gram-positive S. aureus and Gram-negative E. coli, bacterial suspensions were treated with varying concentrations of the extracts and exposed to white light or maintained in the dark. Control groups included untreated bacterial suspensions and those treated with ethanol at the same concentration as present in the extracts. Figure 1 presents the results obtained for S. aureus.
The antibacterial activity of Beer and Hanut Orcha leaf extracts against S. aureus was assessed at an initial bacterial concentration of 104 CFU/mL, using extracts at concentrations of 5 mg/mL and 10 mg/mL. The results revealed a time-dependent increase in antibacterial activity under light exposure. During the first 15 min, the cell concentration decreased by ca. 2 log10, and after 30 min, all the bacteria were killed (Figure 1). This finding is consistent with previous studies demonstrating that light exposure enhances the antimicrobial properties of a variety of compounds from plant extracts [16,17,18,26].
At the same time, the control groups, including untreated cells and ethanol-treated cells, exhibited no significant changes in bacterial viability under either light or dark conditions since the decrease in bacterial concentration did not exceed 0.5 log10 when compared to the untreated control cells. This confirms that light alone did not affect S. aureus, and the observed antibacterial activity was solely attributed to the photoactive compounds present in the Beer and Hanut Orcha leaf extracts.
The antibacterial efficacy of Beer and Hanut Orcha leaf extracts against E. coli under illumination is demonstrated in Figure 2. The results show a clear reduction in bacterial concentration, with both extracts exhibiting significant bactericidal effects as exposure time increased (Figure 2).
As in the case of S. aureus, photodynamic treatment caused the antibacterial activity of both Beer and Hanut Orcha leaf extracts against E. coli. As shown in Figure 1, the bacterial viability of S. aureus was significantly reduced under light exposure, particularly at higher extract concentrations (10 mg/mL). Since Gram-negative bacteria are known to be less susceptible to photodynamic treatment due to their complex outer membrane structure [27], in the case of E. coli, we applied the higher extract concentrations at longer time periods. The complete elimination of E. coli within 60 min and S. aureus within 30 min under light treatment, shown in the current work, is particularly noteworthy.
A time-dependent decrease in cell concentration of E. coli was observed, with significant reductions occurring within the first 30 min and complete bacterial elimination after 60 min (Figure 2). The enhanced antibacterial effect observed with prolonged light exposure suggests that light activates bioactive compounds within the extracts, leading to bacterial cell eradication. Control groups, including untreated and ethanol-treated bacterial suspensions, showed unchanged bacterial concentration throughout the experiment, confirming that the antibacterial effects were due to the extracts under light exposure and not to the presence of ethanol (Figure 2). In the case of both bacteria, there was no detectable difference between the activity of the two extracts (the p-value in the case of S. aureus was 0.87, and in the case of E. coli, 0.93).
Our results show that light exposure significantly enhances the antibacterial effects of grape leaf extracts against both S. aureus and E. coli. This observation aligns with previous research demonstrating the photodynamic inactivation of bacteria using plant-derived photosensitizers [14,15].

2.2. Effect of the Extracts on Bacteria Under Exposure to Ultrasound

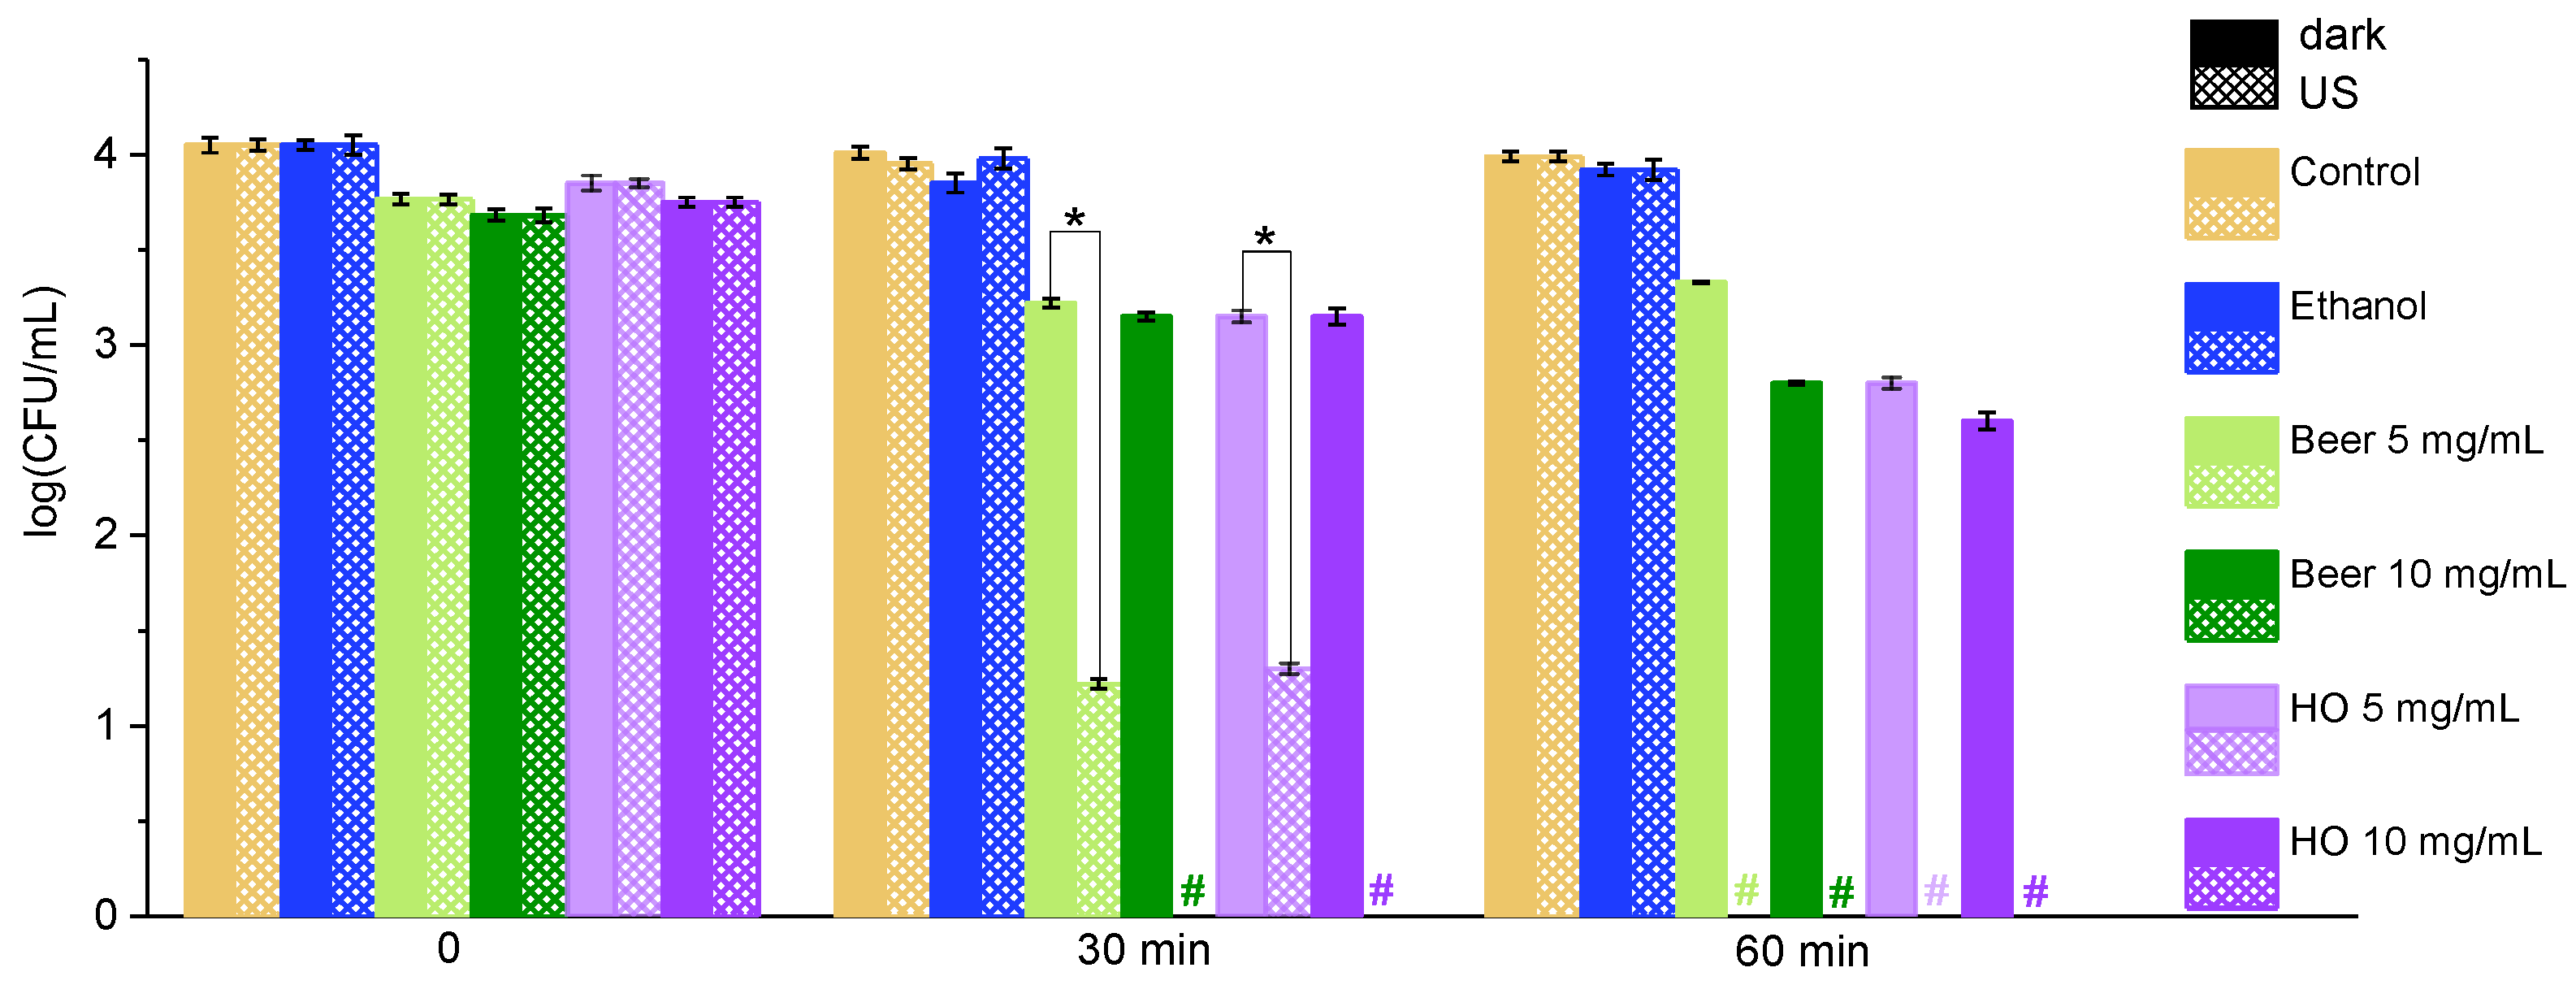
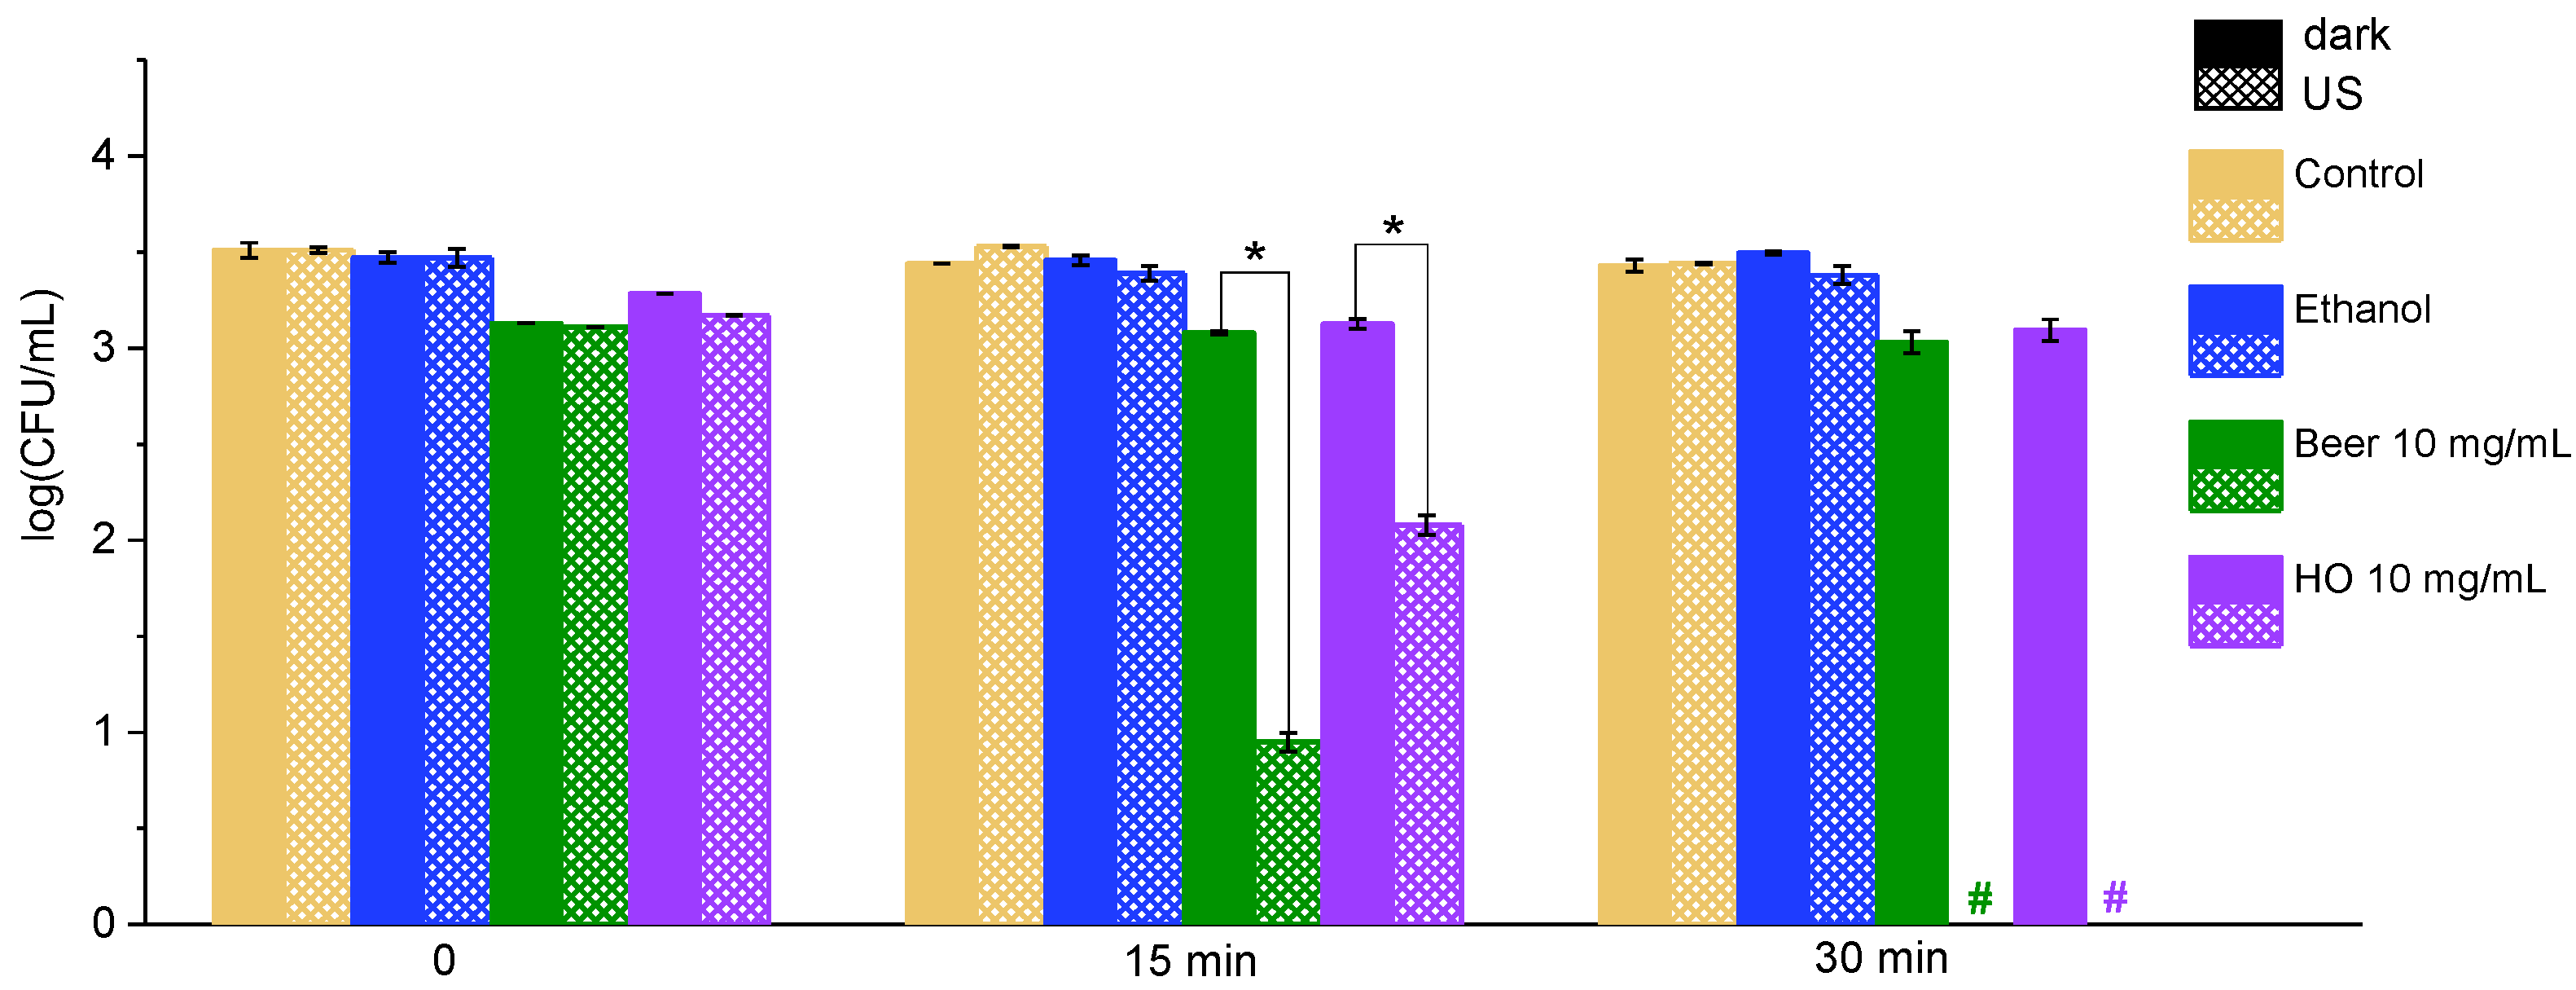
The antibacterial effect of Beer and Hanut Orcha leaf extracts against S. aureus and E. coli under ultrasonication in the dark was evaluated at an initial bacterial concentration of 104 CFU/mL (Figure 3 and Figure 4).
At all-time intervals, no significant antibacterial activity was observed in any of the control groups, confirming that in the absence of ultrasonication, the extract solutions alone did not impact bacterial viability. However, after 30 min of sonication, both extract concentrations exhibited a substantial reduction in bacterial cell concentration, indicating significant antibacterial activity. Application of the extracts at the higher 10 mg/mL concentration consistently demonstrated greater efficacy than the 5 mg/mL concentration, highlighting a dose-dependent response. Control groups, including untreated cells and those treated with ethanol, showed no significant changes in bacterial viability, further confirming that the observed antibacterial effects were solely due to the Beer and Hanut Orcha leaf extracts in combination with ultrasonication. The reduction in bacterial viability underscores the potential of ultrasonication to enhance the antibacterial efficacy of natural extracts against S. aureus (Figure 3).
Ultrasonication was also shown to enhance the antibacterial properties of Beer and Hanut Orcha leaf extracts against E. coli. The results demonstrated a significant increase in antibacterial activity following ultrasonication. Already after 15 min, a marked reduction in bacterial concentration was observed, indicating rapid bacterial cell death. The inhibition of bacterial growth became even more pronounced after 30 min of sonication in the presence of extracts at 10 mg/mL (Figure 4).
The increased efficacy of extracts against E. coli under ultrasonic conditions, compared to light exposure, suggests that ultrasound may provide a more effective means of overcoming the outer membrane barrier in Gram-negative bacteria. This aligns with studies by He et al. and Zhang et al., who found that ultrasound-initiated treatment by natural antimicrobials caused effective eradication of E. coli through enhanced membrane disruption mechanisms [28,29].
In conclusion, the sonodynamic treatment provided strong evidence of the antibacterial efficacy of the extracts under ultrasonication. Both S. aureus and E. coli exhibited substantial reductions in bacterial concentration following sonication, particularly within 30 min at the higher extract concentration of 10 mg/mL. These findings align with recent studies indicating that ultrasonication enhances the antimicrobial properties of plant extracts by generating reactive oxygen species (ROS) [21,22,23,30]. Additionally, the results in control groups confirmed that the observed antibacterial effects under ultrasonication were due to the extracts, as no significant changes were observed in untreated or ethanol-treated samples.
As in the case of the photodynamic treatment, there was no significant difference between the activity of the two extracts against bacteria (the p-value in the case of S. aureus was 0.84, and in the case of E. coli, 0.78). For this reason, in further study, we used only the extract from the leaves of Hanut Orcha grapes.

2.3. Fractionation of Hanut Orcha Extract and Testing Antibacterial Activity of Various Fractions

To separate and concentrate the compounds responsible for the antimicrobial activity of the Hanut Orcha extract, it was fractionated using RP-18 cartridges (Yicozoo Energy Technology Co., Ltd., Xi’an, China) and elution with varying concentrations of aqueous acetonitrile (ACN).
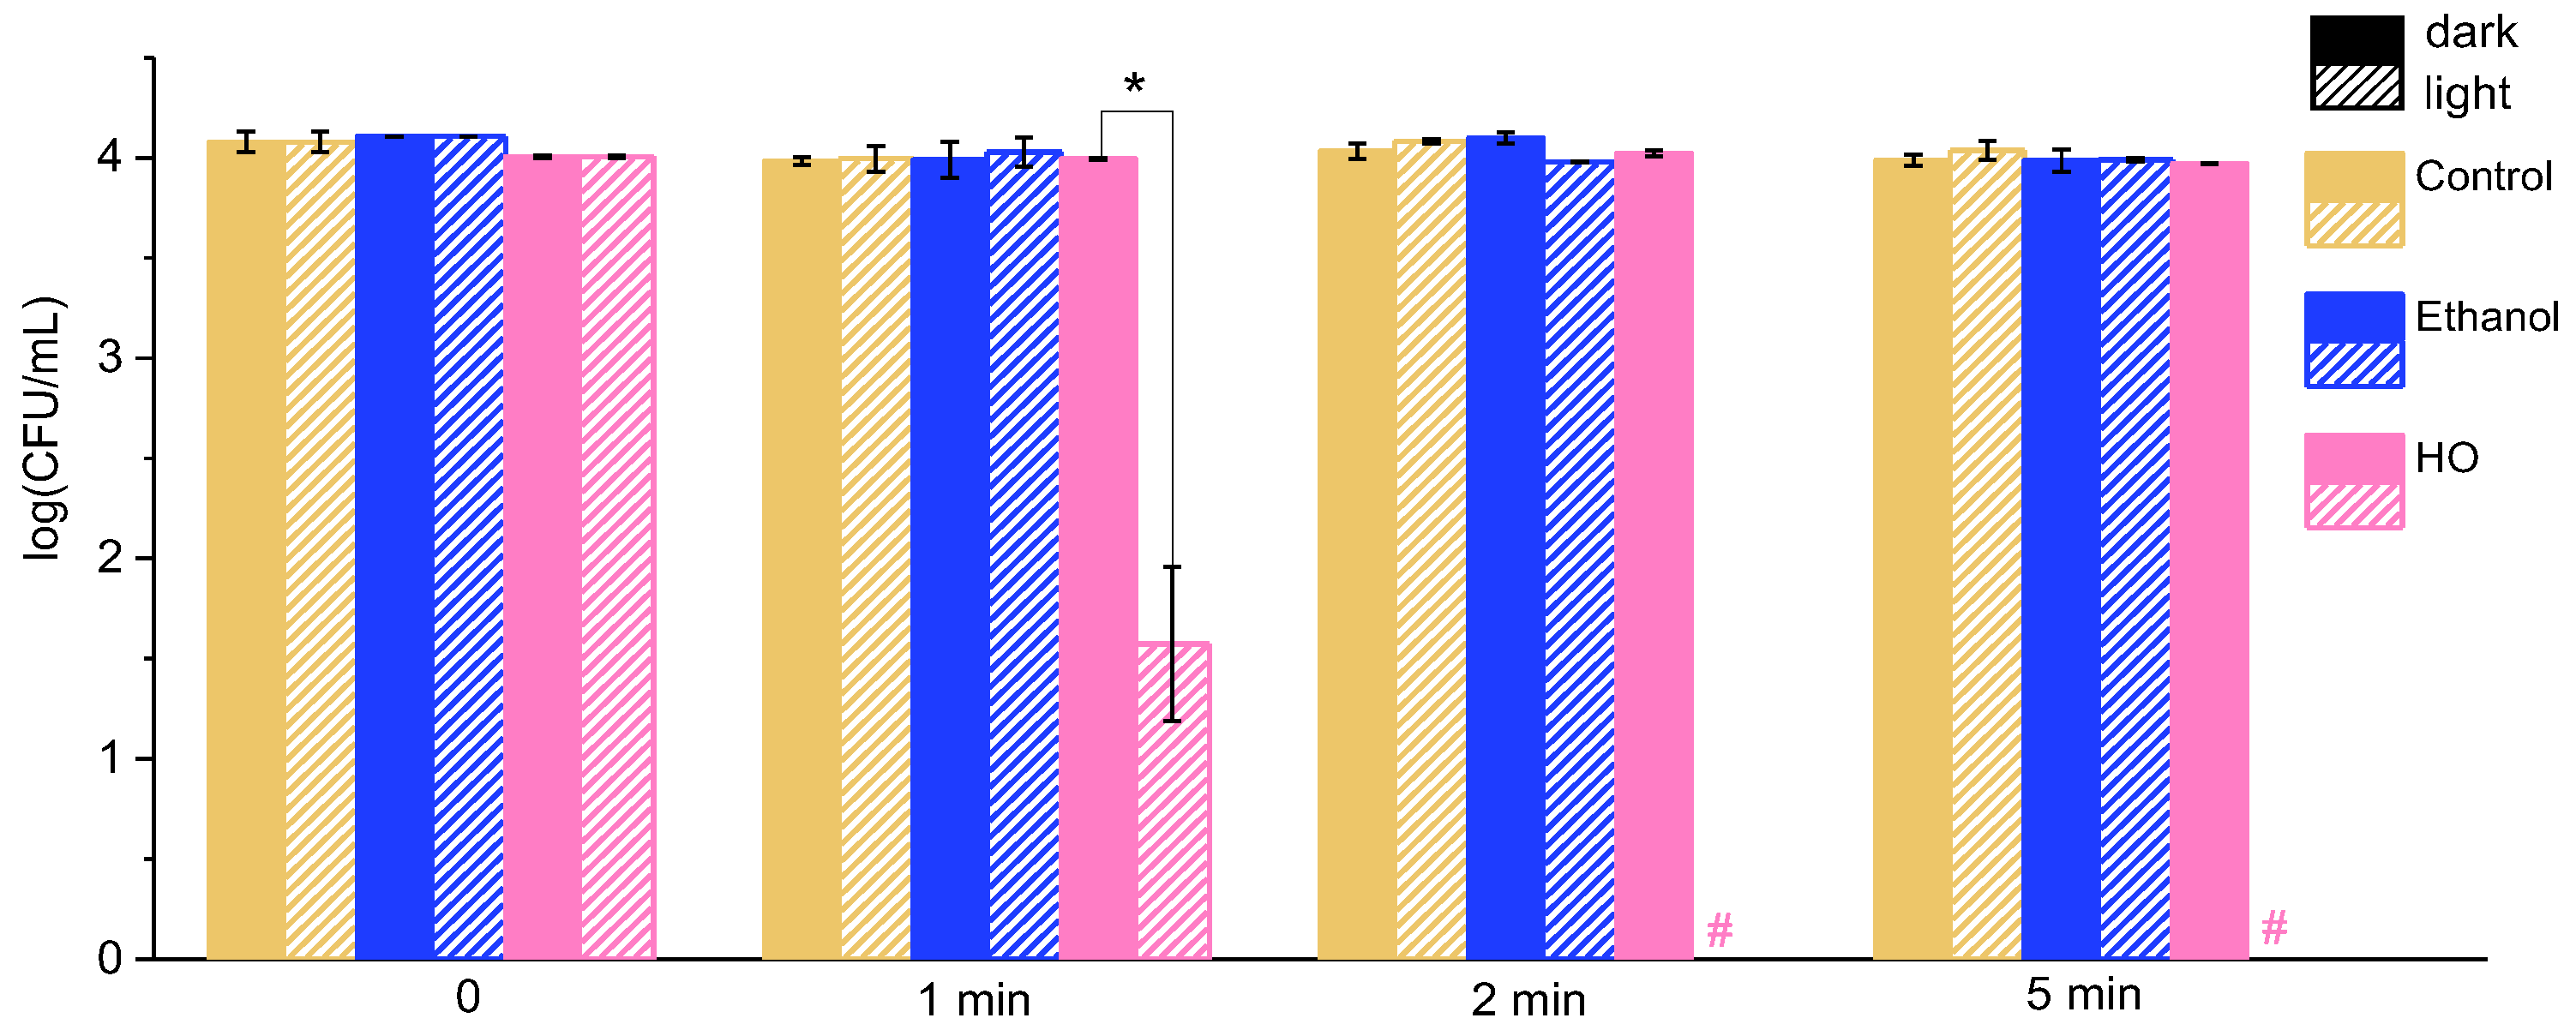
After evaporation, the fractions of 40%, 60%, and 80% ACN were dissolved in 70% ethanol, adjusted to the same concentration as in the initial crude extract (see Section 3.2), and tested against S. aureus with the initial bacterial concentration of 104 CFU/mL under illumination. The 60% ACN fraction was the most active (Figure 5). The results revealed a time-dependent increase in antibacterial photodynamic activity. After 1 min of treatment, bacterial concentration was significantly reduced, and after 2 min, complete bacterial elimination was observed (Figure 5). As in the case of the crude extract, the 60% ACN fraction showed very low dark activity.
The 60% ACN fraction exhibited faster and more effective bacterial elimination compared to the crude extract (Figure 1 and Figure 5). These results suggest that fractionation enabled obtaining a fraction containing concentrated bioactive compounds. This observation is consistent with previous findings indicating that targeted extraction and purification techniques can improve the bioactivity of plant-derived antibacterial compounds. A study by Kuete et al. showed that fractions of Ficus ovata extract possessed strong antibacterial activity against two fungi species, three Gram-positive bacteria, and five Gram-negative bacteria [31]. Similarly, Etame et al. found that fractionation of Enantia chlorantha stem bark extract led to the selective isolation of antibacterial flavonoids, which enhanced efficacy against seven strains and 28 clinical bacterial isolates [32]. The n-butanol and the aqueous fractions were particularly effective in inhibiting the growth of both Gram-positive and Gram-negative bacteria compared to the crude extract [32]. Nwodo et al. emphasized the significance of purification in screening novel antibacterial agents, illustrating its effects on plant fractions and their varying antibacterial activities [33]. Some bacterial strains lost susceptibility, while others exhibited increased susceptibility to the purified products [34]. Sidjui et al. investigated the phytochemical properties and antibacterial activity of extracts and isolated compounds from the stem barks of Jacaranda mimosifolia and Kigelia africana against Gram-negative bacteria (E. coli, Pseudomonas aeruginosa, and Salmonella typhi) and Gram-positive bacteria (S. aureus). This research resulted in the isolation of seventeen known compounds, including seven terpenoids, four quinones, and seven other compounds, some of which exhibited significant antibacterial activity [35]. Similar enhancements have been reported for grape leaf extracts. For example, Orhan et al. [24,36] showed that solvent-partitioned fractions, particularly the ethyl acetate and chloroform fractions, were enriched in phenolics and exhibited stronger biological activities, while Sommer et al. [37] developed a method to separate monomeric and polymeric polyphenols from grapevine leaves, further confirming the potential of fractionation to concentrate active constituents.

2.4. Characterization of the Active Fraction from the Extract

To characterize the obtained active fraction, it was examined by spectroscopic analysis, for ROS production, and by HPLC/MS analysis.

2.4.1. Spectroscopic Analysis of the Active Fraction

The absorbance spectra of the initial crude extract and the active fraction eluted by 60%, ACN are presented in Figure 6. The spectra in the visible region contain the peak at 660 ± 2 nm and several additional local maxima. As can be seen from Figure 6, the crude extract from grape leaves and the active fraction have different absorption spectra in the visible region, where photosensitizers are expected to absorb. It was interesting to compare the spectrum of the active fraction with that of the crude extract. Figure 6a,b show the UV/Vis spectra of these species, and it can be noticed that the spectrum of the crude extract contains prevalent absorption in the UV region rather than the visible range (A250/A660 = 31), whereas the active fraction is rich in compounds absorbing in the visible region (A250/A660 = 0.9). This explains the higher photodynamic properties of the 60% ACN fraction relative to the initial extract.

2.4.2. Measurements of Singlet Oxygen Generation

The measurements of singlet oxygen quantum yields were performed in water using a singlet oxygen sensor green (SOSG). The latter exhibits high selectivity for singlet oxygen (1O2) and does not significantly react with other ROS, such as hydroxyl radicals or superoxide anions [38]. The fluorescence intensity of SOSG increases with irradiation time in the presence of 1O2. This green fluorescence emission was assigned to an endoperoxide generated by the interaction of 1O2 with the anthracene component of SOSG [39].
1O2 generation under LED lamp exposure of the extract and methylene blue (MB) was monitored by the increasing emission of SOSG at 488 nm (Figure 7a,b). The 1O2 production quantum yield was determined by Equation (1), where reaction rate constants were found as slopes on the graph of ln[Ft/F0] vs. time (Figure 7c). The calculated ΦΔ value in water for the active extract fraction was 0.55.

2.4.3. HPLC/MS Analysis of the Active Fraction

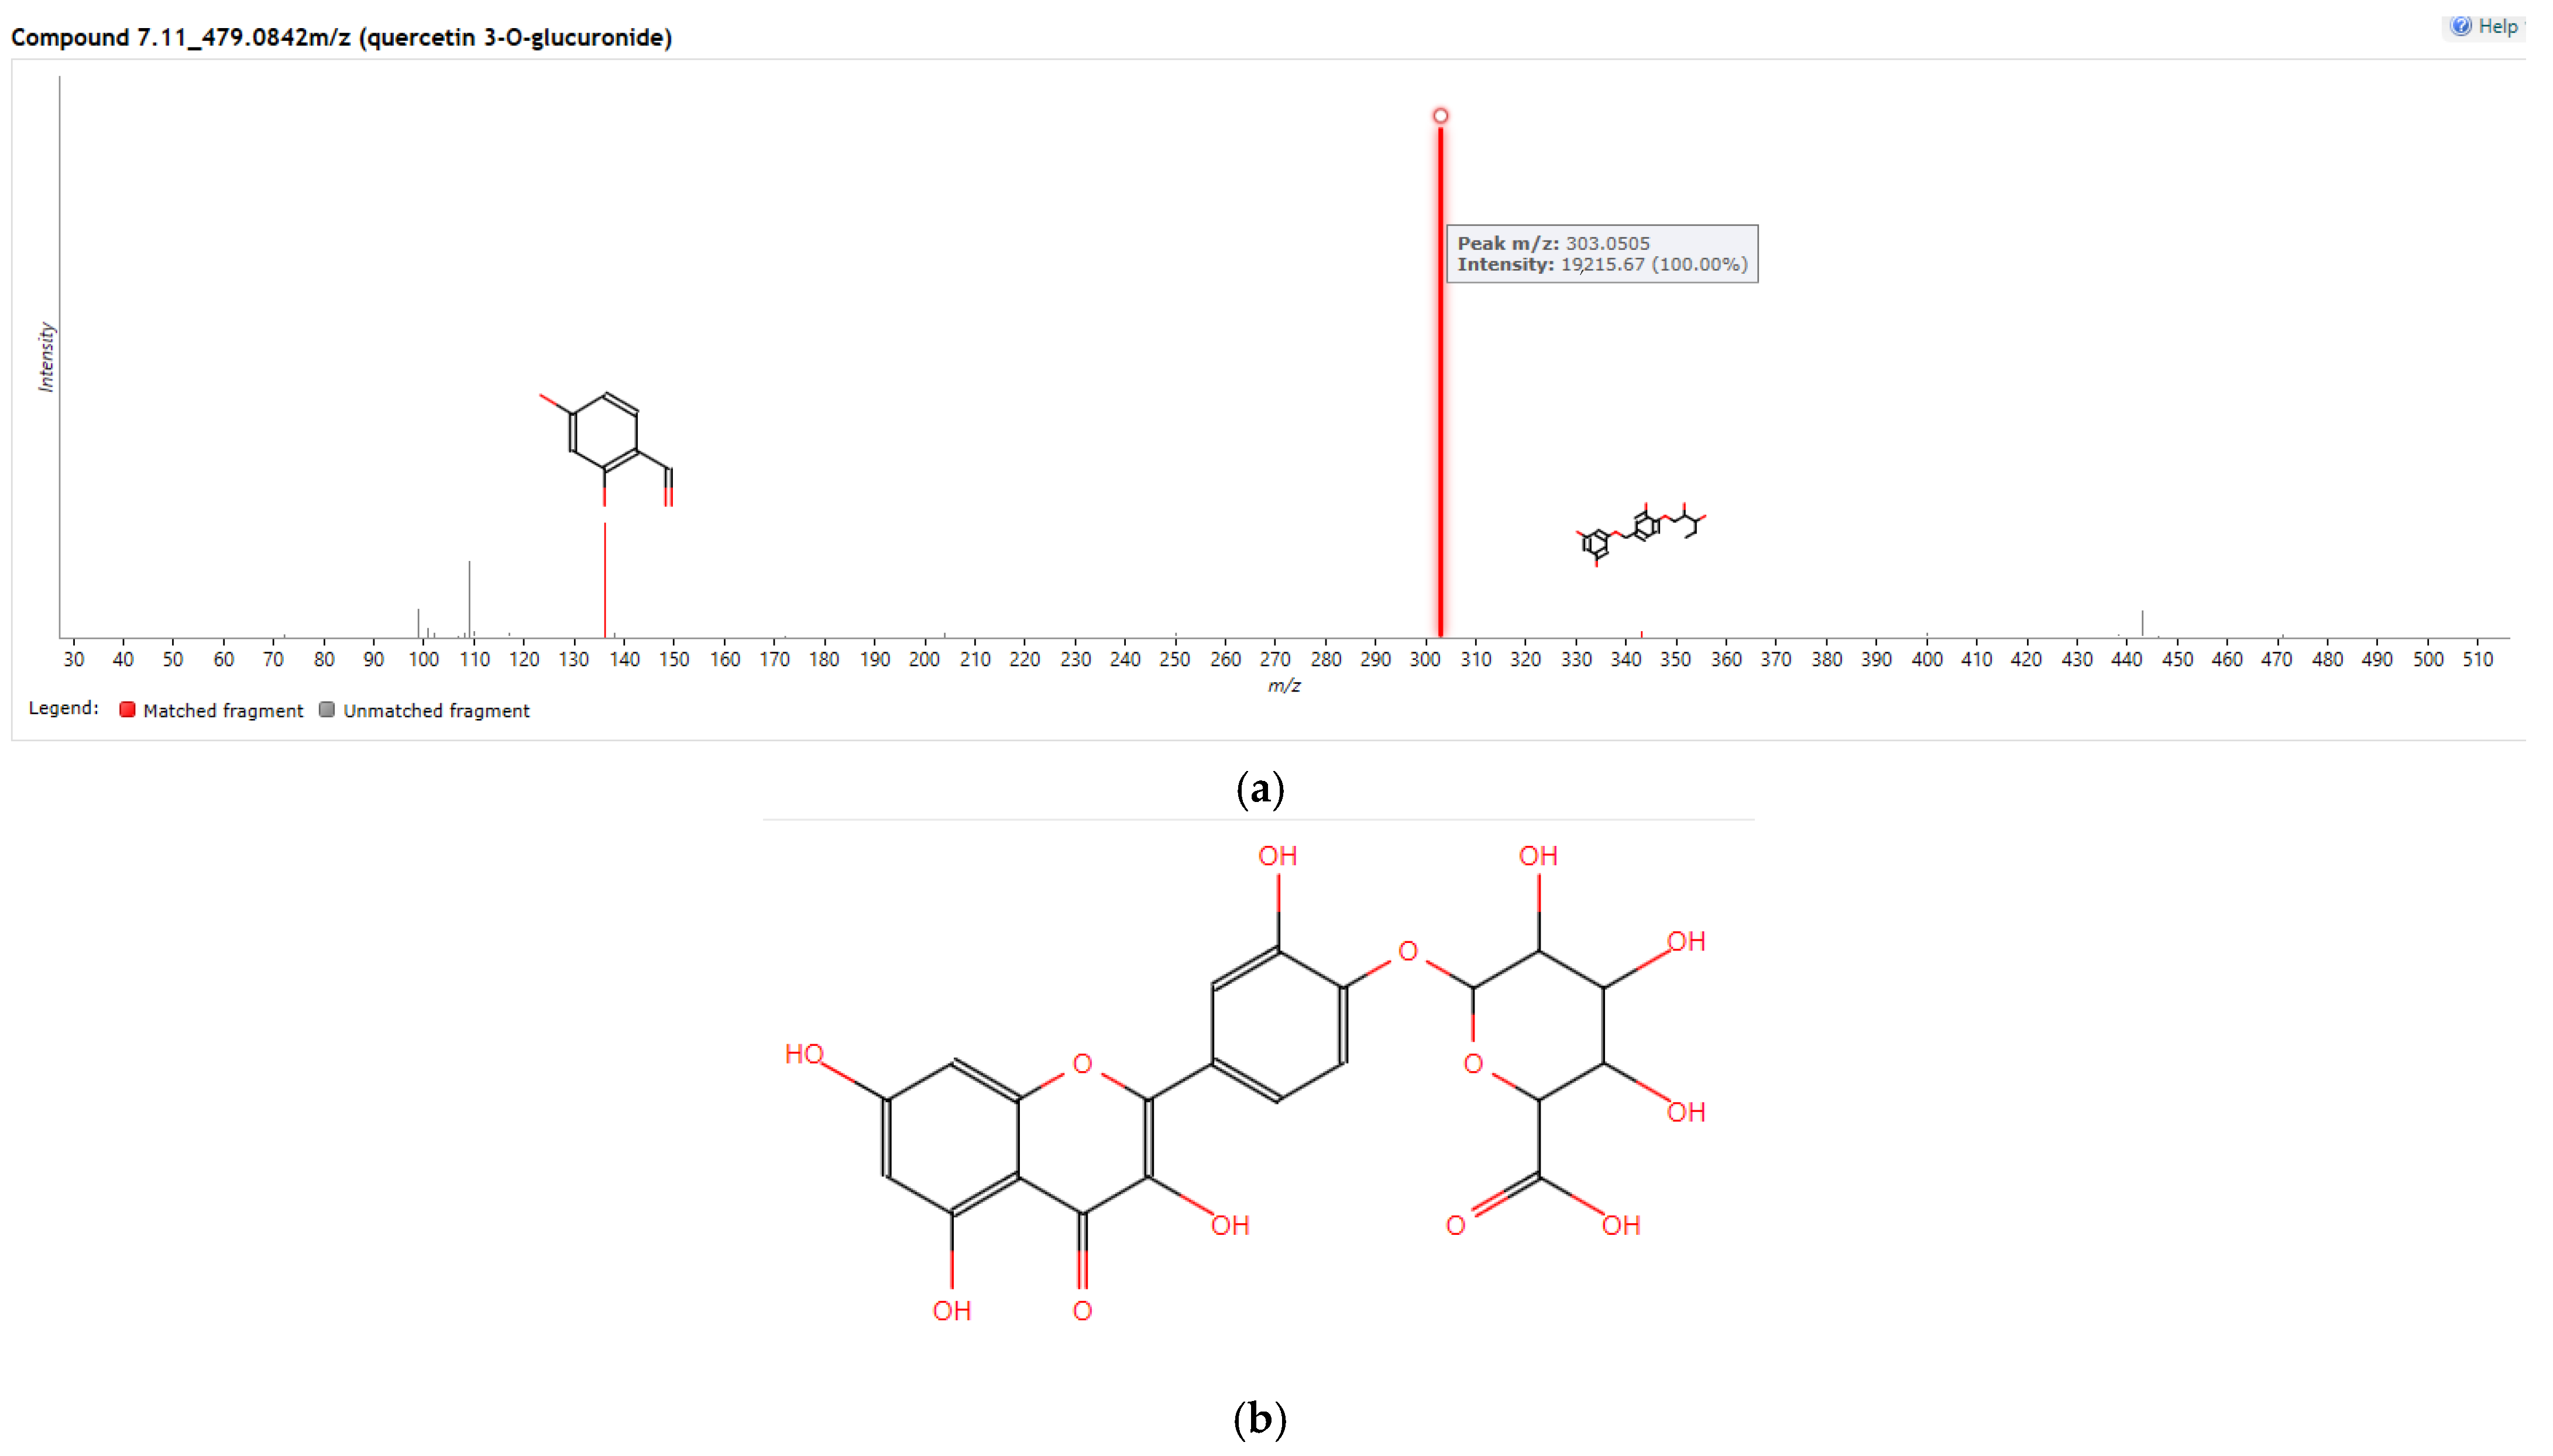
To identify the components of the extract having photodynamic antibacterial activity, 5 replicates of the active 60% ACN fraction were analyzed by HPLC/MS chromatography using HILIC (hydrophilic interaction liquid chromatography). The list of potential components was filtered according to several criteria: 1st, the molecules were filtered by abundance higher than 1000 units, choosing ca. 100 most abundant compounds; 2nd, the compounds with high variability (5-fold and higher) between the replicates of the active 60% ACN fraction were deleted since the replicates have shown approximately equal activity, 3rd, the molecules with retention time less than 1 min were deleted as too lipophilic. After these procedures, 35 compounds were left as potential candidates. The search was performed to find compounds belonging to the grape leaves’ components and those known or having potential photodynamic properties. Two components answered these criteria—quercetin 3-O-glucuronide and pheophorbide a. The first one is characterized by a very high score (54.5/60), and it was found in grape leaves (Table S1 in [40]) [40,41,42,43]. The mass spectrum of quercetin 3-O-glucuronide, obtained from the chromatogram, and its structure are shown in Figure 8.
As can be seen from Figure 8a, the registered mass spectrum matches the expected spectrum of quercetin 3-O-glucuronide. Quercetin 3-O-glucuronide is a natural polyphenol belonging to flavonols, possessing a developed system of conjugated double bonds, which is responsible for the photodynamic properties of the quercetin core [26,44]. These properties of quercetin were demonstrated by the inactivation of E. coli and Listeria monocytogenes [44], causing total death of S. aureus [45] and disruption of the microbial biofilms of S. mutans [46] and A. baumannii [47].
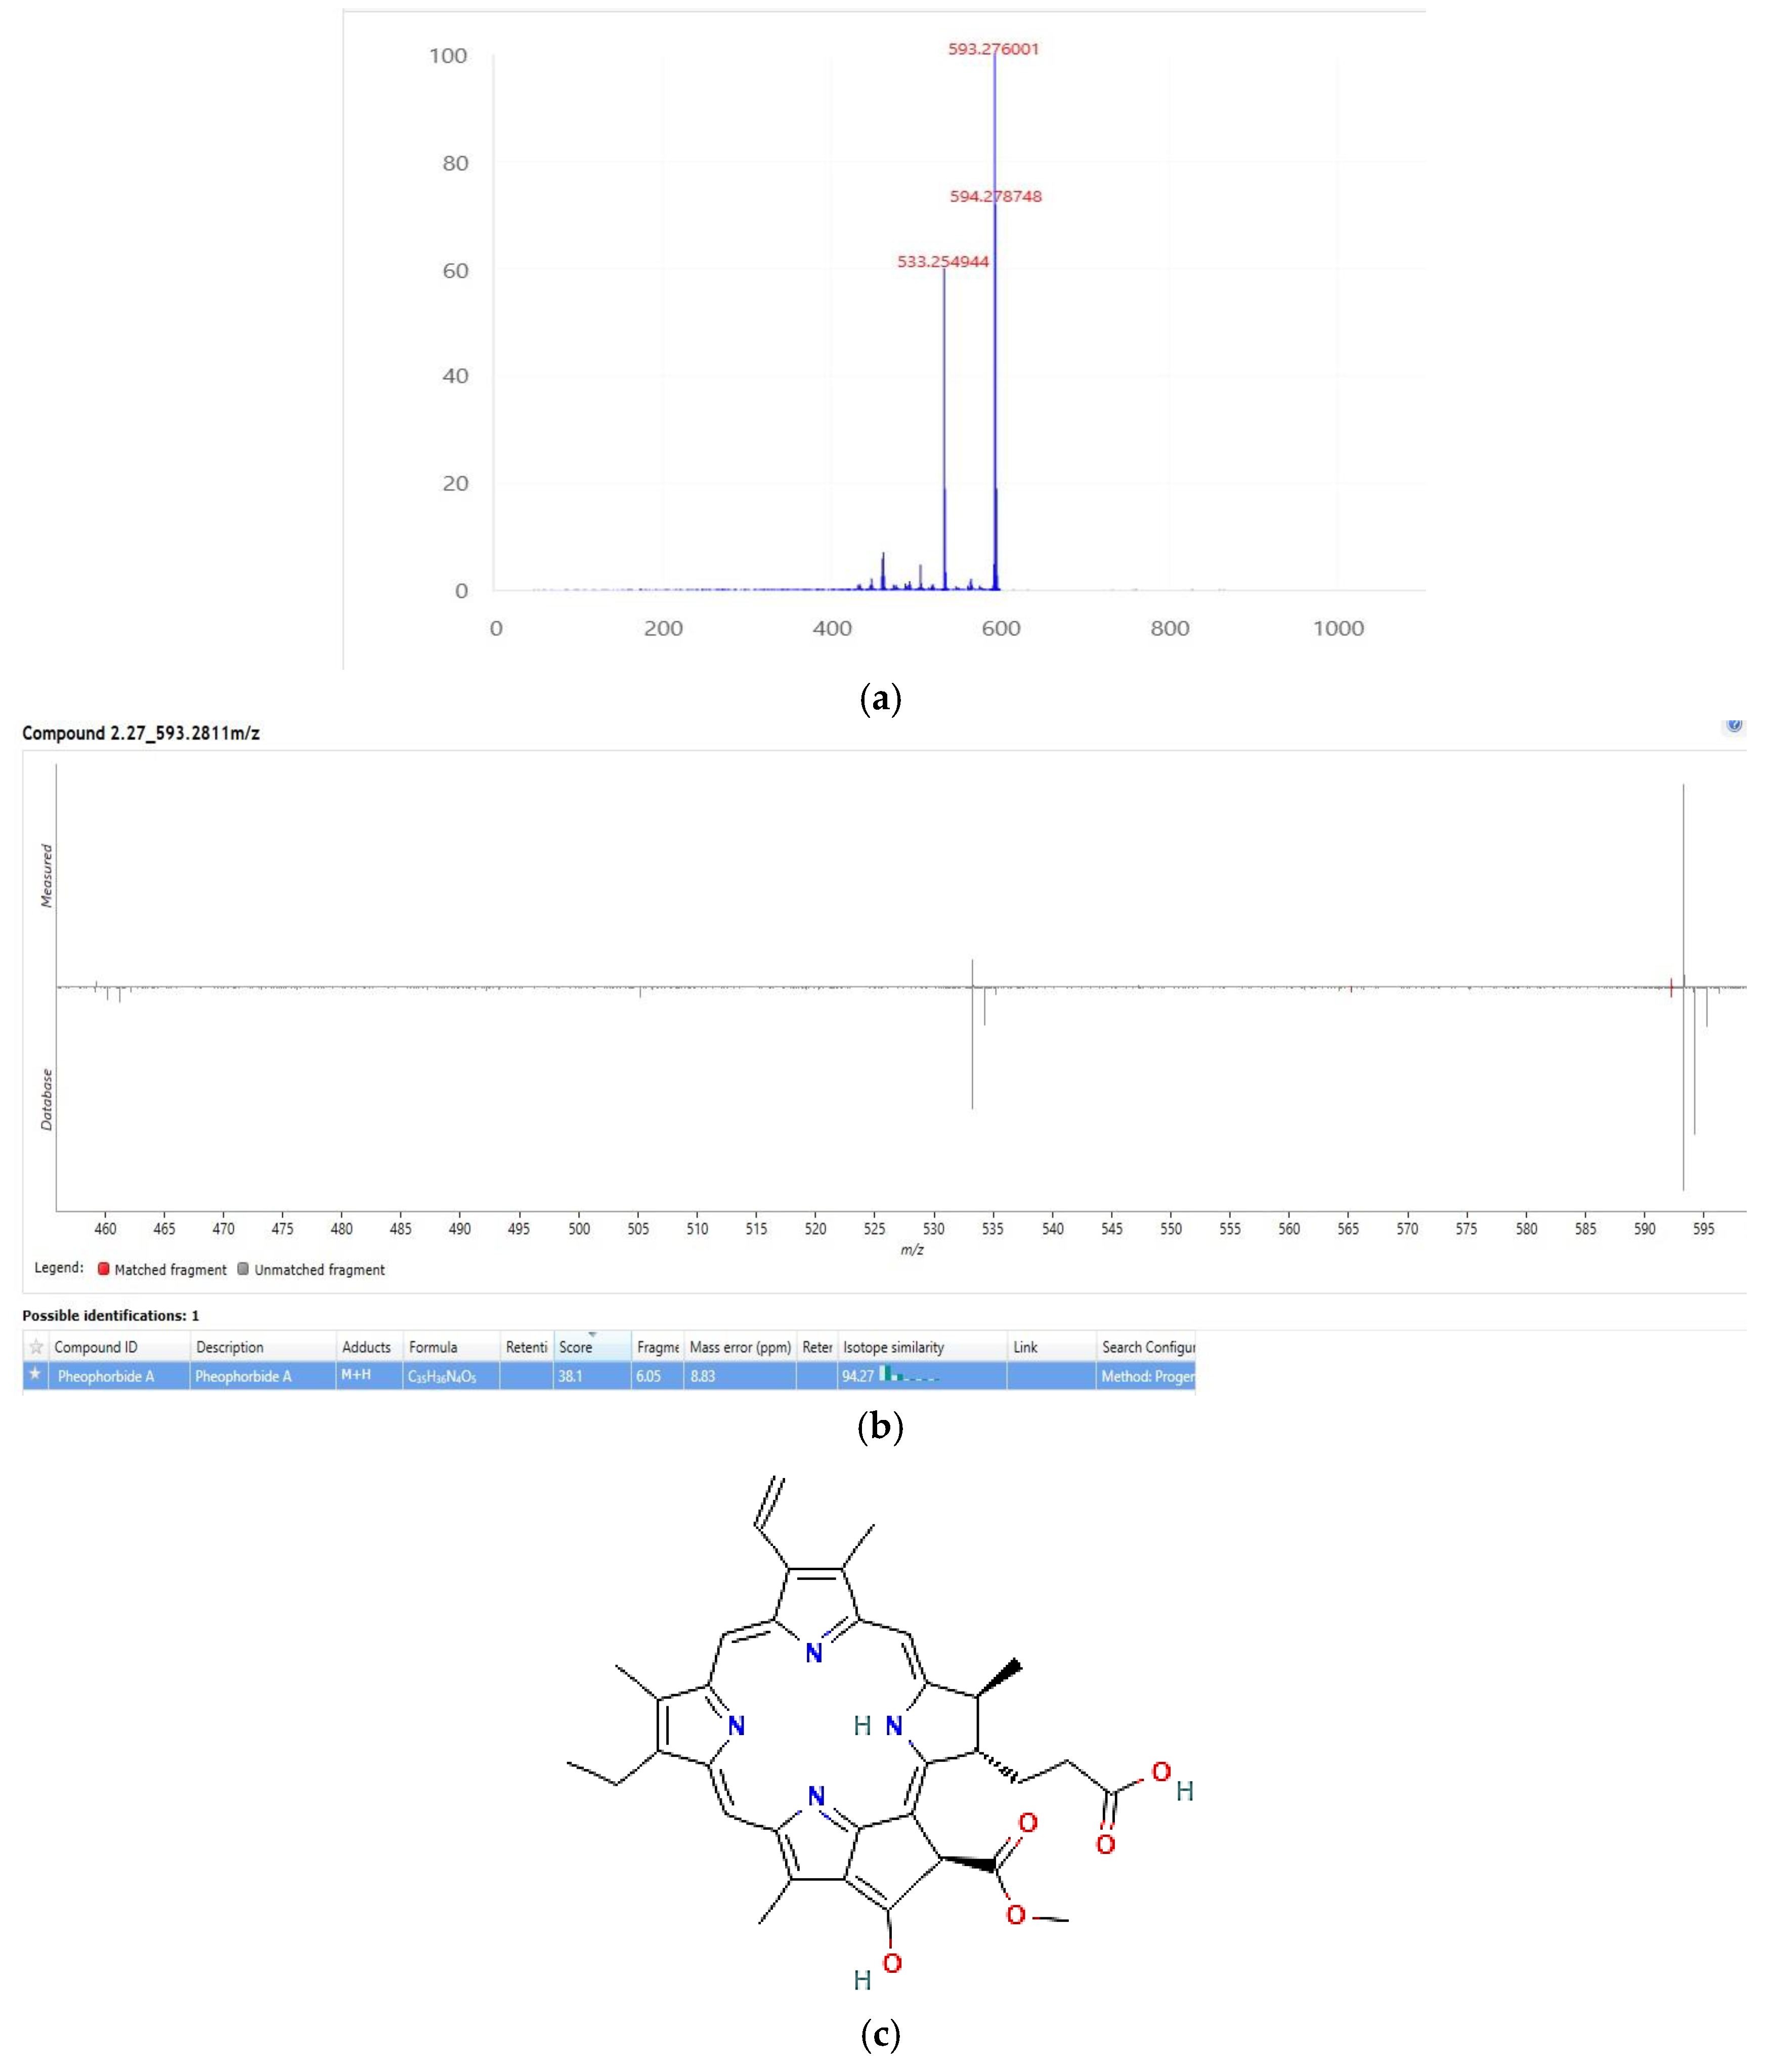
The second candidate, pheophorbide a, is a product of chlorophyll metabolic breakdown [48], and it was found in grape leaves [49]. This compound was reported to exhibit photodynamic properties [50]. The score of pheophorbide an identification is a bit lower than for quercetin 3-O-glucuronide (38.1/60); however, a perfect fragmentation MS pattern as well as UV/Vis spectrum [51] ensures that this compound is really present in the active 60% fraction. The mass spectrum and the structure of pheophorbide a are presented in Figure 9. Photodynamic activity of pheophorbide a was shown against MRSA bacteria [50] as well as against cancer cells [52,53].
The presence of two photosensitizers—quercetin 3-O-glucuronide and pheophorbide a—explains the high photodynamic antibacterial properties of the active 60% ACN fraction and the crude extract itself. Quercetin derivatives are excited at 405 nm [44] or 435 nm [26], whereas pheophorbide a is illuminated by visible light at 610–670 nm [50], 613–645 nm [53], or by a broad-spectrum halogen lamp equipped with a 515 nm cut-off filter [52]. In our study, a white LED light source having a spectrum of emission at 400–800 nm was applied [54], and for this reason, both detected photosensitizers could be excited. We suppose that the photodynamic properties of the crude extract, and especially of the active 60% ACN fraction, can be explained by the presence of the two photosensitizers, quercetin 3-O-glucuronide and pheophorbide a, which work independently or maybe synergistically. Anyway, the grape leaf extract can become a source of natural antimicrobial agents and can be applied in food disinfection under illumination with white light as a whole extract, or can be used for the treatment of bacterial infections after isolation of the active fraction having increased content of photosensitizers.

3. Materials and Methods

3.1. Extraction of Bioactive Compounds from Grape Leaves

Leaves from Hanut Orcha and Beer grape samples were carefully collected using a knife cutter in the experimental vineyard of Ariel University in March 2024, and immediately placed in clean plastic bags to minimize contamination and preserve their bioactive components. Following collection, the leaves were thoroughly washed with tap water and dried in an oven (SHEL LAB, SVAC1-2, Sheldon Manufacturing, Inc., Cornelius, OR, USA) at 60 °C for 24 h. Then the leaves were ground to approximately 0.3 mm in size using a blender (Nutri Ninja, QB3001IS 30, 220–240 V). The ground plant material was extracted using the following procedure: 1 g of dried leaves was mixed with 40 mL of an extraction mixture consisting of 300 mL methanol, 420 mL acetone, 5 mL acetic acid, and 275 mL distilled water [55]. The mixture was shaken vigorously for 15 min at room temperature, followed by centrifugation at 5000 rpm for 5 min. The supernatant was dried by solvent evaporation at 50 °C using a rotary vacuum evaporator (IKA RV 8V, Ika, Staufen, Germany), supplied with VIVO RT4 constant temperature water circulator (QTE Technologies Co, Ltd., Hanoi, Vietnam). The resulting solid solutes were weighed and dissolved in 70% ethanol to achieve a final concentration of 0.1 g/mL [56]. The extracts were filtered using Whatman 0.45 µm filter discs, 47 mm diameter (Sigma-Aldrich Israel Ltd., an affiliate of Merck KGaA, Darmstadt, Germany) and stored at 4 °C in the dark until further use.

3.2. Fractionation and Separation of Bioactive Compounds

Extract fractionation was performed using column chromatography with RP-18 cartridges. A 3 mL extract sample was applied onto the SPE cartridge C-18 (40–60 mm, 120 Å) (Yicozoo Energy Technologies Technology Co., Ltd., Xi’an, China) equilibrated with water, and eluted with 3 mL of 20%, 40%, 60%, 80%, and 100% aqueous ACN solutions, with both solvents being of HPLC grade. The fractions obtained were analyzed using a Thermo Scientific Evolution 201 spectrometer, model 840-210800 (Thermo Fisher Scientific, Waltham, MA, USA).
The fractions were dried by evaporation using a SpeedVac concentrator (CentriVap Benchtop Vacuum Concentrator, Model 7810011, Labconco Corporation, Kansas City, MO, USA) and dissolved in 70% ethanol to achieve an absorbance at 660 nm equal to that of the initial extract. The samples were stored at 4 °C for further analysis.

3.3. Bacterial Strains and Culture Preparation

The antimicrobial activity of the extracts was tested against Gram-positive Staphylococcus aureus (ATCC 25923) and Gram-negative Escherichia coli (ATCC 25922). Bacterial cultures were grown on Brain Heart Agar (BHA, Acumedia, Lansing, MI, USA) for 24 h, then transferred to Brain Heart Infusion Broth (BH, Acumedia, Lansing, MI, USA) for S. aureus and Luria–Bertani (LB) broth (Acumedia, Lansing, MI, USA) for E. coli. The cultures were incubated at 37 °C with shaking at 170 rpm until reaching an absorbance of A660 = 0.2–0.4 ± 0.02, and diluted to A660 = 0.1, corresponding to a cell concentration of 108 CFU/mL, and further diluted to 103–104 CFU/mL for experiments. The bacterial suspensions were diluted using a commercial sterile 0.9% saline solution.

3.4. Testing Photodynamic and Sonodynamic Activity of the Crude and Fractionated Grape Leaf Extracts

To evaluate the photo-dynamic and sonodynamic antimicrobial activity of the extracts against S. aureus and E. coli, the bacterial suspensions were diluted with sterile 0.9% saline to a final concentration of 103–104 CFU/mL.
For photodynamic treatment, 1 mL of bacterial suspension was dispensed into individual wells of a 48-well plate, followed by the addition of Beer and Hanut Orcha leaf extracts up to a final concentration of 5 mg/mL and 10 mg/mL. In the case of the separated fractions of extracts (Section 3.2), the concentration of the components was adjusted to that in the crude extract according to A660. The mixtures were gently agitated to ensure a homogenous distribution of the extracts with the bacterial suspension. The S. aureus samples were placed on a rotary shaker and exposed to light or kept in the dark for 0–30 min, the E. coli samples for 0–60 min, and the fractions for 0–30 min. Light exposure was performed using an 18 W white LED lamp (OSRAM, model L18W/765, cool daylight, Munich, Germany), emitting visible light in the range of 400–800 nm, under shaking at 100 rpm. The lamp, which emitted light between 400 and 800 nm, was positioned at a distance of 8 cm, resulting in a light power density of 56 mW/cm2. Light intensity was measured by an LX-102 light meter (Lutron, Taipei, Taiwan). After light exposure, 100 µL aliquots of each sample were spread onto BHA plates using a Drigalski spreader and incubated at 37 °C for 24 h. Colony-forming units (CFU) were counted using a Scan 500 colony counter (Interscience, Saint Nom-la-Bretèche, France). Parallel experiments were conducted in the presence of ethanol at the same concentration as in the samples and without the addition of any compounds under illumination and in the dark to serve as controls.
For sonodynamic treatment, experiments were performed on S. aureus and E. coli using final extract solutions at 5 mg/mL and 10 mg/mL. Samples and controls were either subjected to ultrasonication in the dark or kept in the dark without sonication. Sonication was carried out in the ultrasonic bath VUO3H (SMEG Instruments, Guastalla, Italy) operating at a frequency of 37 kHz and power 80 W, and maintaining a set temperature of 37 °C. S. aureus samples were sonicated for 0–60 min using final extract solutions of 5 mg/mL and 10 mg/mL, and E. coli was tested only with 10 mg/mL extract concentration for 0–30 min. Control groups included 1. Samples without extract but subjected to sonication, 2. Not-sonicated samples without extract addition, 3. Samples with extract but without sonication, and 4. Samples with an addition of ethanol up to the concentration as in the extracts with and without sonication. 100 µL aliquots were sampled at defined time periods, spread onto BHA plates using a Drigalski spreader, and incubated at 37 °C for 24 h. CFU counts were recorded using a Scan 500 colony counter.

3.5. Characterization of the Extracts and the Active Fraction from the Hanut Orcha Extract

3.5.1. Spectroscopic Assay

The UV/Vis spectra of the crude extracts and the active fraction were registered in 1 cm quartz cuvettes using the Thermo Scientific Evolution 201 spectrophotometer (Thermo Fisher Scientific Inc., Madison, WI, USA).

3.5.2. Generation of ROS

The quantum yield of the singlet oxygen generation (ΦΔ) of the active fraction in water was measured according to the following procedure. The 5 mM stock solution of Singlet Oxygen Sensor Green (SOSG) was prepared in methanol [57]. In a standard 1 cm quartz cuvette, 3 mL of a sample in water and 3 mL of SOSG solution were mixed to obtain a final concentration of SOSG of 5 µM in the cuvette. The solution obtained was illuminated by a white LED lamp, and the emission spectra of SOSG were recorded over time using the Edinburgh FS5 spectrofluorometer (Edinburgh Instruments Ltd., Livingston, UK). The singlet oxygen generation quantum yield, ΦΔ, of the active fraction was calculated relative to methylene blue (MB) as the reference dye (ΦΔMB = 0.52) according to Equation (1) [58,59,60].
ΦΔsample = ΦΔMB × ksample/kMB
where ksample and kMB are reaction rate constants, ΦΔsample and ΦΔMB are quantum yields of the singlet oxygen generation of a sample and MB, respectively.
For the determination of reaction rate constants, graphs of ln[Ft/F0] vs. time were plotted, where Ft and F0 are fluorescence intensities at time t and at the initial time, respectively. Each experiment on the ΦΔ measurements was carried out in triplicate, and the average ΦΔ was calculated. The error in the reproducibility of the determination of ΦΔ did not exceed 5%.

3.5.3. HPLC/MS Assay

The active fraction of grape leaf extract, derived from five separate extractions, was subjected to desiccation using a SpeedVac apparatus and subsequently preserved at a temperature of −80 °C. For analytical purposes, the dried extract samples were reconstituted in 100 μL of acetonitrile (ACN) and subjected to centrifugation at 13,000 rpm at a temperature of 4 °C for a duration of 10 min.
Chromatographic separation was executed utilizing ultra-performance liquid chromatography coupled with electrospray ionization tandem mass spectrometry (UPLC-ESI-MS/MS), employing the Acquity UPLC I system (Waters, Milford, MA, USA) and a SeQuant ZIC-HILIC column (2.1 × 150 mm, internal diameter, 3.5 μm) (Merck, Rehovot, Israel). The mobile phase A was constituted of UPLC-grade water augmented with 0.1% formic acid, while mobile phase B comprised acetonitrile (ACN) with 0.1% formic acid. The column temperature was consistently maintained at 30 °C, with the mobile phase flow rate established at 0.2 mL·min−1. Initially, mobile phase B was maintained at 100% for 1 min, subsequently decreased to 40% over 10 min, and then restored to 100% at the 11 min mark. Ultimately, the column was equilibrated at 100% B for a period of 20 min.
The mass spectrometer utilized was the Xevo G2XS QTof (Waters Corp., Milford, MA, USA), which was integrated with an electrospray ionization (ESI) source. The parameters governing the mass spectrometry were delineated as follows: the source and desolvation temperatures were sustained at 120 °C and 450 °C, respectively. The capillary voltage was calibrated to 3.0 kV for positive ionization mode, while the cone voltage was fixed at 40 V. Nitrogen was employed as the desolvation and cone gas at flow rates of 800 L·h−1 and 30 L·h−1, respectively. The mass spectrometer was utilized in a comprehensive scan HDMSE resolution mode across a mass range of 50–2000 Da. A collision energy ramp ranging from 20 to 80 eV was implemented for the high-energy scan functionality, whereas a low-energy scan function utilized a collision energy of 4 eV.
Data processing was conducted using Progenesis QI v3.1 software (Nonlinear). The identification of lipids was achieved through the comparison of masses and fragmentation patterns against established databases such as the Natural Products Atlas (NPA), the Coconut Database for Natural Products, the Human Metabolome Database (HMDB), ChemSpider, and LipidBlast.

3.6. Statistical Analysis

All experiments were performed in duplicates and repeated at least twice. Data were analyzed using appropriate statistical methods, including ANOVA and post hoc tests, to determine significant differences between treatment groups. Results were expressed as mean ± standard deviation (STDEV), and p-values < 0.05 were considered statistically significant.

4. Conclusions

This study demonstrated that Beer and Hanut Orcha grape leaf extracts possess strong antibacterial activity, which can be significantly enhanced by photodynamic and sonodynamic activation. Both S. aureus and E. coli were completely eradicated under illumination or ultrasound, confirming the potential of photo- and sono-activation as effective strategies for overcoming bacterial contaminations. Fractionation of the extract allowed for the concentration and identification of two bioactive compounds, quercetin 3-O-glucuronide and pheophorbide a, which are responsible for the observed activity. However, it is important to note that crude extracts themselves represent highly valuable antimicrobial agents: they not only preserve biologically active substances for longer periods compared to purified compounds but also reduce costs associated with separation, making them more practical for initial applications.
From an application perspective, grape leaf extracts could be developed into formulations for medical use, such as topical antibacterial treatments, wound dressings, or oral care products, as well as for non-medical uses, including food disinfection and preservation. While light penetration limits the application of photodynamic treatment in opaque food matrices, promising opportunities remain for surface disinfection, transparent liquids, and packaging environments, as already demonstrated in food-related PDT studies. Nevertheless, further studies are needed to evaluate their formulation stability and safety. The present findings strongly support the scientific hypothesis that photo- and sonoactivation of natural plant extracts provides a powerful, sustainable, and cost-effective approach to combating pathogenic bacteria while enabling innovative applications of edible plant by-products.

Author Contributions

Conceptualization, F.N. and M.N.; methodology, F.N., I.H., M.A., N.Z. and O.S.; validation, T.H.A., N.M.K. and O.S.; investigation, T.H.A., I.H., M.A., N.Z. and O.S.; resources, M.N.; data curation, T.H.A., N.M.K. and I.H.; writing—original draft preparation, T.H.A.; writing—review and editing, F.N., M.N. and N.M.K.; supervision, M.N.; project administration, F.N. All authors have read and agreed to the published version of the manuscript.

Funding

This research received no external funding.

Institutional Review Board Statement

Not applicable.

Informed Consent Statement

Not applicable.

Data Availability Statement

Data are available in this publication.

Acknowledgments

We acknowledge the Research Authority of Ariel University, Ariel, Israel, for supporting this research. The authors thank E. Drori and S. Shecori (Ariel University, Ariel, Israel) for their assistance in experiments.

Conflicts of Interest

The authors declare no conflicts of interest.

Abbreviations

The following abbreviations are used in this manuscript:
ROSReactive oxygen species
HPLCHigh-performance liquid chromatography
MSMass spectrum
ACNAcetonitrile
SOSGSinglet Oxygen Sensor Green
MBMethylene blue

References

  1. Tacconelli, E.; Carrara, E.; Savoldi, A.; Harbarth, S.; Mendelson, M.; Monnet, D.L.; Pulcini, C.; Kahlmeter, G.; Kluytmans, J.; Carmeli, Y.; et al. Discovery, Research, and Development of New Antibiotics: The WHO Priority List of Antibiotic-Resistant Bacteria and Tuberculosis. Lancet Infect. Dis. 2018, 18, 318–327. [Google Scholar] [CrossRef] [PubMed]
  2. Ventola, C.L. The Antibiotic Resistance Crisis Part 1: Causes and Threats. Pharm. Ther. 2015, 40, 277–283. [Google Scholar]
  3. O’Kennedy, N.; Raederstorff, D.; Duttaroy, A.K. Fruitflow®: The First European Food Safety Authority-Approved Natural Cardio-Protective Functional Ingredient. Eur. J. Nutr. 2017, 56, 461–482. [Google Scholar] [CrossRef] [PubMed]
  4. Yadav, A.; Kumar, A.; Das, M.; Tripathi, A. Sodium Benzoate, a Food Preservative, Affects the Functional and Activation Status of Splenocytes at Non-Cytotoxic Dose. Food Chem. Toxicol. 2016, 88, 40–47. [Google Scholar] [CrossRef]
  5. Ren, L.; Meng, M.; Wang, P.; Xu, Z.; Eremin, S.A.; Zhao, J.; Yin, Y.; Xi, R. Determination of Sodium Benzoate in Food Products by Fluorescence Polarization Immunoassay. Talanta 2014, 121, 136–143. [Google Scholar] [CrossRef]
  6. Wang, Y.; Liu, X.J.; Chen, J.B.; Cao, J.P.; Li, X.; De Sun, C. Citrus Flavonoids and Their Antioxidant Evaluation. Crit. Rev. Food Sci. Nutr. 2022, 62, 3833–3854. [Google Scholar] [CrossRef]
  7. Cowan, M.M. Plant Products as Antimicrobial Agents. Clin. Microbiol. Rev. 1999, 12, 564–582. [Google Scholar] [CrossRef]
  8. Aiyegoro, O.A.; Okoh, A.I. Preliminary Phytochemical Screening and In Vitro Antioxidant Activities of the Aqueous Extract of Helichrysum longifolium DC. BMC Complement. Altern. Med. 2010, 10, 21. [Google Scholar] [CrossRef]
  9. Cushnie, T.P.T.; Lamb, A.J. Recent Advances in Understanding the Antibacterial Properties of Flavonoids. Int. J. Antimicrob. Agents 2011, 38, 99–107. [Google Scholar] [CrossRef] [PubMed]
  10. Askari, G.A.; Kahouadji, A.; Khedid, K.; Mousaddak, M.; Ouaffak, L.; Charof, R.; Mennane, Z. Evaluation of Antimicrobial Activity of Aqueous and Ethanolic Extracts of Leaves of Vitis vinifera Collected from Different Regions in Morocco. Am.-Eurasian J. Agric. Environ. Sci. 2012, 12, 85–90. [Google Scholar]
  11. Nermin, S.; Abdelhamid, N.; Hassan, H.; Mattar, Z.; Abou-Taleb, K.; Ramadan, E. Screening of Some Egyptian Plant Extracts for Biological Activity against Some Pathogenic Bacteria. Arab. Univ. J. Agric. Sci. 2017, 25, 377–386. [Google Scholar] [CrossRef]
  12. Songca, S.P.; Adjei, Y. Applications of Antimicrobial Photodynamic Therapy against Bacterial Biofilms. Int. J. Mol. Sci. 2022, 23, 3209. [Google Scholar] [CrossRef]
  13. Zhou, W.; Jiang, X.; Zhen, X. Development of Organic Photosensitizers for Antimicrobial Photodynamic Therapy. Biomater. Sci. 2023, 11, 5108–5128. [Google Scholar] [CrossRef] [PubMed]
  14. Mikulich, A.V.; Plavskii, V.Y.; Tretyakova, A.I.; Nahorny, R.K.; Sobchuk, A.N.; Dudchik, N.V.; Emeliyanova, O.A.; Zhabrouskaya, A.I.; Plavskaya, L.G.; Ananich, T.S.; et al. Potential of Using Medicinal Plant Extracts as Photosensitizers for Antimicrobial Photodynamic Therapy. Photochem. Photobiol. 2024, 100, 1833–1847. [Google Scholar] [CrossRef]
  15. Bonifácio, D.; Martins, C.; David, B.; Lemos, C.; Neves, M.G.P.M.S.; Almeida, A.; Pinto, D.C.G.A.; Faustino, M.A.F.; Cunha, Â. Photodynamic Inactivation of Listeria innocua Biofilms with Food-Grade Photosensitizers: A Curcumin-Rich Extract of Curcuma longa vs. Commercial Curcumin. J. Appl. Microbiol. 2018, 125, 282–294. [Google Scholar] [CrossRef]
  16. Marqués-Calvo, M.S.; Codony, F.; Agustí, G.; Lahera, C. Visible Light Enhances the Antimicrobial Effect of Some Essential Oils. Photodiagn. Photodyn. Ther. 2017, 17, 180–184. [Google Scholar] [CrossRef] [PubMed]
  17. Jeong, J.Y.; Hwang, Y.J. Natural Phytochemical and Visible Light at Different Wavelengths Show Synergistic Antibacterial Activity against Staphylococcus aureus. Pharmaceutics 2024, 16, 612. [Google Scholar] [CrossRef] [PubMed]
  18. Taylor, R.S.; Edel, F.; Manandhar, N.P.; Towers, G.H. Antimicrobial Activities of Southern Nepalese Medicinal Plants. J. Ethnopharmacol. 1996, 50, 97–102. [Google Scholar] [CrossRef] [PubMed]
  19. Wang, R.; Liu, Q.; Gao, A.; Tang, N.; Zhang, Q.; Zhang, A.; Cui, D. Recent Developments of Sonodynamic Therapy in Antibacterial Application. Nanoscale 2022, 14, 12999–13017. [Google Scholar] [CrossRef]
  20. Xing, X.; Zhao, S.; Xu, T.; Huang, L.; Zhang, Y.; Lan, M.; Lin, C.; Zheng, X.; Wang, P. Advances and Perspectives in Organic Sonosensitizers for Sonodynamic Therapy. Coord. Chem. Rev. 2021, 445, 214087. [Google Scholar] [CrossRef]
  21. Wang, X.; Ip, M.; Leung, A.W.; Yang, Z.; Wang, P.; Zhang, B.; Ip, S.; Xu, C. Sonodynamic Action of Curcumin on Foodborne Bacteria Bacillus cereus and Escherichia coli. Ultrasonics 2015, 62, 75–79. [Google Scholar] [CrossRef] [PubMed]
  22. Pourhajibagher, M.; Rahimi Esboei, B.; Hodjat, M.; Bahador, A. Sonodynamic Excitation of Nanomicelle Curcumin for Eradication of Streptococcus mutans under Sonodynamic Antimicrobial Chemotherapy: Enhanced Anti-Caries Activity of Nanomicelle Curcumin. Photodiagn. Photodyn. Ther. 2020, 30, 101780. [Google Scholar] [CrossRef]
  23. Pourhajibagher, M.; Bahrami, R.; Bazarjani, F.; Bahador, A. Anti-Multispecies Microbial Biofilms and Anti-Inflammatory Effects of Antimicrobial Photo-Sonodynamic Therapy Based on Acrylic Resin Containing Nano-Resveratrol. Photodiagn. Photodyn. Ther. 2023, 43, 103669. [Google Scholar] [CrossRef]
  24. Orhan, D.D.; Orhan, N.; Özçelik, B.; Ergun, F. Biological Activities of Vitis vinifera L. Leaves. Turk. J. Biol. 2009, 33, 341–348. [Google Scholar] [CrossRef]
  25. Güvensen, N.C.; Keskin, D.; Zorlu, Z.; Uğur, A. In-Vitro Antimicrobial Activities of Different Extracts of Grapevine Leaves (Vitis vinifera L.) from West Anatolia against Some Pathogenic Microorganisms. J. Pure Appl. Microbiol. 2012, 6, 1303–1308. [Google Scholar]
  26. Wang, X.; Wang, L.; Fekrazad, R.; Zhang, L.; Jiang, X.; He, G.; Wen, X. Polyphenolic Natural Products as Photosensitizers for Antimicrobial Photodynamic Therapy: Recent Advances and Future Prospects. Front. Immunol. 2023, 14, 1275859. [Google Scholar] [CrossRef]
  27. Rapacka-Zdończyk, A.; Woźniak, A.; Michalska, K.; Pierański, M.; Ogonowska, P.; Grinholc, M.; Nakonieczna, J. Factors Determining the Susceptibility of Bacteria to Antibacterial Photodynamic Inactivation. Front. Med. 2021, 8, 642609. [Google Scholar] [CrossRef] [PubMed]
  28. He, Q.; Liu, D.; Ashokkumar, M.; Ye, X.; Jin, T.Z.; Guo, M. Antibacterial Mechanism of Ultrasound against Escherichia coli: Alterations in Membrane Microstructures and Properties. Ultrason. Sonochem. 2021, 73, 105509. [Google Scholar] [CrossRef]
  29. Zhang, H.; Wang, S.; Goon, K.; Gilbert, A.; Nguyen Huu, C.; Walsh, M.; Nitin, N.; Wrenn, S.; Tikekar, R.V. Inactivation of Foodborne Pathogens Based on Synergistic Effects of Ultrasound and Natural Compounds during Fresh Produce Washing. Ultrason. Sonochem. 2020, 64, 104983. [Google Scholar] [CrossRef]
  30. Fan, L.; Muhammad, A.I.; Ismail, B.B.; Liu, D. Sonodynamic Antimicrobial Chemotherapy: An Emerging Alternative Strategy for Microbial Inactivation. Ultrason. Sonochem. 2021, 75, 105591. [Google Scholar] [CrossRef] [PubMed]
  31. Kuete, V.; Nana, F.; Ngameni, B.; Mbaveng, A.T.; Keumedjio, F.; Ngadjui, B.T. Antimicrobial Activity of the Crude Extract, Fractions and Compounds from Stem Bark of Ficus ovata (Moraceae). J. Ethnopharmacol. 2009, 124, 556–561. [Google Scholar] [CrossRef]
  32. Etame, R.E.; Mouokeu, R.S.; Pouaha, C.L.C.; Kenfack, I.V.; Tchientcheu, R.; Assam, J.P.A.; Poundeu, F.S.M.; Tiabou, A.T.; Etoa, F.X.; Kuiate, J.R.; et al. Effect of Fractioning on Antibacterial Activity of Enantia chlorantha Oliver (Annonaceae) Methanol Extract and Mode of Action. Evid. Based Complement. Altern. Med. 2018, 2018, 4831593. [Google Scholar] [CrossRef]
  33. Nwodo, U.U.; Obiiyeke, G.E.; Chigor, V.N.; Okoh, A.I. Assessment of Tamarindus indica Extracts for Antibacterial Activity. Int. J. Mol. Sci. 2011, 12, 6385–6396. [Google Scholar] [CrossRef]
  34. Nwodo, U.U.; Ngene, A.A.; Iroegbu, C.U.; Gc, O. Effects of Fractionation on Antibacterial Activity of Crude Extracts of Tamarindus indica. Afr. J. Biotechnol. 2010, 9, 7108–7113. [Google Scholar] [CrossRef]
  35. Sidjui, L.S.; Toghueo, R.M.K.; Menkem Zeu, E.; Mbouna, C.D.J.; Leddet, V.M.; Herbette, G.; Fekam, F.B.; Ollivier, E.; Folefoc, G.N. Antibacterial Activity of the Crude Extracts, Fractions and Compounds from the Stem Barks of Jacaranda mimosifolia and Kigelia africana (Bignoniaceae). Pharmacologia 2016, 7, 22–31. [Google Scholar] [CrossRef]
  36. Orhan, N.; Aslan, M.; Orhan, D.D.; Ergun, F.; Yeşilada, E. In-Vivo Assessment of Antidiabetic and Antioxidant Activities of Grapevine Leaves (Vitis vinifera) in Diabetic Rats. J. Ethnopharmacol. 2006, 108, 280–286. [Google Scholar] [CrossRef] [PubMed]
  37. Sommer, S.; Salie, M.; Garcia, E.; Reyes, A.; Ebersole, S.C.; Naegele, R.P.; Van Zyl, S. A New Method for Fractionation and Characterization of Polyphenols and Tannins from Grapevine Leaf Tissue. Plants 2023, 12, 1706. [Google Scholar] [CrossRef]
  38. Lin, H.; Shen, Y.; Chen, D.; Lin, L.; Wilson, B.C.; Li, B.; Xie, S. Feasibility Study on Quantitative Measurements of Singlet Oxygen Generation Using Singlet Oxygen Sensor Green. J. Fluoresc. 2013, 23, 41–47. [Google Scholar] [CrossRef] [PubMed]
  39. Ragàs, X.; Jiménez-Banzo, A.; Sánchez-García, D.; Batllori, X.; Nonell, S. Singlet Oxygen Photosensitisation by the Fluorescent Probe Singlet Oxygen Sensor Green®. Chem. Commun. 2009, 2009, 2920–2922. [Google Scholar] [CrossRef]
  40. Shecori, S.; Kher, M.M.; Tyagi, K.; Lerno, L.; Netzer, Y.; Lichter, A.; Ebeler, S.E.; Drori, E. A Field Collection of Indigenous Grapevines as a Valuable Repository for Applied Research. Plants 2022, 11, 2563. [Google Scholar] [CrossRef]
  41. Singh, J.; Rasane, P.; Kaur, R.; Kaur, H.; Garg, R.; Kaur, S.; Ercisli, S.; Choudhary, R.; Skrovankova, S.; Mlcek, J. Valorization of Grape (Vitis vinifera) Leaves for Bioactive Compounds: Novel Green Extraction Technologies and Food Pharma Applications. Front. Chem. 2023, 11, 1290619. [Google Scholar] [CrossRef] [PubMed]
  42. Chemical Book. Available online: https://www.chemicalbook.com/ChemicalProductProperty_EN_CB51484947.htm (accessed on 10 August 2025).
  43. Cioffi, E.; Comune, L.; Piccolella, S.; Buono, M.; Pacifico, S. Quercetin 3-O-glucuronide from Aglianico Vine Leaves: A Selective Sustainable Recovery and Accumulation Monitoring. Foods 2023, 12, 2646. [Google Scholar] [CrossRef] [PubMed]
  44. Lee, I.-H.; Kim, S.-H.; Kang, D.-H. Quercetin-Mediated Antimicrobial Photodynamic Treatment Using Blue Light on Escherichia coli O157:H7 and Listeria monocytogenes. Curr. Res. Food Sci. 2023, 6, 100428. [Google Scholar] [CrossRef]
  45. Condat, M.; Babinot, J.; Tomane, S.; Malval, J.P.; Kang, I.K.; Spillebout, F.; Mazeran, P.-E.; Lalevée, J.; Andalloussi, S.A.; Versace, D.-L. Development of Photoactivable Glycerol-Based Coatings Containing Quercetin for Antibacterial Applications. RSC Adv. 2016, 6, 18235–18245. [Google Scholar] [CrossRef]
  46. Pourhajibagher, M.; Alaeddini, M.; Etemad-Moghadam, S.; Rahimi Esboei, B.; Bahrami, R.; Miri Mousavi, R.S.; Bahador, A. Quorum Quenching of Streptococcus mutans via the Nano-Quercetin-Based Antimicrobial Photodynamic Therapy as a Potential Target for Cariogenic Biofilm. BMC Microbiol. 2022, 22, 125. [Google Scholar] [CrossRef]
  47. Pourhajibagher, M.; Bazarjani, F.; Bahador, A. In Silico and In Vitro Insights into the Prediction and Analysis of Natural Photosensitive Compounds Targeting Acinetobacter baumannii Biofilm-Associated Protein. Photodiagn. Photodyn. Ther. 2022, 40, 103134. [Google Scholar] [CrossRef]
  48. Paul, S.; Pallavi, A.; Gandasi, N.R. Exploring the Potential of Pheophorbide A, a Chlorophyll-Derived Compound, in Modulating GLUT for Maintaining Glucose Homeostasis. Front. Endocrinol. 2024, 15, 1330058. [Google Scholar] [CrossRef]
  49. Anić, M.; Kontić, J.K.; Rendulić, N.; Čarija, M.; Osrečak, M.; Karoglan, M.; Andabaka, Ž. Evolution of Leaf Chlorophylls, Carotenoids and Phenolic Compounds during Vegetation of Some Croatian Indigenous Red and White Grape Cultivars. Plants 2024, 13, 971. [Google Scholar] [CrossRef]
  50. Chan, B.C.L.; Dharmaratne, P.; Wang, B.; Lau, K.M.; Lee, C.C.; Cheung, D.W.S.; Chan, J.Y.W.; Yue, G.G.L.; Lau, C.B.S.; Wong, C.K.; et al. Hypericin- and Pheophorbide A-Mediated Photodynamic Therapy Fighting MRSA Wound Infections: A Translational Study from In Vitro to In Vivo. Pharmaceutics 2021, 13, 1399. [Google Scholar] [CrossRef]
  51. Pheophorbide α. Available online: https://epic.awi.de/id/eprint/28854/1/Jef1997aj.pdf (accessed on 10 August 2025).
  52. Wang, K.-K.; Li, J.; Kim, B.-J.; Lee, J.-H.; Shin, H.-W.; Ko, S.-H.; Lee, W.-Y.; Lee, C.-H.; Jung, S.H.; Kim, Y.-R. Photophysical Properties of Pheophorbide-A Derivatives and Their Photodynamic Therapeutic Effects on a Tumor Cell Line In Vitro. Int. J. Photoenergy 2014, 793723. [Google Scholar] [CrossRef]
  53. Yoon, H.-E.; Oh, S.-H.; Kim, S.-A.; Yoon, J.-H.; Ahn, S.-G. Pheophorbide A-Mediated Photodynamic Therapy Induces Autophagy and Apoptosis via the Activation of MAPKs in Human Skin Cancer Cells. Oncol. Rep. 2014, 31, 137–144. [Google Scholar] [CrossRef] [PubMed]
  54. Atrash, M.; Hovor, I.; Gurianov, Y.; Barel, M.; Semenova, O.; Brider, T.; Nisnevitch, M.; Nakonechny, F. Antibacterial Properties of Rose Bengal Conjugated to Hyaluronic Acid. Int. J. Mol. Sci. 2024, 25, 3330. [Google Scholar] [CrossRef]
  55. Syed, H.K.; Liew, K.B.; Loh, G.O.K.; Peh, K.K. Stability Indicating HPLC-UV Method for Detection of Curcumin in Curcuma longa Extract and Emulsion Formulation. Food Chem. 2015, 170, 321–326. [Google Scholar] [CrossRef]
  56. Rodríguez-Cabo, T.; Rodríguez, I.; Ramil, M.; Cela, R. Comprehensive Evaluation of the Photo-Transformation Routes of Trans-Resveratrol. J. Chromatogr. A 2015, 1410, 129–139. [Google Scholar] [CrossRef] [PubMed]
  57. Singlet Oxygen Sensor Green. Available online: https://www.lumiprobe.com/k/singlet-oxygen-sensor-green (accessed on 13 February 2025).
  58. Usui, Y. Determination of the Quantum Yield of Singlet Oxygen Formation by Photosensitization. Chem. Lett. 1973, 2, 743–744. [Google Scholar] [CrossRef]
  59. Hao, Y.; Liu, B.M.; Bennett, T.F.; Monsour, C.G.; Selke, M.; Liu, Y. Determination of Singlet Oxygen Quantum Yield of a Porphyrinic Metal-Organic Framework. J. Phys. Chem. C 2021, 125, 7392–7400. [Google Scholar] [CrossRef]
  60. Cantelli, A.; Piro, F.; Pecchini, P.; Di Giosia, M.; Danielli, A.; Calvaresi, M. Concanavalin A–Rose Bengal Bioconjugate for Targeted Gram-Negative Antimicrobial Photodynamic Therapy. J. Photochem. Photobiol. B 2020, 206, 111852. [Google Scholar] [CrossRef]
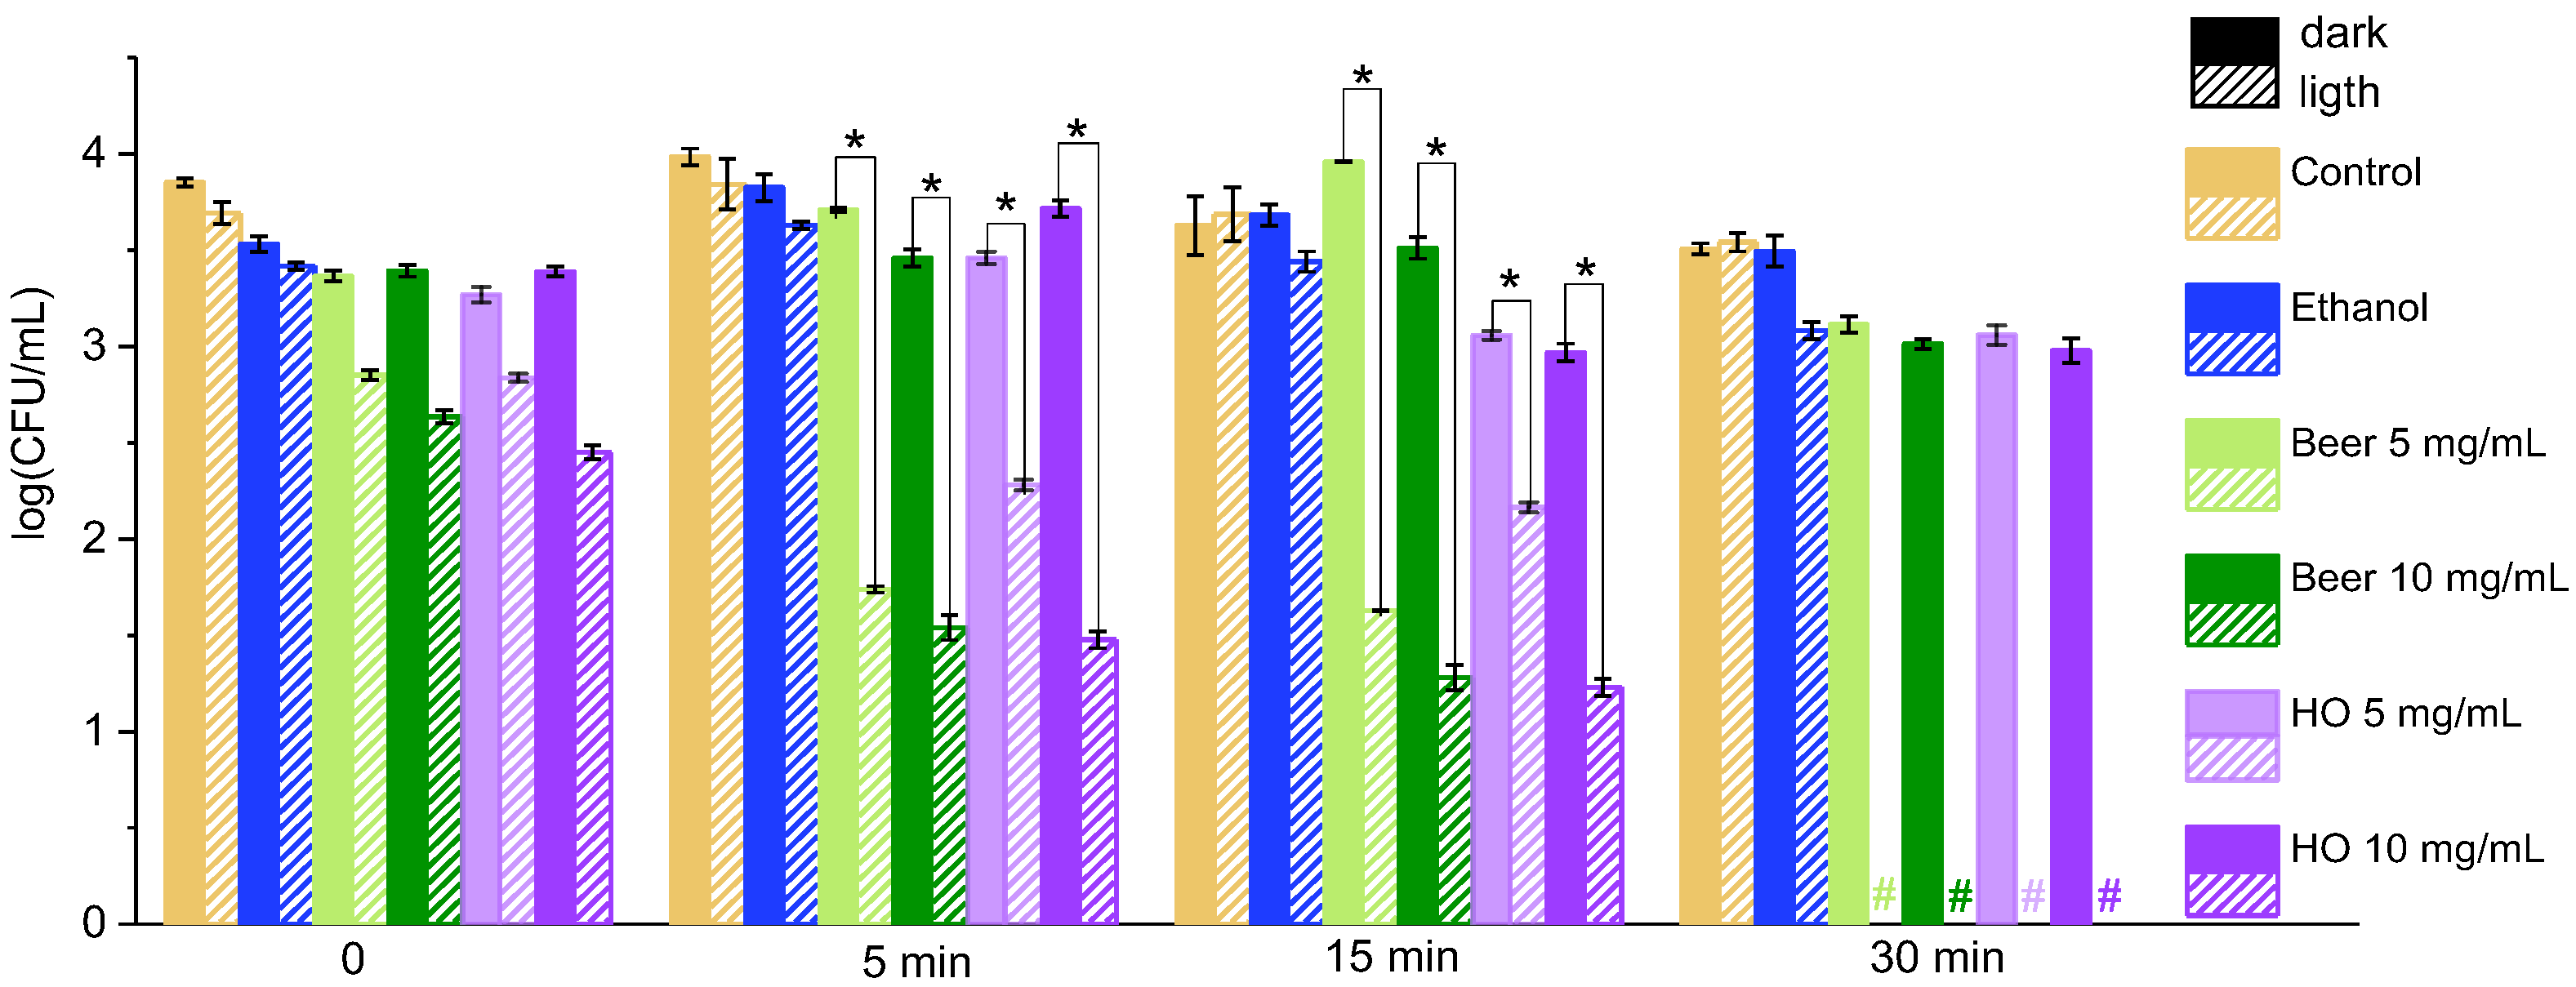
Figure 1. Antibacterial effects of Beer and Hanut Orcha (HO) leaf extracts at concentrations of 5 and 10 mg/mL on S. aureus after incubation under dark (solid-filled bars) conditions and light (pattern-filled bars) exposure. Error bars represent the STDEV. Statistically different results (p < 0.05) are marked by asterisks. The sharp # indicates the total inhibition of bacterial cells.
Applsci 15 10738 g001
Figure 2. Antibacterial effects of Beer and Hanut Orcha (HO) leaf extracts (10 mg/mL) on E. coli after incubation under dark conditions (solid-filled bars) and light exposure (pattern-filled bars). Error bars represent the STDEV. Statistically different results (p < 0.05) are marked by asterisks. The sharp # indicates the total eradication of bacterial cells.
Applsci 15 10738 g002
Figure 3. Antibacterial effects of Beer and Hanut Orcha (HO) leaf extracts at 5 and 10 mg/mL concentrations on S. aureus after incubation in the dark with (pattern-filled bars) or without ultrasonication (solid-filled bars). Error bars represent the STDEV. Statistically different results (p < 0.05) are marked by asterisks. The sharp # indicates the total inhibition of bacterial cells.
Applsci 15 10738 g003
Figure 4. Antibacterial effects of Beer and Hanut Orcha (HO) leaf extracts (10 mg/mL) on E. coli after incubation in dark conditions with (pattern-filled bars) and without (solid-filled bars) ultrasonication. Error bars represent the STDEV. Statistically different results (p < 0.05) are marked by asterisks. The sharp # indicates the total inhibition of bacterial cells.
Applsci 15 10738 g004
Figure 5. Antibacterial effect of the 60% ACN Hanut Orcha fraction extract against S. aureus under dark conditions (solid-filled bars) and light illumination (pattern-filled bars). Error bars represent the STDEV. Statistically different results (p < 0.05) are marked by asterisks. The sharp # indicates the total inhibition of bacterial cells. The concentration of the components in the fraction was adjusted to that in the crude extract according to A660.
Applsci 15 10738 g005
Figure 6. Absorbance spectra in the UV/Vis region of crude grape leaf extract (a) and the active fraction (b) obtained after chromatographic separation using RP-18 cartridges and a 60% aqueous solution of ACN as an eluent. The spectra were registered in a 70% aqueous solution of ethanol.
Applsci 15 10738 g006
Figure 7. The fluorescence spectra of SOSG in the presence of MB (a) and 60% ACN fraction (b) under light irradiation by a white LED lamp; (c) an auxiliary plot for calculation of kinetic constants, where Ft and F0 are the fluorescent intensities of samples at time t and the initial one, respectively.
Applsci 15 10738 g007
Figure 8. The mass spectrum (a) and the structure (b) of quercetin 3-O-glucuronide.
Applsci 15 10738 g008
Figure 9. The mass spectrum (a), the comparison between the measured and the database MS. A table below the MS spectrum is a representative identification table, in which the identified name appears (Compound ID = Pheophorbide A), as well as measured molecular formula, identification score (for this instrument the maximal score is 60, and all scores above 35 are sufficient), fragmentation, mass error, isotope similarity and the identification library (b), and the structure (c) of pheophorbide a.
Applsci 15 10738 g009
Disclaimer/Publisher’s Note: The statements, opinions and data contained in all publications are solely those of the individual author(s) and contributor(s) and not of MDPI and/or the editor(s). MDPI and/or the editor(s) disclaim responsibility for any injury to people or property resulting from any ideas, methods, instructions or products referred to in the content.