Article

Seismic Performance Assessment of 170 kV Line Trap Systems Through Shake Table Testing and Finite Element Analysis

1
Department of Construction Technologies, Karadeniz Technical University, 61080 Trabzon, Türkiye
2
Earthquake and Structural Health Monitoring Research Center, Karadeniz Technical University, 61080 Trabzon, Türkiye
Appl. Sci. 2025, 15(19), 10734; https://doi.org/10.3390/app151910734
Submission received: 25 August 2025 / Revised: 29 September 2025 / Accepted: 2 October 2025 / Published: 5 October 2025

Abstract

Line traps are critical components of power line carrier systems, enabling remote control signaling, voice communication, and inter-substation control within electrical transmission and distribution networks. Despite their importance, limited research has addressed their seismic performance, particularly under near-fault and far-fault ground motions. This study addresses this gap by experimentally and numerically evaluating a full-scale 170 kV line trap. Ambient Vibration Tests (AVTs), using Enhanced Frequency Domain Decomposition (EFDD), and shake table testing established its modal and seismic response characteristics. A finite element (FE) model was then developed and calibrated using the experimental results. Dynamic analyses were conducted to evaluate the structural response under both near-fault and far-fault ground motions. Experimental findings revealed that the seismic response of the line trap increased with height, with the upper segment experiencing over four times the base acceleration. Numerical analyses further demonstrated that near-fault ground motions induced significantly higher displacement and acceleration responses than far-fault records. These findings collectively constitute a detailed investigation into the seismic performance of a full-scale line trap, emphasizing the pivotal role of ground motion characteristics in the structural evaluation of substation apparatus.

1. Introduction

Substation facilities are typically planned to avoid high-risk regions such as active fault zones, landslides, and mudslides. However, due to the extensive distribution of active faults, it is often impractical to locate transmission networks and substations entirely outside these regions. Seismic events have shown that substation components are particularly vulnerable to earthquake-induced excitations, as evidenced by recurring damage to such equipment in past destructive earthquakes [1,2,3]. Liu et al. (2012) documented 246 substations damaged in the Mw 7.9 Wenchuan event [4]. The cascading effects of such failures have been both infrastructural and economic. According to Schiff (1998), the 1971 San Fernando (Mw = 6.6), 1987 North Palm Springs (Mw = 6.1), 1989 Loma Prieta (Mw = 6.9), and 1994 Northridge (Mw = 6.7) earthquakes resulted in over USD 330 million in damage to power transmission infrastructure [5]. Beyond the financial cost, disruption to substation functionality can compromise electricity delivery to urban areas, obstructing post-seismic operations including rescue, repair, and reconstruction. Hence, enhancing substation seismic resilience remains a fundamental goal in ensuring grid reliability [6].
Research on the seismic behavior of substation equipment and systems has received increasing attention since the 1971 San Fernando earthquake (Mw = 6.6). In response, the IEEE 693 guideline was issued in 1984, establishing fundamental principles for evaluating seismic adequacy of substation systems. Subsequently, the American Society of Civil Engineers (ASCE) published additional design guidelines aimed at improving the seismic resilience of substation systems. These regulatory frameworks have prompted ongoing investigations into the seismic vulnerability and performance improvement of substation equipment [7].
Prior research on substation seismic behavior has primarily concentrated on current transformers, transformer–bushing systems, and other slender systems, which share structural similarities with the line trap investigated in this study [3,8,9,10,11,12,13,14,15,16,17]. Moreover, several studies have examined steel towers supporting long-span transmission lines [18,19]. These experimental and numerical studies have contributed to understanding the seismic behavior of such structures.
In addition, several investigations have focused on a wide range of critical substation components. Günay et al. (2015) compared the outcomes of conventional shake table testing with real-time hybrid simulation [20]. Moustafa and Mosalam, (2016) focused on 230-kV disconnect switch insulators [21], while Ullah et al. (2018) tested 132 kV surge arresters [22]. Li et al. (2018) studied both static and dynamic properties of composite insulators and conducted full-scale shake table tests on 1000 kV cylindrical components [23]. Dinh et al. (2020) used tri-axial shake table techniques to investigate a 1000 kVA cast resin hybrid transformer [24]. Similarly, Li (2020) evaluated the seismic performance of a “T”-type high-voltage circuit breaker [25], while Wen et al. (2019) developed seismic fragility functions for disconnect switches [26]. Recent studies have introduced advanced models and analytical techniques. These include seismic fragility modeling for dry-type reactors [27], incorporation of soil–structure interaction in scaled ultra-high-voltage transformer experiments [28], and evaluation of failure risks under material strength deviations [29]. Beyond characterization of seismic demand, mitigation approaches have also been explored. Studies have investigated the use of isolators and damping devices to improve the seismic performance of substation equipment and reduce their vulnerability to earthquake effects [30,31,32,33,34,35,36,37,38,39]. In addition to the general seismic vulnerability of substation equipment, it is also important to consider the impact of dynamic disturbance effects on structural stability. Strong dynamic inputs (e.g., earthquake and blasting vibration) can amplify the structural response of slender systems with high centers of gravity, thereby increasing the likelihood of local failures or instability. Previous studies have highlighted that dynamic amplification under strong dynamic input may significantly alter the demand imposed on structures [40]. This perspective further underscores the necessity of examining not only the inherent structural characteristics of line traps but also their response amplification mechanisms under different dynamic loading scenarios.
Despite numerous studies on the seismic response of substation equipment, line traps have received limited research attention. These devices are essential to power line carrier communication systems, supporting remote signaling, voice communication, and inter-substation coordination. The structural configuration of line traps in substations, typically installed on steel supporting structures and porcelain insulators of varying numbers, results in a relatively high center of gravity, thereby increasing their seismic vulnerability. Moreover, limited research addresses the impact of near- and far-fault motions on such systems. Addressing this gap, the current study investigated the seismic behavior of a 170 kV line trap through full-scale shake table experiments, supported by numerical modeling and validation. In particular, the study highlights two main contributions:
  • It presents, to the authors’ knowledge, the first full-scale shake table tests performed on a line trap,
  • It provides a comparative evaluation of near-fault and far-fault ground motion effects on such equipment.
The findings aimed to advance the understanding of the seismic performance of line traps and address a notable research gap concerning substation vulnerability. The remainder of this paper is organized as follows. Section 2 describes the characteristics of selected 170 kV line trap. Section 3 describes the experimental setup and methodology. Also, this section presents the FE modeling and validation process. Section 4 discusses the seismic analyses and results under near-fault and far-fault ground motions. Section 5 briefs limitations and sources of uncertainty of this study. Finally, Section 6 provides conclusions and recommendations for future research.

2. Description of 170 kV Line Trap

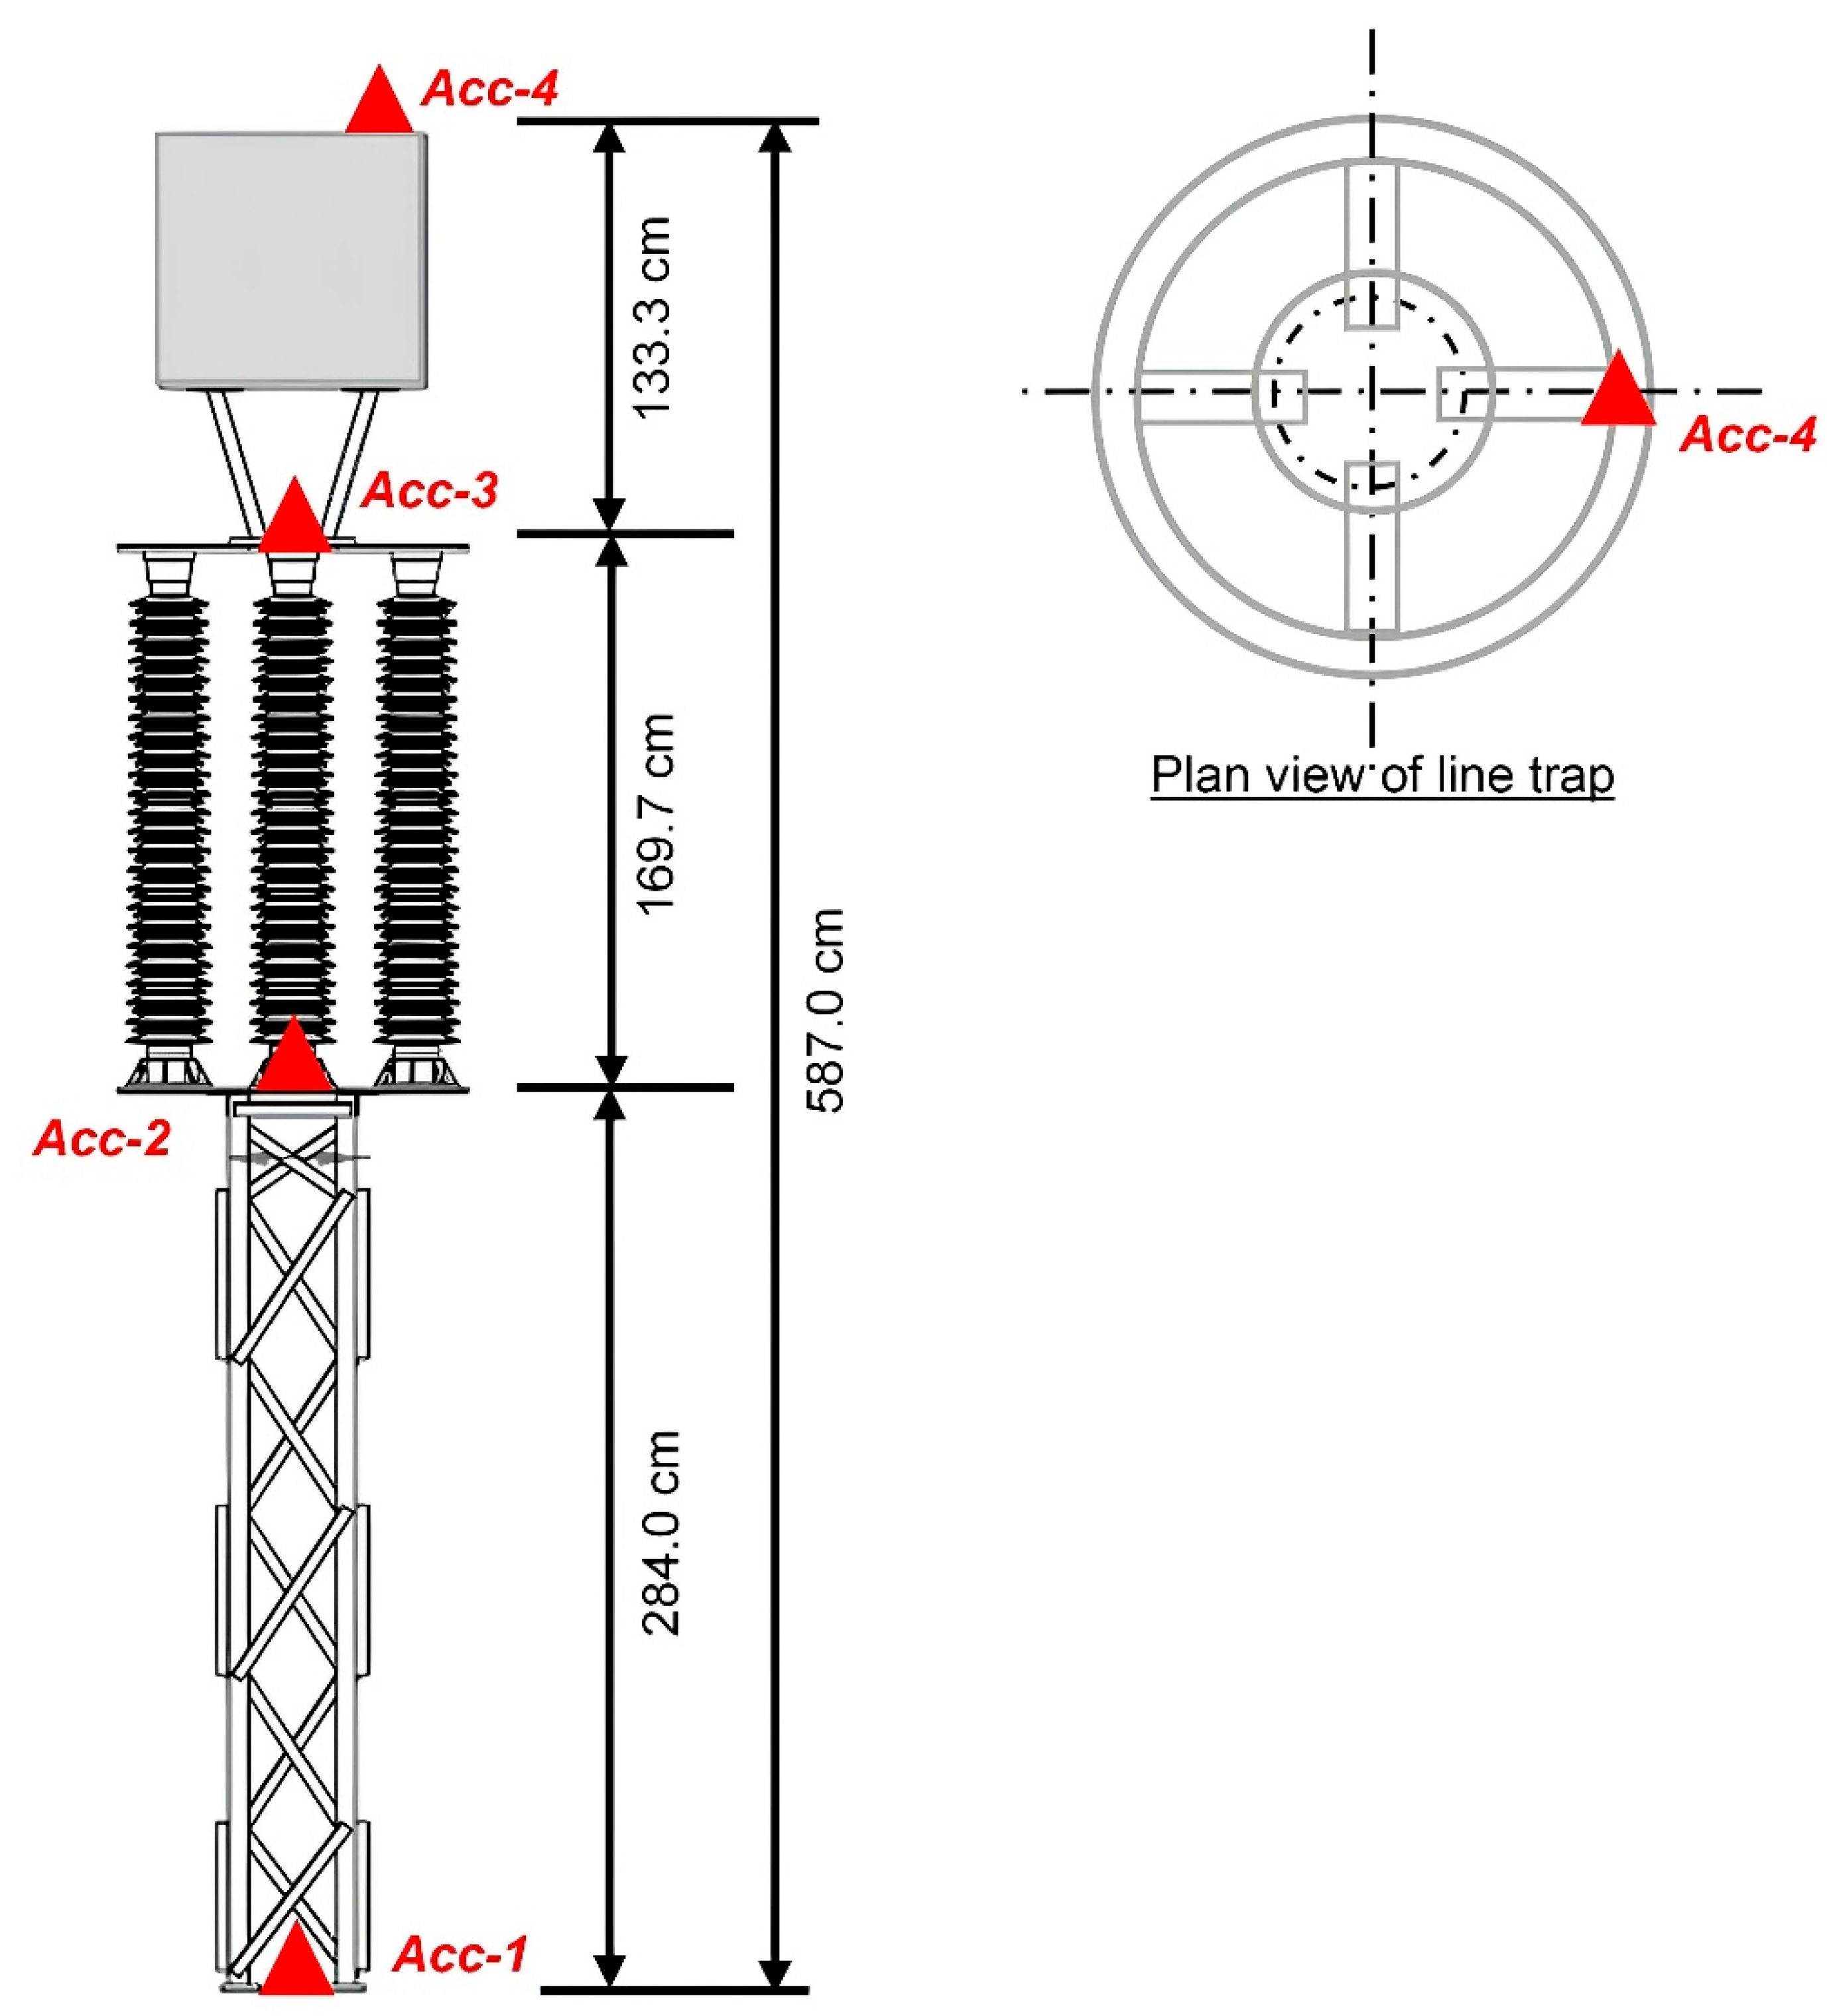
In this study, a line trap was tested at the Karadeniz Technical University to investigate its structural behavior under seismic excitations. The device consists of six main components: (i) the steel support structure, (ii) bottom steel plate, (iii) three porcelain insulators, (iv) upper steel plate, (v) the pedestal and (vi) line trap. The steel frame was fabricated using L-profile sections, with a base of 45 × 45 cm and 284 cm height. Each porcelain insulator measures 170 cm in height, yielding a total assembled height of 587 cm. The individual mass of the line trap was 465 kg, while the pedestal and insulators together weighed 976 kg. M12 bolts were used to fix the line trap to the pedestal; M16 bolts secured the support structure and plates, while M20 bolts anchored the base plate to the shake table. The assembly process began with anchoring the base plate, followed by the sequential installation of the frame, porcelain elements, steel plates, and the preassembled line trap and pedestal. The final experimental configuration is depicted in Figure 1.

3. Experimental Studies

Following the completion of the installation on the shake table, AVTs were conducted to determine the modal parameters (natural frequencies and mode shapes) of the line trap. In addition, shake table tests were performed to determine the damping ratio and to investigate the dynamic behavior of the line trap under seismic excitation.

3.1. Test Instrumentation

The seismic test was conducted using a shake table equipped with a rigid 4 × 4 m platform. The system is capable of achieving peak accelerations of ±2 g, a maximum velocity of 628 mm/s, and a displacement range of ±400 mm. It can support an effective payload of 350 kN and withstand dynamic lateral loads up to 500 kN. To determine the structural behavior of the line trap, a total of four B&K4506-type triaxial accelerometers mounted on the base plate, porcelain insulators and line trap itself. Through these accelerometers, raw data from the line trap were obtained, and its structural behavior was analyzed. The accelerometers featured an operational frequency bandwidth of 0.3–2000 Hz, a measurement range of ±14 g, and a sensitivity of 0.5 V/g. Data acquisition and processing were carried out using a B&K 3560 system linked to a computer interface. The sensor arrangement and experimental configuration are illustrated in Figure 2.

3.2. Ambient Vibration Tests

To characterize the dynamic behavior of the structure prior to seismic testing, AVT was implemented. AVT, also known as operational modal analysis or output-only modal testing, is a widely accepted non-destructive approach for identifying structural modal parameters such as natural frequencies, mode shapes, and damping ratios [41]. In AVT, structural responses to environmental excitations such as wind, traffic, seismic events, or blasting are recorded through sensors such as accelerometers. These signals are processed using computational algorithms to extract dynamic characteristics. Modal identification can be performed using either frequency-domain or time-domain techniques. Frequency-based methods rely on signal magnitude and inter-sensor correlation, while time-domain approaches use time histories or model-fitting via correlation functions [42]. This study utilized frequency-domain-based modal identification, applying the EFDD method to derive modal properties.
EFDD is an extension of the Frequency Domain Decomposition (FDD) technique [43]. In this method, the modes were obtained by selecting the peaks in the singular values decomposition graphs calculated from the spectral density function of response. While the original FDD technique is limited in that it cannot estimate damping ratios, it offers accurate determination of natural frequencies and mode shapes. The EFDD method extends this capability by enabling the estimation of damping ratios as well [44]. The mathematical formulation linking unknown inputs and measured responses is presented in Equation (1), with detailed solutions available [45,46].
G y y ( ω ) = H ¯ ( ω )   G x x ( ω )   H ( ω )   T
where Gxx is the r × r power spectral density matrix of the input of which r is the number of inputs, Gyy is the m × m power spectral density matrix of the responses of which m is the number of responses, H(ω) is the m × r frequency response function matrix, respectively.
The accelerometer configuration detailed in Section 3.1 was utilized during the AVTs. The recorded raw vibration data were transmitted to the PULSE operational modal analysis software [47], which was used for both signal processing and modal parameter extraction. Each measurement session lasted 15 min. Based on the results of the FE model, the frequency range of interest was defined as 0–10 Hz. To mitigate leakage effects during frequency analysis, a Hanning window was applied.
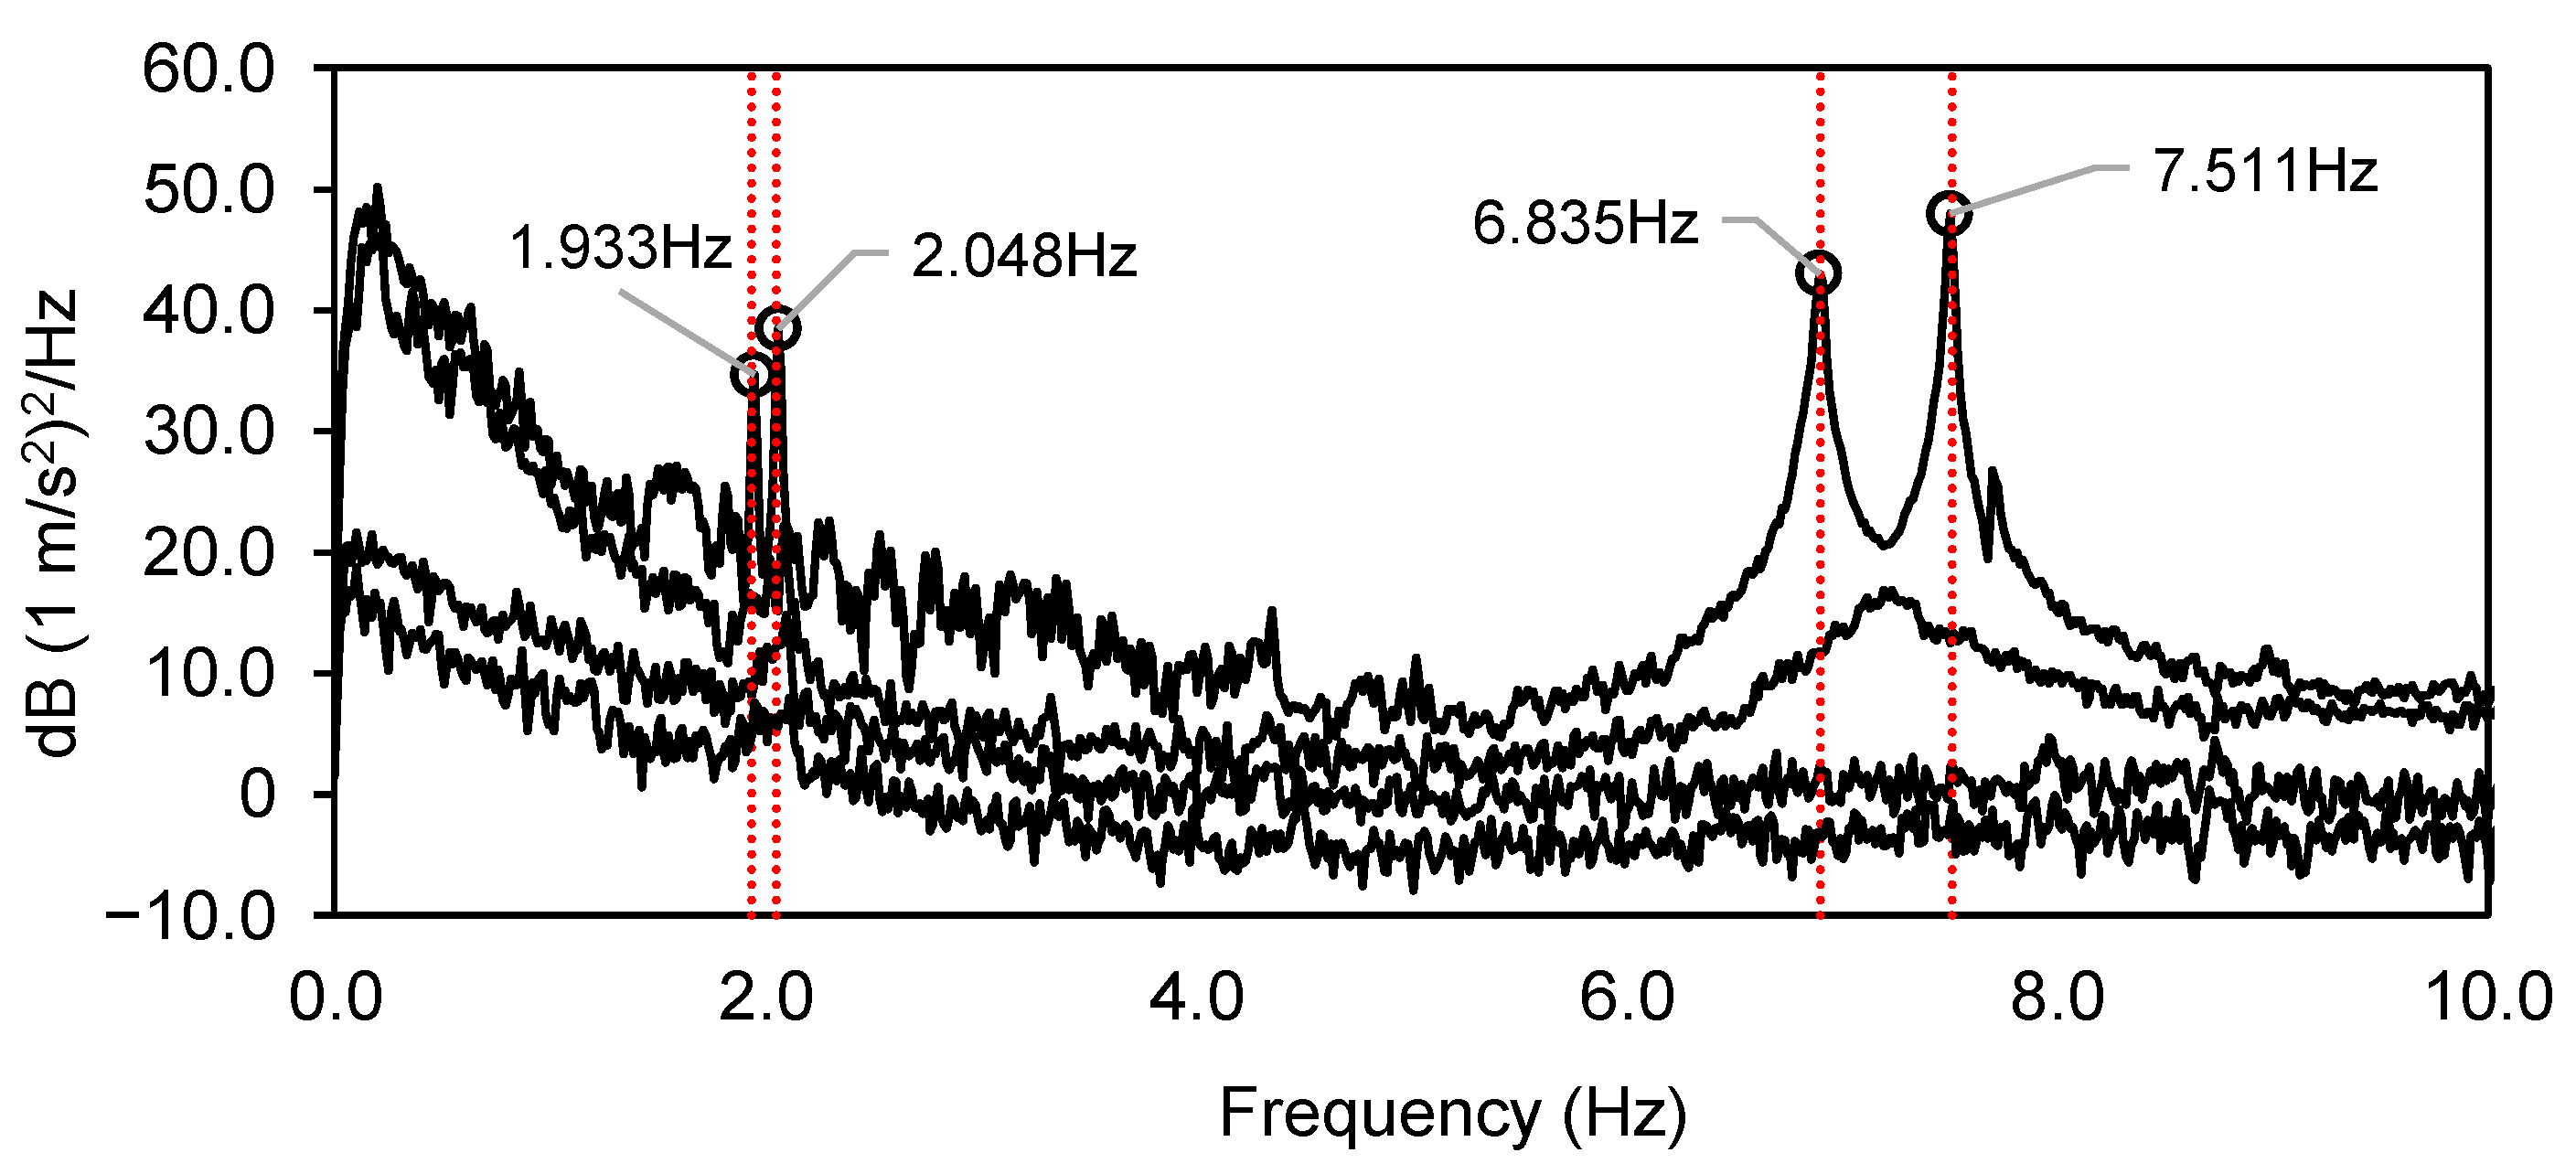
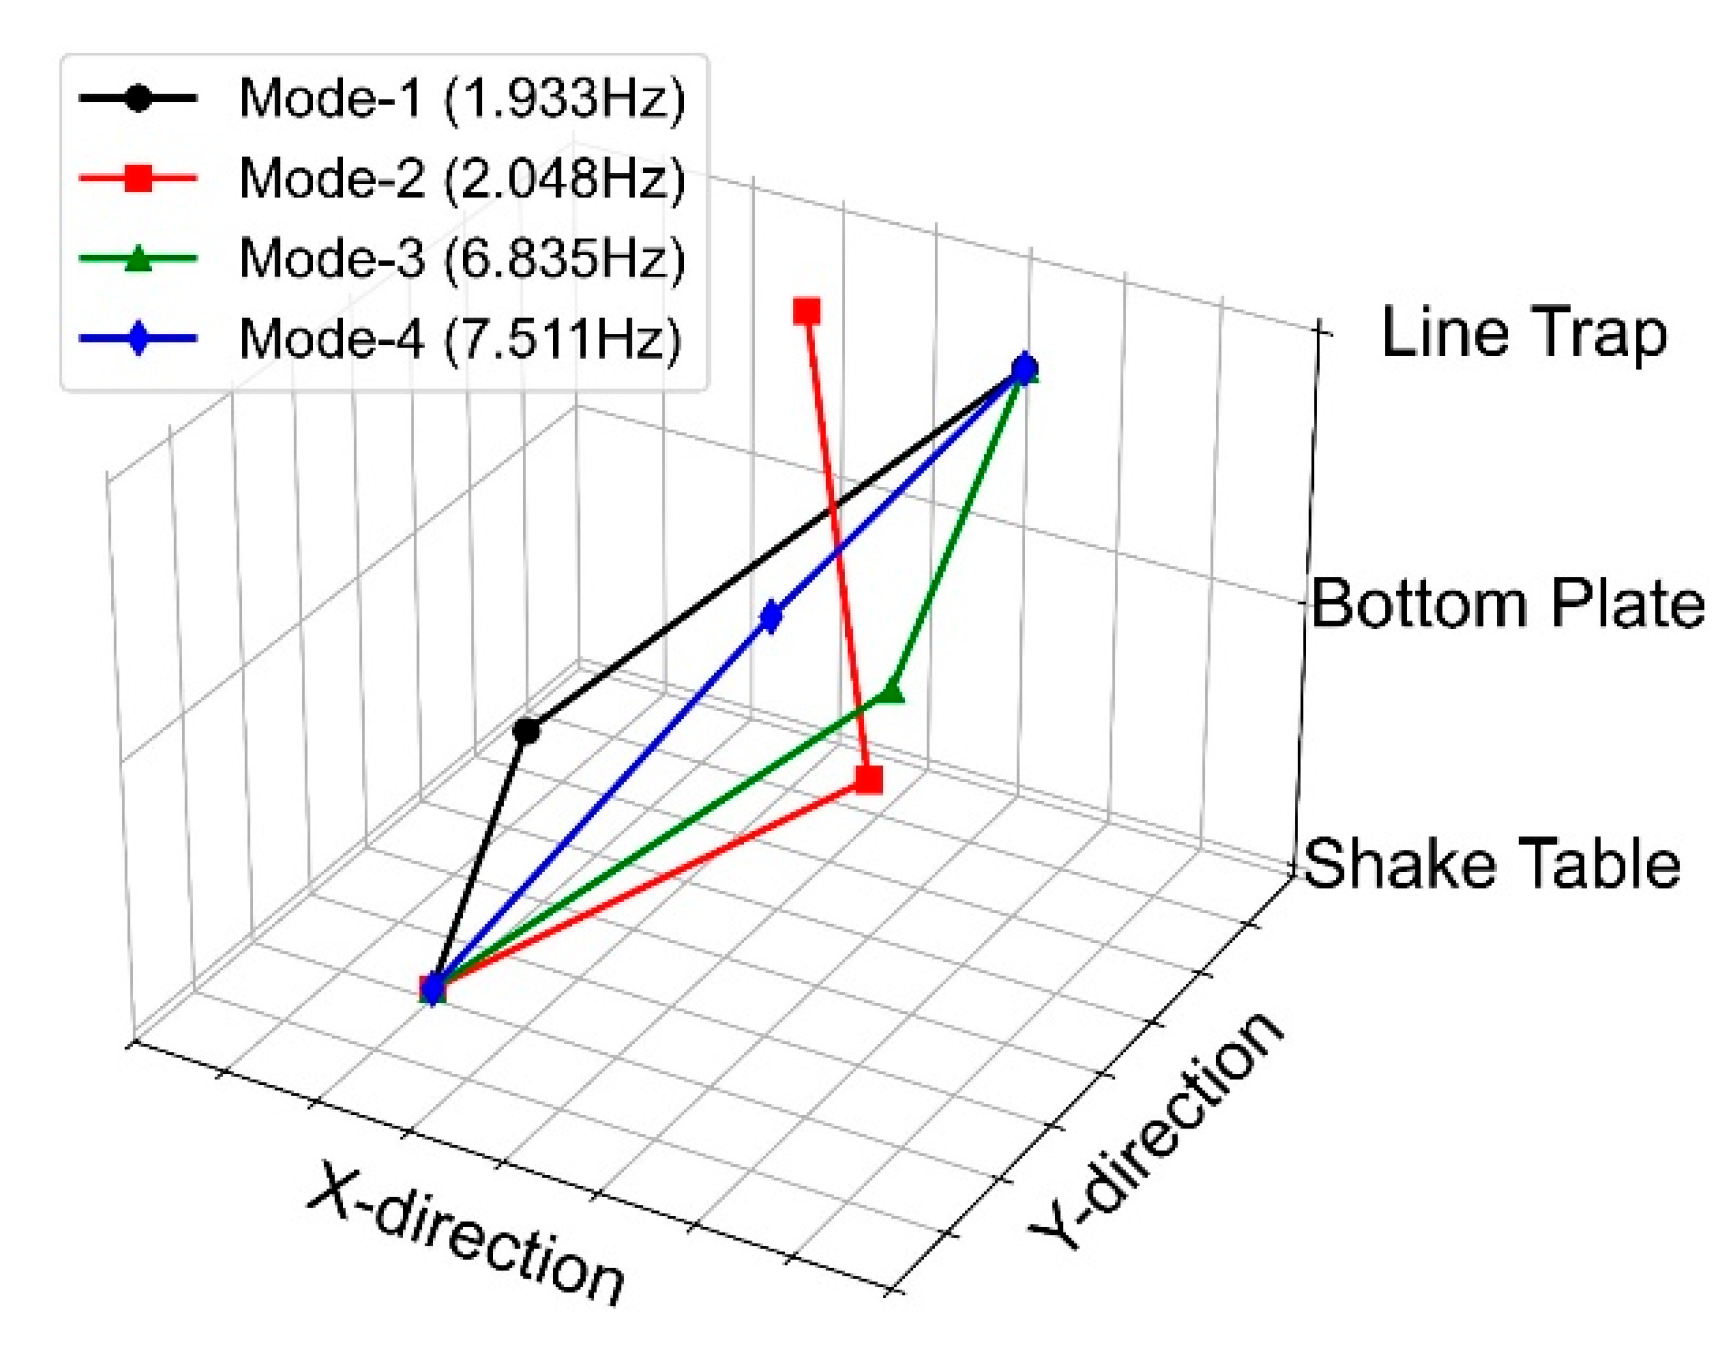
Following the application of the EFDD method, the Singular Values of the Spectral Density Matrices (SVSDM) for the line trap were computed and visualized, as shown Figure 3. The number of singular values equals the number of measurement channels; they are ordered by magnitude, with the first carrying the dominant modal content. For clarity, Figure 3 shows only the four most significant curves. Natural frequencies were extracted from peak locations on the dominant singular value and verified by the alignment of corresponding peaks in the remaining singular values. This agreement is an essential indicator of the existence of the corresponding vibration modes. The first four frequencies were identified as 1.933 Hz, 2.048 Hz, 6.835 Hz, and 7.511 Hz, respectively. The corresponding mode shapes for these frequencies were identified as transversal (Figure 4). In this study, the modal analysis primarily focused on transversal modes, as they represent the dominant vibration forms of slender substation equipment. Accordingly, the accelerometer layout was designed to capture these transversal modes. Torsional modes were not observed but could be identified with a sensor arrangement specifically configured for that purpose.

3.3. Shake Table Tests

Shake table experiments were performed to evaluate the damping ratio and seismic responses of the line trap. Prior studies have utilized both earthquake-recorded acceleration data and controlled sinusoidal excitations to analyze structural dynamics under simulated seismic loads [41,48,49,50]. Among these, sine-wave inputs provide a simplified excitation pattern, allowing for clearer interpretation of the system’s response and facilitating the calibration of finite element models [51]. In this study, sinusoidal input motions were exclusively used during shake table testing to isolate fundamental dynamic characteristics and obtain consistent damping estimates under controlled laboratory conditions.
Although this method offers valuable insights into dynamic response characteristics, it does not fully represent the non-stationary nature of actual earthquake ground motions. While real earthquake records are critical for evaluating the seismic performance of such equipment, their use was excluded in the current experimental program. This decision was based on laboratory limitations and the objective of maintaining the specimen within the elastic range without causing damage. Consequently, the direct applicability of the experimental results to real-world seismic events is constrained. To address this limitation, numerical analyses incorporating both near-fault and far-fault earthquake records were performed, providing a perspective on the expected seismic response of the line trap. The experimental sinusoidal input was carefully tuned to the line trap’s resonance frequency to ensure dynamic relevance. Accordingly, a sinusoidal excitation with a peak ground acceleration (PGA) of 0.25 g was applied (Figure 5). The resonance frequency required for this input was previously identified through AVTs. To ensure the experimental results were both consistent and reliable, it was critical to achieve close agreement between the input excitation and the platform response. For this purpose, the Proportional-Integral-Derivative (PID) controller was tuned prior to testing. Figure 5 presents a comparison of the ground motion input with the response obtained from the rigid platform of the shake table, demonstrating a good agreement between the applied signals and the measured outputs.
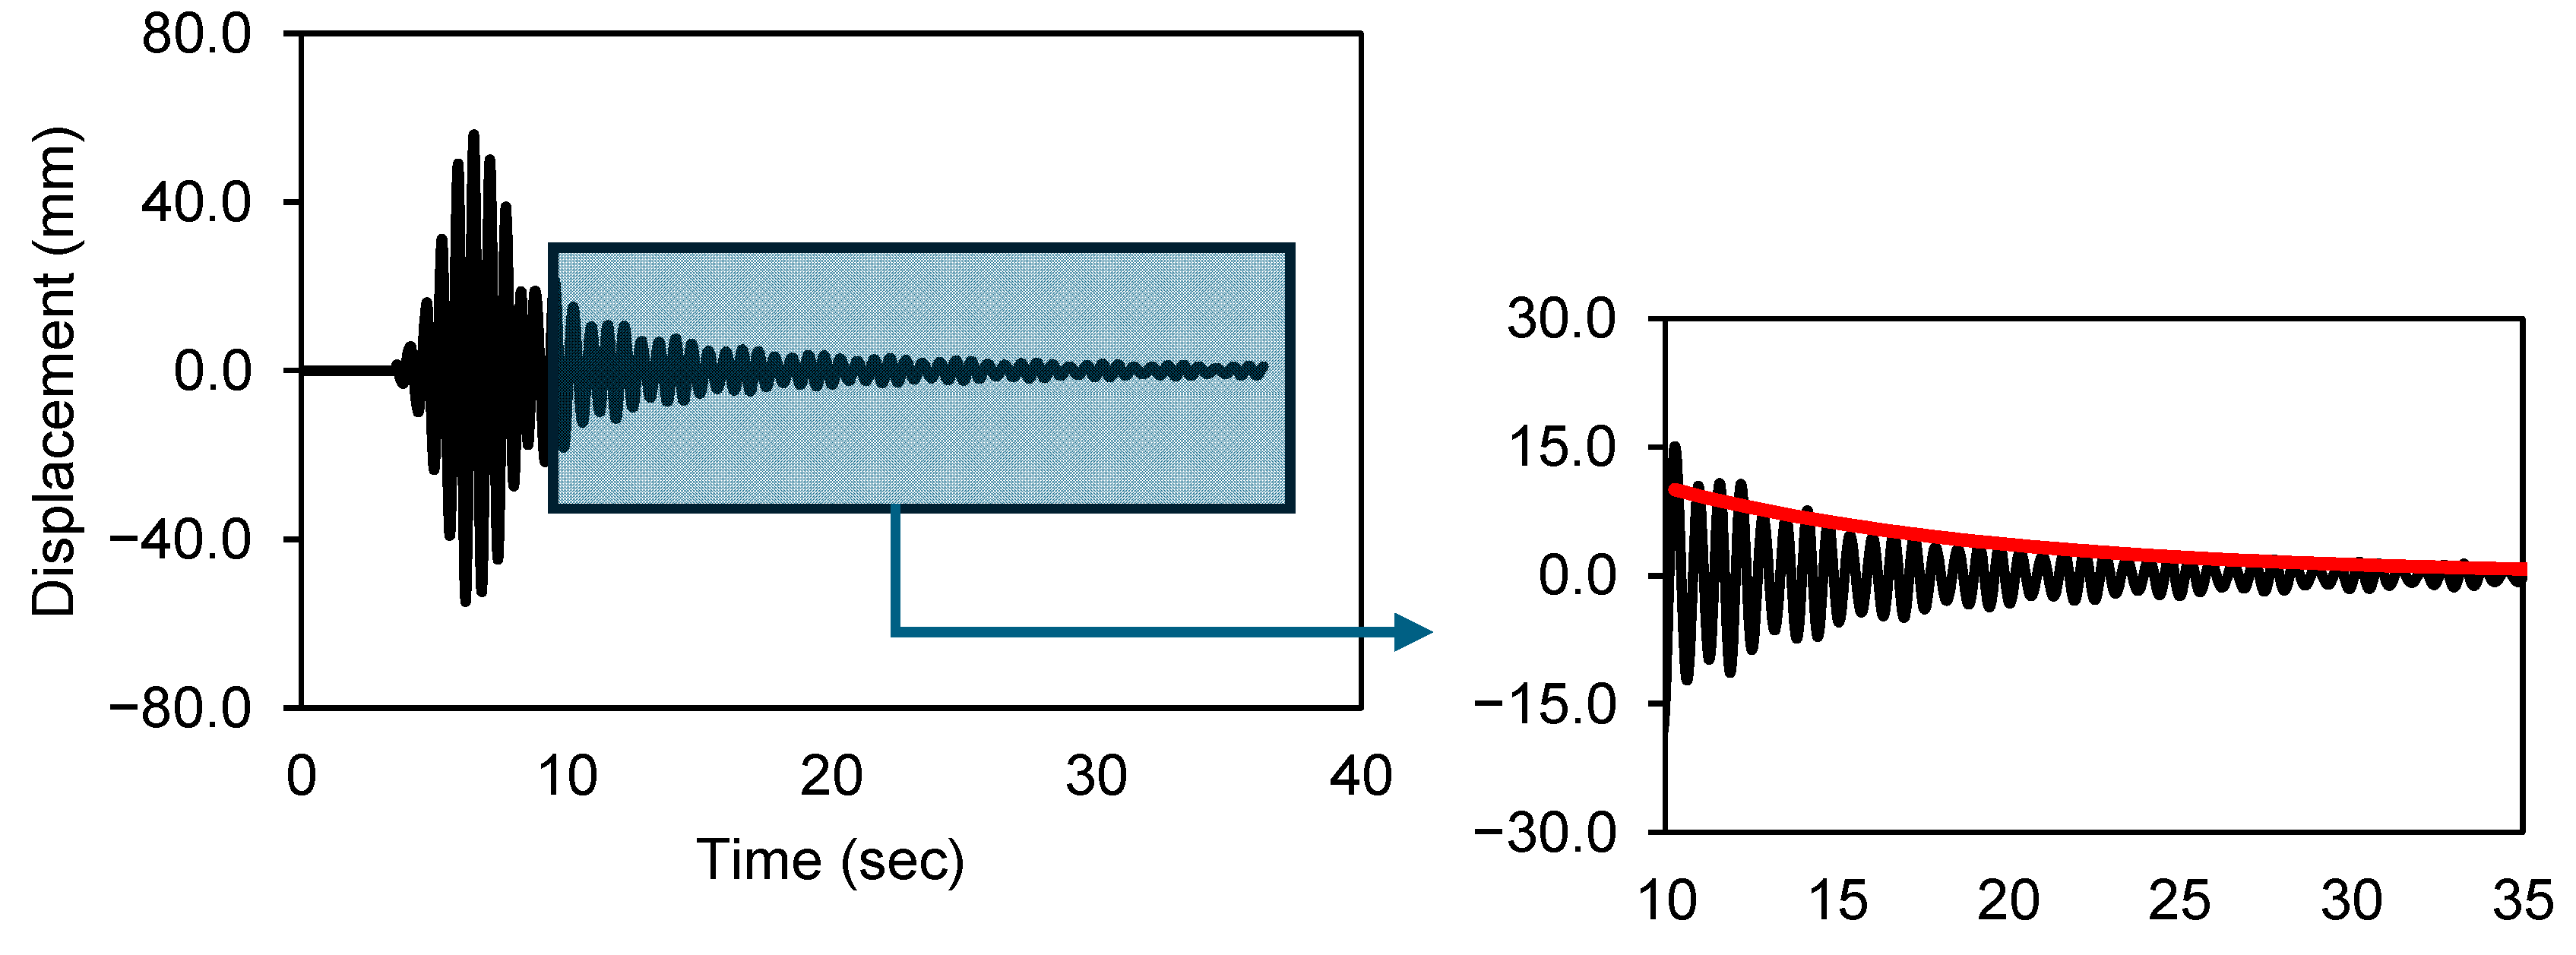
Damping characteristics of the line trap were assessed using structural response data recorded during the shake table experiments. Among the established techniques for damping evaluation—Logarithmic Decrement and Half-Power Bandwidth methods—this study employed the Logarithmic Decrement Method to determine damping ratios. Measurements were conducted in both orthogonal directions. Relative displacements were calculated using acceleration data from Acc-1 and Acc-3, which were strategically positioned on the specimen. Four accelerometers were mounted (Figure 2), and the recorded signals were processed into displacement time histories. Based on relative displacements, the damping ratios in each principal direction were computed using the Logarithmic Decrement Method. The logarithmic decay curve for motion in the y-direction is presented in Figure 6. The experimentally determined damping ratios were 1.92% for the x-direction and 1.71% for the y-direction.
The relative displacement–time histories obtained from the shake table test are presented in Figure 7. The maximum acceleration and relative displacement values recorded by each accelerometer are summarized in Table 1. As shown in Table 1, the maximum acceleration and relative displacement were found to be 0.956 g and 77.745 mm, respectively. During the shake table experiment, the peak responses were captured by the accelerometer positioned at the top of the line trap. Data analysis confirmed that structural responses intensified progressively with elevation. Furthermore, a comparison of acceleration values indicates that the top of the test specimen experienced 4.05 times higher than the input ground motion. This amplification effect reflects the dynamic susceptibility linked to the line trap’s slender profile and high center of gravity, which causes the upper structure to endure significantly greater seismic forces compared to the base. The relative displacement data demonstrated a similar amplification trend, suggesting that structural elements—particularly brittle porcelain insulators—experienced heightened stress levels, positioning them as critical failure zones under severe seismic excitation. From the standpoint of seismic design, such amplification emphasizes the need to assess both base excitation and localized demand escalation in evaluating the seismic resilience of substation components. Nevertheless, for multi-component equipment, relying solely on peak acceleration values may lead to inaccuracies due to localized modal effects and noise introduced by inter-component interactions. Consequently, to accurately qualify and design such equipment seismically, it is necessary to employ ground motions defined in standards such as IEEE 693, and determine the acceleration amplification factor using the average, the peak, or the zero-period value within the random frequency range of the response spectrum [52].

4. Numerical Studies

4.1. FE Model of the 170 kV Line Trap

To investigate the seismic performance of a 170 kV line trap subjected to both near-fault and far-fault seismic excitations, an FE model was constructed in SAP2000. Experimental data from AVT and shake table tests were used to calibrate the model.
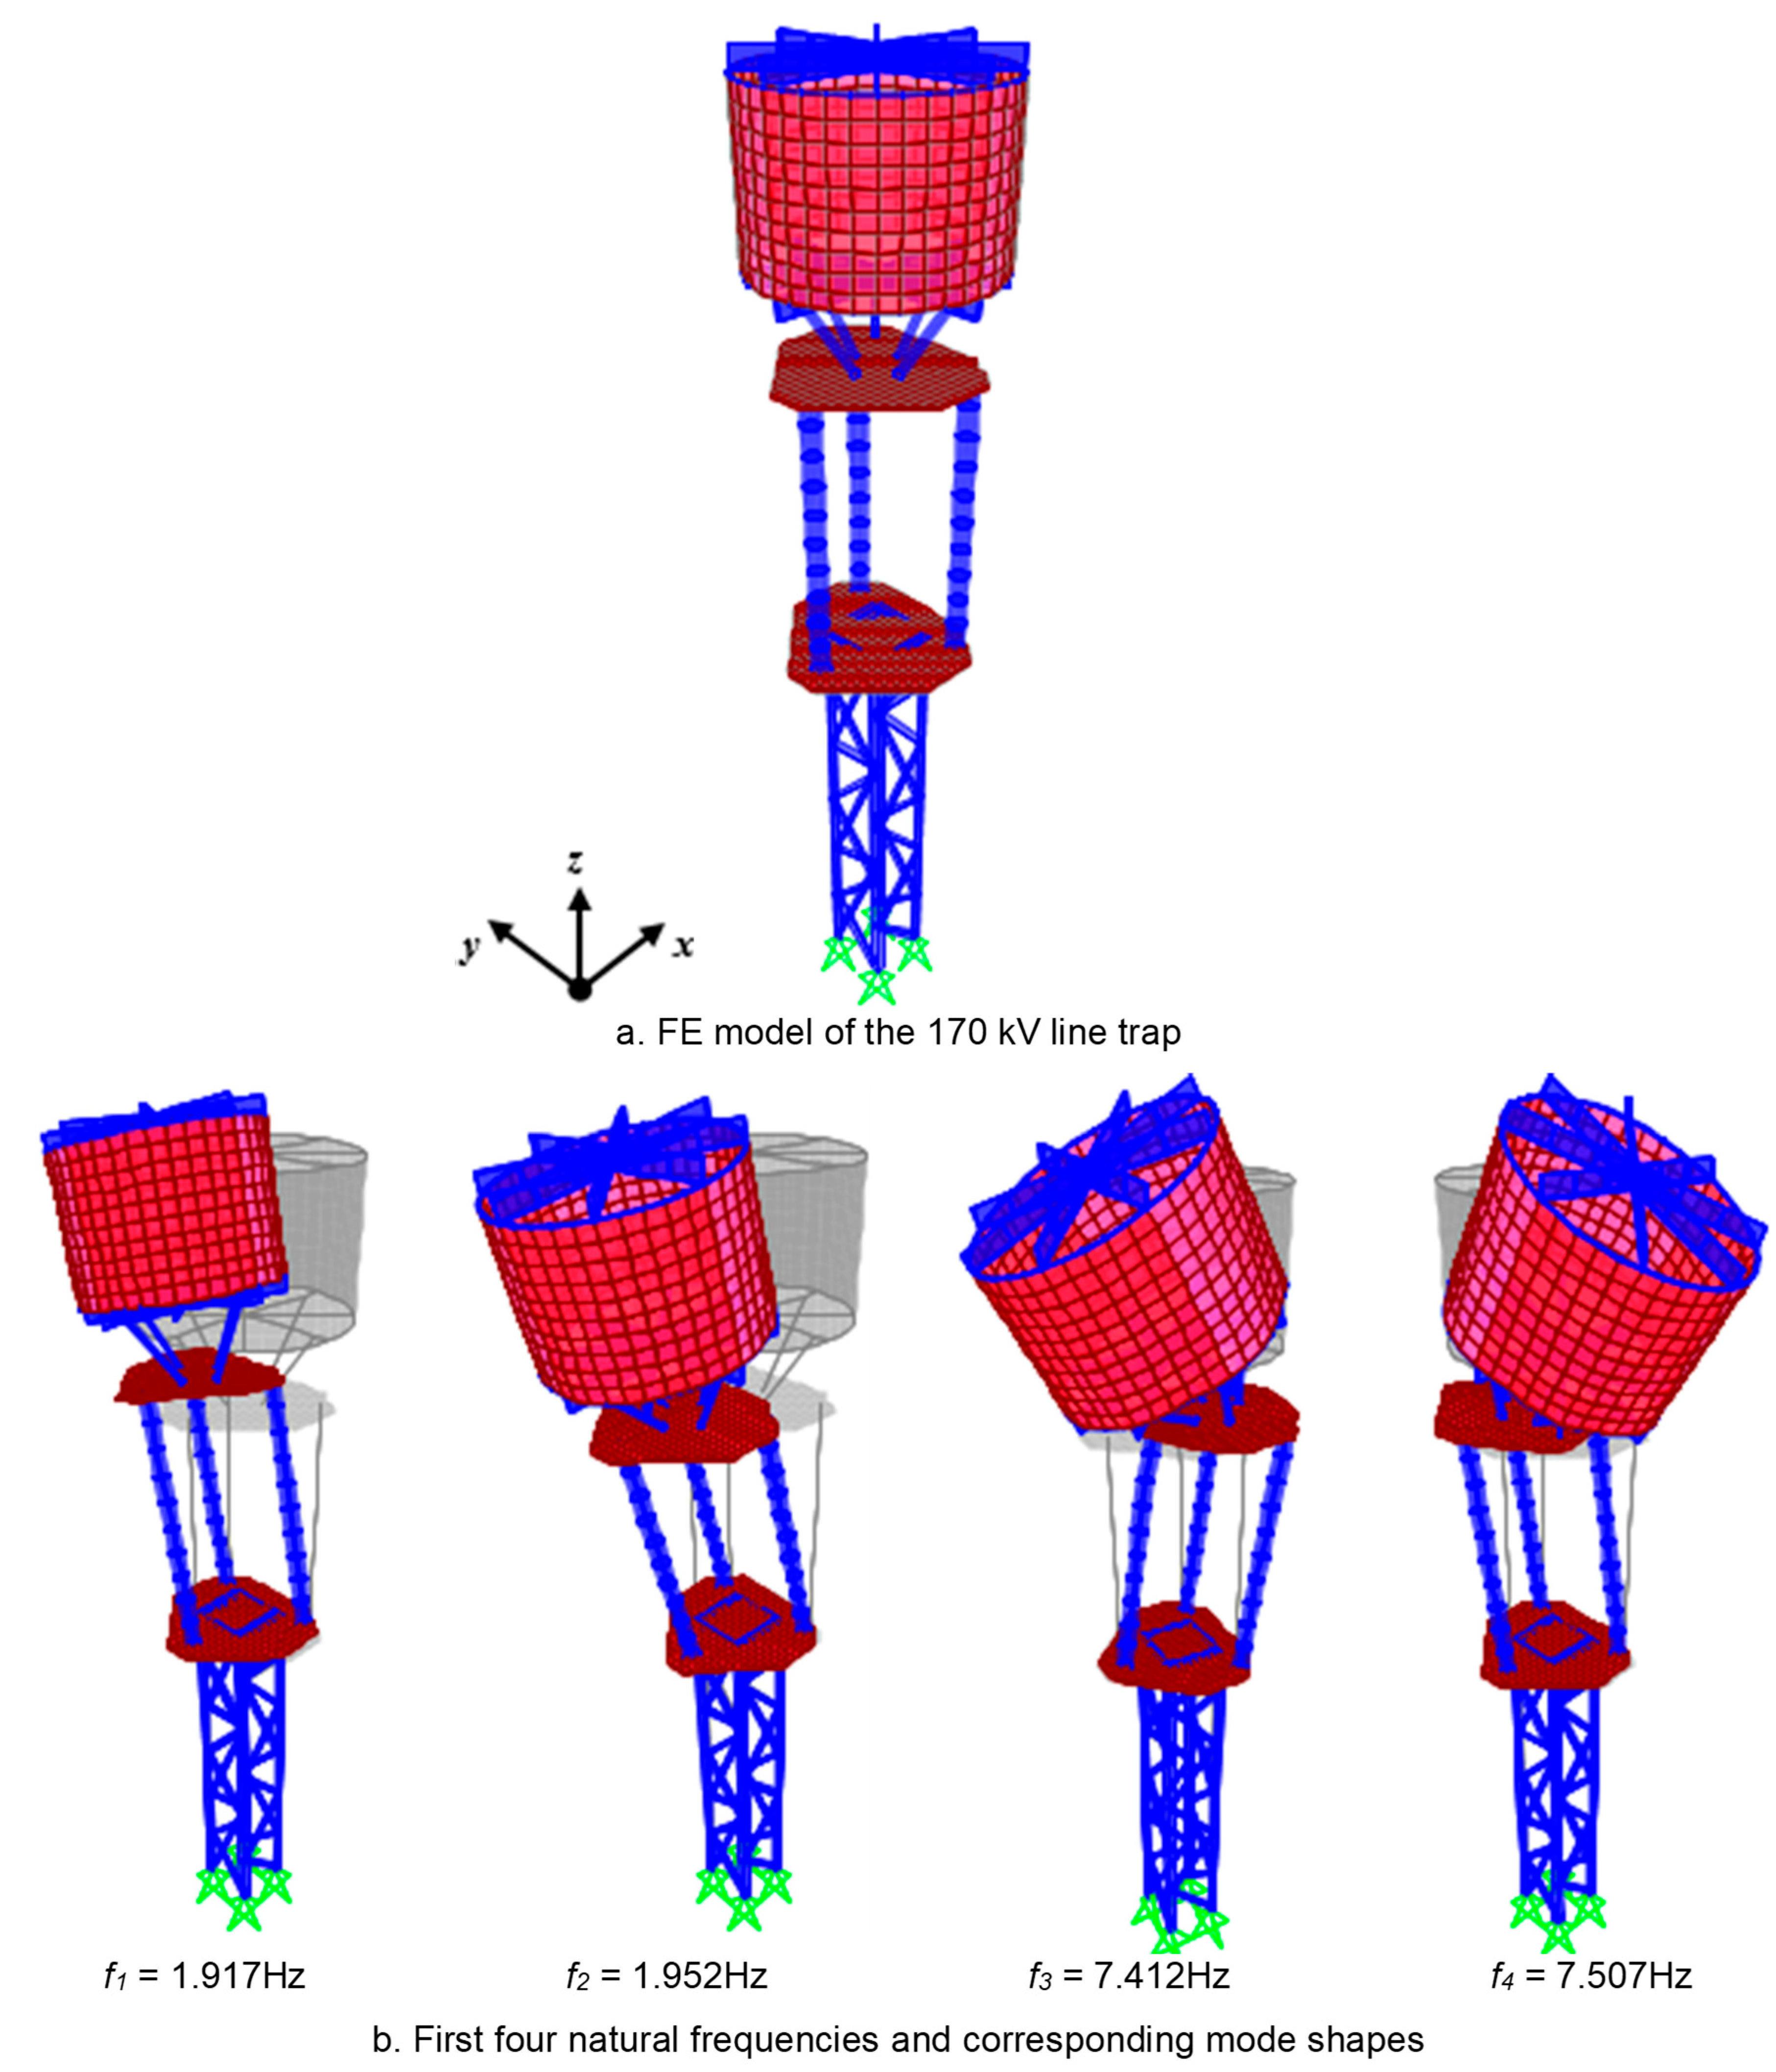
The steel supporting structure was modeled using 3D elastic beam elements (six DOF per node), while the upper and lower plates at the porcelain insulator ends were defined using four-node shell elements. All steel components were S235 grade (fyk = 235 MPa), with an elastic modulus of 2.1 × 10⁸ kN/m2, a Poisson’s ratio of 0.3, and a density of 76.97 kN/m3. The porcelain insulators, assumed brittle, were modeled using beam elements in an elastic regime [34]. The porcelain insulators were modeled using C120 aluminous porcelain, per IEC 60672-3. As damage in such assemblies predominantly occurs within the porcelain body, flanges were excluded from the numerical model. The material properties for C120 included an elasticity modulus of 8 × 10⁷ kN/m2, Poisson’s ratio of 0.17, and density of 23.53 kN/m3. As per IEEE 693-2018, flexural strength was set at 90 MPa (unglazed) and 110 MPa (glazed). The aluminum pedestal linking the steel plate to the line trap was represented using 3D elastic beam elements, adopting material properties of Aluminum 6013-T8, including an elasticity modulus of 68.9 × 10⁶ kN/m2, Poisson’s ratio of 0.33, and a density of 26.60 kN/m3. The support structure was fixed to rigid platform of the shake table via M20 bolts, which were modeled as pinned supports in FE. Truss elements forming the structural frame were modeled with hinged connections at both ends, while the upper joints of the pedestal were modeled with moment release conditions. Figure 8a illustrates the final FE model configuration of the 170 kV line trap.
Through modal analysis, the first four natural frequencies were predicted as 1.917 Hz, 1.952 Hz, 7.412 Hz, and 7.507 Hz, with mode shapes shown in Figure 8b. The experimental AVT data showed comparable values ranging from 1.933 to 7.511 Hz, with respective mode discrepancies of 0.83%, 4.69%, 8.44%, and 0.05% (Table 2). The FE model demonstrated a good overall agreement with the experimental results. However, the third natural frequency exhibited a relatively high error (8.44%), primarily due to uncertainties in the modeling of connections and boundary conditions, which critically influence the dynamic characteristics of the system. Since the structure consists of factory-produced steel and porcelain, the material variability is assumed minimal, thereby reinforcing the influence of boundary abstraction errors on modal behavior. To reduce this error, experimental determination of the moment–curvature relationships and shear behavior of the connections would be required for accurate incorporation into the FE model. Reducing this deviation would require experimental quantification of moment–curvature and shear responses at the connections and subsequent integration of these data into the FE model. However, such tests were beyond the scope of this study.
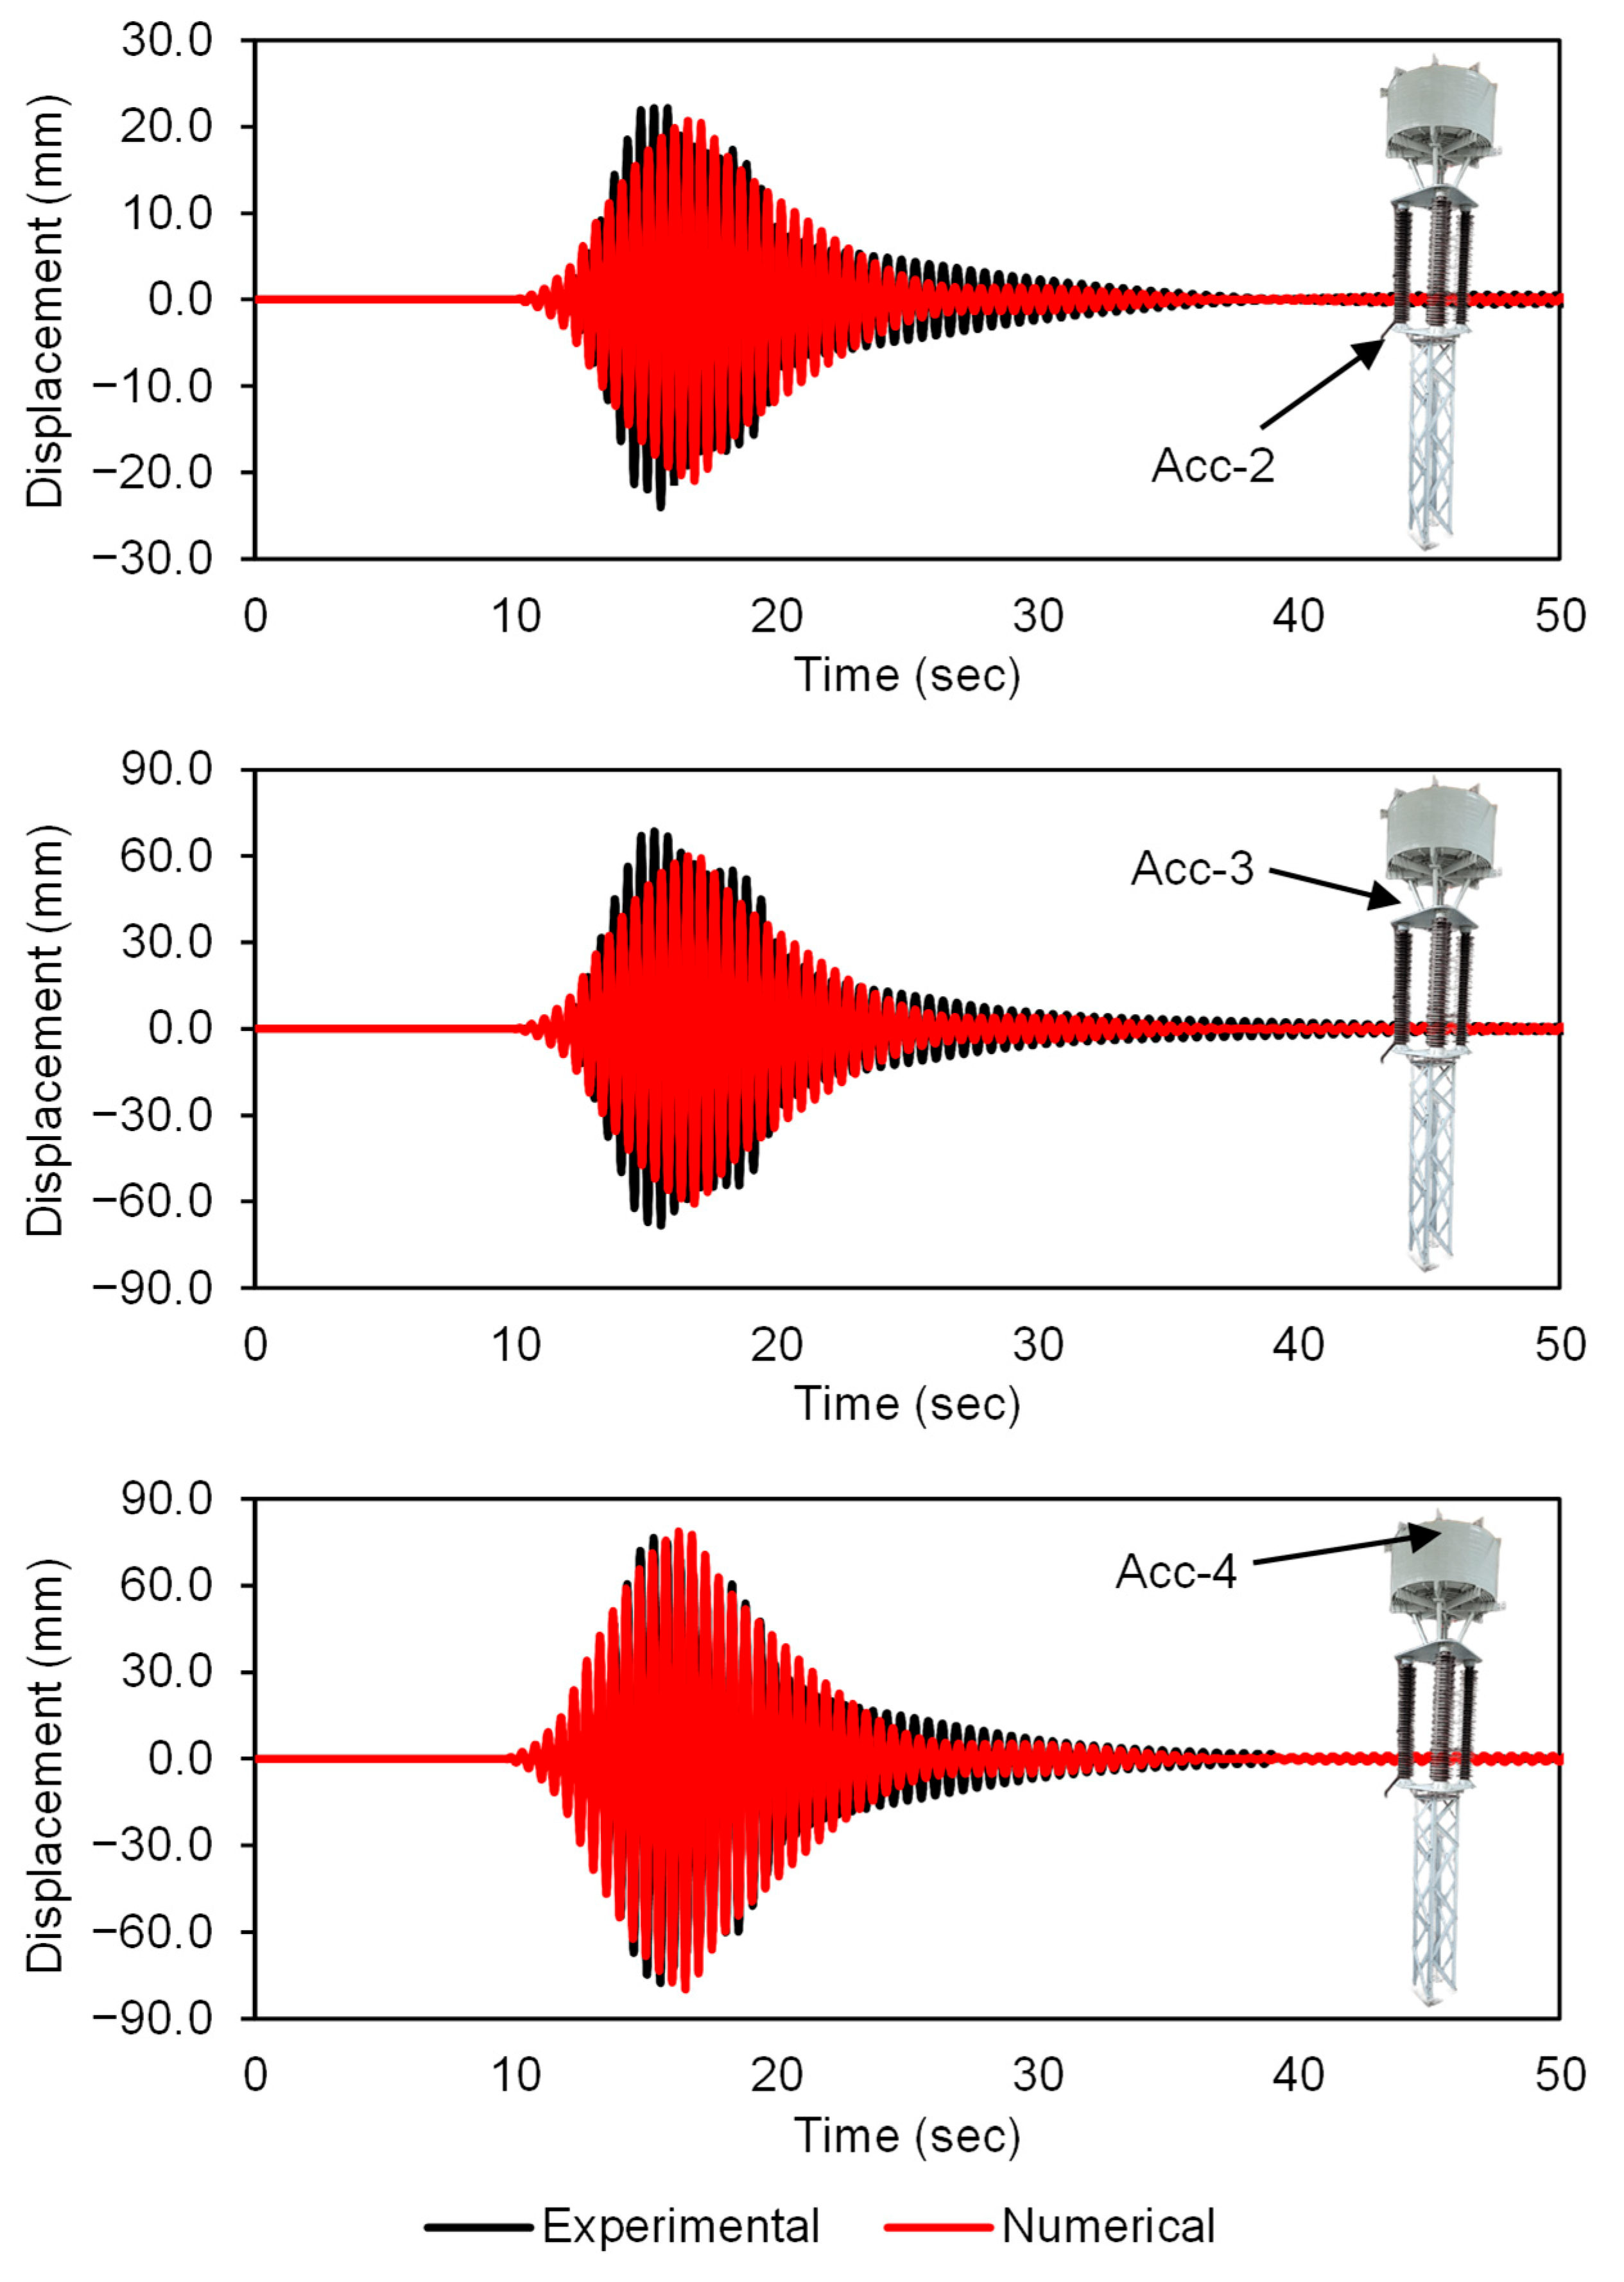
To compare numerical and experimental displacement responses, dynamic analyses were performed. Given minor differences in input and measured table accelerations (Figure 5, Acc-1 acceleration data were used in the FE model. The resulting displacement–time histories are shown in Figure 9, enabling direct comparison with the experimental results. In the shake table test, the recorded peak displacements were 24.093 mm (lower plate), 68.570 mm (upper plate), and 77.745 mm (line trap), while those predicted numerically were 20.995 mm, 60.794 mm, and 79.944 mm, respectively. When the maximum displacement values at different accelerometer locations were compared, the differences were found to be 12.85%, 11.34%, and 2.82%, respectively (Table 3). The combined analysis of modal parameters from AVT and structural responses from the shake table test confirmed that the FE model adequately captures the structural behavior of the line trap.
Despite close agreement between the FE model and experimental data, differences remained in modal parameters, accelerations, and displacement response. To mitigate this, the actual ground motion from the shake table and experimentally obtained damping ratio were incorporated into the FE model. However, these adjustments could not fully eliminate inconsistencies, which were attributed to approximations in material and connection modeling. Achieving improved consistency would require comprehensive experimental investigations into material and connection. These were not performed within the scope of the current study, and their potential effects are discussed in detail in Section 5.
To examine the influence of damping on the numerical results, additional analyses were performed by varying the damping ratio between 1% and 5%. The maximum displacement responses of the line trap were obtained as 102.10 mm, 77.75 mm, 62.83 mm, 51.53 mm, and 43.53 mm for damping ratios of 1%, 2%, 3%, 4%, and 5%, respectively. These findings confirm that increasing damping reduces displacement demands, as expected, while the overall behavioral trend of the system remained consistent. Accordingly, the experimentally obtained damping ratio of approximately 2% was considered a reasonable value for the analysis, although it is acknowledged that damping remains a critical parameter and further studies could investigate its variation under different excitation levels.

4.2. Selection of Ground Motions

To examine the seismic response of substation equipment subjected to near-fault and far-fault ground motions, time-history analyses were performed. Classification of these motion types has previously relied on predictive indicators such as the PGV/PGA ratio, velocity pulse period (Tp), and Joyner–Boore distance (Rjb) have been considered for the classification of near-fault and far-fault ground motions [53,54,55,56,57]. Additional selection metrics included magnitude, epicentral distance, closest distance from the recording site to the ruptured area, and shear wave velocity [58].
In this study, 9 near-fault and 9 far-fault ground motions recommended in FEMA P695 [59] were used (Table 4). These were sourced from the PEER strong motion database [60]. Selection was informed by FEMA’s criteria on magnitude, source characteristics, local site conditions, and rupture distance, as elaborated in Section A.7 of FEMA P695. Previous studies have emphasized that, for consistent comparison, near-fault and far-fault ground motion records must be scaled to an identical PGA level [53,56,61,62,63]. Without such scaling, variations in PGA introduce inconsistencies that obscure the comparative effects of near-fault and far-fault motions on the seismic responses of the structures. To mitigate such inconsistencies, all seismic records in this study were scaled to a uniform PGA of 0.40 g. Simultaneously, spectral shape compatibility was factored into the record selection process to minimize differences between near-fault and far-fault ground motions. The initial record set comprised 28 near-fault and 22 far-fault motions [59]. From this, nine motions from each group were selected such that the average response spectra showed strong alignment. This agreement is demonstrated in Figure 10, confirming the success of the selection criteria.

4.3. Dynamic Responses Under to Near-Fault and Far-Fault Ground Motions

To investigate the seismic response of the 170 kV line trap under near-fault and far-fault ground motions, dynamic analyses were conducted. The results, focused on key structural metrics such as displacement and acceleration, are presented in a comparative format. To simulate realistic excitation while preserving analytical clarity, the two horizontal components from each ground motion record (as detailed in Table 4) were applied concurrently. The vertical components were intentionally excluded to avoid interpretational complexity and ensure consistency across cases.
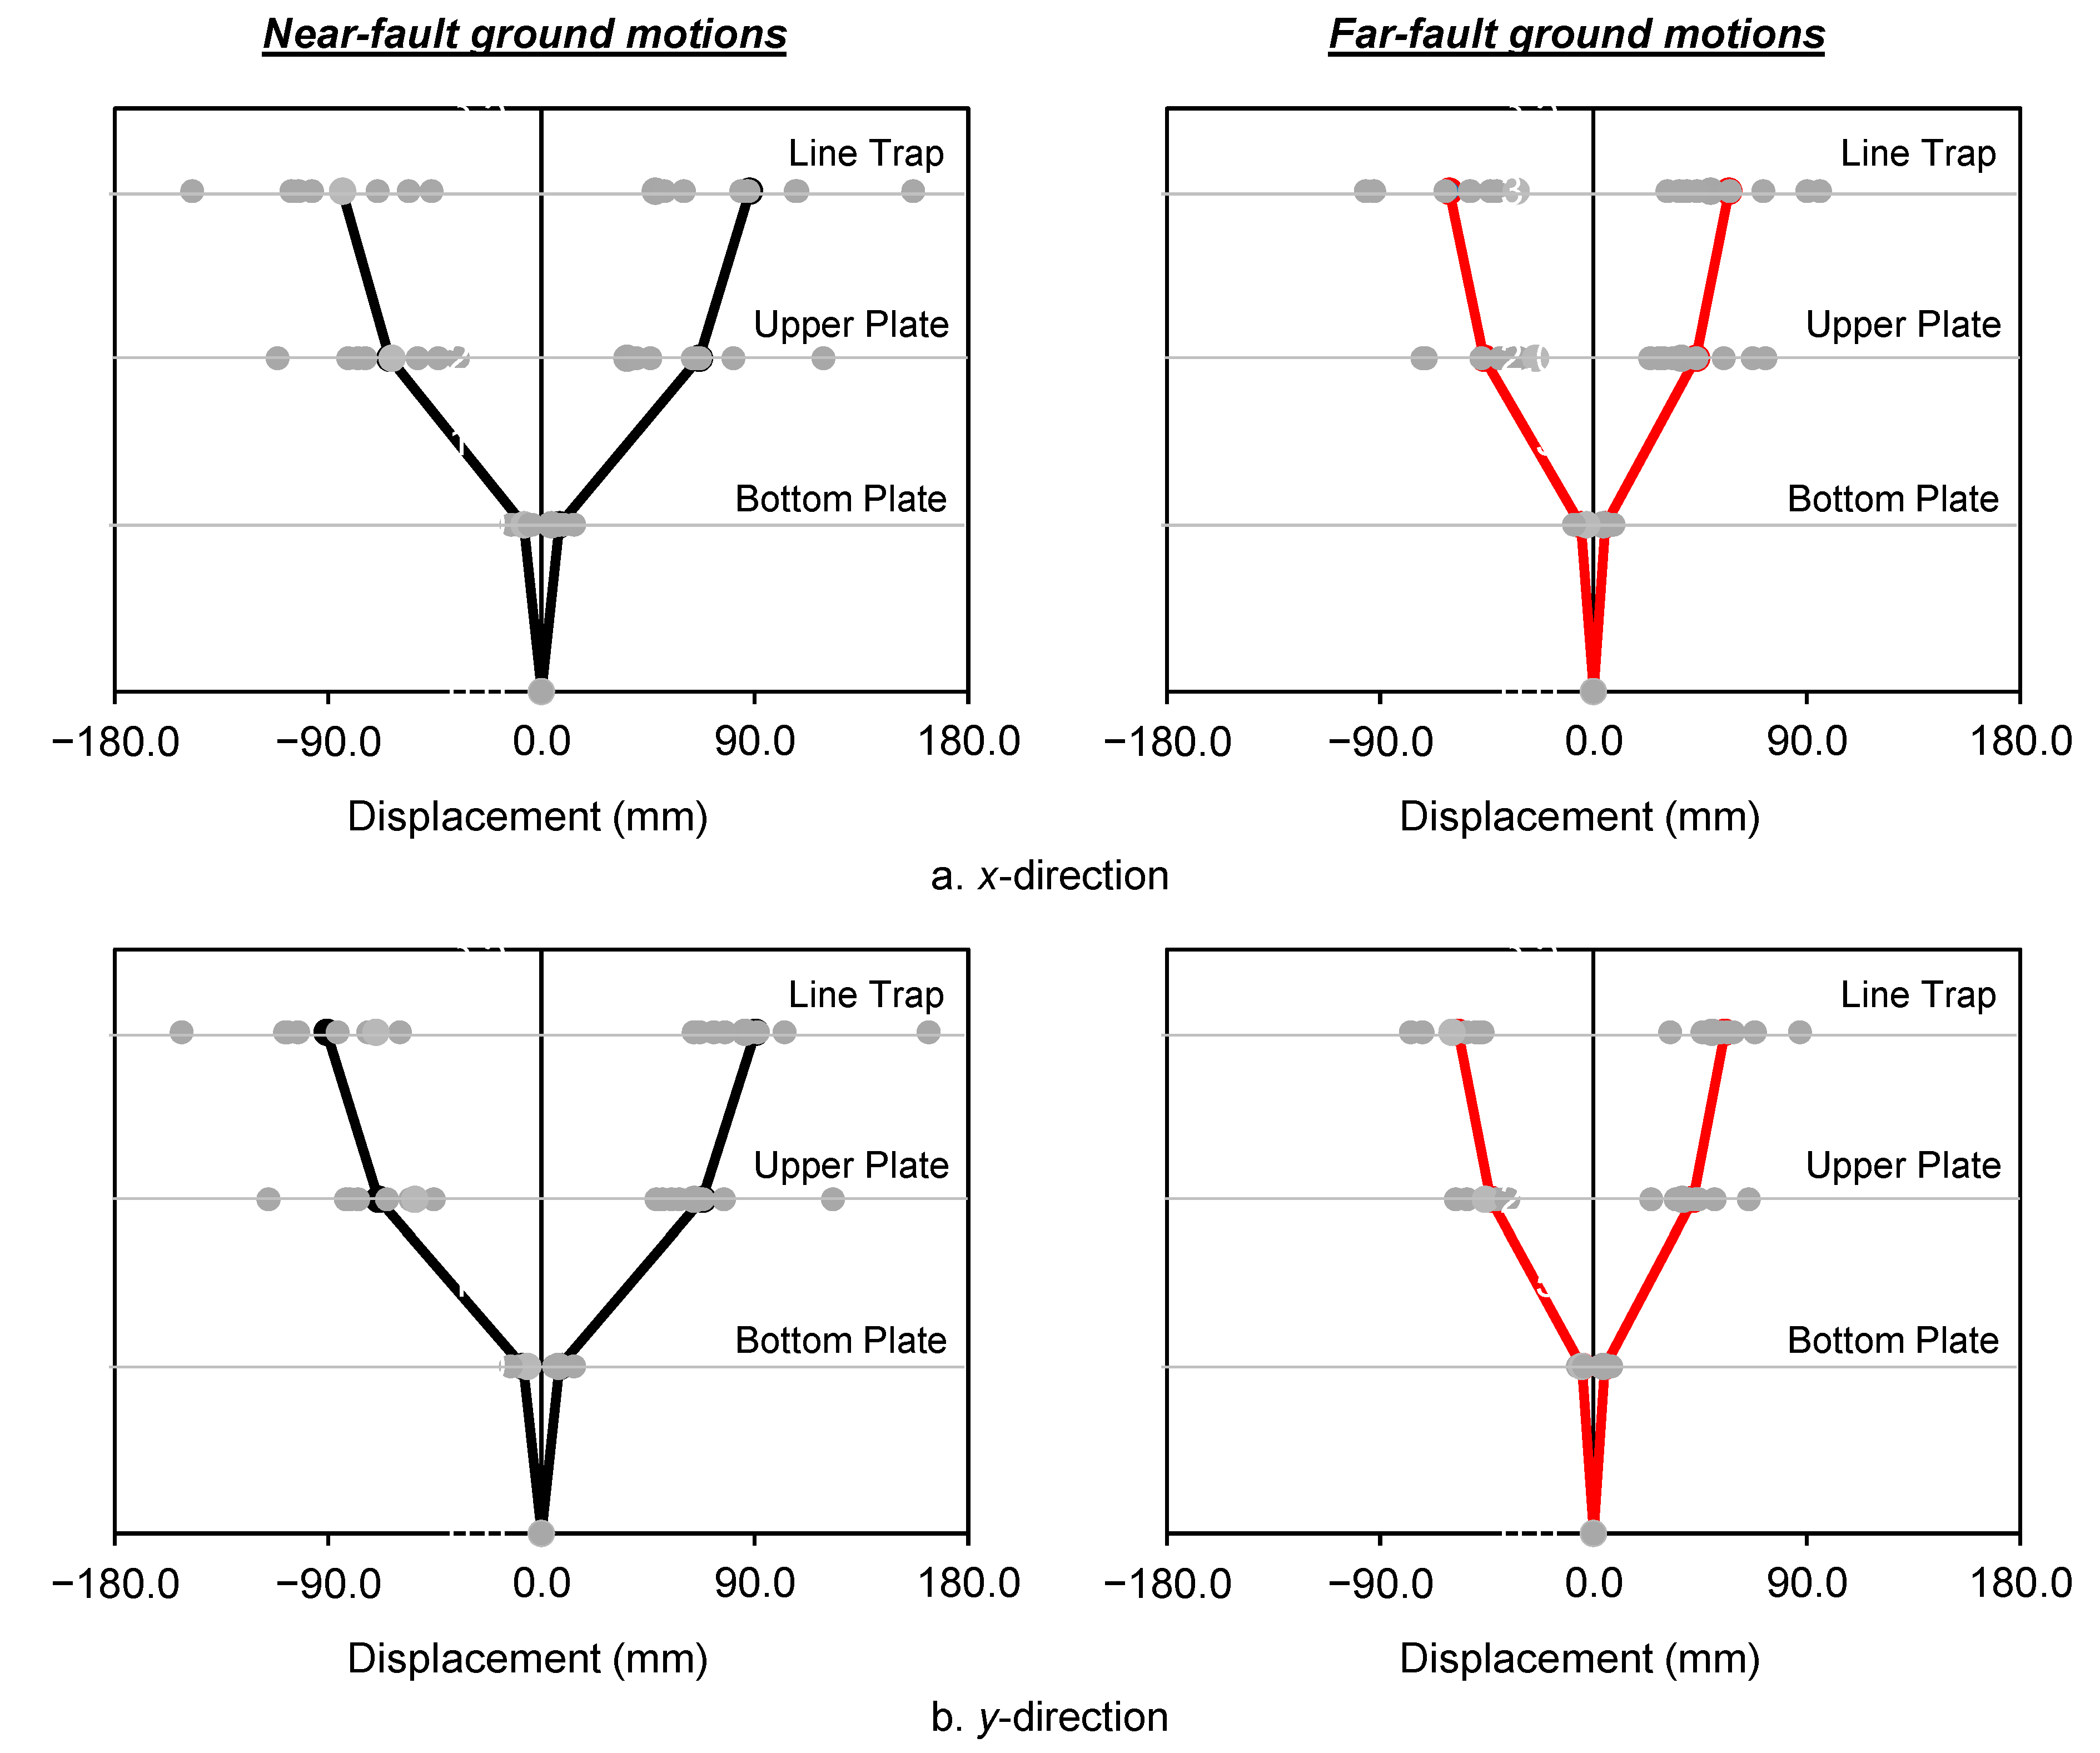
As shown in Figure 11, average peak displacements in the x-direction under near-fault ground motions reached 7.66 mm at the lower plate, 66.58 mm at the upper plate, and 87.84 mm at the line trap. Far-fault excitation resulted in reduced values of 5.311 mm, 46.11 mm, and 60.83 mm, respectively. In the y-direction, near-fault records produced displacements ranging from 7.67 mm to 90.54 mm, while far-fault ground motions resulted in displacements between 4.85 mm and 57.09 mm. This comparison indicates that near-fault motions increased average displacement by approximately 34% in the x-direction and 38% in the y-direction relative to far-fault loading.
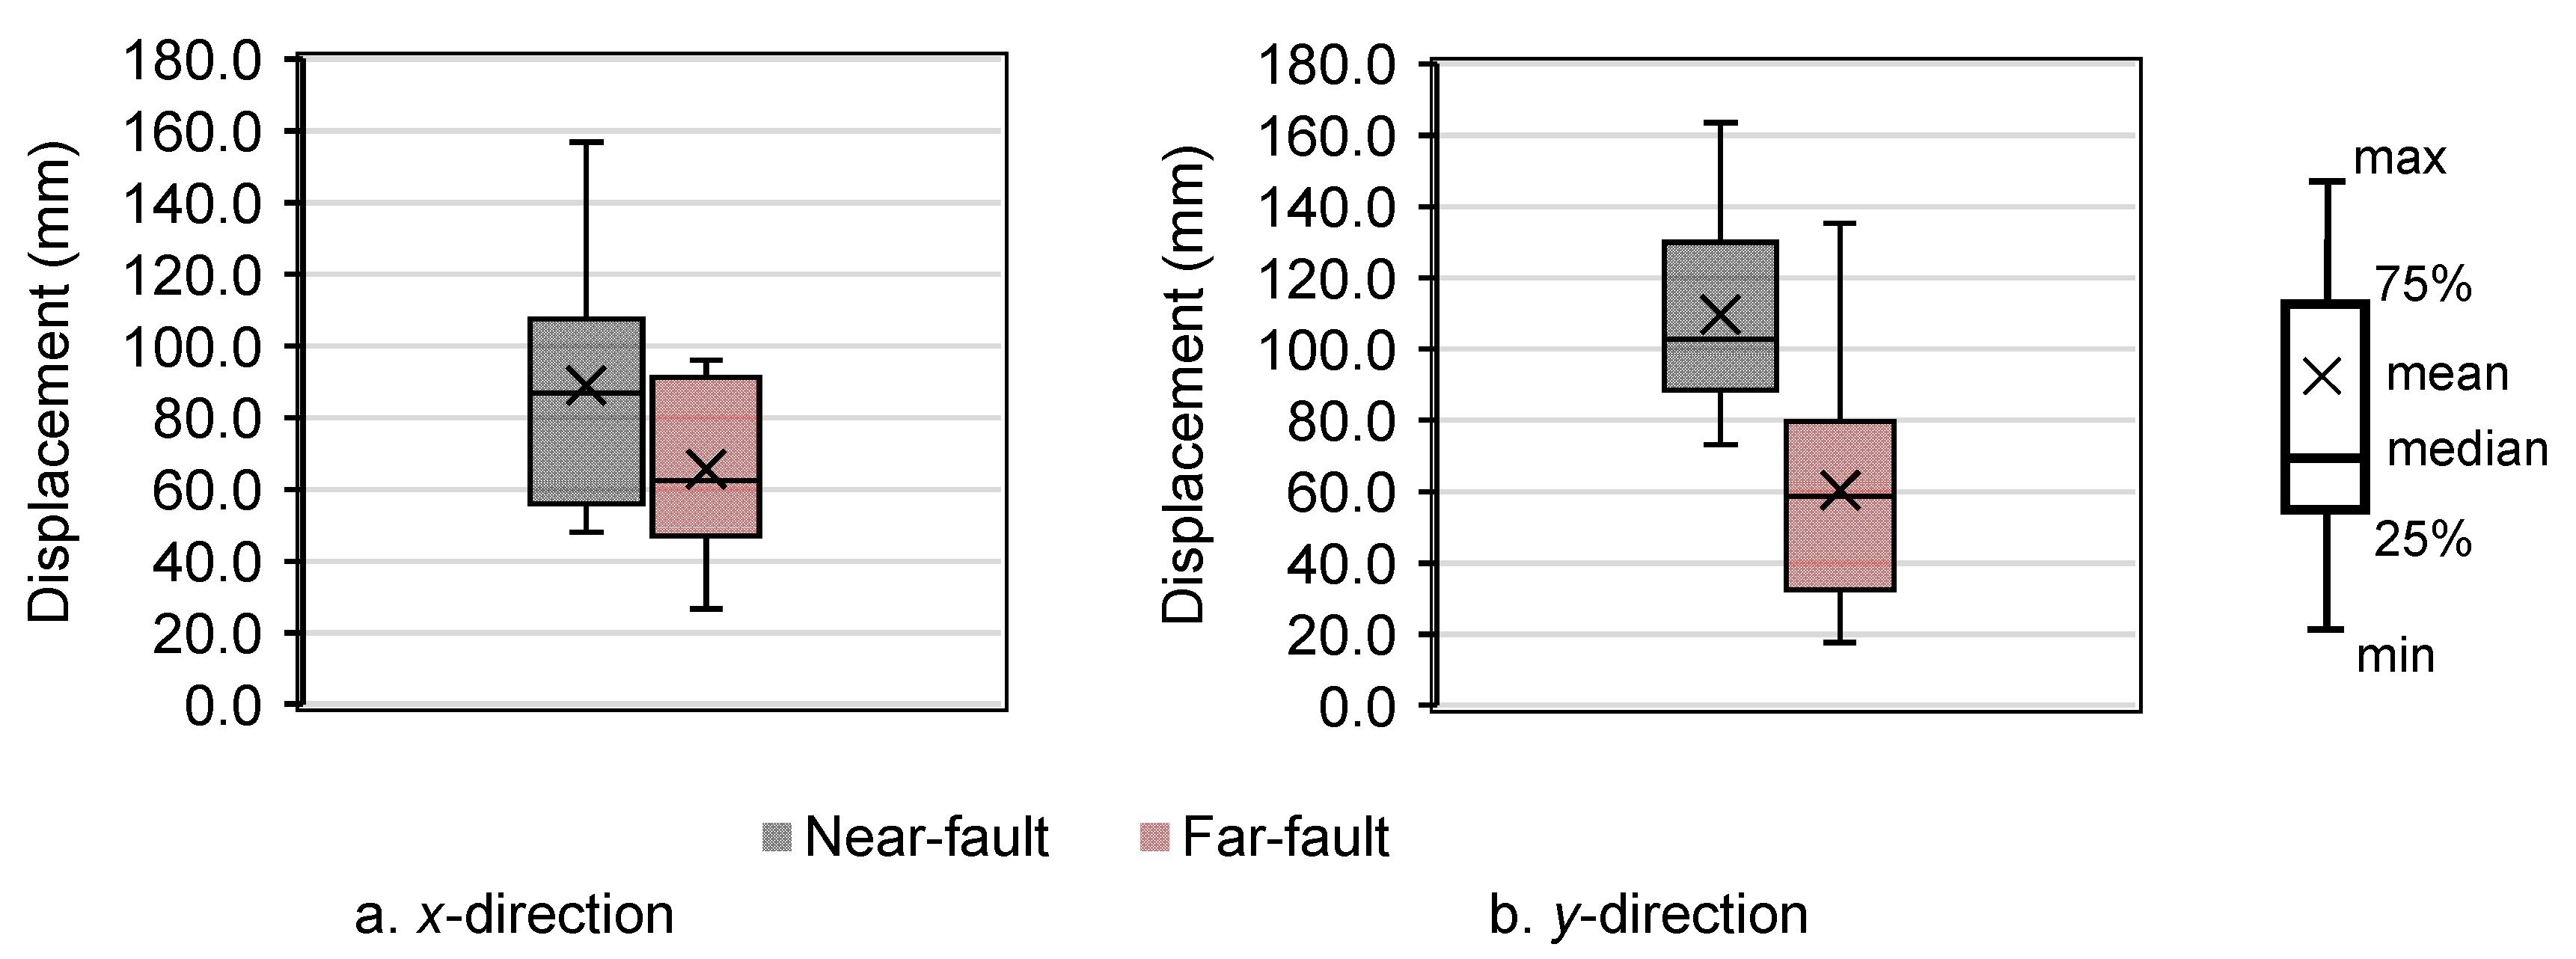
Figure 12 illustrates the boxplots of maximum displacements recorded at the line trap level along both orthogonal axes. The data clearly indicates that near-fault ground motions produced higher mean and median displacement values compared to far-fault excitations. Specifically, the mean displacement in the x-direction reached 88.89 mm for near-fault motions, whereas the corresponding value for far-fault events was 65.57 mm. In the y-direction, near-fault records produced a mean displacement of approximately 90 mm, compared to 60 mm for far-fault excitations. These trends suggest that near-fault dynamics impose more severe loading conditions on infrastructure. Nonetheless, it must be acknowledged that the ground motion dataset used in this study was relatively limited. For statistically robust conclusions, further studies involving larger sets of ground motion records are necessary.
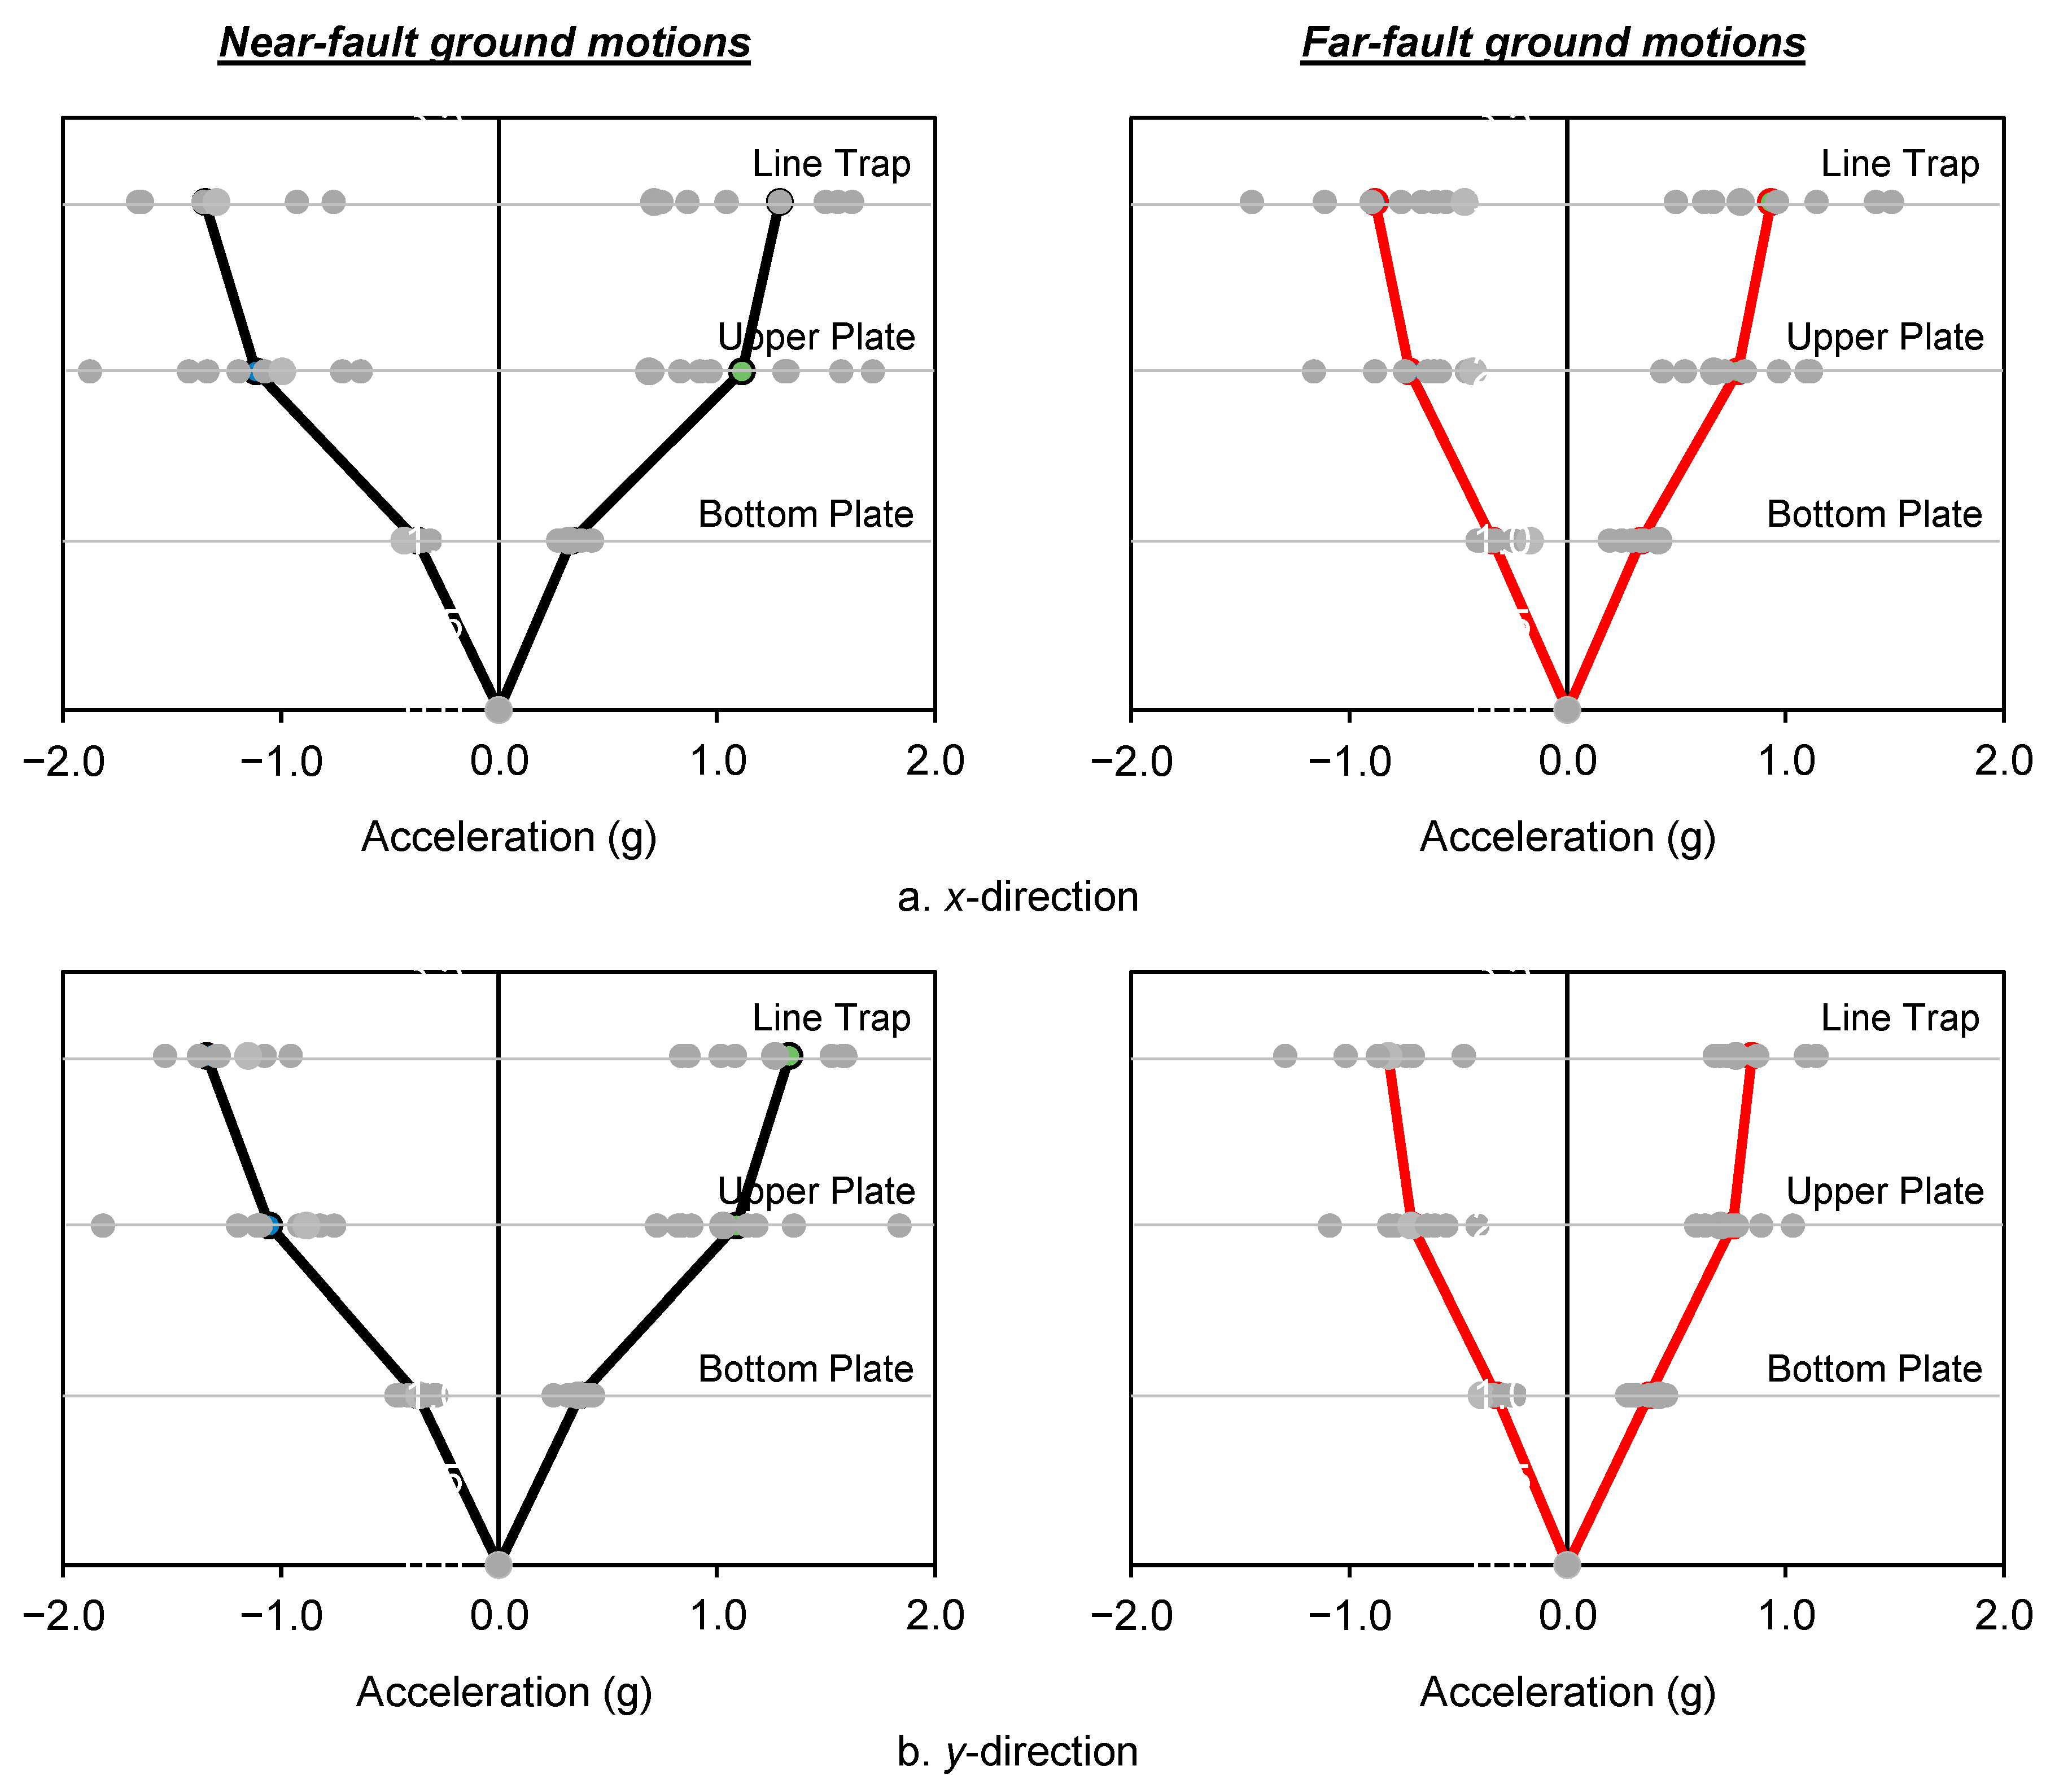
Figure 13 presents the maximum acceleration responses obtained from individual ground motion records, along with their averaged values in the two orthogonal directions. Under near-fault excitations, the mean of maximum accelerations in the x-direction reached 0.37 g at the bottom plate, 1.11 g at the upper plate, and 1.35 g at the line trap. In the case of far-fault ground motions, these values were 0.34 g, 0.78 g, and 0.93 g, respectively. In the y-direction, the mean accelerations ranged from 0.37 g to 1.34 g under near-fault inputs, while far-fault motions resulted in a narrower range of 0.37 g to 0.84 g. These outcomes reinforce earlier displacement findings, confirming that near-fault ground motions induce more critical dynamic responses in substation equipment. Nonetheless, to generalize the findings, a broader range of equipment types and larger ground motion records must be considered. Moreover, since electrical substation components are interconnected via cables, future studies should incorporate system-level analyses to capture interaction effects among the components, rather than evaluating them in isolation.
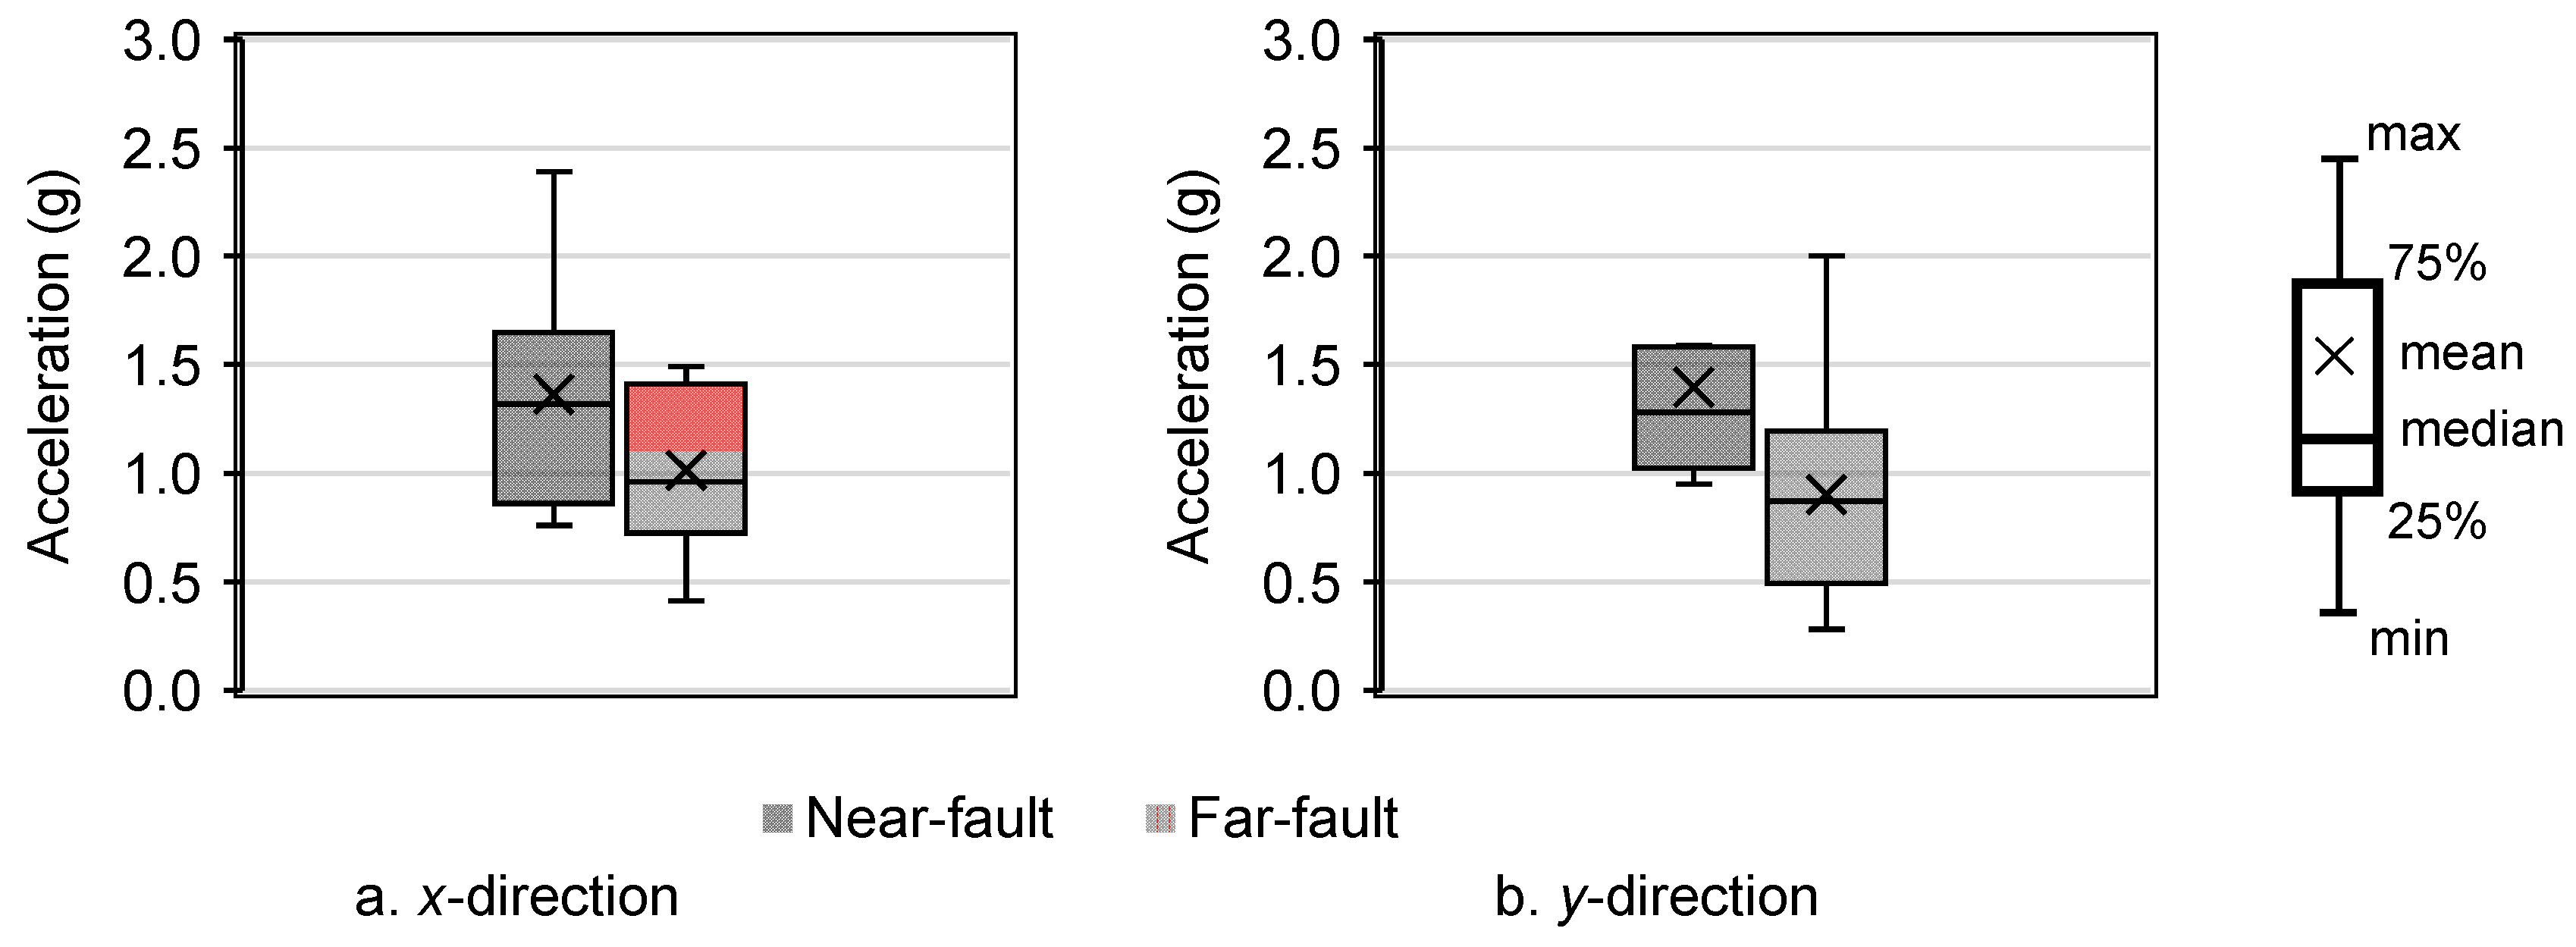
Figure 14 presents the boxplots of maximum accelerations at the line trap level under both near-fault and far-fault ground motions. Consistent with the displacement results, near-fault motions resulted in higher mean and median acceleration values compared to far-fault excitations. These findings suggest that near-fault ground motions impose more severe seismic demands, a critical factor in the performance assessment of substation equipment. Notably, near-fault records consistently yielded higher acceleration demands in both orthogonal directions, underscoring the significant role of near-fault effects in seismic evaluation of substation components.
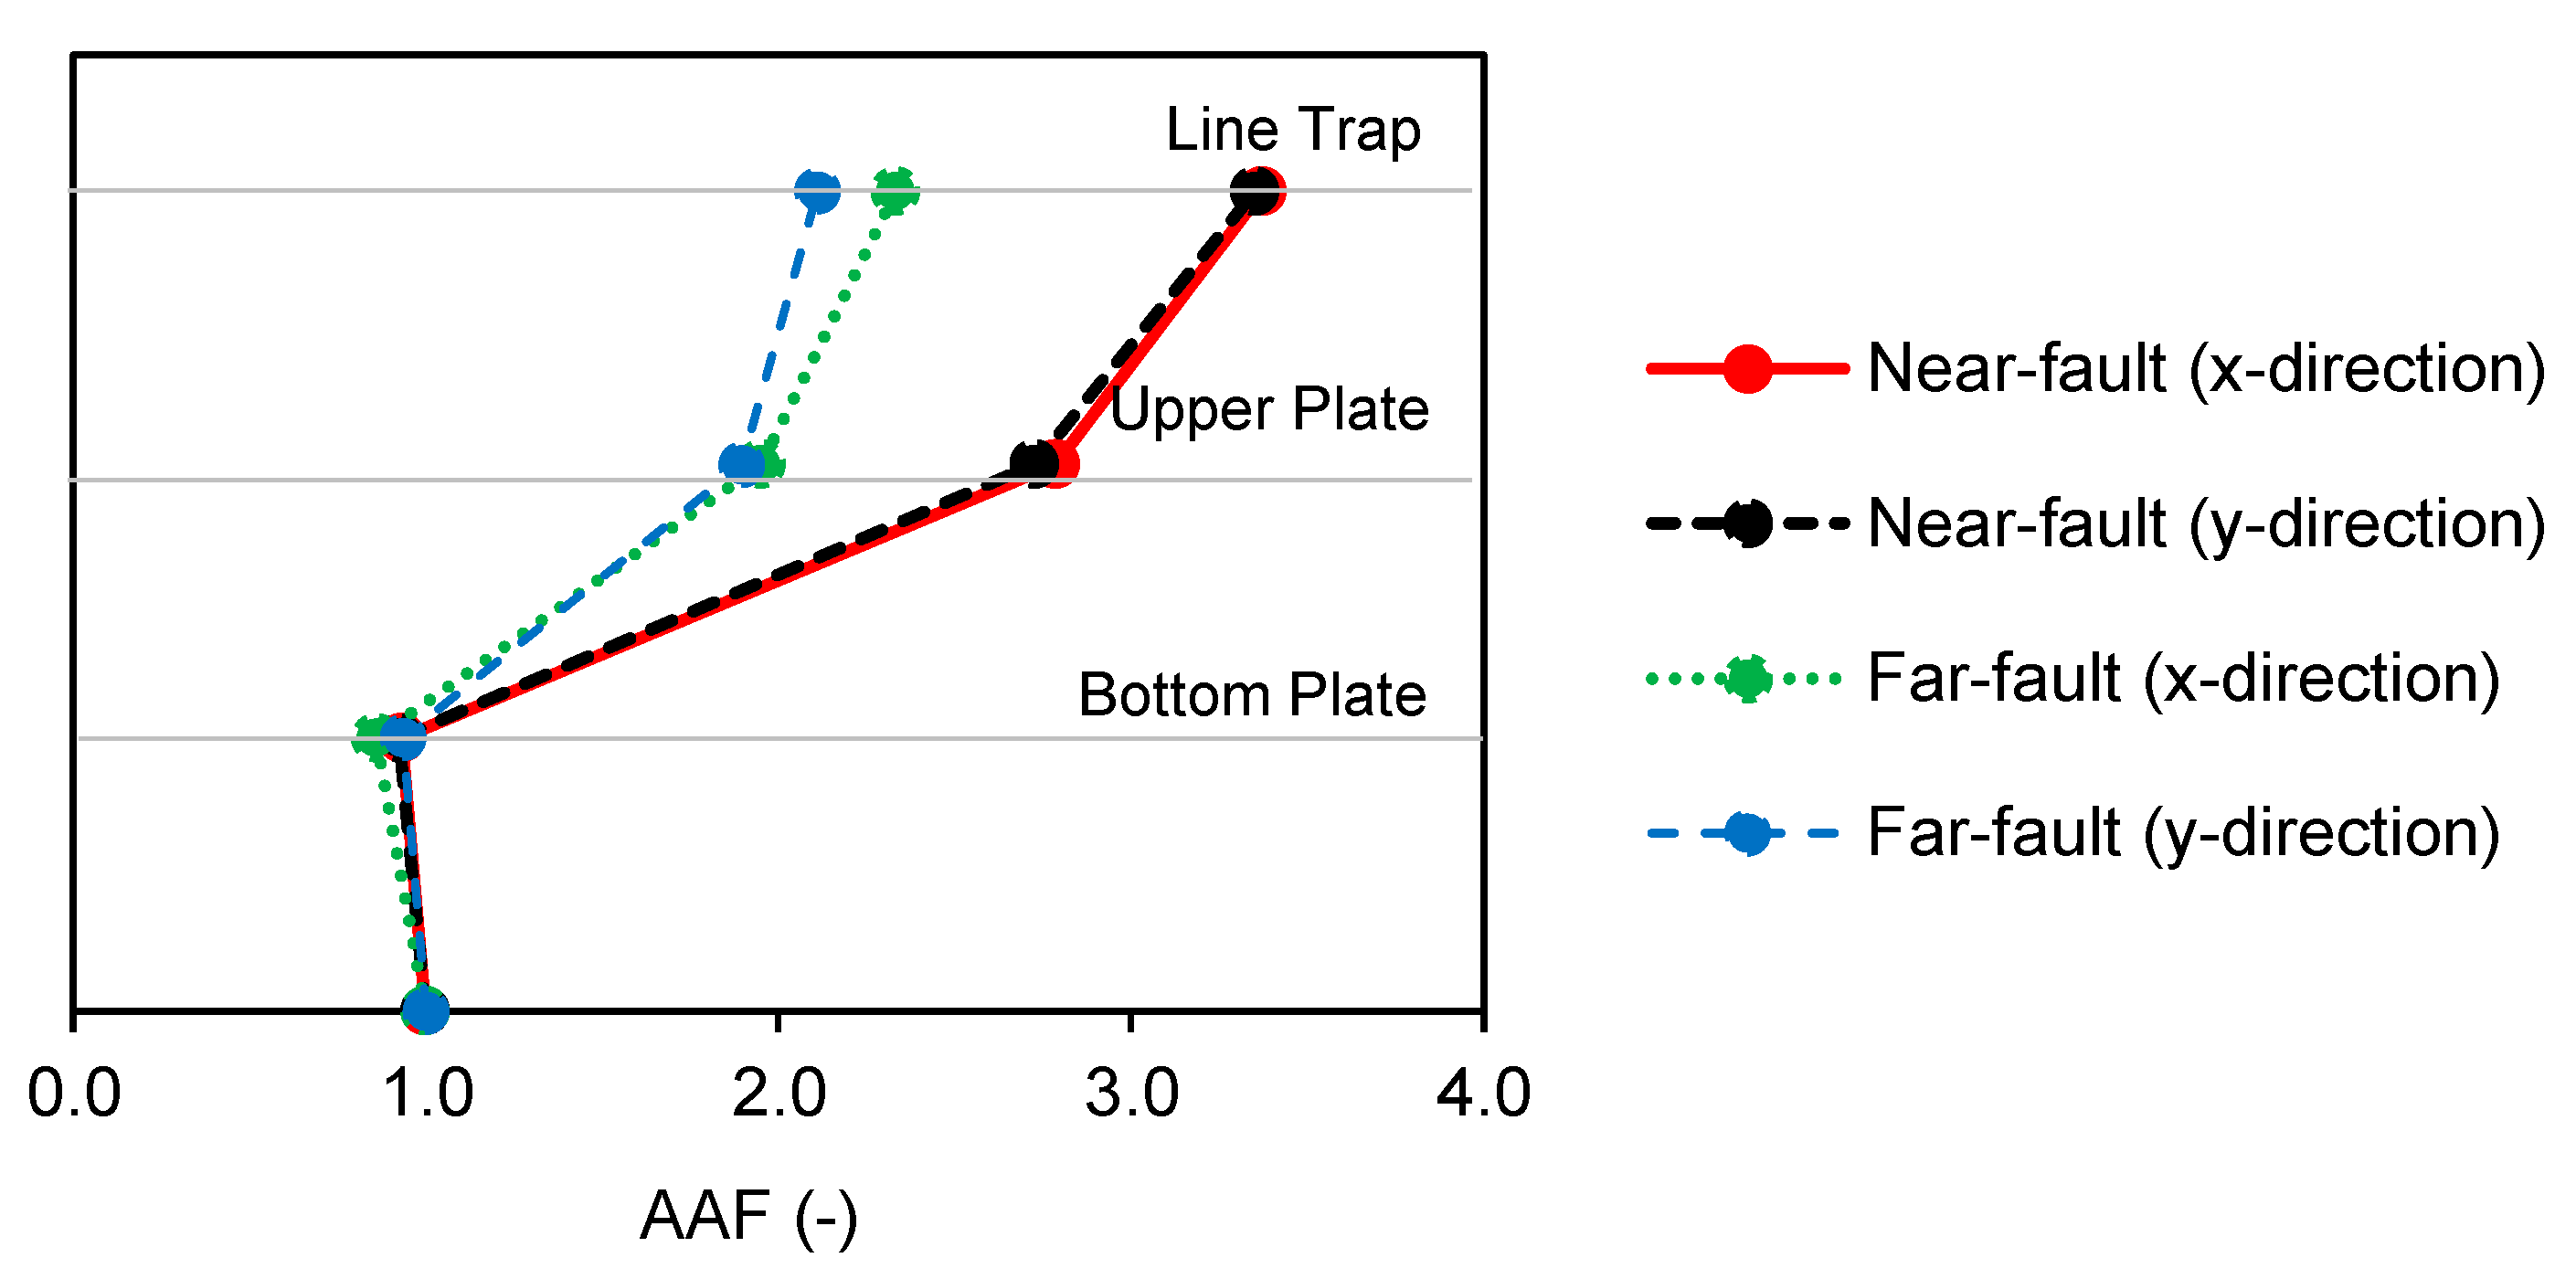
Figure 15 presents the variation in the acceleration amplification factor along the height of the line trap relative to the PGA of the input ground motions. The results demonstrate that near-fault ground motions induce significantly greater fluctuations in the acceleration response over the height of the line trap compared to far-fault excitations.
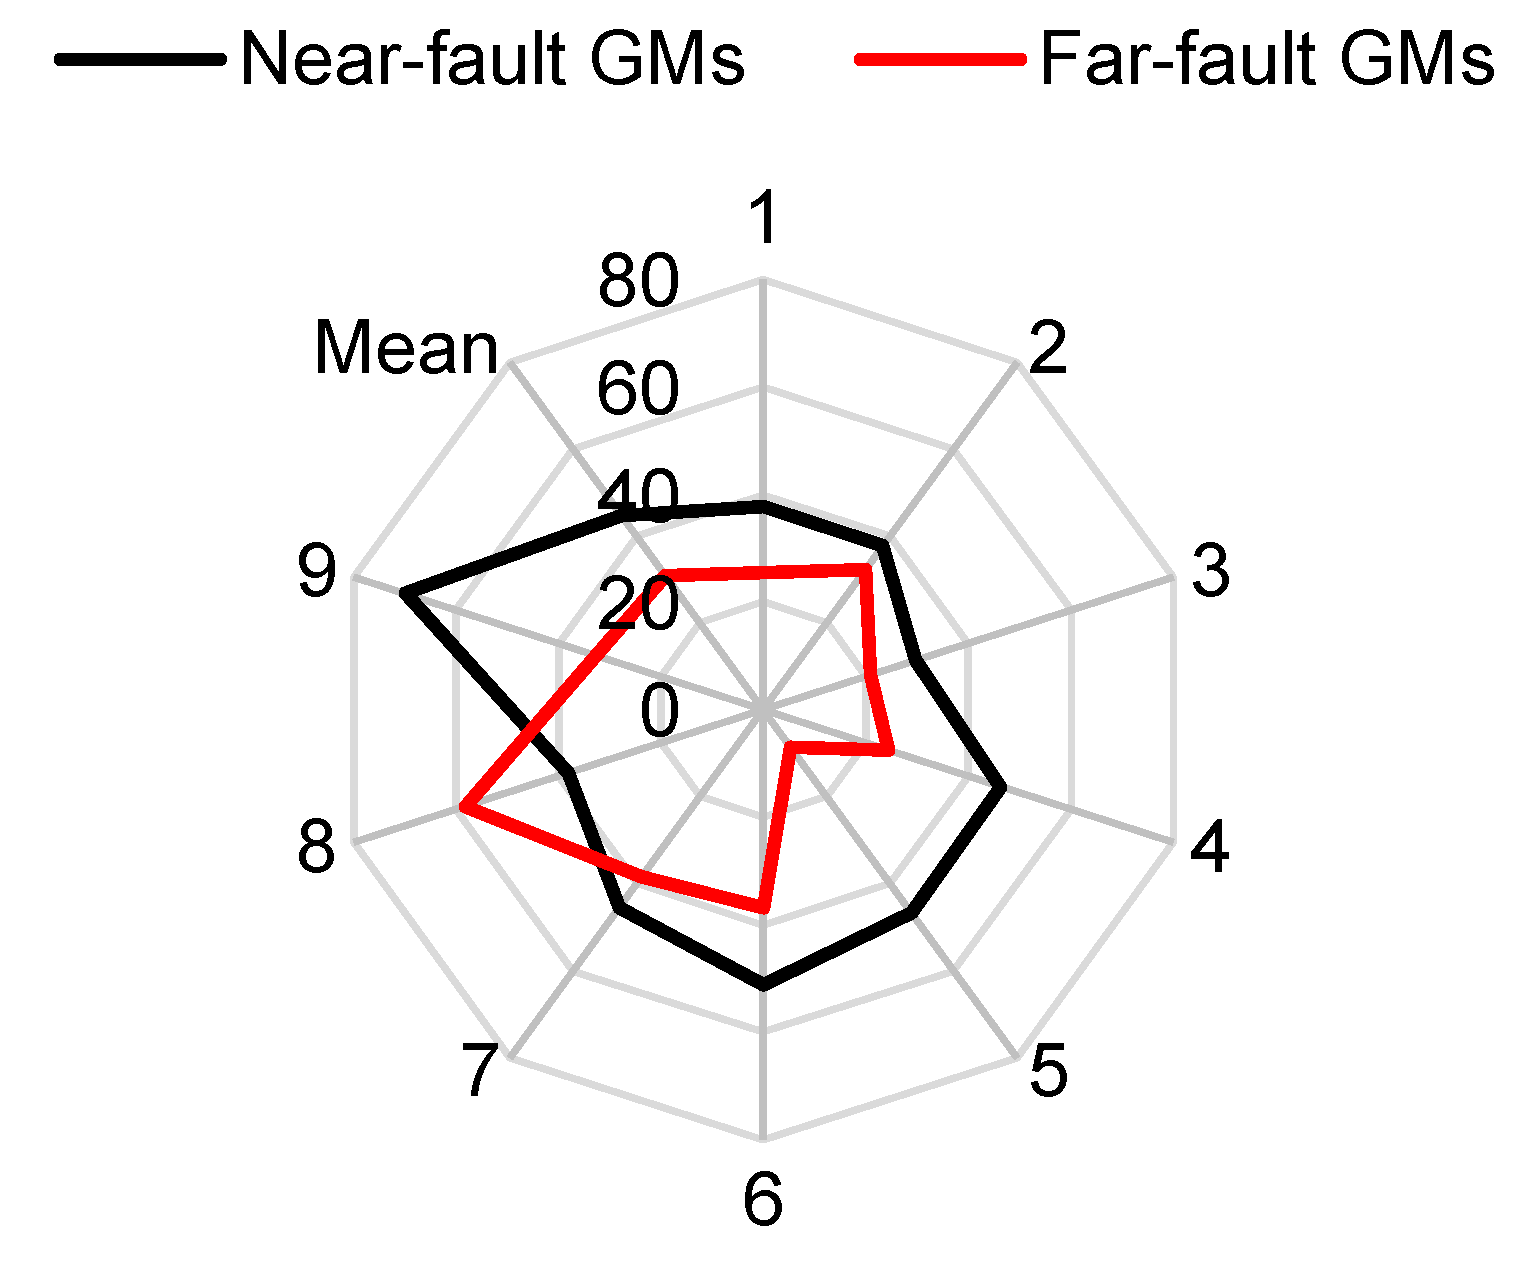
To further assess the seismic demand on the porcelain insulators, maximum stress values were determined under both near-fault and far-fault ground motions. Figure 16 presents the maximum stress values obtained from the selected ground motion records. The analysis revealed that near-fault records generally induced higher stress levels compared to far-fault motions. The mean stress value under near-fault excitation was 44.7 MPa, whereas the far-fault cases yielded a mean of 30.9 MPa. These results indicated that both groups of motions remained within the elastic range of the porcelain material and near-fault excitations tended to generate relatively higher stress demands on the insulators.
As a result of the analyses performed, it is observed that the structural responses of the selected line trap were significantly affected by the near-fault ground motions. Ground motions in the near-fault region, particularly those aligned with the rupture direction, exhibit characteristics that differ markedly from far-fault records observed at greater distances. Fault-normal components of near-fault motions often contain large displacements and velocity pulses, features generally absent in far-fault excitations. Due to these characteristics, near-fault ground motions introduce high input energy at the onset of shaking, typically resulting in substantial structural responses and potential damage. For this reason, their effects on civil engineering structures have attracted considerable research interest [53,56,61,62,63]. However, in the case of the structure addressed in this study, broad generalization of this conclusion requires analyses involving a much larger dataset. Notably, prior studies have also reported that far-fault ground motions may produce critical effects under certain conditions [58,64]. On the other hand, brittle materials can undergo significant property changes when exposed to extreme external actions [65,66], and they may develop sudden failure modes under seismic effects. Therefore, the intense energy input and velocity pulses characteristic of near-fault ground motions have the potential to exacerbate degradation mechanisms in brittle components such as porcelain insulators.

5. Limitations and Sources of Uncertainty

This analysis acknowledges limitations stemming from simplified assumptions in boundary condition and connection modeling, which influenced the accuracy of modal parameters and seismic response predictions. Although the FE model demonstrated strong consistency with experimentally obtained modal parameters, with errors remaining below 5% for three modes, a deviation of 8.44% was observed in the third natural frequency. This discrepancy is largely attributed to the limitations in modeling connections and boundary conditions, which directly influence the modal characteristics. Furthermore, such uncertainties extend to the nonlinear seismic response under intense ground motion. Addressing these issues would necessitate experimental characterization of moment–curvature, shear behaviors of the connections, and integrating these data into the FE model, yet such tests exceeded the current scope. Although the steel and porcelain components used in the line trap are manufactured with high consistency, some degree of uncertainty remains in the assumed material properties. Prior studies have emphasized the value of experimental validation for finite element models through material testing [67,68,69]. Therefore, while such testing is deemed critical, it was not included in this investigation.
This work incorporated both PGA and spectral compatibility in ground motion selection and scaling. Nevertheless, alternative intensity measures, including PGV and spectral acceleration at the fundamental period (Sa(T1)), could serve as more targeted predictors for structural response in line trap systems. A notable limitation is the relatively small set of ground motion records used in the nonlinear dynamic analysis. Broader generalization and accurate seismic fragility evaluation, particularly under near- and far-fault excitations, requires fragility assessments based on substantially larger datasets.
While this study contributes experimental and numerical data regarding the seismic response of a 170 kV line trap, its scope is limited to a single component assessed under controlled laboratory conditions. However, actual substations consist of interconnected elements, often linked via cables, forming a dynamically coupled system. Within such systems, the behavior of one component may alter or be altered by adjacent elements, resulting in modified boundary conditions, redistributed seismic demands, and potential amplification or suppression of dynamic responses. The objective of the present experimental setup was to establish the fundamental response characteristics of the line trap and to provide a validated reference model. However, this situation excluded the effects of coupled vibrations and cable forces arising from the integrated substation system. As a result, the findings reported here should be interpreted as representative of the stand-alone seismic behavior of the line trap, rather than the complete substation assembly. Therefore, the outcomes must be interpreted within the context of isolated component behavior. To enhance real-world applicability, future investigations should incorporate system-level modeling and, where possible, physical testing of interconnected substation assemblies.

6. Conclusions

This research undertook an integrated experimental and numerical assessment of the seismic response of a 170 kV line trap using AVTs, shake table experiments, and calibrated FE modeling, with a specific focus on the differential impact of near-fault versus far-fault ground motions. The experimental program identified the fundamental modal properties of the line trap and confirmed the reliability of the FE model. The recorded responses under sinusoidal excitation demonstrated a pronounced amplification effect along the height of the equipment, with accelerations at the top exceeding four times those at the base. This highlights the dynamic sensitivity of slender substation components with high centers of gravity. The FE model reproduced modal frequencies and seismic responses with reasonable accuracy, although some discrepancies were observed in higher modes. This situation was attributed to the assumptions made during modeling and emphasized the critical importance of connection modeling in this type of structure.
Dynamic analyses under recorded ground motions indicated that near-fault ground motions imposed substantially higher demands on the line trap compared to far-fault motions, with displacement and acceleration magnitudes increasing by approximately 30–40%. This amplification is attributed to the elevated input energy typically associated with near-fault seismic records. Such findings underscore the necessity of incorporating ground motion characteristics in seismic design frameworks for substation components.
Overall, this work provided one of the first full-scale shake table tests of a line trap, validating numerical models with empirical data. Amplification of the seismic response along the vertical axis was clearly quantified, revealing the inherent vulnerability of tall, slender substation devices. Comparative analysis of near- and far-fault excitation effects further highlights the imperative for context-specific design strategies. From an engineering perspective, the results emphasize that seismic assessment of substation equipment should account for ground motion characteristics. Future studies should expand the database of input motions, conduct fragility assessments, and examine system-level interdependencies, as component-level analysis may not fully capture substation behavior.

Funding

This research received no external funding.

Data Availability Statement

All experimental and processed data, including modal parameters and FE input files, that support the findings of this study are owned by TEİAŞ. These data can be made available to qualified researchers upon reasonable request and with prior written approval from TEİAŞ.

Acknowledgments

The author gratefully acknowledges the researchers of the Department of Civil Engineering, Earthquake and Structural Health Monitoring Laboratory at Karadeniz Technical University for their contributions. The author also wish to thank Ömer Baydilli, Halit Utku Can and Kemal Refik Ertabak from the General Directorate of Turkish Electricity Transmission Corporation (TEİAŞ) for their support the experimental campaign.

Conflicts of Interest

The author declares that they have no known competing financial interests or personal relationships that could have appeared to influence the work reported in this paper.

References

  1. Stearns, C.C.; Filiatrault, A. Electrical Substation Equipment Interaction: Experimental Rigid Conductor Studies; Pacific Earthquake Engineering Research Center: Berkeley, CA, USA, 2005. [Google Scholar]
  2. Sezen, H.; Whittaker, A.S. Seismic performance of industrial facilities affected by the 1999 Turkey earthquake. J. Perform. Constr. Facil. 2006, 20, 28–36. [Google Scholar] [CrossRef]
  3. Ma, G.L.; Xie, Q. Seismic analysis of a 500-kV power transformer of the type damaged in the 2008 Wenchuan earthquake. J. Perform. Constr. Facil. 2018, 32, 04018007. [Google Scholar] [CrossRef]
  4. Liu, R.; Zhang, M.; Wu, Y. Vulnerability study of electric power grid in different intensity area in Wenchuan earthquake. In Proceedings of the 15th World Conference of Earthquake Engineering (WCEE), Lisboa, Portugal, 24–28 September 2012. [Google Scholar]
  5. Schiff, A.J. Guide to Improved Earthquake Performance of Electric Power Systems; National Institute of Standards and Technology, Building and Fire Research Laboratory: Gaithersburg, MD, USA, 1998. [Google Scholar]
  6. Ashrafi, S.A.H.N. Issues of Seismic Response and Retrofit for Critical Substation Equipment. Doctoral Dissertation, New Jersey Institute of Technology, Newark, NJ, USA, 2003. [Google Scholar]
  7. Wang, M.; He, J. Shake table test and finite element model for evaluating seismic performance of 220 kV transformer-bushing systems. Earthq. Spectra 2023, 39, 1755–1778. [Google Scholar] [CrossRef]
  8. Wilcoski, J.; Smith, S.J. Fragility Testing of a Power Transformer Bushing; USA-CERL Technical Report 97/57; US Army Corps of Engineers, Construction Engineering Research Laboratories: Champaign, IL, USA, 1997. [Google Scholar]
  9. Ersoy, S.; Saadeghvaziri, M.A. Seismic response of transformer-bushing systems. IEEE Trans. Power Deliv. 2004, 19, 131–137. [Google Scholar] [CrossRef]
  10. Whittaker, A.S.; Fenves, G.L.; Gilani, A.S. Earthquake performance of porcelain transformer bushings. Earthq. Spectra 2004, 20, 205–223. [Google Scholar] [CrossRef]
  11. Filiatrault, A.; Matt, H. Experimental seismic response of high-voltage transformer-bushing systems. Earthq. Spectra 2005, 21, 1009–1025. [Google Scholar] [CrossRef]
  12. Filiatrault, A.; Matt, H. Seismic response of high voltage electrical transformer–bushing systems. J. Struct. Eng. 2006, 132, 287–295. [Google Scholar] [CrossRef]
  13. Koliou, M.; Filiatrault, A.; Reinhorn, A.M. Seismic response of high-voltage transformer-bushing systems incorporating flexural stiffeners II: Experimental study. Earthq. Spectra 2013, 29, 1353–1367. [Google Scholar] [CrossRef]
  14. Mosalam, K.M.; Günay, S.; Takhirov, S. Response evaluation of interconnected electrical substation equipment using real-time hybrid simulation on multiple shaking tables. Earthq. Eng. Struct. Dyn. 2016, 45, 2389–2404. [Google Scholar] [CrossRef]
  15. Zareei, S.A.; Hosseini, M.; Ghafory-Ashtiany, M. Evaluation of power substation equipment seismic vulnerability by multivariate fragility analysis: A case study on a 420 kV circuit breaker. Soil Dyn. Earthq. Eng. 2017, 92, 79–94. [Google Scholar] [CrossRef]
  16. Wen, J.; Xie, Q. Seismic evaluation of ±800 kV UHVDC disconnect switch by shake table test. J. Eng. 2019, 2019, 2772–2776. [Google Scholar] [CrossRef]
  17. Cavalieri, F.; Donelli, G.; Pinho, R.; Dacarro, F.; Bernardo, N.; de Nigris, M. Shake table testing of voltage and current transformers and numerical derivation of corresponding fragility curves. Infrastructures 2022, 7, 171. [Google Scholar] [CrossRef]
  18. Tian, L.; Gai, X.; Qu, B. Shake table tests of steel towers supporting extremely long-span electricity transmission lines under spatially correlated ground motions. Eng. Struct. 2017, 132, 791–807. [Google Scholar] [CrossRef]
  19. Tian, L.; Yang, M.; Liu, J.; Ma, Z.; Gong, J.; Chen, H.; Luo, X. Shake table test and seismic fragility analysis of transmission tower-line system considering duration effect. Thin-Walled Struct. 2024, 197, 111584. [Google Scholar] [CrossRef]
  20. Günay, S.; Mosalam, K.; Takhirov, S. Real-time hybrid simulation in a shaking table configuration for parametric studies of high-voltage equipment and IEEE693 development. Nucl. Eng. Des. 2015, 295, 901–909. [Google Scholar] [CrossRef]
  21. Moustafa, M.A.; Mosalam, K.M. Structural performance of porcelain and polymer post insulators in high voltage electrical switches. J. Perform. Constr. Facil. 2016, 30, 04016002. [Google Scholar] [CrossRef]
  22. Ullah, N.; Ali, S.M.; Shahzad, R.; Khan, F. Seismic qualification and time history shake-table testing of high voltage surge arrester under seismic qualification level moderate. Cogent Eng. 2018, 5, 1431375. [Google Scholar] [CrossRef]
  23. Li, S.; Tsang, H.H.; Cheng, Y.; Lu, Z. Seismic testing and modeling of cylindrical electrical equipment with GFRP composite insulators. Compos. Struct. 2018, 194, 454–467. [Google Scholar] [CrossRef]
  24. Dinh, N.H.; Lee, S.J.; Kim, J.Y.; Choi, K.K. Study on seismic performance of a mold transformer through shaking table tests. Appl. Sci. 2020, 10, 361. [Google Scholar] [CrossRef]
  25. Li, H. Shaking Table Test on Seismic Performance of Combined High Voltage Circuit Breaker. In IOP Conference Series: Earth and Environmental Science; IOP Publishing: Bristol, UK, 2020; Volume 446, p. 042027. [Google Scholar]
  26. Wen, B.; Moustafa, M.A.; Junwu, D. Seismic fragilities of high-voltage substation disconnect switches. Earthq. Spectra 2019, 35, 1559–1582. [Google Scholar] [CrossRef]
  27. Cui, J.; Che, A.; Li, S.; Cheng, Y. A maximum-entropy-based multivariate seismic vulnerability analysis method for power facilities: A case study on a ±1100-kV dry type smoothing reactor. Eng. Fail. Anal. 2022, 142, 106740. [Google Scholar] [CrossRef]
  28. Cheng, Y.; Xue, Y.; Du, W.; Lu, Z. Experimental study on influence of soil–structure interaction on seismic performance of UHV transformer. J. Earthq. Eng. 2023, 27, 3024–3059. [Google Scholar] [CrossRef]
  29. Zhu, W.; Xie, Q.; Liu, X. Seismic failure risk analysis of ±800 kV coupling filter circuit considering material strength deviation. Structures 2023, 47, 1566–1578. [Google Scholar] [CrossRef]
  30. Alessandri, S.; Giannini, R.; Paolacci, F.; Malena, M. Seismic retrofitting of an HV circuit breaker using base isolation with wire ropes. Part 1: Preliminary tests and analyses. Eng. Struct. 2015, 98, 251–262. [Google Scholar] [CrossRef]
  31. Alessandri, S.; Giannini, R.; Paolacci, F.; Amoretti, M.; Freddo, A. Seismic retrofitting of an HV circuit breaker using base isolation with wire ropes. Part 2: Shaking-table test validation. Eng. Struct. 2015, 98, 263–274. [Google Scholar] [CrossRef]
  32. Cheng, Y.; Li, S.; Lu, Z.; Liu, Z.; Zhu, Z. Seismic risk mitigation of cylindrical electrical equipment with a novel isolation device. Soil Dyn. Earthq. Eng. 2018, 111, 41–52. [Google Scholar] [CrossRef]
  33. Lee, D.; Constantinou, M.C. Combined horizontal–vertical seismic isolation system for high-voltage–power transformers: Development, testing and validation. Bull. Earthq. Eng. 2018, 16, 4273–4296. [Google Scholar] [CrossRef]
  34. Karami-Mohammadi, R.; Mirtaheri, M.; Salkhordeh, M.; Mosaffa, E.; Mahdavi, G.; Hariri-Ardebili, M.A. Seismic mitigation of substation cable connected equipment using friction pendulum systems. Struct. Eng. Mech. 2019, 72, 785–796. [Google Scholar]
  35. Takhirov, S.; Kempner, L.; Riley, M.; Fujisaki, E.; Low, B. Seismic protection of high-voltage equipment by friction dampers: Numerical modelling correlated with full-scale component tests. In Proceedings of the COMPDYN-2019, 7th ECCOMAS Thematic Conference on Computational Methods in Structural Dynamics and Earthquake Engineering, Crete, Greece, 24–26 June 2019; pp. 24–26. [Google Scholar]
  36. Yang, Z.; Xie, Q.; He, C.; Xue, S. Numerical investigation of the seismic response of a UHV composite bypass switch retrofitted with wire rope isolators. Earthq. Eng. Eng. Vib. 2021, 20, 275–290. [Google Scholar] [CrossRef]
  37. Naeem, A.; Kim, J. Seismic retrofit of 3000 kVA power transformer using friction dampers and prestressed tendons. Structures 2021, 32, 641–650. [Google Scholar] [CrossRef]
  38. Zhang, R.; Cao, M.; Huang, J. Study on seismic response and parameter influence in a transformer–bushing with inerter isolation system. Buildings 2022, 12, 530. [Google Scholar] [CrossRef]
  39. Liu, Z.; Zhang, L.; Cheng, Y.; Lu, Z.; Zhu, Z. Seismic performance improvement using bolt-on isolators on interconnected slender electrical equipment. Eng. Struct. 2023, 289, 116238. [Google Scholar] [CrossRef]
  40. Li, X.; Li, Q.; Hu, Y.; Chen, Q.; Peng, J.; Xie, Y.; Wang, J. Study on three-dimensional dynamic stability of open-pit high slope under blasting vibration. Lithosphere 2022, 2021, 6426550. [Google Scholar] [CrossRef]
  41. Kaya, A.; Adanur, S.; Bello, R.A.; Genç, A.F.; Okur, F.Y.; Sunca, F.; Günaydın, M.; Altunışık, A.C.; Sevim, B. Post-earthquake damage assessments of unreinforced masonry (URM) buildings by shake table test and numerical visualization. Eng. Fail. Anal. 2023, 143, 106858. [Google Scholar] [CrossRef]
  42. Türkay, A. Determination of Dynamic Characteristics of Composite Cantilever Beams Using Experimental and Analytical Methods. Buildings 2025, 15, 1608. [Google Scholar] [CrossRef]
  43. Hüsem, M.; Nasery, M.M.; Okur, F.Y.; Altunişik, A.C. Experimental evaluation of damage effect on dynamic characteristics of concrete encased composite column-beam connections. Eng. Fail. Anal. 2018, 91, 129–150. [Google Scholar] [CrossRef]
  44. Jacobsen, N.J.; Andersen, P.; Brincker, R. Using enhanced frequency domain decomposition as a robust technique to harmonic excitation in operational modal analysis. In Proceedings of the ISMA2006: International Conference on Noise & Vibration Engineering, Leuven, Belgium, 18–20 September 2006. [Google Scholar]
  45. Bendat, J.S.; Piersol, A.G. Random Data: Analysis and Measurement Procedures, 3rd ed.; John Wiley and Sons: Hoboken, NJ, USA, 2004. [Google Scholar]
  46. Brincker, R.; Zhang, L.; Andersen, P. Modal identification from ambient responses using frequency domain decomposition. In Proceedings of the 18th International Modal Analysis Conference (IMAC), San Antonio, TX, USA, 7–10 February 2000. [Google Scholar]
  47. PULSE, version 7.1; PULSE Operational Modal Analysis Software; Structural Vibration Solution: Aalborg, Denmark, 2021.
  48. Wang, M.; Liu, K.; Guragain, R.; Shrestha, H.; Ma, X. Shake table tests on the two-storey dry-joint stone masonry structures reinforced with timber laces and steel wires. Bull. Earthq. Eng. 2019, 17, 2199–2218. [Google Scholar] [CrossRef]
  49. Tomassetti, U.; Correia, A.A.; Candeias, P.X.; Graziotti, F.; Campos Costa, A. Two-way bending out-of-plane collapse of a full-scale URM building tested on a shake table. Bull. Earthq. Eng. 2019, 17, 2165–2198. [Google Scholar] [CrossRef]
  50. Sunca, F.; Altunişik, A.C.; Kaya, A.; Genç, A.F.; Şahin, M.C.; Karahasan, A.K. Shake table tests on story-to-story pounding between adjacent RC buildings. Structures 2024, 69, 107544. [Google Scholar] [CrossRef]
  51. Mayorca, P.; Sathiparan, N.; Guragain, R.; Meguro, K. Comparison of the seismic performance of different strength masonry structures retrofitted with PP-band meshes. In Proceeding of the 5th International Symposium on New Technologies for Urban Safety of Mega Cities in Asia, Phuket, Thailand, 16–17 November 2006. [Google Scholar]
  52. Jeon, B.G.; Chang, S.J.; Kim, S.W.; Park, D.U.; Chun, N. Experimental study on the acceleration amplification ratio of cable terminations for electric power facilities. Energies 2024, 17, 5641. [Google Scholar] [CrossRef]
  53. Adanur, S.; Altunişik, A.C.; Bayraktar, A.; Akköse, M. Comparison of near-fault and far-fault ground motion effects on geometrically nonlinear earthquake behavior of suspension bridges. Nat. Hazards 2012, 64, 593–614. [Google Scholar] [CrossRef]
  54. Akköse, M.; Şimşek, E. Non-linear seismic response of concrete gravity dams to near-fault ground motions including dam-water-sediment-foundation interaction. Appl. Math. Model. 2010, 34, 3685–3700. [Google Scholar] [CrossRef]
  55. Davoodi, M.; Jafari, M.K.; Hadiani, N. Seismic response of embankment dams under near-fault and far-field ground motion excitation. Eng. Geol. 2013, 158, 66–76. [Google Scholar] [CrossRef]
  56. Güllü, H.; Karabekmez, M. Effect of near-fault and far-fault earthquakes on a historical masonry mosque through 3D dynamic soil-structure interaction. Eng. Struct. 2017, 152, 465–492. [Google Scholar] [CrossRef]
  57. Zhang, S.; Wang, G. Effects of near-fault and far-fault ground motions on nonlinear dynamic response and seismic damage of concrete gravity dams. Soil Dyn. Earthq. Eng. 2013, 53, 217–229. [Google Scholar] [CrossRef]
  58. Gong, J.; Yang, T.; Shao, Y.; Du, Y.; Chen, C.; Deng, L. Response and fragility of long-span truss structures in ultra-high voltage substation subjected to near-fault pulse-like and far-field ground motions. Structures 2024, 63, 106363. [Google Scholar] [CrossRef]
  59. FEMA P695. Quantification of Building Seismic Performance Factors; Federal Emergency Management Agency: Washington, DC, USA, 2009. [Google Scholar]
  60. PEER. Peer Strong Ground Motion Database. Available online: https://ngawest2.berkeley.edu/ (accessed on 4 June 2025).
  61. Bayraktar, A.; Altunişik, A.C.; Sevim, B.; Kartal, M.E.; Türker, T.; Bilici, Y. Comparison of near-and far-fault ground motion effect on the nonlinear response of dam–reservoir–foundation systems. Nonlinear Dyn. 2009, 58, 655–673. [Google Scholar] [CrossRef]
  62. Güllü, H.; Özel, F. Microtremor measurements and 3D dynamic soil–structure interaction analysis for a historical masonry arch bridge under the effects of near-and far-fault earthquakes. Environ. Earth Sci. 2020, 79, 338. [Google Scholar] [CrossRef]
  63. Altunişik, A.C.; Sunca, F.; Genç, A.F.; Tavşan, C. Post-earthquake damage assessments of historic mosques and effects of near-fault and far-fault ground motions on seismic responses. Int. J. Archit. Herit. 2023, 17, 1043–1078. [Google Scholar] [CrossRef]
  64. Altunışık, A.C.; Sunca, F.; Sevim, B. Modal parameter identification and seismic assessment of historical timber structures under near-fault and far-fault ground motions. Structures 2023, 47, 1624–1651. [Google Scholar] [CrossRef]
  65. Li, X.; Peng, J.; Xie, Y.; Li, Q.; Zhou, T.; Wang, J.; Zheng, W. Influence of high-temperature treatment on strength and failure behaviors of a quartz-rich sandstone under true triaxial condition. Lithosphere 2022, 2022, 3086647. [Google Scholar] [CrossRef]
  66. Altunışık, A.C.; Öztürk, M.M.; Genç, A.F.; Günaydin, M.; Kaya, A.; Akbulut, Y.E.; Sunca, F. Dynamic characteristics changes of masonry arches exposed to elevated temperature. Constr. Build. Mater. 2024, 418, 135423. [Google Scholar] [CrossRef]
  67. Gong, J.; Zhi, X.; Shang, W.; Fan, F. Shaking table test and numerical analysis of dynamic coupling effect between suspended system and OLF1000. Eng. Struct. 2020, 207, 110224. [Google Scholar] [CrossRef]
  68. Moustafa, M.A.; Mosalam, K.M. Finite element modeling and assessment of seismic response of electrical substations porcelain post insulators. Soil Dyn. Earthq. Eng. 2021, 150, 106895. [Google Scholar] [CrossRef]
  69. Li, Z.J.; Gong, J.; Shao, Y.B.; Huang, W.F.; Zhang, X. Axial compressive behaviors of multi-cavity concrete-filled double-skin tubular stub columns. J. Constr. Steel Res. 2024, 216, 108619. [Google Scholar] [CrossRef]
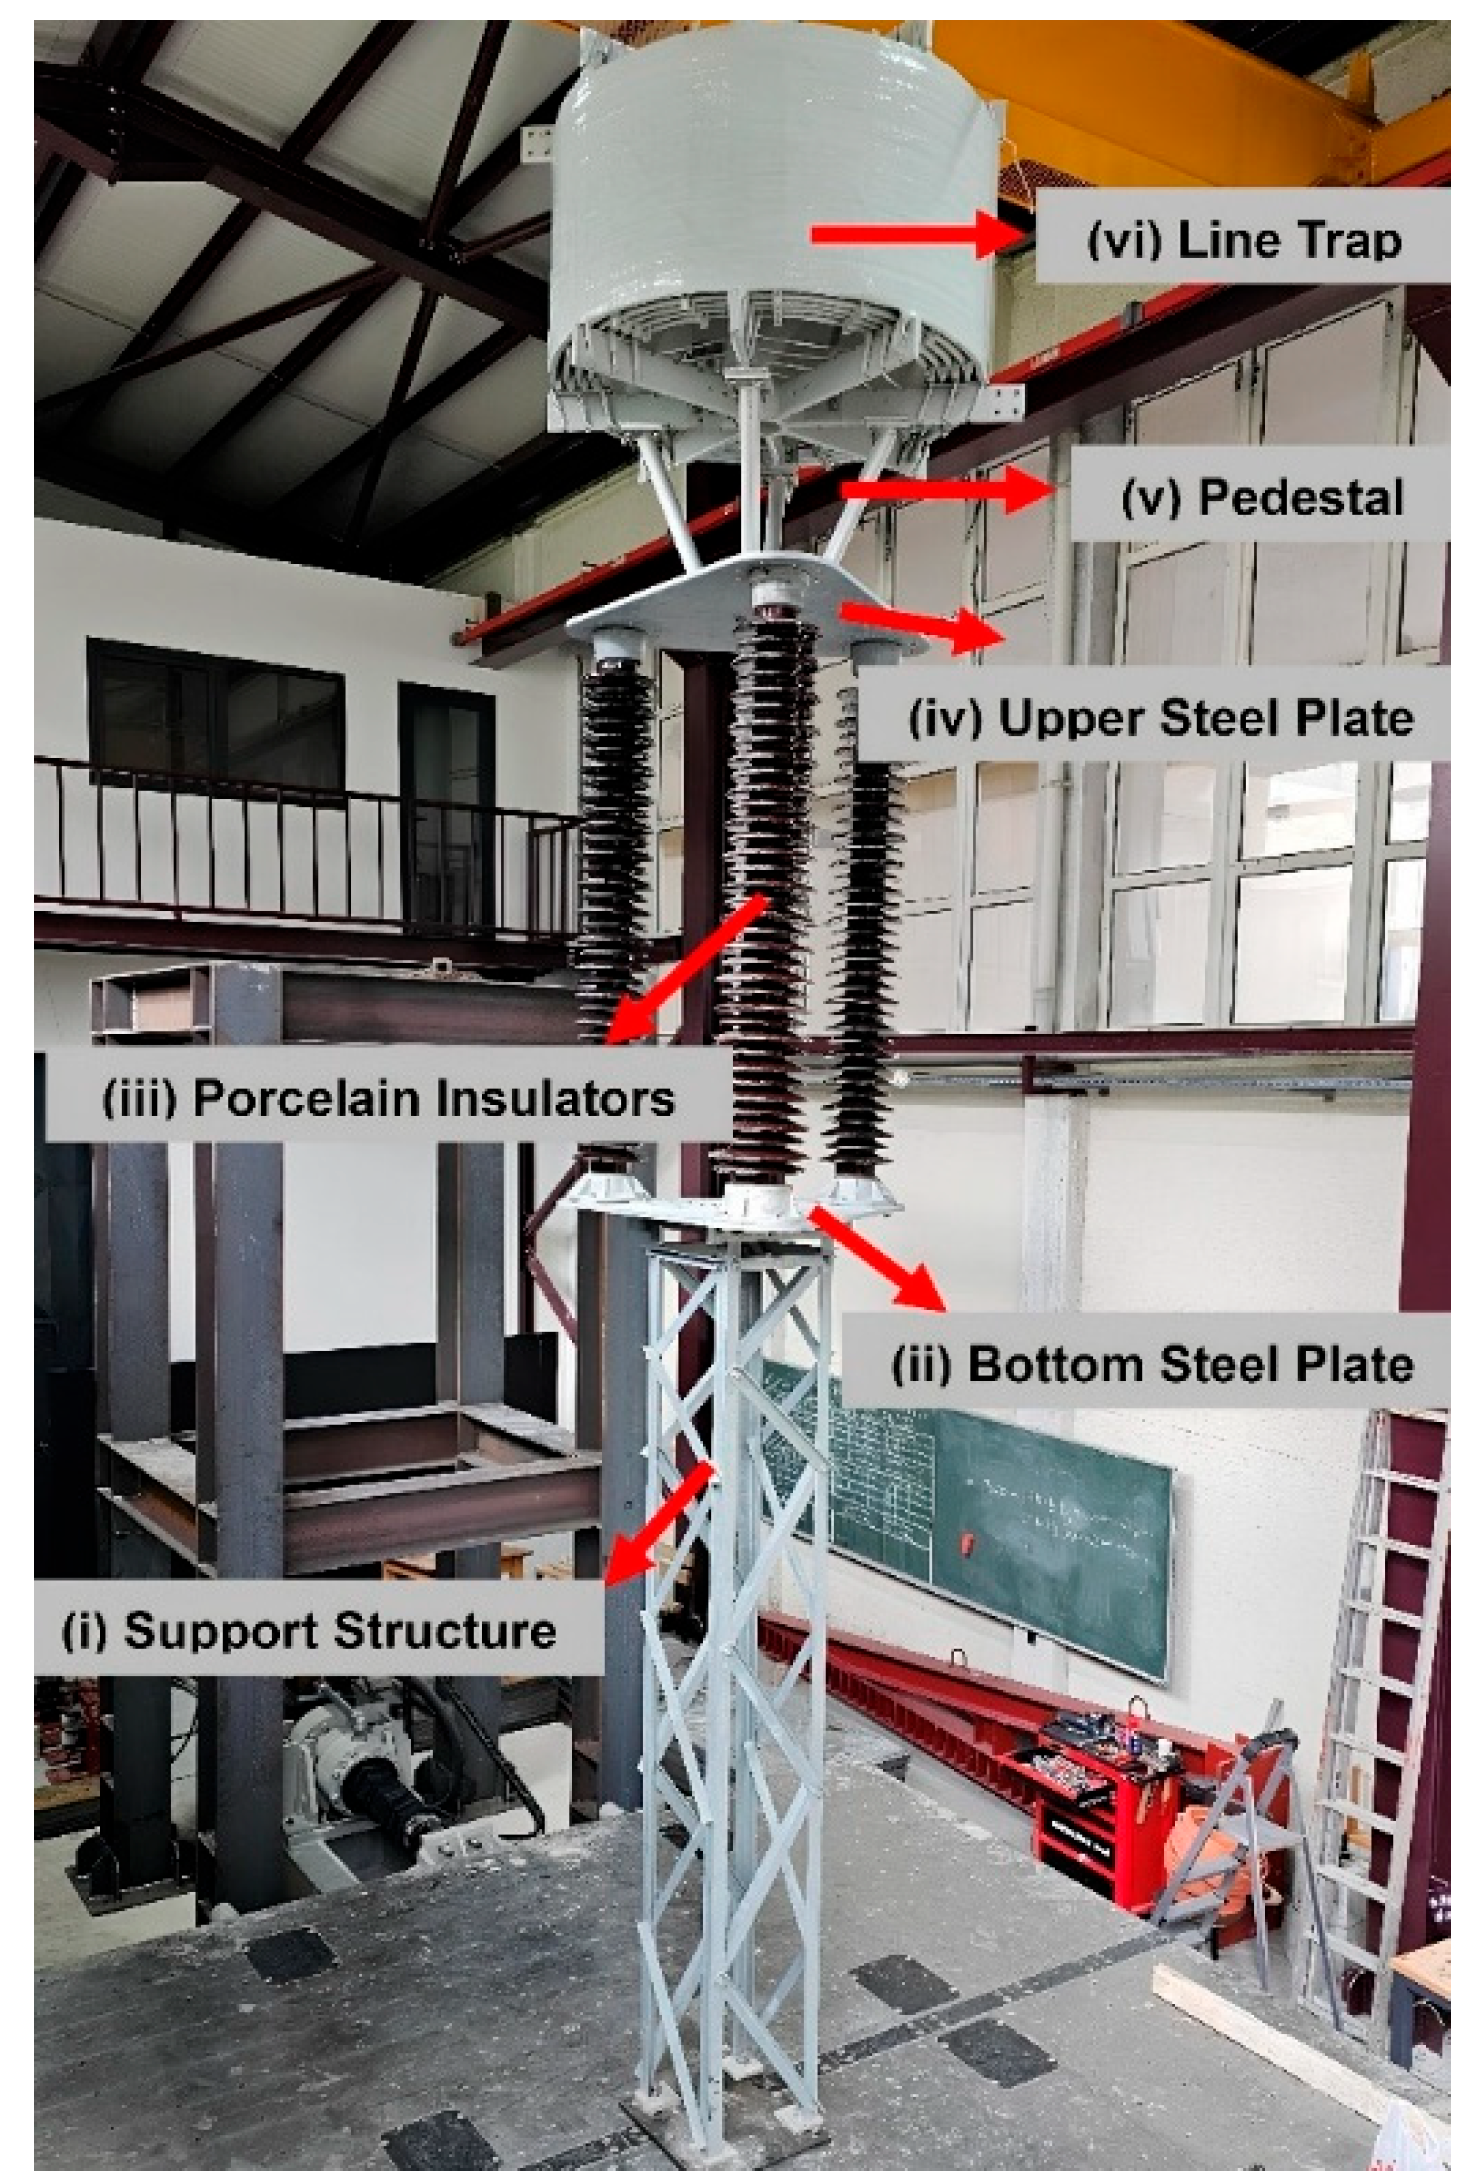
Figure 1. 170 kV line trap installed on shake table.
Applsci 15 10734 g001
Figure 2. Accelerometer layout plan used during AVTs and shake table tests.
Applsci 15 10734 g002
Figure 3. SVSDM graph of the 170 kV line trap obtained from EFDD method.
Applsci 15 10734 g003
Figure 4. Experimentally predicted first four natural frequencies and mode shapes of line trap.
Applsci 15 10734 g004
Figure 5. Comparison of the input ground motion with the responses obtained from the rigid platform of the shake table.
Applsci 15 10734 g005
Figure 6. Relative displacement response and corresponding logarithmic decrement curve of the line trap.
Applsci 15 10734 g006
Figure 7. The time history of relative displacements of 170 kV line trap obtained from shake table test.
Applsci 15 10734 g007
Figure 8. Numerical model and modal analysis results of the 170 kV line trap.
Applsci 15 10734 g008
Figure 9. Comparison of displacement responses obtained from experimental studies and numerical analyses.
Applsci 15 10734 g009
Figure 10. Elastic response spectra for the selected ground motions.
Applsci 15 10734 g010
Figure 11. The maximum displacements and their means for both orthogonal directions (each dot represents an individual acceleration record, whereas the solid lines illustrate the mean values).
Applsci 15 10734 g011
Figure 12. Distribution of maximum displacements at the line trap level for near-fault and far-fault ground motions.
Applsci 15 10734 g012
Figure 13. The maximum accelerations and their means for both orthogonal directions (each dot represents an individual acceleration record, whereas the solid lines illustrate the mean values).
Applsci 15 10734 g013
Figure 14. Distribution of maximum acceleration at the line trap level for near-fault and far-fault ground motions.
Applsci 15 10734 g014
Figure 15. Comparison of acceleration amplification factors obtained from dynamic analysis under near-fault and far-fault ground motions.
Applsci 15 10734 g015
Figure 16. Comparison of maximum stress values of porcelain insulators under near-fault and far-fault ground motions.
Applsci 15 10734 g016
Table 1. Maximum acceleration and relative displacement values.
AccelerometerAcceleration (g)Relative Displacement (mm)
Acc-10.236--
Acc-20.19524.093
Acc-30.86168.570
Acc-40.95677.745
Table 2. Comparison of the differences (%) between experimental and numerical frequencies.
ModeNumerical Frequencies (Hz)Experimental Frequencies (Hz)Differences (%)
11.9171.9330.83
21.9522.0484.69
37.4126.8358.44
47.5077.5110.05
Table 3. Comparison of the experimental and numerical peak displacement values.
Acc.Experimental Results (mm)Numerical Results (mm)Differences (%)
Acc-224.09320.99512.85
Acc-368.57060.79411.34
Acc-477.74579.9442.82
Table 4. The selected near-fault and far-fault ground motions.
Far-Fault Ground Motions
NoEarthquake NameYearStation NameMwRrup(km)
1Imperial Valley-061979Delta6.5322.03
2Imperial Valley-061979El Centro Array #116.5312.56
3Loma Prieta1989Capitola6.9315.23
4Landers1992Coolwater7.2819.74
5Landers1992Yermo Fire Station7.2823.62
6Kobe_Japan1995Nishi-Akashi6.97.08
7Kobe_Japan1995Shin-Osaka6.919.15
8Kocaeli_Turkey1999Duzce7.5115.37
9Hector Mine1999Hector7.1311.66
Near-fault ground motions
1Imperial Valley-061979El Centro Array #66.531.35
2Irpinia_Italy-011980Sturno (STN)6.9010.84
3Erzincan_Turkey1992Erzincan6.694.38
4Cape Mendocino1992Petrolia7.018.18
5Landers1992Lucerne7.282.19
6Northridge-011994Rinaldi Receiving Sta6.696.50
7Northridge-011994Sylmar–Olive View.6.695.30
8Kocaeli_Turkey1999Izmit7.517.21
9Duzce_Turkey1999Duzce7.146.58
Disclaimer/Publisher’s Note: The statements, opinions and data contained in all publications are solely those of the individual author(s) and contributor(s) and not of MDPI and/or the editor(s). MDPI and/or the editor(s) disclaim responsibility for any injury to people or property resulting from any ideas, methods, instructions or products referred to in the content.