Article

EEG-Powered UAV Control via Attention Mechanisms

1
Graduate School of Engineering, Saitama Institute of Technology, Fukaya 369-0203, Saitama, Japan
2
More & More Co., Ltd., Zushi 249-0006, Kanagawa, Japan
3
RIKEN Center for Advanced Intelligence Project (AIP), Chuo-ku, Tokyo 103-0027, Japan
*
Author to whom correspondence should be addressed.
Appl. Sci. 2025, 15(19), 10714; https://doi.org/10.3390/app151910714
Submission received: 13 August 2025 / Revised: 13 September 2025 / Accepted: 29 September 2025 / Published: 4 October 2025
(This article belongs to the Section Computing and Artificial Intelligence)

Abstract

This paper explores the development and implementation of a brain–computer interface (BCI) system that utilizes electroencephalogram (EEG) signals for real-time monitoring of attention levels to control unmanned aerial vehicles (UAVs). We propose an innovative approach that combines spectral power analysis and machine learning classification techniques to translate cognitive states into precise UAV command signals. This method overcomes the limitations of traditional threshold-based approaches by adapting to individual differences and improving classification accuracy. Through comprehensive testing with 20 participants in both controlled laboratory environments and real-world scenarios, our system achieved an 85% accuracy rate in distinguishing between high and low attention states and successfully mapped these cognitive states to vertical UAV movements. Experimental results demonstrate that our machine learning-based classification method significantly enhances system robustness and adaptability in noisy environments. This research not only advances UAV operability through neural interfaces but also broadens the practical applications of BCI technology in aviation. Our findings contribute to the expanding field of neurotechnology and underscore the potential for neural signal processing and machine learning integration to revolutionize human–machine interaction in industries where dynamic relationships between cognitive states and automated systems are beneficial.

Graphical Abstract

1. Introduction

Attention is a fundamental cognitive process that directly shapes learning outcomes, work performance, and human–machine interaction. Reliable assessment of attentional states is therefore essential in fields such as education, neuroscience, and brain–computer interface (BCI) research. Traditional diagnostic and monitoring methods, however, such as clinical interviews, behavioral observation, or self-reported questionnaires, are largely subjective and often prone to variability among evaluators [1]. This motivates the development of objective, quantitative, and real-time approaches to assess attention.
Electroencephalography (EEG) has been widely recognized as a promising tool for such purposes. EEG provides a non-invasive means to capture brain activity with high temporal resolution, making it suitable for real-time monitoring of cognitive states [2,3]. Prior work has shown that EEG-based systems can effectively differentiate between attentional states by analyzing spectral power in specific frequency bands. For example, Wan et al. [2] proposed methods for identifying multiple attention levels using frontal EEG, while Lim et al. [3] demonstrated that EEG-based training could enhance sustained focus in children. Related research on neurodevelopmental disorders has also suggested that EEG-guided training may support individuals with attention difficulties such as ADHD, underscoring the broader relevance of such approaches [4,5,6]. Beyond attention, EEG has been successfully applied to alertness and drowsiness monitoring, where individualized EEG algorithms demonstrated strong reliability in tracking cognitive fluctuations [7].
Despite these advances, several challenges remain. Many state-of-the-art approaches rely on computationally intensive deep learning models, which limit scalability and hinder deployment in embedded or portable systems [2,3]. In contrast, support vector machines (SVMs) provide a robust and efficient alternative. By maximizing classification margins and minimizing overfitting, SVMs are particularly well suited for real-time classification tasks [8,9].
In this work, we introduce a lightweight EEG-based framework for discriminating between focused and relaxed states in real time. The framework leverages the ratio of alpha to beta spectral power as a discriminative feature, combined with an optimized SVM classifier to achieve efficient and accurate recognition of attentional states. To validate its practicality, we applied the system to the control of unmanned aerial vehicles (UAVs), showing that subtle changes in EEG-derived attention levels can be converted into reliable UAV commands.
While UAV control serves as a proof-of-concept scenario, the proposed method has broader applicability. The same framework could be extended to contexts such as neurofeedback training, education, or clinical settings, where objective and real-time monitoring of attentional states is equally critical [3,5]. By combining methodological efficiency with practical demonstration, this study contributes to advancing EEG-based BCIs as effective tools for attention assessment and cognitive-state-driven control.

2. Methods for Detecting Attention with BCI

2.1. EEG-Based Attention Assessment

Electroencephalography (EEG) is a non-invasive technique that records the electrical activity of the brain using multiple electrodes placed on the scalp. The EEG signals represent the brain’s spontaneous electrical activity over time, crucial for diagnosing various neurological conditions and understanding brain functions [10,11,12].
Previous research has extensively explored the potential of using EEG signals to detect individual attention levels [7,13,14]. These studies have demonstrated that EEG can effectively identify various cognitive states, leveraging patterns in brainwave activity to assess focus and concentration.
Among these signals, alpha and beta waves are particularly significant in cognitive neuroscience [15,16]. Alpha waves are linked to states of relaxation and calmness, often observed when the eyes are closed and the mind is at rest. Conversely, beta waves are associated with active thinking, alertness, and problem-solving activities, occurring during intense mental engagement. The brain’s neurons are perpetually active, emitting minute electromagnetic waves captured as EEG signals. Typically, individuals cannot control these brain signal fluctuations without considerable training. This characteristic makes EEG a complex but invaluable tool for exploring the underlying mechanisms of brain activity and consciousness. By analyzing these signals, researchers can gain insights into the neural dynamics that underpin various cognitive states and behaviors.
Our study utilizes these EEG signals within a framework designed to assess attention levels through the analysis of brainwave patterns. This framework processes EEG data to classify states of mental focus using advanced signal processing techniques. Figure 1 illustrates this attention assessment framework, which systematically outlines the steps from raw EEG data acquisition to the application of signal processing for feature extraction and classification.
The proposed framework consists of six interconnected functional modules that operate in a closed-loop design. Initially, the Signal Acquisition module captures raw EEG data from an OpenBCI Cyton 8-channel system at a sampling rate of 250 Hz, streamed via the Lab Streaming Layer (LSL) protocol [17,18]. These neurophysiological signals are then channeled through the Signal Preprocessing subsystem, where temporal filtering (bandpass 1–50 Hz) and artifact rejection techniques are applied to enhance signal quality and attenuate noise components [19].
In the Feature Extraction module, we implement spectral decomposition methods focusing on oscillatory activities in the alpha (8–12 Hz) and beta (12–30 Hz) frequency bands, which are known neurophysiological correlates of attentional processes. Using Welch’s method with Hann windows, we compute power spectral density estimates from 5 s data epochs for each channel. Rather than employing a high-dimensional feature space, our approach strategically extracts the ratio of alpha to beta power as the primary discriminative feature. This ratio leverages the neurophysiological principle that elevated beta activity coupled with diminished alpha power indicates heightened cognitive engagement and attentional focus.
The Cognitive Assessment module constitutes the core analytical component of our framework, where we implement a support vector machine (SVM) classifier with a radial basis function kernel to determine attentional states. This represents a significant advancement over conventional threshold-based approaches. The SVM operates in the feature space of α / β ratios from multiple EEG channels, learning optimal decision boundaries between high and low attention states through supervised training. This machine learning approach accommodates individual variations in EEG baseline characteristics and provides probabilistic measures of classification confidence, enhancing both the accuracy and interpretability of attentional state assessment.
The Feedback Mechanism module interfaces with the user through a graphical display that visualizes real-time attention metrics and classification results. It incorporates both continuous attention-level indicators based on the computed α / β ratios and discrete state classifications derived from the SVM model. This bidirectional component not only provides the user with immediate cognitive state feedback but also enables system calibration through the collection of labeled training samples during user interaction.
Finally, the Application Interface module translates the classified attentional states into control commands for external devices. In our implementation, we demonstrate this capability by controlling a Tello drone’s vertical movement, where sustained high attention states (as classified by the SVM) trigger upward motion, while low attention states initiate downward motion. This practical application showcases the framework’s capacity to transform neurophysiological signals into tangible, real-world interactions.
The framework incorporates several feedback pathways that optimize system performance: (1) Feedback Control paths that enable dynamic parameter adjustments based on classification performance; (2) Configuration paths that allow system customization for different users and environments; and (3) Emergency Control mechanisms that ensure operational safety during critical state changes. This comprehensive design ensures robust performance across varying environmental conditions and individual user characteristics while maintaining operational reliability [20,21,22,23].
Through this integrated approach combining neurophysiological signal processing, machine learning classification, and real-time feedback mechanisms, our framework achieves a balance between computational efficiency and classification accuracy, making it particularly suitable for brain–computer interface systems requiring immediate response to changing cognitive states.

2.2. Feature Extraction

For our research, we employed the OpenBCI platform, an advanced commercial EEG monitoring tool renowned for its mobility and wireless capabilities, which are crucial for real-time monitoring and data analysis in various settings. Our setup included portable EEG sensors like the Experimental USB Dongle and the OpenBCI Cyton board, which are powered by four dry batteries. These devices are capable of capturing subtle brainwaves emitted by the brain and digitizing them for wireless transmission to processing hardware. The utilization of OpenBCI has been instrumental in our research, providing high-quality, real-time EEG data that facilitates comprehensive analysis of frontal lobe brain signals, where cognitive functions such as attention regulation and decision-making are processed [24,25,26].
The primary focus of the current study is on analyzing power changes within specific EEG frequency bands, especially alpha (8–13 Hz) and beta (13–30 Hz), to assess the user’s attention state [27,28,29]. Generally, increased activity in the beta band is associated with heightened attention, whereas an increase in alpha activity often indicates a more relaxed state with less concentrated focus. The ratio of alpha to beta activity, defined as
R = E α E β
serves as a critical feature for assessing the level of mental focus, where R is the metric used to determine the focus level. This ratio aids in differentiating between states of relaxation and active concentration, making it a valuable metric for controlling UAVs through brain signals. Leveraging this ratio enables a more nuanced understanding of how brain activity correlates with attention levels, providing a robust mechanism for EEG-based UAV control.
Moreover, to intricately analyze the frequency components of the EEG signals, we applied fast Fourier transform (FFT) and power spectral density (PSD) techniques. FFT is an algorithm that efficiently computes the Fourier transform of a signal, thereby converting a time-domain signal into a frequency-domain representation. This technique is particularly suitable for analyzing physiological signals like EEG data, which exhibit periodic variations. The mathematical expression for FFT is
FFT ( x ( t ) ) = X ( f ) = x ( t ) e j 2 π f t d t
where x ( t ) is the signal in the time domain, X ( f ) is the signal in the frequency domain, and f represents the frequency.
Using the data processed through the FFT, we further calculate its PSD, which quantifies how the power of a signal is distributed across various frequencies. The formula for PSD is
PSD ( f ) = T X ( f ) 2
where T is the length of the observation time window, and X ( f ) is the amplitude of the frequency domain signal obtained from the FFT.
By analyzing the PSD of EEG signals, we can accurately identify frequency components associated with focused attention, such as alpha and beta waves. This method not only enhances the detection capabilities for subtle differences in brain activity but also provides more precise biomarkers for controlling UAVs based on EEG signals.

2.3. Support Vector Machine

Support vector machines (SVMs) are powerful machine learning tools that excel in various predictive tasks, including classification and regression [30,31]. Unlike models that focus solely on minimizing the error on training data, SVMs employ a principle known as Structural Risk Minimization (SRM). This approach optimizes the model by balancing complexity with the ability to generalize well on unseen data, thereby minimizing the upper bound on the expected risk, in contrast to merely fitting to the training set. This distinction is pivotal, especially when compared to Empirical Risk Minimization (ERM) strategies typically employed by conventional neural networks that prioritize fitting as closely as possible to the training examples [32,33].
SRM’s strategy for minimizing the expected error across unknown data renders SVMs particularly robust in scenarios requiring high generalizability. This robustness is crucial in fields like UAV control, where systems must perform reliably under diverse and unpredictable conditions. In our research, we utilize the binary classification capability of SVMs to differentiate between focused and relaxed mental states using EEG signals. The efficacy of SVMs in discerning these states proves invaluable for real-time applications, such as piloting UAVs based on the operator’s cognitive state.
For binary classification of attention states, an SVM model was employed. The SVM optimizes the decision boundary by solving
arg min w 1 2 w 2 + C i = 1 N ξ i
subject to
y i ( w · x i + b ) 1 ξ i , ξ i 0
where w and b are the model parameters, and ξ i are slack variables.
By focusing on simple EEG signal detection and classification, our study aims to integrate neuroscientific insights with practical technological applications. The use of the SVM in our research underscores its efficacy in managing critical tasks where decisions must be made swiftly and accurately, reflecting the user’s mental engagement. This integration of advanced statistical learning techniques with EEG-based monitoring offers new avenues for enhancing interactive technologies, pushing the boundaries of what can be achieved through brain–computer interfaces.

3. Experimental Validation of Attention Assessment Framework

3.1. System Architecture

In this section, we delve into the design and implementation of our system, which utilizes EEG data to control drones by monitoring and analyzing the user’s level of attention in real time. The core of the system is an efficient classifier that processes EEG signals on the fly to determine the user’s attention state. Based on this analysis, the system generates precise flight commands, enabling accurate drone control.
As illustrated in Figure 2, the process begins with the capture of EEG signals, collected through a wireless EEG headset that ensures both the timeliness and accuracy of the data. These signals are transmitted to a processing unit, where the classifier analyzes the complex EEG data to extract key information and assess the user’s concentration levels. Depending on this assessment, control commands are automatically sent to the drone, guiding its elevation and other flight maneuvers.
For this study, we utilized the DJI Tello drone as the primary flight platform. Known for its compact design and ease of use, the DJI Tello is an ideal choice for research requiring lightweight, portable, and responsive drones. With features such as precise flight stabilization, simple programming interfaces, and compatibility with custom communication protocols, the Tello drone facilitates seamless integration with the EEG-based control framework. Its affordability and reliability make it particularly well-suited for real-time experimental setups.
Furthermore, the system includes a feedback mechanism that provides real-time updates on both the drone’s flight status and the user’s attention level to the operator. This feature helps users adjust their focus to achieve better control over the drone. We have also explored various attention training techniques designed to enhance users’ focus through regular practice.

3.2. EEG Data Acquisition and Analysis

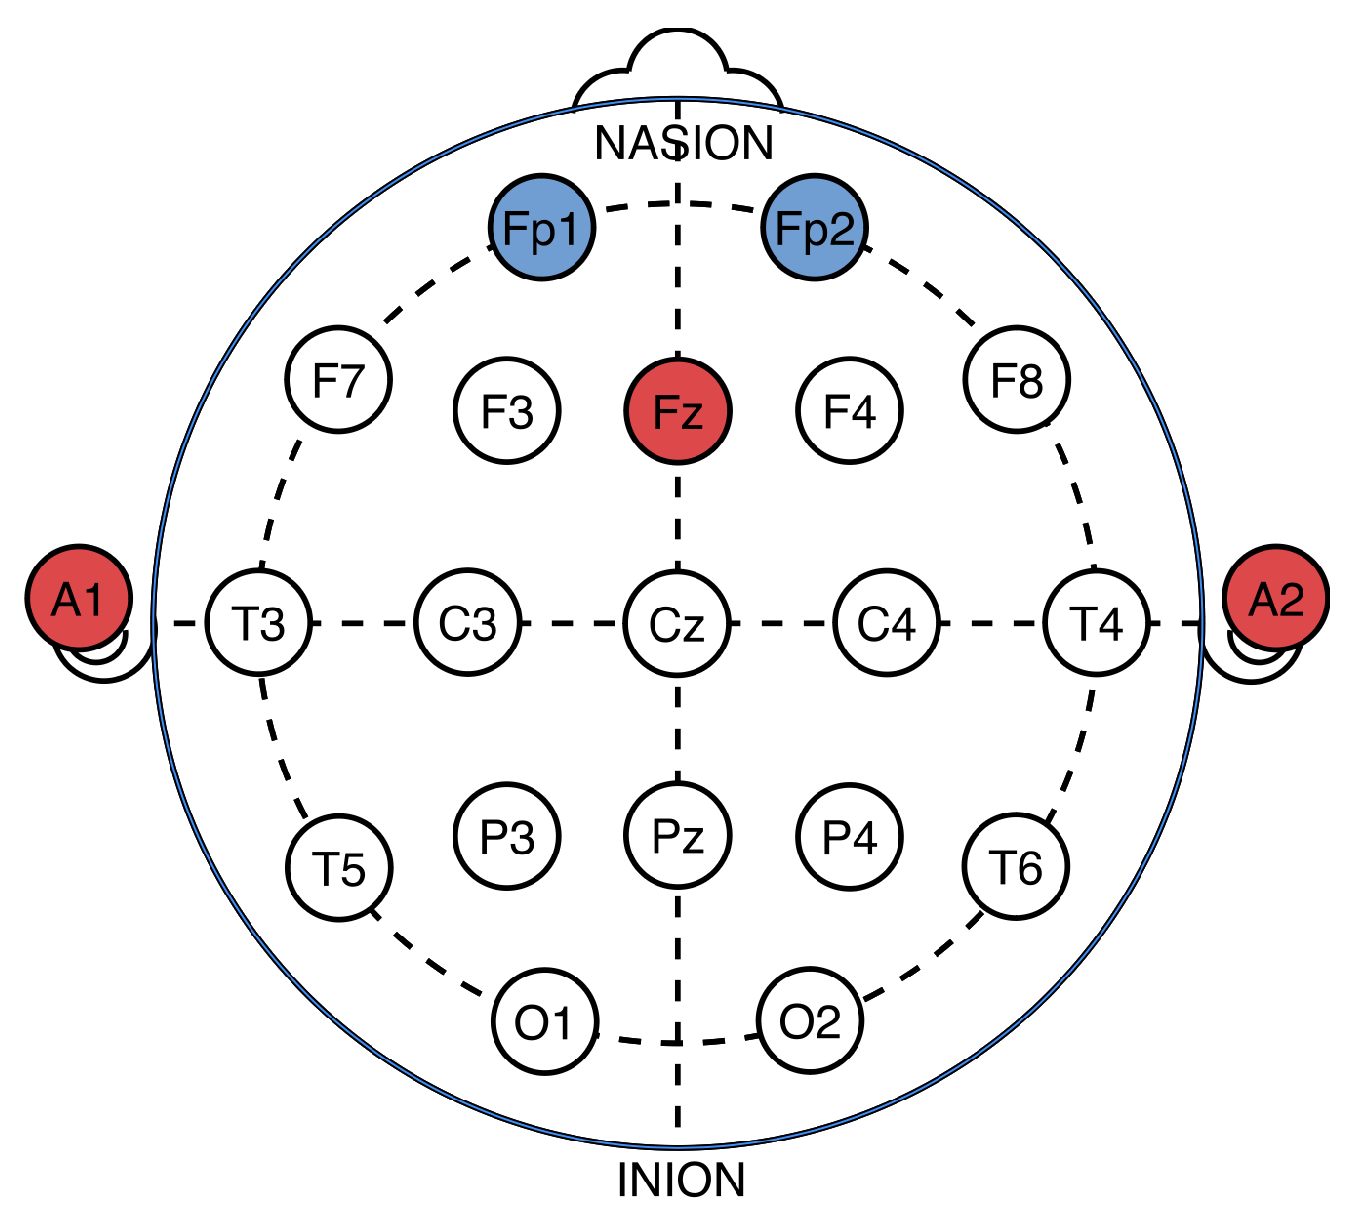
To ensure comprehensive data acquisition, we utilized the OpenBCI EEG system, which has a 250 Hz sampling rate, focusing on frontal electrodes FP1 and FP2, with FZ as the reference electrode and A1 and A2 electrodes at the earlobes serving as ground references. This setup is crucial for capturing detailed EEG data across different cognitive states. By concentrating on the frontal lobe—central to executive functions such as attention and decision-making—we can assess the brain’s response to stimuli, which is invaluable for applications involving UAV control.
As shown in Figure 3, our presentation illustrates the International 10–20 system for electrode placement used in our experiments. This standardized placement ensures consistent and accurate EEG data collection across subjects, which is essential for valid comparative analysis. The figure emphasizes the placement of electrodes FP1, FP2, and FZ, which are vital for monitoring frontal brain activity closely linked to cognitive functions such as focus and alertness.
To effectively monitor and analyze brain activity, we adopted two distinct data collection methods tailored to specific mental states—focused attention and relaxation.

3.2.1. Focused Attention Collection Method

We utilized a visual stimulus involving a 3 × 3 grid of randomly flashing squares, as illustrated in Figure 4. Participants were instructed to count the flashes while minimizing eye blinks and bodily movements, ensuring engagement and concentration. This setup simulates scenarios requiring sustained attention, akin to operating a UAV.

3.2.2. Relaxation Collection Method

Participants were asked to relax with closed eyes, devoid of any active thought processes, in a controlled, quiet environment to minimize external distractions. This state corresponds to periods of low cognitive demand, providing a baseline for relaxed brain activity.
For our study, extensive steps were taken to ensure the integrity and applicability of the EEG data we collected. Initially, we engaged participants in a pre-training phase designed to help them become familiar with the mental states required for our tests. This training ensured that participants could consistently achieve and maintain these states during data collection, enhancing the reliability of our results.
To validate the physiological relevance of the collected data, we rigorously analyzed the power spectra of alpha (8–13 Hz) and beta (13–30 Hz) waves. These spectral analyses helped us confirm that alpha waves, typically associated with relaxed states, and beta waves, linked to active thinking and concentration, behaved as expected under different cognitive loads.
Our study group consisted of young adults, all around the age of 25 (±1 year). This age homogeneity was crucial, as it minimized variability due to cognitive developmental differences that could affect EEG outcomes. For each recording session, we meticulously ensured that the beta power was greater during tasks requiring focused attention and lower during relaxation phases, thus validating the physiological markers of our targeted mental states.

3.3. Data Preprocessing and Feature Extraction

In terms of data preprocessing, the susceptibility of EEG signals to various types of noise necessitated a rigorous approach. We segmented 60 s of continuous EEG data into smaller intervals, typically every 1 or 2 s. This segmentation allowed for more manageable and detailed analysis of the EEG signals.
To clean the data, we employed a Chebyshev filter for bandpass filtering, removing frequencies below 0.5 Hz and above 50 Hz, thus filtering out DC offsets and muscle artifacts. Furthermore, to tackle the common issue of electrical interference from power lines in EEG data, a notch filter was specifically applied at 50 Hz.
Detrending each data segment was crucial to eliminate slow-frequency trends like baseline drifts, which can obscure genuine brain activity. This process ensured that the high-frequency components of the EEG signals were highlighted, improving the overall quality of our analysis.
Artifact rejection was meticulously carried out using Independent Component Analysis (ICA), which decomposes EEG signals into independent components. This method allowed us to identify and remove components associated with eye movements, blinks, and muscle twitches, which are typical artifacts in EEG recordings. Additionally, manual inspections were conducted to further ensure the removal of any segments severely affected by artifacts.
Normalization of the EEG signals was performed to eliminate individual differences in signal amplitude, which could influence the analysis. Each signal was standardized to zero mean and unit variance, ensuring that the data across all participants could be compared on equal footing.
The feature extraction phase was crucial for our analysis. Using the Fourier transform (FFT), we converted the time-domain EEG signals into the frequency domain, allowing us to analyze the energy distribution across different frequency bands. Power spectral density (PSD) calculations were then employed to quantify the power within these bands, focusing on theta (4–8 hz), alpha (8–13 hz), beta (13–30 hz), and gamma (30–38 Hz) frequencies [34,35,36]. We calculated both absolute and relative power values for these bands, which were essential for assessing attention levels through ratios like alpha to beta. As illustrated in Figure 5, the entire workflow of EEG data collection and preprocessing is meticulously designed to ensure the precision and reliability of our data.

3.4. Experimental Results

The variability and overall distribution of alpha-to-beta power ratios in the focused state are shown in Figure 6, where each bar represents one of the 32 individual focus sessions. Most ratios fall within the range of 0.5 to 1.2, confirming that focused attention is generally associated with a relatively lower alpha-to-beta ratio. Only a small number of outlier sessions approach values above 2.0, which likely reflect individual differences or transient fluctuations in EEG activity rather than a consistent trend.
Figure 7 presents the corresponding results for 34 relaxation sessions. In contrast to the focused condition, the majority of ratios range between 1.0 and 2.5, with several sessions reaching values close to 3.0. This shift toward higher ratios illustrates the increased dominance of alpha activity during relaxation, in line with established findings that alpha rhythms are more prominent under reduced cognitive load or passive mental states.
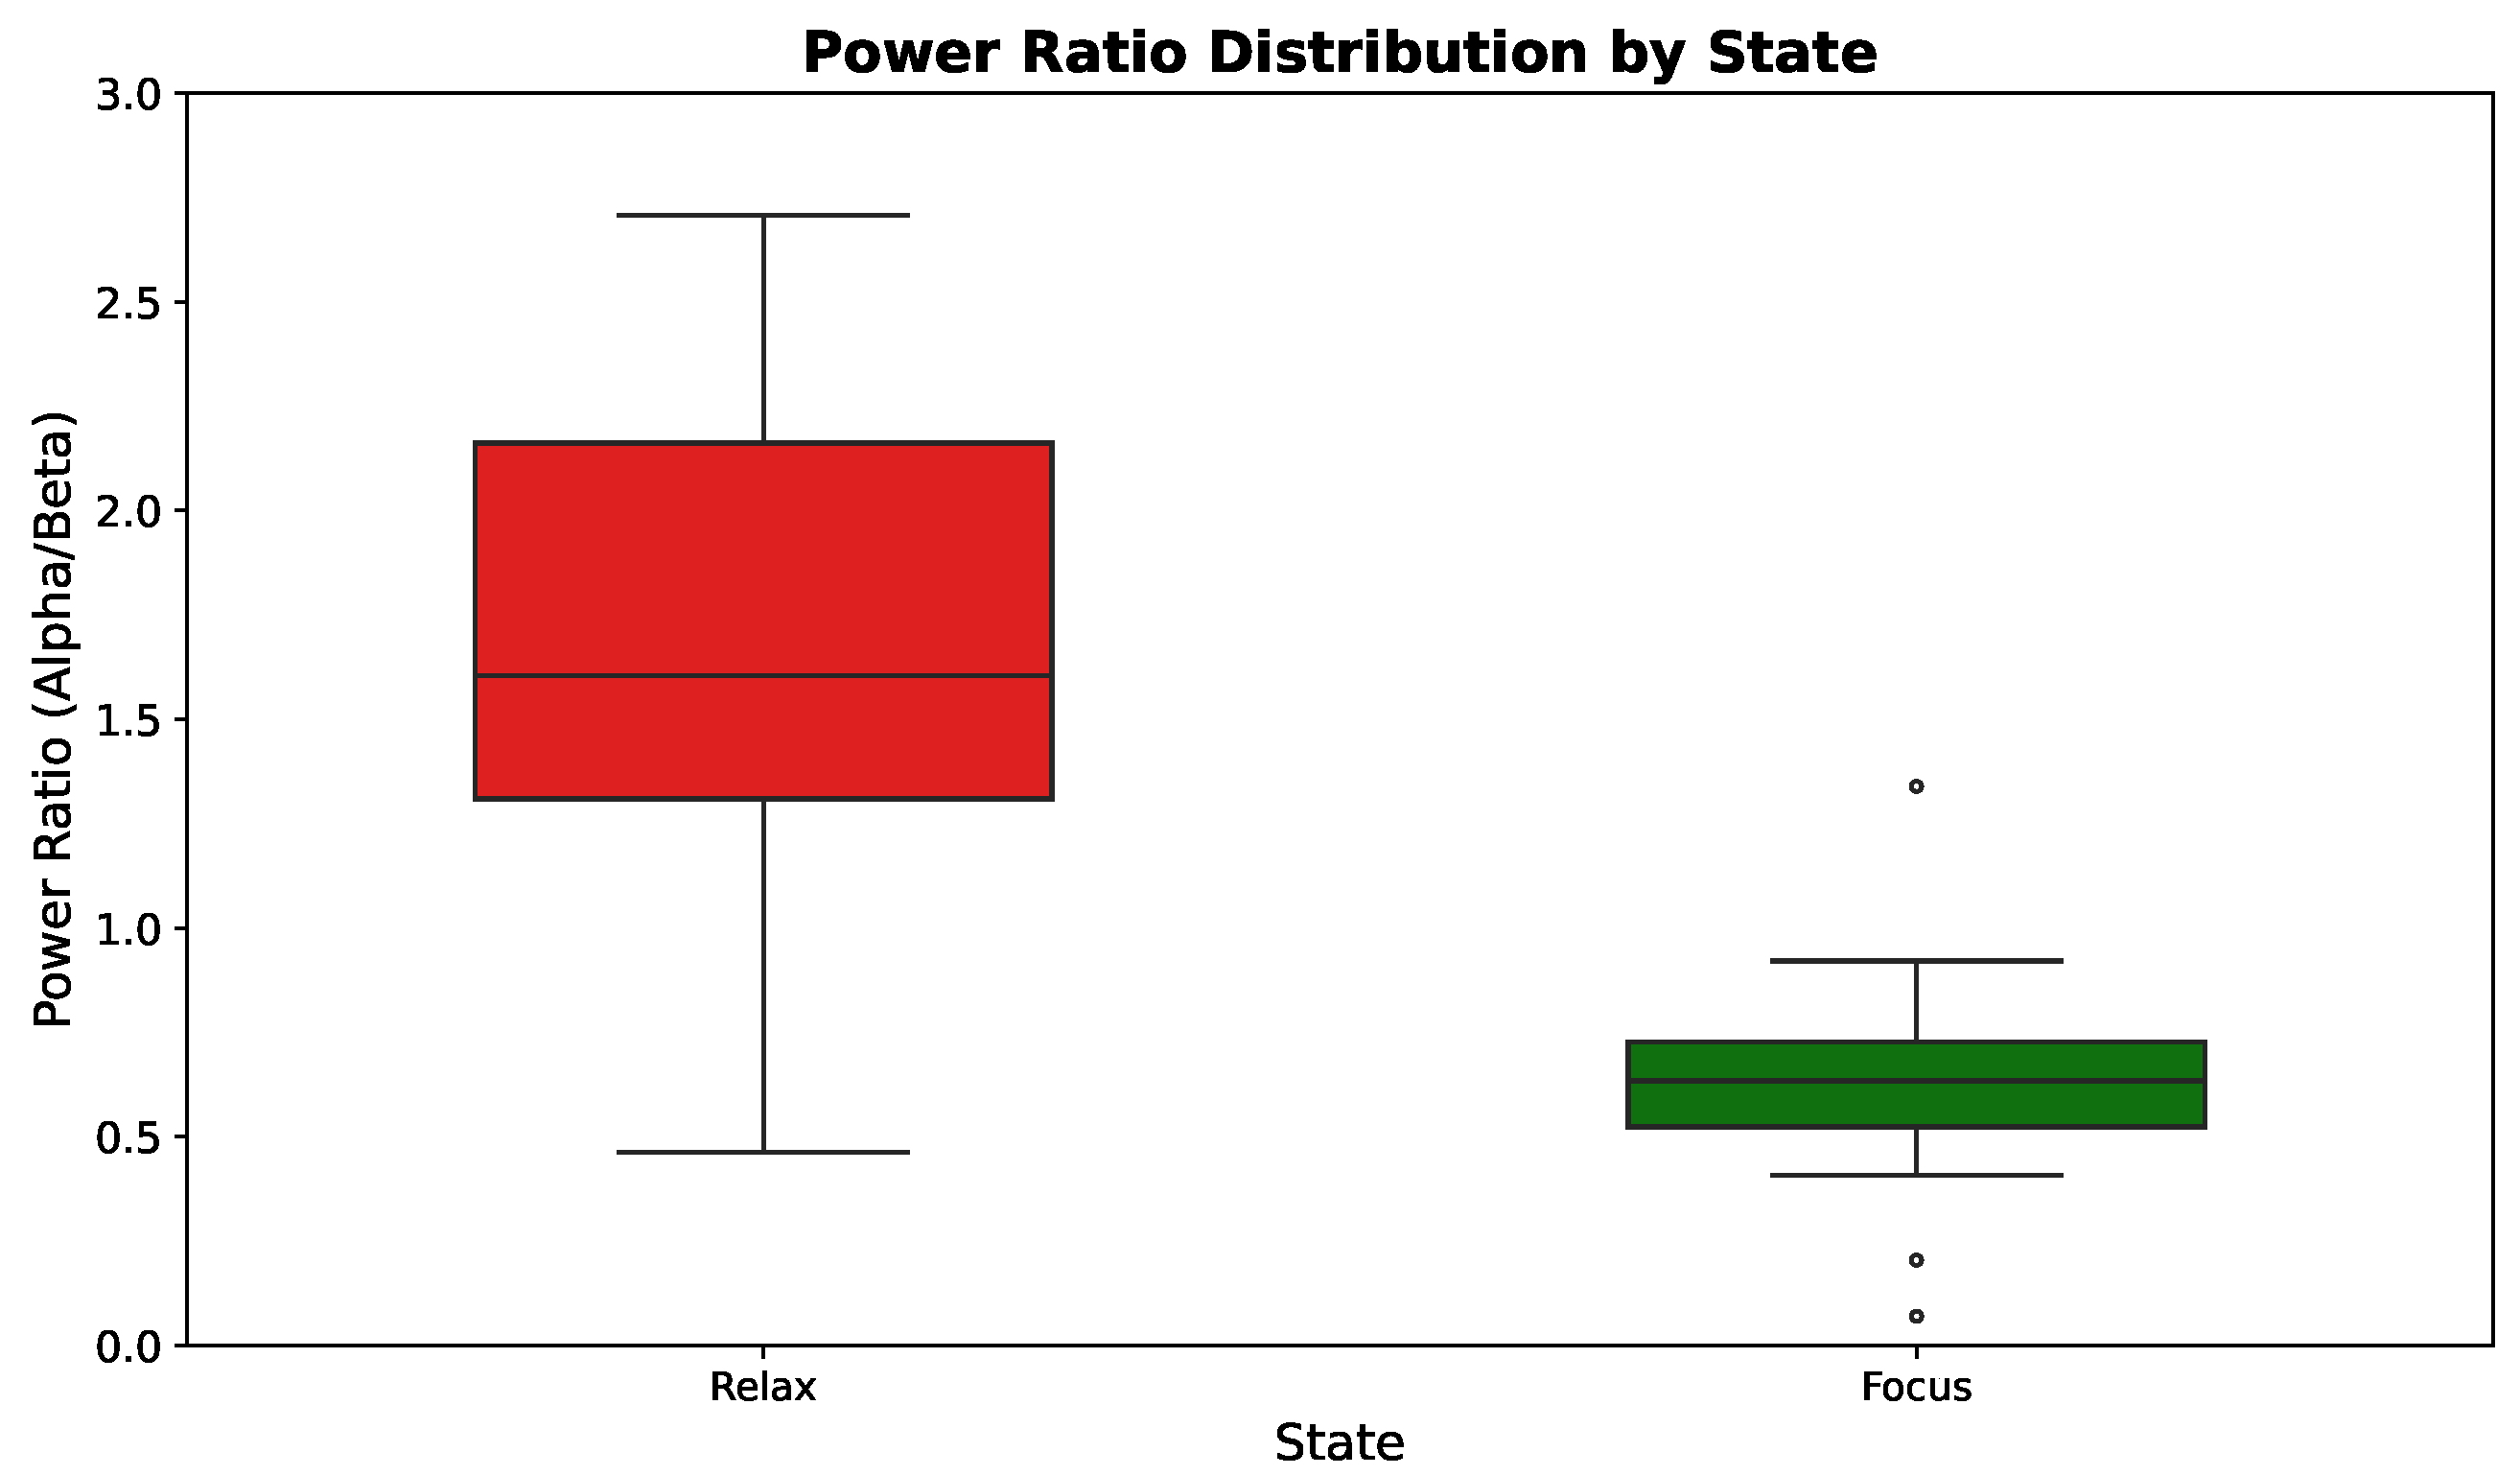
To provide a statistical comparison, Figure 8 summarizes the distributions across both groups using a box plot. For the focus condition, the median alpha-to-beta ratio was 0.63 with a standard deviation of 0.21, reflecting lower variability and a tighter clustering of values, indicative of a relatively uniform neural signature of concentration. In contrast, the relaxation condition exhibited a median ratio of 1.69 with a standard deviation of 0.59, reflecting both a higher overall level and greater variability, suggesting that participants expressed relaxation with more heterogeneous neural patterns.

3.5. SVM Classification Analysis

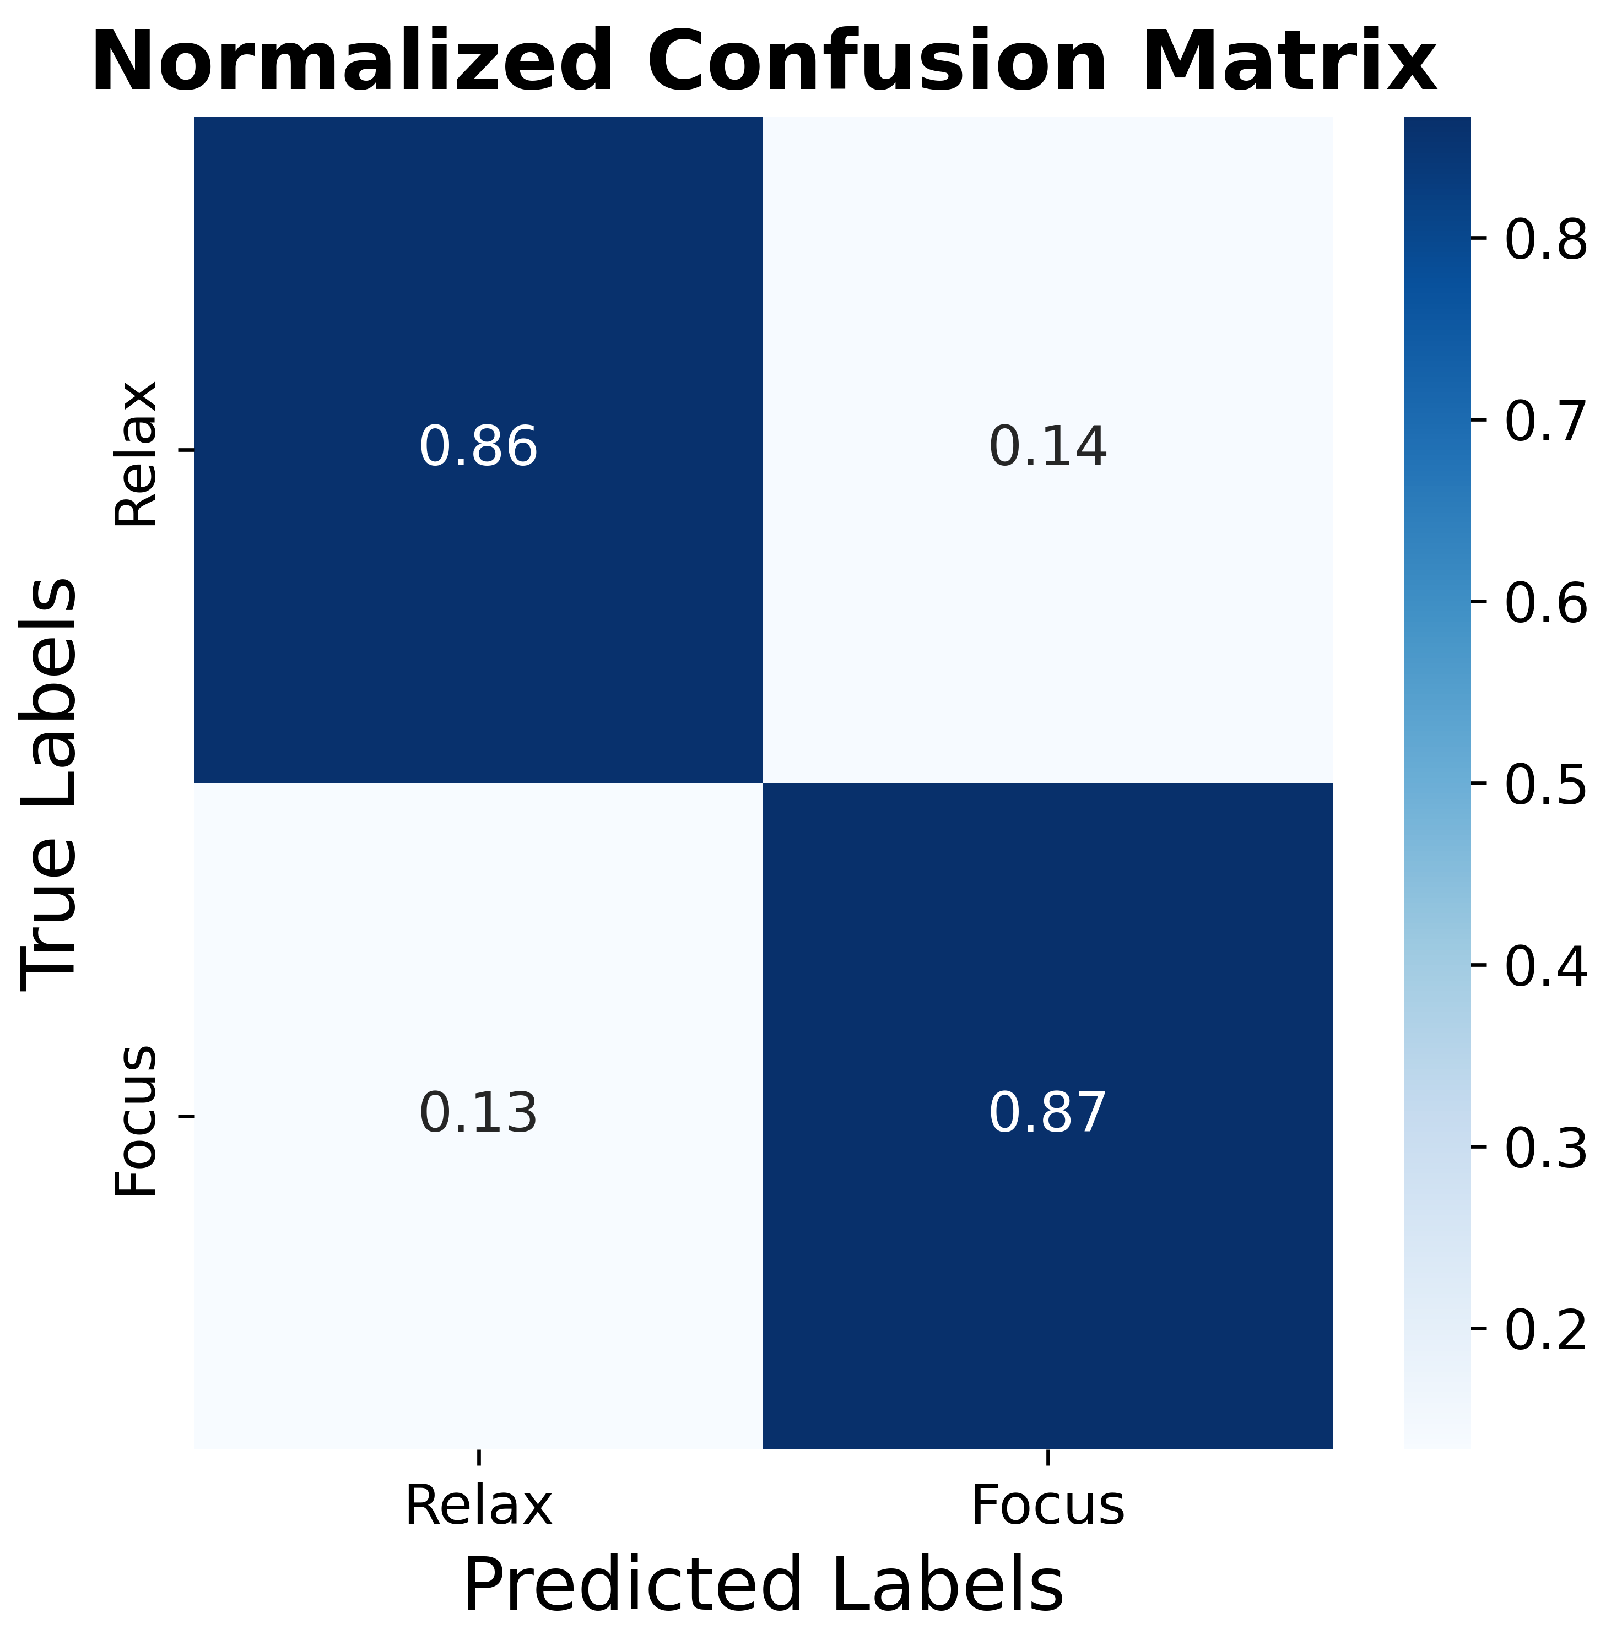
The SVM achieved balanced and reliable recognition of the two mental states. As shown in Figure 9, relaxed sessions were correctly classified in 86% of cases, while focused sessions were identified with 87% accuracy. The misclassifications were limited to about 13–14%, and importantly, errors were symmetrically distributed across both classes. This indicates that the classifier did not favor one state over the other, which is essential for applications requiring stable performance in real time.
Another observation from the matrix is that the SVM was particularly effective at maintaining high detection rates for focus, which is the critical condition in UAV control tasks. Even when errors occurred, they rarely resulted in systematic bias, suggesting that the decision boundary based on the α / β ratio generalized well across different subjects and sessions. The confusion matrix highlights that the SVM provides dependable classification with relatively low error rates in both categories. This performance validates its suitability as a primary model for real-time EEG-based control, while also setting a benchmark against which alternative classifiers can be compared.

3.6. Comparison with Additional Classifiers

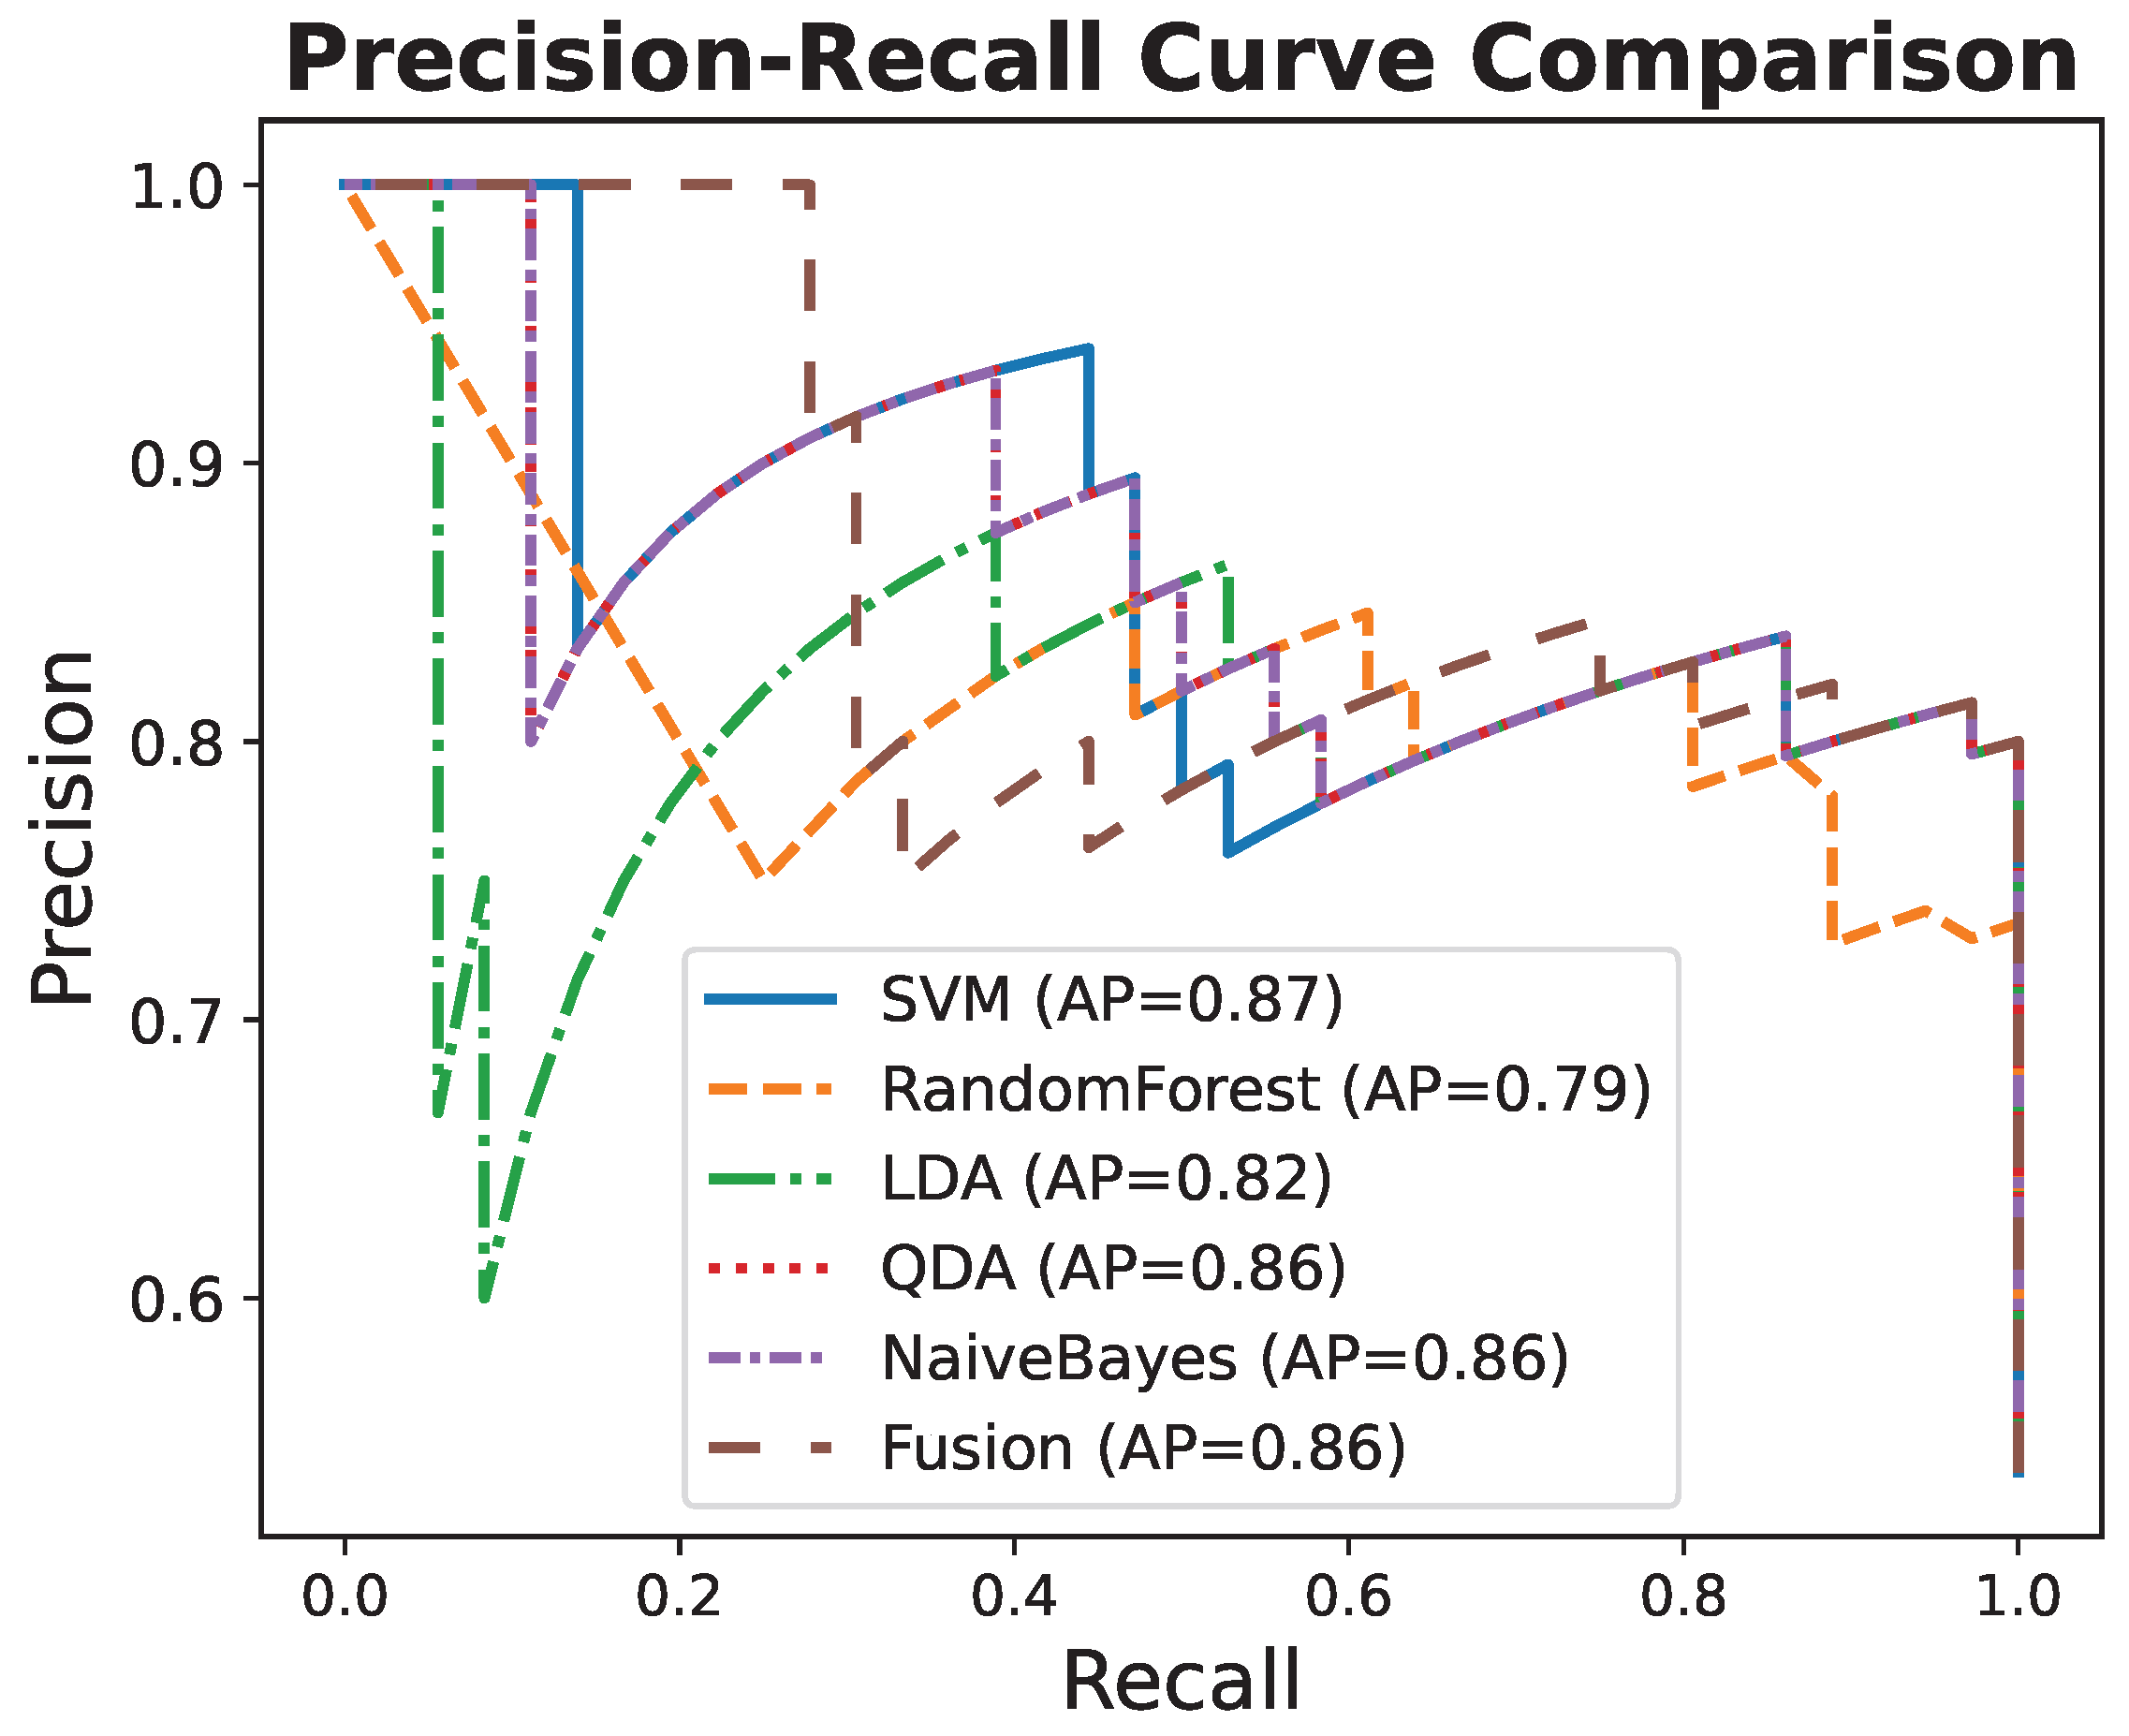
To provide a more comprehensive evaluation, we extended the analysis beyond the SVM by implementing and comparing several additional classifiers, including Random Forest (RF), Linear Discriminant Analysis (LDA), Quadratic Discriminant Analysis (QDA), and Naive Bayes (NB), which are widely applied in EEG-based BCI research [37,38]. In addition, a classifier fusion strategy was tested to examine whether combining multiple decision rules could further enhance predictive performance [39,40]. Two additional figures were generated to illustrate the results: the ROC curve comparison (Figure 10) and the Precision–Recall curve comparison (Figure 11).
Figure 10 shows that the fusion model achieved the highest AUC (0.92), followed closely by SVM and LDA, both approaching 0.90. The Precision–Recall analysis in Figure 11 supports this observation, as fusion and SVM yielded the highest AP values. By contrast, QDA and NB exhibited weaker results, reflecting the limitations of their distributional assumptions, while RF trailed behind in accuracy, suggesting that tree-based methods are less effective for the low-dimensional EEG features used in this study.
Table 1 provides a quantitative summary of the six classifiers in terms of ACC, AUC, and AP. Fusion delivered the best performance across all three metrics (ACC = 0.881, AUC = 0.918, AP = 0.899), but the margin over the SVM and LDA was small, indicating that the α / β power ratio features are already highly discriminative under both linear and nonlinear decision boundaries. In contrast, NB and QDA produced relatively lower AP values (≈0.85 and 0.819, respectively), and RF obtained the weakest ACC, confirming their limited suitability for this dataset.
Table 2 reports the paired significance tests conducted per fold using both paired t-tests and Wilcoxon signed-rank tests. Results indicated that SVM significantly outperformed weaker baselines such as RF, QDA, and NB ( p < 0.05 or p < 0.01 depending on the metric). Compared with the SVM, the fusion model achieved a small but statistically significant improvement in ACC ( p < 0.05 ), while differences in AUC and AP were not statistically significant. This suggests that although fusion can provide modest gains, the SVM already offers a strong and stable baseline.
From a practical standpoint, deploying fusion in real-time UAV control is constrained by computational complexity, as it requires simultaneous evaluation of multiple models and introduces latency. In contrast, the SVM achieved nearly equivalent performance with substantially lower overhead, making it the most practical choice for lightweight and embedded systems where responsiveness is critical. Future work may nevertheless explore fusion approaches in scenarios with fewer computational constraints, where maximizing accuracy is prioritized over efficiency.
Beyond the classifiers evaluated here, several advanced methods could further improve EEG-based BCIs. For example, filter bank common spatial patterns (FBCSPs) have been widely used to extract discriminative features from multiple frequency sub-bands, Riemannian geometry classifiers have shown robustness across subjects and sessions, and compact convolutional neural networks such as EEGNet have demonstrated strong performance with relatively low computational cost [41,42,43]. Incorporating such strategies into future work may yield further improvements beyond the α / β power ratio features and the traditional classifiers considered in this study.

3.7. System Interface and Performance

The graphical user interface (GUI) of the proposed system was developed using the PyQt5 framework, ensuring high responsiveness and cross-platform compatibility. The interface integrates EEG signal visualization, real-time attention monitoring, and UAV control functions in a single environment, allowing users to observe their cognitive state and issue control commands intuitively. By consolidating these modules into one platform, the system supports both effective monitoring and seamless interaction without unnecessary complexity. As demonstrated in Supplementary Video S1, the proposed system offers a complete experimental demonstration of real-time EEG-based UAV control via an intuitive interface.
To evaluate system performance in real UAV control tasks, four additional subjects (separate from the 20 participants used for offline dataset construction) participated in experiments where their attention states were classified in real time to control UAV altitude. Table 3 summarizes the performance metrics. The results show that the system achieved an average classification accuracy of 85.4%, an average response time of 1.36 s, and an average control success rate of 91.7%, demonstrating both the accuracy and stability of the proposed approach.

4. Conclusions

This study investigated the feasibility of using EEG signals to control UAVs by distinguishing between focused and relaxed mental states. The proposed SVM-based approach achieved a robust classification accuracy of approximately 85%, demonstrating that the α / β power ratio is a reliable feature for real-time attention recognition.
The results confirmed that the SVM provides a stable balance between accuracy and computational efficiency, making it well suited for lightweight embedded applications such as UAV control. Beyond UAV operation, the approach highlights the broader potential of EEG-based brain–computer interfaces in areas such as medical rehabilitation, assistive technology, and interactive entertainment, where cognitive states can be translated into actionable commands.
Future work will expand the participant pool to improve generalizability, investigate more advanced feature extraction and classification methods, and explore a wider range of control commands. These directions will further enhance the robustness and applicability of EEG-based attention recognition systems, contributing to the advancement of human–machine interaction and neurotechnology.

Supplementary Materials

The following supporting information can be downloaded at: https://www.mdpi.com/article/10.3390/app151910714/s1, Video S1: Real-time EEG-based UAV control demonstration.

Author Contributions

Data collection was performed by J.G. and H.L.; code development was carried out by J.G. and H.L.; data analysis was conducted by J.G., H.L. and L.Z.; the original draft was written by J.G.; conceptualization and study design were provided by J.C. and T.M. All authors have read and agreed to the published version of the manuscript.

Funding

This research received no external funding.

Institutional Review Board Statement

The study was conducted in accordance with the Declaration of Helsinki, and the protocol was approved by the Ethics Committee of Saitama Institute of Technology 2018-01 on 22 October 2018.

Informed Consent Statement

Verbal informed consent was obtained from all participants. Verbal consent was obtained rather than written because the study involved only non-invasive EEG recordings and did not include any personal privacy or medical treatment, and all data were fully anonymized with no identifiable information collected.

Data Availability Statement

The data that support the findings of this study are not publicly available due to privacy and ethical restrictions, but may be obtained from the corresponding author upon reasonable request.

Conflicts of Interest

Author Liangyu Zhao was employed by the company More & More Co., Ltd. The remaining authors declare that the research was conducted in the absence of any commercial or financial relationships that could be construed as a potential conflict of interest.

References

  1. Costello, E.J.; Egger, H.; Angold, A. 10-year research update review: The epidemiology of child and adolescent psychiatric disorders: I. Methods and public health burden. J. Am. Acad. Child Adolesc. Psychiatry 2005, 44, 972–986. [Google Scholar] [CrossRef] [PubMed]
  2. Wan, W.; Cui, X.; Gao, Z.; Gu, Z. Frontal EEG-based multi-level attention states recognition using dynamical complexity and extreme gradient boosting. Front. Hum. Neurosci. 2021, 15, 673955. [Google Scholar] [CrossRef] [PubMed]
  3. Lim, C.G.; Lee, T.S.; Guan, C.; Fung, D.S.S.; Zhao, Y.; Teng, S.S.W.; Zhang, H.; Krishnan, K.R.R. A brain-computer interface-based attention training program for treating attention deficit hyperactivity disorder. PLoS ONE 2012, 7, e46692. [Google Scholar] [CrossRef] [PubMed]
  4. Guze, S.B. Diagnostic and Statistical Manual of Mental Disorders, 4th Ed. (DSM-IV). Am. J. Psychiatry 1995, 152, 1228. [Google Scholar] [CrossRef]
  5. Kooij, J.J.S.; Huss, M.; Asherson, P.; Akehurst, R.; Beusterien, K.; French, A.; Sasané, R.; Hodgkins, P. Distinguishing comorbidity and successful management of adult ADHD. J. Atten. Disord. 2012, 16 (Suppl. 5), 3S–19S. [Google Scholar] [CrossRef]
  6. Mattfeld, A.T.; Gabrieli, J.D.; Biederman, J.; Spencer, T.; Brown, A.; Kotte, A.; Kagan, E.; Whitfield-Gabrieli, S. Brain differences between persistent and remitted attention deficit hyperactivity disorder. Brain 2014, 137, 2423–2428. [Google Scholar] [CrossRef]
  7. Johnson, R.R.; Popovic, D.P.; Olmstead, R.E.; Stikic, M.; Levendowski, D.J.; Berka, C. Drowsiness/alertness algorithm development and validation using synchronized EEG and cognitive performance to individualize a generalized model. Biol. Psychol. 2011, 87, 241–250. [Google Scholar] [CrossRef]
  8. Burges, C. A tutorial on support vector machines for pattern recognition. Data Min. Knowl. Discov. 1998, 2, 121–167. [Google Scholar] [CrossRef]
  9. Cortes, C.; Vapnik, V. Support-vector networks. Mach. Learn. 1995, 20, 273–297. [Google Scholar] [CrossRef]
  10. Hinterberger, T.; Nijboer, F.; Kübler, A.; Matuz, T.; Furdea, A.; Mochty, U.; Jordan, M.; Lal, T.N.; Hill, N.J.; Mellinger, J.; et al. Brain-Computer Interfaces for Communication in Paralysis: A Clinical Experimental Approach; Unpublished; MIT Press: Cambridge, MA, USA, 2007. [Google Scholar]
  11. Wijdicks, E.F. Brain death worldwide: Accepted fact but no global consensus in diagnostic criteria. Neurology 2002, 58, 20–25. [Google Scholar] [CrossRef] [PubMed]
  12. Szurhaj, W.; Lamblin, M.D.; Kaminska, A.; Sediri, H. EEG guidelines in the diagnosis of brain death. Neurophysiol. Clin. Neurophysiol. 2015, 45, 97–104. [Google Scholar] [CrossRef] [PubMed]
  13. Lee, T.S.; Goh, S.J.A.; Quek, S.Y.; Phillips, R.; Guan, C.; Cheung, Y.B.; Feng, L.; Teng, S.S.W.; Wang, C.C.; Chin, Z.Y.; et al. A brain-computer interface-based cognitive training system for healthy elderly: A randomized control pilot study for usability and preliminary efficacy. PLoS ONE 2013, 8, e79419. [Google Scholar] [CrossRef] [PubMed]
  14. Acı, Ç.İ.; Kaya, M.; Mishchenko, Y. Distinguishing mental attention states of humans via an EEG-based passive BCI using machine learning methods. Expert Syst. Appl. 2019, 134, 153–166. [Google Scholar] [CrossRef]
  15. Liu, N.H.; Chiang, C.Y.; Chu, H.C. Recognizing the degree of human attention using EEG signals from mobile sensors. Sensors 2013, 13, 10273–10286. [Google Scholar] [CrossRef]
  16. You, S.D. Classification of relaxation and concentration mental states with EEG. Information 2021, 12, 187. [Google Scholar] [CrossRef]
  17. Kothe, C.; Shirazi, S.Y.; Stenner, T.; Medine, D.; Boulay, C.; Grivich, M.I.; Makeig, S. The lab streaming layer for synchronized multimodal recording. Imaging Neurosci. 2025, 3, IMAG.a.136. [Google Scholar] [CrossRef]
  18. Blum, S.; Hölle, D.; Bleichner, M.G.; Debener, S. Pocketable labs for everyone: Synchronized multi-sensor data streaming and recording on smartphones with the lab streaming layer. Sensors 2021, 21, 8135. [Google Scholar] [CrossRef]
  19. Dornhege, G.; Blankertz, B.; Krauledat, M.; Losch, F.; Curio, G.; Müller, K.R. Combined optimization of spatial and temporal filters for improving brain-computer interfacing. IEEE Trans. Biomed. Eng. 2006, 53, 2274–2281. [Google Scholar] [CrossRef]
  20. McFarland, D.J.; Wolpaw, J.R. Brain-computer interfaces for communication and control. Commun. ACM 2011, 54, 60–66. [Google Scholar] [CrossRef]
  21. Pfurtscheller, G.; Neuper, C.; Birbaumer, N. Human brain-computer interface. In Motor Cortex in Voluntary Movements; Sporns, O., Ed.; CRC Press: Boca Raton, FL, USA, 2004; pp. 367–402. [Google Scholar]
  22. McFarland, D.J.; Krusienski, D.J. Brain-Computer Interfaces: Principles and Practice; Oxford University Press: Oxford, UK, 2012. [Google Scholar]
  23. Fatourechi, M.; Bashashati, A.; Ward, R.K.; Birch, G.E. EMG and EOG artifacts in brain computer interface systems: A survey. Clin. Neurophysiol. 2007, 118, 480–494. [Google Scholar] [CrossRef]
  24. Frey, J. Comparison of an open-hardware electroencephalography amplifier with medical grade device in brain-computer interface applications. arXiv 2016, arXiv:1606.02438. [Google Scholar]
  25. Jiang, X.; Bian, G.B.; Tian, Z. Removal of artifacts from EEG signals: A review. Sensors 2019, 19, 987. [Google Scholar] [CrossRef] [PubMed]
  26. Duvinage, M.; Castermans, T.; Petieau, M.; Hoellinger, T.; Cheron, G.; Dutoit, T. Performance of the Emotiv Epoc headset for P300-based applications. Biomed. Eng. Online 2013, 12, 56. [Google Scholar] [CrossRef] [PubMed]
  27. Jahani, H.; Safaei, A.A. Efficient deep learning approach for diagnosis of attention-deficit/hyperactivity disorder in children based on EEG signals. Cogn. Comput. 2024, 16, 2315–2330. [Google Scholar] [CrossRef]
  28. Chiang, H.S.; Hsiao, K.L.; Liu, L.C. EEG-based detection model for evaluating and improving learning attention. J. Med. Biol. Eng. 2018, 38, 847–856. [Google Scholar] [CrossRef]
  29. Alirezaei, M.; Sardouie, S.H. Detection of human attention using EEG signals. In Proceedings of the 2017 24th National and 2nd International Iranian Conference on Biomedical Engineering (ICBME), Tehran, Iran, 30 November–1 December 2017; IEEE: Piscataway, NJ, USA, 2017; pp. 1–5. [Google Scholar]
  30. Chang, C.C.; Lin, C.J. LIBSVM: A library for support vector machines. ACM Trans. Intell. Syst. Technol. 2011, 2, 27. [Google Scholar] [CrossRef]
  31. Moguerza, J.M.; Muñoz, A. Support vector machines with applications. Stat. Sci. 2006, 21, 322–336. [Google Scholar] [CrossRef]
  32. Hearst, M.A.; Dumais, S.T.; Osuna, E.; Platt, J.; Scholkopf, B. Support vector machines. IEEE Intell. Syst. 1998, 13, 18–28. [Google Scholar] [CrossRef]
  33. Drucker, H.; Burges, C.J.; Kaufman, L.; Smola, A.; Vapnik, V. Support vector regression machines. In Advances in Neural Information Processing Systems; MIT Press: Cambridge, MA, USA, 1996; Volume 9. [Google Scholar]
  34. Chen, D.; Huang, H.; Bao, X.; Pan, J.; Li, Y. An EEG-based attention recognition method: Fusion of time domain, frequency domain, and non-linear dynamics features. Front. Neurosci. 2023, 17, 1194554. [Google Scholar] [CrossRef]
  35. Xu, G.; Wang, Z.; Zhao, X.; Li, R.; Zhou, T.; Xu, T.; Hu, H. A subject-specific attention index based on the weighted spectral power. IEEE Trans. Neural Syst. Rehabil. Eng. 2024, 32, 1687–1702. [Google Scholar] [CrossRef] [PubMed]
  36. Wu, X.; Shi, C.; Yan, L. Driving attention state detection based on GRU-EEGNet. Sensors 2024, 24, 5086. [Google Scholar] [CrossRef] [PubMed]
  37. Ramoser, H.; Müller-Gerking, J.; Pfurtscheller, G. Optimal spatial filtering of single-trial EEG during imagined hand movement. IEEE Trans. Rehabil. Eng. 2000, 8, 441–446. [Google Scholar] [CrossRef] [PubMed]
  38. Lotte, F.; Guan, C. Regularizing common spatial patterns to improve BCI designs: Unified theory and new algorithms. IEEE Trans. Biomed. Eng. 2011, 58, 355–362. [Google Scholar] [CrossRef]
  39. Schirrmeister, R.T.; Springenberg, J.T.; Fiederer, L.D.J.; Glasstetter, M.; Eggensperger, K.; Tangermann, M.; Hutter, F.; Burgard, W.; Ball, T. Deep learning with convolutional neural networks for EEG decoding and visualization. Hum. Brain Mapp. 2017, 38, 5391–5420. [Google Scholar] [CrossRef]
  40. Salazar, A.; Safont, G.; Vergara, L.; Vidal, E. Graph regularization methods in soft detector fusion. IEEE Access 2023, 11, 138507–138520. [Google Scholar] [CrossRef]
  41. Ang, K.K.; Chin, Z.Y.; Zhang, H.; Guan, C. Filter bank common spatial pattern (FBCSP) algorithm on BCI Competition IV datasets 2a and 2b. Front. Neurosci. 2012, 6, 39. [Google Scholar] [CrossRef]
  42. Barachant, A.; Bonnet, S.; Congedo, M.; Jutten, C. Classification of covariance matrices using a Riemannian-based kernel for BCI applications. Neurocomputing 2012, 90, 60–68. [Google Scholar] [CrossRef]
  43. Lawhern, V.J.; Solon, A.J.; Waytowich, N.R.; Gordon, S.M.; Hung, C.P.; Lance, B.J. EEGNet: A compact convolutional neural network for EEG-based brain–computer interfaces. J. Neural Eng. 2018, 15, 056013. [Google Scholar] [CrossRef]
Figure 1. EEG-based attention-level assessment framework.
Applsci 15 10714 g001
Figure 2. Operational flowchart of the EEG-based drone control system.
Applsci 15 10714 g002
Figure 3. International 10–20 electrode placement system.
Applsci 15 10714 g003
Figure 4. Visual stimulation and EEG response setup.
Applsci 15 10714 g004
Figure 5. EEG data collection and preprocessing workflow for UAV control.
Applsci 15 10714 g005
Figure 6. Alpha-to-beta power ratios for focus state samples.
Applsci 15 10714 g006
Figure 7. Alpha-to-beta power ratios for relax state samples.
Applsci 15 10714 g007
Figure 8. Distribution of EEG feature values for focus and relax states.
Applsci 15 10714 g008
Figure 9. Normalized confusion matrix of SVM outputs.
Applsci 15 10714 g009
Figure 10. ROC curves of different classifiers (SVM, RF, LDA, QDA, NB, and fusion).
Applsci 15 10714 g010
Figure 11. Precision–Recall curves of different classifiers (SVM, RF, LDA, QDA, NB, and fusion).
Applsci 15 10714 g011
Table 1. Performance metrics of different classifiers in EEG-based attention control.
ClassifierACCAUCAP
Fusion0.8810.9180.899
SVM0.8810.8950.853
LDA0.8660.8940.870
Naive Bayes0.8510.8940.850
Random Forest0.8060.8910.867
QDA0.8210.8870.819
Table 2. Paired significance tests (t-test/Wilcoxon) comparing classifiers across k-fold CV. Values indicate p-values. Asterisks denote significance: * ( p < 0.05 ), ** ( p < 0.01 ). ns = not significant.
ComparisonACCAUCAP
SVM vs. RF0.044 */0.047 *nsns
SVM vs. LDAnsnsns
SVM vs. QDA 1.4 × 10 5 **/0.0049 **0.025 */0.0166 *0.011 */0.0166 *
SVM vs. Naive Bayes 4.9 × 10 5 **/0.0049 **ns0.025 */0.0093 *
Fusion vs. SVM0.011 */0.0256 *nsns
Table 3. Performance metrics of the real-time EEG-based attention control system.
Subject IDAccuracy (%)Response Time (s)Control Success Rate (%)
S187.21.2594.8
S284.51.4290.3
S386.11.3092.7
S483.61.4788.9
Mean85.41.3691.7
Disclaimer/Publisher’s Note: The statements, opinions and data contained in all publications are solely those of the individual author(s) and contributor(s) and not of MDPI and/or the editor(s). MDPI and/or the editor(s) disclaim responsibility for any injury to people or property resulting from any ideas, methods, instructions or products referred to in the content.