Abstract
Smart grid operators face escalating cyber threats and tight resource constraints, demanding the transparent, defensible prioritization of security controls. This paper asks how to select cybersecurity controls for smart grids while retaining picture fuzzy evidence throughout and supporting policy-sensitive “what-if” analyses. We propose a hybrid Picture Fuzzy Stepwise Weight Assessment Ratio Analysis (SWARA) and Combinative Distance-based Assessment (CODAS) framework that carries picture fuzzy evidence end-to-end over a domain-specific cost/benefit criteria system and a relative-assessment matrix, complemented by multi-scenario sensitivity analysis. Applied to ten prominent solutions across twenty-nine sub-criteria in four dimensions, the model highlights Performance as the most influential main criterion; at the sub-criterion level, the decisive factors are updating against new threats, threat-detection capability, and policy-customization flexibility; and Zero Trust Architecture emerges as the best overall alternative, with rankings stable under varied weighting scenarios. A managerial takeaway is that foundation controls (e.g., OT-integrated monitoring and ICS-aware detection) consistently remain near the top, while purely deceptive or access-centric options rank lower in this context. The framework contributes an end-to-end picture fuzzy risk-assessment model for smart grid cybersecurity and suggests future work on larger expert panels, cross-utility datasets, and dynamic, periodically refreshed assessments.
1. Introduction
Over the past decade, power systems have moved from isolated controls to digital, two-way smart grids. This shift has improved efficiency but also created more cyber risks. Even home devices such as smart inverters now need dedicated protection. In 2024, the U.S. National Institute of Standards and Technology (NIST) highlighted these risks in Report NISTIR 8498, noting that “open, Internet-facing protocols introduce new vulnerabilities” into smart grid communications. Because utilities cannot afford to apply every possible control, the key challenge is deciding which measures provide the best resilience for their cost while still meeting technical and regulatory requirements.
Researchers have approached this challenge as a multi-criteria decision-making (MCDM) problem, combining quantitative indicators with expert judgment to rank security alternatives. The early literature favored Analytic Hierarchy Process (AHP) hierarchies; for example, Bouramdane [1] used AHP to structure expert comparisons among encryption, intrusion detection, and incident response options for smart grids. While AHP provides a transparent framework, its pairwise comparisons are inherently subjective and can embed bias, especially when expert opinions diverge on novel, AI-driven defenses. AHP was utilized to structure expert comparisons of cybersecurity controls, including encryption, intrusion detection, and incident response, in smart grid environments [2].
To temper subjectivity, hybrid models such as the stochastic AHP + Fuzzy Technique for Order Preference by Similarity to Ideal Solution (TOPSIS) have been introduced. Zhao and Li [3] showed that integrating stochastic dispersion into AHP weights before a fuzzy TOPSIS ranking yields a more nuanced sustainability assessment of China’s “Strong Smart Grid” program. Nevertheless, single membership fuzzy sets capture only partial uncertainty and distance-based rankers that ignore inter-criterion conflict may misrepresent options when performance metrics are strongly correlated. Zhoung et al. present a unified framework that combines distributional robust optimization and a bilevel Stackelberg game to enable efficient collaboration between energy hubs and multi-energy users under uncertainty, reformulated into a solvable MILP and validated through case studies [4].
With these advancements, the expressive power of MCDM frameworks has expanded further. This includes approaches based on spherical fuzzy sets, neutrosophic sets, and PiFS. Under multidimensional uncertainty, neutrosophic Criteria Importance Through Intercriteria Correlation (CRITIC) has been used to evaluate AI-driven cybersecurity audit tools [2,5,6]. Recent methodological advances exploit richer uncertainty formalisms. For example, spherical fuzzy Markov chains combined with machine learning–based weighting have been applied to rank cybersecurity factors in microgrids, highlighting the strong impact of network redundancy investments [7]. Neutrosophic extensions go further by modeling truth, indeterminacy, and falsity simultaneously. Sahin fused CRITIC–Combinative Distance-based Assessment (CODAS) to select AI-based cybersecurity audit software, demonstrating superior robustness under joint sensitivity analysis [6]. Parallel work with Linear Diophantine fuzzy aggregation operators confirms that advanced fuzzy logics can sharpen cyber control rankings by widening the information domain over which ambiguity is expressed [8].
The SWARA–Best Worst Method (BWM) has been applied to assess and rank cybersecurity risks in small and medium-sized enterprises, where expert-driven prioritization is essential under resource limits [9]. In the context of security requirement engineering (SRE), Fuzzy AHP-TOPSIS has been applied to evaluate the usability of different approaches based on qualitative criteria such as efficiency, learnability, and productivity [10]. Moreover, fuzzy MCDM methods have been widely adopted for the performance evaluation of intrusion detection systems (IDSs), facilitating structured comparisons of prominent alternatives, including Zeek, Suricata, Open Source HIDS SECurity (OSSEC), and Snort, based on expert-defined assessment metrics [11]. Similarly, Fuzzy TOPSIS has proven to be effective in evaluating security risks in energy management and control systems (EMCS) by focusing on critical dimensions such as communication protocol vulnerabilities, node-level security, and the adequacy of network monitoring mechanisms [12].
Recent developments in fuzzy MCDM emphasize the use of interval-valued PiFS in order to model expert hesitation and uncertainty more accurately. A notable contribution is the SWARA and CODAS methodology, introduced by Gul et al. [13], in the context of renewable energy alternative selection. In this framework, interval-valued picture fuzzy sets (IVPFS) enable decision-makers to assign nuanced linguistic evaluations, while SWARA is used to obtain expert-driven criterion weights and CODAS ranks alternatives based on both Euclidean and Taxicab distances from an ideal solution. This hybrid approach has demonstrated a greater robustness and sensitivity than interval-valued PiFS–AHP–TOPSIS alternatives, offering clear benefits in ranking stability and stakeholder consensus. The mathematical framework of PiFS enables advanced aggregation methods, including the Picture Fuzzy Interactional Weighted Average (PFIWA) and similar operators, which maintain important properties such as monotonicity and shift invariance. These operators have shown a promising application in various MCDM domains by refining the treatment of neutral and refusal values in complex decision contexts [14,15].
The PiF-SWARA-CODAS approach adopted in this study provides more comprehensive uncertainty modeling and stronger discriminative power compared to the combinations commonly used in the literature. The PiFS environment captures epistemic uncertainties that are often overlooked by AHP or CRITIC-based methods by allowing experts to mathematically express not only positive and negative opinions but also neutral and abstentionist views [16]. This feature makes the decision-making process more realistic, especially in areas such as cybersecurity that involve high risk and uncertainty. Compared to AHP, the SWARA method requires fewer pairwise comparisons, making it more applicable for experts. It offers a transparent and practical weighting process based solely on the evaluation of criteria according to their order of importance [17,18]. Unlike CRITIC’s objective calculations based solely on variance and correlation, SWARA enables the context-specific weighting of criteria by directly incorporating expert experience into the process. The CODAS method overcomes the limited discriminative power of TOPSIS, which is based solely on Euclidean distance, by considering both Euclidean and Manhattan distances, thereby reliably distinguishing even alternatives with a very similar performance [19]. Indeed, in a study conducted by Gul et al. [13] on renewable energy selection, it was reported that IVPFS-SWARA-CODAS produced higher ranking stability and more robust results against rank reversal compared to IVPFS-AHP-TOPSIS. When all these features are combined, PiF-SWARA-CODAS not only ensures methodological integrity but also reflects uncertainties in expert opinions more effectively, resulting in more robust, flexible, and stakeholder-friendly decision-support mechanisms.
Despite this progress, three gaps persist: (i) few studies integrate objective weight elicitation with neutrosophic ranking in a single pipeline; (ii) comparative evidence across diverse fuzzy families remains fragmentary; and (iii) empirical applications centered specifically on smart grids’ cyber resilience are still limited.
This article addresses these gaps by proposing a fully integrated PiF-SWARA–CODAS framework for multi-criteria decision analysis in selecting cybersecurity solutions for smart grids. Subjective weights are elicited using the SWARA method under a picture fuzzy environment, allowing experts to express agreement, neutrality, and refusal degrees simultaneously, which better reflects real-world hesitancy in critical infrastructure decision-making. The CODAS ranking mechanism, adapted to the picture fuzzy domain, evaluates alternatives based on both Euclidean and Taxicab distances from the negative-ideal solution, ensuring higher discriminative power among closely performing cybersecurity options. By embedding both weighting and ranking stages in a picture fuzzy context, this study captures the epistemic uncertainty and hesitancy commonly encountered in smart grid cyber risk assessment. Unlike prior studies that combine heterogeneous fuzzy models, our hybrid design preserves picture fuzzy information consistently from weighting to ranking, ensuring methodological coherence and traceability. We further tailor the pipeline to a domain-specific criteria taxonomy with explicit cost/benefit treatment and a relative assessment matrix that enhances separation among close alternatives. Moreover, the proposed method constitutes a novel smart grid cybersecurity risk assessment model, providing an end-to-end, picture fuzzy evidence flow (from criterion weighting to alternative ranking) and enabling scenario-based stress testing aligned with stakeholder priorities. Using a real-world expert dataset, we
- Generate a transparent, stakeholder-sensitive ranking of candidate cybersecurity measures;
- Analyze expert judgment patterns across linguistic profiles to assess consistency and the influence of agreement, neutrality, and refusal on decision outcomes;
- Perform a sensitivity analysis on expert-weight variations and neutrality/refusal thresholds.
By combining state-of-the-art uncertainty modeling with practical decision support, this study contributes to the growing body of the picture fuzzy MCDM literature and offers a flexible, interpretable tool for smart grid cybersecurity planning under uncertainty.
The remainder of this article is organized as follows. Section 2 details the PiF-SWARA–CODAS framework and the mathematical preliminaries needed for our analysis. Section 3 operationalizes the framework in a smart grid cybersecurity case study by specifying the criteria system, expert panel, and alternatives and by computing the weights and the relative assessment matrix. Section 4 conducts a multi-scenario sensitivity analysis to examine the robustness of the rankings. Section 5 interprets the results in light of the research gap identified in Section 1 and discusses implications and limitations, and Section 6 concludes with key takeaways and avenues for future work.
2. Proposed Methodology
The recent development of smart grids has resulted in high levels of data generation. While this has led to an improvement in analysis capabilities and an increase in remote control possibilities, these developments have led to the emergence of serious cyber security threats [20]. The systems that these systems work with are Supervisory Control and Data Acquisition (SCADA) infrastructures, Internet of Things (IoT) devices, distributed energy resources, and cloud-based services, each of which constitute potential attack surfaces [21]. Therefore, selecting the appropriate cyber security solution for smart grids and evaluating alternatives is a complex problem involving various criteria and uncertainty.
The aim of this study is to model the uncertain situations encountered during the decision-making process in a more realistic way, and for this purpose, the PiFS approach is integrated into the decision problem. While traditional fuzzy sets allow the decision-maker to evaluate only one membership degree, PiFS offers a more flexible and in-depth model by defining simultaneous degrees of agreement, disagreement, and abstention of an alternative [16]. This feature allows for a more accurate accounting of hesitation, indecision, and ambivalence, which are especially prominent in decision problems based on human judgment.
It is extremely difficult to model and work with crisp numbers in decision problems with high risks and technical dimensions such as cyber security. To overcome this difficulty, the triple membership structure of PiFS was found appropriate. In this study, Picture Fuzzy Numbers (PiFN) are used not only in the weighting of criteria but also in the evaluation of alternative solutions, so that uncertainty is consistently tackled throughout the process. Thus, the diversity of evaluation results that may arise due to the individual differences in the experts consulted can be represented in a more realistic way than in classical fuzzy models. This approach contributes to obtaining results that are both more reliable and closer to practice.
The study adopted a two-stage methodology. In the first stage, the relative importance levels of the criteria were determined using the PİF-SWARA method. SWARA is a flexible method that allows decision-makers to express their priorities among criteria in a ranked form [17]. Compared with pairwise-comparison-intensive schemes (e.g., AHP), SWARA requires substantially fewer comparisons and reduces cognitive load while still capturing expert judgment on relative importance [22]. In our setting, PiFSs are adopted to encode expert opinions with positive, neutral, and negative membership degrees (subject to the PiFS constraint), which provides a richer representation of hesitation and neutrality than classical fuzzy/intuitionistic fuzzy models [23]. Accordingly, PiF-SWARA yields robust criterion weights under uncertainty by combining SWARA’s step-wise reweighting with PiFS’s extended expressiveness [24].
Within the scope of the methodology adopted, alternative solutions were evaluated with the PiF-CODAS method using the criteria weights determined in the first stage. CODAS is a distance-based MCDM approach that evaluates the performance of alternatives based on their Euclidean and Taxicab distances from the negative ideal solution [25]. The Euclidean distance is used first, but when alternatives cannot be distinguished by this criterion, a more precise comparison is made using the Taxicab distance [19]. It uses the Euclidean (L2) distance as the primary separation measure and invokes the Taxicab (L1) distance as a tie-breaker when alternatives are very close, thereby improving the discrimination power in crowded decision spaces [26]. Embedding CODAS in the Picture Fuzzy environment allows us to process linguistic expert inputs directly and to obtain more informative relative assessment matrices for ranking cybersecurity [27].
In the study, PiF-SWARA and PiF-CODAS methods were used together to reflect the uncertainties and complexities in the model in a systematic way. Thus, it provides a robust methodological framework for multidimensional evaluation of cyber security solutions in smart grids. Taken together, the PiF-SWARA and PiF-CODAS pipeline offers (i) lower elicitation burden during weighting, (ii) enhanced handling of expert neutrality/refusal, and (iii) stronger ranking discrimination when alternatives are close—capabilities that are particularly relevant in smart grid cybersecurity selection. Algorithms 1–3 presents the pseudocode of the proposed methodology.
| Algorithm 1: Picture Fuzzy SWARA and CODAS |
Common Inputs and Notation
|
| Algorithm 2: Picture Fuzzy SWARA (PiF-SWARA)—Criterion Weighting |
| Input: Evaluated lists of criteria from each expert; linguistic scale with PiFN mappings; PFWA and score function S(·). Output: Normalized weights w1, …, wm with
|
| Algorithm 3: Picture Fuzzy CODAS (PiF-CODAS)—Ranking Alternatives |
| Input: Expert evaluations of alternatives on each criterion (linguistic → PiFN), weights w1, …, wm from PiF-SWARA, threshold τ ∈ [0.01, 0.05]. Output: Scores Hi and ranking of alternatives A1, …, An (higher Hi ⇒ better).
End |
This structure makes the decision process sensitive not only to technical data but also to the fuzzy nature of expert judgments selection [19,28]. The flow chart representing the methodology adopted in the study is as given in Figure 1.
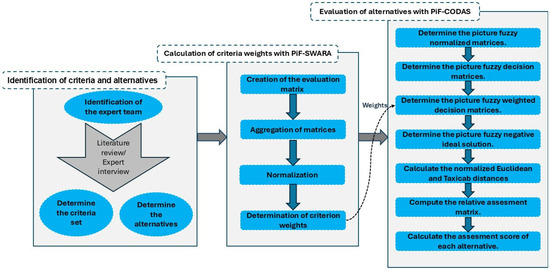
Figure 1.
The proposed methodology.
2.1. Preliminaries of Picture Fuzzy Sets
Definition 1
[16]. PiFS defined over a universe X as follows:
where the functions: μA (x) ∈ [0, 1] quantifies the positive membership degree of x to the set A, ηA (x) ∈ [0, 1] measures the neutral or indeterminate membership, and vA (x) ∈ [0, 1] expresses the negative membership degree.
These values are bound by the following condition:
Based on this, the refusal (rejection) degree of an element x in relation to A is given by
In PiFS, denotes the refusal (rejection) degree, i.e., the residual margin after accounting for positive, neutral, and negative memberships, with
Definition 2
[16,29]. Let α = (μα,ηα,vα) and β = (μβ,ηβ,vβ) be two PiFNs. The fundamental arithmetic operations between these two numbers are defined as follows:
Addition:
Multiplication:
Scalar Multiplication (for λ > 0):
Scalar Power (for λ > 0):
Definition 3
[16,30]. Given a PiFN α = (μα,ηα,vα), its score function is calculated by the following expression:
Definition 4
[31]. Let αj = (μαj,ηαj,ναj) be a collection of PiFNs for (J = 1, 2, …, n). The Picture Fuzzy Weighted Average (PFWA) operator is defined as follows:
where ω = (ω1,ω2,…,ωn)T is the corresponding weight vector for the PiFNs, satisfying the conditions .
The result of the PFWA aggregation is itself a PiFN, calculated by the following:
As stated, the weight vector ω = (ω1,ω2,…,ωn)T must meet the criteria ωj > 0 and .
2.2. Picture Fuzzy SWARA-CODAS
Step 1. Construction of the Decision Matrix:
Let C = {c1, c2, …, cn} denote the set of evaluation criteria
E = {e1, e2… el} represent the group of experts providing judgments;
A = {a1, a2… am} denote the set of alternative options under consideration [32].
Step 2. Development of Criteria Evaluation Matrices:
At this stage, each expert individually evaluates the criteria using a predefined linguistic scale. The corresponding linguistic terms and their associated values are provided in Table 1. The linguistic terms and their numerical mappings follow a standard picture fuzzy scale used in the literature [33] and were adopted then minimally calibrated with a pilot to fit the context of smart grid cybersecurity.

Table 1.
Linguistic expressions and fuzzy number equivalents to evaluate the criteria [23,33].
Step 3. Aggregation of Evaluation Matrices:
In this phase, the individual evaluations provided by the experts are aggregated using the PFWA operator. Let Z = [zij]m × n represent the aggregated decision matrix, where the aggregation for each criterion is calculated using the following formula:
Here, i = 1… n and k = 1, … l, where n is the total number of criteria and l is the number of experts involved in the evaluation process. At this stage, it is assumed that all experts are assigned equal weights.
Step 4. Determination of Criteria Weights:
Step 4.1. The net score values of each criterion are calculated using Equation (12):
Step 4.2. Based on expert assessments, the criteria are ranked from the most important to the least important [32].
Step 4.3. Each criterion’s relative importance is then compared against that of the highest-ranked criterion.
Step 4.4. The comparative importance value kj is determined using Equation (13). This value expresses the incremental importance between criterion j and its immediate predecessor (j − 1), where sj denotes the score difference used to compute the sequential importance:
Step 4.5. The unnormalized weight pj of each criterion is computed using Equation (14), followed by normalization to obtain the final weight values wj, as shown in Equation (15):
Step 5. Construct the Decision Matrix:
For the decision matrix X, where decision-makers assess the performance of each alternative with respect to each criterion, the corresponding linguistic terms and their associated values are provided in Table 1.
where ≥ 0 and
Step 6. Aggregation of Evaluation Matrices:
PFWA operator is used to aggregate expert opinions again.
Step 7. Normalization of the Decision Matrix:
In the case of cost-type criteria, the normalization is performed using the formula provided below. For benefit-type criteria, normalization is unnecessary.
Step 8. Construction of a Weighted Normalized Decision Matrix:
The values of the picture fuzzy weighted normalized matrix are computed using Equation (18), where wj takes values ranging from 0 to 1:
Step 9. Calculation of Negative Ideal Solutions:
The negative ideal solution for the picture fuzzy weighted normalized values is determined using score functions (see Definition 3).
Step 10. Calculation of Euclidean Distance (Ei) and Taxicab Distance (Ti) Cap Distances:
Calculate the Euclidean (Ei) and Taxicab (Ti) distances of the alternatives from the negative ideal solution. In this step, Equation (19) is used to compute the Euclidean distances. To determine the Taxicab distance, the normalized Hamming distance formula proposed by Cuong and Kreinovich [16] is applied as follows:
Step 11. Construct the Relative Assessment (Ra) Matrix, As Shown Below:
Construct the relative assessment (Ra) matrix using Equation (21), where k ∈ {1, 2, …, n}, and ψ represents a threshold function used to determine the equivalence of the Euclidean distances between two alternatives, as defined in Equation (22). The threshold parameter (τ) is adjustable by the decision-maker and must lie within the range of 0.01 to 0.05. If the Euclidean distance difference between two alternatives is smaller than τ, their comparison will also incorporate the Taxicab distance.
Step 12. Compute the Assessment Score Hi for Each Alternative Using the Following Formula:
A higher Hi indicates a more suitable alternative.
Step 13. Ranking of Alternatives:
Rank the alternatives in descending order based on their Hi values. The alternative with the highest Hi is considered the best among the available options.
3. Case Study
Building on the PiF-SWARA–CODAS formulation in Section 2, we now specify the case context, criteria hierarchy, expert panel, and alternative set required to run the model end-to-end.
First, this study aims to identify and select the most appropriate cybersecurity solutions for smart grid systems under uncertainty. To construct the sub-criteria, we followed a three-step procedure. First, we performed a scoping review of smart grid cybersecurity standards and guidelines and the peer-reviewed literature to compile a long list of candidate factors covering technical, operational, and economic aspects. Second, we consolidated and normalized the items for the smart grid context by merging near-duplicates, harmonizing terminology, and mapping each item to one of four dimensions (Economic Impact, Performance, Manageability, and Security Features). Third, a two-stage expert screening/pilot assessed each item’s (a) relevance to smart grid operations, (b) observability/measurability in real deployments, and (c) actionability for decision support, using our linguistic scale. The criteria set, comprising 29 sub-criteria under four main categories (Cost Structure, Performance and Reliability, Manageability, and Security Features), reflects both technical and operational requirements critical to the protection of smart grid infrastructures. Detailed definitions of these criteria are provided in Table 2.
Table 2.
Evaluation criteria.
After determining the evaluation criteria, a set of alternative cybersecurity solutions was established through an analysis of the literature and expert input. The considered alternatives represent a diverse range of cutting-edge cybersecurity approaches and technologies applicable to modern smart grids.
The importance weights of the criteria were obtained using the PiF-SWARA method, which allows experts to express their preferences under uncertainty with a flexible linguistic scale. Subsequently, each alternative was evaluated in terms of its performance with respect to the identified criteria, using expert assessments and the same linguistic scale. In the final stage, the PiF-CODAS method was employed to rank the cybersecurity alternatives by integrating the calculated criteria weights. This combined approach enables a transparent and robust multi-criteria decision-making process for the selection of optimal cybersecurity solutions for the smart grid environment.
3.1. Expert Team
This study places a strong emphasis on the rigor and breadth of expert input in the evaluation and prioritization of cybersecurity solutions for smart grid systems. To ensure a comprehensive and multidisciplinary perspective, a panel of five experts was established, each with significant expertise in domains directly relevant to cybersecurity, smart grids, industrial systems, and critical infrastructure protection. The expert pool was carefully composed to include both academic scholars and industry practitioners, representing a blend of backgrounds in computer engineering, industrial engineering, information security, electrical power systems, and operational risk management. This diversity helped to capture a holistic view of the technical, operational, and strategic considerations required for robust cybersecurity decision-making in smart grid contexts.
Each expert contributed at three key stages of the process: refining and validating the evaluation criteria, determining the relative importance (weights) of these criteria using structured linguistic scales within the PiF-SWARA framework, and assessing each cybersecurity alternative with respect to the established criteria for the subsequent PiF-CODAS analysis. Experts provided their judgments independently and anonymously to minimize bias and potential group influence. Clear instructions, detailed definitions, and structured assessment forms were distributed to all participants to standardize the input and improve consistency. Detailed information about the expert team and their backgrounds is provided in Table 3.
Table 3.
Information about the expert team.
3.2. Alternatives for Cybersecurity Solutions for Smart Grid Systems
In this study, ten cybersecurity solution alternatives were selected to represent the broad spectrum of contemporary approaches and technologies for securing smart grid infrastructures. These alternatives were identified through a combination of an extensive literature review and expert consultations, ensuring the inclusion of both well-established and emerging strategies. The selection covers key areas of cybersecurity for smart grids, ranging from advanced network monitoring and threat detection to robust encryption, identity management, and architectural innovations. Together, these alternatives address diverse security requirements such as real-time anomaly detection, data integrity, system resilience, and operational access control. By encompassing both preventive and responsive solutions, as well as foundational and innovative technologies, the alternative set provides a comprehensive basis for evaluating cybersecurity priorities in smart grid environments. The selected alternatives are:
A1. ICS/SCADA-Specific IDS/IPS: Intrusion detection and prevention systems (IDS/IPS) tailored for industrial control systems (ICS) and Supervisory Control and Data Acquisition (SCADA) networks to monitor and block suspicious activity within critical smart grid infrastructure [34].
A2. AI/ML-Based Anomaly Detection: Artificial intelligence and machine learning-powered tools that continuously analyze network behavior to identify and respond to unusual or malicious activity in real time [35].
A3. OT-Integrated SIEM Solutions: Security Information and Event Management (SIEM) platforms integrated with Operational Technology (OT) environments, enabling centralized monitoring, analysis, and incident response across smart grid systems [36].
A4. Hardware Security Modules (HSM): Dedicated hardware devices that securely manage cryptographic keys, support encryption operations, and provide tamper-resistant protection for critical data and communications [37].
A5. Blockchain-Based Data Integrity: Distributed ledger technologies that ensure the immutability and traceability of smart grid data, protecting against tampering, unauthorized access, and fraud [38].
A6. Advanced Grid Communication Encryption: State-of-the-art encryption protocols and technologies designed to safeguard the confidentiality and integrity of data transmitted across smart grid communication channels [39].
A7. IAM for Operational Infrastructure: Identity and Access Management (IAM) solutions tailored for smart grid environments, ensuring that only authorized users and devices can access critical systems and data [40].
A8. Zero Trust Architecture (ZTA): A security model based on the principle of “never trust, always verify,” requiring continuous authentication and strict access controls throughout the smart grid network [40].
A9. Network Segmentation: Techniques for dividing the smart grid network into isolated segments to contain potential threats and limit the spread of attacks [36].
A10. Honeypot/Deception Systems: Deceptive systems and decoy resources deployed to detect, divert, and analyze attackers by luring them away from genuine smart grid assets [41].
These alternatives were chosen for their practical relevance, technological diversity, and alignment with current and anticipated cybersecurity challenges in smart grid systems. They collectively support a robust, multi-layered security posture necessary for the safe and reliable operation of modern power infrastructure.
3.3. Calculation of Criteria Weights with the PiF-SWARA Method
In this study, the input of five experts was utilized to define the evaluation criteria, determine their weights, and assess the ranking of cybersecurity alternatives for smart grids. All data in the study was collected directly from expert assessments through structured forms tailored for this research. Experts rated the importance of each criterion using the linguistic scale presented in Table 1. The results of the main criteria assessments by each expert are summarized in Table 4.
Table 4.
Expert evaluations for the main criteria.
Next, expert judgments on the main criteria were combined, with each expert’s input considered equally. The PiF-SWARA method was then implemented to systematically calculate the final weights of the main criteria, as illustrated in Figure 2.
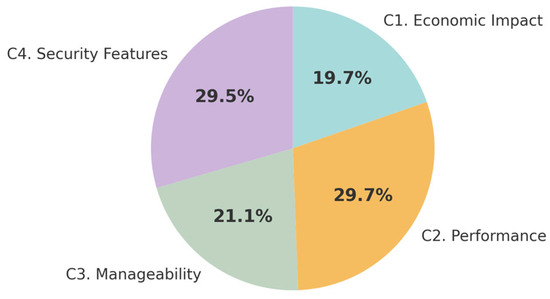
Figure 2.
Main criteria weights.
According to Figure 2, the most significant main criterion in the selection of optimal cybersecurity solutions for smart grids is Performance, with a weight of 0.30. Security Features rank as the second most important criterion, accounting for a weight of 0.29. Manageability follows with a weight of 0.21, while Economic Impact is considered the least influential criterion in this decision process, with a weight of 0.20. After determining the main criteria weights, the expert team proceeded to evaluate the sub-criteria within each group. Table 5 presents the sub-criteria assessments provided by each expert.
Table 5.
Expert evaluations for sub-criteria.
Next, the local weights of the sub-criteria within each main criterion were calculated using the PiF-SWARA method. These local sub-criteria weights were then multiplied by their respective main criterion weights to determine the overall (global) weights for each sub-criterion. The resulting final weights of the sub-criteria are presented in Table 6.
Table 6.
Weights of criteria.
The results in Table 7 show that the most influential sub-criterion in selecting cybersecurity solutions for smart grids is “C41. Ability to Update Against New Threats”, reflecting the critical importance of adaptability in dynamic cyber environments. “C27. Threat Detection Rate” and “C42. Flexibility to Customize Policies” also received high weights, highlighting the need for both effective threat identification and adaptable security management. On the other hand, factors such as “C36. Remote Maintenance Capability”, “C13. Maintenance Cost”, and “C35. Required Technical Expertise” were ranked lowest, indicating that, while operational aspects are important, they are considered less decisive than core security and system performance features in this context. Having obtained global sub-criterion weights in Table 7, Section 3.4 combines these weights with the aggregated alternative evaluations to compute the PiF-CODAS distances and relative assessment matrix.
Table 7.
Relative assessment matrix.
3.4. Evaluation of Cybersecurity Alternatives
At this stage, cybersecurity solution alternatives for smart grids were evaluated using the PiF-CODAS method. The same panel of experts assessed each alternative based on the established criteria, applying the predefined linguistic scale (given in Table 1) to ensure a consistent and systematic evaluation process. Table A1 (see Appendix A) presents the expert evaluations. The resulting relative assessment matrix was constructed using aggregated expert judgments following the methodological steps outlined in the study. In the implementation, the negative ideal solutions and method parameters were determined according to standard PiF-CODAS procedures. The threshold value is set to 0.2. In this evaluation, the following criteria were considered as cost-type attributes: Initial Investment Cost (C11), Operating Cost (C12), Maintenance Cost (C13), Training Needs (C16), Deployment Time (C25), False Positive Rate (C28), Required Technical Expertise (C35), and Response Time (C37), where lower values are more desirable. All remaining criteria were evaluated as a benefit-type, meaning higher values indicate a more favorable performance. The final relative assessment matrix is presented in Table 7.
The scores for each cybersecurity alternative were determined using the PiF-CODAS method, and the resulting final rankings are presented in Figure 3.
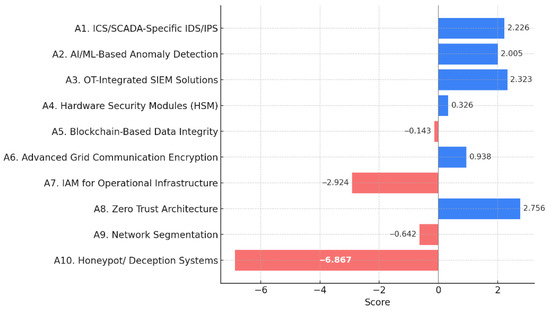
Figure 3.
Scores of alternatives.
The results reveal that Zero Trust Architecture (A8) emerges as the most favorable cybersecurity solution for smart grids, achieving the highest score (2.756) and ranking first among the alternatives. This underscores the growing recognition of comprehensive, identity-centric security models in safeguarding critical infrastructure. OT-Integrated SIEM Solutions (A3), ICS/SCADA-Specific IDS/IPS (A1), and AI/ML-Based Anomaly Detection (A2) also perform strongly, highlighting the value of real-time monitoring, advanced detection, and system-specific protection mechanisms. In contrast, solutions such as the Honeypot/Deception Systems (A10), IAM for Operational Infrastructure (A7), and Network Segmentation (A9) received lower or negative scores, suggesting these approaches may present limitations in scalability, integration, or overall impact within smart grid environments. Notably, technologies like Advanced Grid Communication Encryption (A6) and Hardware Security Modules (HSM) (A4) demonstrate a moderate performance, indicating that, while they contribute to security, they may need to be combined with broader, system-level solutions for optimal effectiveness. The resulting relative assessment matrix (Table 7) yields the base case scores summarized in Figure 3. Section 4 stress tests these rankings under six weighting scenarios to assess robustness across stakeholder priorities.
4. Sensitivity Analysis
Using the base weights from Table 6 and the alternative performance assessments of Section 3.4, we evaluate the ranking stability under six scenarios that emphasize different main criteria priorities (Table 8).
Table 8.
Scenario analysis results.
To assess the robustness of the alternative rankings, a comprehensive sensitivity analysis was conducted by defining six distinct weighting scenarios. This analysis explored how variations in the importance assigned to different main criteria could affect the prioritization of cybersecurity solutions for smart grids. Each scenario simulates a different decision-making perspective or stakeholder priority, thereby stress-testing the reliability of the model’s recommendations.
S1. Equal Weights Scenario: In this baseline scenario, equal weights are assigned to all criteria. This neutral reference point ensures each dimension of evaluation has the same influence on the final rankings, independent of subjective preferences.
S2. Cost-Driven Scenario: Here, the Cost Structure criterion is prioritized, receiving a total weight of 0.50, while the remaining 0.50 is distributed equally among the other three main criteria. This scenario reflects contexts where economic considerations, such as cost efficiency and resource allocation, are paramount.
S3. Performance-Focused Scenario: In this scenario, a greater emphasis is placed on Performance and Reliability, which is assigned a weight of 0.50, with the rest of the weight divided equally among the other criteria. This setting simulates environments where technical performance, system reliability, and operational excellence are the primary concerns.
S4. Security-Emphasis Scenario: This scenario assigns the highest priority to Security Features, giving it a weight of 0.50, with the remaining weight split equally among the other criteria. This reflects decision-making processes that place a premium on advanced security capabilities, threat responses, and data protection.
S5. Manageability-Oriented Scenario: In this case, Manageability receives a total weight of 0.50, and the other criteria share the remaining 0.50 equally. This models situations where the ease of integration, scalability, and operational control are considered to be the most critical factors.
S6. Balanced Security–Performance Scenario: In this additional scenario, equal weights are assigned to all four main criteria.
The results of the alternative rankings under each scenario are provided in Table 8. S0 present the current solution.
The sensitivity analysis across multiple weighting scenarios demonstrates the robustness and consistency of the ranking results for cybersecurity solutions in smart grids. Notably, Zero Trust Architecture (A8) and OT-Integrated SIEM Solutions (A3) consistently occupy the top two positions in almost all scenarios, underscoring their broad applicability and effectiveness regardless of changing stakeholder priorities. ICS/SCADA-Specific IDS/IPS (A1) also performs strongly, frequently ranking among the top three alternatives, particularly in scenarios where Cost or Manageability are weighted more heavily. This indicates the importance of foundational monitoring and detection systems as a core component of smart grid security.
Meanwhile, IAM for Operational Infrastructure (A7) and Honeypot/Deception Systems (A10) persistently receive the lowest scores across all scenarios, reflecting their relatively limited overall impact or suitability under the evaluated criteria. Other alternatives, such as Advanced Grid Communication Encryption (A6) and AI/ML-Based Anomaly Detection (A2), show moderate fluctuations but generally maintain mid-range rankings, suggesting their performance is more sensitive to the weighting of specific criteria like performance or security features. Overall, the analysis confirms that, while minor shifts in criteria weights can influence the ordering of mid-ranked solutions, the most and least favorable alternatives remain stable, providing strong validation for the model’s recommendations. The scenario results (Table 8) show limited rank volatility among the top and bottom alternatives, indicating robust preferences. Section 5 relates these findings to the research gap stated in Section 1, with implications for smart grid security planning.
5. Comparative Analysis
To validate the robustness of the PiF-CODAS ranking, we performed a comparative analysis using Picture Fuzzy TOPSIS (PiF-TOPSIS) on the same expert-aggregated decision matrix, with the PiF-SWARA weights and the identical cost/benefit treatment. The procedure followed the standard PiF-TOPSIS pipeline: (i) picture fuzzy normalization of the decision matrix; (ii) application of criterion weights to obtain the weighted matrix; (iii) construction of the positive and negative ideal solutions; and (iv) computation of each alternative’s closeness coefficient based on its distances to the two ideals. Detailed numerical results and the full PiF-TOPSIS ranking are reported in Table 9.
Table 9.
Results of PiF-TOPSIS.
Figure 4 presents a side-by-side comparison of alternative rankings obtained from PiF-TOPSIS and the proposed PiF-SWARA→PiF-CODAS pipeline.
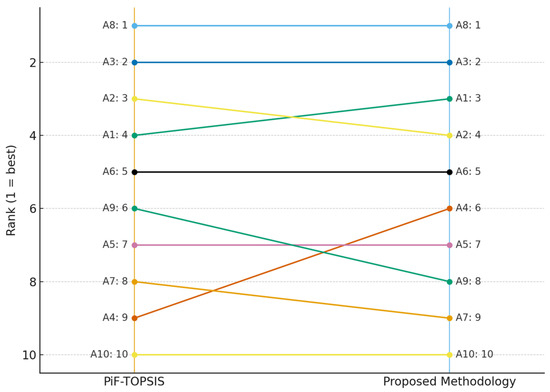
Figure 4.
Comparative rankings.
Both methods show a strong agreement at the extremes: Zero Trust Architecture (A8) is ranked first and Honeypot/Deception (A10) last by both PiF-TOPSIS and the proposed PiF-SWARA→PiF-CODAS pipeline, while OT-Integrated SIEM (A3) remains solidly in second place. Stability also appears for Blockchain-based Integrity (A5) and Advanced Communication Encryption (A6), which keep their mid–upper positions across methods. Differences are concentrated in the middle tier: the proposed methodology elevates HSM (A4) from the lower ranks to mid-pack and slightly demotes Network Segmentation (A9) and IAM for OT (A7) relative to PiF-TOPSIS. A minor swap is observed between A1 (ICS/SCADA IDS/IPS) and A2 (AI/ML Anomaly Detection) around ranks 3, 4.
6. Results and Discussions
We interpret the base case and scenario outcomes reported in Section 3 and Section 4 with respect to the need for a consistent, end-to-end picture fuzzy decision pipeline. This study makes an important addition to the current literature by addressing critical gaps identified in prior research on cybersecurity solutions for smart grids. Our integrated PiF-SWARA, CODAS framework combines expert hesitation and neutrality. This approach captures a more realistic view of uncertainty that is often present in decision-making for critical infrastructure. In the baseline configuration (S0), the top four alternatives and their scores are A8 Zero Trust Architecture = 2.756, A3 OT-Integrated SIEM = 2.323, A1 ICS/SCADA-Specific IDS/IPS = 2.226, and A2 AI/ML-Based Anomaly Detection = 2.005; the lowest are A10 Honeypot/Deception = −6.867, A7 IAM for Operational Infrastructure = −2.924, and A9 Network Segmentation = −0.642 (Figure 3; Table 8). The findings underscore Zero Trust Architecture (A8) as the most effective cybersecurity solution for smart grid environments, closely followed by OT-Integrated SIEM Solutions (A3) and ICS/SCADA-Specific IDS/IPS (A1). These results match the increasing focus in the literature on identity-based, constantly validated security methods that can address the changing threat landscape for smart grid systems. Previous studies by [3,6] have shown the strength and responsiveness of hybrid fuzzy MCDM methods. Our approach grows from these ideas by merging objective weight elicitation with a neutrosophic ranking of alternatives into one framework, an alteration serving to fix problems of the older methods that took these elements as separate. With respect to using PiFS, a great advantage is that it can simultaneously consider positive, negative, and neutral degrees. This effectively answers the questions raised in the previous literature regarding the inappropriate treatment of expert hesitation and uncertainty. The use of PiFS is methodologically very interesting as it can simultaneously consider positive, negative, and neutral degrees. This approach defends against criticism arising in the earlier literature, commenting on the absence of proper treatment for expert hesitation and uncertainty. Quantitatively, the main criteria weights are Performance = 0.30, Security Features = 0.29, Manageability = 0.21, and Economic Impact = 0.20 (Figure 2). The robustness of our results was validated through a comprehensive sensitivity analysis, further reinforcing their reliability. Across seven scenarios (S0–S6), A8 remains ranked first in six of seven cases (S0, S1, S2, and S4–S6) with scores from 2.655 (S1) to 3.099 (S2), whereas in the performance-focused scenario (S3), A2 attains rank one with 3.668 (Table 8). The consistency of the results also speaks to the flexibility and stability of our proposed methodology, qualities deemed essential for decision-making under uncertainty by [13,14].
Nonetheless, there exist limitations in this study. As is common in most MCDM studies, the limited number of experts used in this study must serve as a caveat for generalizing the results. Future research may, therefore, consider using a larger expert group or groups with heterogeneity in their background to improve external validity. Another limitation regards using the identified evaluation criteria and sub-criteria, which were decided upon by expert opinion and the literature, meaning certain emerging security concerns might have been left out. Future studies may provide a solution to these shortcomings by creating a mechanism whereby the criteria can be updated in tandem with changes occurring in the cybersecurity area.
In conclusion, it is formulated to adduce a PiF-SWARA–CODAS framework as an efficient, robust, and comprehensive means of optimal cybersecurity solution selection in the complex and uncertain ambience of smart grids. This work significantly enhances methodological rigor, broadens the scope of uncertainty handling, and delivers actionable insights that align closely with contemporary cybersecurity challenges. Finally, Section 6 distills the practical implications for utilities and outlines research directions enabled by our framework.
7. Conclusions
Thus, it can be said that the current PiF-SWARA-CODAS framework is an extremely useful, robust, and all-in-one tool for selecting optimum cybersecurity solutions in the complex and uncertain environment of smart grids. This study significantly enriches the methodological rigor, broadens the scope of handling uncertainty, and supplies actionable insights closely aligned with contemporary cybersecurity challenges. The sensitivity analysis that serves as a risk adaptation has empirically validated the trustworthiness and adaptability of the framework. The proposed PiF-SWARA–CODAS pipeline prioritizes Performance (0.30) and Security Features (0.29) at the main criteria level (Figure 2), with C41 = 0.0582, C27 = 0.0502, and C42 = 0.0484 as the most influential sub-criteria (Table 6). In the baseline ranking (S0), A8 leads with 2.756, followed by A3 = 2.323, A1 = 2.226, and A2 = 2.005, while A10 = −6.867 and A7 = −2.924 score the lowest (Figure 3). Robustness checks confirm that A8 retains rank one in 6/7 scenarios (min–max 2.655–3.099), and A2 becomes rank one under the performance-focused scenario (S3) with 3.668 (Table 8).
A key limitation of this study is the small expert panel (n = 5). Although the participants possess substantial domain experience and provided independent, anonymous judgments captured with picture fuzzy representations (agreement/neutrality/refusal), a panel of this size may introduce sampling bias and constrain external validity. Small samples can also increase variance in estimated weights and reduce the stability of mid-ranked alternatives. We partially mitigate these concerns by using an end-to-end picture fuzzy pipeline and multi-scenario sensitivity analysis, which shows that top and bottom positions remain stable under substantial weight shifts; however, the findings should still be interpreted with caution. Future studies should consider larger and stratified expert panels, multi-round elicitation (e.g., Delphi) to reduce dispersion, and formal agreement diagnostics (e.g., inter-rater concordance) to quantify the consensus. Cross-utility replications and periodic reassessments would further enhance generalizability as threat landscapes and operational constraints evolve.
For future studies, the extension of this approach to other critical infrastructure domains is encouraged, and the integration of advanced analytical techniques should be worked toward for decision-making improvement.
Author Contributions
Conceptualization and methodology, E.A. and B.K.; software, B.K.; validation, E.A.; formal analysis, B.K.; data curation, B.Y.K., E.A. and T.K.K.; writing—original draft preparation, B.Y.K. and T.K.K.; writing—review and editing, E.A.; visualization, B.K.; supervision, E.A. All authors have read and agreed to the published version of the manuscript.
Funding
This research received no external funding.
Institutional Review Board Statement
Not applicable.
Informed Consent Statement
Not applicable.
Data Availability Statement
The datasets generated and analyzed during the current study are available from the corresponding author on reasonable request.
Conflicts of Interest
The authors declare no conflicts of interest.
Abbreviations
The following abbreviations are used in this manuscript:
| AHP | Analytic Hierarchy Process |
| BWM | Best Worst Method |
| CODAS | Combinative Distance-Based Assessment |
| CRITIC | Criteria Importance Through Intercriteria Correlation |
| EMCS | Energy Management and Control Systems |
| HSM | Hardware Security Modules |
| IAM | Identity and Access Management |
| ICS | Industrial Control Systems |
| IDS | Intrusion Detection System |
| IoT | Internet of Things |
| IPS | Intrusion Prevention System |
| IVPFS | Interval-Valued Picture Fuzzy Sets |
| MCDM | Multi-Criteria Decision Making |
| MTBF | Mean Time Between Failures |
| NIST | National Institute of Standards and Technology |
| NISTIR | NIST Interagency/Internal Report |
| OSSEC | Open Source HIDS SECurity |
| OT | Operational Technology |
| PFIWA | Picture Fuzzy Interactional Weighted Average |
| PFWA | Picture Fuzzy Weighted Average |
| PiFS | Picture Fuzzy Set |
| PiFN | Picture Fuzzy Numbers |
| ROI | Return on Investment |
| SCADA | Supervisory Control and Data Acquisition |
| SIEM | Security Information and Event Management |
| SRE | Security Requirement Engineering |
| SWARA | Stepwise Weight Assessment Ratio Analysis |
| TOPSIS | Technique for Order Preference by Similarity to Ideal Solution |
| ZTA | Zero Trust Architecture |
Appendix A
Table A1.
Expert evaluations for alternatives.
Table A1.
Expert evaluations for alternatives.
| C11 | C12 | C13 | C14 | C15 | C16 | C17 | C21 | C22 | C23 | C24 | C25 | C26 | C27 | C28 | C31 | C32 | C33 | C34 | C35 | C36 | C37 | C41 | C42 | C43 | C44 | C45 | C46 | C47 | ||
|---|---|---|---|---|---|---|---|---|---|---|---|---|---|---|---|---|---|---|---|---|---|---|---|---|---|---|---|---|---|---|
| E-1 | A1 | MH | MH | H | M | MH | M | MH | H | H | H | VH | H | H | VH | H | ML | ML | M | M | MH | M | MH | ML | ML | M | ML | ML | M | M |
| A2 | H | MH | MH | MH | M | MH | MH | H | H | H | H | H | H | VH | H | M | M | M | ML | ML | M | MH | M | ML | ML | M | M | M | ML | |
| A3 | H | MH | MH | MH | MH | MH | MH | H | H | H | H | H | H | VH | H | M | ML | M | M | M | MH | MH | ML | MH | ML | ML | M | M | ML | |
| A4 | MH | MH | MH | MH | MH | MH | MH | H | H | H | H | H | H | VH | H | M | M | M | M | M | M | M | MH | ML | M | ML | MH | ML | M | |
| A5 | ML | H | MH | MH | MH | H | MH | MH | MH | MH | MH | MH | MH | MH | MH | ML | ML | ML | ML | ML | ML | ML | ML | ML | ML | ML | MH | M | M | |
| A6 | M | MH | M | MH | H | H | MH | H | H | H | H | H | H | VH | H | M | M | M | MH | ML | M | MH | MH | M | ML | M | M | MH | ML | |
| A7 | MH | MH | H | MH | H | M | MH | H | H | H | H | H | H | VH | H | MH | M | ML | M | MH | M | MH | ML | M | ML | M | M | MH | ML | |
| A8 | M | MH | H | H | H | H | MH | H | H | H | H | H | H | VH | H | M | M | ML | M | MH | M | MH | M | ML | M | M | MH | ML | MH | |
| A9 | ML | MH | H | H | H | MH | MH | H | H | H | H | H | H | VH | H | M | M | MH | M | MH | ML | MH | MH | ML | ML | ML | ML | MH | ML | |
| A10 | MH | MH | MH | H | H | H | MH | H | H | H | H | H | H | VH | H | ML | M | MH | M | MH | ML | MH | ML | MH | M | M | M | MH | ML | |
| E-2 | A1 | MH | H | VL | M | H | VL | M | H | H | ML | EL | VL | M | H | H | M | M | M | VH | VL | MH | VH | VH | VH | ML | M | H | VH | ML |
| A2 | VL | VL | VL | M | M | VH | ML | M | MH | MH | VL | ML | M | H | VL | ML | ML | M | M | M | ML | M | H | H | H | M | ML | MH | M | |
| A3 | EH | VH | ML | VH | H | H | MH | H | H | H | H | H | H | H | H | MH | H | VL | M | H | VL | M | H | H | ML | H | H | H | H | |
| A4 | MH | H | VL | M | H | VL | M | M | MH | M | MH | M | MH | EL | MH | VL | VL | VL | M | M | VH | ML | M | MH | M | MH | M | MH | M | |
| A5 | VL | VL | VL | M | M | VH | ML | H | H | H | H | H | H | H | H | EH | VH | ML | VH | H | H | MH | H | H | H | H | H | H | H | |
| A6 | EH | VH | ML | VH | H | H | MH | VL | VL | M | VL | M | MH | VL | MH | MH | H | VL | M | H | VL | M | M | MH | M | MH | M | MH | M | |
| A7 | MH | H | VL | M | H | VL | M | H | H | ML | H | H | H | H | H | M | M | VH | ML | H | H | H | H | H | H | H | H | MH | VL | |
| A8 | VL | VL | VL | M | M | VH | ML | M | MH | M | MH | M | MH | M | MH | VH | H | H | MH | M | MH | M | MH | M | MH | M | MH | H | EH | |
| A9 | EH | VH | ML | VH | H | H | MH | H | ML | H | ML | H | ML | H | H | M | H | VL | M | H | H | ML | H | H | H | H | H | MH | MH | |
| A10 | MH | H | VL | M | H | VL | M | M | MH | M | MH | M | MH | M | MH | M | M | VH | ML | M | MH | M | MH | M | MH | M | MH | MH | M | |
| E-3 | A1 | M | M | M | MH | M | MH | VH | VH | VH | VH | VH | ML | VH | VH | ML | VH | VH | MH | MH | MH | MH | VH | VH | MH | VH | VH | VH | VH | VH |
| A2 | ML | ML | ML | VH | MH | ML | MH | EH | EH | EH | EH | MH | EH | EH | VL | MH | MH | VH | VH | VH | ML | EH | EH | ML | EH | EH | EH | EH | EH | |
| A3 | ML | ML | ML | VH | ML | VH | EH | VH | VH | VH | VH | VL | VH | VH | ML | EH | EH | VH | VH | ML | ML | VH | VH | VH | VH | VH | VH | VH | VH | |
| A4 | VL | VL | VL | ML | ML | ML | ML | MH | MH | MH | MH | VH | EH | EH | VL | ML | ML | ML | ML | VH | ML | MH | EH | ML | EH | EH | EH | EH | EH | |
| A5 | ML | ML | ML | ML | ML | ML | ML | MH | MH | MH | MH | VH | EH | EH | VL | ML | ML | ML | ML | VH | ML | MH | EH | ML | EH | EH | EH | EH | EH | |
| A6 | M | M | M | MH | MH | MH | VH | VH | VH | VH | VH | ML | EH | EH | VL | VH | VH | MH | MH | MH | MH | VH | EH | MH | EH | EH | EH | EH | EH | |
| A7 | M | M | M | MH | ML | VH | VH | MH | MH | MH | MH | ML | VH | VH | ML | VH | VH | MH | MH | ML | VH | MH | VH | VH | VH | VH | VH | VH | VH | |
| A8 | VL | VL | VL | VH | ML | ML | MH | VH | VH | VH | VH | MH | EH | EH | VL | MH | MH | VH | VH | VH | ML | VH | EH | ML | EH | EH | EH | EH | EH | |
| A9 | H | H | H | MH | M | VH | VH | MH | MH | MH | MH | ML | VH | VH | ML | VH | VH | MH | MH | ML | VH | MH | VH | VH | VH | VH | VH | VH | VH | |
| A10 | H | H | H | MH | M | MH | MH | MH | MH | MH | MH | MH | VH | VH | ML | MH | MH | MH | MH | MH | MH | MH | VH | MH | VH | VH | VH | VH | VH | |
| E-4 | A1 | M | M | M | M | M | M | MH | H | H | MH | MH | M | H | VH | M | VH | H | MH | MH | MH | MH | H | H | MH | M | H | H | MH | MH |
| A2 | MH | MH | MH | M | H | H | H | VH | VH | H | H | MH | M | EH | ML | MH | M | H | H | H | H | VH | VH | H | M | MH | VH | EH | H | |
| A3 | H | M | M | M | MH | MH | VH | H | H | MH | MH | M | M | H | M | H | MH | MH | MH | MH | VH | H | H | MH | MH | H | H | H | VH | |
| A4 | VH | H | H | VL | M | M | M | M | M | VH | VH | VL | VH | M | VL | M | VL | M | M | M | M | M | M | VL | VH | MH | M | ML | M | |
| A5 | H | MH | VL | VL | M | MH | M | M | M | M | M | ML | VL | M | M | M | ML | M | M | H | M | M | M | M | H | M | M | M | M | |
| A6 | M | M | VL | VL | MH | VL | M | MH | MH | MH | M | M | M | MH | M | H | M | M | M | VL | M | MH | MH | M | EH | M | MH | M | VL | |
| A7 | M | M | M | M | H | M | MH | M | M | M | M | M | ML | M | M | M | M | M | M | M | M | M | M | MH | M | VH | M | M | M | |
| A8 | MH | MH | MH | MH | VH | MH | H | H | VH | H | H | MH | M | H | ML | MH | M | H | VH | MH | H | VH | H | VH | H | EH | H | H | H | |
| A9 | M | VL | VL | M | MH | M | M | MH | H | MH | MH | M | M | MH | M | H | MH | MH | H | M | M | MH | M | M | M | H | M | M | M | |
| A10 | ML | ML | ML | ML | M | H | ML | M | M | M | VL | ML | ML | H | MH | M | VL | M | M | H | ML | M | M | M | VL | M | M | M | MH | |
| E-5 | A1 | H | H | VL | M | H | VL | M | H | H | ML | EL | VL | M | VH | H | M | M | M | VH | VL | MH | VH | VH | VH | ML | M | H | VH | ML |
| A2 | VL | VL | VL | M | M | VH | ML | M | MH | MH | VL | ML | M | H | VL | ML | ML | M | M | M | ML | M | H | H | H | M | ML | MH | M | |
| A3 | EH | VH | ML | VH | H | H | MH | H | H | H | H | H | H | H | H | MH | H | VL | M | H | VL | M | H | H | ML | H | H | H | H | |
| A4 | MH | H | VL | M | H | ML | M | M | MH | M | MH | M | MH | EL | MH | VL | VL | VL | M | M | VH | ML | M | MH | M | MH | M | MH | M | |
| A5 | VL | VL | VL | M | M | VH | ML | H | H | H | H | H | H | H | H | EH | VH | ML | VH | H | H | MH | H | H | H | H | H | H | H | |
| A6 | EH | VH | ML | VH | H | H | MH | VL | VL | M | ML | M | MH | VL | MH | MH | H | VL | M | H | VL | M | M | MH | M | MH | M | MH | M | |
| A7 | MH | H | VL | M | H | VL | M | H | H | ML | H | H | H | H | H | M | M | VH | ML | H | H | H | H | H | H | H | H | MH | VL | |
| A8 | VL | VL | VL | M | M | VH | ML | M | MH | M | MH | M | MH | M | MH | VH | H | H | MH | M | MH | M | MH | M | MH | M | MH | H | EH | |
| A9 | EH | VH | ML | VH | H | H | MH | H | ML | H | ML | H | ML | H | H | M | H | VL | M | H | H | ML | H | H | H | H | H | MH | MH | |
| A10 | MH | H | VL | M | H | VL | M | M | MH | M | MH | M | MH | M | MH | M | M | VH | ML | M | MH | M | MH | M | MH | M | MH | MH | M |
References
- Bouramdane, A.-A. Cyberattacks in Smart Grids: Challenges and Solving the Multi-Criteria Decision-Making for Cybersecurity Options, Including Ones That Incorporate Artificial Intelligence, Using an Analytical Hierarchy Process. J. Cybersecur. Priv. 2023, 3, 662–705. [Google Scholar] [CrossRef]
- Abushark, Y.B.; Irshad Khan, A.; Jaber Alsolami, F.; Almalawi, A.; Mottahir Alam, M.; Agrawal, A.; Kumar, R.; Ahmad Khan, R. Usability Evaluation Through Fuzzy AHP-TOPSIS Approach: Security Requirement Perspective. Comput. Mater. Contin. 2021, 68, 1203–1218. [Google Scholar] [CrossRef]
- Zhao, H.; Li, N. Performance Evaluation for Sustainability of Strong Smart Grid by Using Stochastic AHP and Fuzzy TOPSIS Methods. Sustainability 2016, 8, 129. [Google Scholar] [CrossRef]
- Zhong, J.; Zhao, Y.; Li, Y.; Yan, M.; Peng, Y.; Cai, Y.; Cao, Y. Synergistic Operation Framework for the Energy Hub Merging Stochastic Distributionally Robust Chance-Constrained Optimization and Stackelberg Game. IEEE Trans. Smart Grid 2025, 16, 1037–1050. [Google Scholar] [CrossRef]
- Gharib, Z.; Tavakkoli-Moghaddam, R.; Bozorgi-Amiri, A.; Yazdani, M. Post-Disaster Temporary Shelters Distribution after a Large-Scale Disaster: An Integrated Model. Buildings 2022, 12, 414. [Google Scholar] [CrossRef]
- Sahin, F.; Menekse, A.; Yilmaz, S. AI Software Selection for Cybersecurity Auditing Using Neutrosophic CRITIC CODAS. Appl. Soft Comput. 2025, 179, 113295. [Google Scholar] [CrossRef]
- Eti, S.; Yüksel, S.; Pamucar, D.; Dinçer, H.; Deveci, M.; Gökalp, Y. Markov Chain and RATGOS-Driven Fuzzy Decision-Making for Prioritizing Cybersecurity Measures in Microgrid Systems. OPSEARCH 2024. [Google Scholar] [CrossRef]
- Hanif, M.Z.; Yaqoob, N. Prioritized Decision Support System for Cybersecurity Selection Based on Extended Symmetrical Linear Diophantine Fuzzy Hamacher Aggregation Operators. Symmetry 2025, 17, 70. [Google Scholar] [CrossRef]
- Sukumar, A.; Mahdiraji, H.A.; Jafari-Sadeghi, V. Cyber Risk Assessment in Small and Medium-sized Enterprises: A Multilevel Decision-making Approach for Small E-tailors. Risk Anal. 2023, 43, 2082–2098. [Google Scholar] [CrossRef]
- Satapathy, S.C.; Bhateja, V.; Mohanty, J.R.; Udgata, S.K. (Eds.) Smart Intelligent Computing and Applications, Proceedings of the Third International Conference on Smart Computing and Informatics, Volume 2; Smart Innovation, Systems and Technologies; Springer: Singapore, 2020; Volume 160. [Google Scholar] [CrossRef]
- Alyami, H.; Ansari, M.T.J.; Alharbi, A.; Alosaimi, W.; Alshammari, M.; Pandey, D.; Agrawal, A.; Kumar, R.; Khan, R.A. Effectiveness Evaluation of Different IDSs Using Integrated Fuzzy MCDM Model. Electronics 2022, 11, 859. [Google Scholar] [CrossRef]
- Alhakami, W. Computational Study of Security Risk Evaluation in Energy Management and Control Systems Based on a Fuzzy MCDM Method. Processes 2023, 11, 1366. [Google Scholar] [CrossRef]
- Gul, A.Y.; Kızılkan Demir, Z.B.; Şirin, E.; Büyükkanber, K. A Novel Interval Valued Picture Fuzzy SWARA & CODAS Methodology: Renewable Energy Selection Application. J. Mult.-Valued Log. Soft Comput. 2023, 41, 241–283. [Google Scholar]
- Wu, X.; Zhu, Z.; Çaylı, G.; Liu, P.; Zhang, X.; Yang, Z. Picture Fuzzy Interactional Aggregation Operators via Strict Triangular Norms and Applications to Multi-Criteria Decision Making. arXiv 2022, arXiv:2204.03878. [Google Scholar] [CrossRef]
- Hussain, A.; Liu, Y.; Ullah, K.; Rashid, M.; Senapati, T.; Moslem, S. Decision Algorithm for Picture Fuzzy Sets and Aczel Alsina Aggregation Operators Based on Unknown Degree of Wights. Heliyon 2024, 10, e27548. [Google Scholar] [CrossRef]
- Cuong, B.C.; Kreinovich, V. Picture Fuzzy Sets—A New Concept for Computational Intelligence Problems. In Proceedings of the 2013 Third World Congress on Information and Communication Technologies (WICT 2013), Hanoi, Vietnam, 15–18 December 2013; IEEE: Piscataway, NJ, USA, 2013; pp. 1–6. [Google Scholar] [CrossRef]
- Keršulienė, V.; Zavadskas, E.K.; Turskis, Z. Selection of Rational Dispute Resolution Method by Applying New Step-Wise Weight Assessment Ratio Analysis (SWARA). J. Bus. Econ. Manag. 2010, 11, 243–258. [Google Scholar] [CrossRef]
- Zolfani, S.H.; Saparauskas, J. New Application of SWARA Method in Prioritizing Sustainability Assessment Indicators of Energy System. Eng. Econ. 2014, 24, 408–414. [Google Scholar] [CrossRef]
- Keshavarz Ghorabaee, M.; Zavadskas, E.K.; Olfat, L.; Turskis, Z. Multi-Criteria Inventory Classification Using a New Method of Evaluation Based on Distance from Average Solution (EDAS). Informatica 2015, 26, 435–451. [Google Scholar] [CrossRef]
- Paul, B.; Sarker, A.; Abhi, S.H.; Das, S.K.; Ali, M.F.; Islam, M.M.; Islam, M.R.; Moyeen, S.I.; Rahman Badal, M.F.; Ahamed, M.H.; et al. Potential Smart Grid Vulnerabilities to Cyber Attacks: Current Threats and Existing Mitigation Strategies. Heliyon 2024, 10, e37980. [Google Scholar] [CrossRef]
- Ding, J.; Qammar, A.; Zhang, Z.; Karim, A.; Ning, H. Cyber Threats to Smart Grids: Review, Taxonomy, Potential Solutions, and Future Directions. Energies 2022, 15, 6799. [Google Scholar] [CrossRef]
- Zolfani, S.H.; Chatterjee, P. Comparative Evaluation of Sustainable Design Based on Step-Wise Weight Assessment Ratio Analysis (SWARA) and Best Worst Method (BWM) Methods: A Perspective on Household Furnishing Materials. Symmetry 2019, 11, 74. [Google Scholar] [CrossRef]
- Ayyildiz, E.; Yildirim, B.; Aydin, N. Location Selection Methodology for Data Center with Renewable Energy Integration. Renew. Energy 2025, 250, 123270. [Google Scholar] [CrossRef]
- Alkan, N. Evaluation of Sustainable Development and Utilization-Oriented Renewable Energy Systems Based on CRITIC-SWARA-CODAS Method Using Interval Valued Picture Fuzzy Sets. Sustain. Energy Grids Netw. 2024, 38, 101263. [Google Scholar] [CrossRef]
- Yildirim, B.; Ayyildiz, E.; Aydin, N. A Strategic Sustainability Framework for Smart City Investment Prioritization. Sustain. Cities Soc. 2025, 131, 106705. [Google Scholar] [CrossRef]
- Biswas, S.; Pamucar, D. Combinative Distance Based Assessment (CODAS) Framework Using Logarithmic Normalization for Multi-Criteria Decision Making. Serb. J. Manag. 2021, 16, 321–340. [Google Scholar] [CrossRef]
- Aydoğmuş, H.Y.; Kamber, E.; Kahraman, C. ERP Selection Using Picture Fuzzy CODAS Method. J. Intell. Fuzzy Syst. Appl. Eng. Technol. 2021, 40, 11363–11373. [Google Scholar] [CrossRef]
- Cường, B.C. Picture Fuzzy Sets. J. Comput. Sci. Cybern. 2015, 30, 409. [Google Scholar] [CrossRef]
- Jin, J.; Zhao, P.; You, T. Picture Fuzzy TOPSIS Method Based on CPFRS Model: An Application to Risk Management Problems. Sci. Program. 2021, 2021, 1–15. [Google Scholar] [CrossRef]
- Kasradze, M.; Kamali Saraji, M.; Streimikiene, D. Challenges to Corporate Social Responsibility Adoption for Sustainability: A Picture Fuzzy Approach. Integr. Environ. Assess. Manag. 2023, 19, 1254–1275. [Google Scholar] [CrossRef]
- Wei, G. TODIM Method for Picture Fuzzy Multiple Attribute Decision Making. Informatica 2018, 29, 555–566. [Google Scholar] [CrossRef]
- Kamali Saraji, M.; Aliasgari, E.; Streimikiene, D. Assessment of the Challenges to Renewable Energy Technologies Adoption in Rural Areas: A Fermatean CRITIC-VIKOR Approach. Technol. Forecast. Soc. Change 2023, 189, 122399. [Google Scholar] [CrossRef]
- Ayyildiz, E.; Yildirim, B.; Erdogan, M.; Aydin, N. Strategic Site Selection Methodology for Small Modular Reactors: A Case Study in Türkiye. Renew. Sustain. Energy Rev. 2025, 215, 115545. [Google Scholar] [CrossRef]
- Hu, Y.; Yang, A.; Li, H.; Sun, Y.; Sun, L. A Survey of Intrusion Detection on Industrial Control Systems. Int. J. Distrib. Sens. Netw. 2018, 14, 155014771879461. [Google Scholar] [CrossRef]
- Berghout, T.; Benbouzid, M.; Muyeen, S.M. Machine Learning for Cybersecurity in Smart Grids: A Comprehensive Review-Based Study on Methods, Solutions, and Prospects. Int. J. Crit. Infrastruct. Prot. 2022, 38, 100547. [Google Scholar] [CrossRef]
- Wiboonrat, M. Cybersecurity in Industrial Control Systems: An Integration of Information Technology and Operational Technology. In Proceedings of the IECON 2022—48th Annual Conference of the IEEE Industrial Electronics Society, Brussels, Belgium, 17–20 October 2022; IEEE: Brussels, Belgium, 2022; pp. 1–6. [Google Scholar] [CrossRef]
- Alzoubi, Y.I. Hardware Security Modules for Sustainable Energy Systems: Targeted Review. Int. J. Crit. Infrastruct. Prot. 2025, 50, 100791. [Google Scholar] [CrossRef]
- Guo, Y.; Wan, Z.; Cheng, X. When Blockchain Meets Smart Grids: A Comprehensive Survey. High-Confid. Comput. 2022, 2, 100059. [Google Scholar] [CrossRef]
- Ghosal, A.; Conti, M. Key Management Systems for Smart Grid Advanced Metering Infrastructure: A Survey. IEEE Commun. Surv. Tutor. 2019, 21, 2831–2848. [Google Scholar] [CrossRef]
- Abreu, V.; Santin, A.O.; Viegas, E.K.; Cogo, V.V. Identity and Access Management for IoT in Smart Grid. In Advanced Information Networking and Applications; Barolli, L., Amato, F., Moscato, F., Enokido, T., Takizawa, M., Eds.; Advances in Intelligent Systems and Computing; Springer International Publishing: Cham, Switzerland, 2020; Volume 1151, pp. 1215–1226. [Google Scholar] [CrossRef]
- Maesschalck, S.; Giotsas, V.; Green, B.; Race, N. Don’t Get Stung, Cover Your ICS in Honey: How Do Honeypots Fit within Industrial Control System Security. Comput. Secur. 2022, 114, 102598. [Google Scholar] [CrossRef]


Disclaimer/Publisher’s Note: The statements, opinions and data contained in all publications are solely those of the individual author(s) and contributor(s) and not of MDPI and/or the editor(s). MDPI and/or the editor(s) disclaim responsibility for any injury to people or property resulting from any ideas, methods, instructions or products referred to in the content. |
© 2025 by the authors. Licensee MDPI, Basel, Switzerland. This article is an open access article distributed under the terms and conditions of the Creative Commons Attribution (CC BY) license (https://creativecommons.org/licenses/by/4.0/).