1. Introduction
Melanoma remains a public health problem due to its incidence and mortality rates. Incidence continued to grow in recent decades, especially in developed countries. Based on the worldwide projection statistics of melanoma evolution, the melanoma incidence will increase in 2040 by 50%, and the number of deaths will increase by 68% if the rates persist in their upward trend [
1,
2].
Cutaneous melanoma (CM) arises from melanocytes, the pigmented cells of the skin, and is the most aggressive and unpredictable form of skin cancer due to its high genomic heterogeneity [
3]. The main risk factor for melanoma is ultraviolet (UV) radiation exposure, which leads to 60–70% of cases. However, genetic familial predisposition, a specific phenotype vulnerability to environmental risk factors, also plays a significant role in the malignant transformation of melanocytes [
4,
5,
6].
However, in recent years, hopeful positive results have been registered in terms of survival rates, as specific monoclonal antibodies have been incorporated into therapy protocols. Among them, the immune checkpoint inhibitors such as Ipilimumab (Ipi) targeting cytotoxic T-lymphocyte-associated protein 4 (CTLA-4), Nivolumab (Niv) directed against the programmed cell death protein 1 (anti-PD-1), or Relatlimab that targets the Lymphocyte-Activation Gene 3 (LAG-3) are of great benefit together with some selective molecular target BRAF and/or MEK inhibitors [
7,
8]. In this regard, for stage IV melanoma patients, the 5-year survival rate significantly increased from 15% of melanoma cases in 2015 to 35% of cases in 2023, while less than 10% of metastatic melanoma patients achieved a 5-year survival prior to these therapies [
2,
9,
10,
11]. Despite these advances in melanoma therapy, not all patients respond to single or combined therapy, due to primary or acquired resistance to these anti-tumor agents [
12,
13,
14].
In the future, there is a real need to overcome this barrier through new combinations of antineoplastic agents that aim to both stimulate the immune response and block cell division or different signaling mechanisms that promote uncontrolled cell-specific tumor proliferation [
15,
16]. Cytotoxic drugs have proven their effectiveness by acting on nucleic acids or the microtubules of tumor cells, but systemic chemotherapy as monotherapy in melanoma has had limited effectiveness. Recently, studies showed that many of these oncolytic agents seem to be essential in promoting antitumor immunogenicity by activating the cytotoxic T lymphocytes, maturation of antigen-presenting cells, or depletion of immunosuppressive regulatory T cells, which reduces the immunosuppressive activation with direct effect on tumor cell survival, and enhances the response to antibody therapy [
17].
TNF-α and IL-6 are pleiotropic cytokines with important roles in the development of malignancies, being mediators of inflammatory processes and immune cell responses, and inhibiting programmed cell death, stimulating tumor angiogenesis, and invasion. The pro-inflammatory effects of these cytokines were extensively studied, their abnormal levels being associated with poor outcomes both in melanoma patients and experimental models [
18,
19].
The cytotoxic drugs used to treat melanoma include Carboplatin (CPt), belonging to the DNA-alkylating group as platinum derivatives, which robustly impair the tumor cells’ proliferation and induce apoptosis, and also stimulate the antitumor immunity by increasing the tumor infiltration of CD8
+ T cells [
20,
21]. Additionally, Paclitaxel (Pxl) from the Taxanes group is a tubulin inhibitor that increases microtubule stability, leading to cell cycle arrest at the late G2 phase and inhibiting cell replication, while disrupting mitotic spindle formation promotes chromosome fragmentation [
22,
23]. Moreover, biologically active compounds extracted from plants, such as Resveratol (Rsv), a phytoestrogen (3,4′,5-trihydroxy-trans-stilbene), demonstrated anti-tumor initiation, promotion, or progression activities, and when combined with common chemotherapeutic agents, exerted properties that may sensitize cancer cells to these agents [
24]. Quercetin (Qct) is another natural compound involved in preventing cancer growth, proliferation, and progression, but also has protective effects on normal cells. The last two compounds have demonstrated antioxidant, anti-inflammatory, and apoptosis-inducing functions, which support the increased benefits of antitumor therapy [
25,
26].
During our previous studies, some of the main research directions were related to the “programmed cell death” or apoptosis, along with the modulation of DNA progression through cell cycle phases, due to the involvement of these biological processes in the evolution of neoplastic diseases and the therapeutic approaches in cancer. In addition to the evaluation in human tumor cells of the apoptotic events and cell cycle phases, we performed cellular and molecular in vitro studies regarding apoptosis related molecules, cell cycle key regulators, immune check-point inhibitors, epigenetic inductors, which were carried out mainly in breast [
25], colon [
26,
27,
28,
29], head and neck cancers [
30,
31], melanoma [
32,
33], and gliomas [
34]. Since the effect of cancer therapy could be amplified by combined treatments, we tested several biocompounds for their potential biological activity as adjuvants to classical chemotherapy [
25,
26,
27,
28,
30,
31]. Last but not least, we aimed to decipher the mechanisms underlying drug resistance and find the means to reverse it in various cancer cell lines [
28,
31].
Early studies on the expression and functional roles of the intercellular adhesion molecule 1 (ICAM-1/CD54), largely distributed among normal and neoplastic tissues, showed a differential distribution in melanomas, the expression being modulated by cytokines [
35]. Melanoma cells release ICAM-1, the levels of the soluble form being correlated with disease progression [
36]. Moreover, the soluble ICAM-1 inhibited NK-mediated melanoma cell lysis in a dose-dependent manner, demonstrating the role of CD54 in host-tumor interactions [
35,
36]. The constitutive levels of soluble ICAM-1 or IL-1 alpha can differentially influence the tumor progression [
36]. Other studies have shown that CD59 (protectin), a cell-surface C-regulatory protein, protects normal and neoplastic cells from the attack of autologous complement [
37,
38]. The differential sensitivity of melanoma cells is regulated by levels of cell-membrane CD59, influencing the extent of C-mediated lysis of melanoma cells sensitized with anti-melanoma monoclonal antibodies (anti-GD3 Mab R24) [
37]. Data suggested that the levels of CD59 associated with melanoma cells may be responsible for the differential resistance to C-mediated lysis and can account for selecting melanoma patients who may benefit from immunotherapeutic treatment(s) with monoclonal antibodies that trigger C activation [
37,
38]. Finally, recent studies have highlighted the role of the tumor suppressor p53 in modulating the human immune system, revealing a variety of interactions that suggest opportunities to utilize p53 in modulating immunological activities [
39]. As a key component in preventing cancer development by regulating apoptosis, the cell cycle, and senescence genes, p53 can influence several innate and adaptive immune pathways through gene regulation. Among the cell surface markers involved in immune responses that are regulated by p53, ICAM-1 (the genotoxic activation of p53 leads to mRNA and protein upregulation) and CD59, which are involved in complement signaling regulation, are of great importance [
39].
In this context, in order to assess the effects of treatments on SK-MEL-24 melanoma cell line, we selected a set of anti-tumoral agents such as Carboplatin (CPt), Paclitaxel (Pxl) as cytotoxic agents, Nivolumab (Niv) and Ipilimumab (Ipi) as immune checkpoint inhibitors, or Resveratrol (Rsv) and Quercetin (Qct) as bioactive natural compounds. Our previous results prompted us to evaluate in the present study the potential modulation, due to single or combined treatments of the above compounds, of some biological activities or gene expression levels. We have specifically monitored the induced modifications in cell proliferation versus compound-dependent cell cytotoxicity, nuclei distribution in cell cycle phases, programmed cell death (apoptosis), and cytokine release in cell culture supernatants. Moreover, we evaluated the levels of expression of several genes that codify proteins related to cell adhesion (intercellular adhesion molecule 1/ICAM-1), tumor-resistance to drug or mAb treatments (mdr-1/glycoprotein-P, protectin/CD59), and apoptosis (mdm-1, p53, bcl-2), since both p53/ICAM-1 and p53/CD59 relationships may account for the immune surveillance in melanoma cells.
2. Materials and Methods
2.1. Reagents and Kits
Throughout the in vitro assays, we used various culture media, solutions and reagents, such as Dulbecco’s Modified Eagle’s Medium (DMEM) provided from PAN Biotech, Aidenbach, Germany; Hanks’ Balanced Buffer Solution (HBSS), 200 mM L-glutamine, fetal bovine serum (FBS), 100× concentrated antibiotic mixture (10,000 μg/mL streptomycin, 10,000 U/mL penicillin) obtained from Biochrom GmbH, Berlin, Germany; phosphate-buffered saline (TFS), ethylenediaminetetraacetic acid (EDTA), dimethyl sulfoxide (DMSO), and paraformaldehyde (PFA) provided from Sigma Aldrich (St. Louis, MO, USA).
For cell modulation experiments we used: monoclonal antibodies, such as Nivolumab (Niv), provided as 10 mg/mL, and Ipilimumab (Ipi), as 5 mg/mL concentrated solution for infusion, obtained from Bristol Myers Squibb (Princeton, NJ, USA); oncolytic drugs such as Carboplatin (CPt), diluted from 10 mg/mL (Teva Ltd., Eastbourne, East Sussex, UK (Teva Ltd., Eastbourne, East Sussex, UK), and Paclitaxel (Pxl) diluted from 6 mg/mL solution (Fresenius Kabi AG, Bad Hamburg, Germany). The biocompounds Quercetin (Qct) and Resveratrol (Rsv) were purchased from Sigma Aldrich (St. Louis, MO, USA).
As regards the cytotoxicity assays, we used the CellTiter 96R AQueous One Solution Cell Proliferation Assay (MTS) kit, obtained from Promega, Madison, WI, USA. Apoptotic events were assessed using the Annexin V-FITC Apoptosis Detection kit (Becton Dickinson (BD) Biosciences, Mountain View, CA, USA). The cell cycle analysis was performed by using the FxCycle PI/RNase Staining Solution (Thermo Fisher Scientific by Invitrogen Life Technologies Corporation, Hillsboro, OR, USA). Cytokine release was assessed by the human IL-6 and TNF-α uncoated ELISA kits (Invitrogen, Bender MedSystems GmbH, Vienna, Austria).
The RNeasy Mini kit (Qiagen, Hilden, Germany) was used for RNA isolation, while the High-Capacity cDNA Reverse Transcription Kit (Thermo Fisher Scientific Inc., Waltham, MA, USA) was used for reverse-transcription of RNA to cDNA. The TaqMan probes for the target genes (TP53/Hs01034249_m1; ABCB1/Hs00212704_m1, ICAM1/Hs00164932_m1, CD59/Hs00174141_m1, BCL2/Hs99999018_m1, MDM1/Hs01098445_m1), and the endogenous control gene (GAPDH/Hs02758991_g1) were provided by Thermo Fisher Scientific.
2.2. Cell Cultures and Treatments
The SK-MEL-24 human melanoma cell line was obtained from the American Type Culture Collection (ATCC
® HTB-71™, Manassas, VA, USA). SK-MEL-24 is an adherent cell line exhibiting stellate morphology that was established from a metastatic lymph node in a 67-year-old, Caucasian male patient with malignant melanoma. This cell line has been widely used in many applications in in vitro studies, such as 3-D cultures, testing of various drugs, and chemical agents, as the cell line is known to be tumorigenic, to form malignant melanomas, and to express wild-type TP53, B-Raf, and N-Ras [
40,
41,
42]. The SK-MEL-24 cell line was selected because it provides a model of drug resistance that is less aggressive and more adaptive compared to other melanoma cell lines (e.g., SK-MEL-28 or A375). These characteristics allow us to analyze how resistance develops progressively under therapy pressure. Additionally, SK-MEL-24 served as a model for inherent or primary resistance to BRAF inhibitors (and their combinations) in specific contexts. This insight could lead to new approaches for studying mechanisms of resistance that exist before treatment, rather than just focusing on acquired resistance [
43,
44]. SK-MEL-24 melanoma cell line was cultured in DMEM: F12 medium supplemented with 10% Fetal Bovine Serum (FBS), 2 mM L-glutamine, and antibiotic mixture in culture flasks of 25 or 75 cm
2, and further incubated at 37 °C in a 5% CO
2 humidified atmosphere. The melanoma cells were grown for 24 h till they achieved around 70% confluence, and treated with various concentrations of oncolytic drugs (CPt, Pxl), monoclonal antibodies (Niv, Ipi), and natural compounds (Rsv, Qct) for 24–48 h. Then, the cells were detached from the culture flasks with PBS/1 mM EDTA non-enzymatic solution, washed twice in PBS and either immediately used in compound-induced drug-cytotoxicity assays, evaluation of apoptotic events by flow cytometry technique, or preserved for later use, either as cell pellets, frozen at −80 °C for the future extraction of nucleic acids, or fixed in ice-cold ethanol/PBS (70:30) and stored until use at 4 °C for cell cycle analysis by flow-cytometry. In addition, melanoma cell culture supernatants were collected, centrifuged at 400×
g, and preserved at −80 °C for the subsequent evaluation of soluble cytokines. Throughout all the experiments, non-treated (NT) cells were used as controls [
25,
28,
31].
2.3. Evaluation of Compound-Mediated Cytotoxicity Assays by Colorimetric Techniques (MTS)
The oncolytic drugs (Cpt, Pxl) and biocompounds (Rsv, Qct) were investigated to evaluate their ability to inhibit cell proliferation in the SK-MEL-24 melanoma cell line, aiming to modulate the cell response to drug treatments in terms of chemosensitivity. The colorimetric cell viability MTS assay was used to assess the cytotoxic potential of CPt, Pxl, Rsv, and Qct. Experiments were performed in triplicate using the CellTiter 96® AQueous One Solution Cell Proliferation Assay kit, and 96-well flat-bottom microtiter plates (Falcon, Teterboro, NJ, USA). The MTS [3-(4,5-dimethylthiazol-2-yl)-5-(3-carboxymethoxyphenyl)-2-(4-sulfophenyl)-2H-tetrazolium] reagent, mixed with PES (phenazine ethosulfate), as a cationic dye with high chemical stability, led to a more stable solution. During the assay, the yellow MTS reagent mixture was reduced by the metabolically active cells to formazan, a soluble colored product, which was spectrophotometrically detected in the culture medium at λ = 492 nm.
Briefly, after 104 cells were cultured in each well for 24 h, the culture supernatants were discarded, and cells were treated for additional 24–48 h with 6 increasing concentrations of drugs: CPt, Qct, Rsv (6.25, 12.5, 25, 50, 100 and 200 µM each) and Pxl (0.125, 0.25, 0.5, 1, 2, and 4 µM). After each treatment period, 20 µL of the MTS reagent mixture was added to each well, and the plates were incubated at 37 °C for 4 h, in gentle shaking conditions. After the incubation time was finished, the resulting colored product was spectrophotometrically quantified by measuring the absorbance at λ = 492 nm on a Dynex ELISA reader (DYNEX Technologies—MRS, Chantilly, VA, USA).
Data were expressed as percentages of treated cells’ viability relative to untreated cells (NT), considering that control cells have 100% viability, and calculated using the formula:
where T represents the optical density of treated cells; U is the optical density of untreated cells; and B is the optical density of the culture medium alone (blank).
The experiments were performed in triplicate (
n = 3), and the results were expressed as mean values ± standard deviation (SD). The potential nonspecific reactions between MTS and the compounds under study were eliminated by measuring their absorbance in the absence of cells and subtracting them from the final analysis [
28,
34].
2.4. Real-Time Cell Analysis (RTCA)
Real-Time Cell Analysis (RTCA) is a new technique based on electronic cell sensor array technology that enables real-time monitoring of several cellular activities such as cell proliferation vs. cell cytotoxicity, adhesion, invasion, or migration. The xCELLigence System, a Real-Time Cell Analyzer (RTCA), enables the continuous and label-free tracking of various cellular processes, including cell proliferation, cytotoxicity, adhesion, invasion, and migration. This is achieved through electronic cell sensor array technology, which measures electrical impedance across micro-electrodes integrated on specialized tissue culture plates. By avoiding the use of labels, the system allows real-time monitoring of cellular events. The kinetic response of cells in an assay provides crucial insights into the biological status of the cells. Changes in cell status, such as morphology or adhesion, result in alterations in the cell index (CI), a quantitative measure of the cell number in a well [
45].
The xCELLigence DP-System (ACEA Biosciences, San Diego, CA, USA) allowed for label-free monitoring by measuring electrical impedance in special culture E-Plates (ACEA Biosciences) that contained integrated micro-electrodes on their bottom [
31]. Results were automatically presented as cell index (CI) values, which show the cell number present in a well, after measuring the electrode impedance. Briefly, 12,000 cells of SK-MEL-24 melanoma cells were seeded in E-Plates 16 cell (16 wells) and left for 10 min in the culture hood for equilibration of cell cultures. Then, the E-plates were introduced into the xCELLigence DP-System, which was already placed in a 5% CO
2 humidified incubator. The attached computer automatically started to register the growth curves in real time using RTCA 2.1.2 Software [
25,
29,
45]. When cell proliferation reached a CI value over 1.0, the treatments were added to the cell cultures, and live cells were monitored to obtain continuous compound-dependent cell impedances. Results were presented as normalized cell indexes after automatic comparison between the curves of viability for treated and non-treated cells and registered till the normalized CI of treated cells decreased under the baseline level (represented by a black horizontal dotted line, drawn for normalized CI = 1), time-point considered as end-point of the experiment [
45].
2.5. Quantitative Real-Time PCR (qRT-PCR)
2.5.1. RNA Isolation and cDNA Synthesis
Total RNA isolation and purification from cell samples were carried out using the RNeasy Mini kit (Qiagen, Hilden, Germany), according to the manufacturer’s protocol. The concentration of all isolated RNAs was measured with a Nanodrop spectrophotometer (Nanodrop Technologies, Thermo Fisher Scientific Inc., Wilmington, DE, USA), with the quality of the samples determined by their purity, while RIN (RNA Integrity Number) values were assessed. Further, by using the High-Capacity cDNA Reverse Transcription Kit (Thermo Fisher Scientific Inc.) the selected RNAs were reverse-transcribed into cDNAs: 2 μg of each RNA sample were added in a 20 μL total volume to the reaction mix, and reactions followed the sequenced steps of 10 min/25 °C, 120 min/37 °C, and 5 min/85 °C [
28].
2.5.2. Gene Expression Analysis by Real-Time PCR TaqMan Assays
All PCR reactions were performed using the fluorescent Taqman methodology. Briefly, 20 ng of total cDNA were amplified in a 25 µL total volume reaction, using ChromoFour Real Time PCR System (Bio-Rad Laboratories, Hercules, CA, USA) and the thermal cycling conditions: 50 °C/2 min, 95 °C/10 min, 40 cycles of 15 s denaturation at 95 °C, and 60 s annealing at 60 °C. All experiments were performed in triplicate. The results were normalized against the GAPDH house-keeping gene, and the relative expression was calculated using either the 2^
−∆Cq or 2^
−ΔΔCq method [
28].
2.6. Cell Cycle Analysis by Flow Cytometry
Any alterations of DNA progression through cell cycle phases may account for the anti-carcinogenic effects of drugs. Therefore, we analyzed the DNA content of SK-MEL-24 melanoma cells using flow cytometry approaches in order to demonstrate the potential modulation of the cell cycle phases following the drug treatments under study. Briefly, 10
6 melanoma cells were treated with oncolytic drugs (100 µM of CPt or 1 µM Pxl), and/or with monoclonal antibodies (20 µg/mL of Ipi, Nivo), or natural compounds (50 µM of Qct, Rsv). Then, treated and non-treated cells, used as control, were fixed in 70% EtOH, and preserved as described above (
Section 2.2). Before cell cycle analysis, cells were washed twice with cold PBS and centrifuged at 300×
g at 4 °C/5 min. On the cell pellets, we added 0.5 mL of the FxCycle™PI/RNase Staining Solution, a PI staining solution that includes DNase-free RNase A and a permeabilization reagent. The cells were resuspended and incubated at room temperature (RT) for 10–30 min in the dark. Then, 3 × 10
4 events were acquired by flow-cytometry technique using a FACS CANTO II flow-cytometer (Becton Dickinson-BD, Immunocytometry System, Mountain View, San Jose, CACA, USA), and the DIVA 6.2 software. The cell cycle analyses were performed using ModFIT
LT 2.3 software to estimate the nuclear DNA content in nuclei and the progression through cell-cycle phases [
29,
34,
46].
2.7. Apoptosis Analysis by Flow Cytometry
To study the induction or modulation of apoptosis in melanoma cancer cells by individual or combined treatments, levels of apoptotic events were measured by flow cytometry approaches. Briefly, the SK-MEL-24 human melanoma cell line was cultured for 24 h in complete medium, and then the cells were treated for an additional 24 h with the compounds under study, either singly or in combination: 50 µM CPt, 1 µM Pxl, 20 µg/mL Ipi or Niv, 50 µM Rsv or Qct. Following treatment, cells were detached with PBS/1 mM EDTA and sequentially washed with PBS, then centrifuged for 5 min at 300× g. The cell pellets were suspended in 400 µL of binding buffer, and 100 µL were distributed in flow tubes for the staining step with 5 µL of Annexin-V/FITC and/or PI, then incubated at RT for 15 min in the dark. Annexin V is a phospholipid-binding protein, calcium-dependent, that allows the detection of both early and late apoptotic cells, the last stage preceding the necrosis phase, detected by PI staining. The untreated (NT) cells were used as a negative control of the assay.
The FACS CANTO II flow-cytometer (BD Biosciences, Immunocytometry System, Mountain View, CA) was used to acquire 10,000 events in each tube, and the green and red fluorescence were measured. The analysis of the acquired data was performed using DIVA 6.2 software, and the results were expressed as cell percentages of the apoptotic events. The assay allows for the discrimination between the viable cells (FITC−/PI−) and necrotic cells (FITC−/PI+) and assesses both the early apoptosis (FITC+/PI−) and late apoptosis (FITC+/PI+) [
25,
27,
34].
2.8. Evaluation of Cytokine Levels by ELISA
The levels of soluble IL-6 and TNF-α cytokines were evaluated in previously harvested and stored cell culture supernatants of untreated cells and single versus combined treated SK-MEL-24 human melanoma cells, followed by the quantitative detection using Enzyme-linked Immunosorbent Assays (ELISAs). The assay was performed in triplicate using the Human IL-6 Uncoated ELISA and Human TNF-alpha Uncoated ELISA kits (Invitrogen, Bender MedSystems GmbH, Vienna, Austria). The interest proteins were attached to the biotin-conjugated specific antibodies complexed with the streptavidin–HRP enzyme.
The specific capture antibodies were fixed to the surface of the 96-well plates by incubation overnight at 4◦C. The plates were washed three times with 0.05% PBS-Tween 20 buffer, the wells were blocked with 200 μL of diluent (1×) and incubated for 1 h at room temperature (RT). After another two-wash step, 100 μL of standard dilutions or 100 μL of samples were added, followed by an incubation for 2 h at RT. Then, 100 μL detection antibody was added, incubated for 1 h at RT, followed by the addition of Streptavidin-HRP diluted enzyme complex and 30 min incubation. The TMB substrate solution was added and incubated for 15 min at RT, and the reaction was stopped with 2 N H2SO4 solution.
The standard curve was performed by serial dilution for 8 points, with the first point standard at 200 pg/mL for IL-6 and 500 pg/mL for TNF-α. The optical densities were spectrophotometrically read at λ = 450 nm, with protein levels calculated by using the standard curves and expressed in pg/mL. After calculations, the results for the treatment-induced release of cytokines in culture supernatants were expressed as mean values ± SD and normalized by dividing by the concentration of control, non-treated cells, which was considered 100% [
33,
34].
2.9. Statistical Analysis
The experimental data obtained on triplicate samples were further analyzed using GraphPad Prism version 10.3 (GraphPad Software Inc., San Diego, CA, USA) and Microsoft Office Excel 2007 software. The results from the cytotoxicity tests and ELISA were presented as mean values ± standard deviation (SD), statistically analyzed using the Student
t-test and one-way ANOVA. The Pearson
r correlation coefficients were calculated to highlight the potential association between the analyzed parameters. The
r values were considered to show a low correlation for
r ≤ ±0.29, moderate for ±0.3 ≤
r ≤ ±0.49, and a strong correlation for ±0.05 ≤
r ≤ ±1;
p-values < 0.05 were considered statistically significant, where *
p < 0.05, **
p < 0.01 [
33].
3. Results and Discussion
3.1. Compound-Induced Melanoma Cell-Cytotoxicity
In order to study the in vitro potential anti-proliferative capacity of several anti-tumor agents like CPt and Pxl oncolytic drugs, or the adjuvant bioactive natural compounds Rsv and Qct against human melanoma cells, we performed several compound-mediated cytotoxicity assays on the SK-MEL-24 cell line. Thus, melanoma cells were treated with the scalar concentrations of the above compounds for 24 h or 48 h, and further subjected to the MTS colorimetric assay. Then, the experimental data were calculated and expressed as percentages of cell viability for each compound under study.
The cytotoxic effects of the compounds under study varied depending on the concentration and treatment time, with a decrease in cell viability and an increase in cell lysis rate being observed, as shown in
Figure 1, panels A and B.
When the cell responses to compound treatments were analyzed, and the percentages of cell viability were calculated for each compound, we observed that the cell viability percentages decreased more after 48 h treatments when compared to 24 h ones, in a dose- and time-dependent manner.
Thus, 24 h treatments with 200 µM of Cpt, Rsv, or Qct decreased the cell viability to 58%, 19.83%, and 10%, respectively. Treatments with 100 µM or 50 µM treatments with the same compounds decreased the viability to 68.76% and 70.72% for CPt, 40% and 53.69% for Rsv, and 33.77% and 38.97% for Qct. When smaller concentrations of Pxl were used, like 1, 2, and 4 μM, cell viability percentages were decreased to 42.73%, 46.75% and 55.98%, respectively (
Figure 1, panel A). Both CPt treatments with 25 and 12.5 µM induced a decrease in cell viability under 80%, while lower concentrations induced a decrease over 80%. In contrast, 25 µM and 12.5 µM treatments with Rsv and Qct induced cell viability decreases under 70%: till 59.52% and 69.19% by Rsv, and till 54.03% and 66.13%, respectively. When 0.5 µM of Pxl was used, a decrease in the cell viability to 68.51% was observed.
When the treatment time of melanoma cells was prolonged to 48 h, the cytotoxic effects of the compounds under study were increased. Concentrations of 50 µM, 100 µM, and 200 µM of CPt induced a decrease in cell viability to 57%, 44%, and 38.55%, respectively. The highest concentrations of Pxl also had a stronger cytotoxic effect on melanoma cells, inducing a decrease in cell viability percentages to 41.76%, 36.31%, and 28.83%, when 1, 2, or 4 µM concentrations were used. Even at 0.5 µM of Pxl, a decrease in cell viability was observed, reaching 50% and a minimum of 48.73% (
Figure 1, panel B).
The same stronger anti-proliferative effects were observed for Rsv and Qct 48 h treatments: 50, 100, and 200 µM of Rsv induced the decrease in cell viability percentages to 38.52%, 26.45%, and 11.89%, while the percentages for Qct treatments were a little lower (37.3% for 50 µM, 21.42% for 100 µM, and 7.35% for 200 µM). Even the lower concentrations used induced a decrease in cell viability under 80%, both for Rsv and Qct (
Figure 1, panel B).
3.2. RTCA of Single Versus Combined Treatments
Real-Time Cell Analysis (RTCA) is a non-invasive method for continuously monitoring cellular behavior using the inherent adhesive and morphological features of cells. The xCELLigence System (ACEA Biociences, San Diego, CA, USA /trademark of Roche, Basel, Switzerland) for performing RTCA consists of a technology that allows the label-free monitoring of the viability of an entire cell population, ensuring good reproducibility and high sensitivity. Therefore, various changes in cell viability, like cell toxicity/lysis, or reduced cell proliferation, due to cell cycle arrest or senescence, could be observed [
45].
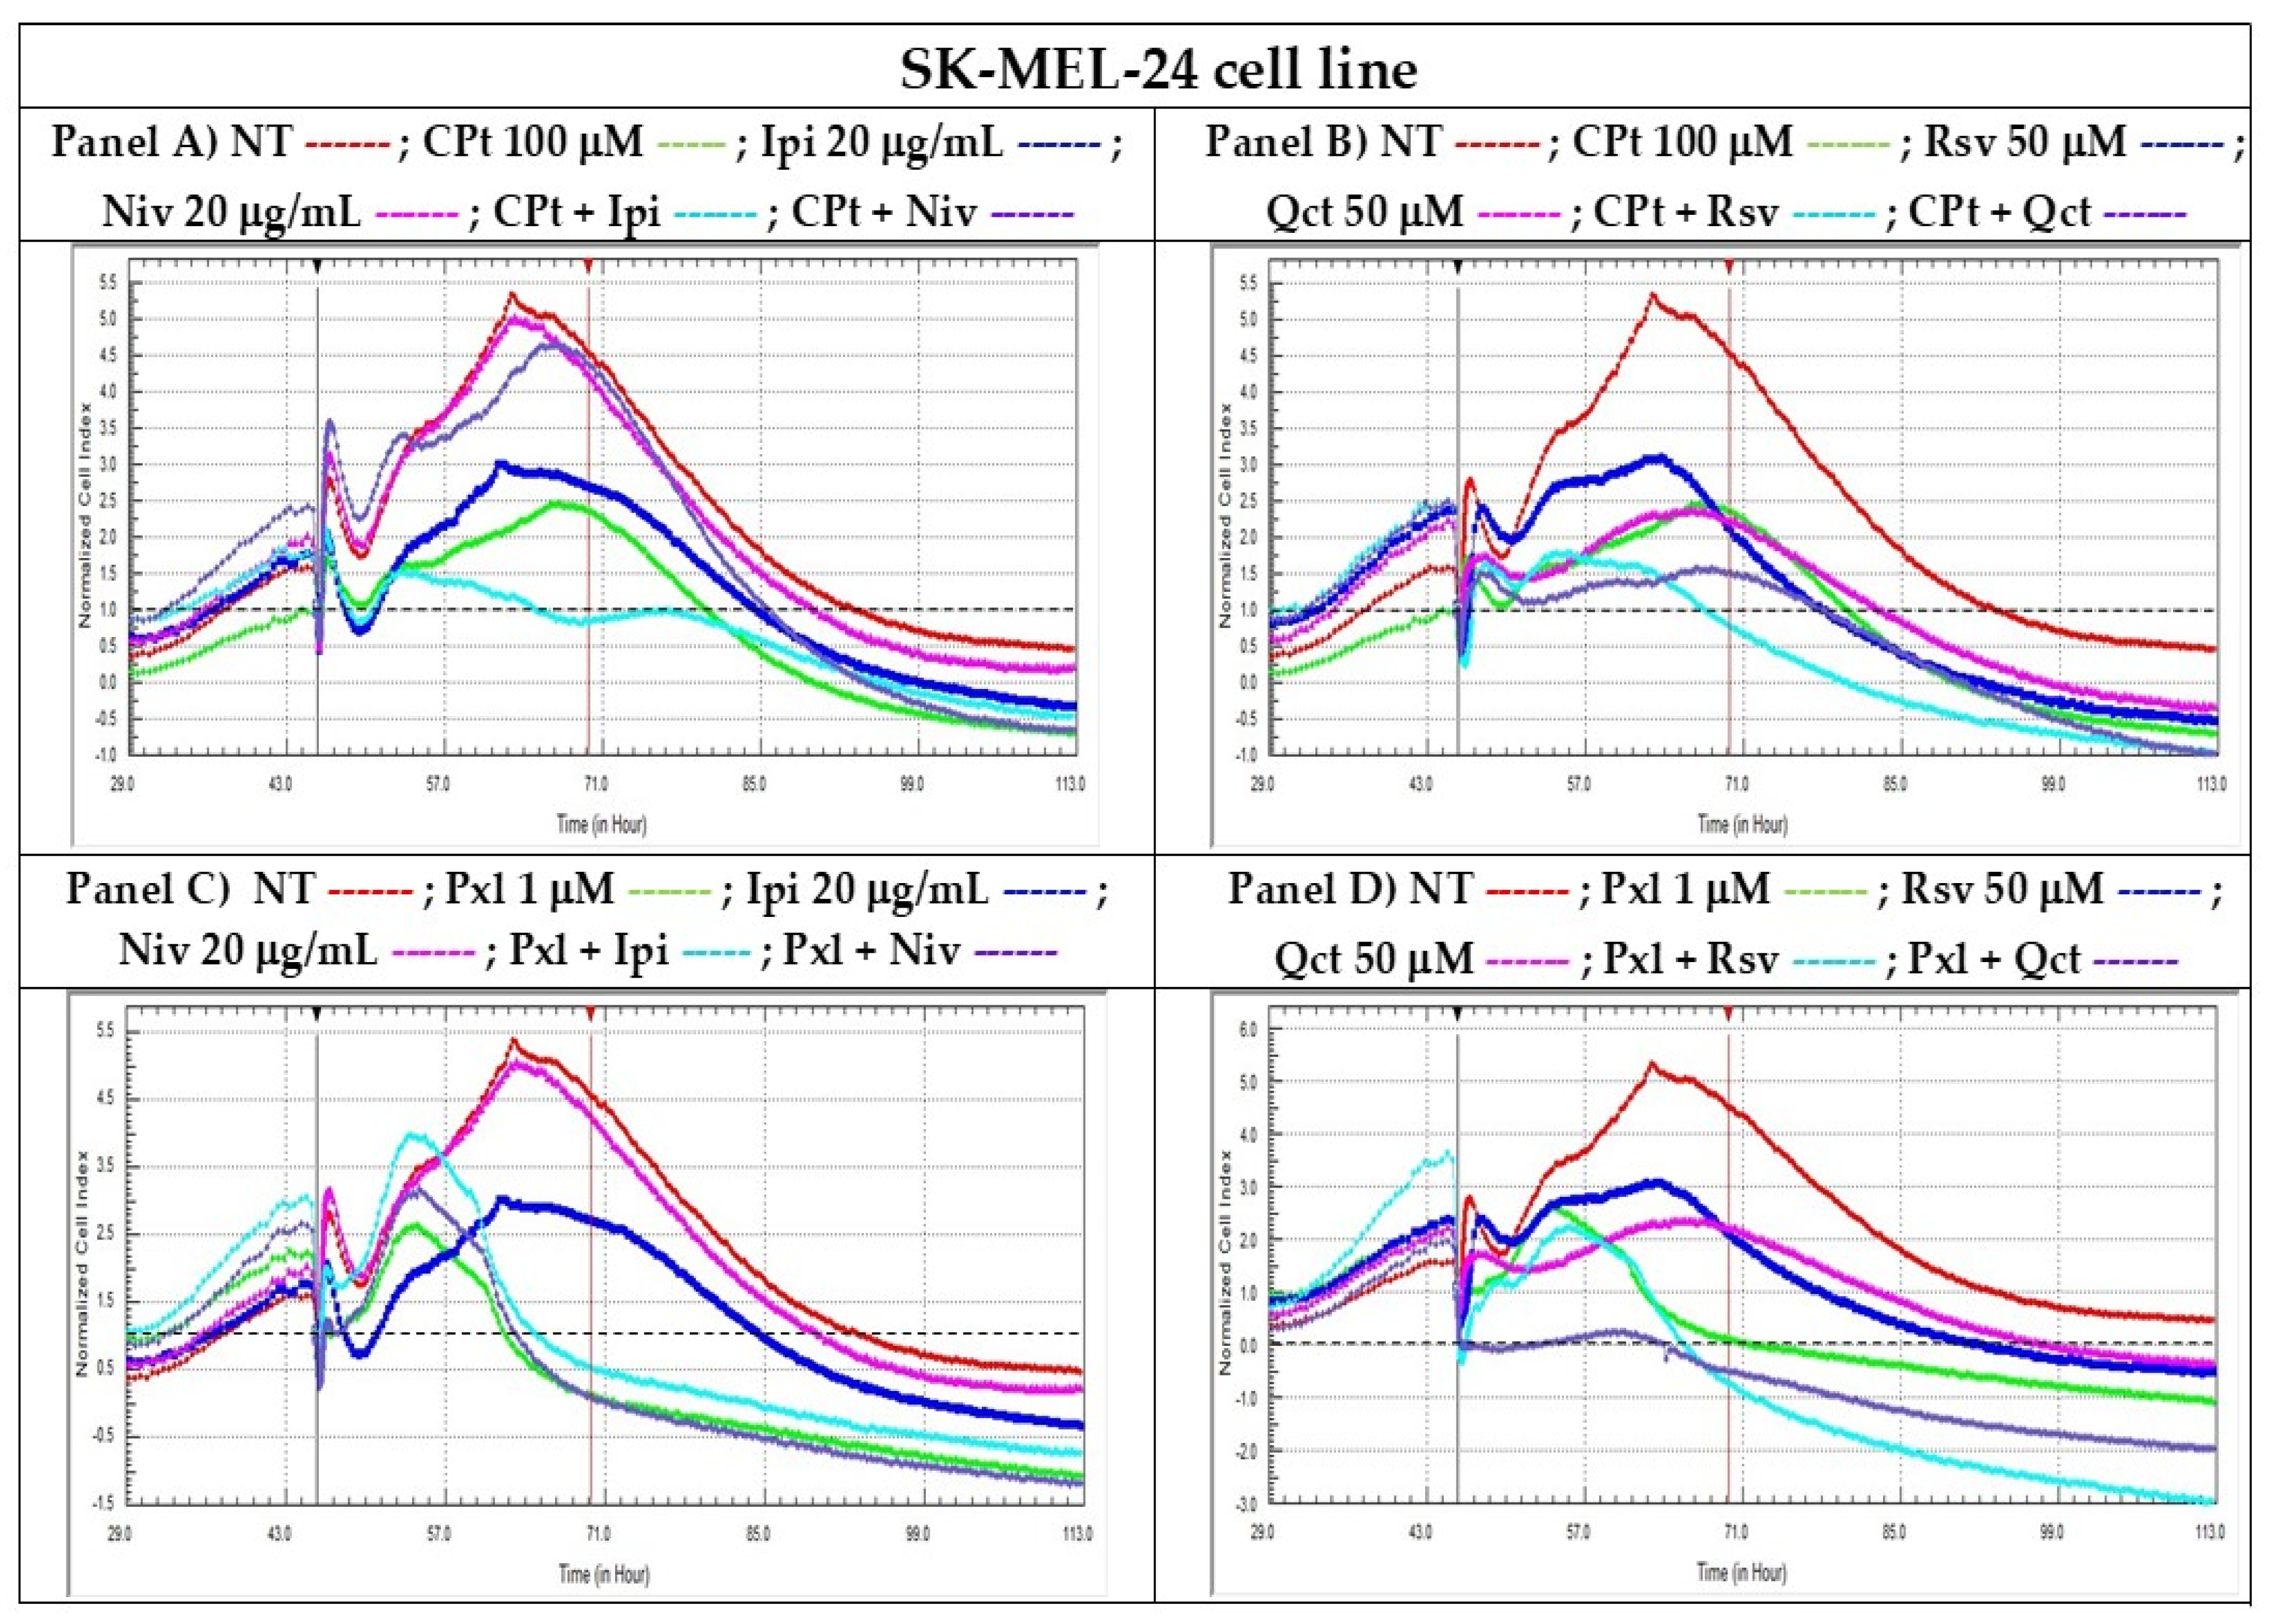
To evaluate the effects of single vs. combined treatments with the reagents under study on the cell proliferation of SK-MEL-24 human melanoma cells, we conducted a real-time evaluation for each analyzed compound, compared to non-treated cells. To assess how these compounds influenced cell proliferation, we employed the xCELLigence Real-Time Cell Analyzer (RTCA) technique and the RTCA-DP system.
Results were presented as normalized cell indexes after automatic comparison between the curves of viability for treated and non-treated cells, the time-point chosen for the normalization marker (black vertical marker) being the time-point when treatments were added. The proliferation curves were registered till the normalized CIs of treated cells decreased under the baseline level (drawn as a horizontal dotted black line for normalized CI = 1) (
Figure 2).
Following single treatment with CPt or Pxl, human melanoma SK-MEL-24 cells showed a significant reduction in cellular index, reflecting a pronounced inhibition of cell proliferation and suggesting a strong cytotoxic effect exerted by these chemotherapeutic agents. The results presented in
Figure 2 highlight the ability of CPt (Panels A and B) and Pxl (Panels C and D) to induce cell death or cell cycle arrest in melanoma cells treated individually. When combined treatments were added, the combinations of CPt with Ipi, RSV, or Qct induced a decrease in the cellular index compared to single treatments, indicating an increase in the cytotoxic effect observed for the single treatments. In contrast, the Niv individual treatment or used in combination with CPt induced a low decrease in IC compared to NT cells (
Figure 2, panels A and B).
When Pxl was used in combinations with both Ipi and Niv checkpoint inhibitors, or Rsv and Qct natural compounds, a high decrease in CI was observed, demonstrating strong inhibitions of cell proliferation.
After performing the compound-mediated cell cytotoxicity tests by colorimetric MTS to screen the proper drug concentrations, and the non-end point RTCA analyses of to demonstrate the cytotoxic or cytostatic potential of single vs. combined treatments (e.g., drugs as CPt, Pxl, or natural compounds like Rsv or Qct, and Ipi or Niv check point inhibitors) in killing the adherent melanoma cells, some concentrations were chosen for each reagent in order to be used in further end-point assays such as modulation of apoptosis process, cell cycle phases, evaluation of cytokine release or gene expression.
3.3. Evaluation of Gene Expression Related to Biological Processes
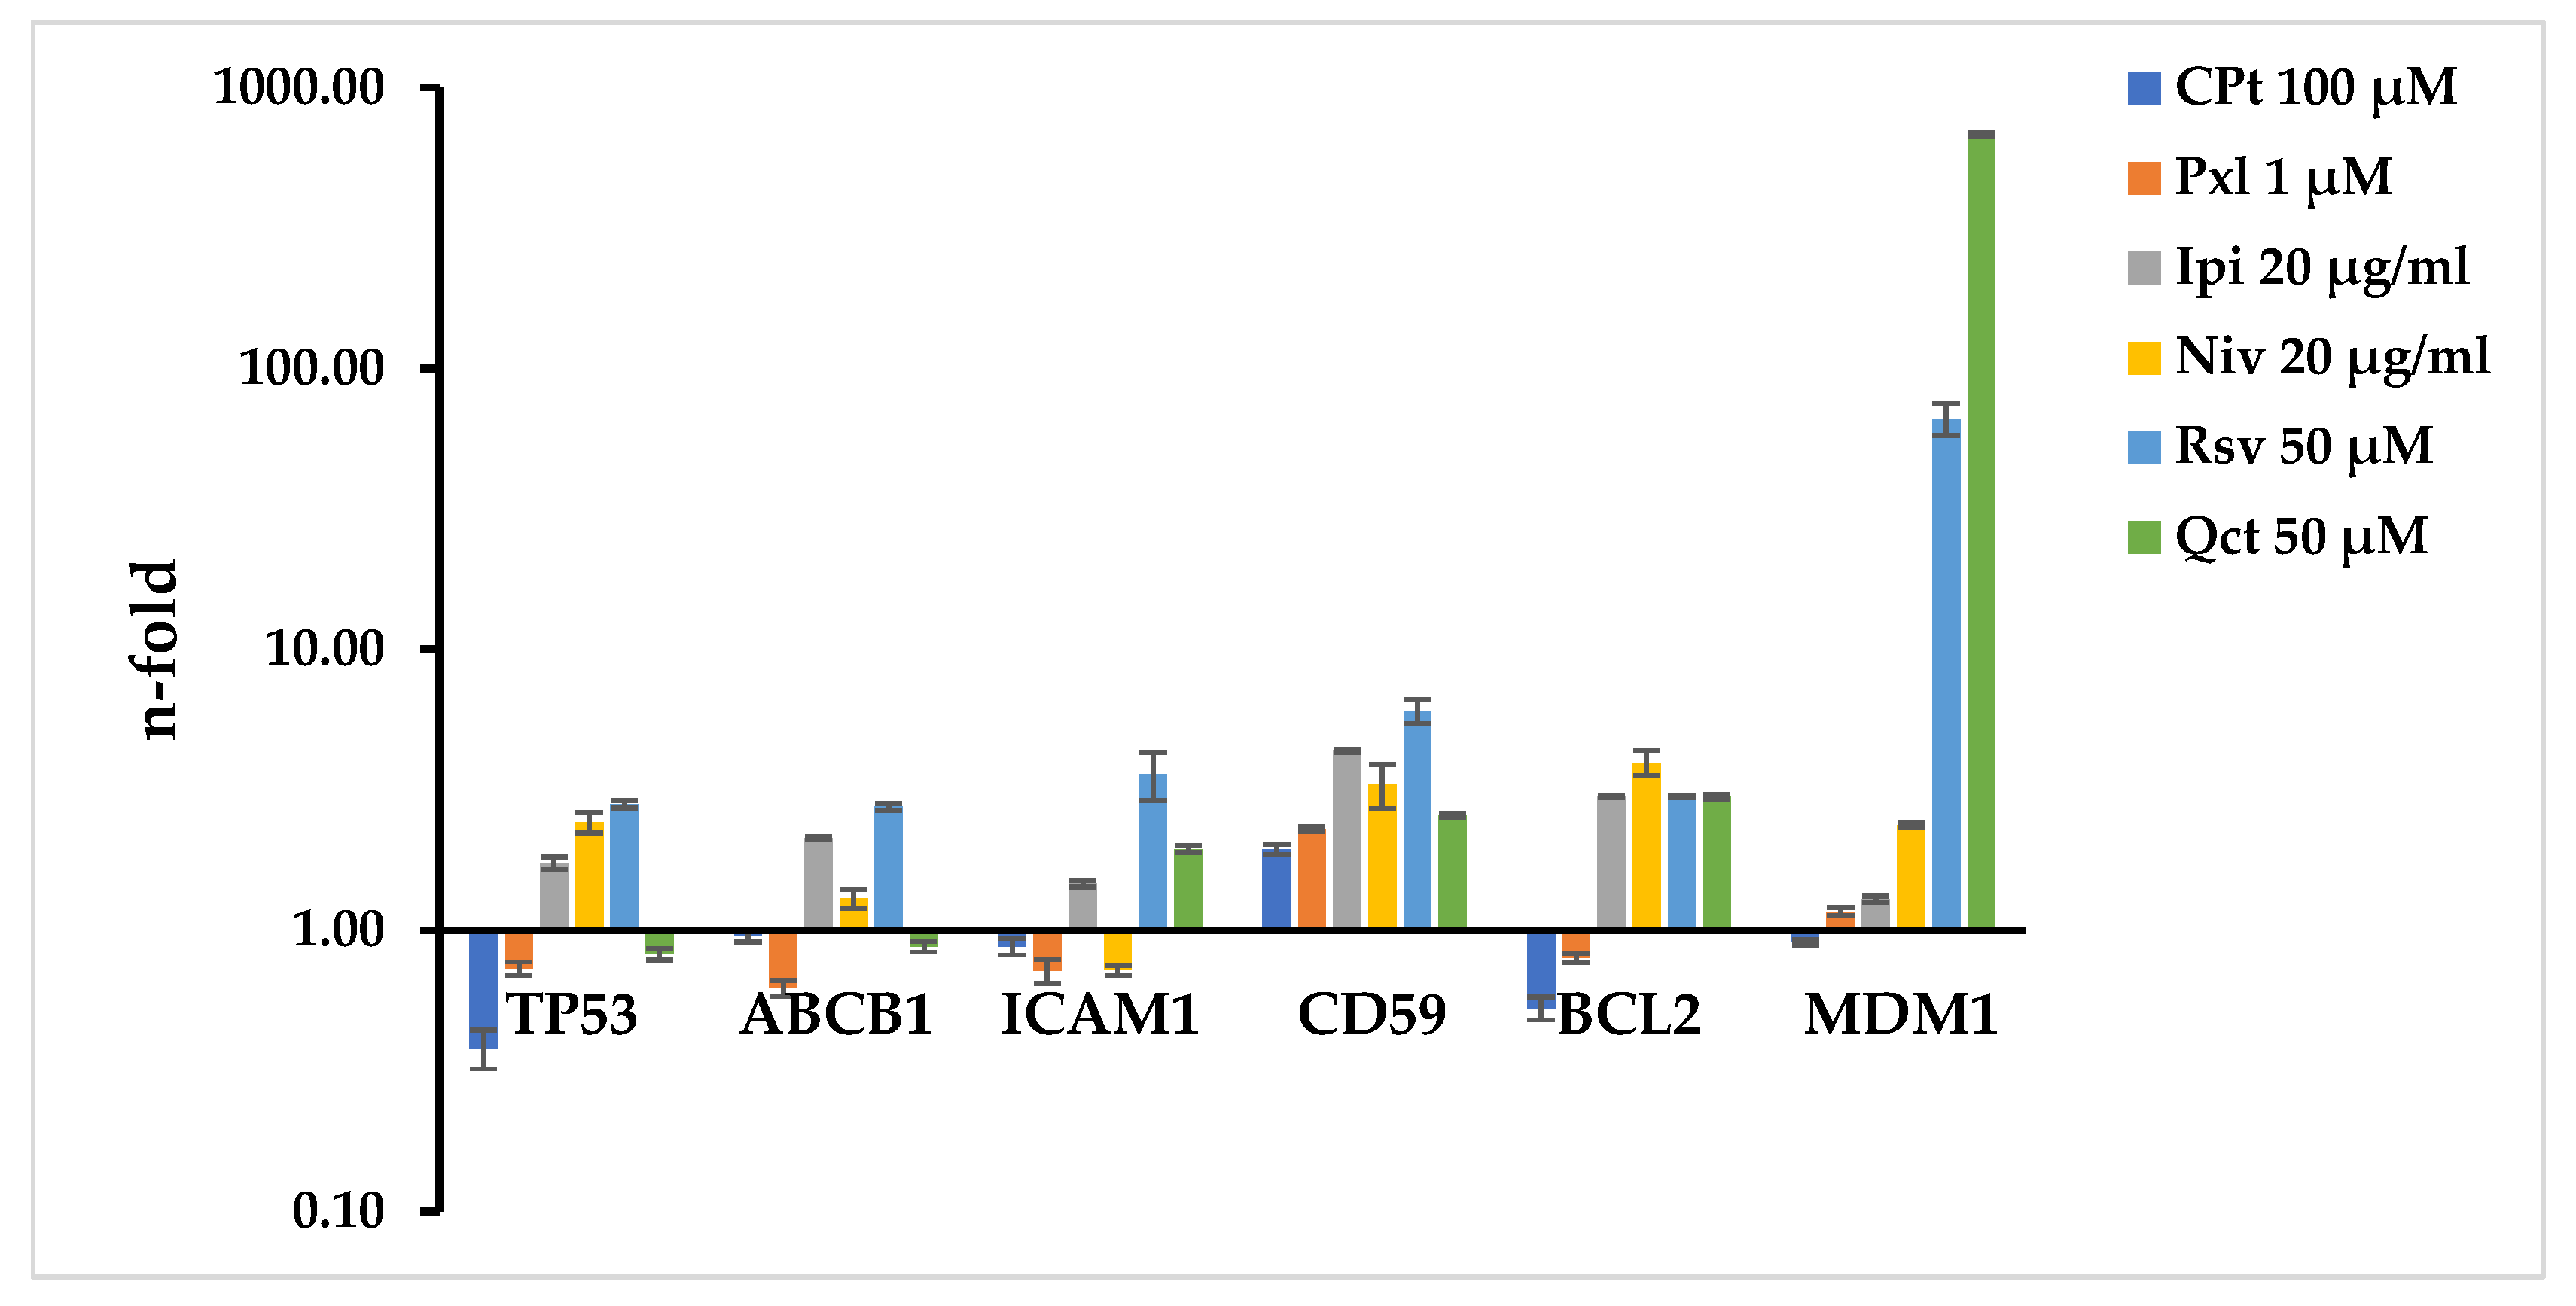
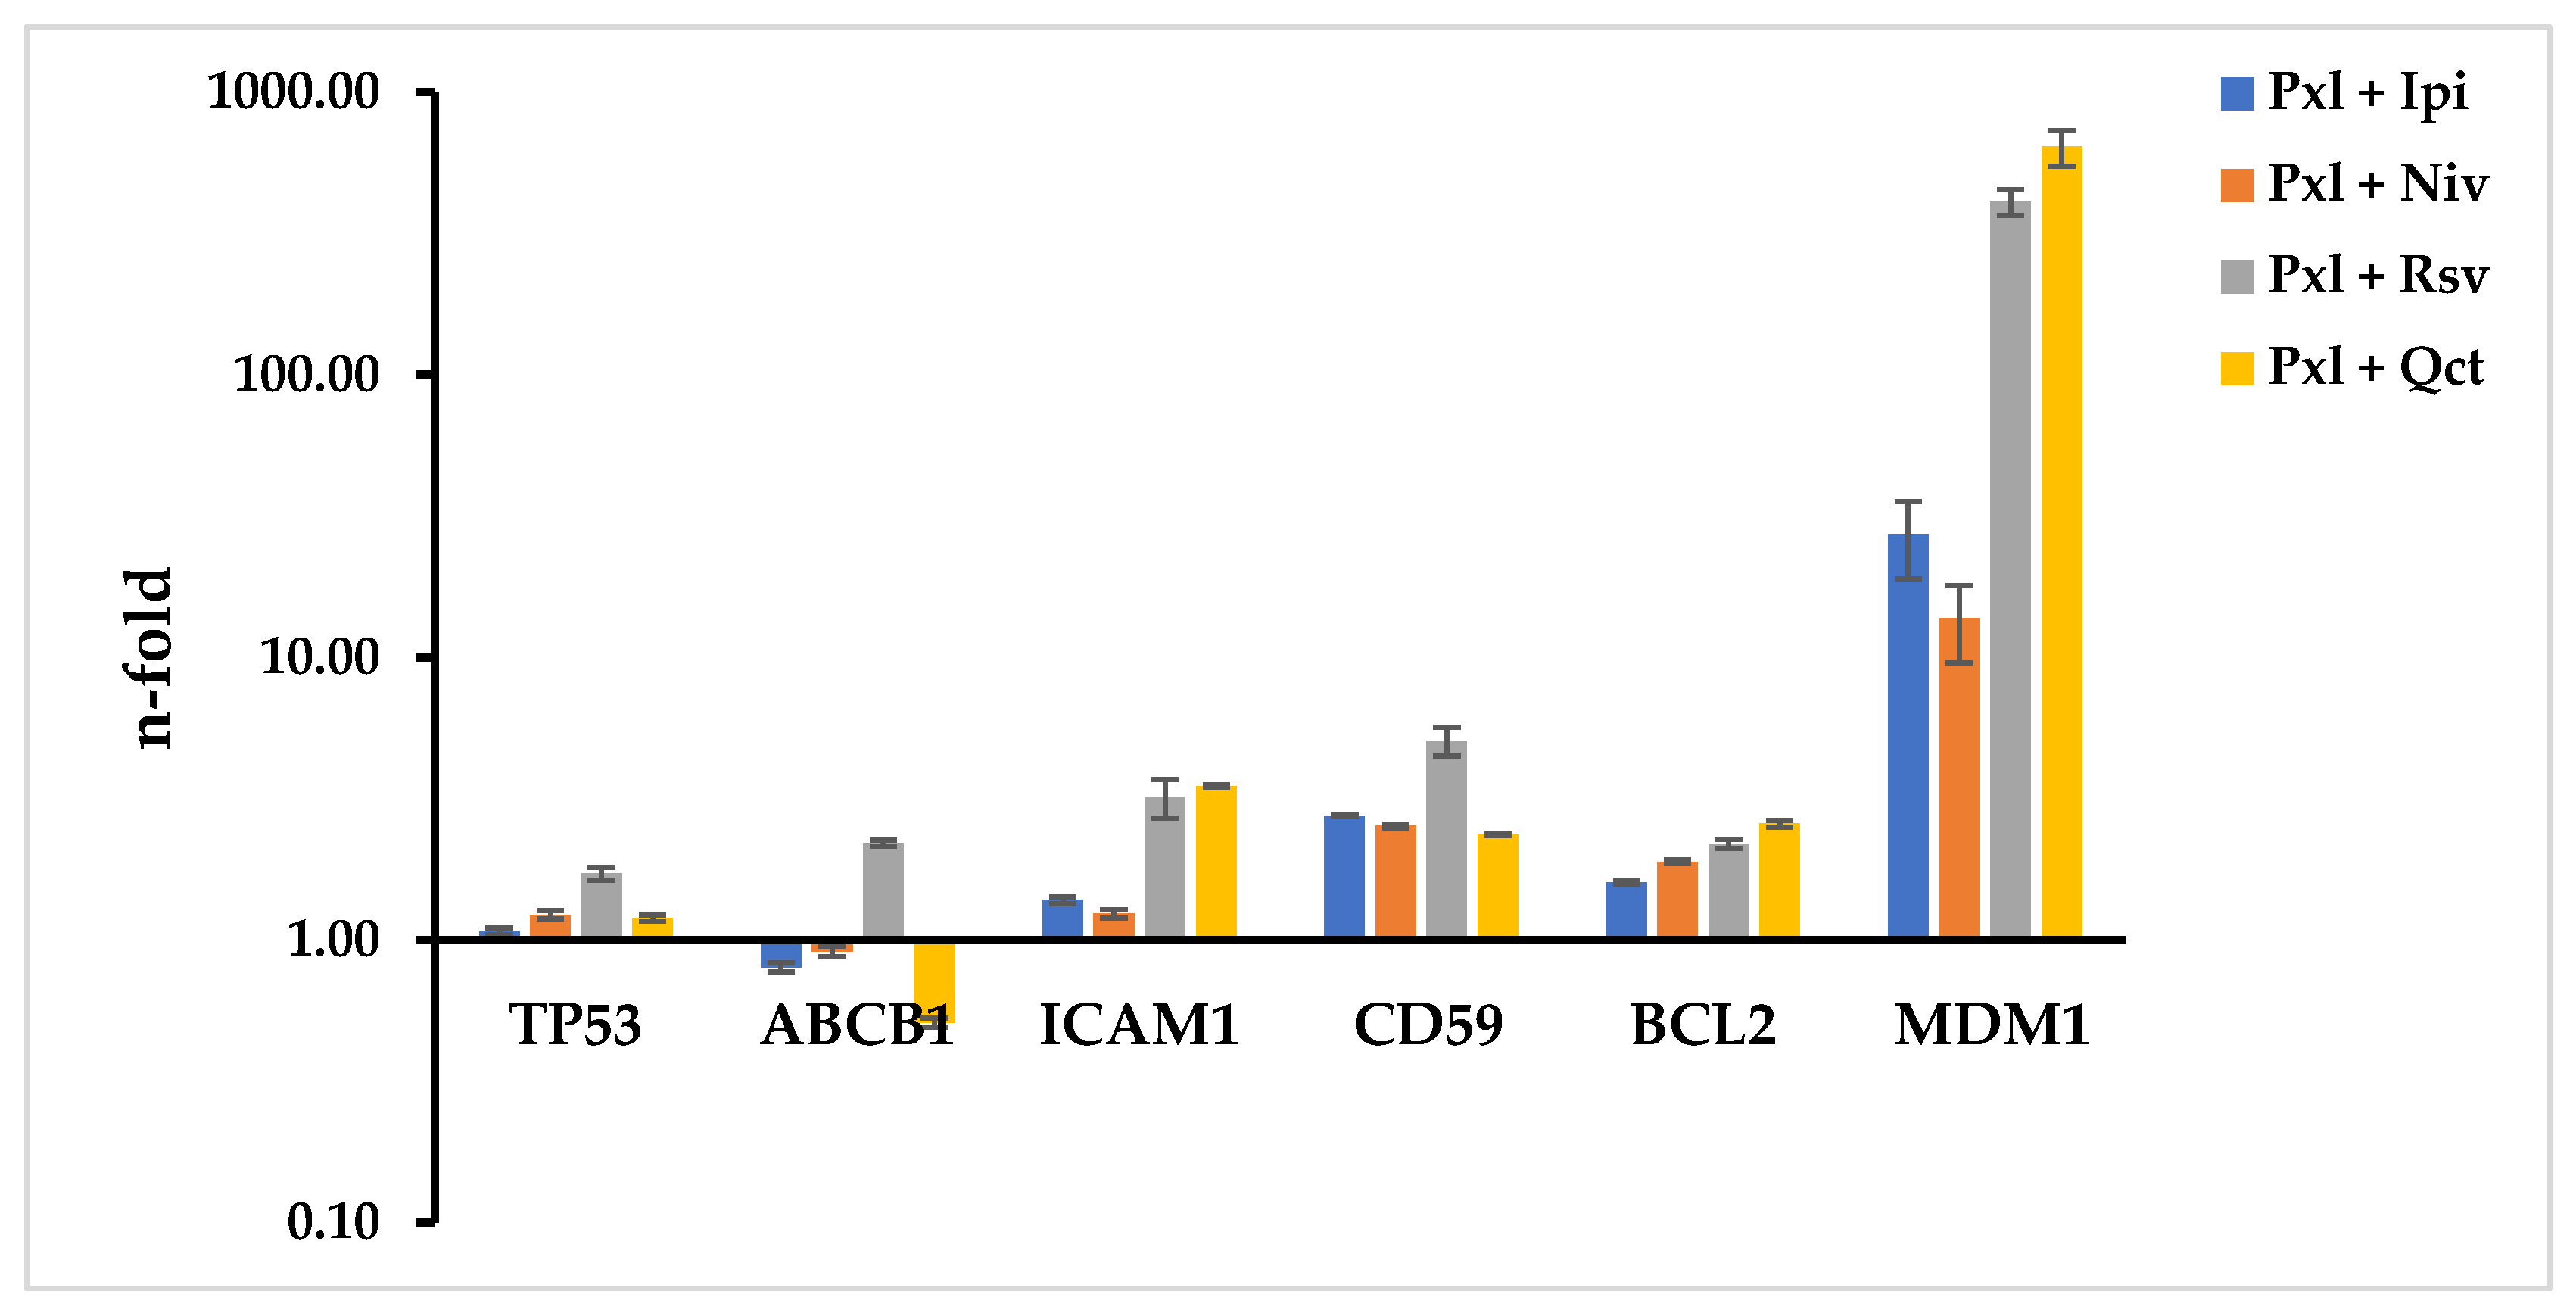
In the present study we evaluated the gene expression of several molecules with major roles in different biological processes like apoptosis (p53, bcl-2, mdm-1), cell adhesion (ICAM-1), drug-resistance (mdr-1/glycoprotein P) or complement system resistance (protectin/CD59), and the potential modulation due to the single or combined drug-treatments, described in the above sections, in SK-MEL-24 human melanoma cells.
Fixed concentrations of 100 µM of CPt or 1 µM of Pxl induced a decrease in TP53 and an increase in CD59 gene expression. All treatments increased the CD59 gene expression, while Ipi and Niv checkpoint inhibitors also induced an increase in TP53, ABCB1, ICAM-1, BCL2, or MDM1. In addition, Rsv natural compound increased expressions of TP53, ABCB1, ICAM-1, BCL2, and MDM1, while Qct induced an increase in ICAM1, BCL2, and MDM1. The modulation effects of Rsv and Qct were the strongest on MDM1, with 66.24 and 679.25 n-fold, respectively (
Figure 3).
When SK-MEL-24 cells were subjected to CPt-combined treatments, increased levels of TP53, ABCB1, CD59, BCL-2 and MDM1 were observed for CPt combination with Ipi, demonstrating the strongest effect on MDM1 (679.25 n-fold). The combination of CPt and Niv also induced increased levels of TP53, ABCB1, CD59, MDM1, and inhibited BCL2 expression. CPt combination with Rsv natural compound had an increased effect on levels of TP53, ABCB1, ICAM1, CD59 and MDM1, and a strong inhibitory effect on BCL2 expression. The combination with Qct induced the strongest increased levels of expression of ICAM1 (2.1 n-fold) and MDM1 (2.37 n-fold) (
Figure 4).
All Pxl-combined treatments stimulated the increased expression levels of all genes under study, except for the effects of Pxl combined with Ipi, Niv, or Qct, which inhibited ABCB1 levels. The highest modulation effects were observed on MDM1 levels for the Pxl-combined treatments with Ipi, Niv, Rsv, or Qct, which induced 27.31, 13.78, 408.96, and 641.01 n-fold increases, respectively. The combination of Pxl with Rsv also increased the levels of expression of TP53, ABCB1, ICAM1, CD59, and BCL2 by 1.72-, 2.2-, 3.2-, 5.07-, and 2.58-fold, respectively (
Figure 5).
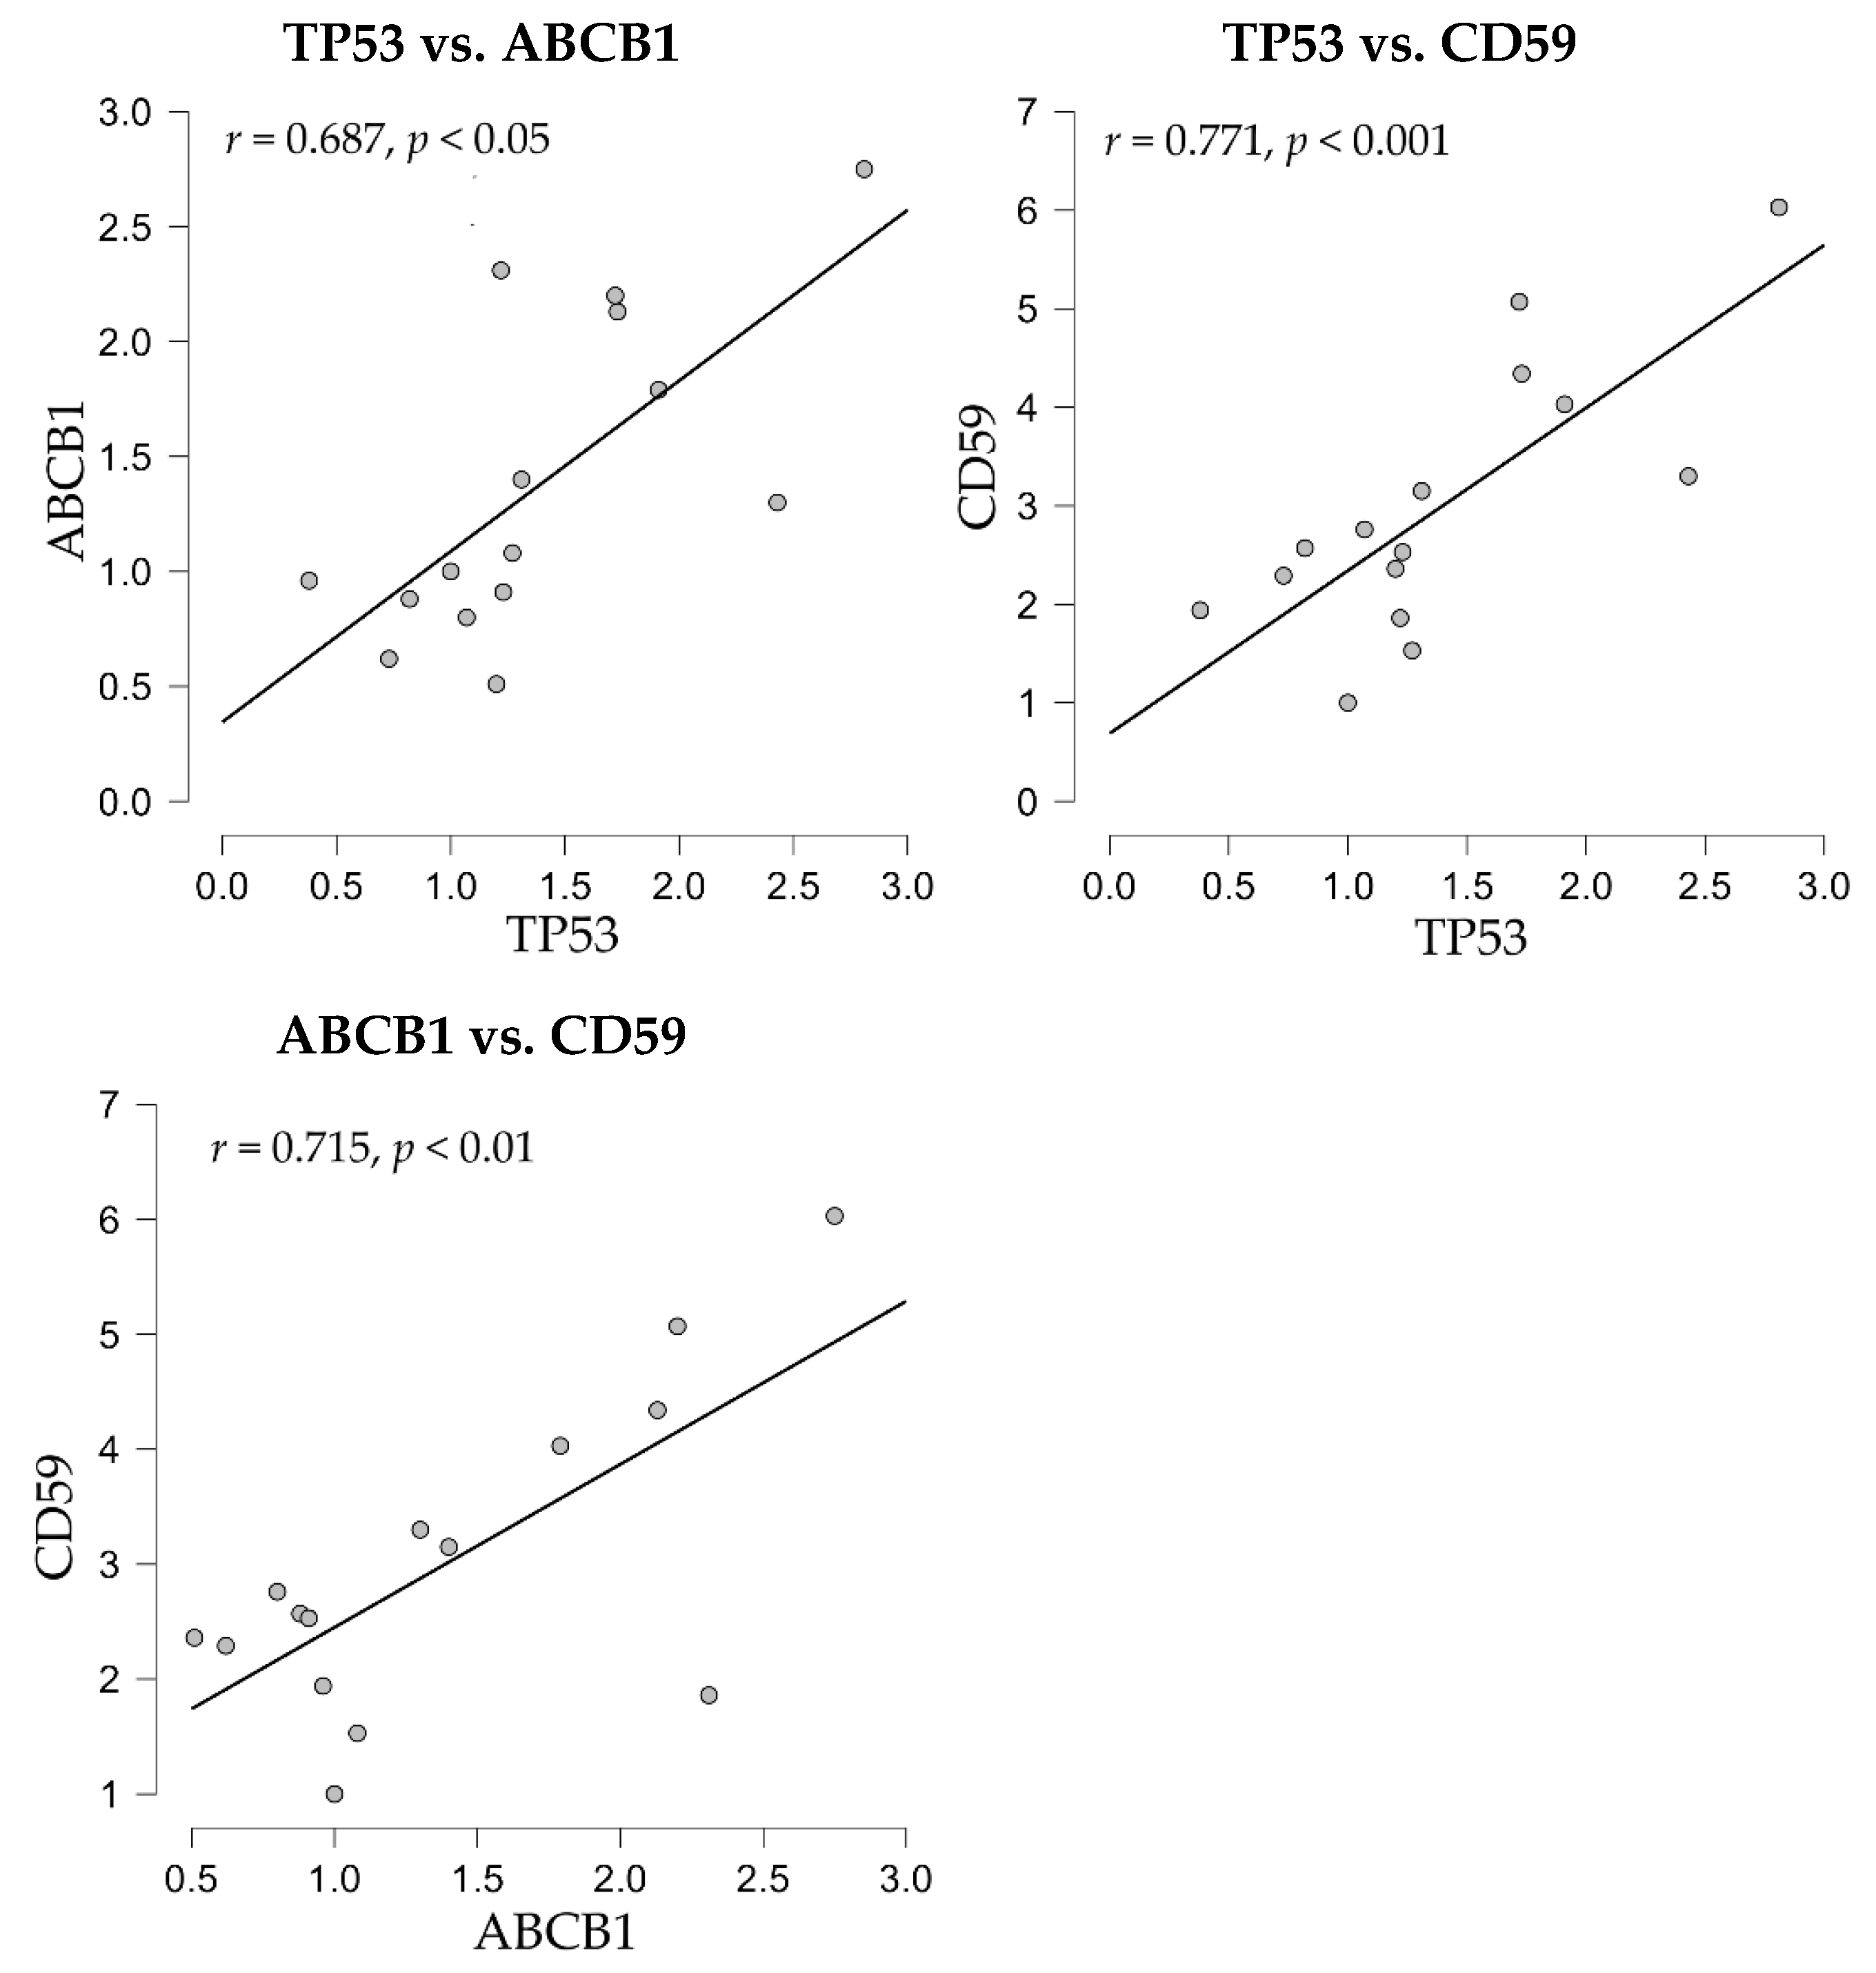
The correlation analyses of gene expression showed positive correlations between the apoptosis-related p53 molecule, codified by the TP53 gene, and both drug-resistance mdr-1/glycoprotein P, codified by the ABCB1 gene, and the complement inhibitor CD59 (
Figure 6).
3.4. Compound-Induced Apoptosis in Sk-Mel-24 Human Melanoma Cell Line
In order to evaluate the effect of single versus combined treatments of CPt and Pxl oncolytic drugs, Ipi and Niv immune checkpoint inhibitors, or Rsv and Qct bioactive natural compounds in the induction/modulation of apoptosis, SK-MEL-24 melanoma cells were cultured for 24 h, and then cells were treated with fixed concentrations of reagents, chosen after performing the MTS and RTCA test: 100 µM of CPt, 1 µM of Pxl, 50 µM of Rsv or Qct, 20 µg/mL of Ipi or Niv. After 24 h of treatment, melanoma cells were detached, washed twice with PBS, stained with Annexin V-FITC and/or PI, followed by flow-cytometry acquisition and analysis, the apoptotic events being expressed as percentages of cells.
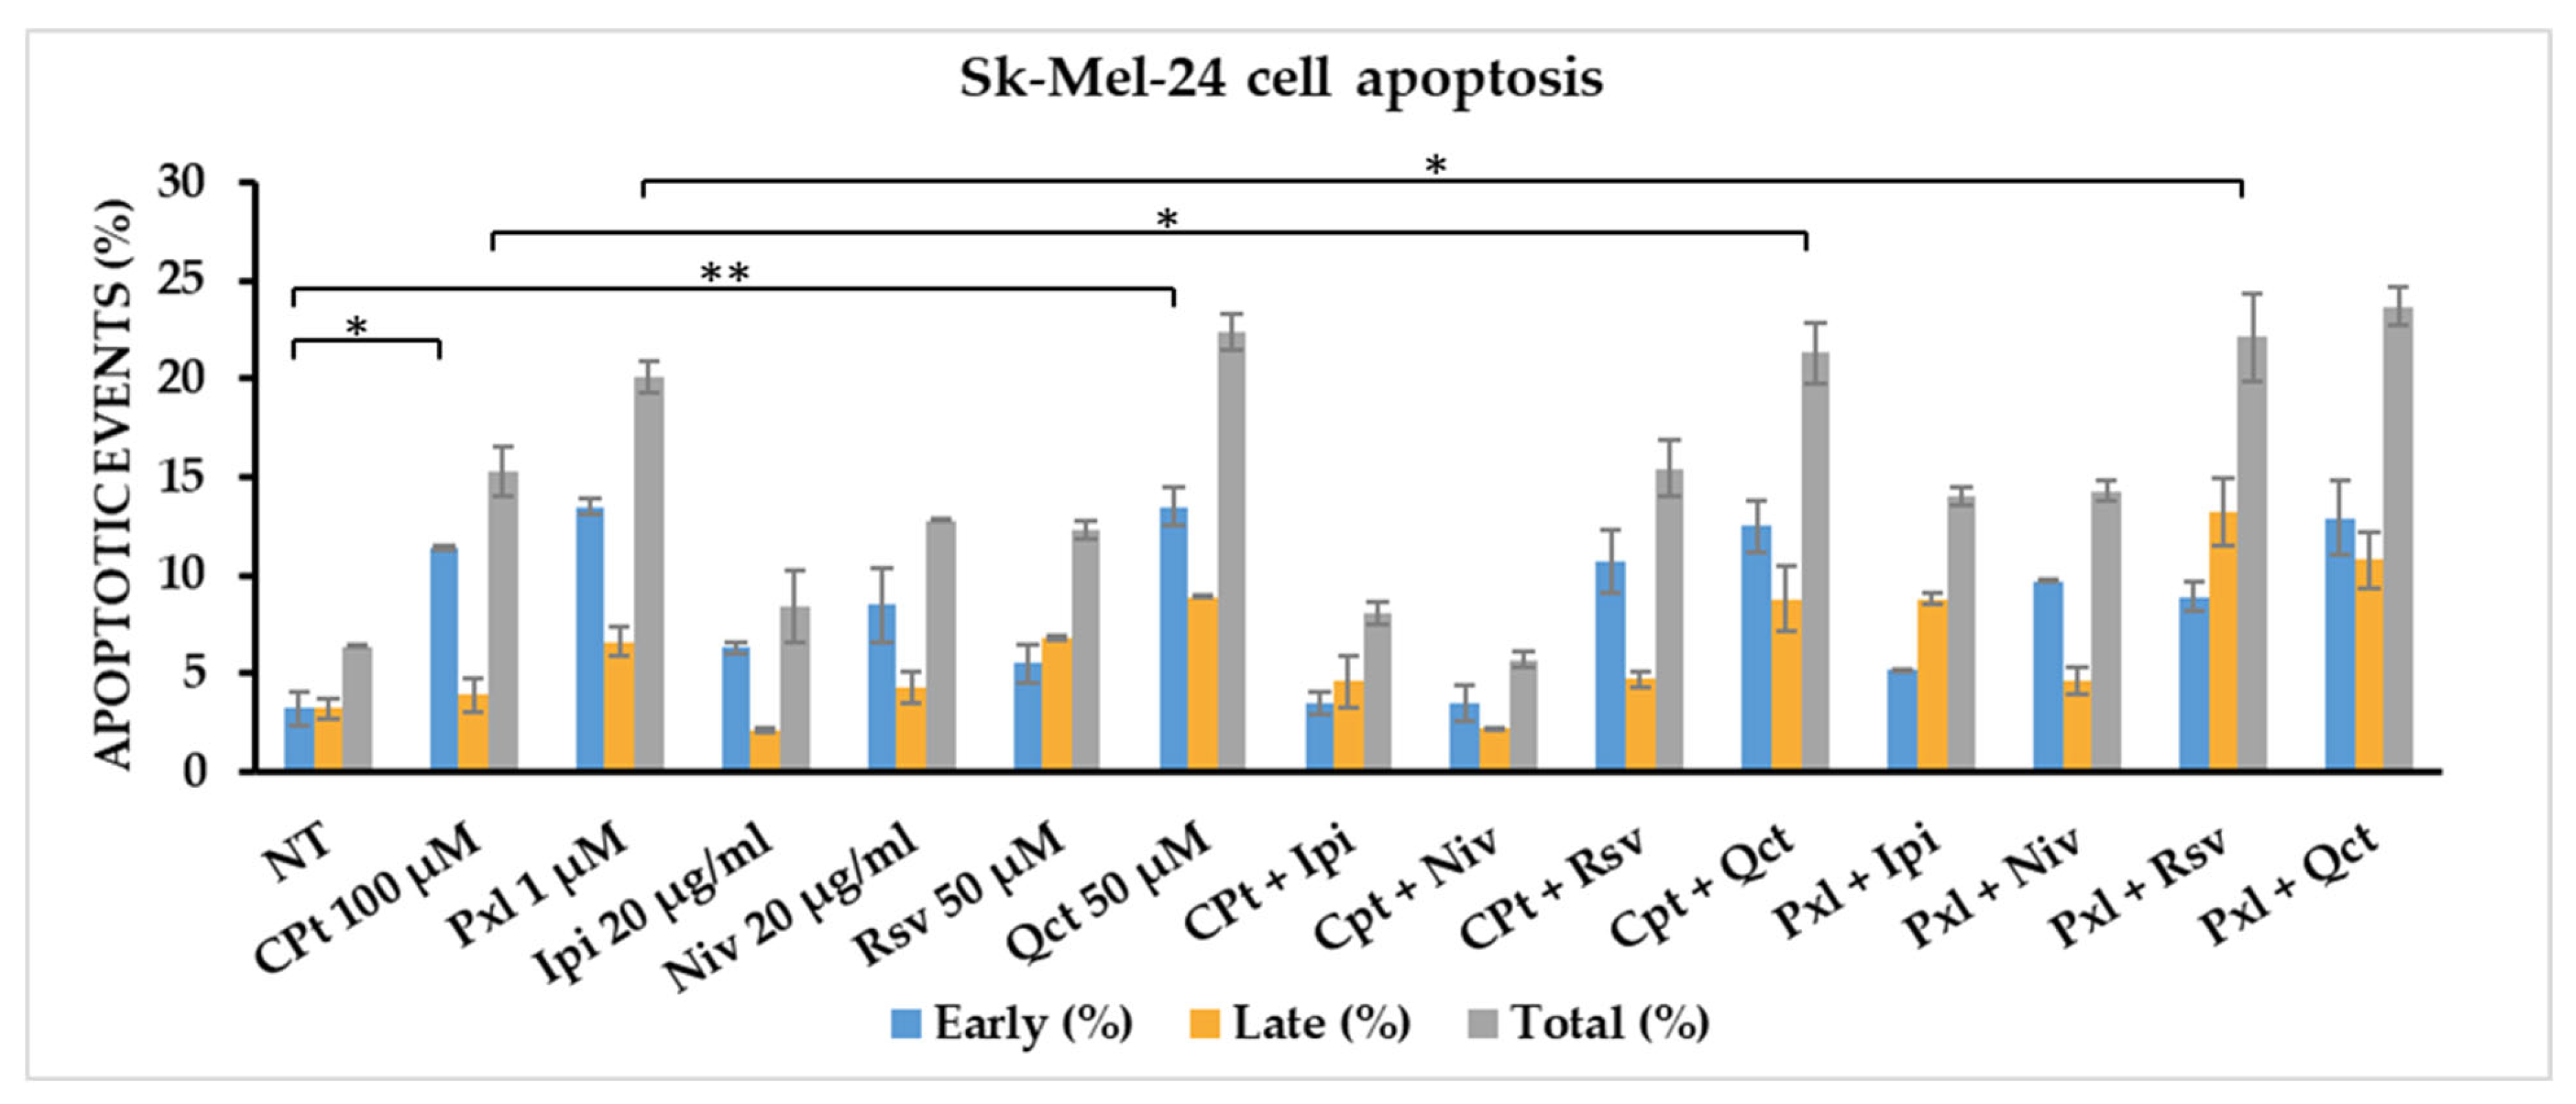
An increase in early apoptosis was observed for all single treatments, compared to non-treated control cells. The strongest effect was observed for 100 mM Cpt, reaching 11.4% apoptotic events, and for 1 mM Pxl or 50 mM Qct treatments, reaching 13.5% apoptotic events. Both Ipi and Niv checkpoint inhibitors, used at 20 mg/mL concentration, induced 6.3% and 8.5% of early apoptosis, while 50 mM Rsv induced 5.5% early apoptotic events (
Figure 7,
Table 1).
Also, the combined treatments induced an increase in early apoptotic events compared to non-treated melanoma cells, the strongest effect being observed when cells were treated with CPt combinations with Rsv or Qct natural compounds, reaching 10.7% and 12.5%, respectively. Pxl combination with Qct or Rsv induced 8.9% and 12.9% early apoptosis. Both combinations of Pxl with the checkpoint inhibitors induced higher levels of early apoptosis than Ipi or Niv single treatments (
Figure 7,
Table 1).
The highest levels of late apoptotic events, over 8%, were mainly induced by single Qct and the combinations with either CPt or Pxl treatments, reaching 8.9%, 8.8%, and 10.8%, respectively; in addition, Pxl and Rsv combined treatment increased the late apoptosis till 13.2% (
Figure 7,
Table 1).
When we calculated the total apoptosis, we observed that Cpt, Niv, and Rsv single treatments induced levels of apoptosis between 10 and 20%, while Pxl and Qct increased the total apoptosis to 20.1% and 22.4%, respectively. Rsv and Qct combined treatments with CPt induced levels of total apoptosis of 15.4% and 21.3%, while their combinations with Pxl increased the total apoptosis to 22.1% and 23.7%, respectively. The combinations of Ipi or Niv with Pxl induced higher levels of total apoptosis than their combinations with CPt: 14% and 14.3% compared to 8.1% and 5.7% (
Figure 7,
Table 1).
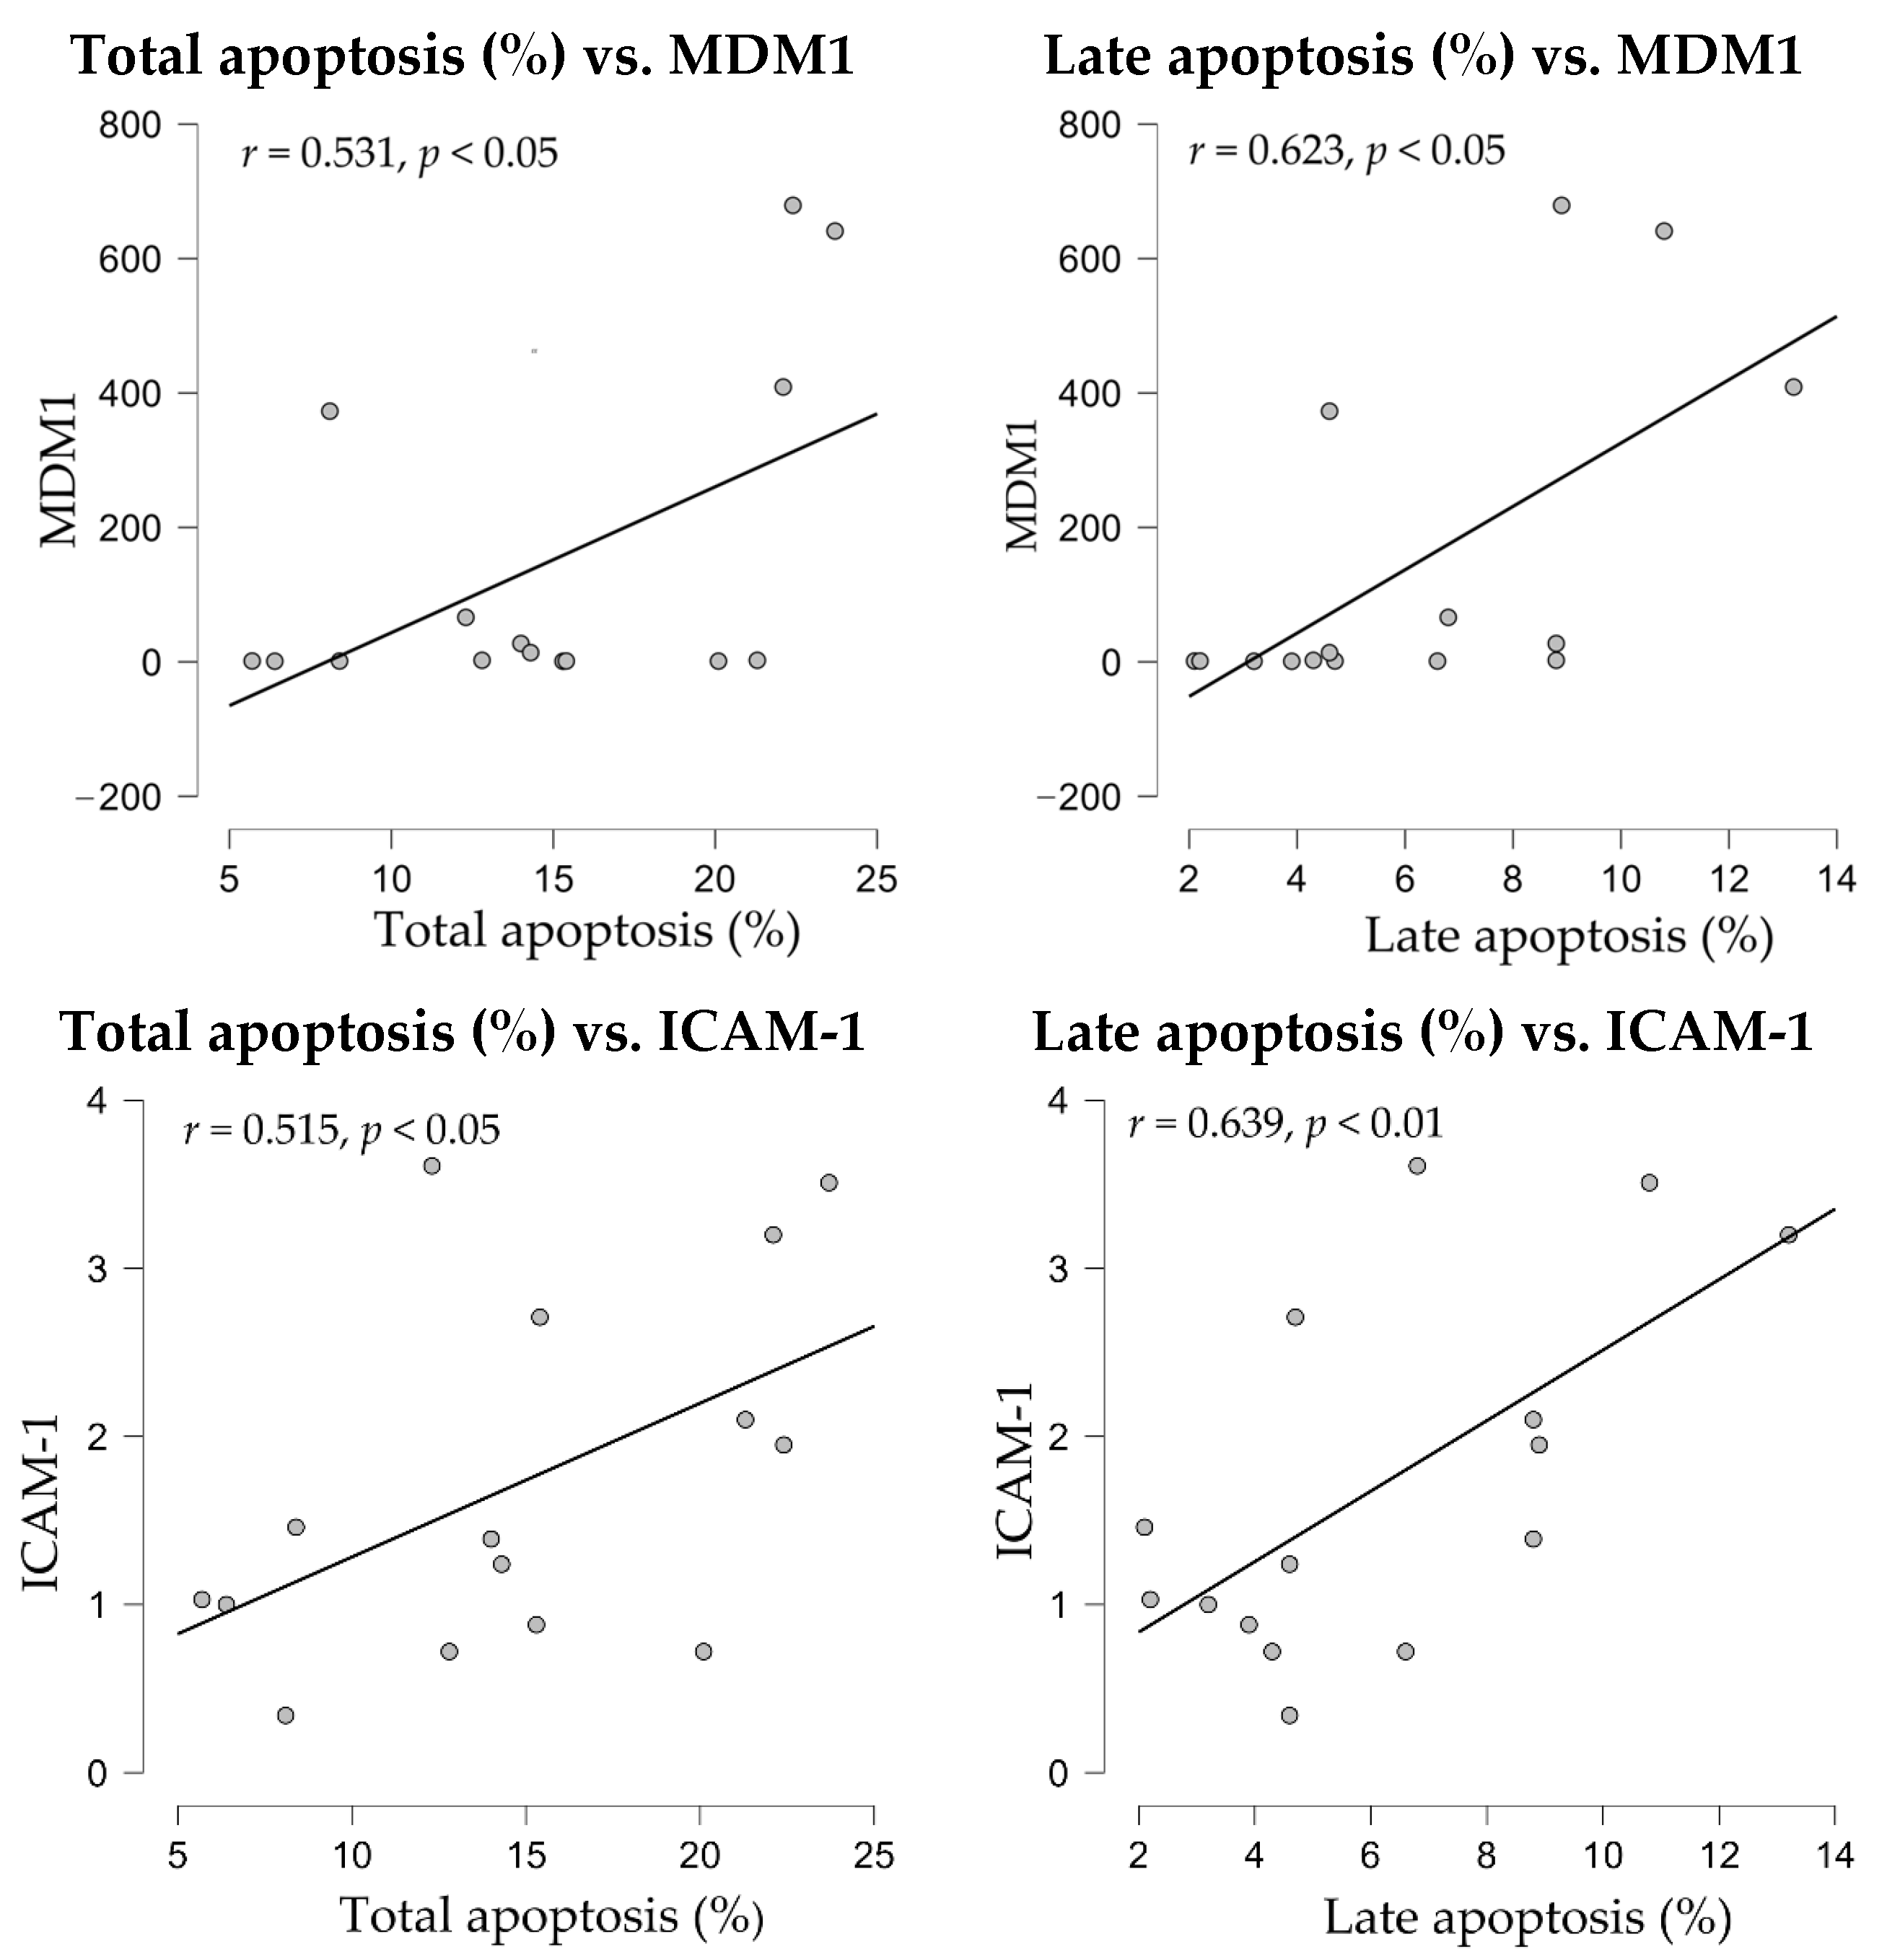
When apoptosis levels were subjected to correlation analyses, both total and late apoptosis showed significant correlations with MDM1 and ICAM1 gene expressions (
Figure 8).
3.5. Compound-Modulation of Cell Cycle Phases
The anti-carcinogenic effects of single or combined drug treatments can be observed by assessing the changes in cell cycle progression. Oncolytic reagents like CPt and Pxl, as well as phytochemicals like QCT and RSV, or checkpoint inhibitors like Ipi and Niv, used alone or in combination, can influence DNA progression through the SK-MEL-24 cell cycle phases.
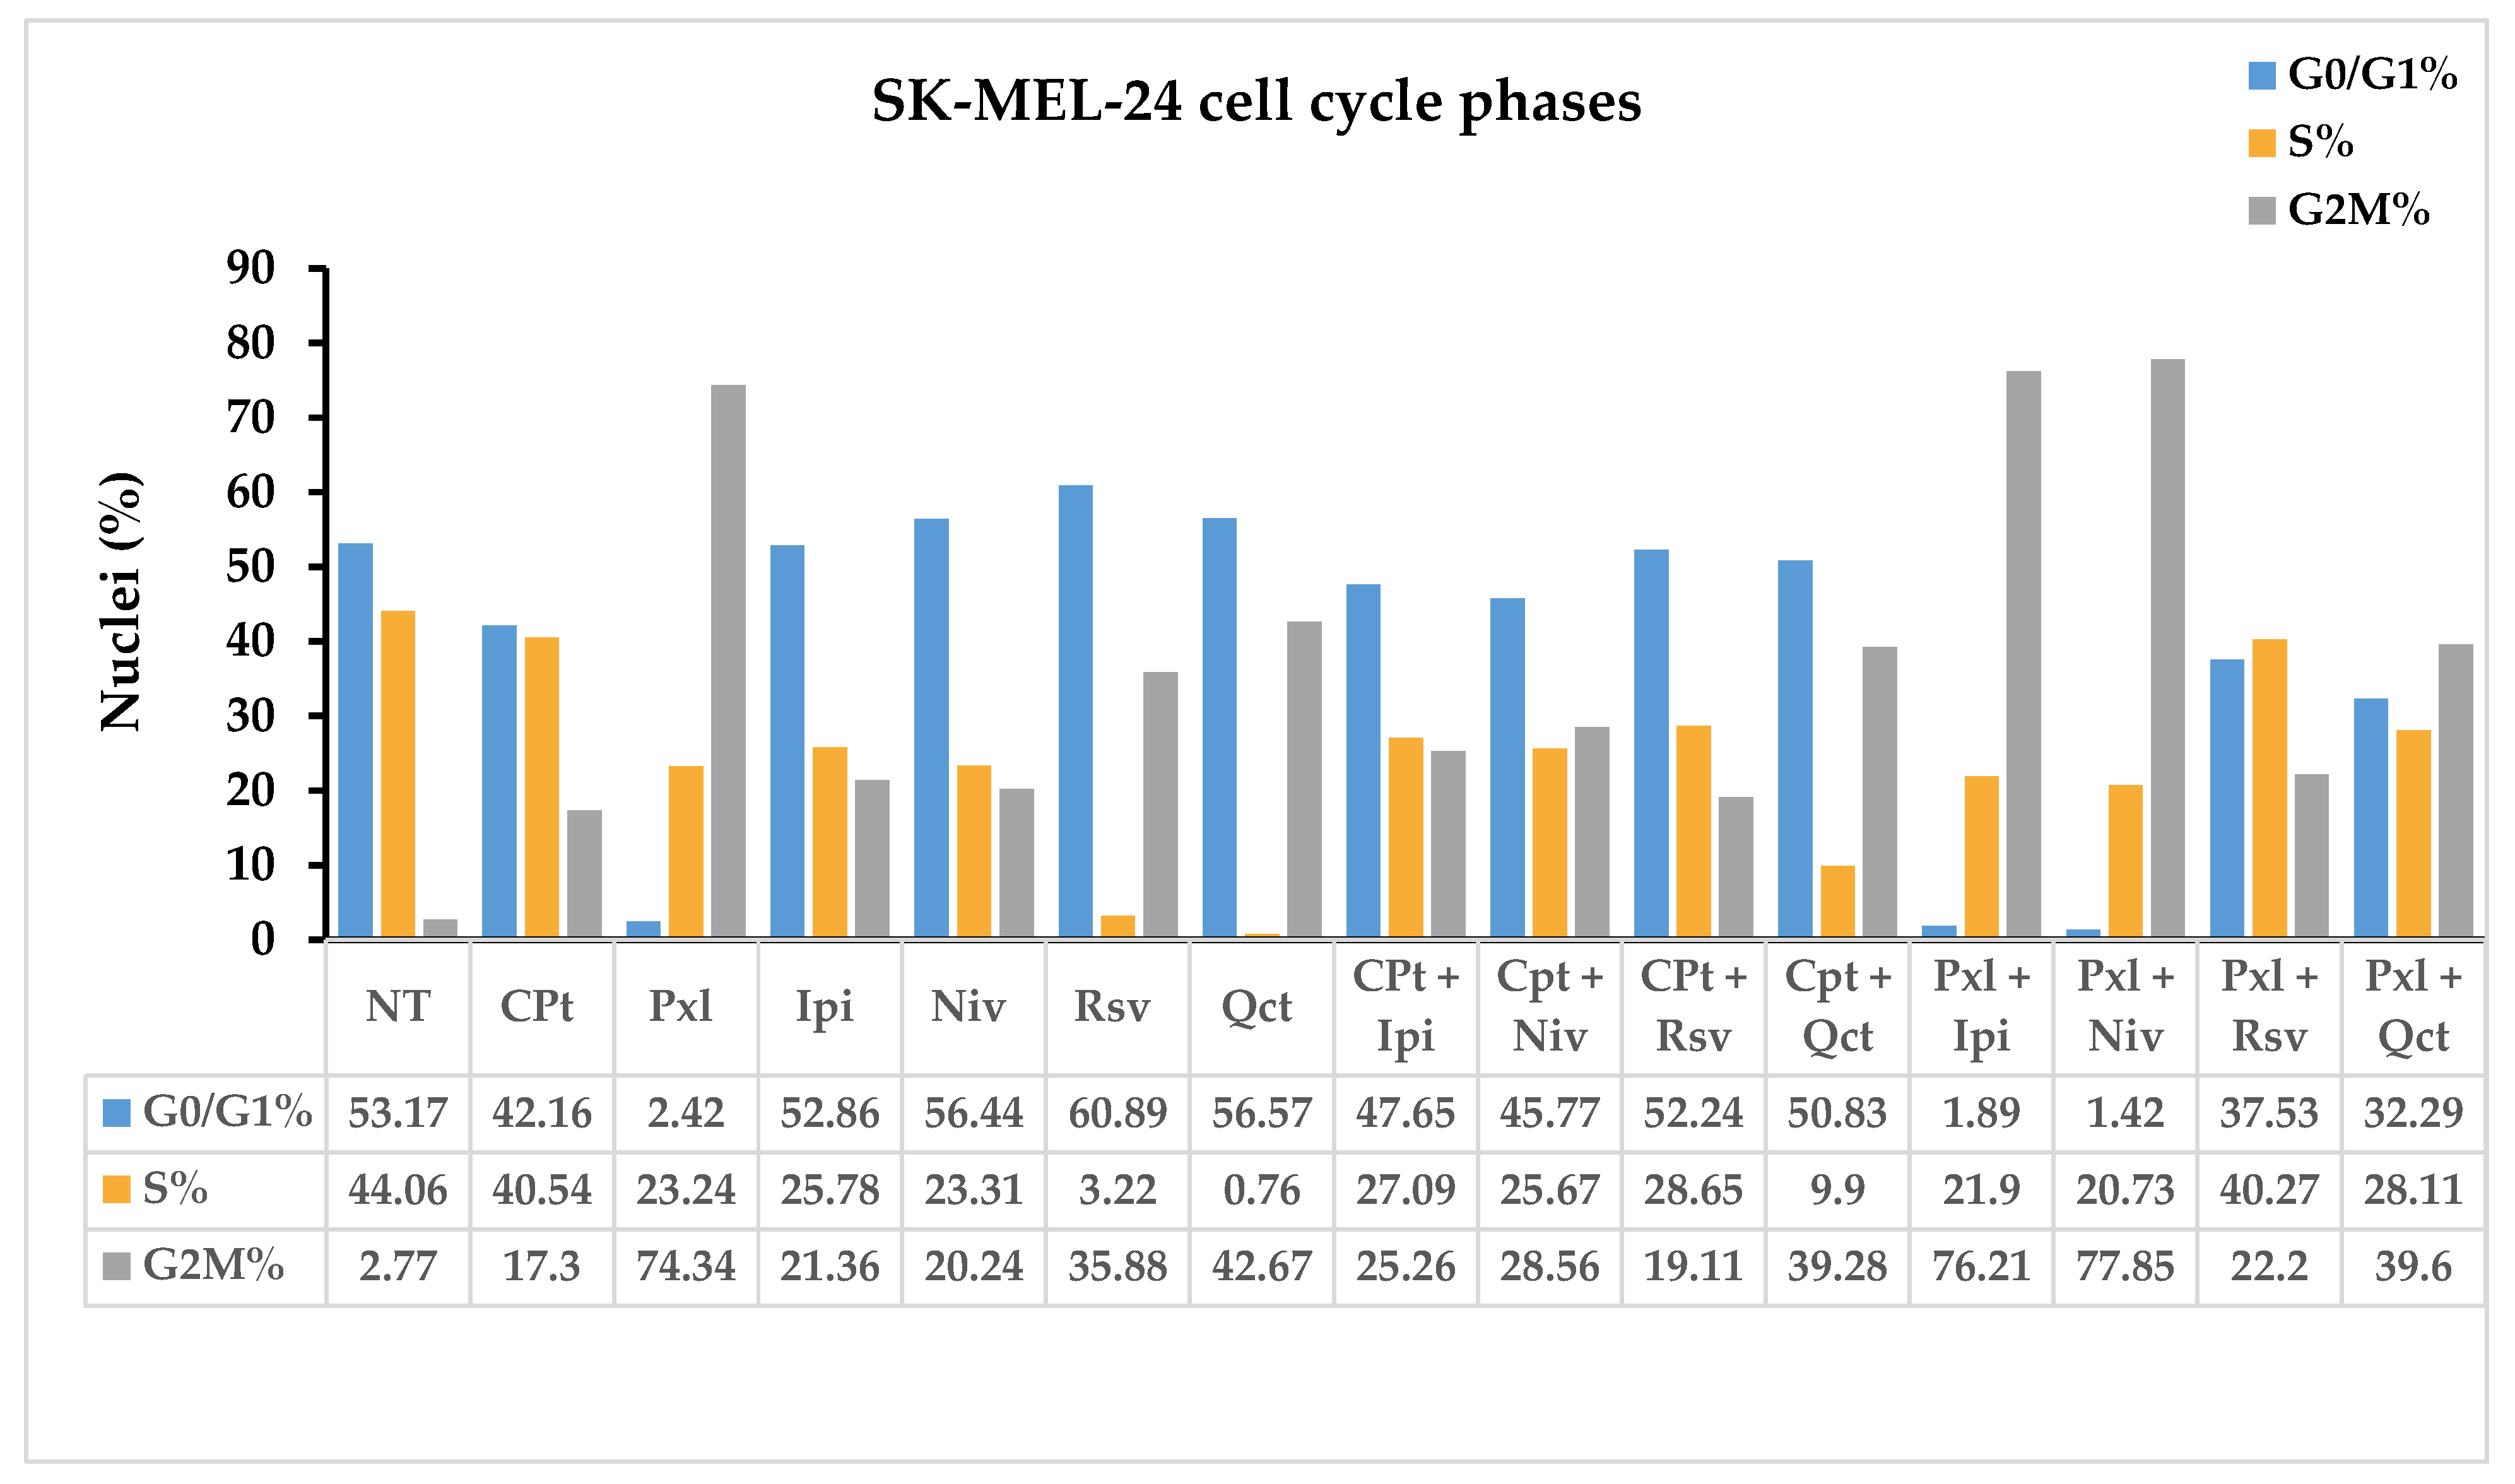
Control non-treated SK-MEL-24 cells displayed a cell distribution of 53.17% in G0/G1, 44.06% in S, and 2.77% in G2M cell cycle phases. All single or combined treatments induced a decrease in the cell distribution in the S phase compared to NT cells; the highest decrease in nuclei percentages after single treatments was observed for Rsv and Qct treatments, to 3.22% and 0.76%, respectively. High decreases in nuclei in the S phase, under 30%, were observed also for Pxl, Ipi, and Niv single treatments, or CPt combinations with Ipi, Niv, and Rsv, while the combination with Qct decreased S phase till 9.9% nuclei. Pxl combined treatments with Ipi, Niv, and Qct induced a decrease in S phase under 30%, too (
Figure 9).
Niv, Rsv, and Qct single treatments induced an increase in G0/G1 phase, while CPt single and combined treatments induced a decrease in G0/G1 phase. The highest decreases in G0/G1 phase, till 2.42%, 1.89% and 1.42%, were observed for Pxl single and combined with Ipi or Niv; concomitant high increases in G2M phase, till 74.34%, 76.21% and 77.85%, respectively, accompanied these G0/G1 decreases (
Figure 9).
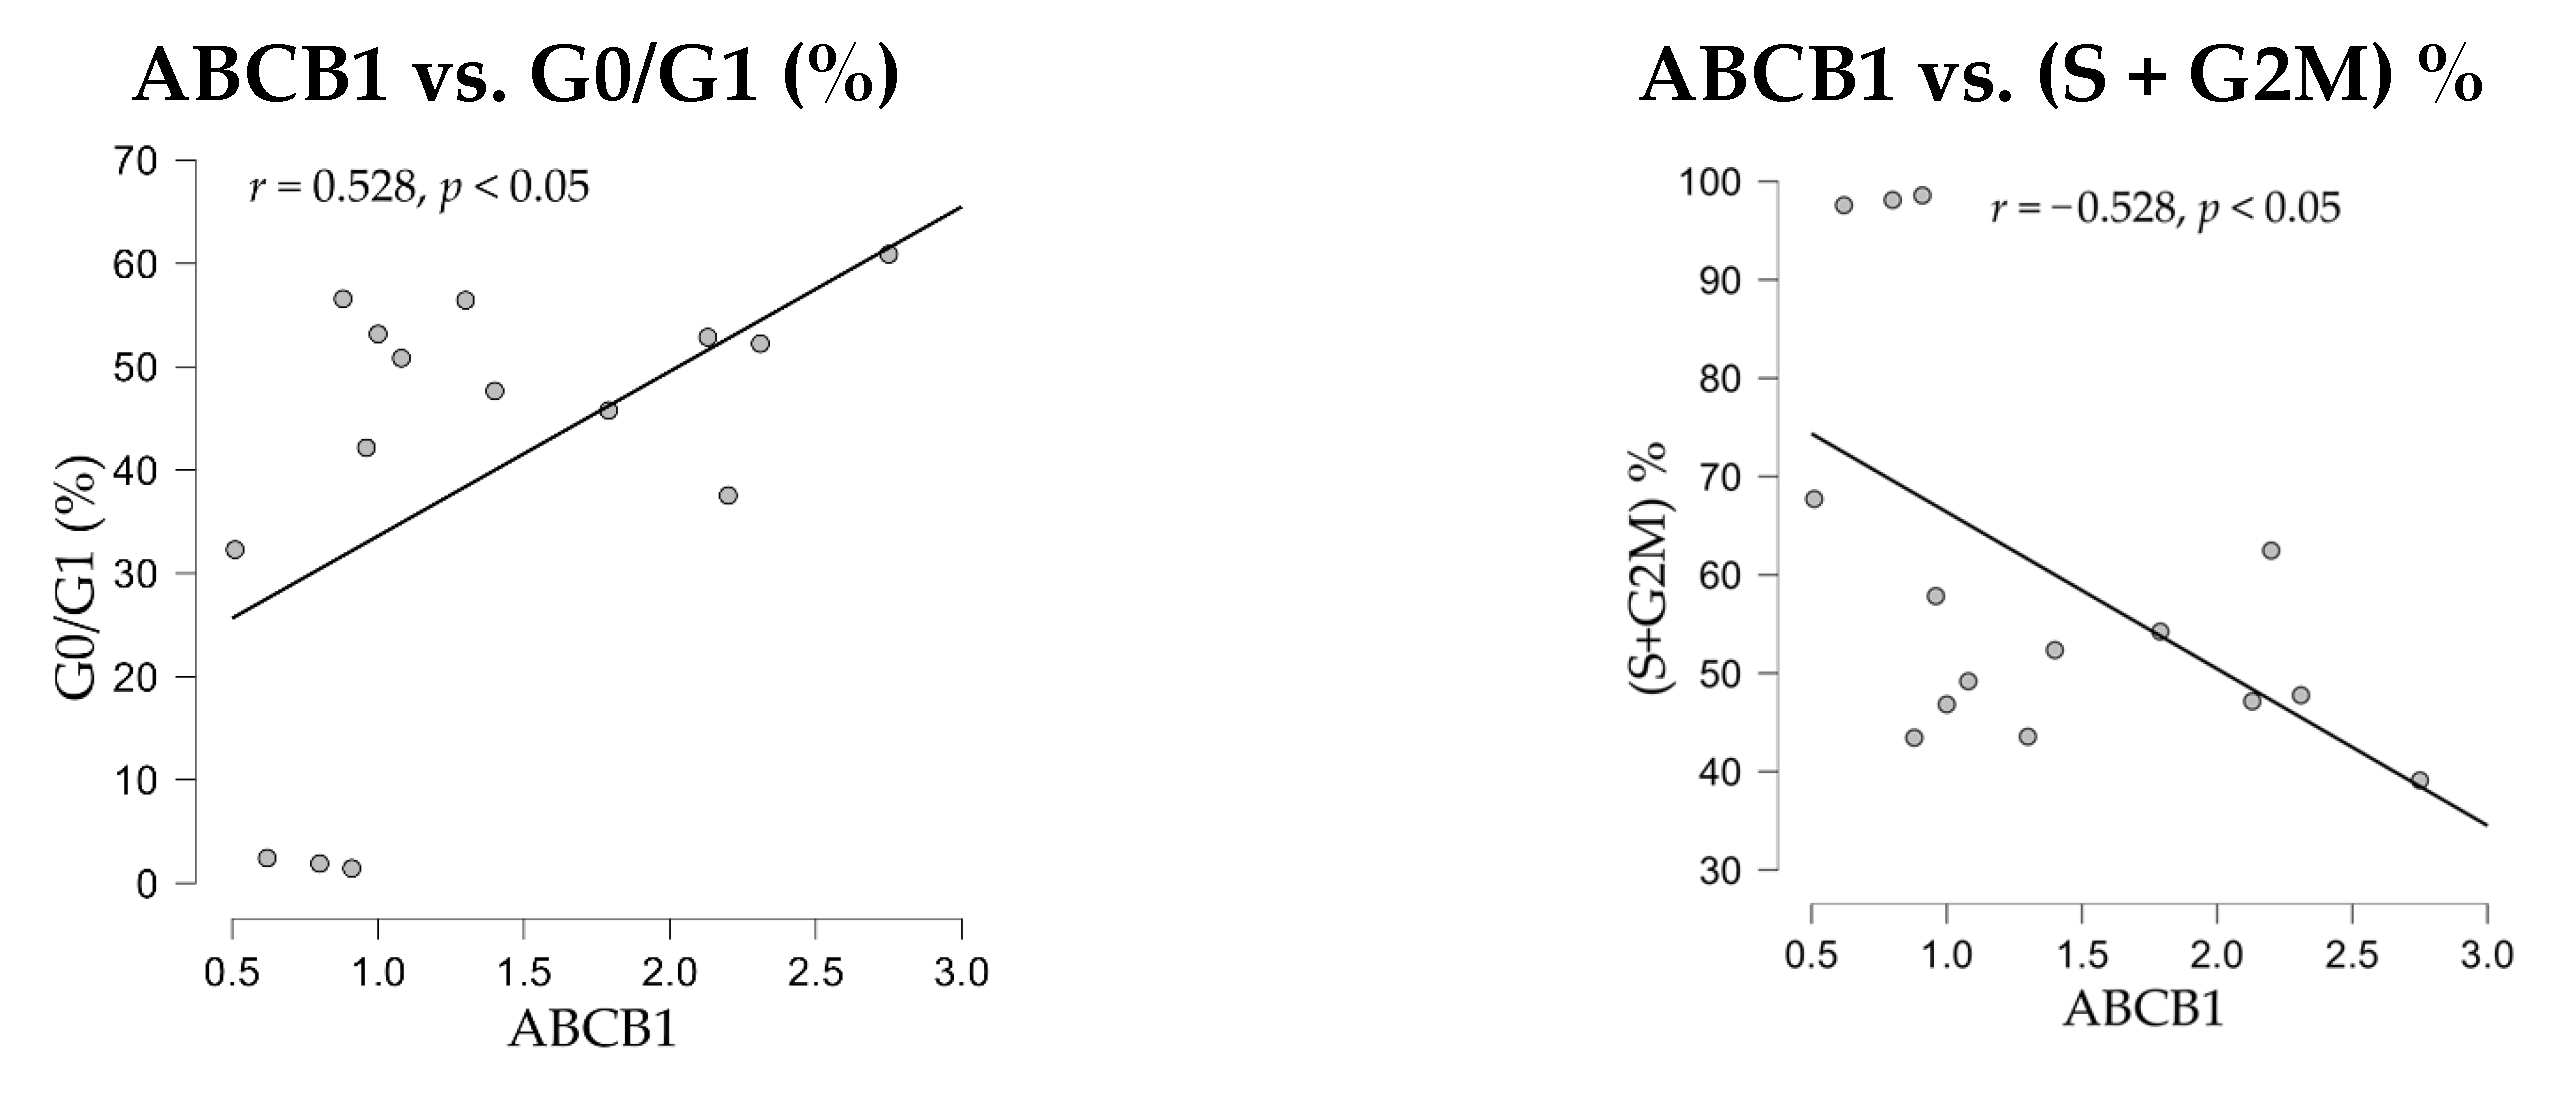
The correlation analyses between nuclei distribution through cell cycle phases and gene expressions demonstrated a positive significant correlation of the drug-resistance ABCB1 gene expression with G0/G1% phase (
r = 0.528,
p < 0.05), and a negative significant correlation with the proliferation index, (S + G2M)% (
r = −528,
p < 0.05) (
Figure 10).
3.6. Modulation of the Cytokine Release
Using the ELISAs, we further studied the in vitro effects of single versus combined drug treatments on the release of the pro-inflammatory cytokines IL-6 and TNF-α by the SK-MEL-24 human melanoma cells.
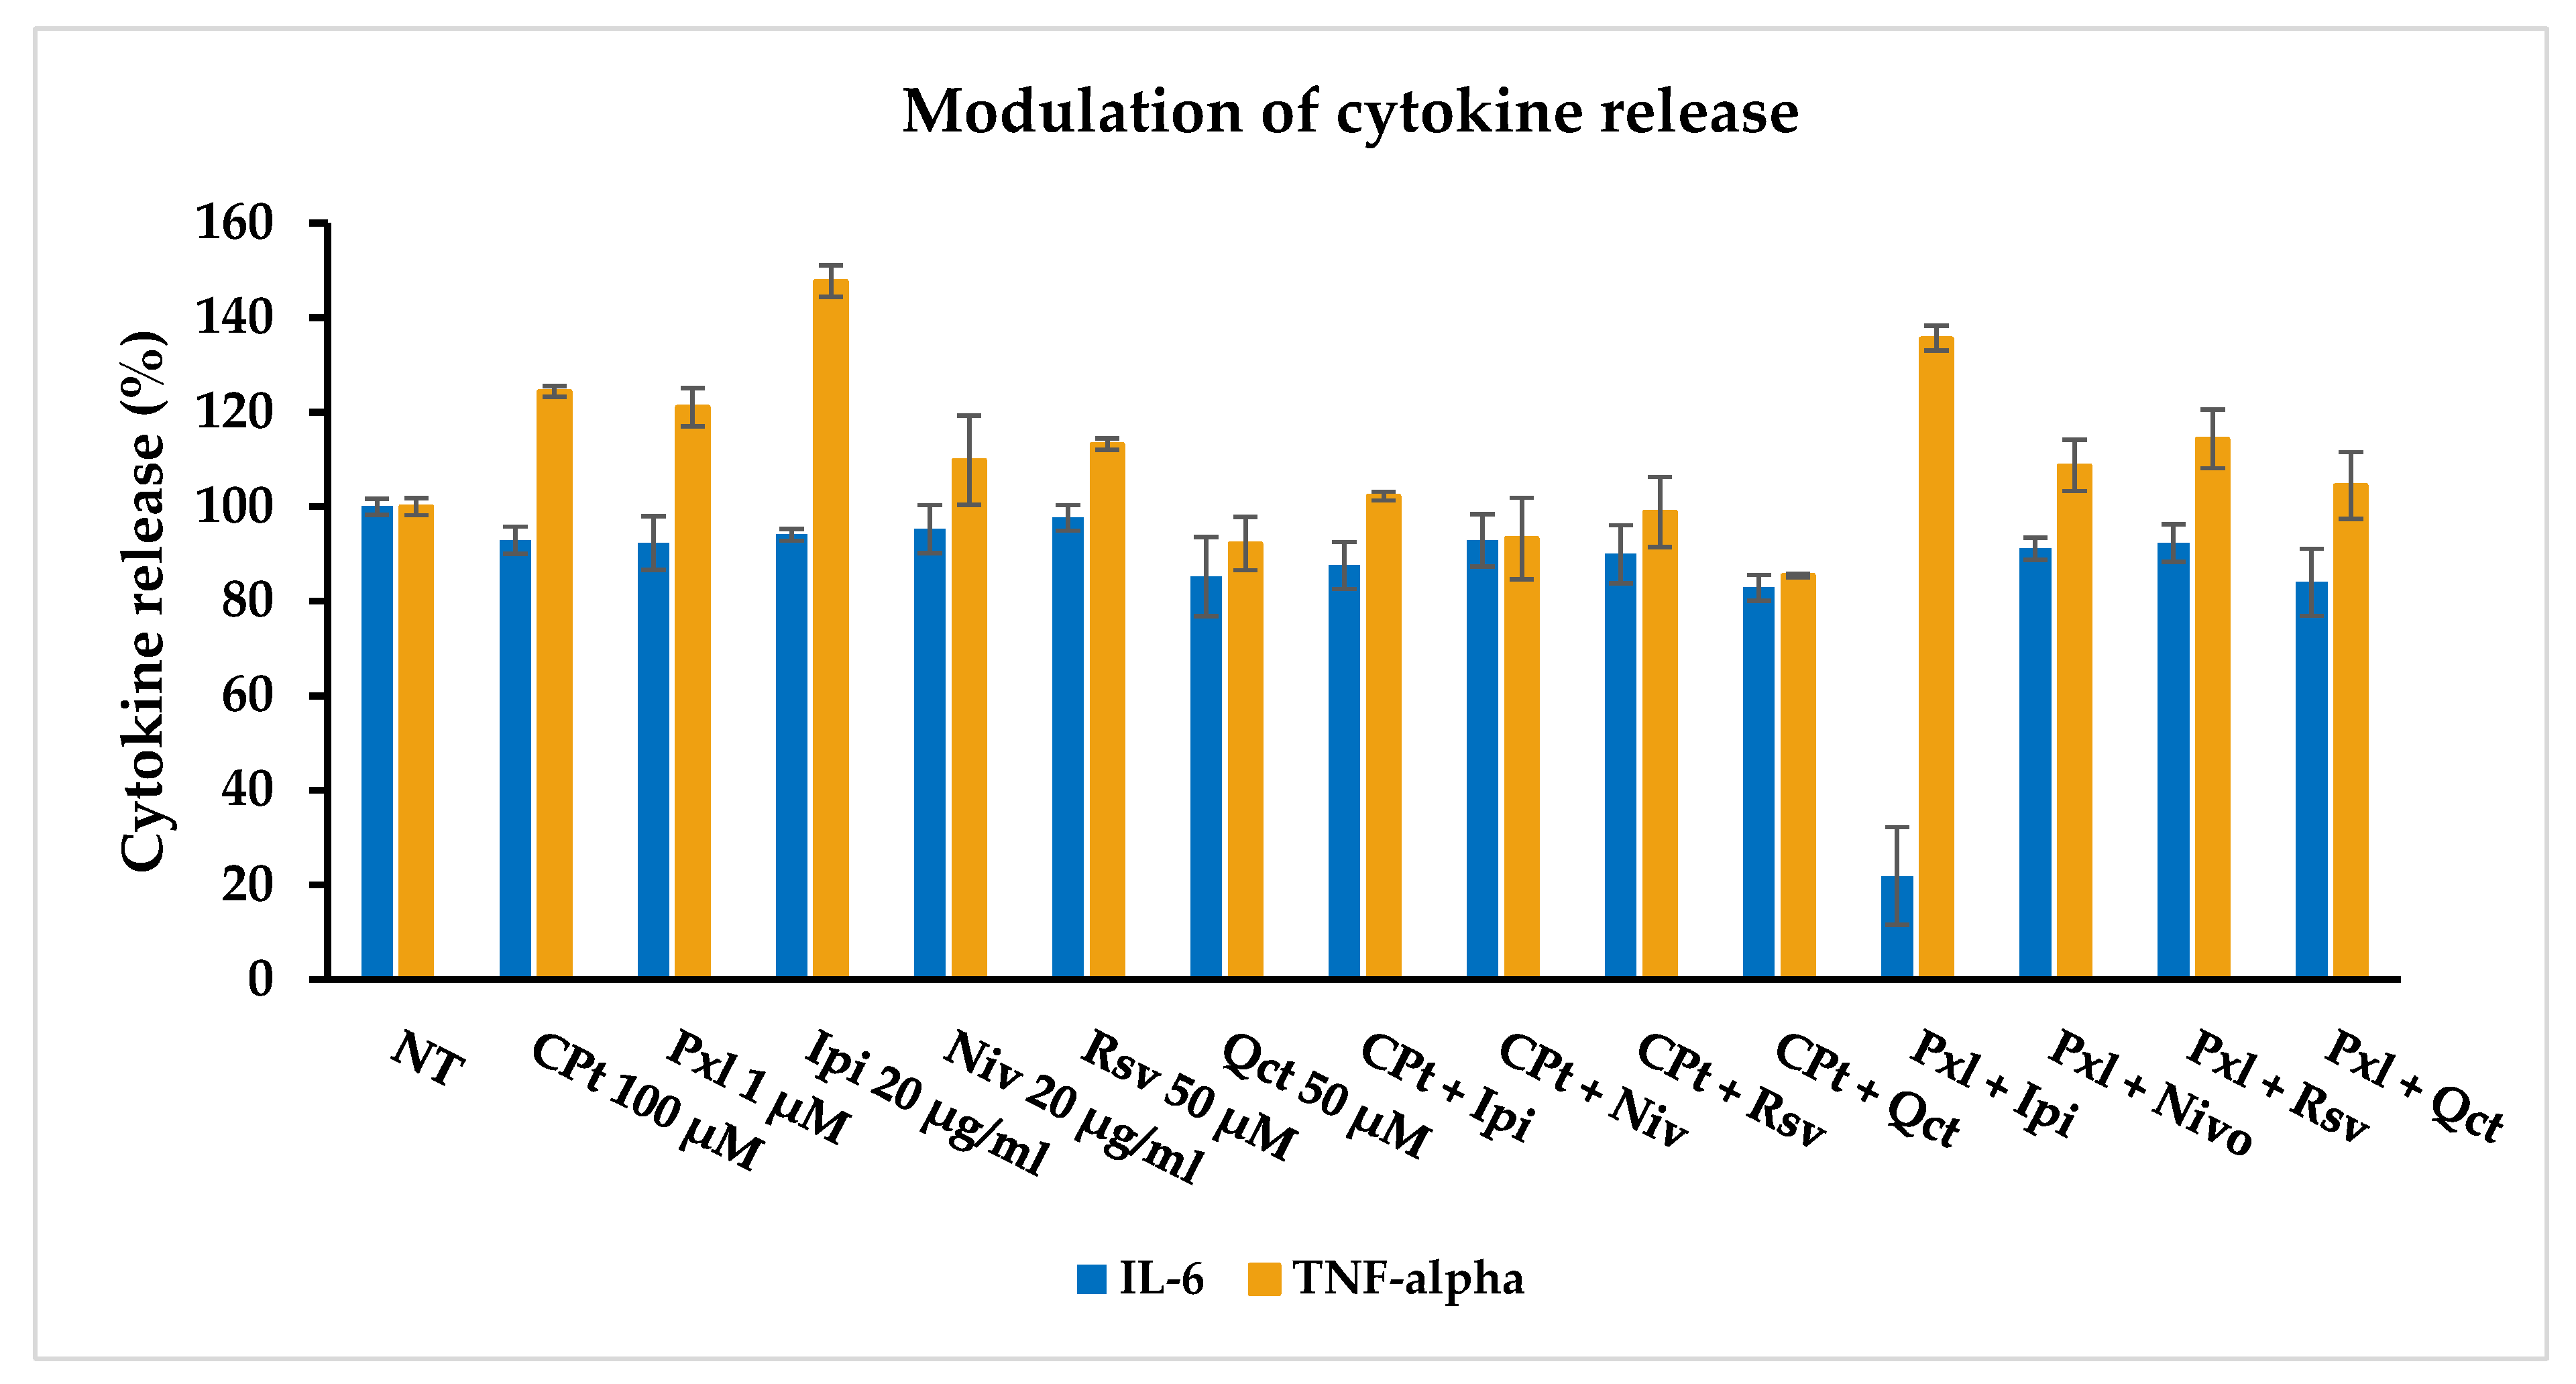
The IL-6 and TNF-α cytokine release by SK-MEL-24 human melanoma cells was induced after 24 h of drug treatment using 100 μM of CPt, 1 μM of Pxl, 50 μM of Rsv or Qct, and 20 μg/mL of Ipi or Niv, used single and combined, showing a pro-inflammatory response, mostly for IL-6 release (
Figure 11).
While CPt, Pxl, Ipi, Niv, or Rsv induced a decrease in less than 10% of IL-6 release, Qct induced a 15% decrease. The combined treatments had stronger decrease effects, especially the combinations of Qct with both CPt or Pxl, inducing 82.84% and 84.02% release, respectively. The highest anti-inflammatory reaction, demonstrated by a 78.11% decrease (21.89% release), was induced by Pxl and Ipi combined treatment.
In contrast, only Qct alone or the combinations of CPt with Niv, Rsv, and Qct induced an inhibition of the TNF-alpha release, while all the other single or combined treatments induced higher released levels. The strongest effect of stimulation of TNF-alpha release was observed for Ipi, used either in single or Pxl-combined treatment, the levels of this cytokine reaching 147.65% and 135.67%, respectively. However, Pxl combinations with other drugs seem to induce lower levels of released TNF-alpha cytokine compared to single-drug treatments.
Interleukin 6 (IL-6) and tumor necrosis factor-alpha (TNF-α) are two essential pro-inflammatory cytokines that play a central role in the initiation, amplification, and maintenance of the inflammatory response in many chronic, autoimmune, and degenerative diseases. These signaling molecules are involved in a wide range of pathophysiological processes, including the activation of immune cells, the production of other cytokines and chemokines, and the regulation of gene expression related to inflammation. They constitute fundamental components of the cytokine network that orchestrates intercellular communication in the immune system and modulates both innate and adaptive immunity.
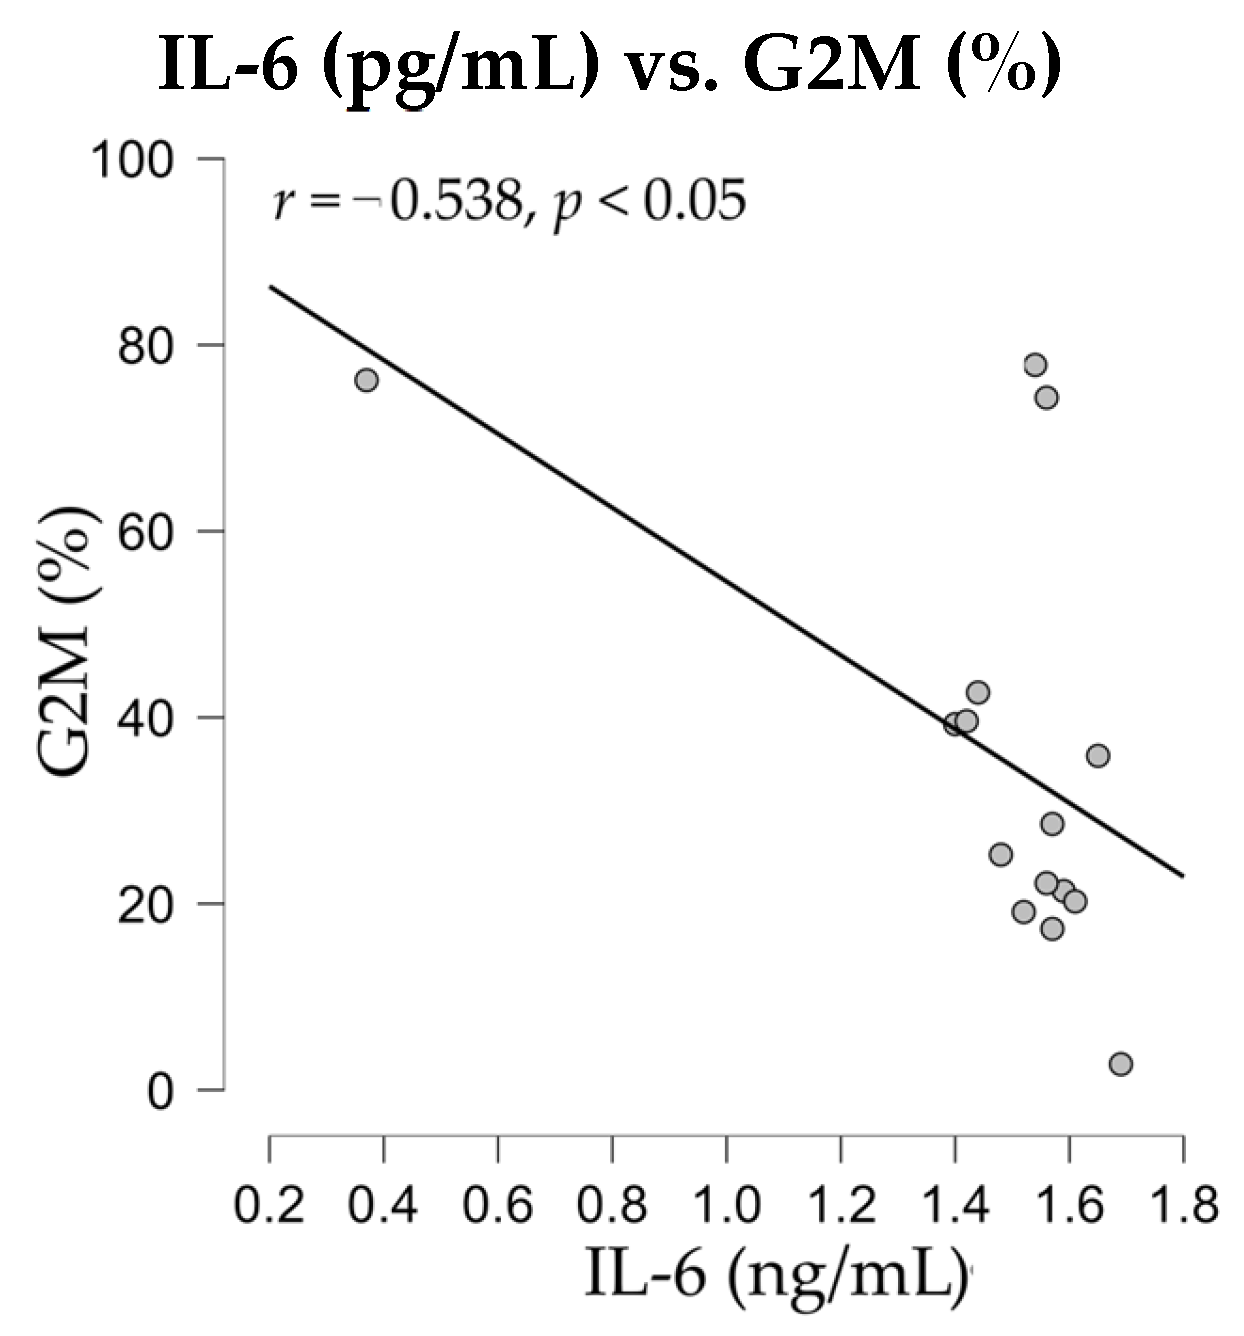
Therefore, after evaluating the release of IL-6 and TNF-alpha, the levels of soluble cytokines were subjected to statistical analysis for the detection of potential correlations with immune parameters, such as apoptotic events or nuclear distribution in cell cycle phases. The correlation analyses revealed a negative significant correlation (
r = −0.538,
p < 0.05) between nuclei distribution in G2M phase and the release of IL-6 cytokine in SK-MEL-24 melanoma cell culture supernatants (
Figure 12).
Under physiological conditions, the secretion of these cytokines has a protective role, contributing to the defense against pathogens, the elimination of infected or malignantly transformed cells, and the initiation of the tissue healing process. A thorough understanding of the mechanisms of action of IL-6 and TNF-α, as well as their interactions with other components of the immune system, is essential for the development of innovative therapeutic strategies capable of effectively modulating the inflammatory response without compromising the body’s basic immunity.
Moreover, the IL-6 and TNF-α cytokines, which are immune-related pro-inflammatory factors, are associated with resistance to immunotherapy in melanoma, such as the use of immune checkpoint inhibitors (ICI), contributing to an immunosuppressive tumor microenvironment. Thus, elevated IL-6 levels are associated with a poor response to ICI therapy and shorter survival rates, as they inhibit the anti-tumor function of cytotoxic T lymphocytes (CTLs) or correlate with tumor-associated macrophages and myeloid-derived suppressor cells, which are involved in suppressing the immune response [
47]. In addition, high TNF-α levels during the ICI therapy are also associated with suboptimal response and treatment resistance if TNF-α increases during the therapy of advanced melanoma. Considering these negative effects, IL-6 and TNF-α cytokines, along with their specific receptors, may represent a valuable therapeutic target to overcome therapy resistance and improve the clinical outcomes of immunotherapy [
48].
In this context of immune-related biomarkers contributing to the therapeutic resistance, recent studies have involved the androgen receptor (AR) activation signaling pathways which enhance melanoma cell invasiveness by disrupting cell adhesion, promote immune evasion by facilitating the release of major histocompatibility complex (MHC) class I chain-related proteins A and B (MICA/MICB) and upregulation of immune checkpoint molecules, or drive the resistance to immunotherapy by maintaining MAPK signaling despite the use of BRAF and MEK inhibitors. In addition, clinical outcome studies reported that AR expression is associated with poor survival response in melanoma patients and is therefore a negative prognostic factor for therapy response [
49,
50].
4. Conclusions
Approximately 4% of all cutaneous neoplasms are represented by melanoma, considered the most aggressive form of skin cancer, which involves metastatic processes in the advanced stages, leading to a high mortality [
32,
51]. Currently, several immune checkpoint inhibitors like Niv or Ipi are used in the treatment of metastatic melanoma, either alone or in combination with other therapies [
33,
51]. However, therapeutic decisions must be made by monitoring reliable biomarkers that can predict patients’ responses and play a role in the development of personalized treatments [
32,
33,
51,
52]. Among them, soluble effector molecules such as LDH, MIA, S100 [
32,
33], PD-1, PDL-1 [
51], cytokines, or immune blood markers, calculated from whole blood cell counts, like the neutrophil-to-lymphocyte ratio (NLR), the monocyte-to-lymphocyte ratio (MLR), the platelet-to-lymphocyte ratio (PLR), the systemic immune inflammation index (SII), or the systemic inflammatory response index (SIRI) [
33,
52], might predict the survival of immunotherapy-treated melanoma patients [
33,
52]. The pro- and anti-inflammatory cytokines and chemokines also play critical roles in host immune responses and have been found to be associated with melanoma, as well as other cancers, in response to treatment with checkpoint inhibitors [
52].
Although the classical anti-cancer chemotherapy remains the main option of treatment, the limitations due to its significant toxicity and the frequently acquired resistance prompted the oncologists to use new available treatment options, including targeted therapy, which aims to inhibit some critical molecular pathways, and cancer immunotherapy [
53,
54]. However, drug resistance frequently appears, resulting from a variety of factors that include mutations in the biochemical target, resistance to drug-induced apoptosis, induction of drug-detoxifying mechanisms, changes in the tumor microenvironment, or epigenetic changes, but the reversal of these mechanisms can lead to improved patient outcome and quality of life [
55].
Recent statistical data suggest that approximately one out of five men or women develops cancer during their lifetime, whereas around one out of nine men or twelve women dies from a neoplasia, being estimated to reach almost 35 million new cases by 2050 [
56]. Therefore, the current research strategies that improve the understanding of drug resistance in the treatment of cancer focus on better in vitro models, which could lead to new anti-cancer therapies. The advances in melanoma research studies that aim to develop new therapeutic strategies, combining classical chemotherapy with targeted therapy like immune checkpoint inhibitors, and/or natural compounds, might be of great benefit. Our data demonstrated that the cytotoxic effects of the compounds under study varied with the concentrations used and the treatment time, showing a dose- and time-dependent decrease in cell viability, and implicitly an increase in cell lysis rate. Similar results were obtained either by performing the endpoint MTS colorimetric assay or by using the disruptive endpoint real-time cell monitoring with the xCELLigence System, thus allowing us to further use during the immune or molecular tests the proper concentrations of compounds under study. Single and combined treatments of melanoma cells modulated the cell sensitivity to drug treatments, apoptosis, cell cycle phases, pro-inflammatory cytokine release, and levels of expression of several genes related to these processes. Therefore, the addition of checkpoint inhibitors or natural compounds might be an alternative strategy to obtain the same, or even a stronger anti-tumor response, diminishing the side-effects by using lower concentrations of oncolytic drugs, and reversing multidrug resistance to cancer treatment.
Regarding the limitations of this study, one aspect that reduces the significance of our results is the use of a single melanoma cell line, chosen for certain characteristics, such as the absence of mutations for some genes (wild-type for TP53, B-Raf, and N-Ras). However, in the future, we intend to extend these studies to a larger panel of melanoma cell lines with various characteristics and specific mutations, which could be involved in the regulation of different signaling pathways responsible for stimulating tumor progression and resistance to antitumor therapy. The use of a panel of melanoma cell lines with different genetic profiles will provide more comparable data, which could serve as a reliable molecular source for testing and modulating the efficacy of next-generation therapeutic compounds, leading to improved therapeutic outcomes in melanoma.

