Article

New Methodology for Evaluating Uncertainty in Mineral Resource Estimation

by
José Alberto Arias
1,2,*,
Alain Carballo
2,
Elmidio Estévez
3,
Reinaldo Rojas
4,
Domingo A. Martín
5 and
Jorge L. Costafreda
5
1
Oficina Nacional de Recursos Minerales, Calzada 852 Esq.4, Municipio Plaza de la Revolución, Vedado, La Habana 10300, Cuba
2
Departamento de Geología, Universidad de Moa “Dr. Antonio Núñez Jiménez”, Calixto García Iñiguez No 15, entre Ave 7 Diciembre y calle Reynaldo Laffita Rueda, Reparto Caribe, Moa, Holguín 15, Cuba
3
Departamento de Geología, Universidad de Pinar del Rio, ”Hermanos Saíz Montes de Oca”, Calle Martí, No 300, Barrio Segundo Sur, entre 27 de Noviembre y González Alcorta, Pinar del Rio 20100, Cuba
4
Centro de Investigaciones del Petróleo, Churruca No 481, entre Washington y Vía Blanca, Municipio Cerro, La Habana 12000, Cuba
5
Escuela Técnica Superior de Ingenieros de Minas y Energía, Universidad Politécnica de Madrid, 28003 Madrid, Spain
*
Author to whom correspondence should be addressed.
Appl. Sci. 2025, 15(19), 10616; https://doi.org/10.3390/app151910616
Submission received: 26 August 2025 / Revised: 22 September 2025 / Accepted: 24 September 2025 / Published: 30 September 2025

Abstract

Geological modeling is generally based on deterministic models, which provide a single representation of reality. Probabilistic modeling is more appropriate when quantifying or understanding the uncertainty associated with a parameter of interest as it considers several equally probable geological scenarios. The object of this study is to quantify the uncertainty in the estimation of the minerals in the Punta Alegre gypsum deposit, by applying a new method based on the simple normal equation geostatistical simulation technique. The Punta Alegre gypsum deposit is a sedimentary deposit of clastic origin, formed by the complex redeposition of salts, gypsum and other sediments. To carry out this research, 50 equiprobable scenarios were simulated, reproducing overburden, gypsum series (different types of gypsum) and intercalated non-mineral lithologies (limestone and other rocks) in a network of nodes measuring 5 × 5 × 5 m, using a training image, composites and prior probability maps as input data. As a result of scaling the previously simulated geological units, three-dimensional models of volume proportions and estimation error for gypsum were obtained for panels measuring 10 × 10 × 5 m. The quantification of the uncertainty of the gypsum volume, determined by the root mean square error, established that the volume estimation error is small at a global scale (6.51%), given that there is no significant variation when comparing the deterministic model with the gypsum proportion model obtained from the 50 simulated scenarios. Conversely, at the local scale, there is a significant variation in gypsum volume of 42% in the 10 × 10 × 5 m panels with a future impact on recoverable mining resources, given the uncertainty at a local scale, which will cause an increase in mining dilution due to the inclusion of non-mineral lithologies within the extracted mineral that will be sent to the processing plant. On the other hand, it will cause changes in the mining company’s plan in areas where there are panels that were previously accounted for by the deterministic model as minerals and are not actually exploitable.

1. Introduction

Traditional geological modeling is deterministic, i.e., the geological model that is created constitutes a unique representation of reality, which presumably means perfect and absolute knowledge of the size and shape of geological units and spatial continuity [1], and is only valid when the available data is sufficient to create models with a high degree of certainty. Conversely, when the interpretation is not definitive and several equally valid scenarios could be inferred from the available information, deterministic modeling would lead to the creation of geological models with a high degree of uncertainty [2].
A set of geostatistical simulation techniques have now been developed for stochastic geological modeling which, in contrast to deterministic geological modeling, create multiple representations of the unknown reality, reflecting the spatial continuity of geological units and the ore of the mineral [3]. The series of models created in this way are the most common representation of what an uncertainty model is [4]. Due to this, geostatistical conditional simulation techniques have become one of the most widely used tools in the mining industry to quantify global or local uncertainty of a random nature [5], based on several simulated equiprobable scenarios [6].
Among the simulation techniques developed is SNESIM (Simple Normal Equation Simulation), which is based on the principle of multiple point simulation, since it does not require a prior variogram model to run it, but rather uses a training image [7,8] that represents the conceptual geological model of the mineral deposit. The training image itself is a repository that provides information on the spatial patterns and their probabilities found in the phenomenon from which the structures are taken directly. The result is a spatial distribution of lithotypes conditioned by real data from boreholes with geological information. The SNESIM method is particularly useful for creating stochastic images of a sparsely sampled geological phenomenon with complex features that cannot be captured and reproduced by two-point statistics [9].
Given that previous studies on evaporite deposits have not quantified the uncertainty of the estimates using geostatistical simulation techniques, this paper develops a novel methodology to quantify the uncertainty of global and local estimates of the recoverable mineral, by applying the multipoint geostatistical sequential simulation method known as SNESIM [10,11,12,13,14,15]. The main object is to reproduce the spatial continuity patterns, of the geological units beforehand such as the overburden, with multiple predefined equiprobable scenarios, the gypsum rock series as well as the non-mineral lithologies in the gypsum deposit series of Punta Alegre gypsum deposit, which is used as a case study in this research.

2. Theoretical Framework

2.1. Simple Normal Equation Simulation (SNESIM)

This simulation technique uses a single equation to model the probability of occurrence of a facies, lithotype or category in a particular node of the grid, using the well-known Bayes’ rule (Equation (1)), which defines the conditional probability of an event d n [10,14,16,17]:
Prob s u = s k d n = Prob S u = s k   y   d n Prob d n C k d n C d n ,
where P r o b d n is the training replica, as it has the same geometric configuration and lithotype and is calculated by scanning the training image and counting the number of training replicas C d n of the conditioning data event C d n P r o b s u = s k y d n is obtained by counting the number c k d n of those replicas between the training replicas C d n with a central value of S u = S k .
In order to search for adjacent conditioning data in the training image, a ‘search template’ is used. The frequency of the training replicas obtained from the training image is stored in a search tree structure, allowing it to be easily retrieved during the simulation process (Figure 1).
The simulation using the SNESIM algorithm consists of two main parts. In the first part, a search tree is constructed, where all the proportions obtained from the training image are stored. The second part is the simulation itself, where these proportions are read and used to obtain the simulated values [19].
The SNESIM algorithm can be summarized as follows [10,11,19]: First, the training image (TI) is scanned to create the specific search tree from a search template τ j . The original data (composite samples) are then relocated to the nodes closest to the network to be simulated and ‘frozen’ during the simulation process. A random path is then defined to visit each location only once; the conditional probability P r o b s u = s k d n of the event d n integrating the proportions C k d n / C d n stored in the training image and the probabilities obtained from the secondary information (‘soft data’). Finally, at random, a value of the possible category at location u j from the estimated conditional probability, which is added to the original data to be used as conditioning data at other locations. The process is repeated until all nodes have been visited. Multiple realizations are obtained using different random paths.
The SNESIM algorithm was the geostatistical tool used in this study to simulate the lithotypes in the Punta Alegre deposit.

2.2. Geological Setting

The area where the deposit is located and its surroundings have been extensively investigated by various authors and described both from a regional geological point of view [20] for the search for hydrocarbons [21,22,23] and locally for the exploration and exploitation of gypsum as a raw material for the cement industry [24,25].
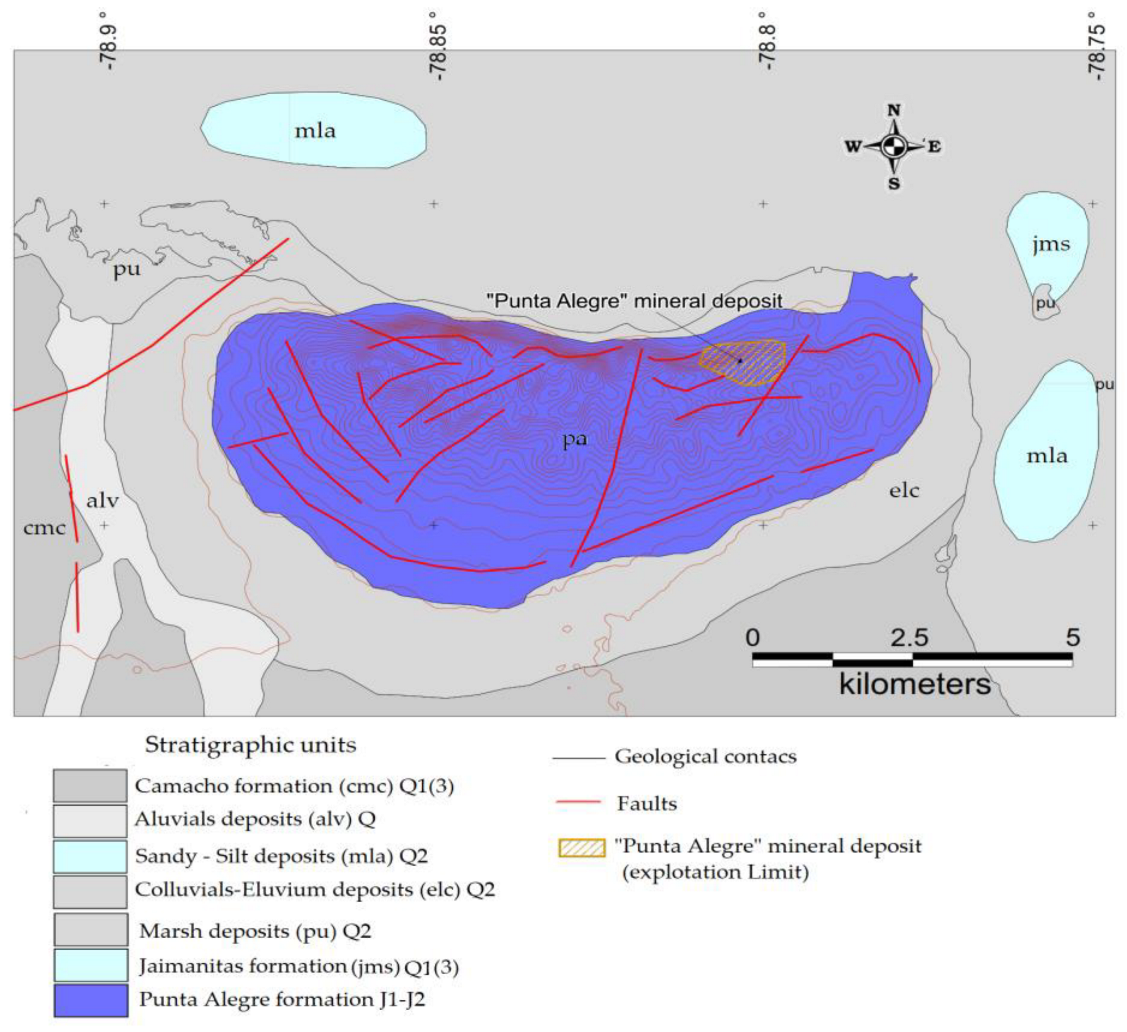
The rocks that make up the Punta Alegre deposit have been conditionally referred to as belonging to the Lower and Middle Jurassic interval and have been named the Punta Alegre formation. These are rocks of evaporitic origin, which generally include salt, gypsum, anhydrite, dolomite and scarce limestones (Figure 2).
According to the stratigraphic lexicon of Cuba [26,27], their diagnostic lithology consists of gypsum breccias with clasts of limestone, slate, siltstone, sandstone and tuff from the Lower and Middle Jurassic periods.
From a structural point of view, these rocks have been attributed to the formation of a salt diapir [21,22,28].
Figure 2. Regional geological map of the study area, modified from Instituto de Geología y Paleontología of Cuba (I.G.P.) [29,30,31].
Applsci 15 10616 g002

3. Materials and Methods

3.1. Materials

For this study, information was obtained from the records of 384 boreholes with 4530 irregular intervals drilled approximately in 40 × 40 m (124 boreholes, 32.3%), 20 × 20 m (228 boreholes, 59.4%) and 80 × 50 m (32 boreholes, 8.3%) grids (Figure 3), lithologically described and validated by consulting and checking the primary information in previous geological exploration reports on the deposit [25,30].

3.2. Methods

3.2.1. Study Area

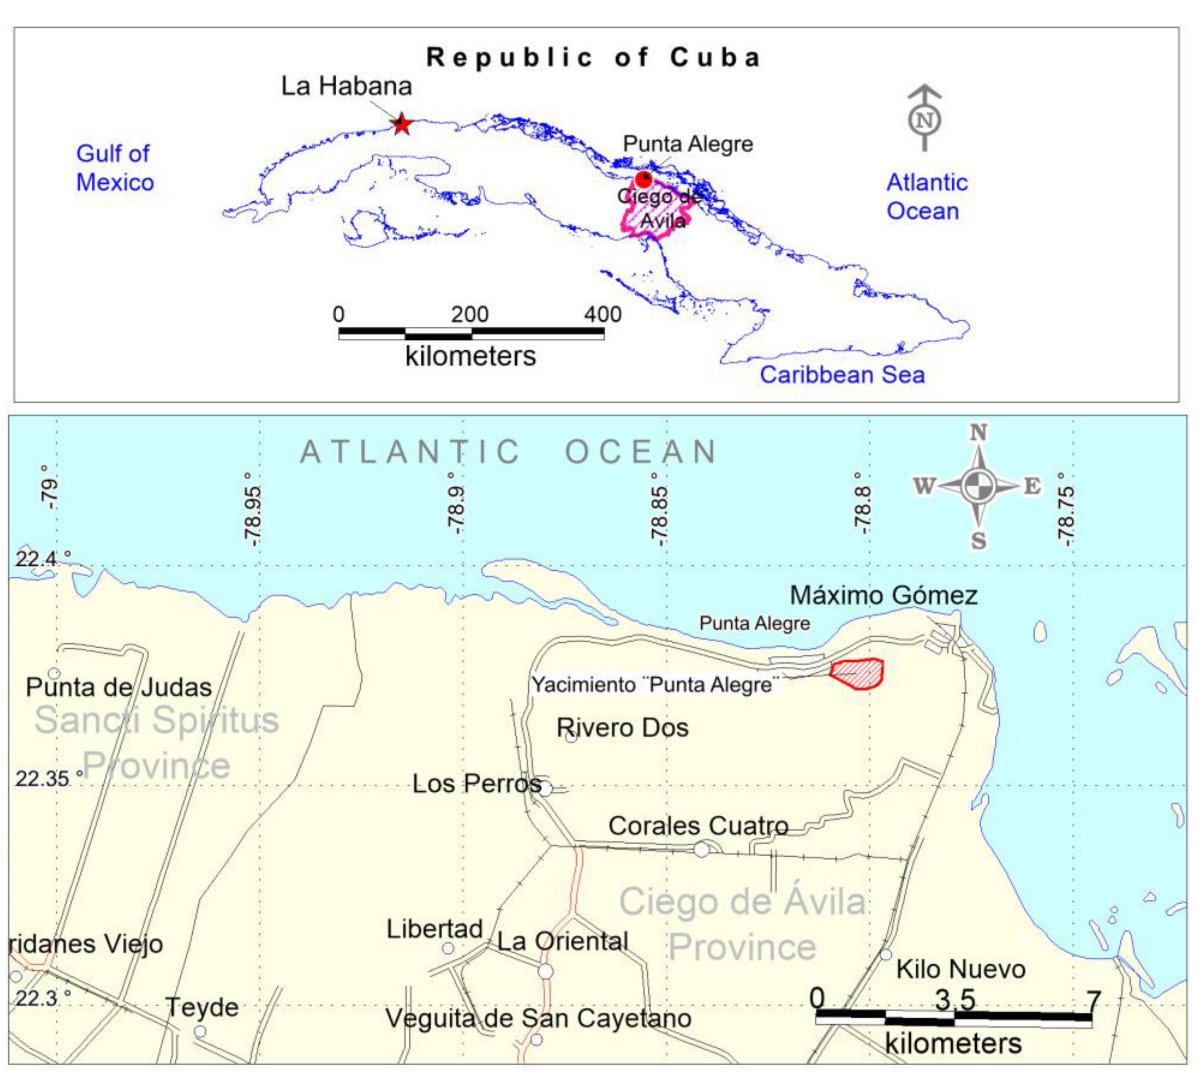
The Punta Alegre gypsum deposit is in the province of Ciego de Ávila, municipality of Chambas, 2.0 km northwest of Central Máximo Gómez and 1.7 km southwest of the town of the same name (Figure 4), covering part of the so-called ‘Loma de yeso’ (Gypsum Hill), covering a total area of 35 km2 [30].

3.2.2. Geological Modeling of the Punta Alegre Deposit

For the modeling of the Punta Alegre gypsum deposit, the spatial boundary was defined as the volume of rock located between the topographic surface and the surface delimiting the base of the boreholes drilled for the exploration of the deposit [32].
The non-mineral envelopes were modeled in the space occupied by the of rocks that define the Punta Alegre gypsum deposit, based on the manual digitization of the perimeters that encompass the non-mineral lithologies, such as inclusions of clayey rocks, limestones, dolomites and slates that appear in the section of the deposit forming the covering materials (overburden) as well as the inclusions of these lithologies within the useful mineral [32].
The perimeters were digitized in sections oriented in an east–west direction, based on the non-mineral intervals defined in the borehole. The wireframes of the non-mineral solids of the overburden were then created by joining the digitized perimeters with the tie lines that interconnect them. For non-mineral intercalations (inter-sterile), solids were constructed by extrusion from their perimeters to half the distance between the two adjacent sections.
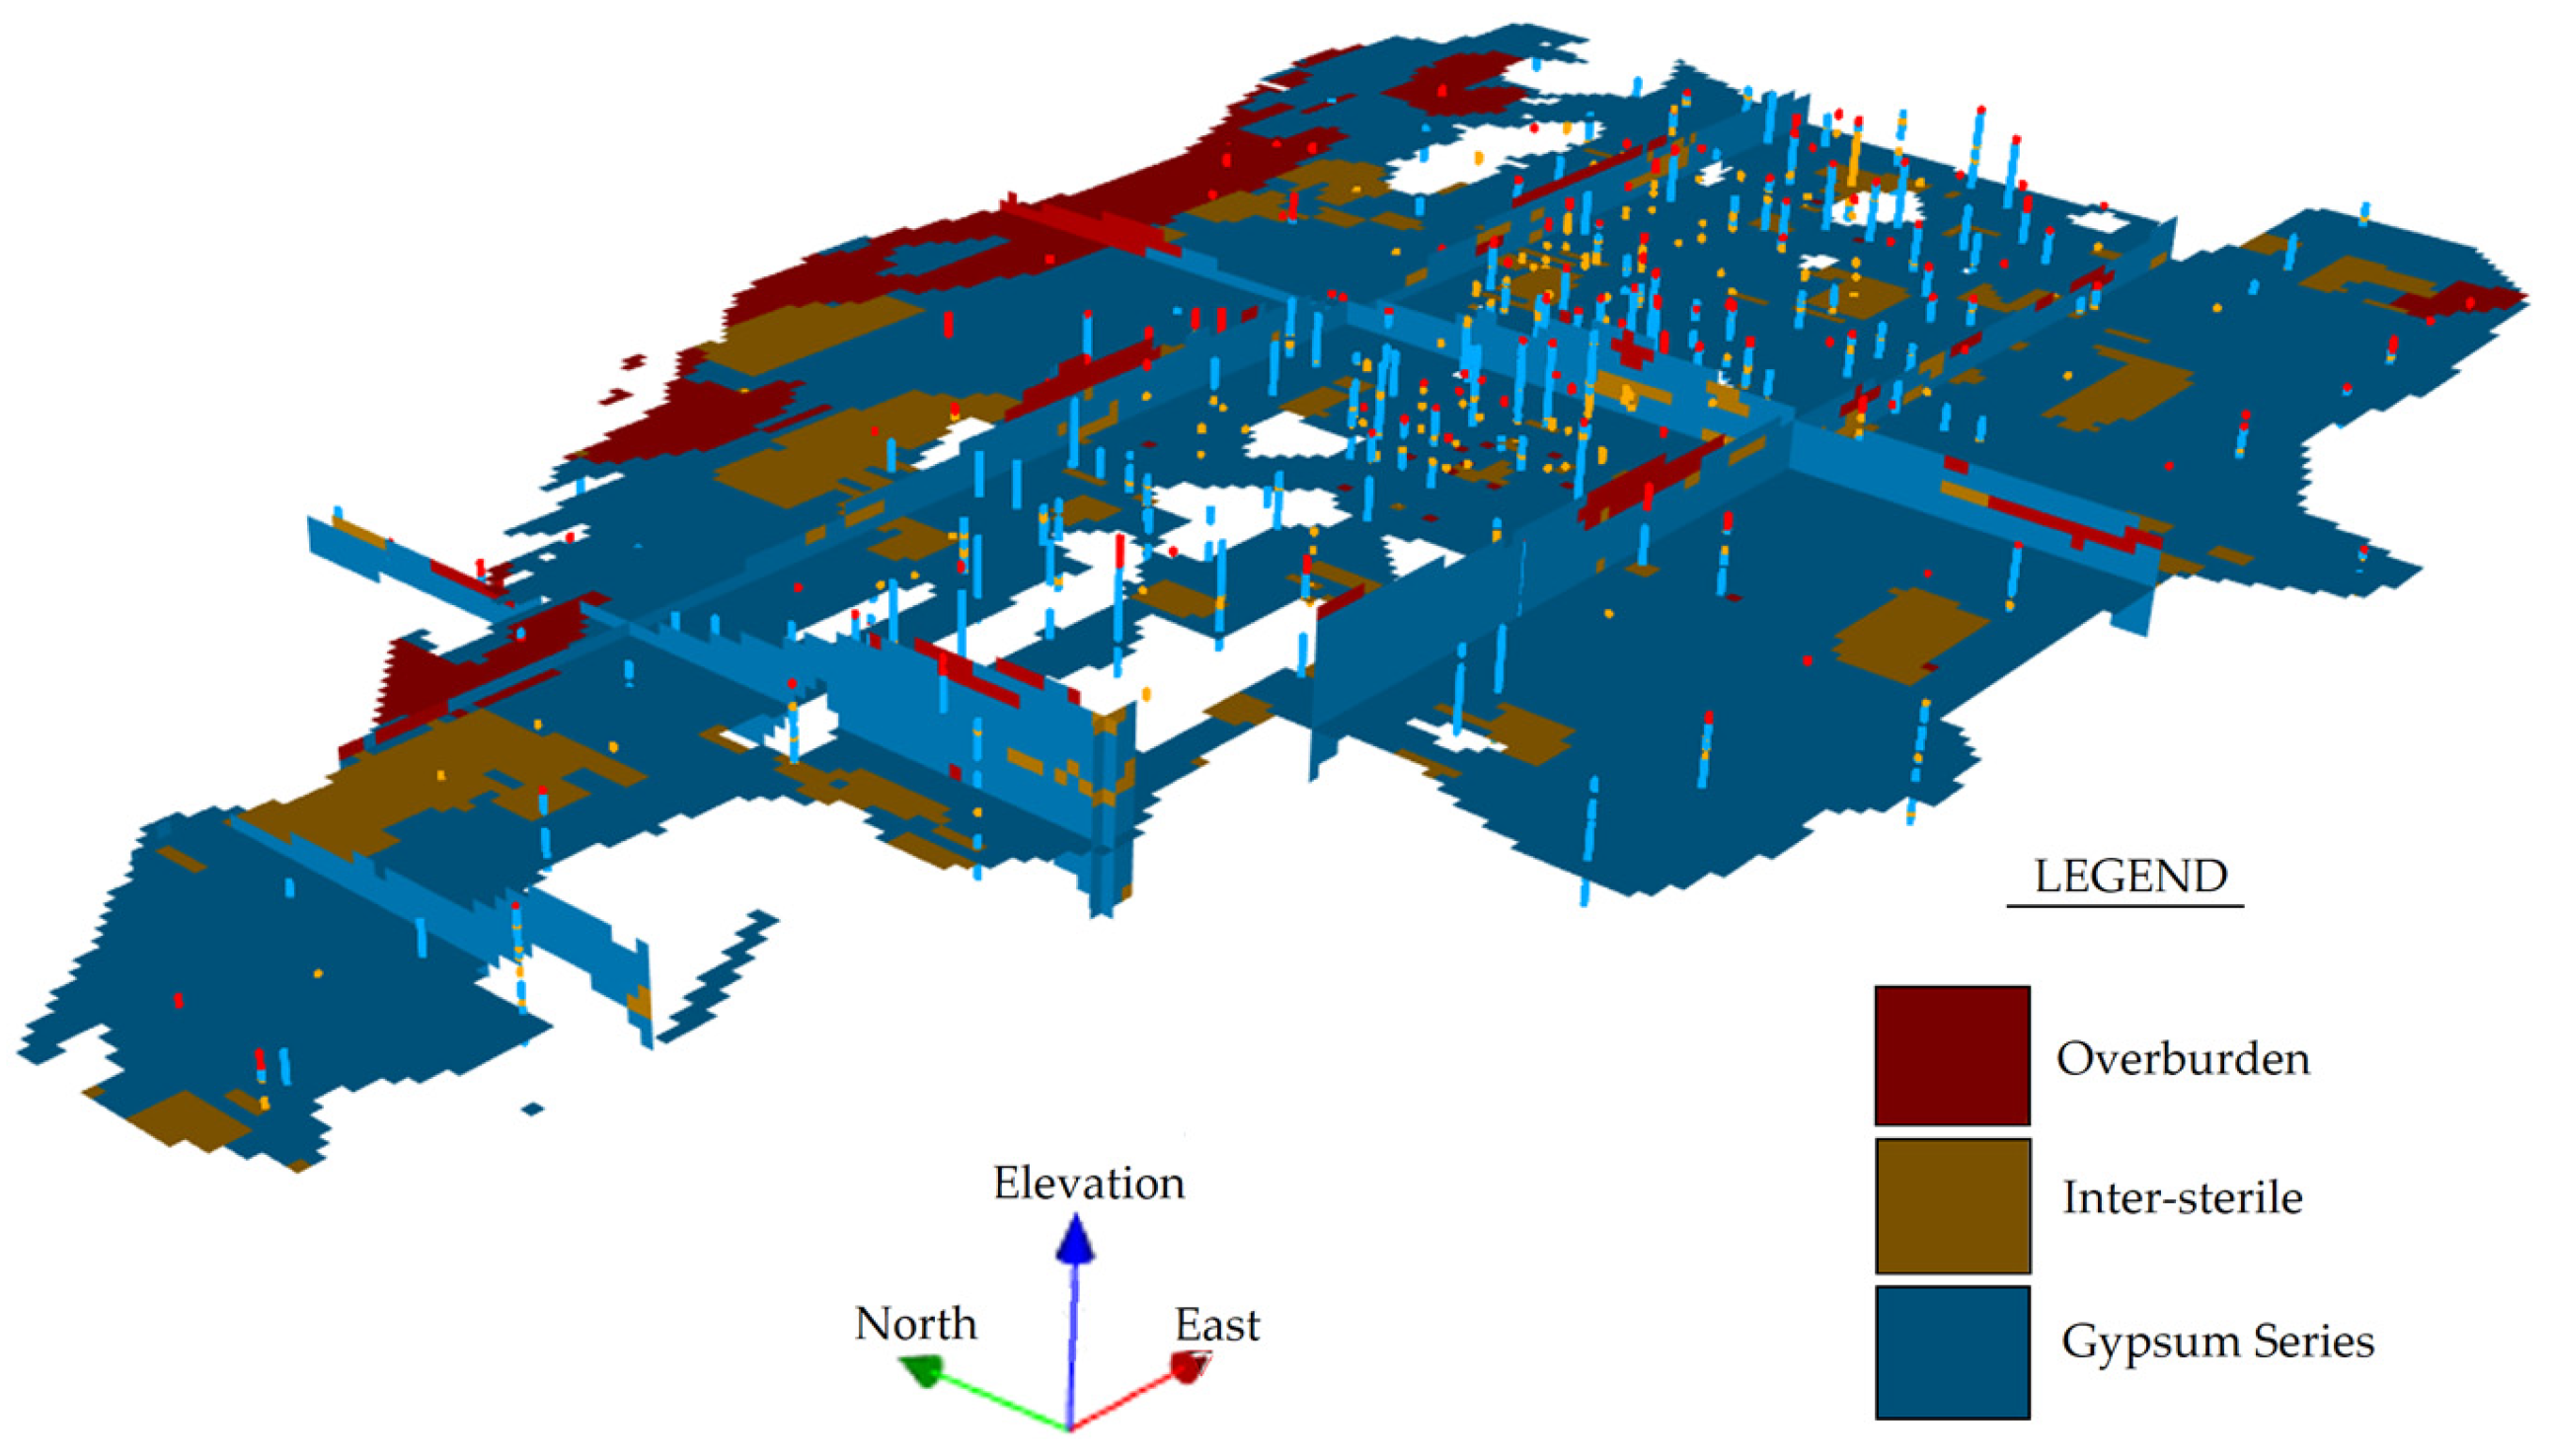
Finally, the parts of the created non-mineral solids where mining had occurred were removed by a cut operation using the updated (current topography) digital terrain model. The general 3D model of the envelopes of the geological units, i.e., wireframes of the solids created, is shown in Figure 5.

3.2.3. Identification of Non-Mineral Envelopes

Once the non-mineral solids (‘wireframes’) had been built they were identified and named as solids of the ‘overburden’ for the non-mineral lithologies located in the upper part of the section, which are more continuous and mainly composed of the topsoil and covering clays, and the non-mineral lithology solids intercalated in the section within the gypsum series (clays, limestones, dolomites and shales), which are less continuous and in the form of lenses and irregular bodies of smaller dimensions. The envelopes of these non-mineral lithologies intercalated within the gypsum series were called ‘inter-sterile’.

3.2.4. Building the Training Image (TI)

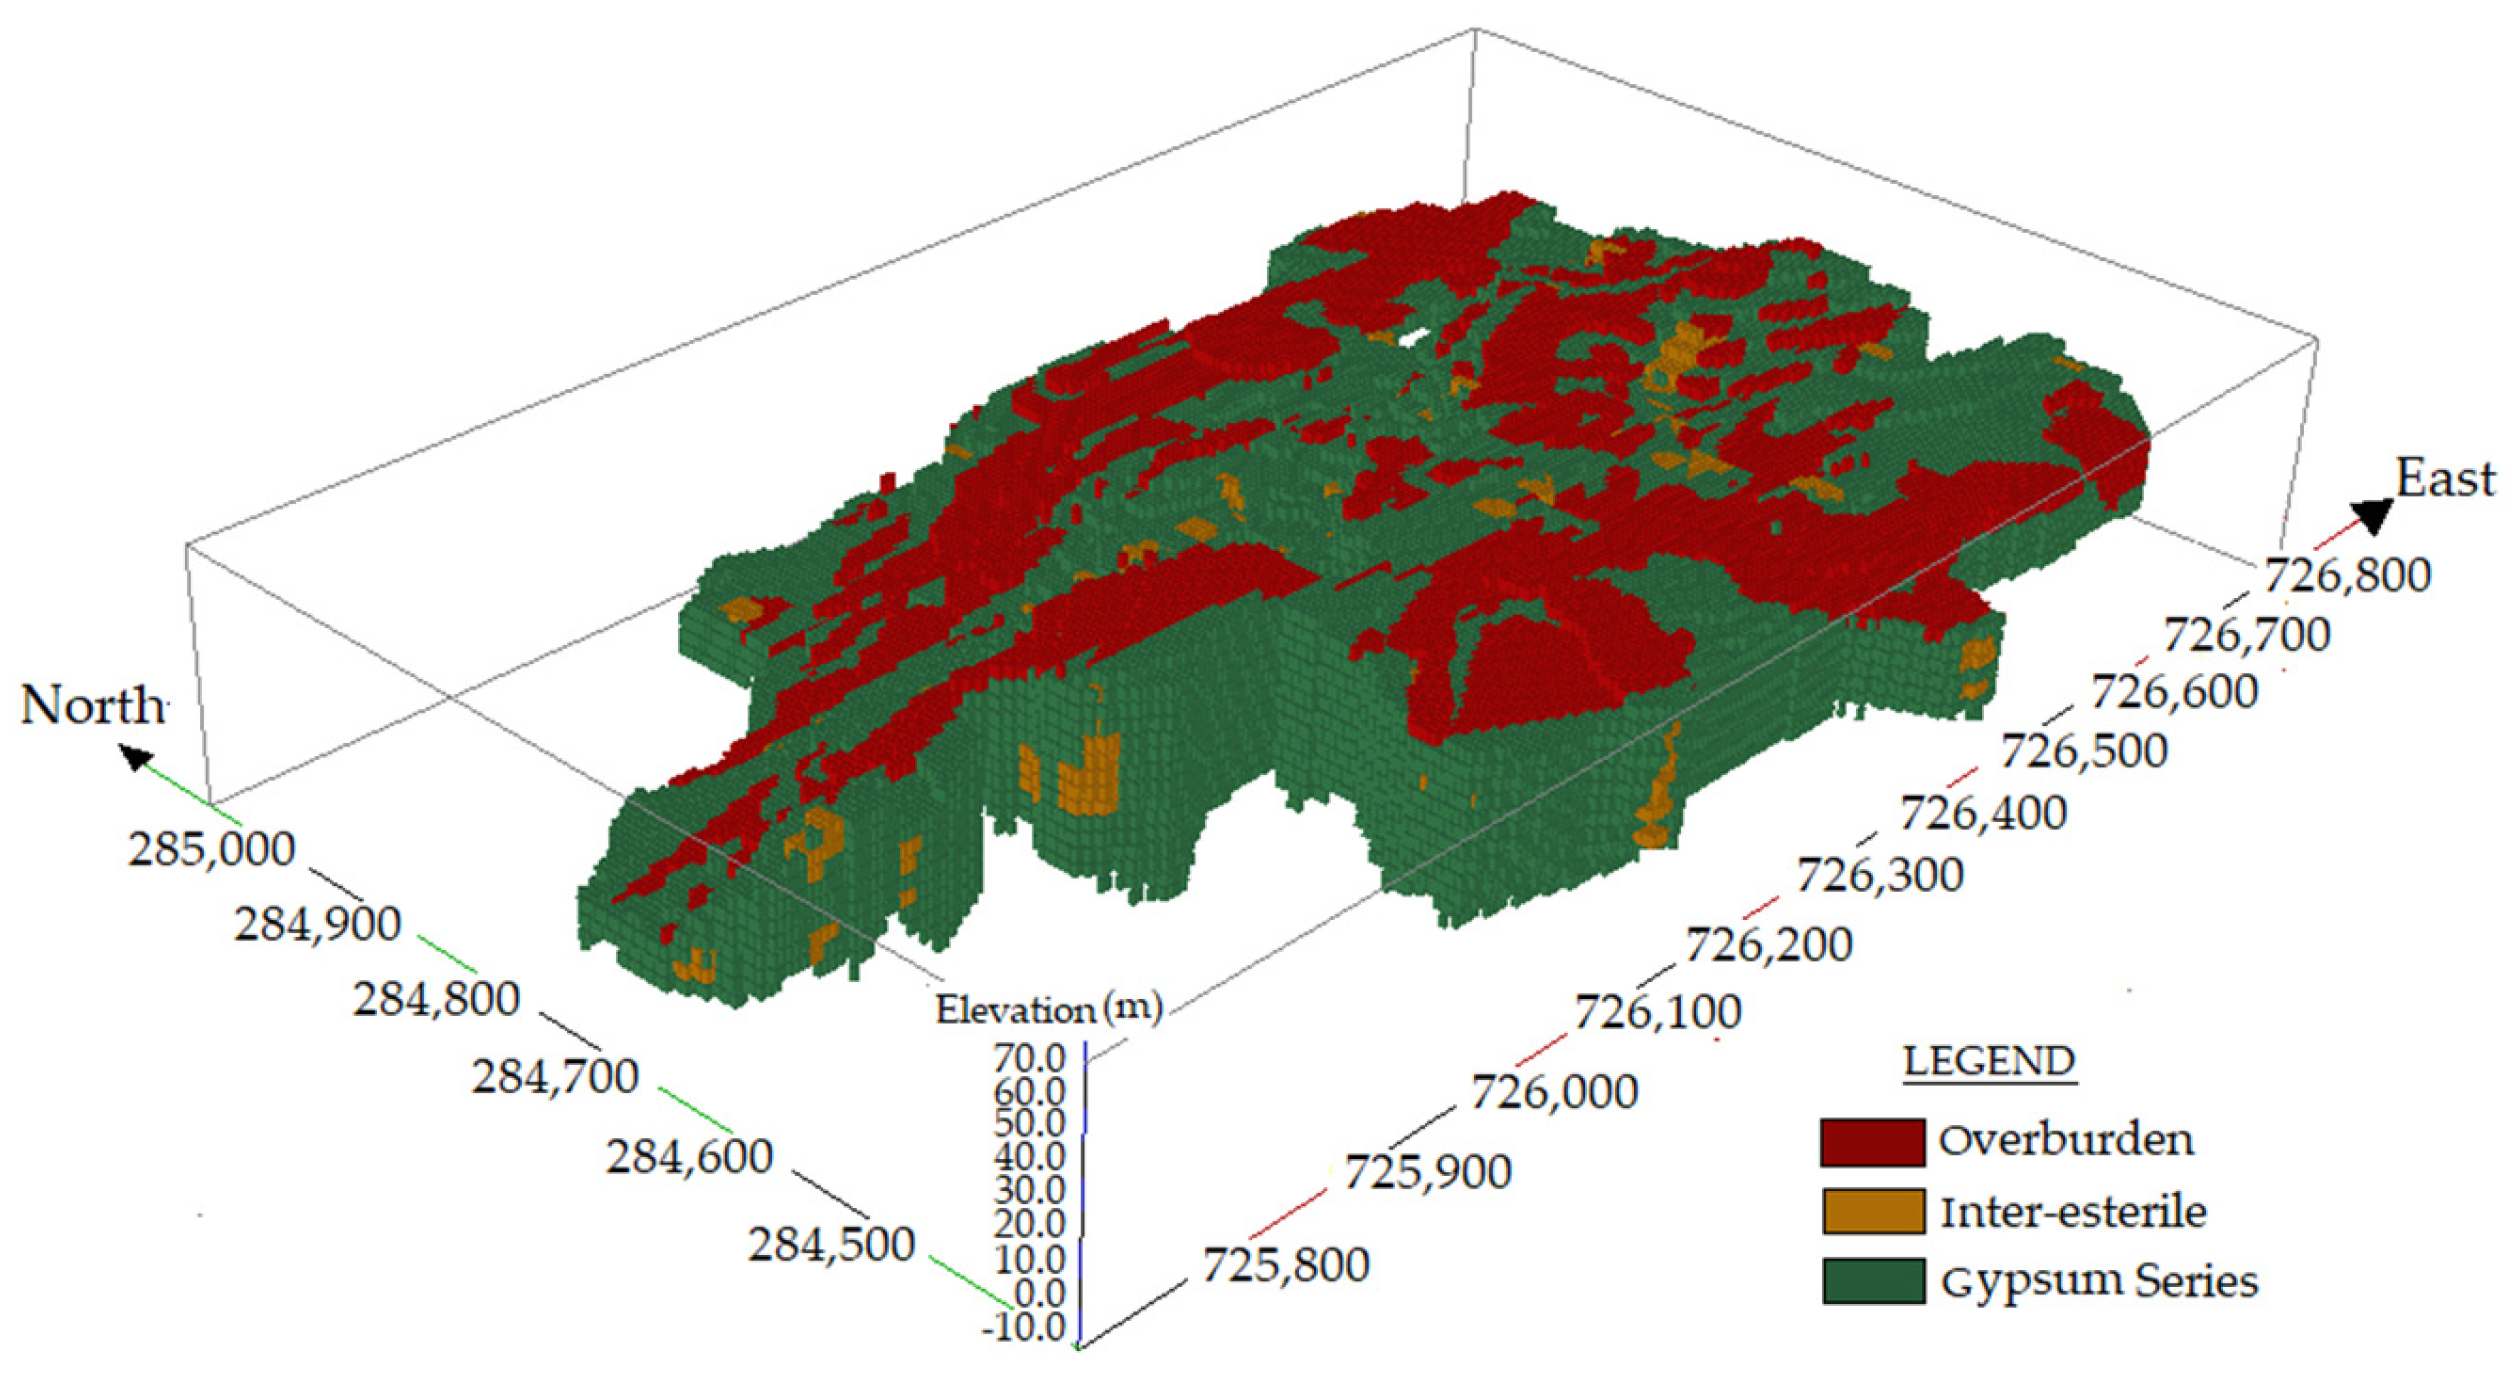
The training image (TI) was built according to a network of 5 × 5 × 5 m nodes, thus subdividing the 10 × 10 × 5 m panels internally into smaller panels, according to a 2 × 2 × 1 unit discretization pattern for scaling.
First, all nodes in the 5 × 5 × 5 m network were selected within the space delimited between the topography and the base of the boreholes (envelope of the deposit), assigning them a numerical code (code = 1). Then the nodes contained by the solids of the overburden (code = 0) and the inter-sterile (code = 2) were recorded. The training image (TI) created represents the conceptual model of the spatial distribution of the mineral and non-mineral units in the Punta Alegre deposit (Figure 6).

3.2.5. Composites

Composites were created to ensure that all samples had the same weight [31], to standardize the lithological information in the database of the Punta Alegre deposit, from the exploration boreholes at various stages [25,30].
The composites were created within the intervals resulting from the intersection of the boreholes and the solids created, using an average length for the composite of 0.5 m, which corresponds to the most frequent length found in the intervals in the ‘lithology’ table. For this purpose, code 1 (gypsum) was first assigned to all composites located within the general envelope of the deposit, and they were subsequently recorded with the appropriate code according to whether they belonged to the overburden or the ‘inter-sterile’ (code = 0 and code = 2, respectively). A total of 8730 composites were created.

3.2.6. Prior Probability Maps of the Overburden, the Valuable Mineral (Gypsum) and the Intercalated Sterile (‘Inter-Sterile’)

For the building of the prior probability maps of the units represented by the overburden, the valuable mineral (gypsum) and the intercalated sterile (‘inter-sterile’), each composite interval was previously coded using binary indicators [0,1], which indicate the presence or absence (zero or one, respectively) of any of the aforementioned types, according to the condition, i(u,k) = 1 if Z(u) = K; 0 or not. Finally, the prior probability maps were created by averaging the values of the indicators [0,1] in the 5 × 5 × 5 m node network using the moving window algorithm in a 150 × 150 × 5 m search area to obtain probability maps with adequate smoothing (Figure 7).

4. Results and Discussion

4.1. Results

The simulation was carried out for 50 equally probable scenarios using the SNESIM sequential simulation algorithm, implemented in the geostatistical software ‘SGeMS’ (version 3.0 Beta 64 bit) [11], using the training image (TI) and composites as hard data. As secondary information, the prior probability maps created beforehand by the moving average algorithm for the aforementioned units were used, with a search template of 150 × 150 × 5 m and a maximum of 80 conditioning data points. The simulated units for the overburden, inter-sterile and gypsum series (gypsum) for scenarios 1, 5, 18, 23, 34 and the training image (TI) are shown below, the latter being used as input for the simulation (Figure 8).
To validate the simulated models, various criteria were used: (a) reproduction of the overall statistics and spatial correlation, and (b) visual verification of the correlation between the input data and the simulated models.
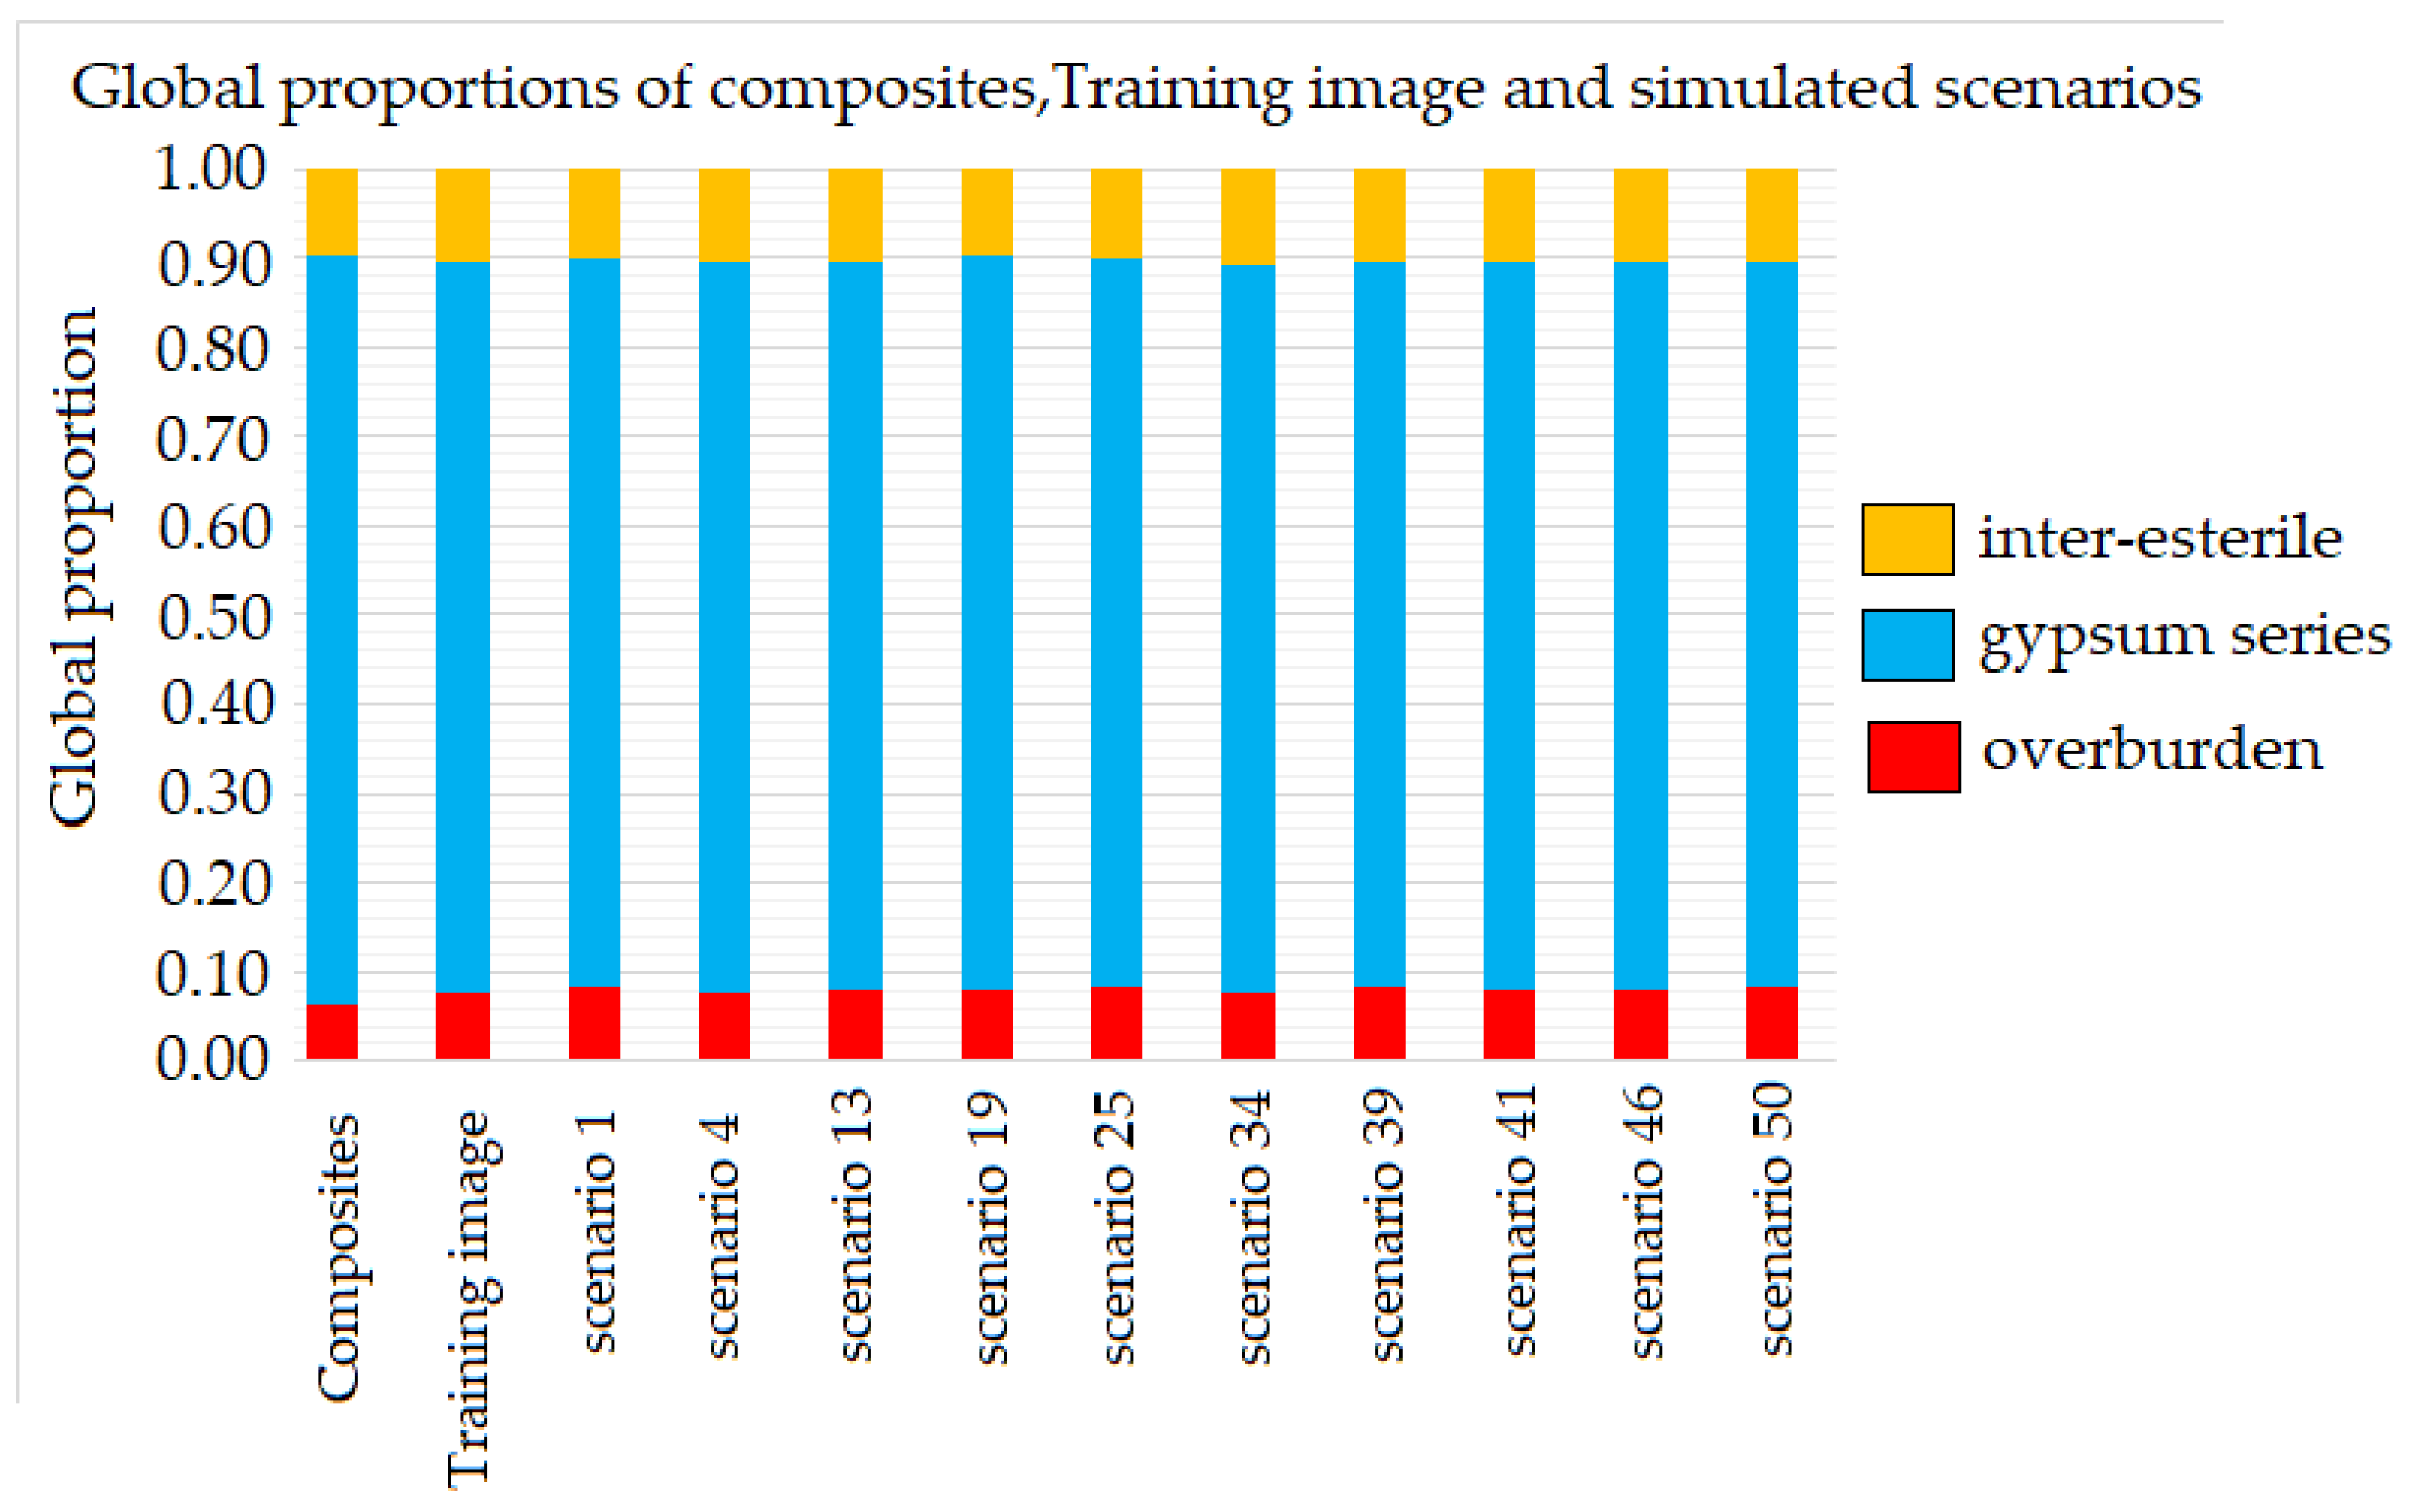
Judging by the overall proportions obtained for overburden gypsum (mineral) and intercalated non-mineral lithologies (sterile) obtained for 10 randomly selected scenarios out of a total of 50 simulated scenarios, the images obtained satisfactorily reproduce the global proportions of the training image and the composites, as shown in Table 1 and Figure 9.
Simulated semi-variogram indicators in the North–South and East–West directions of the overburden, the Inter-sterile and gypsum, were also reproduced satisfactorily in all units for the 50 simulated scenarios, verifying that the spatial correlation model (covariance) of the statistics between two points in the simulated units is correct (Figure 10).
Visual verification of the simulated unit models shows that they are spatially consistent with the composite units used as conditioning data in the simulation process. In this case, simulated scenario #1 is shown as a reference. This shows a good correspondence between the composites and the simulated units (Figure 11).

4.1.1. Deterministic Model for Gypsum in 10 × 10 × 5 m Panels

The deterministic model for gypsum in 10 × 10 × 5 m panels was created by scaling the nodes of the training image (TI), arranged in a 5 × 5 × 5 m grid to 10 × 10 × 5 m panels, calculating the proportion of each unit within the panel and assigning it to the unit with the highest proportion.
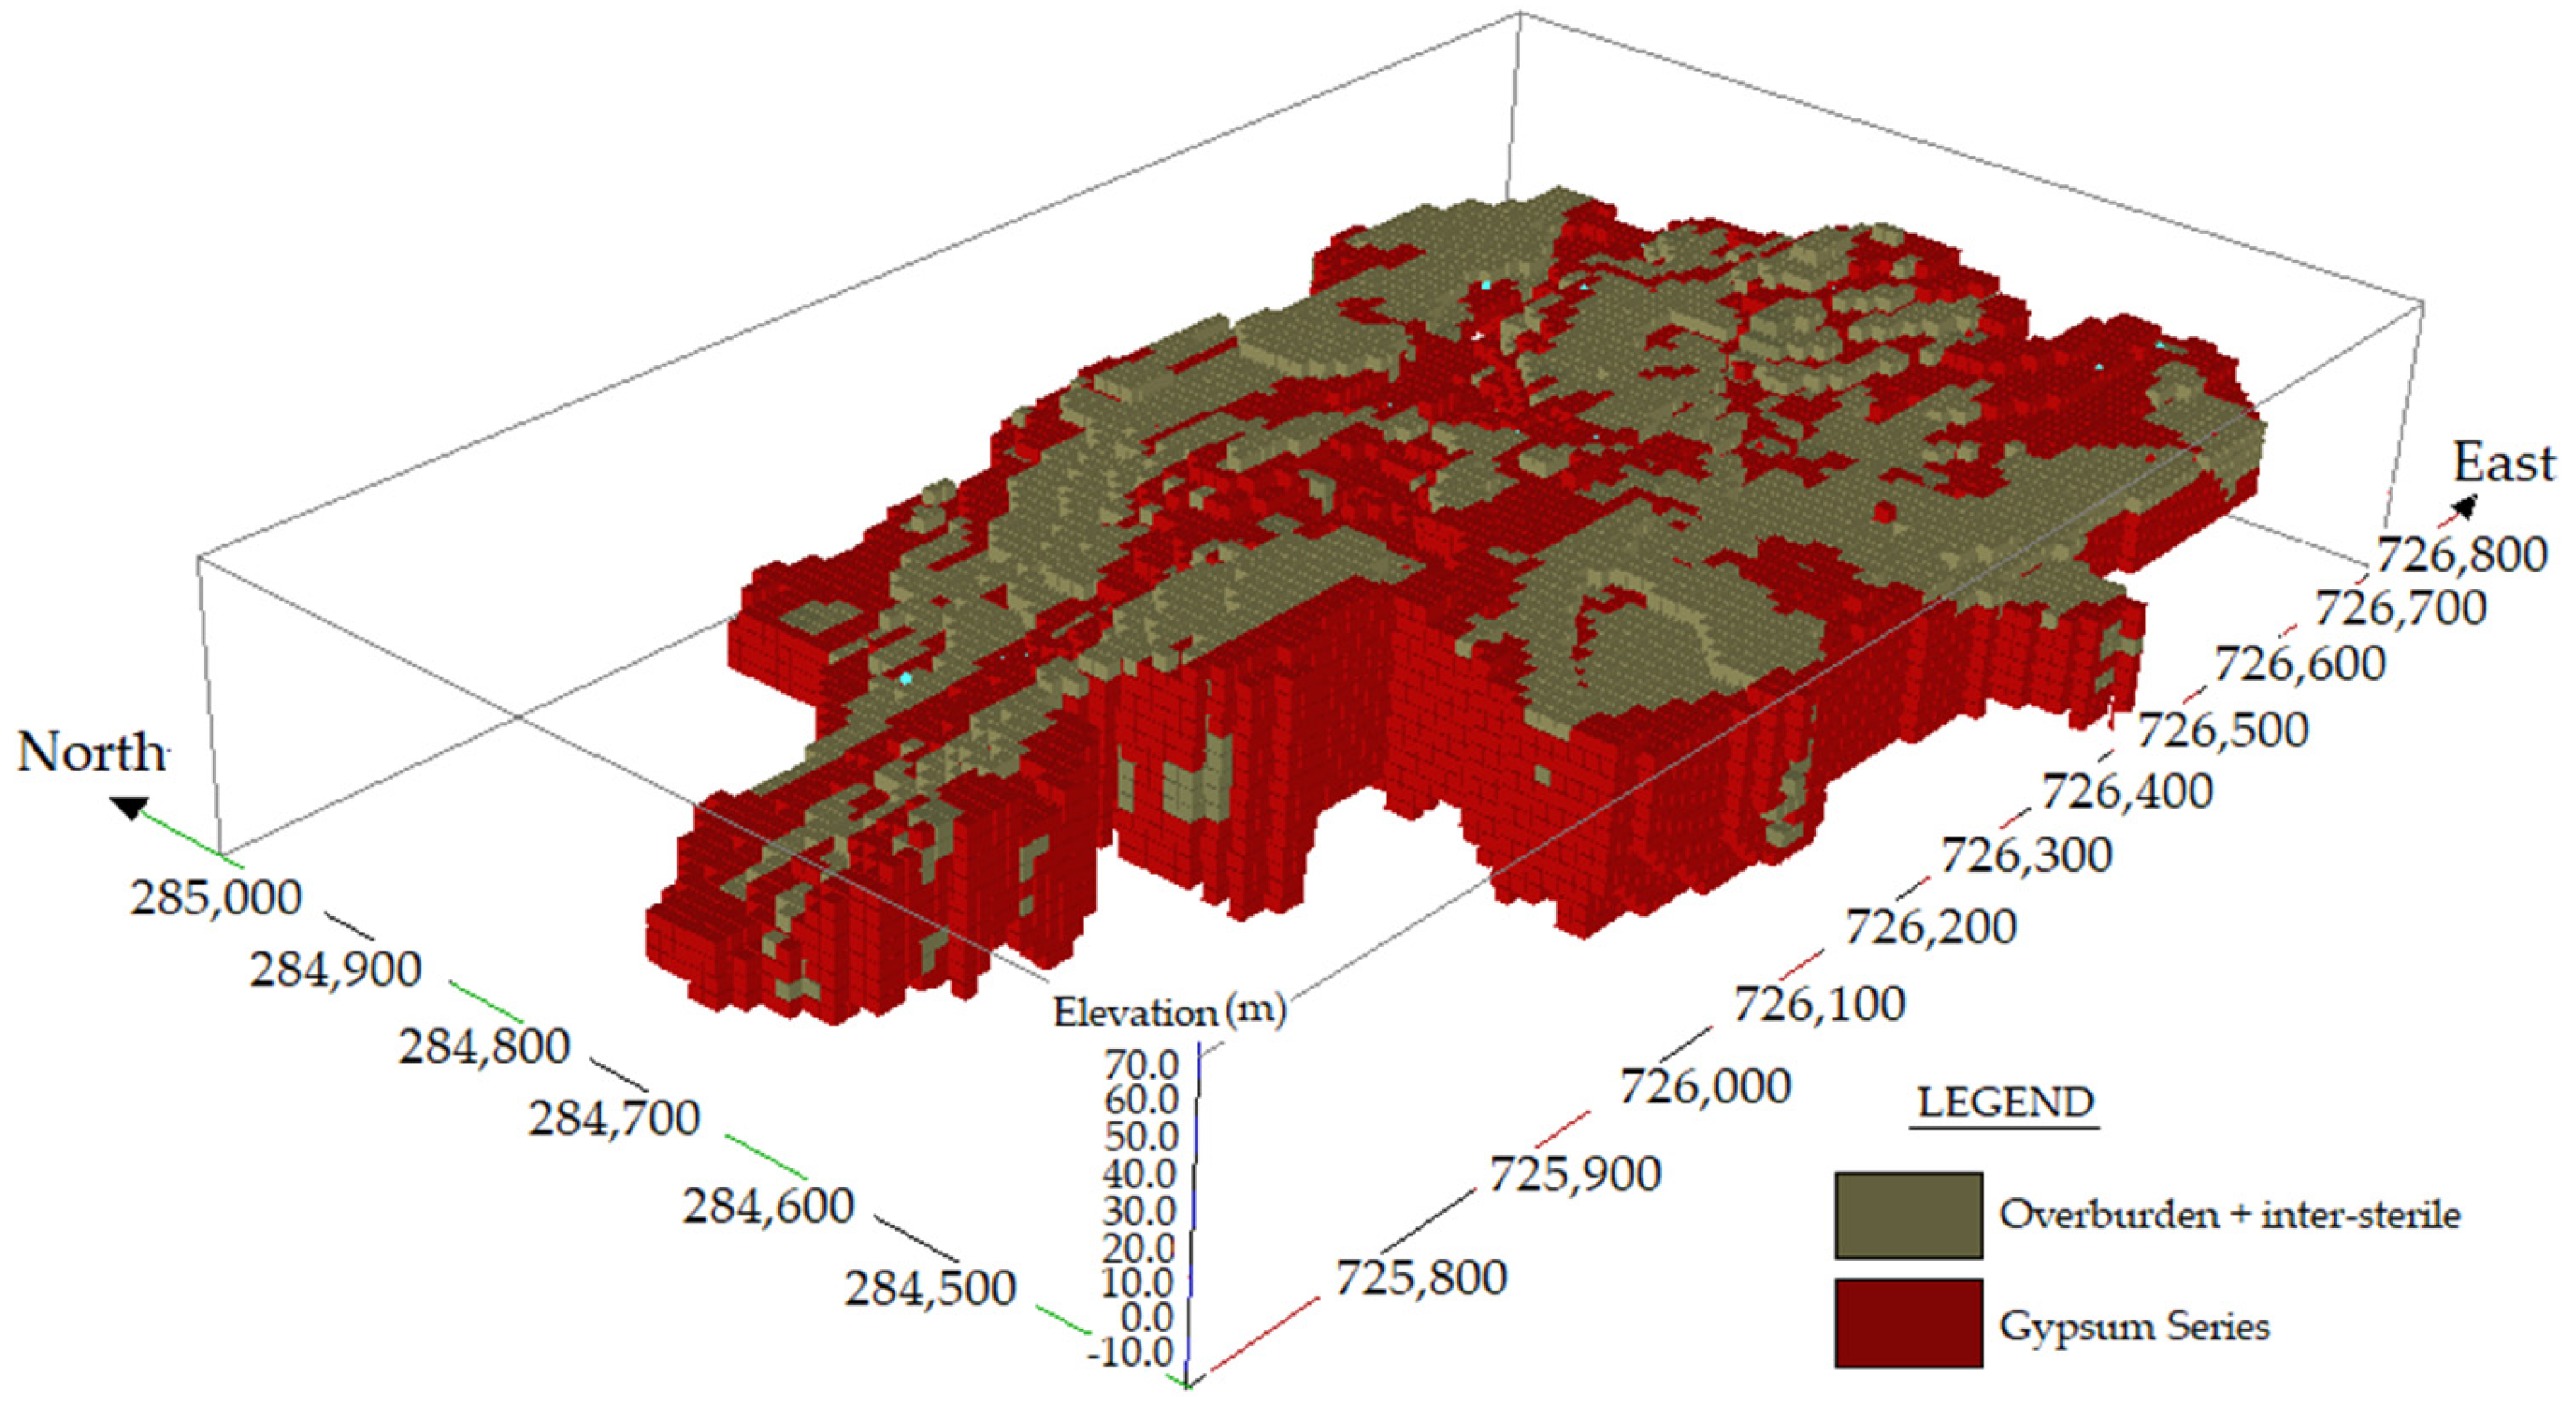
Each panel was then classified and coded with a value of one if the panel belonged to the gypsum series or with a value of zero if the panel was non-mineral, i.e., if it belonged to the overburden or inter-sterile, respectively (Figure 12).

4.1.2. Model of the Average Proportions of Gypsum in the 10 × 10 × 5 m Panels

The model of average gypsum proportions in 10 × 10 × 5 m panels was created in two stages using a procedure like that used to create the deterministic model of the gypsum series (gypsum).
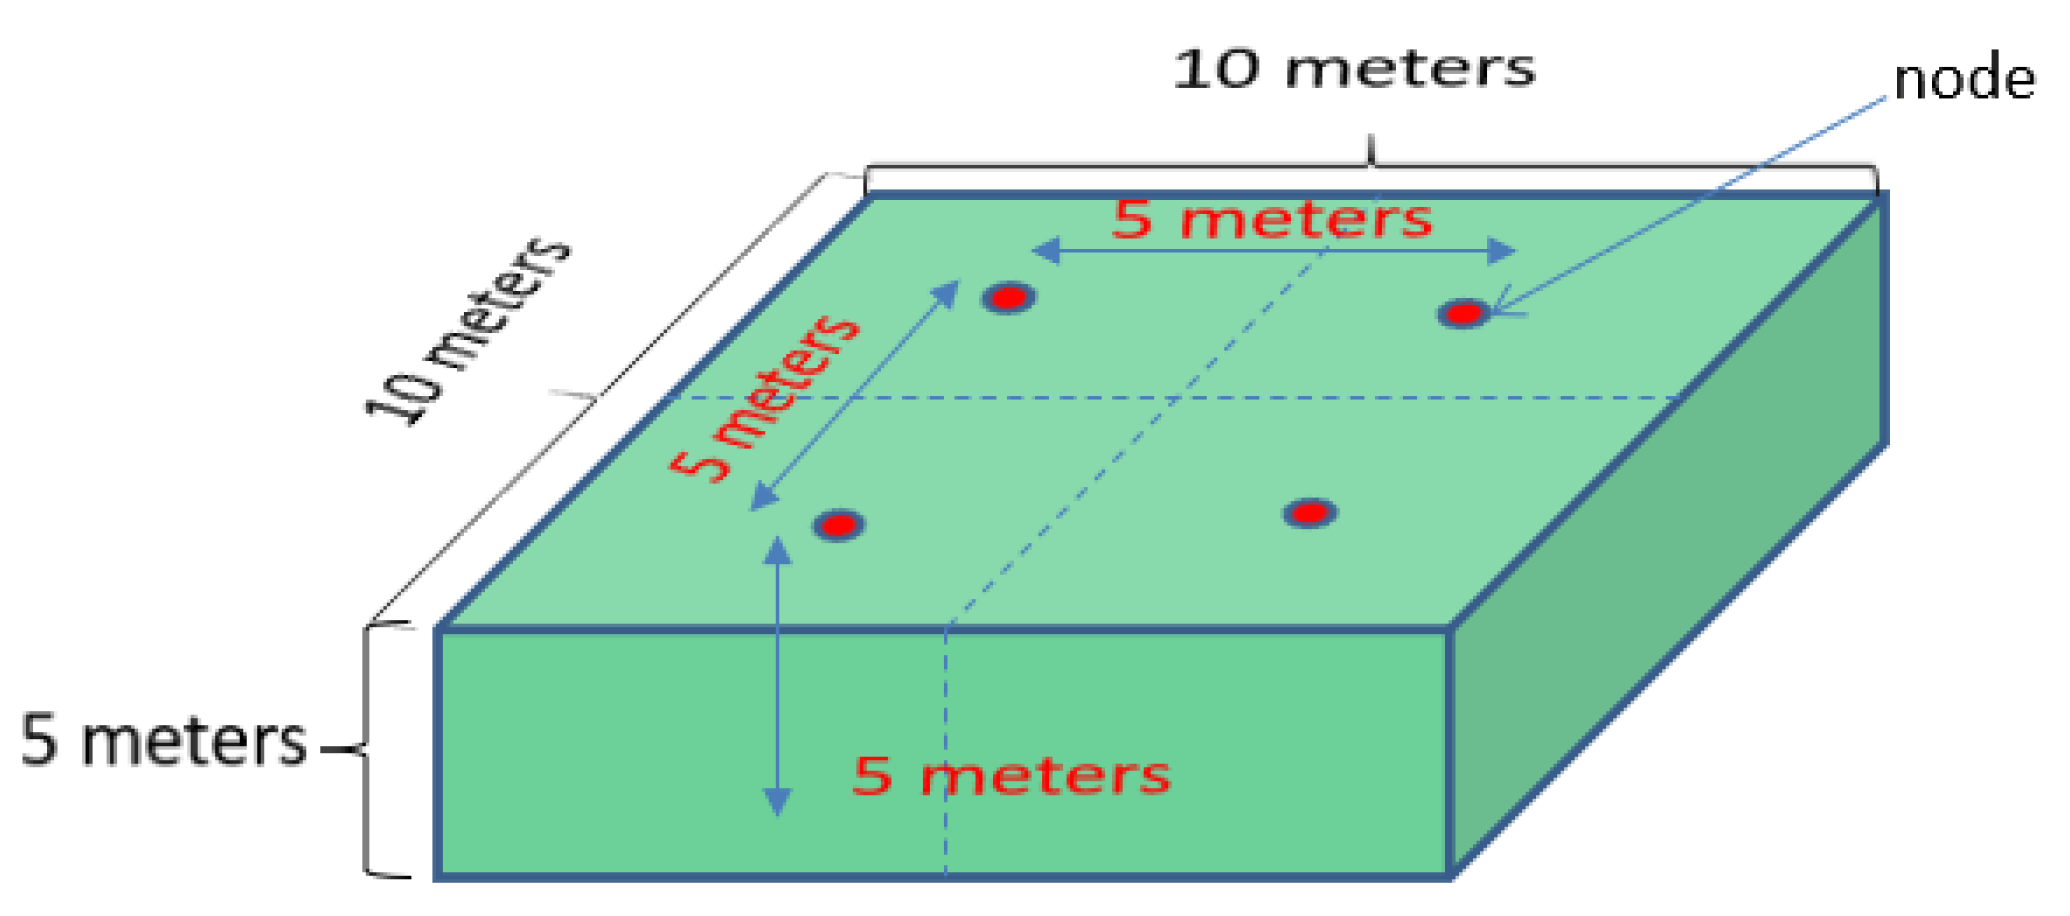
In the first stage, the proportion of gypsum in the volume of each 10 × 10 × 5 m panel was calculated for each of the 50 simulated scenarios using a support scaling, that is, by calculating the number of nodes within the 10 × 10 × 5 m panel that resulted in gypsum according to the simulation, divided by the number of sub-blocks (4) into which the panel is discretized (Figure 13).
The second stage corresponds to the calculation of the average P B in which gypsum occupies the volume of the 10 × 10 × 5 m panel, obtained by averaging the individual proportions calculated for gypsum in every 10 × 10 × 5 m block of each of the 50 simulated scenarios.
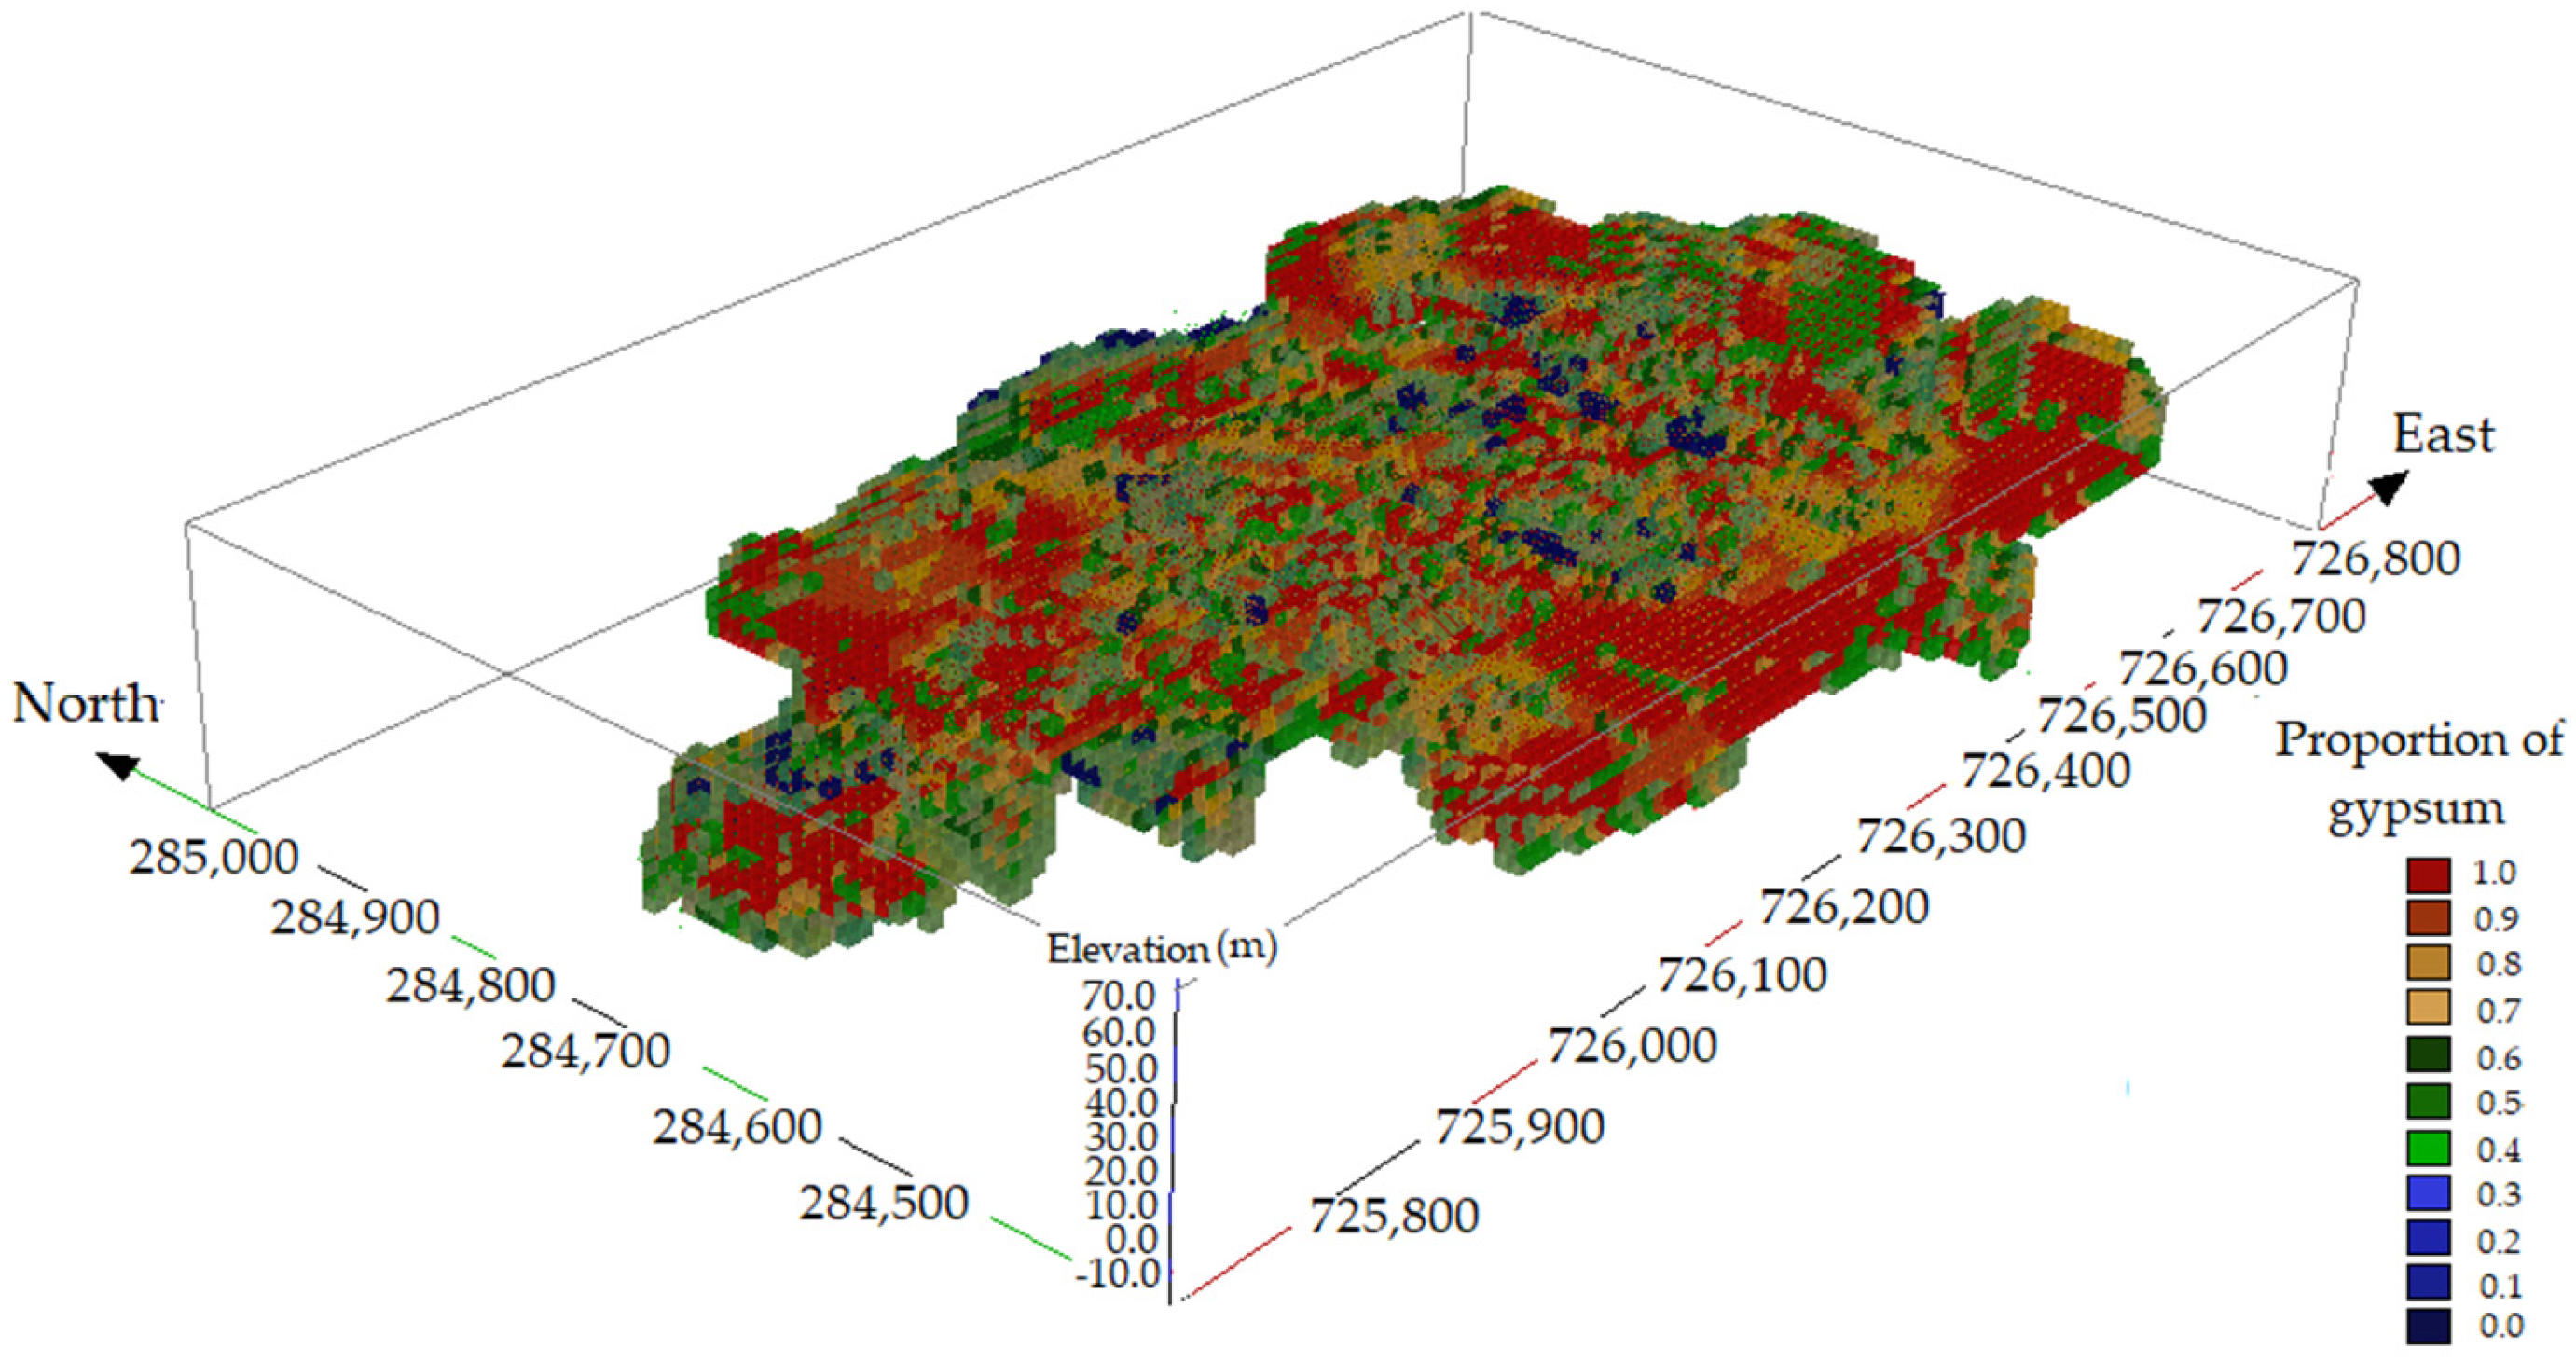
The average gypsum values range between the extreme values of zero and one; zero means the total absence of gypsum in the panel volume, and the value of one means that the panel is completely made up of gypsum (Figure 14).
Subsequently, the estimated gypsum volume (VE) in each 10 × 10 × 5 m panel was obtained by multiplying the mean estimated proportions of gypsum for the panel according to 50 simulated equiprobable scenarios by the unit of the panel, equal to 500 cubic meters.
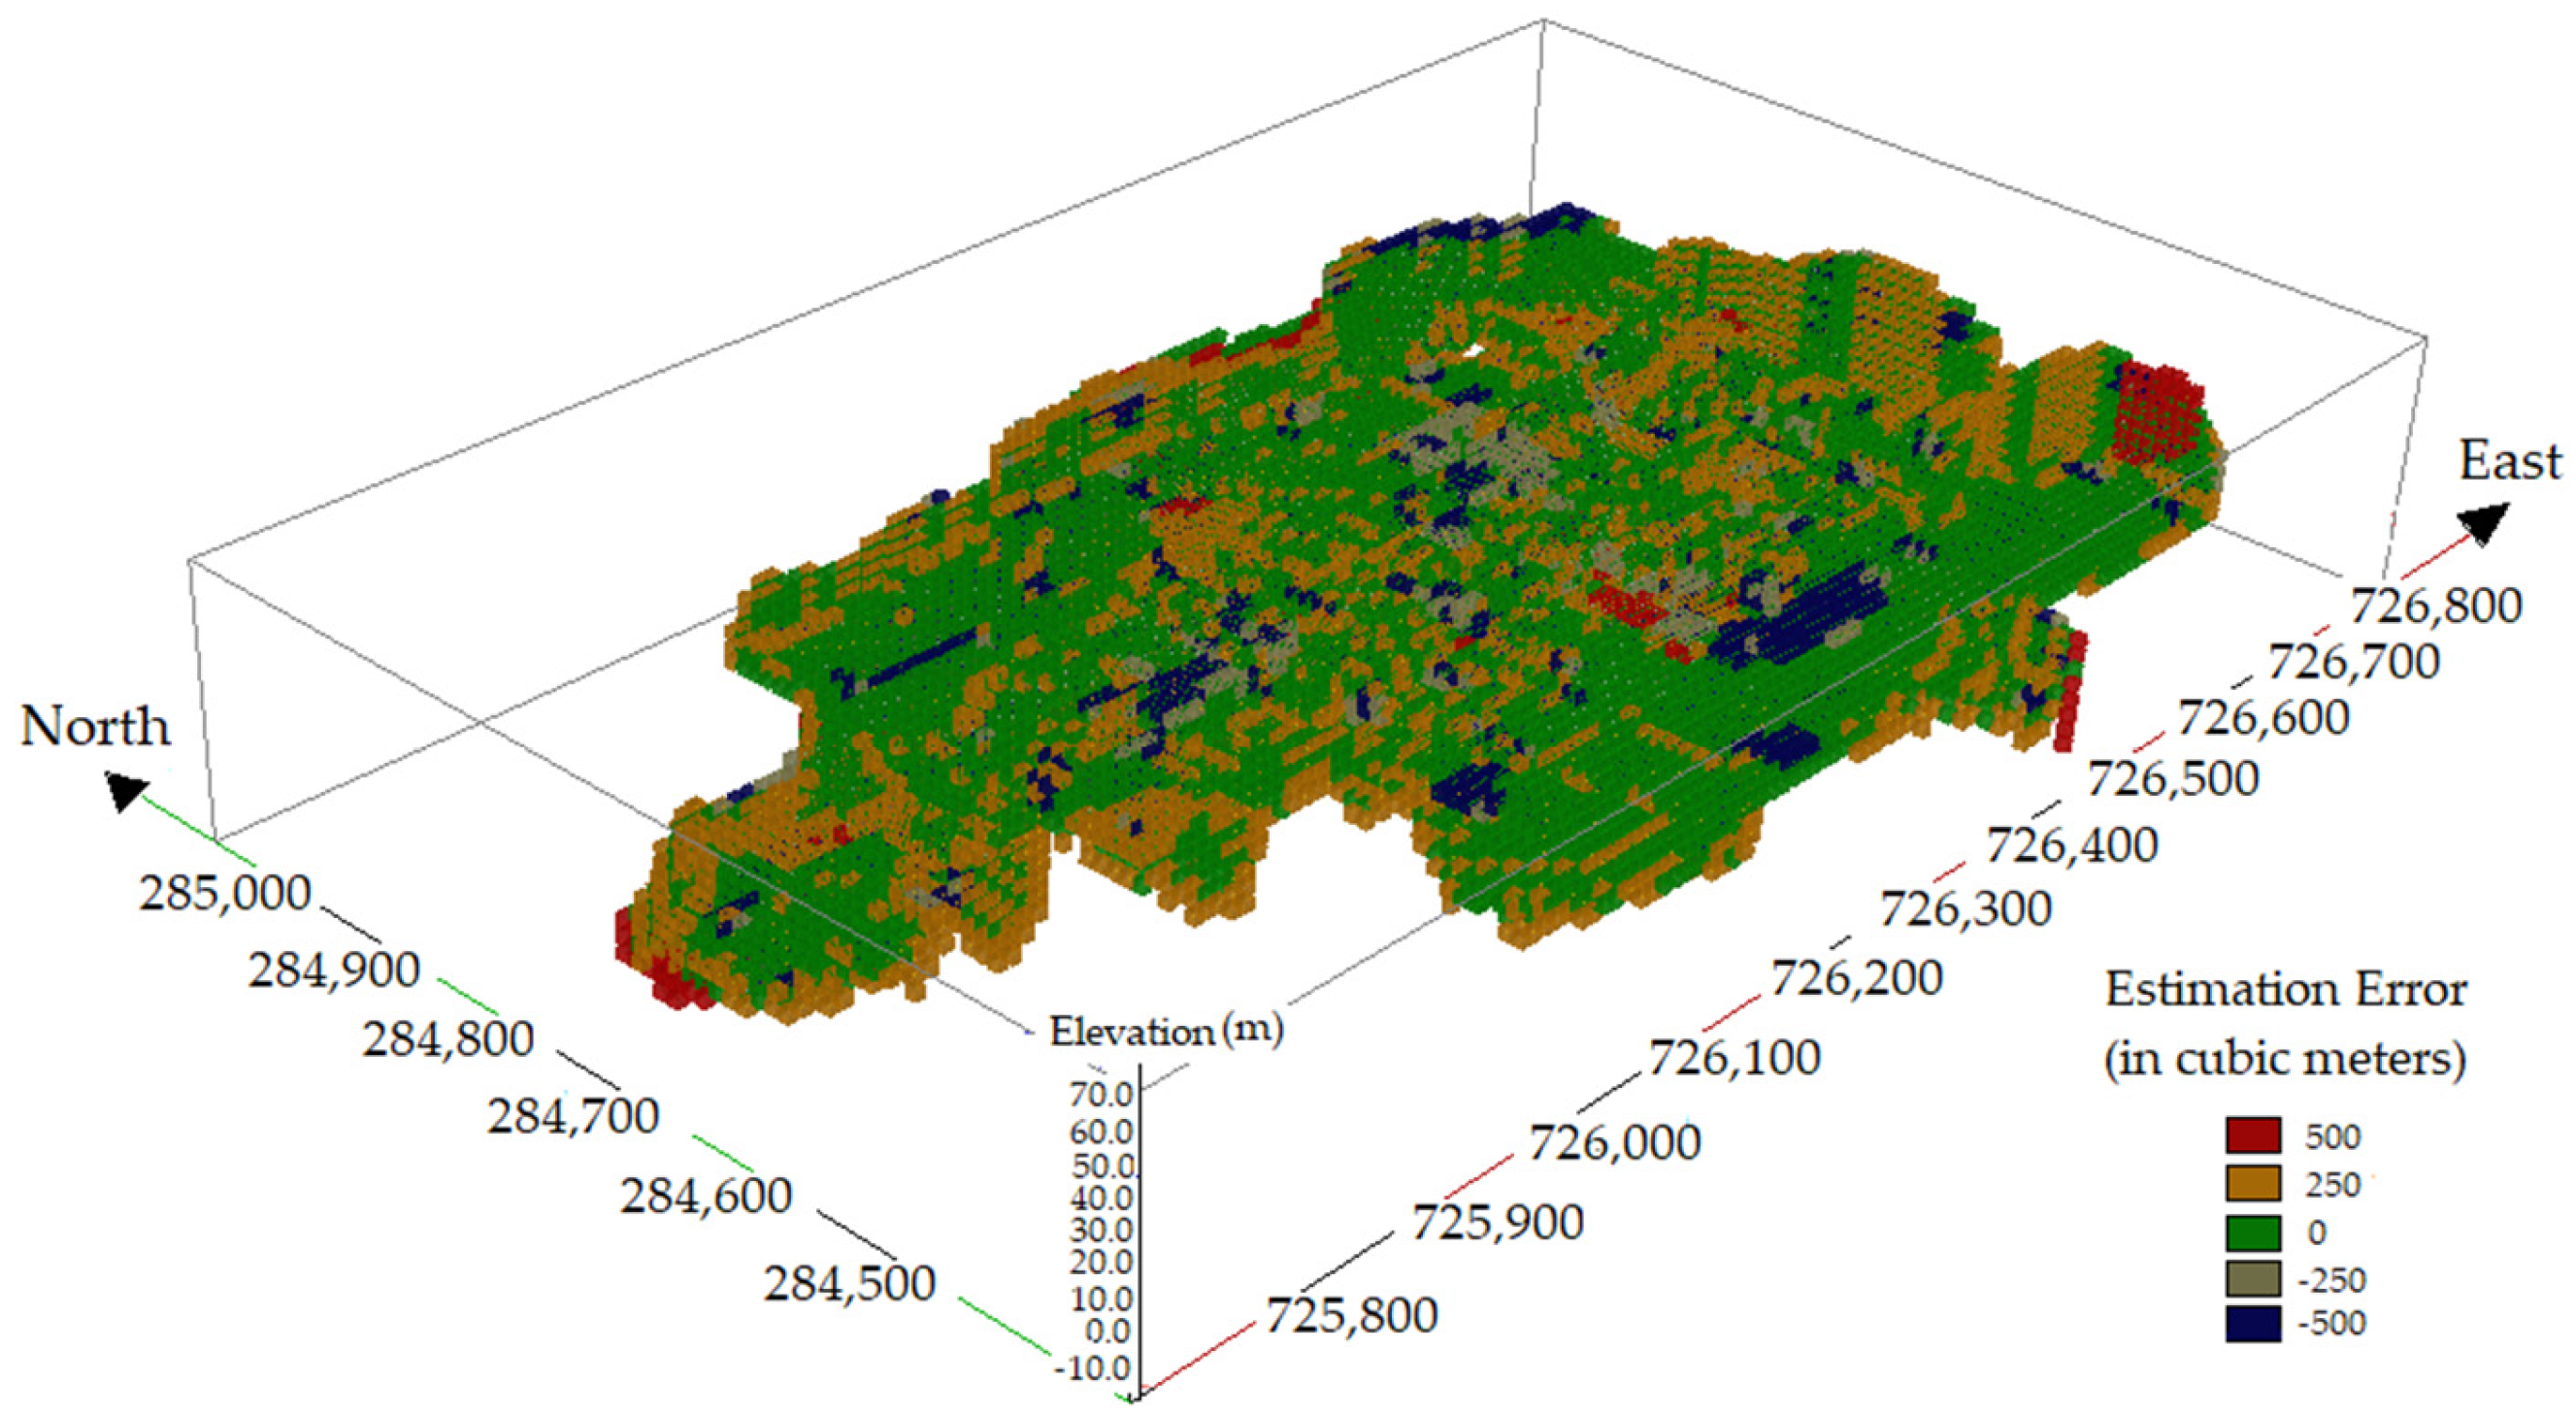
Finally, the spatial distribution model of the ε B of the gypsum volume in the 10 × 10 × 5 m panels (Figure 15) was obtained by the panel-by-panel difference between the gypsum volume of the deterministic mode (VB) and the estimated gypsum volume (VE) obtained from the proportion model for gypsum in the 10 × 10 × 5 m panels.

4.2. Discussion

The quantification of the uncertainty of the useful mineral volume at the Punta Alegre deposit was carried out through comparative statistical processing of the differences between the gypsum volumes of the 10 × 10 × 5 m panels according to the deterministic rock model and the gypsum volumes obtained for the same panels, using the estimated gypsum proportion model (Figure 14). The latter model was created by scaling the simulated values in the 5 × 5 × 5 m grid for 50 equiprobable scenarios obtained through stochastic simulation.
The metrics used to quantify uncertainty were: Mean Error (ME), Mean Absolute Error (MAE), Root Mean Square Error (RMSE) and Standard Deviation. Root Mean Square Error (RMSE) which measures the magnitude of the error between two sets of data. The latter statistic has been widely used to measure model performance in some studies [33,34,35,36], in this case it was used to measure the differences between the estimated gypsum volume of the panels according to the rock model (deterministic) V B , and the volume obtained from the model of the estimated gypsum proportions in the panels and the volume V E . As stated in [37], many mineral deposits, given their complex geological nature, involve inherent uncertainty, which leads to underestimation or overestimation of mineral resources, such is the case of the Punta Alegre deposit, where the results obtained support this result, given that the frequency histogram of the differences between the volumes of V B and V E . , shows a distribution of errors by class, arranged in negative and positive values, which represent the differences by default and by excess, respectively, relative to the variation in the volume of gypsum in the panel according to the deterministic rock model. This result is interpreted as evidence of underestimation and overestimation of the volume at the scale of the 10 × 10 × 5 m panels.
These differences fall between the values of −500 and +500 cubic meters of panel volume, corresponding to the minimum and maximum values, respectively (Figure 16).
The fact that there are a greater number of 10 × 10 × 5 m panels with a positive value for the estimation error ε B of the gypsum volume is interpreted as meaning that there is a systematic overestimation of the gypsum volume according to the deterministic model ( V B ) therefore there is a dominant positive bias with respect to the volume estimated according to the model obtained from the average gypsum proportions ( V E ), showing a greater number of panels with a frequency where ε B is greater than or equal to zero. Similarly, there is an underestimation of the gypsum volume for the 10 × 10 × 5 m panels. All the above is a consequence of small-scale variations in volume, especially in panels located near the contacts of the gypsum series with non-mineral units, both in the overburden and near non-mineral intercalations, where spatial heterogeneity affects interpolation.
The mean estimation error, ε B determined by the difference between the volume of gypsum in the panel according to the deterministic model and the volume obtained from the proportions estimated for the panel according to 50 scenarios, by scaling to the 10 × 10 × 5 m support from the network of 5 × 5 × 5 m nodes; is 26.28 cubic meters, this error considers the sign of the deviations from the central value, which is equal to zero; however, the absolute average error obtained for these same differences amounts to 138.11 cubic meters, which represents approximately 27.6 percent of the volume of the panel.
The size of the mean square error obtained from the differences between the volume of gypsum calculated according to the deterministic model for gypsum, V B . and the volume obtained from the model of the estimated gypsum proportions, V E , is 201.31 cubic meters, which represents a 42 percent variation with respect to the total volume of the panels of 500 cubic meters, reflecting a high geological variability, which is very close to the value of REMC, to the value of the standard deviation obtained (208.66 cubic meters) between these two data series, which suggests that the errors are not concentrated in extreme values, but widely distributed. In the old geological exploration reports, which exist about the Punta Alegre [25] and more recent [23] deposits, which were referred to above, the complex geological constitution of the gypsum series of the deposit is highlighted, due to its genesis by redeposition of salts, gypsum and other rocks to the deposition basin during its formation. This point supports the results obtained in the research regarding the marked uncertainty in the estimation of the gypsum volume at a local scale.
Regarding the limitations to this study, it should be mentioned that the resolution used to discretize the block of 10 × 10 × 5 according to a pattern of dimensions of 5 × 5 × 5 m to make the change in support by scaling, was insufficient to provide statistically more robust mean probability values. On the other hand, the number of simulated scenarios, while valid, could be increased to reduce the standard error.
There is no precedent in the country for the application of geostatistical simulation to determine uncertainty in these types of deposits, whose practical implication derived from this study justifies the use of stochastic models for heterogeneous areas, especially in complex geological contacts such as those existing in the Punta Alegre deposit.

5. Conclusions

The total volume of gypsum ore in the Punta Alegre deposit according to the reference deterministic rock model, amounts to 13.1 × 10⁶ cubic meters (13.1 million cubic meters), on the other hand, the total volume obtained using the estimated proportions of gypsum amounts to 12.3 × 10⁶ tons (12.3 million cubic meters); therefore, although there are differences between the two volumes, these are not significant and tend to compensate at the scale of the deposit, given that the global value of these differences only represents 6.51% of the total volume of the useful mineral (gypsum).
However, if these volume differences are analyzed at a local scale, such as for the panels, the results achieved in this research show that there is a predominance of the systematic overestimation of the volume of gypsum in the panels, judging by the histogram of frequencies of classes of the estimation error; as a result of the effect on the boundaries, that is, on the contacts of the gypsum series with the non-mineral units represented by the overburden and “Inter-sterile”, there being a significant variation in the volume of gypsum of the panels, judging by the figure obtained from the REMC, which is 201.31 cubic meters, denoting a high geological variability existing in the deposit.
When comparing the panel volume differences in the reference deterministic rock model with the panel volume of the model obtained using the estimated gypsum proportions, the difference represents a percentage change in gypsum volume of 42 percent.
The results achieved in this study suggest that the variations obtained at a local scale will have an indisputable influence on mining, given the differences in gypsum amounts in the panels at that scale. This should be considered for planning mining activities, especially in those panels close to the areas in contact with the intercalations of the lithologies that have been referred to in this study as non-mineral or sterile, such as limestones, dolomites, slates, clays, etc.
Although the results obtained positively validate the volume of gypsum resources that are estimated on a global scale according to the reference model; at the local scale the panels shown that there is a significant variation in this parameter, which will impact the gypsum resources that could be recovered by mining, given the existing uncertainty, which will cause an increase in mining dilution both internally and externally, due to the inclusion of non-mineral lithologies within the extracted mineral mass (gypsum) and that will be sent to the processing plant. On the other hand, it will cause deviations from the mining company’s plan, in areas where there are panels where the volumes were previously accounted for by the deterministic model as mineral and are not truly exploitable.

Author Contributions

Conceptualization, J.A.A., A.C. and E.E.; methodology, J.A.A.; software, J.A.A.; validation, J.A.A.; formal analysis, J.A.A. and E.E.; data curation, J.A.A.; writing—original draft preparation, J.A.A. and R.R.; writing—review and editing, J.A.A., J.L.C. and D.A.M.; supervision, J.A.A. All authors have read and agreed to the published version of the manuscript.

Funding

This research received no external funding.

Data Availability Statement

The data is unavailable due to privacy.

Acknowledgments

The authors wish to thank the National Office of Mineral Resources of the Republic of Cuba for providing the information to realize and publishing of this work, as well as Opengeostat Consulting of Vancouver, Canada (http://opengeostat.com/), for reviewing this manuscript and the valuable comments and observations made. The authors also thank the University of Moa (Cuba) and the Universidad Politécnica de Madrid (Spain) for their invaluable help. The authors have reviewed and edited the output and take full responsibility for the content of this publication.

Conflicts of Interest

The authors declare no conflicts of interest.

References

  1. Rossi, M.E.; Deutsch, C.V. Mineral Resource Estimation; Springer: Dordrecht, The Netherlands; Heidelberg, Germany; New York, NY, USA; London, UK, 2014; p. 337. ISBN 978-1-4020-5716-8. [Google Scholar] [CrossRef]
  2. Van Der Grijp, Y.M. Application of Simulation Techniques for Modelling Uncertainty Associated with Gold Mineralization. Master’s Thesis, Faculty of Engineering and the Built Environment, University of the Witwatersrand, Johannesburg, South Africa, 2014; p. 70. Available online: https://core.ac.uk/download/pdf/39676262.pdf (accessed on 11 April 2025).
  3. Deutsch, C.V. The Place of Geostatistical Simulation through the Life Cycle of a Mineral Deposit. Minerals 2023, 13, 1400. [Google Scholar] [CrossRef]
  4. Caers, J. Modeling Spatial Uncertainty. In Modeling Uncertainty in the Earth Sciences; John Wiley & Sons, Ltd.: Oxford, UK, 2011; pp. 93–106. ISBN 9781119992639. [Google Scholar] [CrossRef]
  5. Dowd, P. Quantifying the Impacts of Uncertainty. In Handbook of Mathematical Geosciences: Fifty Years of IAMG; Springer Open: Cham, Switzerland, 2018; Chapter 18; pp. 349–373. ISBN 978-3-319-78998-9. [Google Scholar] [CrossRef]
  6. Júnior, S.; da Silva, A.A. Simulação de Litotipos de Depósito de Minério de Ferro com Geoestatística de Múltiplos Pontos. Master’s Thesis, Universidade Federal Do Rio Grande Do Sul. Programa de Pós-Graduação em Engenharia de Minas, Farroupilha, Brasil, 2013; p. 102. Available online: https://lume.ufrgs.br/handle/10183/79828 (accessed on 16 February 2024).
  7. Gómez-Hernández, J.J.; Srivastava, R.M. One Step at a Time: The Origins of Sequential Simulation and Beyond. Math. Geosci. 2021, 53, 193–209. [Google Scholar] [CrossRef]
  8. Abulkhair, S.; Madani, N. Stochastic modeling of iron in coal seams using two-point and multiple-point geostatistics: A case study. Min. Metall. Explor. 2022, 39, 1313–1331. [Google Scholar] [CrossRef]
  9. Guardiano, F.B.; Srivastava, R.M. Multivariate Geostatistics: Beyond Bivariate Moments. In Geostatistics Tróia ’92; Soares, A., Ed.; Quantitative Geology and Geostatistics; Springer: Dordrecht, The Netherlands, 1993; Volume 5. [Google Scholar] [CrossRef]
  10. Strebelle, S. Conditional Simulation of Complex Geological Structures Using Multiple-Point Statistics. Math. Geol. 2002, 34, 1–21. [Google Scholar] [CrossRef]
  11. Remy, N.; Boucher, A.; Wu, J. Applied Geostatistics with SGeMS: A User’s Guide; Mathematical Geosciences; Cambridge University Press: Cambridge, UK, 2009; Volume 41, pp. 353–356. ISBN 978-0-521-51414-9. [Google Scholar]
  12. Tahmasebi, P. Multiple point statistics: A review. In Handbook of Mathematical Geosciences: Fifty years of IAMG; Springer Open: Cham, Switzerland, 2018; Chapter 30; pp. 613–643. ISBN 978-3-319-78998-9. [Google Scholar] [CrossRef]
  13. Talesh Hosseini, S.; Asghari, O.; Torabi, S.A.; Abedi, M. An Optimum Selection of Simulated Geological Models by Multi-Point Geostatistics and Multi-Criteria Decision-Making Approaches; a Case Study in Sungun Porphyry-Cu deposit, Iran. J. Min. Environ. 2020, 11, 481–503. [Google Scholar] [CrossRef]
  14. Avalos, S.; Ortiz, J.M. Multiple-Point Statistics: Tools and Methods. Predictive Geometallurgy and Geostatistics Lab, Queen’s University, Annual Report, 2020, Paper 2020-03. pp. 33–60. Available online: https://qspace.library.queensu.ca/handle/1974/28556 (accessed on 11 February 2014).
  15. Strebelle, S. Multiple-Point Statistics Simulation Models: Pretty Pictures or Decision-Making Tools? Math. Geosci. 2021, 53, 267–278. [Google Scholar] [CrossRef]
  16. Osterholt, V.; Dimitrakopoulos, R. Simulation of Orebody Geology with Multiple-Point Geostatistics—Application at Yandi Channel Iron Ore Deposit, WA, and Implications for Resource Uncertainty. In Advances in Applied Strategic Mine Planning; Dimitrakopoulos, R., Ed.; Springer: Cham, Switzerland, 2018; pp. 335–352. [Google Scholar] [CrossRef]
  17. Paithankar, A.; Chatterjee, S. Grade and Tonnage Uncertainty Analysis of an African Copper Deposit Using Multiple-Point Geostatistics and Sequential Gaussian Simulation. Nat. Resour. Res. 2018, 27, 419–436. [Google Scholar] [CrossRef]
  18. Strebelle, S. Sequential Simulation Drawing Structures from Training Images. Ph.D. Thesis, Stanford Center for Reservoir Forecasting, Stanford University, Stanford, CA, USA, 2000; p. 24, UMI Number: 3000105. Available online: https://github.com/SCRFpublic/snesim-standalone/blob/master/snesimtheory.ppt (accessed on 10 April 2024).
  19. Amarante, F.A.N.; Rolo, R.M.; Costa, J.F.C.L. Assessing geologic model uncertainty—A case study comparing methods. REM—Int. Eng. J. 2019, 72, 643–653. [Google Scholar] [CrossRef]
  20. Iturralde-Vinent, M.; Marrero, F. Nuevos datos sobre las estructuras diapíricas de Punta Alegre y Turiguanó, en la Provincia Ciego de Avila. Rev. Cienc. Tierra Espac. 1982, 9, 47–55. [Google Scholar]
  21. Meyerhoff, A.A.; Hatten, C.W. Diapiric Structures in Central Cuba1. In Diapirism and Diapirs: A symposium; Braunstein, J., O’Brien, G.D., Eds.; American Association of Petroleum Geologists: Tulsa, OK, USA, 1968; pp. 315–357. [Google Scholar] [CrossRef]
  22. Sánchez Arango, J.R. Las Evaporitas en Cuba y su Relación con Escenarios Exploratorios de Hidrocarburos. Memorias, Trabajos y Resúmenes V Convención Cubana de Ciencias de la Tierra (Geociencias’ 2013) Sociedad Cubana de Geología, 2013. p. 12. PETRO1-O2. SSN-2307-499X. Available online: http://www.redciencia.cu/geobiblio/paper/2013_Sanchez_Arango_PETRO1-O2.pdf (accessed on 16 February 2024).
  23. Rojas-Consuegra, R.; Tamayo Castellanos, Y.; Torres Díaz, M.; Pérez Peña, M.V. Reevalución Estratigráfica Integral de Bloques para la Exploración de Hidrocarburos; Internal Archive; Unpublished Report; National Office of Mineral Resources of the Republic of Cuba: La Habana, Cuba, 2020; Available online: https://www.minem.gob.cu/es/actividades/geologia/informes-concluidos (accessed on 16 February 2024).
  24. Lukač, M. Estratigrafía y génesis de la sal gema en Punta Alegre y en Loma Cunagua, Provincia de Camagüey. Rev. Tecnológica 1969, 1, 20–42. Available online: http://www.redciencia.cu/geobiblio/geobiblio.html#L (accessed on 16 February 2024).
  25. Kazak, Y.; Setién, C.; Hurtado, J. Informe General Sobre los Trabajos Detallados de Exploración Geológica en yeso, en los años 1964–1965,1967–1970 y 1976–1977, Yacimiento Punta Alegre; Internal Archive; Oficina Nacional de Recursos Minerales: La Habana, Cuba, 1981; p. 255. [Google Scholar]
  26. Instituto de Geología y Paleontología of Cuba. Léxico Estratigráfico de Cuba; Instituto de Geología y Paleontología of Cuba: Havana, Cuba, 2014; ISBN 978-959-7117-57-5. Available online: https://isbn.cloud/9789597117575/lexico-estratigrafico-de-cuba-2013/ (accessed on 12 February 2024).
  27. Cala, E.L.; Delgado, D.E.G. Stratigraphy of Cuba. In Geology of Cuba; Pardo Echarte, M.E., Ed.; Regional Geology Reviews; Springer Nature: Cham, Switzerland, 2021; pp. 143–188. [Google Scholar] [CrossRef]
  28. Ducloz, C. Apuntes sobre el yeso del Valle de Yumurí Matanzas. Apuntes sobre el yeso del valle de Yumuri Matanzas. Mem. Soc. Cuba. Hist. Nat. Felipe Poey 1960, 25, 1–9. Available online: https://archive-ouverte.unige.ch/unige:156815 (accessed on 16 February 2024).
  29. Instituto de Geología y Paleontología of Cuba. Mapa Geológico Hoja Punta Alegre a Escala 1:100000; 2011.a ed.; Internal Report; Instituto de Geología y Paleontología (Cuba): La Habana, Cuba, 2011; Available online: https://www.igp.minem.cu/ (accessed on 16 February 2024).
  30. Ortíz, E. Re-Estimación de Recursos para la Concesión del Yacimiento «Yeso Punta Alegre»; Internal Report No.: 3281; CEPRONIQUEL: La Habana, Cuba, 2018; p. 79. [Google Scholar]
  31. Palmer, L.W. Compositing and regularization of drillhole data for geostatistical resource estimation. J. S. Afr. Inst. Min. Metall. 2024, 124, 331–338. [Google Scholar] [CrossRef]
  32. Marwanza, I.; Nas, C.; Azizi, M.A.; Simamora, J.H. Comparison between moving windows statistical method and kriging method in coal resource estimation. J. Phys. Conf. Ser. 2019, 1402, 033016. [Google Scholar] [CrossRef]
  33. Anggara, B.; Marwanza, I.; Ahmad Azizi, M.; Dahani, W. Subandrio. Fitting the variogram model of nickel laterite using root means square error in Morowali, Central Sulawesi. IOP Conf. Ser. Earth Environ. Sci. 2021, 882, 012042. [Google Scholar] [CrossRef]
  34. Garnier-Villarreal, M. Introducción al análisis geoestadístico de datos en geociencias: Teoría y aplicación. Rev. Geol. Am. Cent. 2022, 67, 26–48. [Google Scholar] [CrossRef]
  35. Hodson, T.O. Root-mean-square error (RMSE) or mean absolute error (MAE): When to use them or not. Geosci. Model Dev. 2022, 15, 5481–5487. [Google Scholar] [CrossRef]
  36. Nimmo, M.J. ML and AI for resource estimation—What could possibly go wrong? Nothing! Everything! In Proceedings of the Mineral Resource Estimation Conference 2023, Perth, Australia, 24–25 May 2023.
  37. Lindi, O.T.; Aladejare, A.E.; Ozoji, T.M.; Ranta, J.P. Uncertainty Quantification in Mineral Resource Estimation. Nat. Resour. Res. 2024, 33, 2503–2526. [Google Scholar] [CrossRef]
Figure 1. Training image for two categories, tree and search template, modified from [18].
Applsci 15 10616 g001
Figure 3. Location map of the exploration boreholes.
Applsci 15 10616 g003
Figure 4. Geographical location of the Punta Alegre gypsum deposit.
Applsci 15 10616 g004
Figure 5. Boreholes and solids of the overburden (covering materials), inter-sterile (non-mineral intercalations) and the gypsum series (gypsum).
Applsci 15 10616 g005
Figure 6. Three-dimensional training image (TI) of the units: Overburden, Inter-sterile and gypsum, created according to a network of nodes measuring 5 × 5 × 5 m.
Applsci 15 10616 g006
Figure 7. Prior probability maps (5 × 5 × 5 m nodes).
Applsci 15 10616 g007
Figure 8. Training image (TI) versus simulated scenarios.
Applsci 15 10616 g008
Figure 9. Comparative graph of proportions for 10 equally probable scenarios of the simulated units.
Applsci 15 10616 g009
Figure 10. Simulated indicator semi-variograms (solid lines) versus semi-variograms of the TI training image (dotted line) for the units, the overburden, Inter-sterile and Gypsum.
Applsci 15 10616 g010
Figure 11. Visual validation for simulated scenario # 1. Comparison between the simulated units of the ‘overburden’, the non-mineral intercalations (Inter-sterile) and the gypsum series (Gypsum), and the composites used in the simulation.
Applsci 15 10616 g011
Figure 12. Deterministic model; gypsum series (gypsum) and non-mineral (overburden + inter-sterile) in the 10 × 10 × 5 m panels.
Applsci 15 10616 g012
Figure 13. Panel measuring 10 × 10 × 5 m, discretized according to a 2 × 2 × 1 pattern.
Applsci 15 10616 g013
Figure 14. Model of proportions for gypsum in 10 × 10 × 5 m panels at the Punta Alegre deposit according to 50 simulated scenarios.
Applsci 15 10616 g014
Figure 15. Spatial distribution model of the estimation error of the gypsum volume ε B in the 10 × 10 × 5 m panels at the Punta Alegre deposit. The scale is given in cubic meters.
Applsci 15 10616 g015
Figure 16. Frequency histogram of estimation errors ε B of the gypsum volume of the deterministic model ( V B ) and the volume estimated from the gypsum proportion model V E in the 10 × 10 × 5 m panels.
Applsci 15 10616 g016
Table 1. Actual global proportions versus simulated global proportions.
LithologiesCompositesTraining Image
(TI)
Simulated Scenarios
141319253439414650
Overburden0.070.080.080.080.080.080.080.080.080.080.080.08
Gypsum series0.840.820.810.820.820.820.820.810.810.810.820.81
Inter-sterile0.100.100.100.100.100.100.100.110.100.100.100.10
Disclaimer/Publisher’s Note: The statements, opinions and data contained in all publications are solely those of the individual author(s) and contributor(s) and not of MDPI and/or the editor(s). MDPI and/or the editor(s) disclaim responsibility for any injury to people or property resulting from any ideas, methods, instructions or products referred to in the content.