Article

Synclastic Behavior of the Auxetic Core for Furniture Panels

by
Jerzy Smardzewski
* and
Michał Słonina
Department of Furniture Design, Faculty of Wood Technology, Poznan University of Life Sciences, Wojska Polskiego 28, 60-637 Poznan, Poland
*
Author to whom correspondence should be addressed.
Appl. Sci. 2025, 15(19), 10614; https://doi.org/10.3390/app151910614
Submission received: 7 September 2025 / Revised: 24 September 2025 / Accepted: 25 September 2025 / Published: 30 September 2025

Abstract

Featured Application

The results of this work enable the formation of spherical (synclastic) surfaces in the automotive, boatbuilding, and aviation industries using cell cores without the need for additional external forces.

Abstract

The cores of honeycomb panels are usually made of hexagonal cells. Due to their structure, they create anticlastic surfaces that are difficult to use in furniture design. Synclastic surfaces in lightweight sandwich panels are typically associated with auxetic cores characterized by a negative Poisson’s ratio. This study aimed to transform the hexagonal cell cores into cells with a negative or positive Poisson’s ratio (NPR, PPR), enabling these cores to form synclastic surfaces. New core structures for synclastic furniture sandwich honeycomb panels were modeled numerically and experimentally. It has been demonstrated that reentrant cells with NPR create synclastic surfaces, and new shapes of core cells, created by transforming hexagonal cells with PPR, also enable the formation of synclastic surfaces. Cores’ synclasticity was assessed in two orthogonal planes using physical models and Finite Element Analysis (FEA). A new and original discovery is the demonstration that not only auxetic but also modified hexagonal cells with Poisson’s ratios of ν x y = 0.545 and ν y x = 0.512, respectively, exhibit excellent synclastic properties. The agreement between FEA and experiment was very high. The results show that not only NPR but also cell topology provides a practical route to the synclastic formation of cores without the use of auxetic materials.

1. Introduction

Sandwich panels with honeycomb cores are commonly used in the automotive and aerospace industries [1,2,3,4,5]. In furniture and interior applications, paper-honeycomb sandwich panels are valued for their low mass, indentation resistance, and the ability to achieve tight radii and curved skins while maintaining adequate stiffness. Moreover, the air relative humidity and temperature sensitivity of ligno-cellulosic cores motivate climate-controlled testing and design allowances [6,7,8,9]. Sandwich composites with honeycomb structures made from paper are often used as a replacement for metal sheets due to their excellent corrosion resistance [10]. Panels with hexagonal cells are recommended for forming flat structural elements. When forming spherical surfaces, they adopt an anticlastic shape. However, solutions are sought in which the cellular cores are capable of freely forming synclastic surfaces without the need for additional external forces or energy-intensive technological processes. The behavior of an auxetic honeycomb with a negative Poisson’s ratio [11] has also been studied, demonstrating its ability to form synclastic surfaces. Studies have repeatedly shown that materials with auxetic properties are impact resistant and absorb energy well [12,13]. The relevant work for dome-shaped auxetic structures is the paper by Easey et al. [14]. The authors successfully validated the FE models of auxetic cellular domes using them. Very good agreement was achieved between DIC and FE for the onset of buckling and post-buckling response, including strain, displacement, and loads. However, none of the mentioned works describe sandwich synclastic structures prepared from wood-based composites, dedicated especially to the furniture industry.
Some work has shown the bending mechanical performance of a new class of zero Poisson’s ratio lattices designed for large out-of-plane morphing and deformations. The very large bending compliance of these lattices makes them particularly interesting for cellular skin morphing applications involving the use of composite materials [15,16]. It was also noted that angle gradient configurations with a constant cell-wall aspect ratio provide the highest specific critical load, shear modulus, and bending stiffness for composite sandwich panels with a gradient filler. The authors succeeded in minimizing the differences between experimental testing of prototypes and computer modelling of structural deformation under load. Structures with zero Poisson’s ratio can be used to create synclastic sandwich shells [17,18].
Paper structures, commonly used in the furniture industry, have not been extensively studied for the formation of spherical surfaces [19]. There is a technological need in the furniture industry to shape synclastic structures made of bio-materials. Therefore, a research hypothesis was made that the developed nonauxetic core structures and facings made of wood materials can provide the required rigidity and strength of synclastic coatings with a honeycomb structure.
Because the honeycomb panels commonly used in furniture are not suitable for forming synclastic surfaces, it was decided to conduct a more in-depth analysis and modify these structures to enable them to form spherical surfaces freely. The aim of this study was to transform the hexagonal cells core into cells with a negative or positive Poisson’s ratio, enabling these cores to form synclastic surfaces.

2. Materials and Methods

2.1. Materials and Cell Properties

Two materials were used to construct the cells. One was a WoodEpox® composite made from a mixture of epoxy resin and lignin-cellulose pulp as a filler (Abatron, Kenosha, WI, USA). This material is characterized by zero emission of volatile organic compounds (VOCs) and is certified by Greenguard®. The second type of material used was Testliner-2 paper with a thickness of 0.1 mm and a basis weight of 123 g/m2. The paper was produced by HM Technology (HM Technology, Brzozowo, Poland). The material properties were collected in our laboratory and are presented in Table 1 [19,20,21]. It was also planned to obtain cells with the shapes shown in Figure 1 and dimensions listed in Table 2. Due to the shape of the hexagonal cell and its subsequent modifications, they were designated as re-entrant R, hexagonal H, and modified M, respectively.

2.2. Poisson’s Ratios

Previous research indicates that cell structures with negative Poisson’s ratios (so-called auxetics) have a natural ability to form synclastic surfaces [7,19,22,23]. Some studies also indicate that panels with positive but close-to-zero Poisson’s ratios also have the ability to form synclastic surfaces [17,18,24]. With this in mind, we decided to determine the Poisson ratios of selected cells. This will indicate which of the proposed models demonstrate the ability to form spherical surfaces.
For the R and H structures, the Poisson’s ratios are calculated from Equations (1) and (2):
ν x y   =   s i n φ ( h l + s i n φ ) cos 2 φ
ν y x = cos 2 φ h l + s i n φ s i n φ
In the case of M-type cells, Poisson’s ratios could be calculated based on Equations (3) and (4) [17,18,24]:
ν x y   =   3 cos 60 ° φ + 3 sin 60 ° φ 3 3 ( 2   sin 60 ° φ 1 )
ν y x = 3 ( 2 sin 60 ° φ 1 ) 3 cos 60 ° φ + 3 sin 60 ° φ 3
Due to the complexity of the problem, the mechanical properties of all cells were determined numerically using the finite element method. Poisson’s ratios were calculated using Equations (5) and (6), respectively:
ν y x = d X · Y X · d Y   for loading direction Y
ν x y = d L · W L · d W   for loading direction X
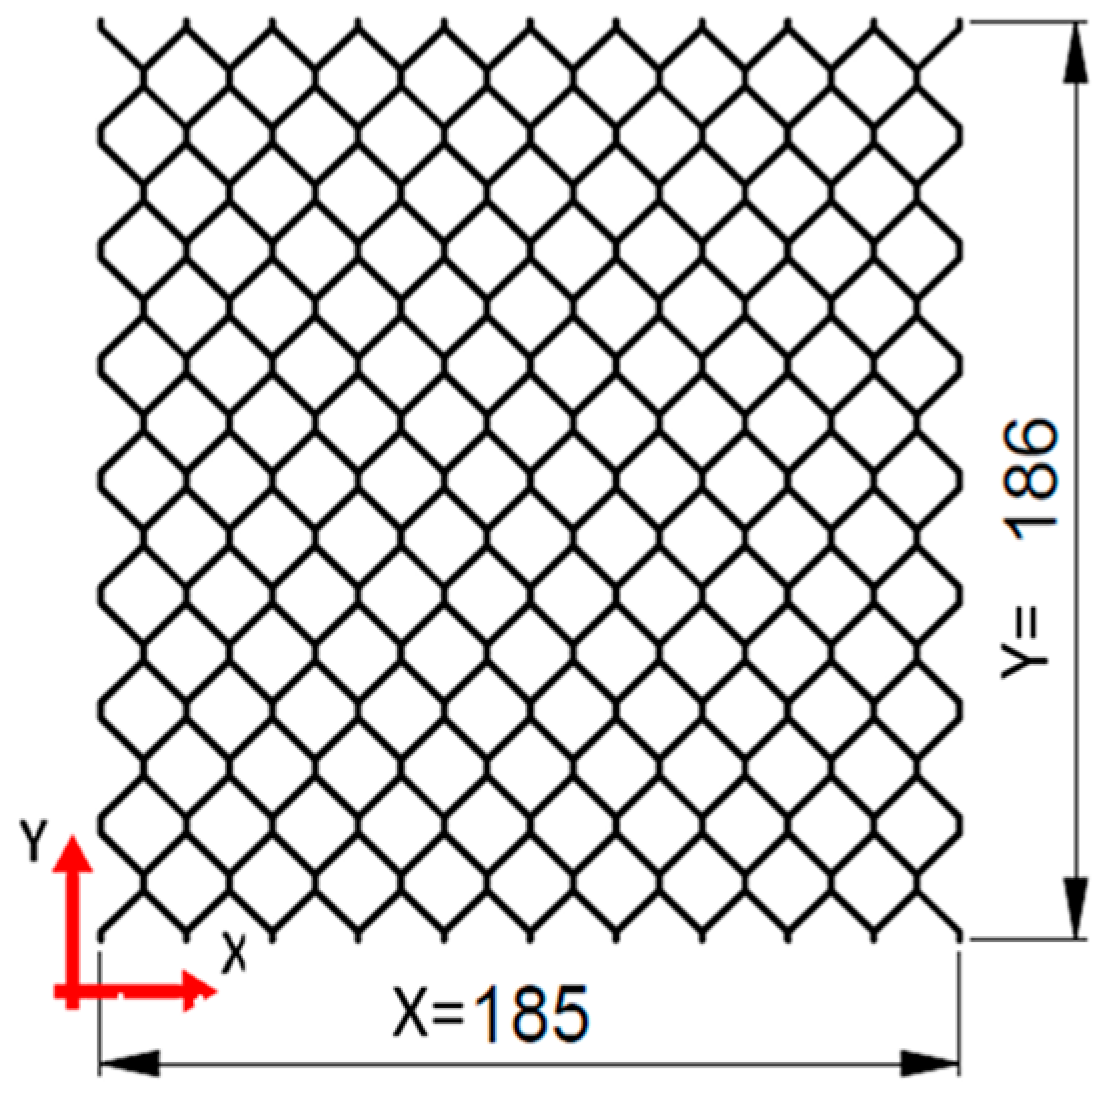
where dX (mm) and dY (mm) are displacements in directions X and Y, X (mm) is the width of the core, and Y (mm) is the length of the core, as in Figure 2.

2.3. Core Samples

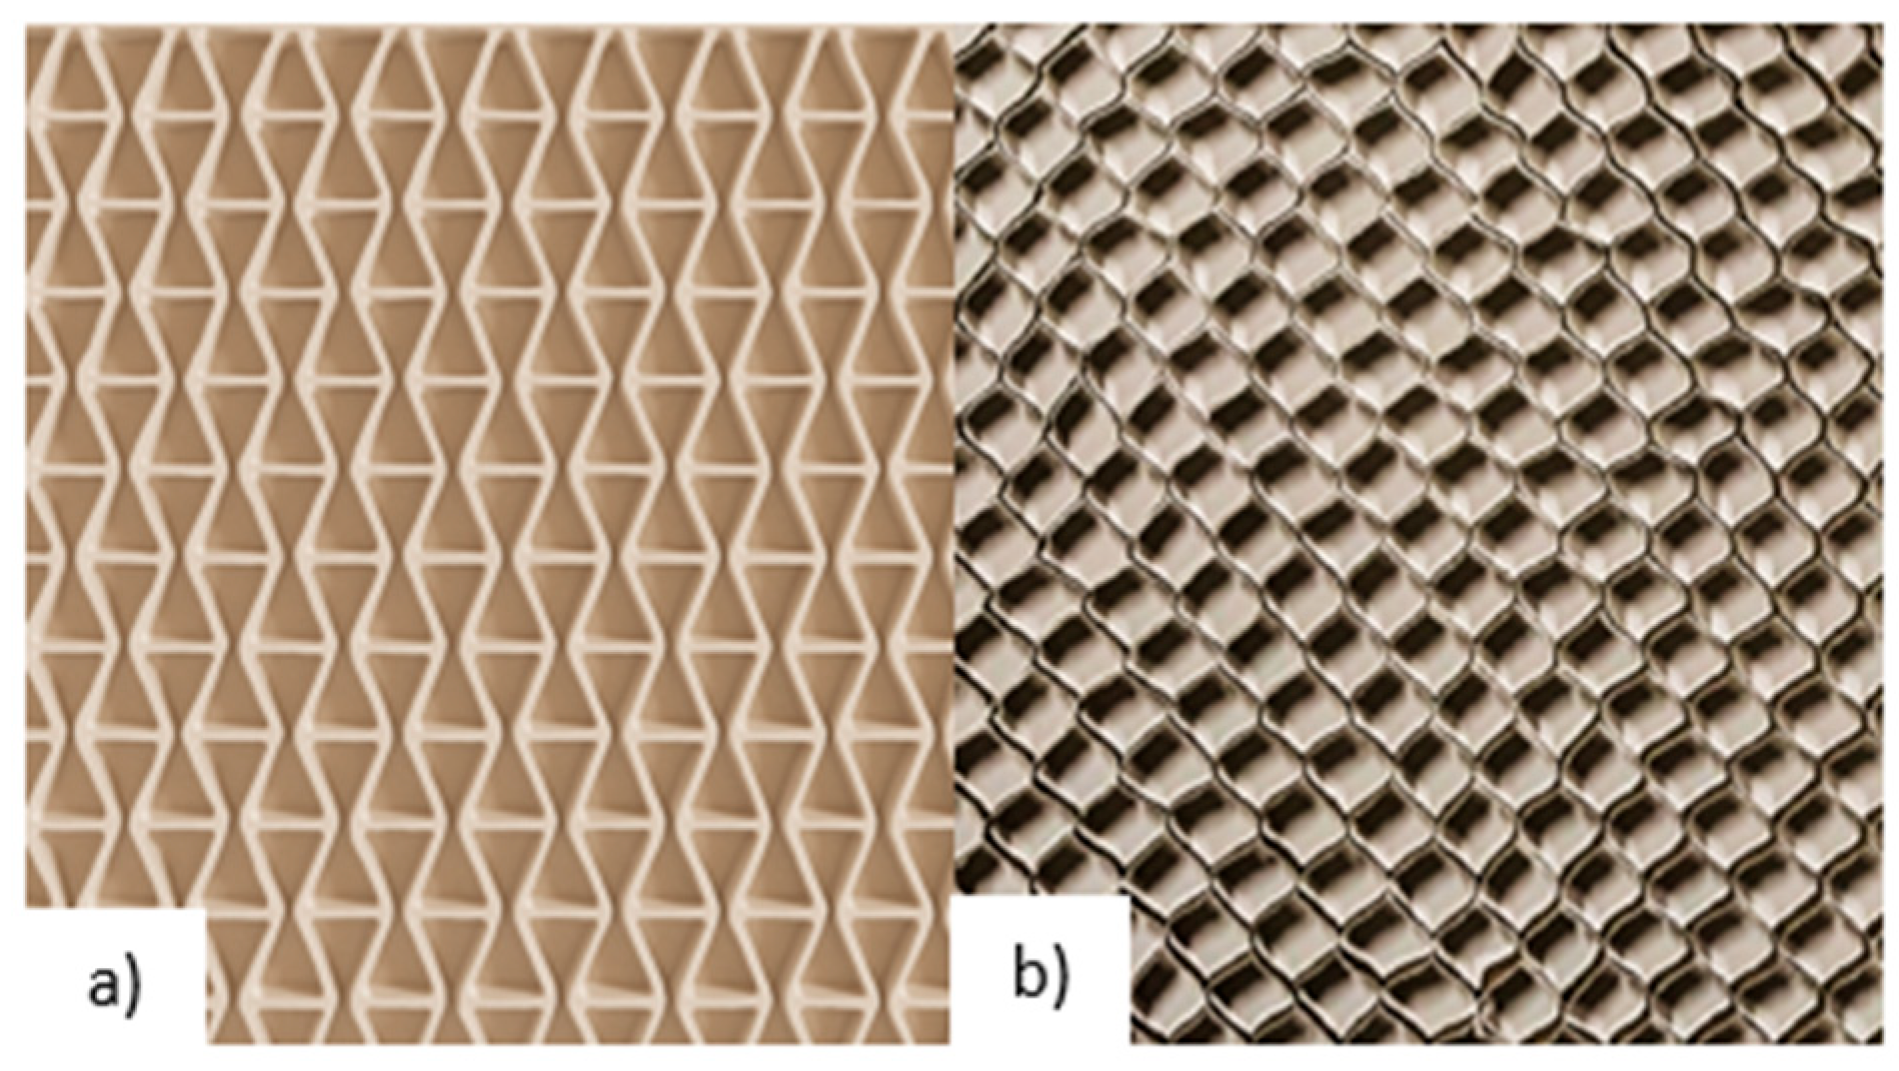
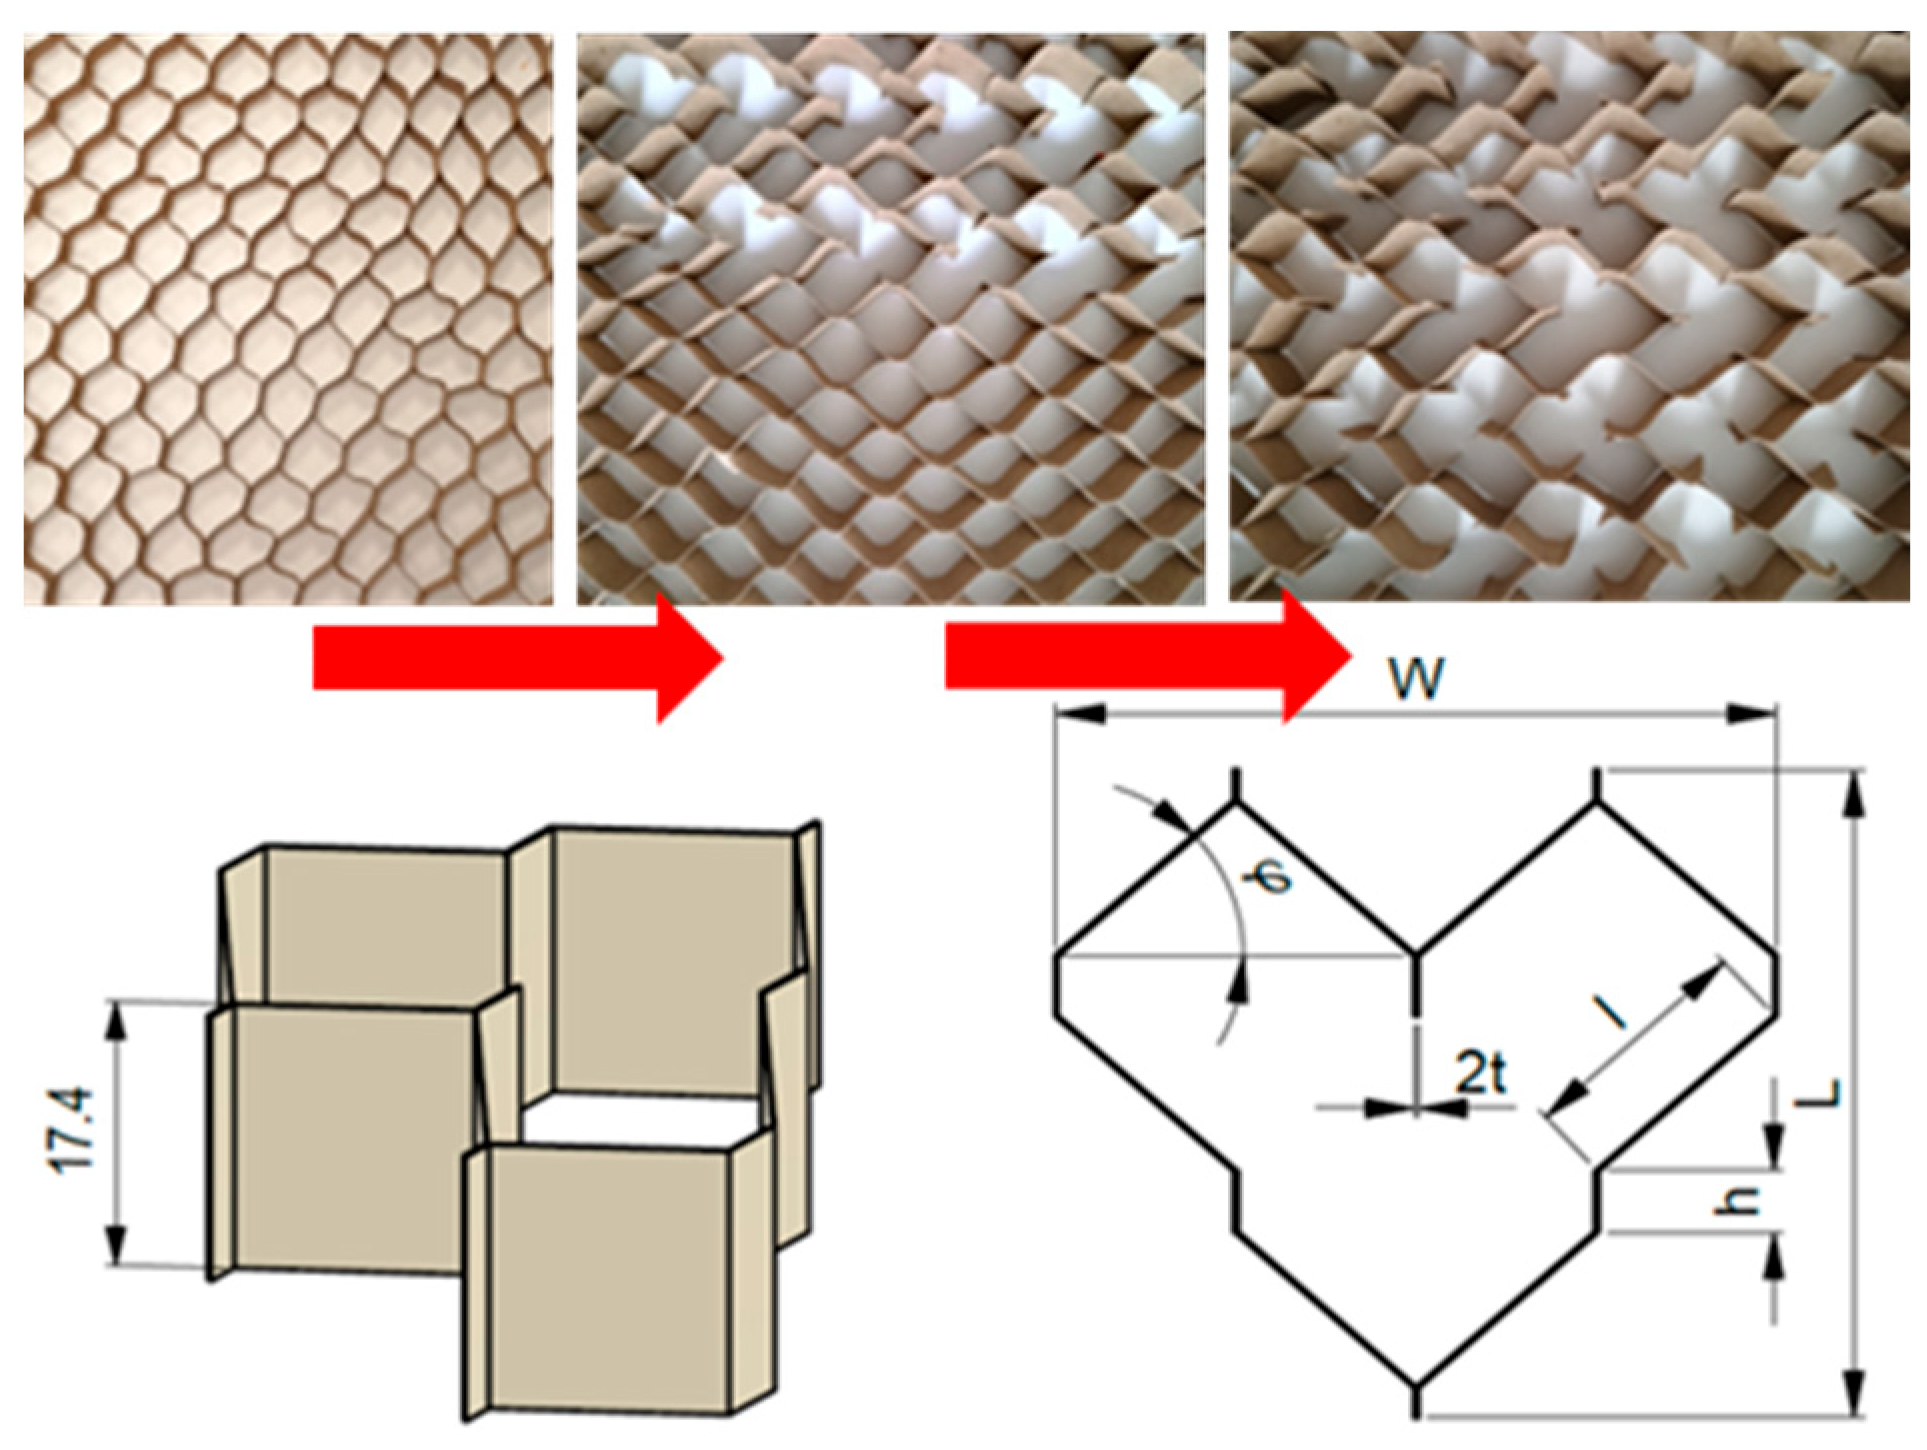
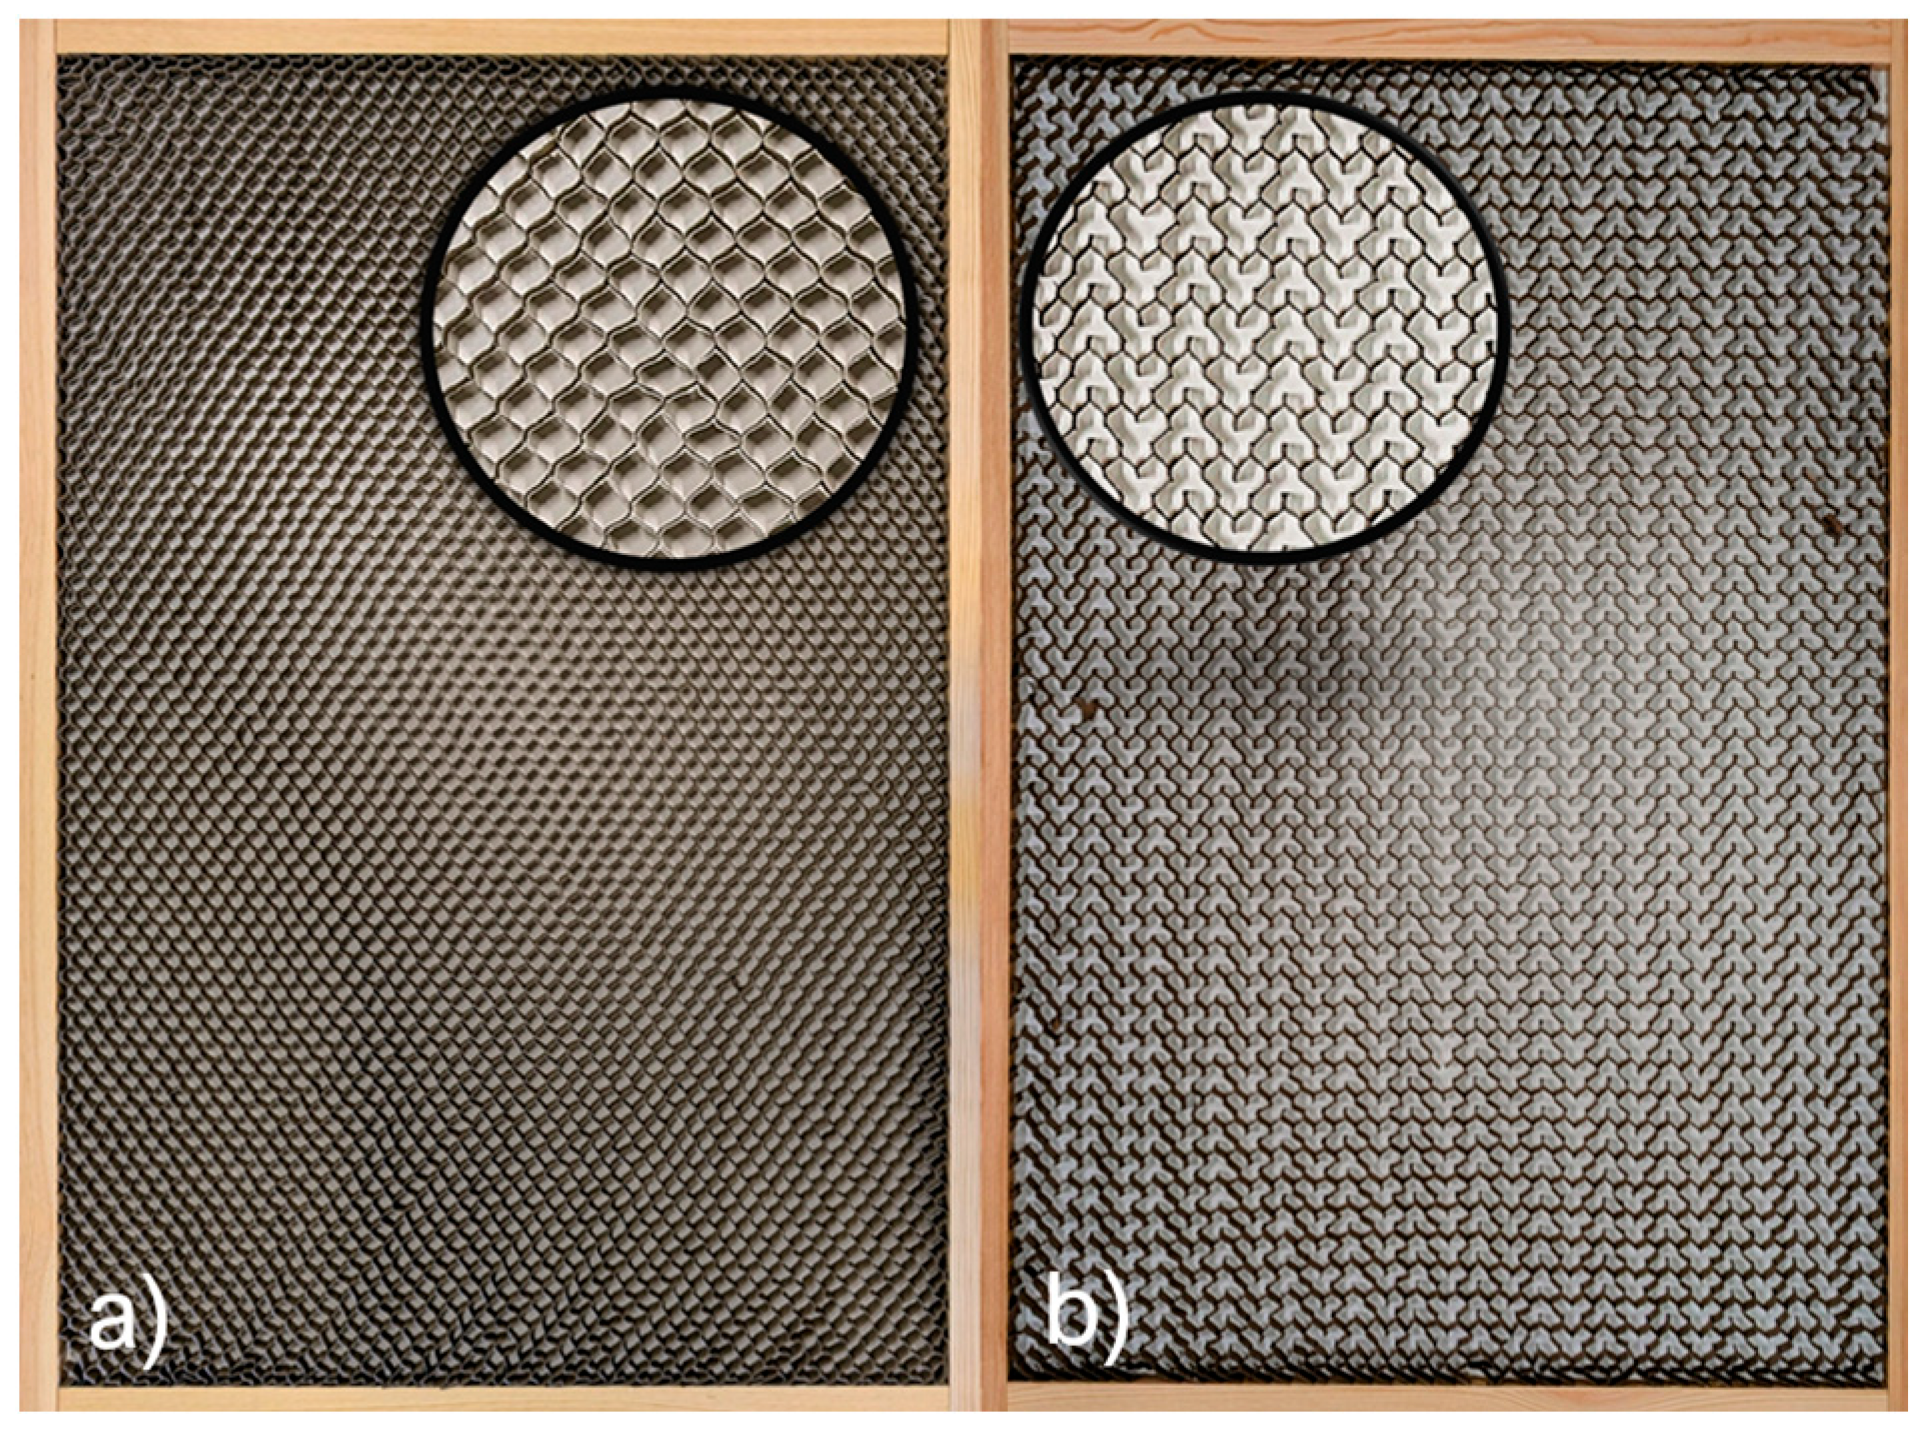
Re-entrant cell cores (Figure 3a) were fabricated by milling a 10 mm thick flat panel made of cured WoodEpox® composite. Milling was performed on a Kongsberg-X milling machine (Kongsberg Gruppen, Kongsberg, Norway) using a HM milling cutter with a 3 mm diameter straight shank (CMT, Poznań, Poland). Paper cores (Figure 3b) were manufactured by HM Technology (HM Technology, Brzozowo, Poland). The cores were seasoned in the production hall at a temperature of 25 °C and a relative humidity of 45% until the sample mass stabilized. First, cores composed of hexagonal cells H were formed (Figure 1). To obtain the modified cell M, three internal cell walls were removed from the cell type H, as illustrated in Figure 4. The cores were then seasoned in the laboratory at a temperature of T = 25 °C and a relative humidity of RH = 45% until the core shape stabilized (Figure 5). The formed cores were used solely to determine the synclastic properties of the model and were not utilized for any other experimental studies.
For the physical tests of R [19], H, and M-type cores, only one specimen of each type was used. This decision was made for two reasons. To ensure consistency with the numerical experiment, which was also conducted on a single model of each core type. The authors’ experience shows that the large size of a core composed of repeating cells favorably influences the homogenization of the entire structure, eliminating the effect of geometric imperfections on its mechanical properties. All registrations were performed in a climate chamber under constant conditions, T = 25 °C and RH = 45%. Cores were seasoned in a frame and cut immediately before testing to preserve cell geometry (Figure 5). During this procedure, no influence of T and RH changes on the measured core deflections was observed.

2.4. Numerical Calculations

2.4.1. Compression Tests

Numerical calculations were performed using the finite element method (FEM) using Abaqus v.6.13 (Dassault Systemes Simulia Corp., Waltham, MA, USA) and the resources of the EAGLE computing cluster at the Poznań Supercomputing and Networking Center. The computational model is presented in Figure 6. A nonlinear model was selected for the calculations, taking into account the geometric and material nonlinearity of the individual structures. The elastic properties of the materials are presented in Table 1. Additionally, the constitutive relations for all materials used in the finite element models are presented in Figure 7. C3D8R (an 8-node linear brick, reduced integration, hourglass control) finite elements were used for the modeling, with an approximate global element size of 0.25 mm. The number of nodes was, on average, 320,000, and the number of elements was 190,000. Calculations were performed for loads in the Y-axis direction and then in the X-axis direction, recording the corresponding deformations in both directions. A load imposing a displacement of 10 mm in the direction of the force was assumed.

2.4.2. Bending Test

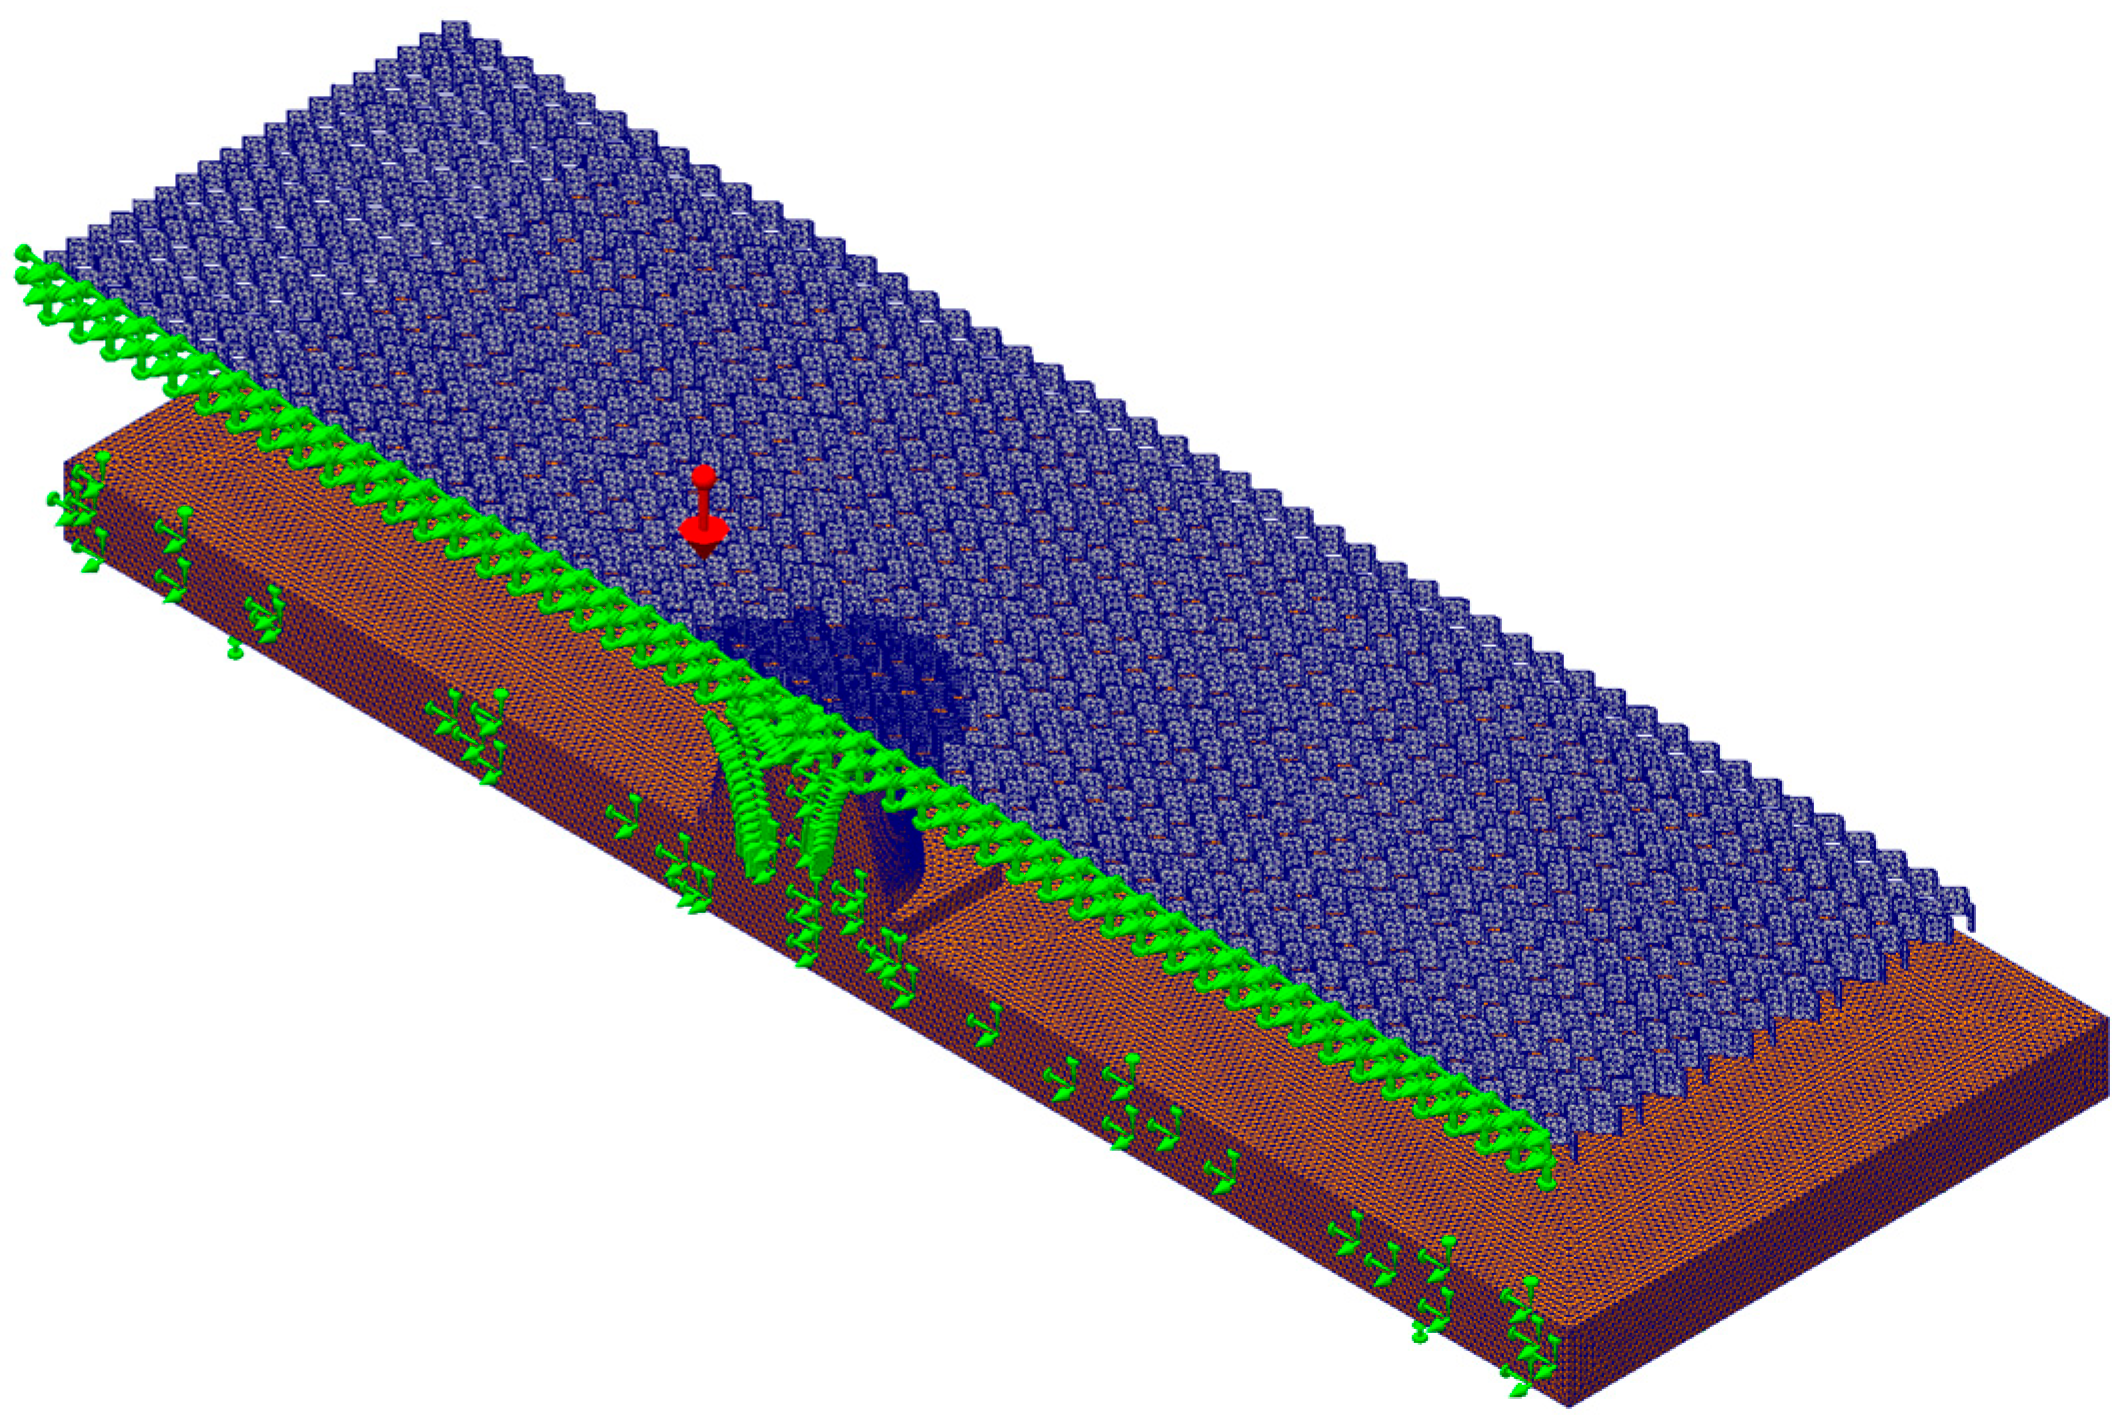
A detailed description of the numerical modeling of cores with re-entrant cells is presented in [19]. Therefore, it was decided to present only the method of modeling cores with H and M types of cells, because the calculations of these structures were performed using SolidWorks 2023 SP5.0 software (Dassault Systèmes SolidWorks Corporation, Waltham, MA, USA). The model dimensions were set to 1140 mm × 635 mm for the M-type core and 1180 mm × 585 mm for the H-type core. A nonlinear static analysis with large displacements (On) and small strains (Off) was performed (Newmark time integration, Newton–Raphson iterations, Direct Sparse solver, automatic stepping 0–1 s). The material followed Table 1 (plasticity with an input σ–ε curve). Geometric symmetry (¼ model) was exploited to reduce computational cost. The model reproduced the actual contact conditions of the core with a spherical support, represented by a hemisphere with a radius of 66 mm. Surface-to-surface contact was defined between the core and the dome, with a Coulomb friction coefficient of 0.2. A blended curvature-based mesh (High Quality, 16-point Jacobian check) was used, with a size ranging from 2 mm to 10 mm, resulting in 385,509 nodes and 195,432 elements. Additional runs with mesh sizes of 0.1 mm to 5 mm, resulting in 1.14 × 10⁶ nodes and 0.57 × 10⁶ elements, did not materially change the deflection profiles or agreement metrics (see below). Solid (tetrahedral) elements were preferred over shells to capture through-thickness stiffness and contact compliance near the spherical support. The applied load was gravitational, corresponding to the core’s self-weight under an acceleration of −9.81 m/s2 (Figure 8). The mechanical properties of the paper are summarized in Table 1.
The quantitative bending comparison was limited to H and M cores manufactured from the same paper to isolate topological effects. It was necessary because significant disparities in mechanical properties and manufacturing processes exist between R, H, and M systems. This heterogeneity definitely confounds comparative bending analyses. For these reasons, the R core (WoodEpox®) is included as an auxetic baseline and was not used for cross-material bending benchmarks, because, as shown in the work [15], R-type structures guarantee synclastic surfaces.
Synclasticity assessment was based on the analysis of core surface point displacements in two orthogonal planes, for both experimental and numerical tests. Actual deformation was documented photographically, using measurement points to enable correlation of the image with the simulation data (Figure 9). A positive core surface deflection value in both orthogonal planes was a sufficient criterion for assessing core synclasticity. To quantitatively assess the agreement between the actual and calculated results, the following were used:
  • RMSE (Root Mean Square Error)—a measure of the mean absolute error expressed in mm:
R M S E = 1 n i = 1 n x i x i 2
where n number of observations, x i actual value, x i estimated value.
  • MAX error—indicating the largest observed difference between the displacement values of the FE model and the actual measurement:
    M A X   e r r o r = max x i x i
  • AUC (area between curves)—defining the total geometric discrepancy between deformation curves (approximate numerical integration):
A U C = i = 1 n 1 x i x i + x i + 1 x i + 1 2 t i + 1 t i
where t i + 1 t i step, distance on the x axis.
  • DTW (Dynamic Time Warping)—a method of comparing curves while allowing for local X-axis shifts. The minimum sum of path-fit deviations (ω) between two sequences (X = x1, …, xn) and (Y = y1, …, ym):
D T W = min w i , j w d x i , y j
where d x i , y j local distance measure, w warping path.

3. Results

3.1. Poisson’s Ratios

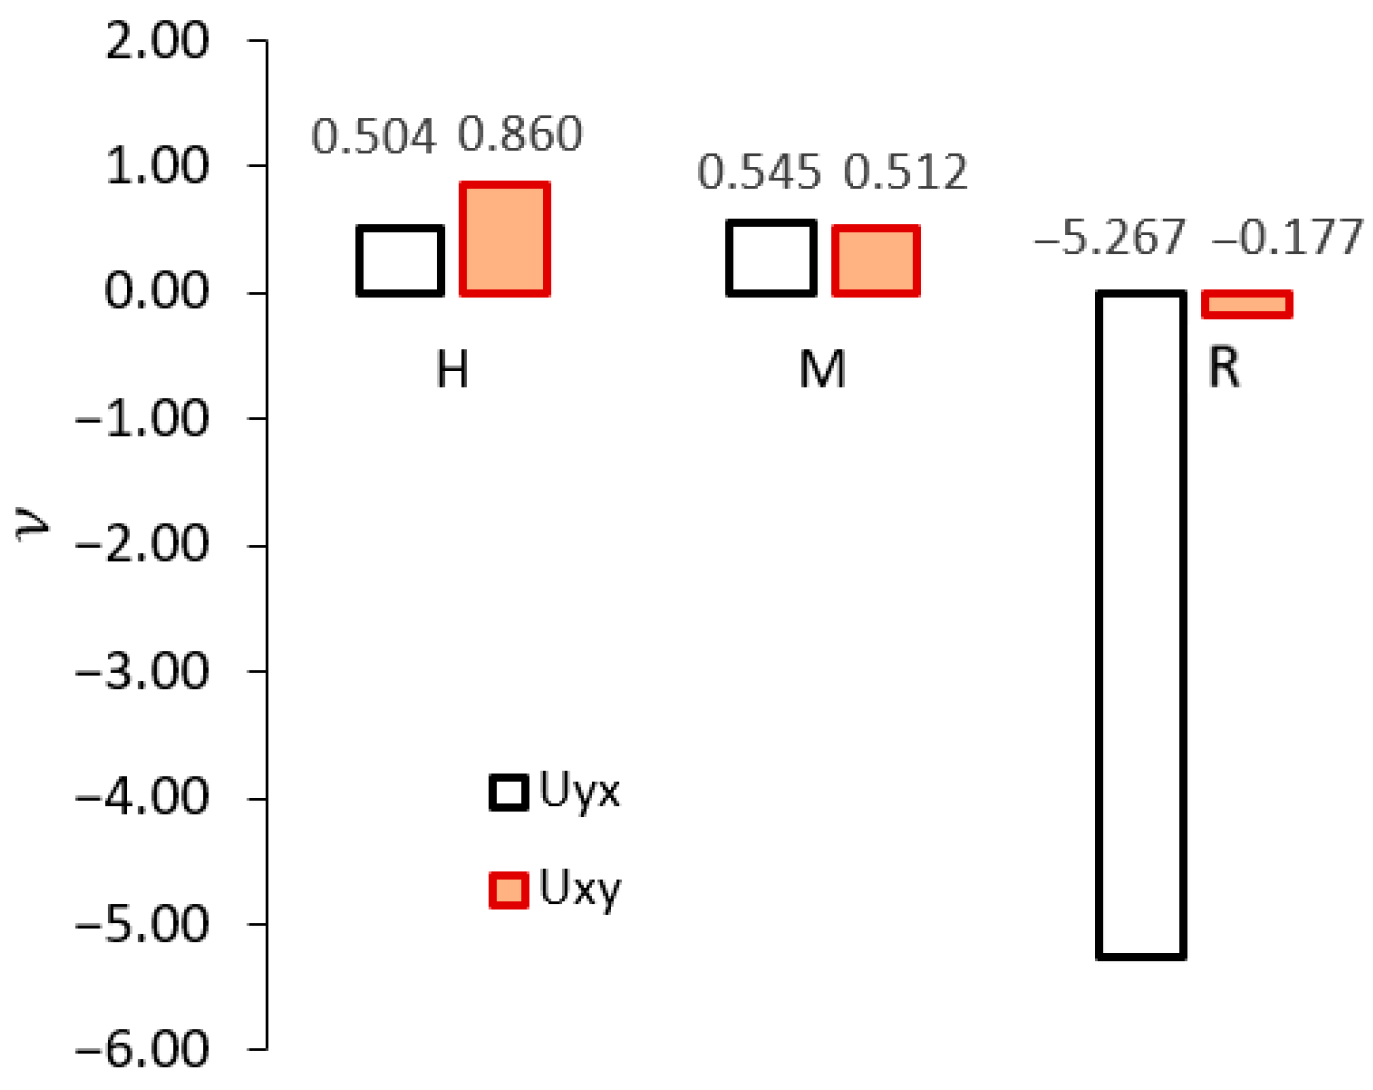
Figure 10 shows that the lowest (negative) value of Poisson’s ratio is shown by cell R for the load direction along the Y axis ( ν y x = −5.2667). In the transverse direction, Poisson’s ratio also has a negative value ( ν x y = −0.1774). The results of the experimental tests presented in the work [25], confirm the consistency of the obtained values with the results of numerical calculations for the same R-type cell. In the case of H-type cells, the corresponding Poisson’s ratios are ν x y = 0.8596 and ν y x = 0.5044, respectively. On the other hand, type M cells show similar values of Poisson’s ratios for both load directions ν x y = 0.5452 and ν y x = 0.5116. Taking the above into account, further research efforts were mainly focused on assessing the synclastic capacity of H and M type cores. It is obvious that cells with a negative Poisson’s ratio will form synclastic surfaces.

3.2. Synclastic Behaviors

The research published in the work [19] demonstrates that the analyzed cells of type R contribute to the synclasticity of the cell core in the sandwich panels (Figure 11).
Below, we present the broader bending analysis results for the H- and M-type cellular structures, obtained both from the FEM model and the actual experiment. The experimental strain values were used as a reference point. The behavior of the H- and M-type cores was then analyzed based on these data. The evaluation was performed by comparing the displacement distributions in two orthogonal directions.
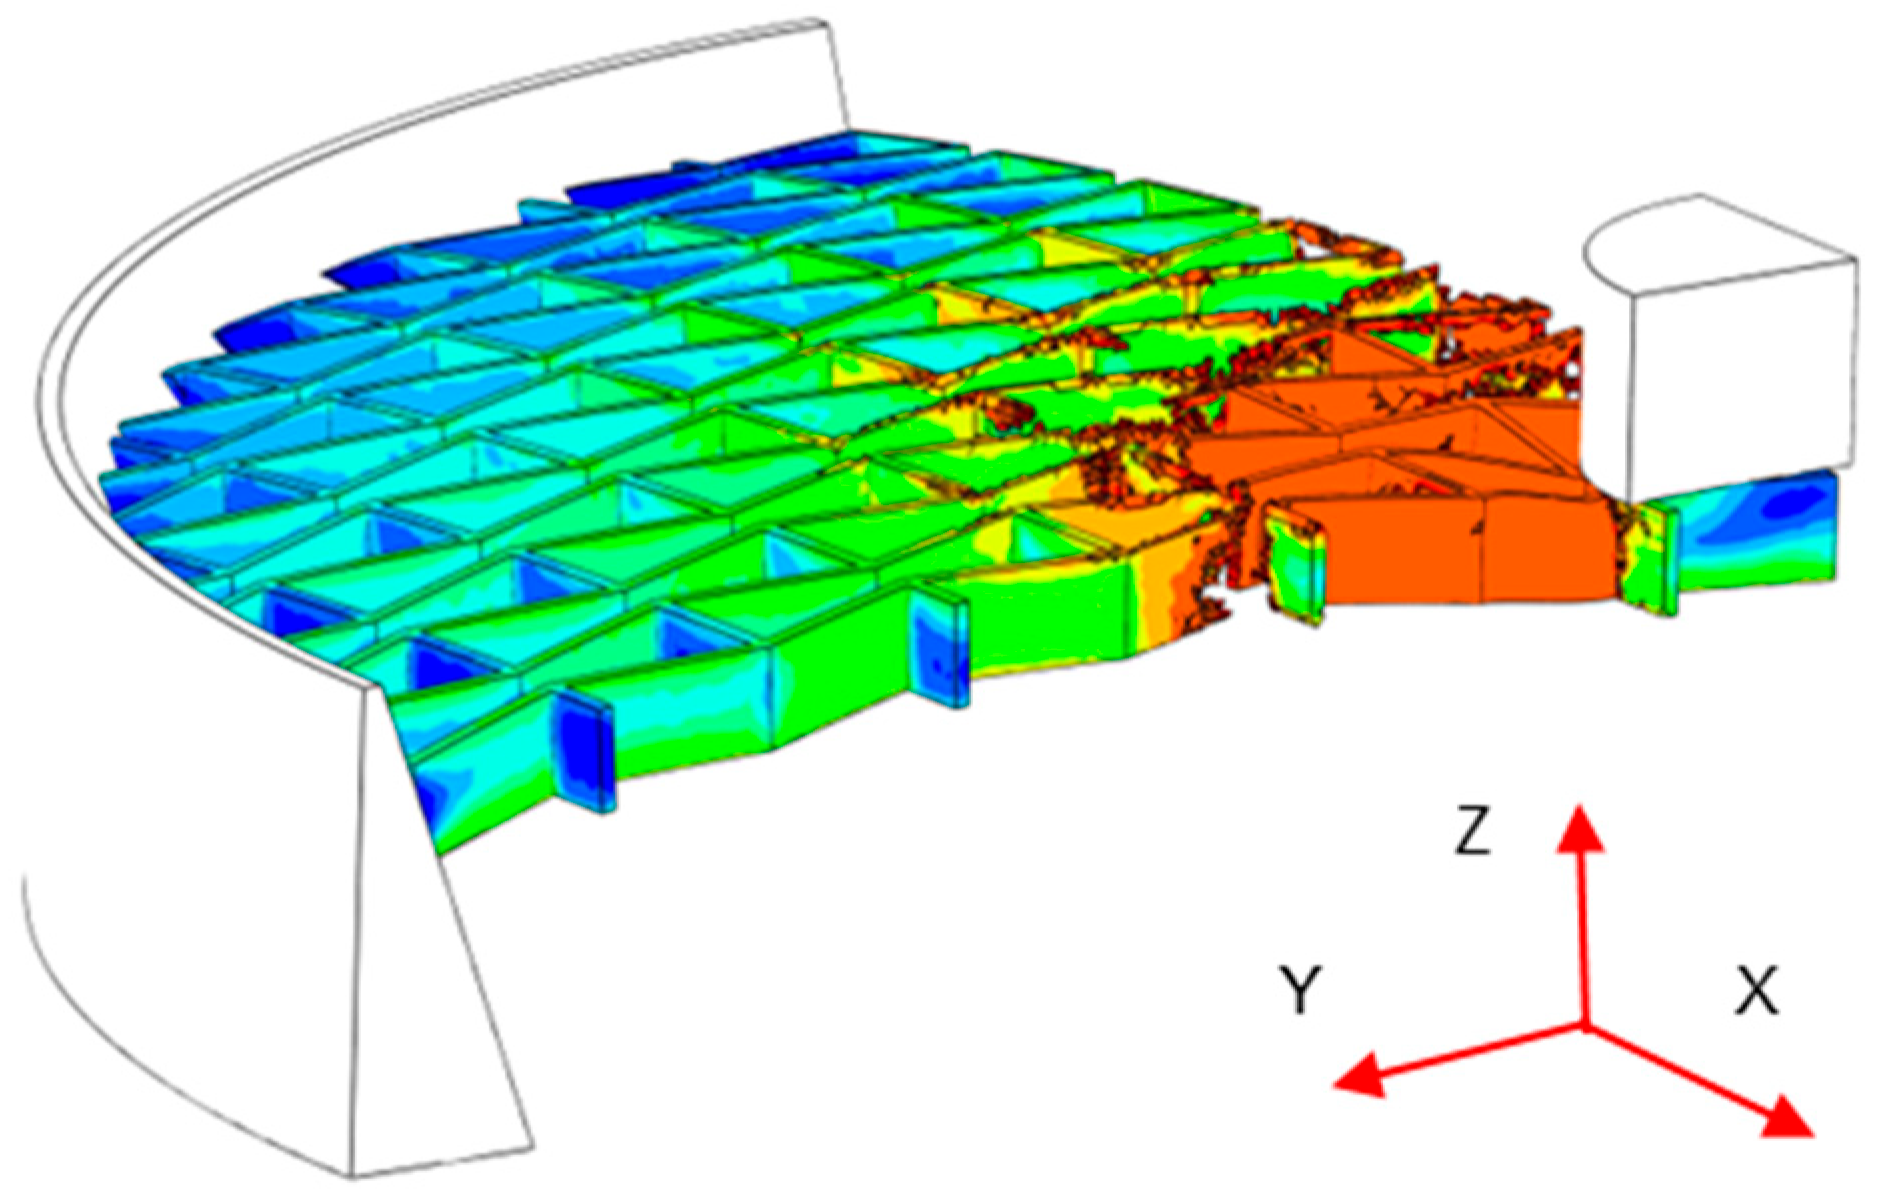
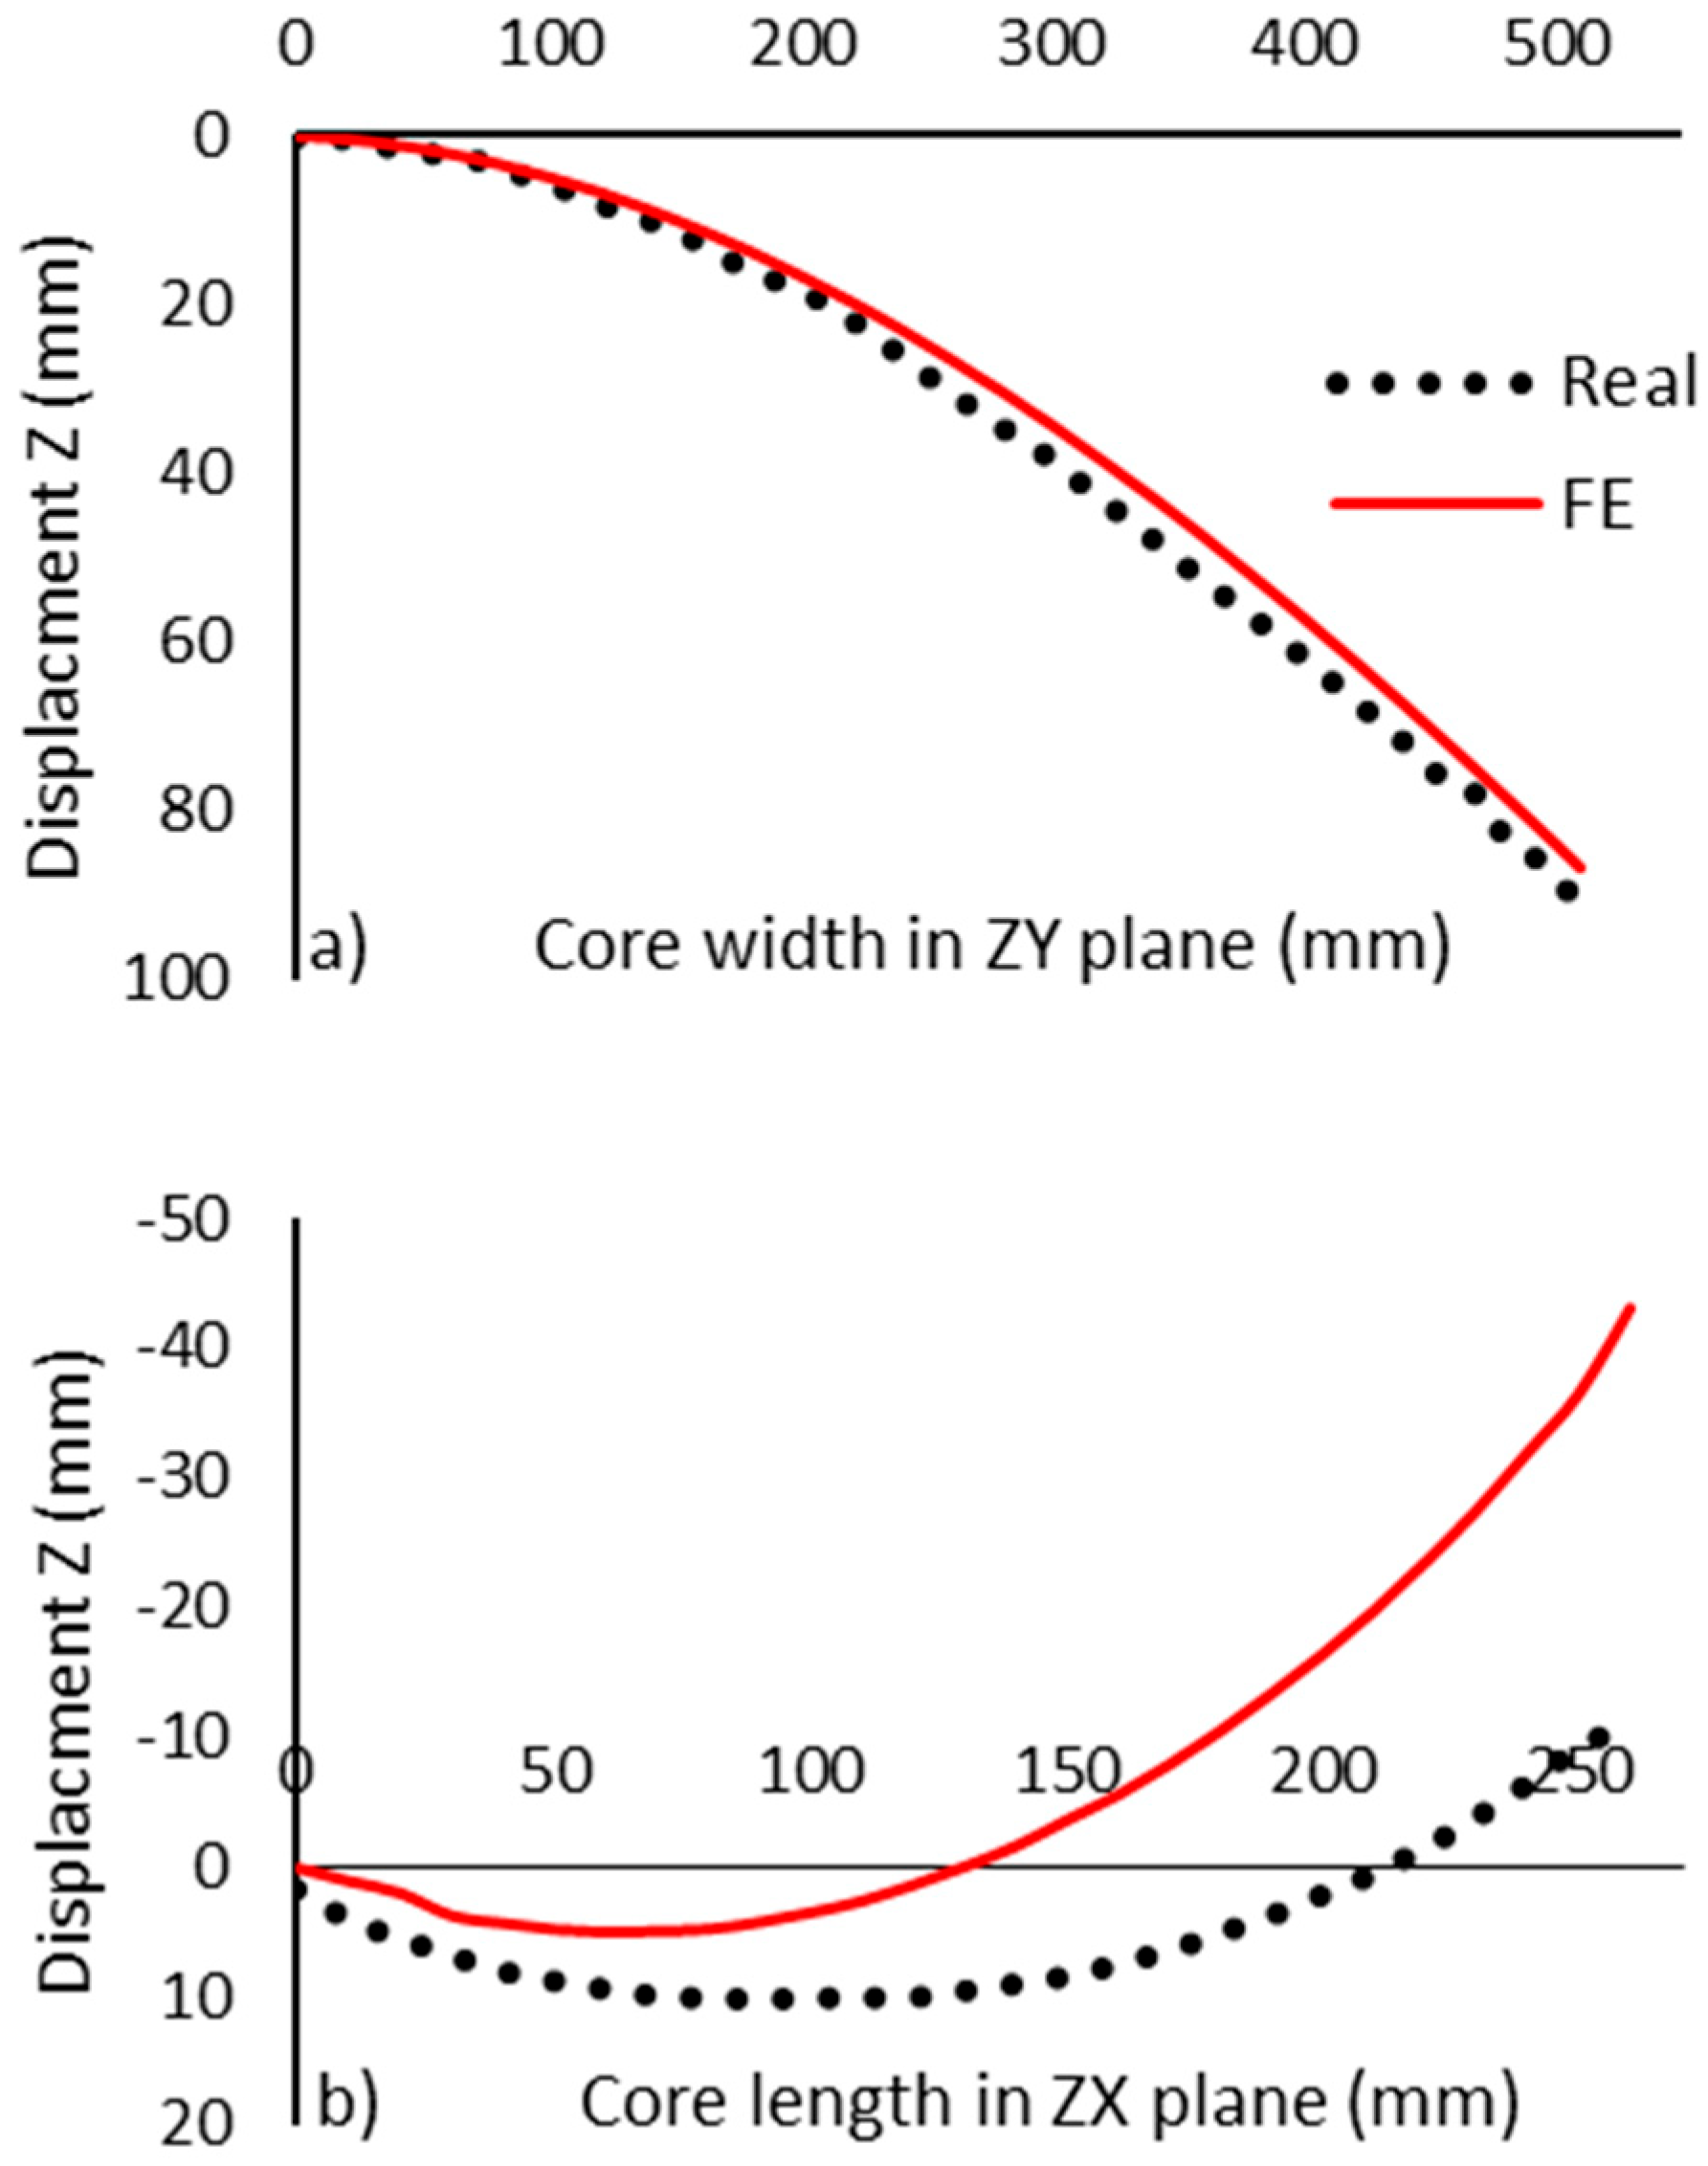
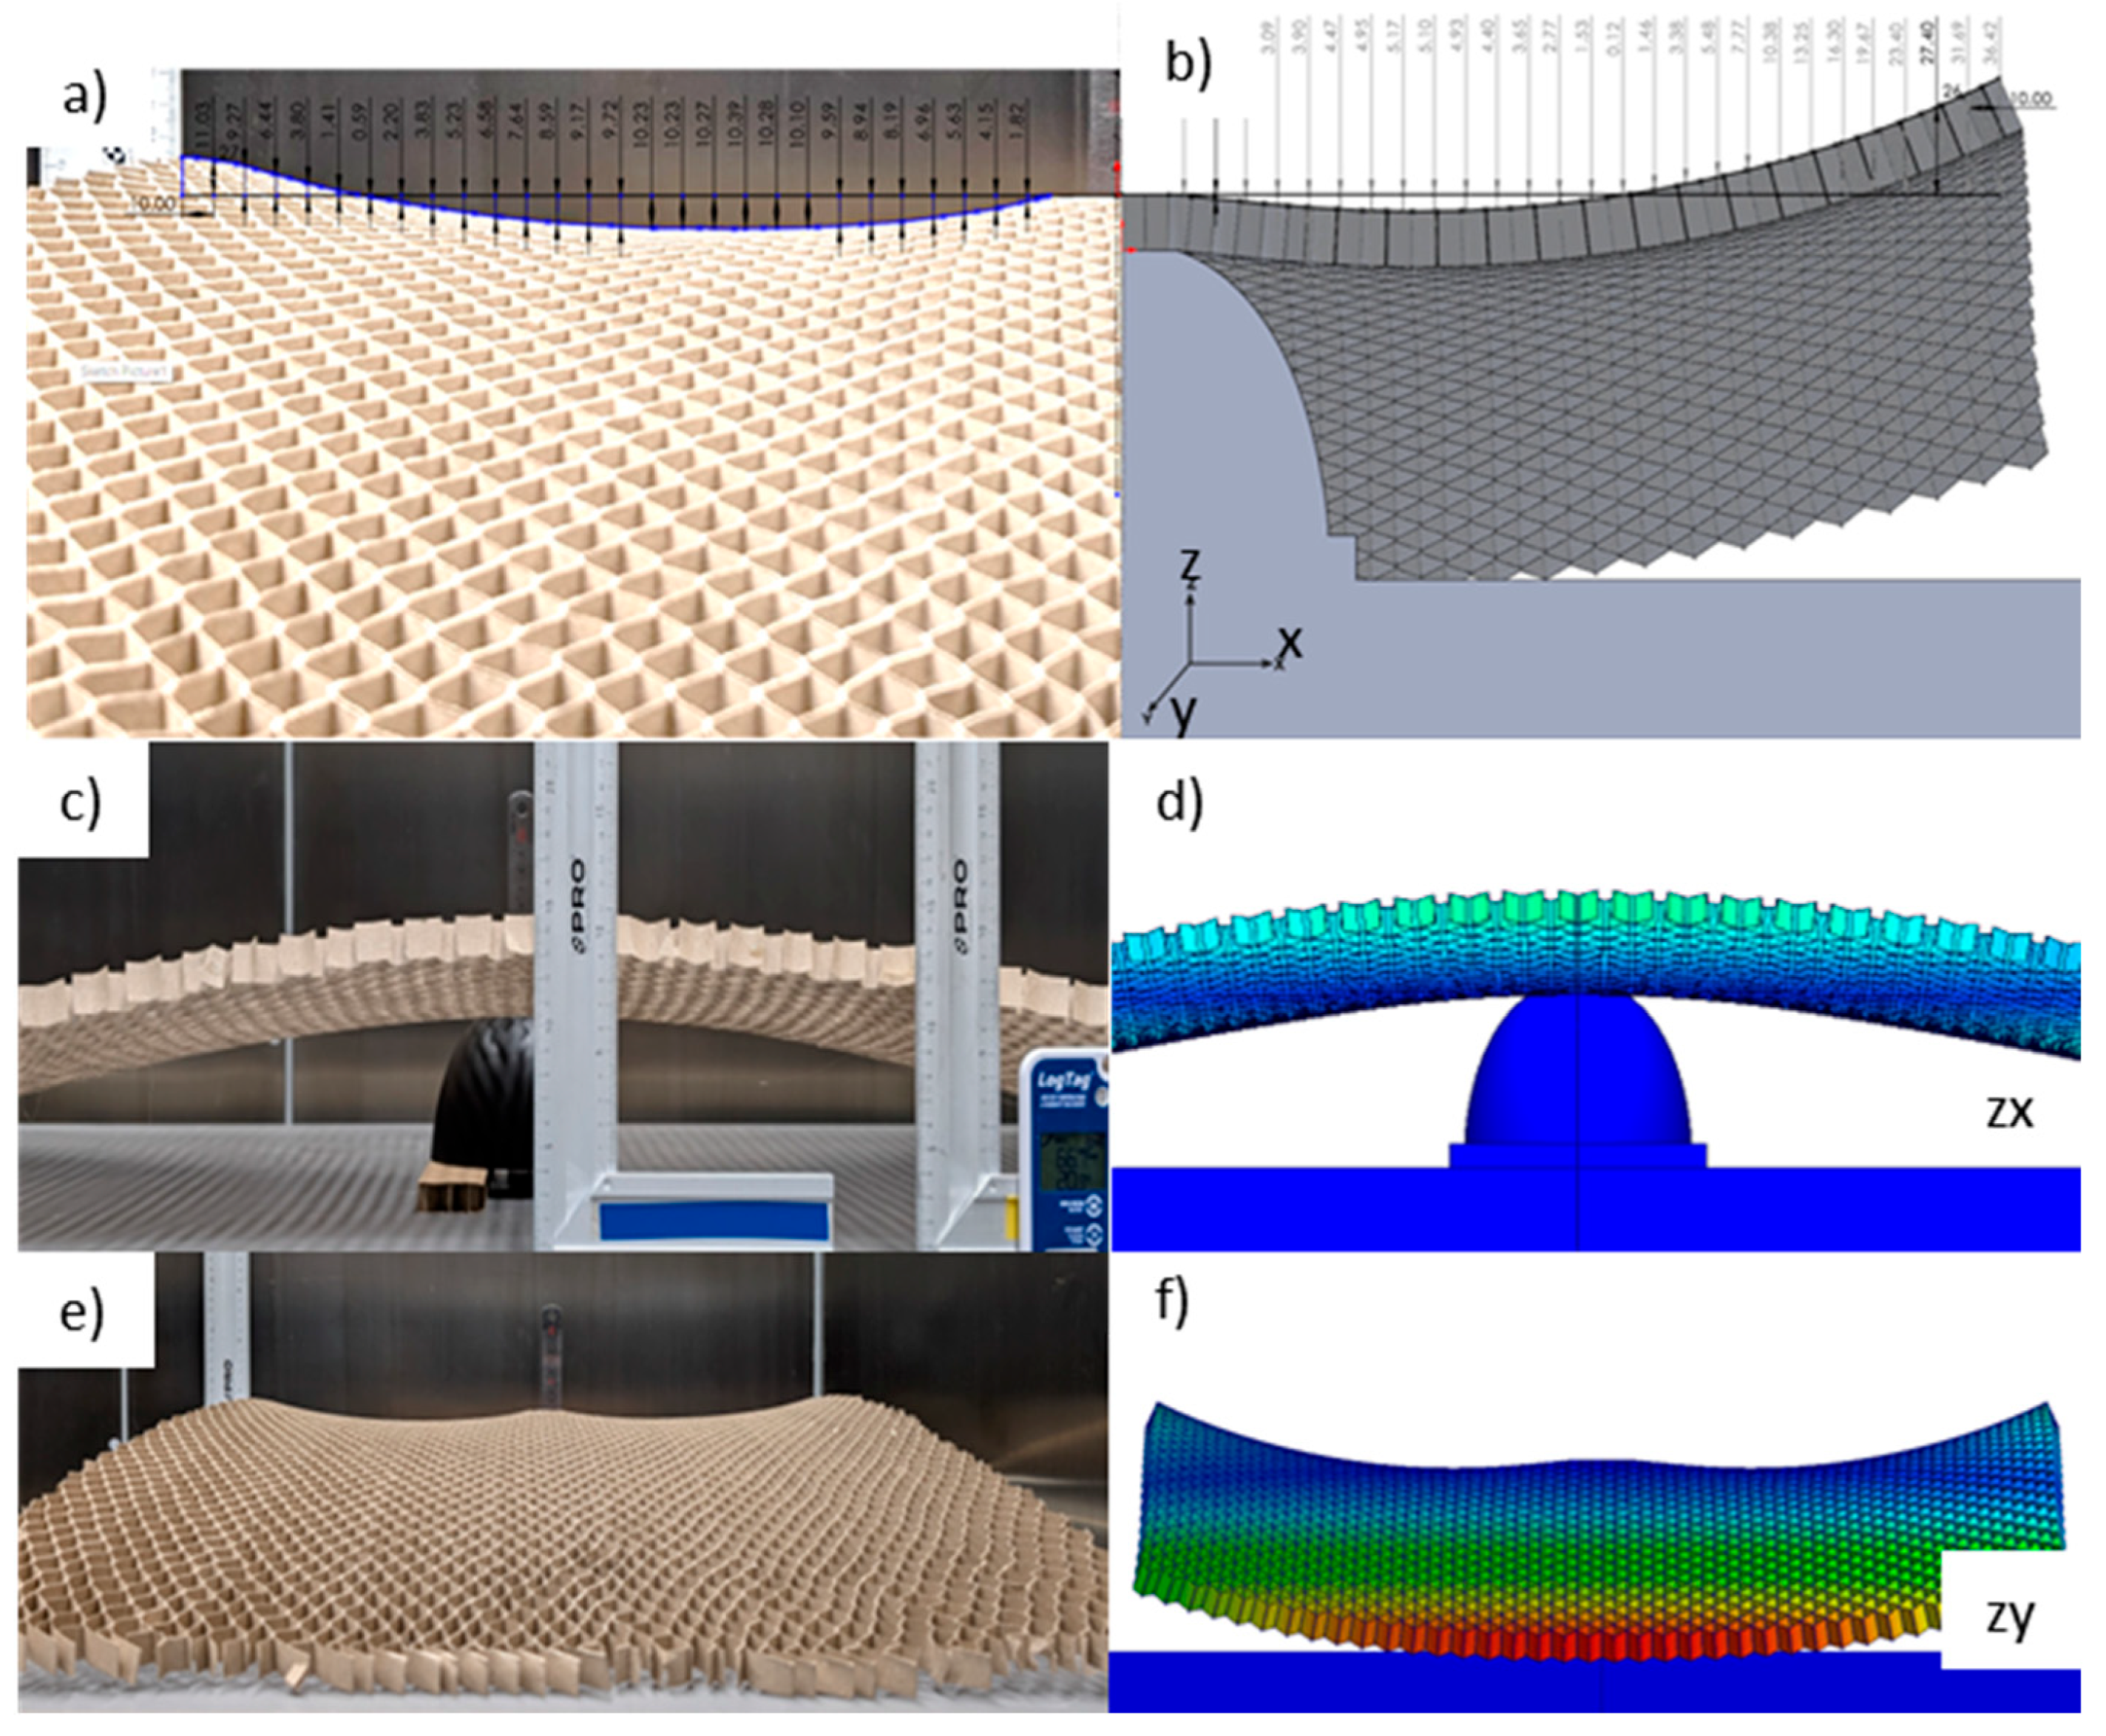
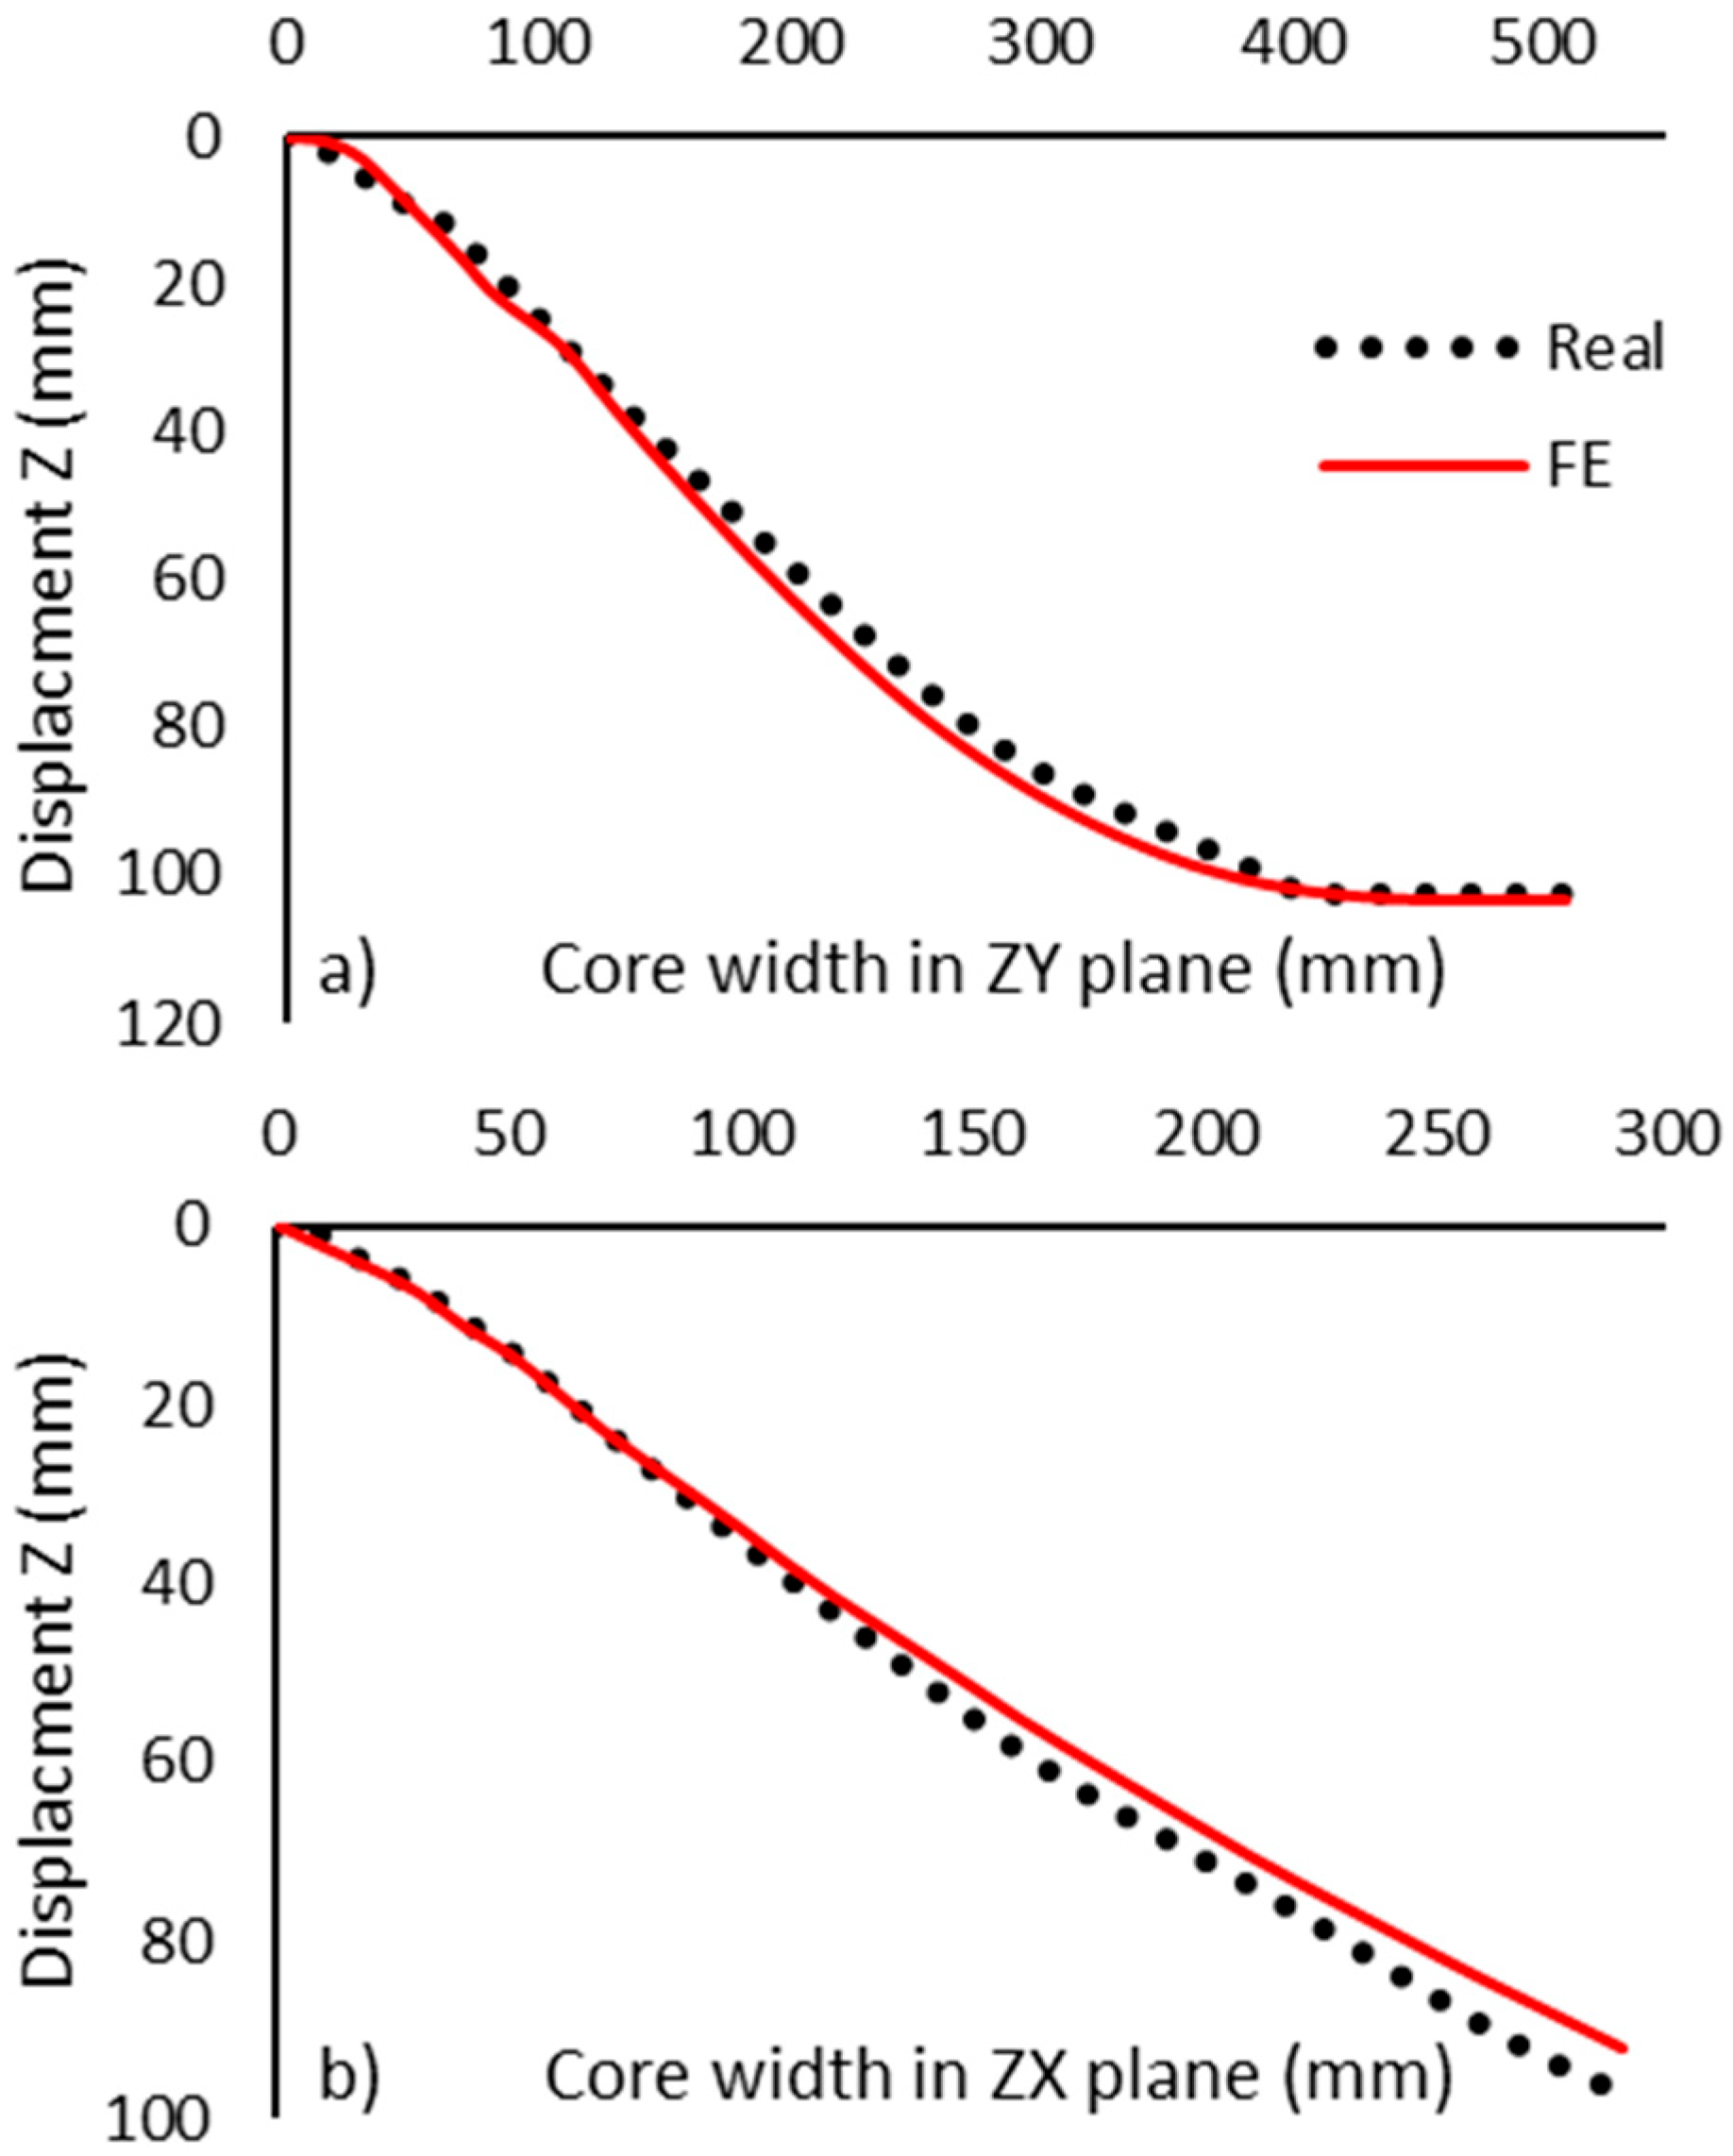
Deformation analysis of the H core confirmed the typical anticlastic deformation of hexagonal cellular structures. Therefore, the experimental core deflection values in the ZY plane were in good agreement with the numerical simulation results (R2 ≈ 0.99, RMSE = 3.4 mm, AUC = 5.58%, DTWavg = 0.45 mm, Table 3). Figure 12a also show that the deflection profiles of both models almost coincide. The apparent deviations are local and do not alter the global trend, as confirmed by the low average DTW of 0.45 mm and the relatively small area between the curves (AUC = 5.58%). This indicates that the numerical model correctly represents the global deflection along this axis. At the same time, in the ZX plane (Figure 12b and Table 3), significant discrepancies between experimental and numerical deflections appeared (RMSE = 14.67 mm, NRMSE = 68.5, AUC = 307.67%, DTWavg = 4.81 mm). Figure 13 shows that the differences are mainly due to local phase shifts and local imperfections (e.g., cell wall buckling), which strongly increase the RMSE/AUC value to 14.67 mm and 307.67%, respectively, while the DTW of 4.81 mm indicates that the overall shape of the anticlastic surface and the order of the measurement results remain consistent. Consequently, the discrepancies are local in nature. The AUC index, on the other hand, captures the overall geometric discrepancy between the runs and additionally confirms that in the ZX plane, the H structure deforms in a less predictable manner than in the ZY plane. Thus, the observation [26] that H structures with a positive Poisson’s ratio deform anticlastically is confirmed. One curvature is positive and the other negative.
In summary, the above analysis confirms the well-known pattern that cores with hexagonal cells, characterized by a positive Poisson’s ratio, form anticlastic surfaces. Therefore, further modification of the cell shape to the M-type model should improve synclastic properties.
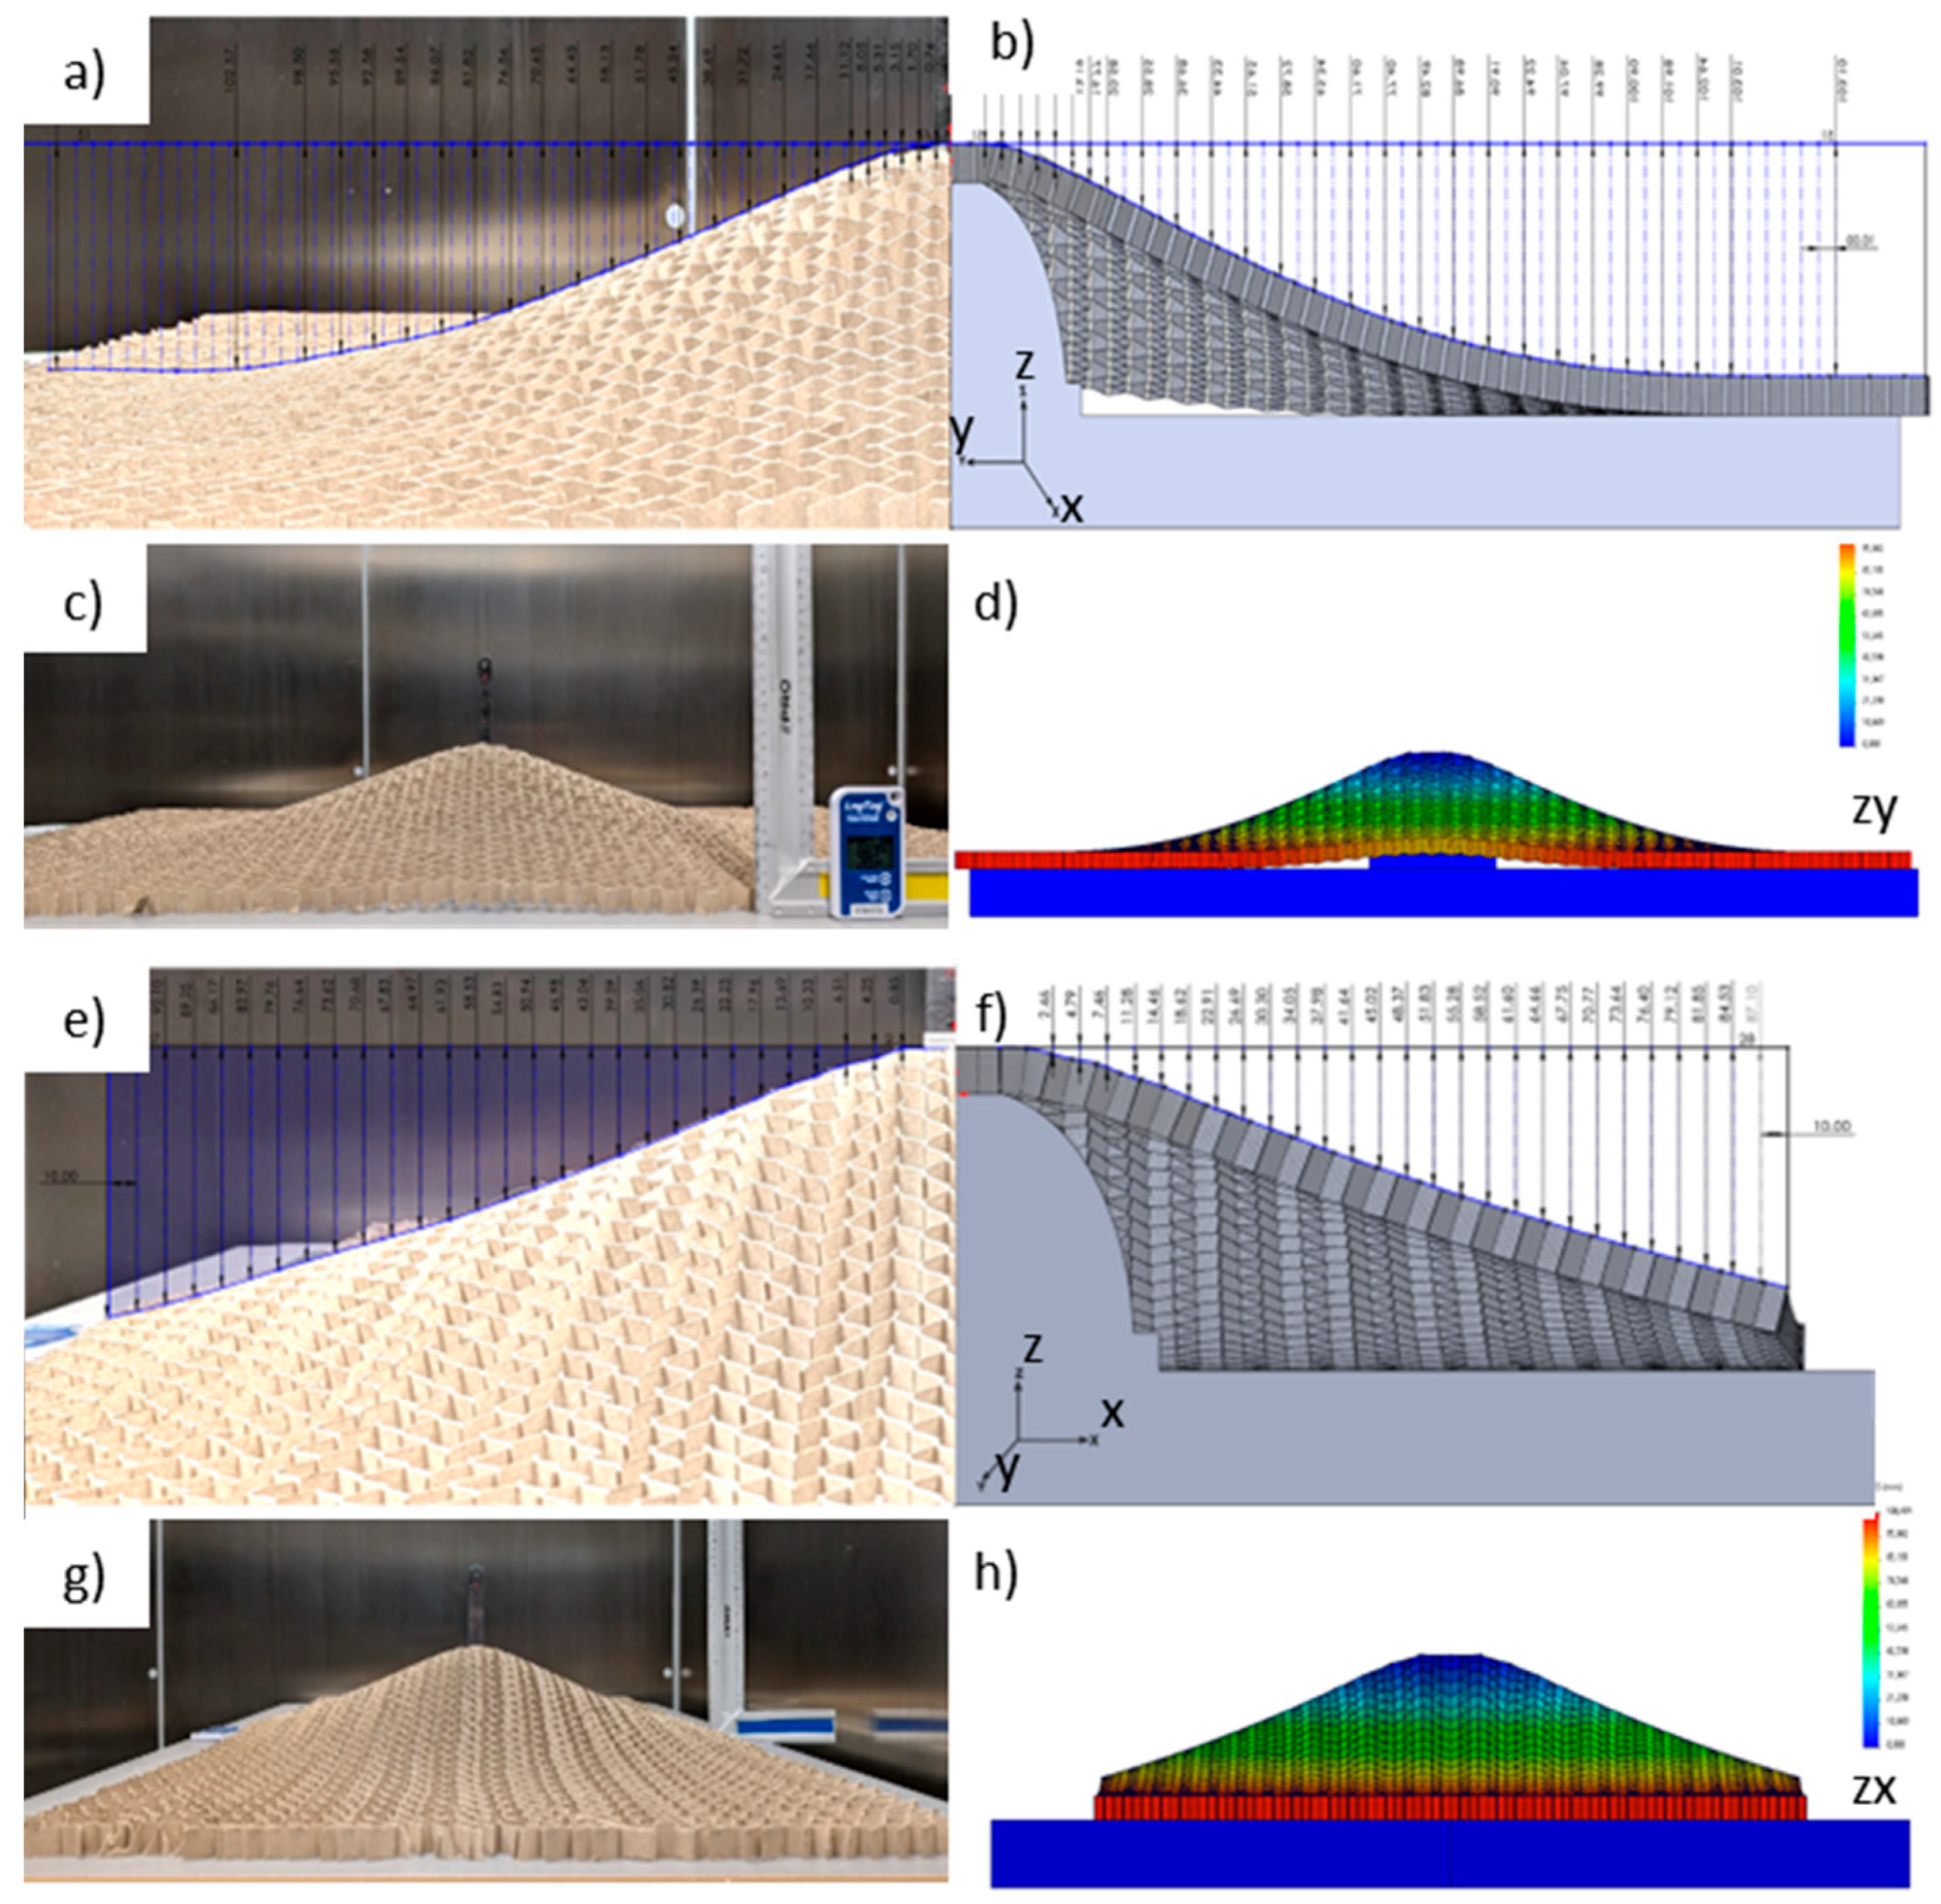
Similarly to the case of core H, the displacement values obtained for the modified core type M are summarized below. In the ZY plane (Figure 14a; Table 4), high convergence of the experimental results and the numerical model was obtained (R2 ≈ 0.999, RMSE = 2.40 mm, AUC = 1.73%, DTWavg = 0.61 mm). The experimental and numerical profiles in Figure 15a–d are practically identical, and the differences are local, not affecting the quality of the synclastic form. This is confirmed by the low AUC and DTW values of 1.73% and 0.61 mm, respectively. In the ZX plane (Figure 14b; Table 4), the fitting accuracy between numerical and experimental results also remains high (R2 ≈ 1.000, RMSE = 2.81 mm, AUC = 4.78%, DTWavg = 0.86 mm). Figure 15e–h illustrate a high degree of agreement between the FEM and experimental values. The low AUC value of 4.78% indicates a very good match between the numerical calculations and experimental measurements. The DTW coefficient of 0.86 mm confirms the absence of significant phase shifts.
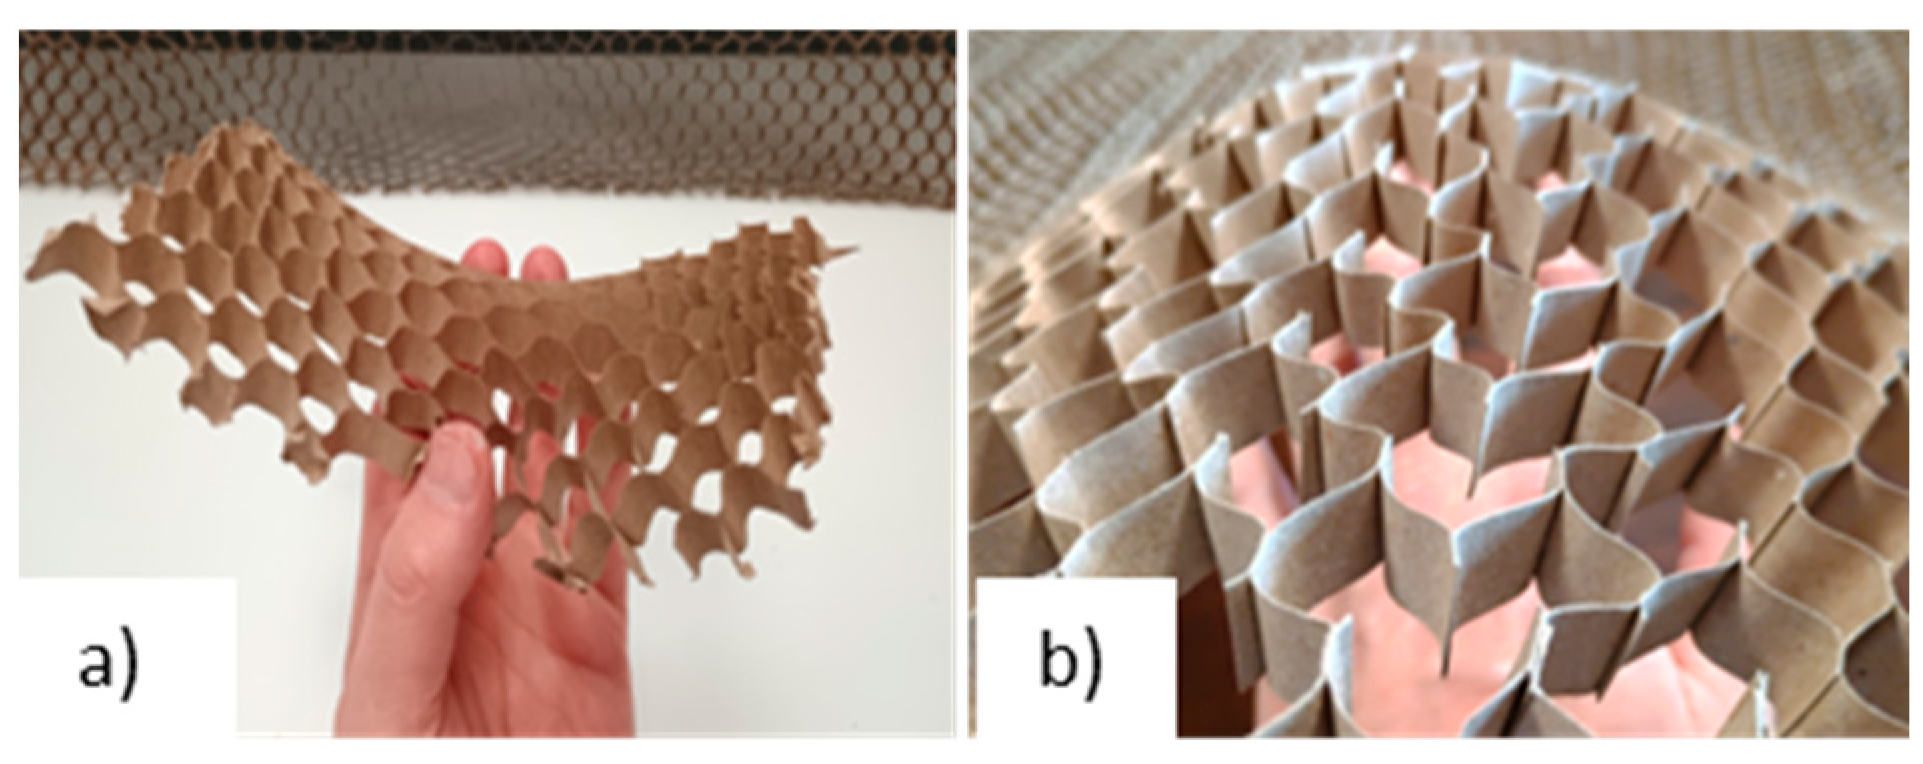
The presented results indicate that even with positive Poisson’s ratio values for M-type cells, excellent synclastic properties can be achieved in both orthotropic directions. This is consistent with the conclusions [27] regarding the possibility of the synclastic effect for cell structures with a strongly positive Poisson’s ratio. This represents an alternative and more practical way to achieve the effect compared to “negative” materials. From an engineering perspective, M-type cores allow for the achievement of a stable synclastic surface by modifying the topology (removing common faces) of the hexagonal core. This facilitates the formation of spherical surfaces without the use of additional forces and expensive technological processes (Figure 16).

4. Discussion

A comparison of H and M cores reveals fundamental differences in their mechanical responses. The classic H cell deforms the core in an anticlastic manner. Modifying this cell to the M model allows for the preservation of the high isotropy of the structure, large positive Poisson’s ratio values (0.51–0.54), and simultaneously enables the formation of synclastic surfaces. This means that Poisson’s ratio alone is not a sufficient indicator of the global form of deformation. The cell topology and its periodicity are crucial. These results expand upon and complement the authors’ previous research, confirming that synclasticity can be achieved in non-auxetic structures through relatively simple geometry modifications. This has significant implications for the design of lightweight sandwich panels, particularly in the furniture and acoustics industries, where the ability to form surfaces with positive curvature in at least two planes is required. In furniture design, engineers continue to seek organic shapes with soft radii and smooth transitions. Historically, Baroque and Art Nouveau cabinetmakers, like contemporary furniture manufacturers, created such surfaces in presses using high pressure and temperature. Thanks to M-type cells, it will be possible to produce spherical doors, spherical cabinet sides and fronts, lampshades, and similar products without the need for high temperatures and high pressure.

5. Conclusions

  • The classic hexagonal core (H) confirmed the typical anticlastic behavior described in the literature—positive curvature in one direction is associated with negative curvature in the other.
  • The modified core (M), despite positive Poisson’s ratio values in both orthotropy directions, clearly showed synclastic surface deformation.
  • The most important factor determining the type of deformation turned out to be not the Poisson’s ratio µ itself, but the local cell topology.
  • The results confirm the possibility of designing panels with synclastic properties without the need to introduce auxeticity, which opens up new perspectives for engineering applications.
  • Further research will focus on modeling parametric multi-material systems and multi-scale structures composed of M-type cells. Modeling should include variable loads under variable climatic conditions, taking into account reinforcement systems.

Author Contributions

Conceptualization, J.S.; methodology, J.S. and M.S.; software, J.S. and M.S.; validation, J.S. and M.S.; formal analysis, J.S. and M.S.; resources, J.S. and M.S.; writing—original draft preparation, J.S. and M.S.; writing—review and editing, M.S.; visualization, J.S. and M.S.; supervision, J.S.; project administration, J.S. and M.S.; funding acquisition, J.S. All authors have read and agreed to the published version of the manuscript.

Funding

This research was funded by National Science Centre (Poland) as part of the research project no. 2016/21/B/ST8/01016.

Institutional Review Board Statement

Not applicable.

Informed Consent Statement

Not applicable.

Data Availability Statement

The original contributions presented in this study are included in the article. Further inquiries can be directed to the corresponding author.

Acknowledgments

The authors would like to gratefully acknowledge the National Science Centre (Poland) for financing the present work as part of the research project no. 2016/21/B/ST8/01016. Some of the computations were performed using computers of the Poznan Supercomputing and Networking Center. The publication was financed by the Polish Minister of Science and Higher Education as part of the Strategy of the Poznan University of Life Sciences for 2024–2026 in the field of improving scientific research and development work in priority research areas.

Conflicts of Interest

The authors declare that they have no conflicts of interest.

References

  1. Heimbs, S.; Pein, M. Failure Behaviour of Honeycomb Sandwich Corner Joints and Inserts. Compos. Struct. 2009, 89, 575–588. [Google Scholar] [CrossRef]
  2. Tao, Y.; Li, W.; Wei, K.; Duan, S.; Wen, W.; Chen, L.; Pei, Y.; Fang, D. Mechanical Properties and Energy Absorption of 3D Printed Square Hierarchical Honeycombs under In-Plane Axial Compression. Compos. B Eng. 2019, 176, 107219. [Google Scholar] [CrossRef]
  3. Castanie, B.; Bouvet, C.; Ginot, M. Review of Composite Sandwich Structure in Aeronautic Applications. Compos. Part C Open Access 2020, 1, 100004. [Google Scholar] [CrossRef]
  4. Harkati, A.; Boutagouga, D.; Harkati, E.; Bezazi, A.; Scarpa, F.; Ouisse, M. In-Plane Elastic Constants of a New Curved Cell Walls Honeycomb Concept. Thin-Walled Struct. 2020, 149, 106613. [Google Scholar] [CrossRef]
  5. Duc, N.D.; Seung-Eock, K.; Tuan, N.D.; Tran, P.; Khoa, N.D. New Approach to Study Nonlinear Dynamic Response and Vibration of Sandwich Composite Cylindrical Panels with Auxetic Honeycomb Core Layer. Aerosp. Sci. Technol. 2017, 70, 396–404. [Google Scholar] [CrossRef]
  6. Smardzewski, J.; Kramski, D. Modelling Stiffness of Furniture Manufactured from Honeycomb Panels Depending on Changing Climate Conditions. Thin-Walled Struct. 2019, 137, 295–302. [Google Scholar] [CrossRef]
  7. Peliński, K.; Smardzewski, J.; Narojczyk, J. Stiffness of Synclastic Wood-Based Auxetic Sandwich Panels. Phys. Status Solidi B 2020, 257, 1900749. [Google Scholar] [CrossRef]
  8. Smardzewski, J.; Tokarczyk, M. Lightweight Honeycomb Furniture Panels with Discreetly Located Strengthening Blocks. Compos. Struct. 2024, 331, 117927. [Google Scholar] [CrossRef]
  9. Mrówczyński, D.; Gajewski, T.; Cornaggia, A.; Garbowski, T. Impact of Temperature and Humidity on Key Mechanical Properties of Corrugated Board. Appl. Sci. 2024, 14, 12012. [Google Scholar] [CrossRef]
  10. Rathod, S.; Khaire, N.; Tiwari, G. A Comparative Study on the Ballistic Performance of Aramid and Aluminum Honeycomb Sandwich Structures. Compos. Struct. 2022, 299, 116048. [Google Scholar] [CrossRef]
  11. Zhou, Y.; Pan, Y.; Chen, L.; Gao, Q.; Sun, B. Study on the Bending Behaviors of a Novel Flexible Re-Entrant Honeycomb. J. Eng. Mater. Technol. 2023, 145, 041006. [Google Scholar] [CrossRef]
  12. Evans, K.E.; Alderson, A. Auxetic Materials: Functional Materials and Structures from Lateral Thinking! Adv. Mater. 2000, 12, 617–628. [Google Scholar] [CrossRef]
  13. Lorato, A.; Innocenti, P.; Scarpa, F.; Alderson, A.; Alderson, K.L.; Zied, K.M.; Ravirala, N.; Miller, W.; Smith, C.W.; Evans, K.E. The Transverse Elastic Properties of Chiral Honeycombs. Compos. Sci. Technol. 2010, 70, 1057–1063. [Google Scholar] [CrossRef]
  14. Easey, N.; Chuprynyuk, D.; Musa, W.M.S.W.; Bangs, A.; Dobah, Y.; Shterenlikht, A.; Scarpa, F. Dome-Shape Auxetic Cellular Metamaterials: Manufacturing, Modeling, and Testing. Front. Mater. 2019, 6, 86. [Google Scholar] [CrossRef]
  15. Huang, J.; Zhang, Q.; Scarpa, F.; Liu, Y.; Leng, J. Bending and Benchmark of Zero Poisson’s Ratio Cellular Structures. Compos. Struct. 2016, 152, 729–736. [Google Scholar] [CrossRef]
  16. Hou, Y.; Tai, Y.H.; Lira, C.; Scarpa, F.; Yates, J.R.; Gu, B. The Bending and Failure of Sandwich Structures with Auxetic Gradient Cellular Cores. Compos. Part A Appl. Sci. Manuf. 2013, 49, 119–131. [Google Scholar] [CrossRef]
  17. Cao, H.; Bao, W.; Bai, C.; Yan, Q.; Wang, B.; Yang, Y.; Fan, H. Manufacturing and Mechanical Testing of Curved Sandwich Beams with Zero-Poisson’s Ratio Honeycomb Cores. Polym. Compos. 2023, 44, 8849–8856. [Google Scholar] [CrossRef]
  18. Chen, X.; Jin, F.; Fan, H. Zero-Poisson’s-Ratio Honeycomb-Filled Braided Textile Reinforced Conical Tubes: Designing, Manufacturing and Testing. Appl. Compos. Mater. 2023, 30, 773–789. [Google Scholar] [CrossRef]
  19. Peliński, K.; Smardzewski, J. Static Response of Synclastic Sandwich Panel with Auxetic Wood-Based Honeycomb Cores Subject to Compression. Thin-Walled Struct. 2022, 179, 109559. [Google Scholar] [CrossRef]
  20. Słonina, M.; Dziurka, D.; Molińska-Glura, M.; Smardzewski, J. Influence of Impregnation with Modified Starch of a Paper Core on Bending of Wood-Based Honeycomb Panels in Changing Climatic Conditions. Materials 2022, 15, 395. [Google Scholar] [CrossRef]
  21. Słonina, M.; Smardzewski, J. Starch Impregnation Effect of Testliner Paper on Stiffness of Honeycomb Panels with Slender Cells. Drv. Ind. 2022, 73, 327–334. [Google Scholar] [CrossRef]
  22. Wu, R.; Ma, K.; Li, P.; Hou, Y.; Wang, P.; Li, B.; Xiao, Y. Experimental and Numerical Studies on a Glubam Spherical Dome. Eng. Struct. 2024, 303, 117462. [Google Scholar] [CrossRef]
  23. Teng, X.C.; Ni, X.H.; Zhang, X.G.; Jiang, W.; Zhang, Y.; Xu, H.H.; Hao, J.; Xie, Y.M.; Ren, X. Design and Mechanical Performance of Stretchable Sandwich Metamaterials with Auxetic Panel and Lattice Core. Thin-Walled Struct. 2023, 192, 111114. [Google Scholar] [CrossRef]
  24. Chen, X.; Fan, H. Flexible Forming Mechanism of Curved Sandwich Shell with Flexible Honeycombs and Twill Carbon Fiber Fabrics. Compos. Struct. 2025, 354, 118779. [Google Scholar] [CrossRef]
  25. Peliński, K.; Smardzewski, J. Experimental Testing of Elastic Properties of Paper and WoodEpox® in Honeycomb Panels. BioResources 2019, 14, 2977–2994. [Google Scholar] [CrossRef]
  26. Evans, K.E.; Nkansah, M.A.; Hutchinson, I.J.; Rogers, S.C. Molecular Network Design. Nature 1991, 353, 124. [Google Scholar] [CrossRef]
  27. Smardzewski, J. Transformation of Hexagonal Cells into Auxetic in Core Honeycomb Furniture Panels. In Proceedings of the ICWSE 2025: XIX. International Conference on Wood Science and Engineering, Nicosia, Cyprus, 21 August 2025; pp. 1–5. [Google Scholar]
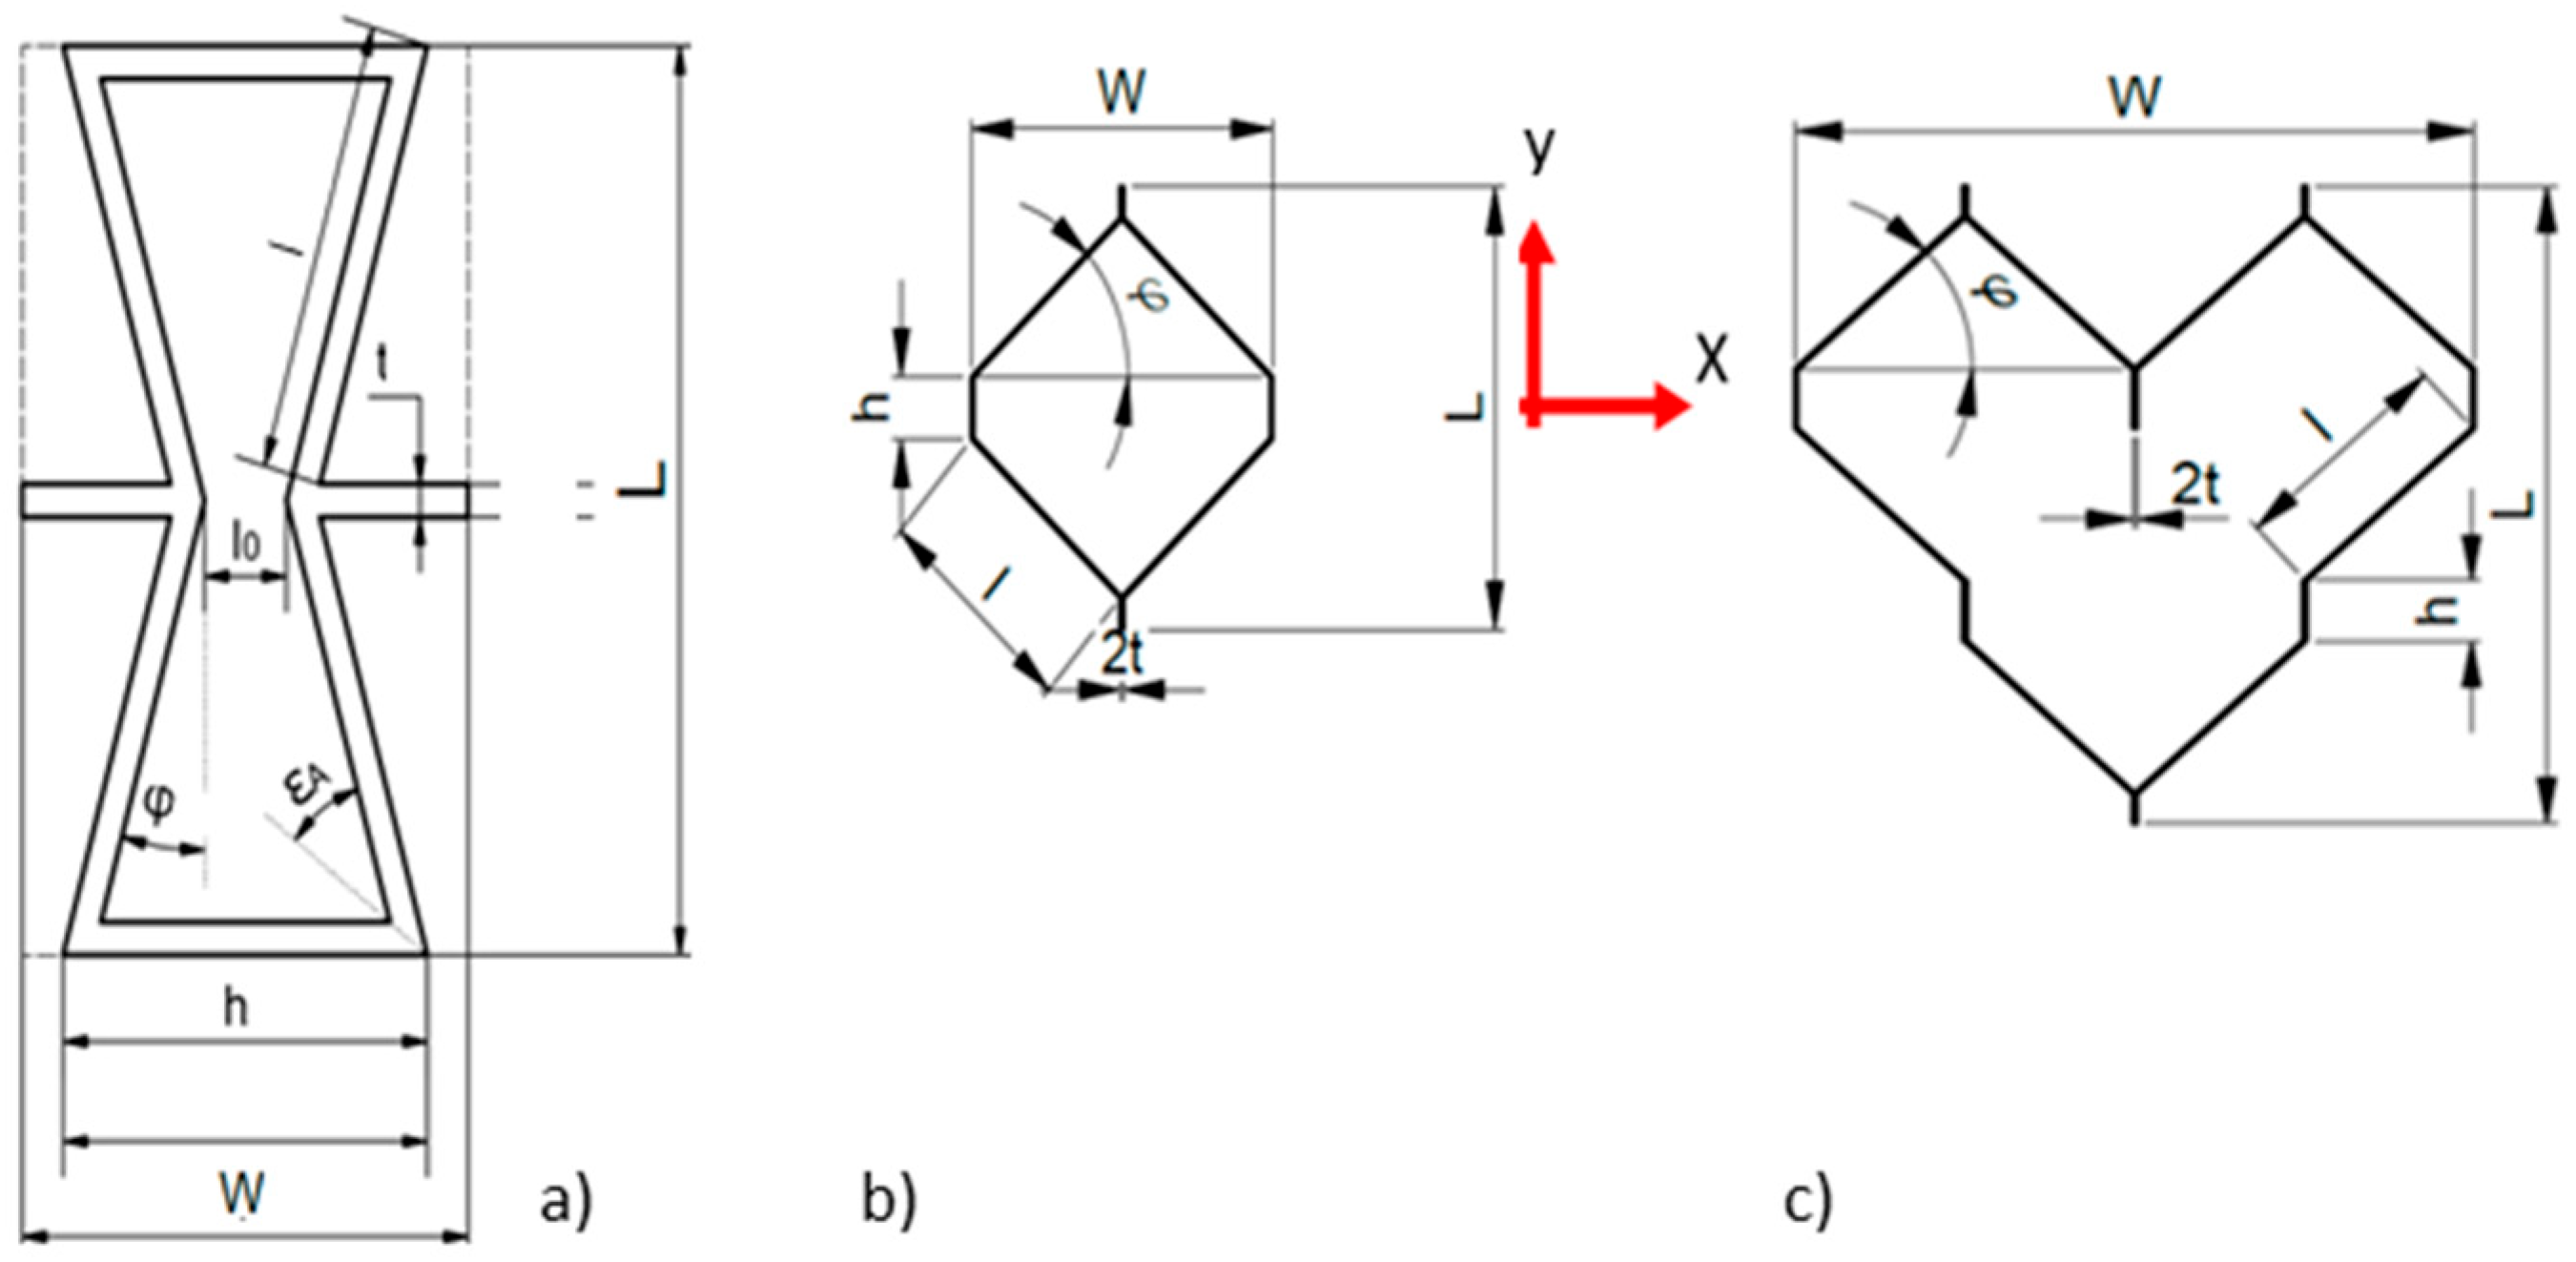
Figure 1. Type of hexagonal cells: (a) re-entrant, (b) regular, (c) modified.
Applsci 15 10614 g001
Figure 2. Example of the core for Poisson’s ratios calculation.
Applsci 15 10614 g002
Figure 3. Type of hexagonal cores: (a) R re-entrant, (b) H regular.
Applsci 15 10614 g003
Figure 4. Transformation H type cells into M type.
Applsci 15 10614 g004
Figure 5. Cores prepared for seasoning: (a) H hexagonal, (b) M modified.
Applsci 15 10614 g005
Figure 6. Numerical model of compression core samples.
Applsci 15 10614 g006
Figure 7. Constitutive relation of materials in the finite element model.
Applsci 15 10614 g007
Figure 8. Numerical model of bending core samples.
Applsci 15 10614 g008
Figure 9. Example of comparison of H-core images from actual measurements, (a) and FEM analysis, (b) at a comparable scale. ZY measurement plane.
Applsci 15 10614 g009
Figure 10. Poisson’s ratios for different types of cores.
Applsci 15 10614 g010
Figure 11. Synclastic shape of the core with R-type cells.
Applsci 15 10614 g011
Figure 12. Comparison of H-core surface displacements in numerical simulation (FE) with experimental results (Real): (a) ZY plane, (b) ZX plane.
Applsci 15 10614 g012
Figure 13. Comparison of an experimental (a,c,e) and numerical (b,d,f) deformations of the H-type core in the (ad) ZX plane, and (e,f) ZY plane.
Applsci 15 10614 g013
Figure 14. Comparison of M-core surface displacements in numerical simulation (FE) with experimental results (Real): (a) ZY plane, (b) ZX plane.
Applsci 15 10614 g014
Figure 15. Comparison of an experimental (a,c,e,g) and numerical (b,d,f,h) deformations of the M-type core in the (ad) ZY plane, and (eh) ZX plane.
Applsci 15 10614 g015
Figure 16. Simply formed anticlastic (a) and synclastic (b) shapes of the core.
Applsci 15 10614 g016
Table 1. Mechanical properties of the materials used for the cores.
MaterialUnitWoodEpox®Paper
Parameter *Direction MDDirection CD
ρ s kg/m3630686686
E s MPa104557072188
G s -2022954
σ s 4.214616
ν s 0.310.4110.147
* Where ρ s (kg/m3) the density of the core paper direction, respectively, E s , G s (MPa) linear elastic modulus and shear modulus, respectively, σ s (MPa) tensile strength, ν s Poisson’s ratio.
Table 2. Geometrical characteristics of the cells used for the study.
Symbol *UnitCell Type
R Re-EntrantH HexagonalM Modified
ϱ -0.09730.01090.0161
L mm39.823.334.9
W   18.918.537.0
H 10.017.417.4
l 19.91212
l o 3.6--
h 18.93.33.3
t 1.50.20.2
ε A (°)37--
φ 164242
* Where ϱ cell relative density, L ,   W ,   H cell length, width, and height, respectively, l ,   h free and common cell wall length, respectively, l o internal dastans, t cell wall thickness, φ , ε A cell wall angle.
Table 3. Correlation coefficients of H-core measurements in the ZY, ZX plane.
ParameterUnitZYZX
Rangemm102.0921.42
RMSE 3.414.67
MAX error5.4131.97
NRMSE-3.3368.48
PEARSON0.990.94
R299.7988.92
MAPE%12.83359.43
AUC-diffmm210392173
AUC-diff%5.58307.67
DTWmm28.16192.56
DTWAvg0.454.81
Range102.0921.42
Table 4. Correlation coefficients of M-core measurements in the ZY, ZX plane.
ParameterUnitZYZX
Rangemm102.696.75
RMSE 2.42.81
MAX error4.075
NRMSE-2.342.9
PEARSON0.9991
R299.7899.97
MAPE%7.8111.38
AUC-diffmm2478470
AUC-diff%1.734.78
DTWmm34.7127.48
DTWAvg0.610.86
Range102.696.75
Disclaimer/Publisher’s Note: The statements, opinions and data contained in all publications are solely those of the individual author(s) and contributor(s) and not of MDPI and/or the editor(s). MDPI and/or the editor(s) disclaim responsibility for any injury to people or property resulting from any ideas, methods, instructions or products referred to in the content.