Abstract
Bridge health monitoring is critical for infrastructure safety, especially with the growing deployment of IoT sensors. This work addresses the challenge of securely storing large volumes of sensor data and extracting actionable insights for timely damage detection. We propose BIONIB, a novel framework that combines an unsupervised machine learning approach called the Novelty Index (NI) with a scalable blockchain platform (EOSIO) for secure, real-time monitoring of bridges. BIONIB leverages EOSIO’s smart contracts for efficient, programmable, and secure data management across distributed sensor nodes. Experiments on real-world bridge sensor data under varying loads, climatic conditions, and health states demonstrate BIONIB’s practical effectiveness. Key findings include CPU utilization below 40% across scenarios, a twofold increase in storage efficiency, and acceptable latency degradation, which is not critical in this domain. Our comparative analysis suggests that BIONIB fills a unique niche by coupling NI-based detection with a decentralized architecture, offering real-time alerts and transparent, verifiable records across sensor nodes.
1. Introduction
Bridge health monitoring is an essential component of infrastructure maintenance, particularly as aging transportation networks require constant evaluation to ensure safety and performance. With the advancement of Internet of Things (IoT) technologies, it has become possible to collect continuous, real-time sensor data from bridges, enabling data-driven structural health monitoring (SHM) [1,2,3]. However, this abundance of data introduces critical challenges in terms of secure storage, efficient processing, and timely detection of structural anomalies. Traditional centralized data handling approaches face limitations in ensuring data integrity, scalability, and real-time decision-making [4].
Recent developments in blockchain technology offer promising solutions to these issues. Due to their decentralized, tamper-resistant architecture, blockchains provide a secure framework for recording and sharing high-frequency sensor data. When combined with smart contracts, blockchains can enable programmable, automated responses to structural health events [5,6,7]. Despite their advantages, blockchains have seen limited integration with lightweight, unsupervised SHM techniques that are suitable for deployment on edge devices. Existing works typically rely on heavyweight models, such as deep learning architectures, which are not optimized for real-time performance in constrained environments.
To address this gap, we propose BIONIB: Blockchain-based IoT using Novelty Index in Bridge Health Monitoring. BIONIB integrates a lightweight, unsupervised anomaly detection technique—the Novelty Index (NI)—with the high-throughput EOSIO blockchain platform. This integration enables secure storage, decentralized processing, and real-time alerting based on structural health conditions. Unlike prior SHM systems, BIONIB avoids storing raw time-series data and instead computes a compact NI representation from sensor streams, significantly improving storage and retrieval efficiency. EOSIO’s parallel processing capabilities are leveraged to scale the system across a large number of sensors and bridge sites.
The main contributions of this work can be summarized as follows:
- We propose a scalable blockchain-based framework utilizing the EOSIO platform to efficiently manage and analyze IoT sensor data in bridge health monitoring. This system ensures secure and transparent storage, integrity, and traceability of structural data across distributed networks.
- We integrate a smart contract system that ingests NI values in real time and automatically triggers alerts when a threshold is crossed. This design enables prompt identification of unhealthy bridge states without relying on centralized infrastructure.
- By storing only NI values rather than full time-series sensor data, BIONIB achieves an over 99.9% data reduction, improving blockchain storage efficiency and lowering transaction overhead.
- We evaluate the scalability and efficiency of BIONIB under varying numbers of IoT sensors and blockchain nodes. Results show that throughput scales linearly while CPU utilization remains stable below 40%, validating the system’s robustness and suitability for large-scale SHM deployments.
The remainder of this article is organized as follows. Section 2 reviews related work in SHM, IoT, and blockchain integration. Section 3 presents the network architecture of the proposed system. Section 4 discusses the data collection process and NI calculation. Section 5 details the BIONIB algorithm and smart contract implementation. Section 6 reports performance evaluation results. Section 7 outlines a discussion of challenges and advantages of the proposed approach. Finally, Section 8 concludes the paper and outlines directions for future work.
A preprint of this work is available on arXiv (https://arxiv.org/abs/2402.14902) (accessed on 25 September 2025.).
2. Related Work
Blockchains have recently become popular in the IoT, healthcare, smart-grid, supplychain, and many other fields for their immutability, secure storage, and decentralization [8]. Many studies have been conducted concentrating on the applications of blockchains for specific IoT sensors and tasks [9]. In this section, we present a review of the literature related to our research.
2.1. IoT Based Blockchain
In [5], a survey is presented showing various applications of blockchains in IoT. The survey [5] also focuses on the challenges posed by the current centralized IoT models, and recent advances made both in industry and research to solve these challenges for effectively using blockchains to provide a decentralized, secure medium for the IoT. The use of blockchains in Industry 4.0 is presented in [10]. The merits and demerits of traditional security solutions in blockchains are discussed in comparison to their countermeasures and a comparison is provided [10]. Various consensus protocols like sharding [11,12] are used in IoT-based blockchains. Recent works focus on using various deep learning and scaling algorithms for blockchains for IoT applications [13,14,15]. These protocols demonstrate the usability of the blockchain consensus algorithms in the domain of IoT.
2.2. SHM
The evaluation of bridge health is explored through the analysis of bridge survey data as detailed in [16,17]. In [6], the recent progress of the SHM technology is reviewed for long-span bridges. In addition to the data analysis and condition assessment including techniques on modal identification, methods on signal processing, and damage identification, a case study of a SHM system of a long-span arch bridge is discussed. The authors of [1] conducted a detailed literature review of recent applications of smartphones, UAVs, cameras, and robotic sensors for structural condition monitoring and maintenance. The work in [18] employs a nondestructive evaluation test with statistical confidence and uses time-series analysis instead of frequency-domain monitoring. The work in [19] discusses partial-model-based damage identification.
The damage detection tool developed in [20,21] utilizes unsupervised machine learning, specifically the Novelty Index (NI), to detect damage in bridges using data from full-scale mock-up tests. The method was validated using field data and shows promise as a robust tool for damage detection. The NI calculation method employed in this study is based on the approaches detailed in [20,21], which compare the NI with alternative damage detection techniques and highlight its advantages as a compact, sensitive damage indicator. Readers are encouraged to consult these sources for a comprehensive understanding of NI methodology and its performance characteristics. Further discussion of the NI technique is provided in later sections.
2.3. Blockchain in SHM
The work in [22] combines IoT and blockchain-based smart contracts for SHM of underground structures to create an efficient, scalable, and secure network that enhances operational safety. The authors of [23] propose a conceptual framework to integrate vibration-based methods and blockchain for more reliable and efficient structural damage detection. The system in [4] is a blockchain network for SHM, with smart contracts for health monitoring on the Ethereum private chain for verifying authority, detecting structural damage, generating alerts, securing data, and allowing for traceability queries. In [7], sensors record monitoring information such as pressure points, temperature, and pre-tension force. This data is transmitted to a blockchain platform that classifies transaction criticality and securely stores the information. The authors of [24] use consortium blockchain for distributed storage, security, and traceability.
2.3.1. Why EOSIO for IoT SHM?
In [25], the authors collect and process up-to-date on-chain data from EOSIO. EOSIO achieves a significant improvement in performance when compared to Bitcoin and Ethereum [25] since it generates more blocks and hence provides more transactions per second. In [26], the authors analyzed the network traffic of three major high-scalability blockchains (EOSIO, Tezos, and XRP Ledger) for seven months and found that a small portion of transactions are used for value transfer purposes. About 96% of the transactions on EOSIO were triggered by the airdrop of a valueless token [26].
The authors of [27] propose EOSAFE, which is a static analysis framework that detects vulnerabilities in EOSIO smart contracts at the bytecode level and analyze EOSIO smart contracts against attacks. In [28], a systematic analysis is conducted on the decentralization of DPoS with data from blocks in EOSIO, the first DPoS-based blockchain system, and characterize the decentralization into two phases, block producer election, and block production. The method in [29] can record the events that occur in multiple industrial robotic arms by deploying a smart contract in the EOSIO blockchain. The authors of [30] analyzed attacks on EOSIO and found vulnerabilities in its components and outlined effective mitigations and best practices for researchers.
Our selection of EOSIO was based on the presence of a well-supported research community and a rigorous security analysis. Additionally, EOSIO offers exceptional scalability, making it suitable for IOT based SHM.
2.3.2. Comparison with Central Storage
IoT data is traditionally stored on a central server. Blockchains are particularly useful due to their better decentralization, security, and tamper resistance properties [31]. Storage efficiency refers to the effective storage and management of data over time. EOSIO [30] is one of the emerging blockchains that offers scalability and flexible operability for our implementation. In EOSIO, the storage efficiency is impacted by factors such as the number of nodes, smart contracts, and additional metadata. Conversely, centralized storage is not dependent on the number of nodes. The EOSIO blockchain’s storage efficiency scales linearly with the number of nodes, making it more advantageous [30]. The time it takes to retrieve data in a blockchain network, known as data retrieval time, is influenced by the number of nodes, and the time data takes to propagate between nodes. The scalability of a blockchain network depends on its ability to handle a growing number of nodes and transactions while maintaining high performance. In contrast, the scalability of centralized storage is limited by the capacity of the central server. The EOSIO blockchain is highly scalable and can efficiently handle a larger network size, particularly when it comes to transaction processing [32]. Blockchain technology is highly secure and resistant to malicious activities due to its decentralized and immutable nature. It offers superior protection against security breaches and tampering compared to centralized systems.
2.4. Comparative Analysis of Structural Health Monitoring Approaches
To further contextualize the contribution of BIONIB, we provide a comparative analysis with existing structural health monitoring (SHM) approaches. While many recent studies have explored anomaly detection in sensor data using machine learning or signal processing techniques, few integrate these with blockchain technologies to ensure data traceability, integrity, and decentralized automation.
Table 1 summarizes key differences across various methods. Specifically, we compare BIONIB to the following:

Table 1.
A brief comparison of BIONIB with Other SHM Approaches.
- A deep autoencoder-based method using one-class SVM [33].
- A clustering-based technique using density-peak methods [34].
- Traditional SHM systems (e.g., threshold-based or rule-based) without blockchain [6].
The BIONIB framework offers several distinct advantages. First, it achieves real-time alerting using a lightweight unsupervised method (Novelty Index) [21], while maintaining low computational cost. Second, it integrates EOSIO smart contracts to ensure immutability and traceability of health indicators. In contrast, methods like deep autoencoders or clustering typically require significant post-processing and lack mechanisms for secure, decentralized data storage.
BIONIB also demonstrates high scalability and consistent CPU usage even under increased node or sensor load, benefiting from EOSIO’s parallel processing capabilities. While other studies have introduced blockchains into SHM, such as Ethereum-based systems [4], they often suffer from low throughput and limited integration with lightweight models. BIONIB addresses this by using EOSIO, which is optimized for high-frequency IoT data streams.
The integration of blockchain technology with SHM represents a significant advancement in ensuring the integrity, security, and reliability of bridge monitoring data. As demonstrated in Table 1, BIONIB leverages the EOSIO blockchain platform to provide superior data integrity and security compared to traditional approaches. Unlike conventional SHM methods that rely on centralized storage systems vulnerable to tampering and unauthorized access, BIONIB’s blockchain-based approach ensures that sensor data remains immutable and transparent [4]. Furthermore, the use of the Novelty Index (NI) in BIONIB offers advantages over other machine learning approaches like deep autoencoders with one-class SVM and density-peaks clustering. While these alternative methods can effectively detect structural anomalies, they often require significant computational resources and post-processing time, limiting their real-time alerting capabilities [21]. BIONIB addresses these limitations by combining the NI algorithm with EOSIO’s parallel processing capabilities, enabling efficient real-time monitoring even with an increasing number of sensors and blockchain nodes. The experimental results from the implementation demonstrate that BIONIB maintains consistent CPU usage regardless of network size, highlighting its scalability advantages for large-scale bridge monitoring deployments [14].
3. Network Architecture
In this section, we will explain the EOSIO consensus used for our implementation. Later, we will discuss the EOSIO protocol with smart contracts. Figure 1 shows the network architecture of bridge monitoring with sensors and a blockchain. Consider N number of block producer nodes and k accounts created. The blockchain layer has the EOSIO accounts and the block producer nodes, which confirm the input transactions into the blocks on the blockchain. For better understanding, EOSIO producer nodes are shown in the edge computing layer but they are also a part of the blockchain layer. Let s be the number of strain sensors collecting the data on every bridge. Each bridge sensor transmits its data to the edge computing layer which consists of the block producer nodes who calculate the NI from the received sensor data. These novelty indices are given to the EOSIO accounts who initiate a smart contract. The deployed smart contracts then output the actions, which are the transactions (containing novelty indices), which after EOSIO consensus are added to the blockchain.
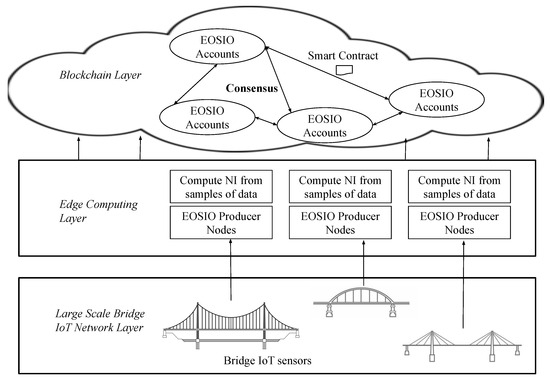
Figure 1.
Network architecture illustrating the integration of blockchain technology with IoT sensors for real-time bridge health monitoring. The system ensures secure data collection, processing, and immutable storage across distributed nodes.
EOSIO Consensus
EOSIO [28,35] is a blockchain protocol designed to empower the development and deployment of decentralized applications (DApps) with a focus on scalability, flexibility, and user-friendliness. EOSIO is a blockchain platform that uses a Delegated Proof-of-Stake (DPoS) consensus mechanism. The consensus mechanism has two distinct components: producer voting and scheduling, which is executed by the DPoS layer 2, and block production and validation, which is carried out by the native consensus layer 1. Additionally, EOSIO uses asynchronous Byzantine Fault Tolerance (aBFT) in Layer 1 to ensure safety and consistency in the validation process. In Delegated Proof-of-Stake (DPoS), a small group of elected nodes, called block producers, are responsible for verifying transactions and adding blocks to the blockchain. Compared to the traditional Proof-of-Work (PoW) consensus mechanism, this design improves scalability and transaction throughput. EOSIO uses parallel processing, allowing multiple transactions to be processed at the same time, resulting in increased transaction speed and efficiency. It is ideal for applications that require high performance and low latency. Additionally, EOSIO introduces a resource model that includes bandwidth, computation, and storage.
Layer 1 uses Asynchronous Byzantine Fault Tolerance (aBFT), an advanced consensus algorithm, to validate blocks produced by elected producers and record them on the blockchain permanently. The layer ensures that each block is signed by the corresponding producer by utilizing the proposed schedule of producers from Layer 2. To ensure byzantine fault tolerance, this layer follows a two-stage block confirmation process, where each block must be confirmed twice by a two-thirds supermajority of producers from the currently scheduled set. The layer proposes a Last Irreversible Block (LIB) in the first stage, and the proposed LIB is confirmed as final in the second stage, making the block irreversible. Additionally, any changes made to the producer schedule are notified at the beginning of every schedule round. The EOSIO consensus mechanism attains algorithmic finality, a departure from the probabilistic finality characteristic of Proof-of-Work models. Active producers on the EOSIO blockchain use signatures to validate each block. The schedule determines authorized signers for each block at specific time slots. Smart contracts can alter the schedule, but changes are implemented only after the block has undergone two stages of confirmation. EOSIO smart contracts allow us to define specific rules and conditions for transactions. In the proposed approach for bridge health monitoring, EOSIO blockchain integration involves deploying smart contracts to handle the secure storage of real-time IoT data and execute predefined logic for data analysis. This incorporation enhances the overall security, transparency, and efficiency of the bridge health monitoring system.
4. Data Collection and Analysis
4.1. Collection of Data
Field tests were conducted at the Midwest Roadside Safety Facility (MwRSF) to evaluate barrier performance during vehicle impacts on a bridge deck mock-up. The authors of [20] measured the bridge’s response to vehicle loads at different speeds and under various levels of damage before and after the crash test. Figure 2 and Figure 3 show a cantilevered bridge deck with a concrete barrier at the end. It comprises a grade beam, deck, barrier, and overlay. The mock-up mimics a real bridge. The grade beam replicates a girder, and the design matches realistic forces. The overhang and barrier meet AASHTO’s and NCHRP’s design specifications. The bridge deck had 40 BDI strain transducers placed across its width at eight locations. Each section was equipped with two longitudinal and three transverse strain sensors, out of which, 24 sensors were used for the study. Figure 3 illustrates the locations of the sensors on one half of the bridge. The other half of the bridge follows the same sensor placement. The proposed damage detection method for a bridge was tested using a pickup truck and a dump truck. The bridge was tested in different conditions, with the pickup truck traveling at different speeds, while the dump truck moved slowly, both empty and loaded. The initial tests were carried out on the bridge in its original state, followed by tests with different levels of damage. Strain data were collected for each test, and the damage scenarios were designed to mimic real-world situations.
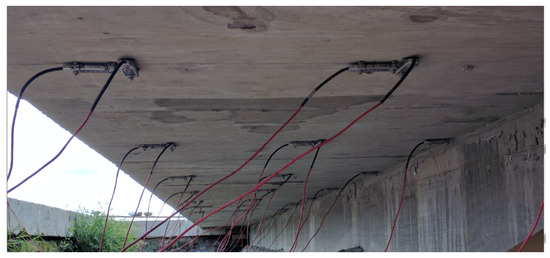
Figure 2.
Sensors installed on the underside of the bridge deck for structural health monitoring.
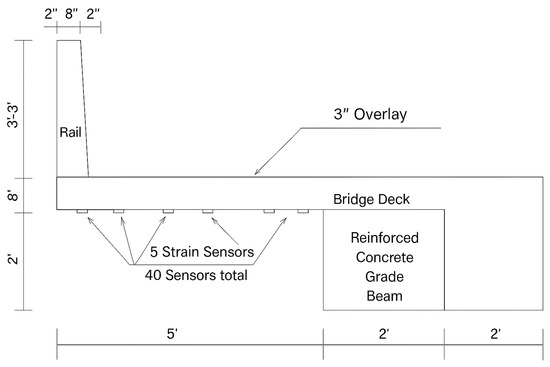
Figure 3.
Illustrationof half of the bridge showing deployed sensors, including measurements, rail, and reinforced concrete beam. The other half follows the same sensor pattern.
4.2. Novelty Index Calculation
In this work we use NI calculations based on [20,21]. To detect damage, features are extracted from response data. Linear modal properties like resonant frequencies and mode shape curvatures are used to fit a linear, dynamic model to both healthy and damaged structure data. However, these features have limitations, such as being unable to detect nonlinear changes in system response and being influenced by environmental conditions. Recent research has focused on developing damage-sensitive features such as novelty analyses using Singular Value Decomposition (SVD), and Independent Component Analysis (ICA). These features transform measured, nonlinear response data into low-dimensional features, serving as damage indicators and input parameters for novelty indices. SVD and ICA offer computational simplicity compared to traditional vibration modes. It is important to note that strain transducers were used for live load response measurement and Operational Modal Analysis (OMA) was not utilized. SVD can be applied to both linear and nonlinear systems and is robust to measurement noise, while ICA is a potential alternative known for data reduction and handling measurement noise effectively. Proper Orthogonal Decomposition (POD) generates orthonormal vectors ordered by importance. It has an intuitive link with PCA, which transforms correlated variables into principal components. In PCA used for POD, the first POM captures the most variability in the data. SVD and Karhunen–Lo‘eve Decomposition (KLD) are other POD techniques. Numerically, PCA and SVD provide similar results. SVD was chosen to develop POMs in this study, but PCA could also be used. Then we use datasets from bridge mock-ups, where represents snapshot matrices of vehicle passage data. The SVD of these matrices allows for the extraction of damage features, represented as , where L, , and R are orthonormal matrices. The first Proper Orthogonal Mode (POM), , contains information relevant to the presence of structural damage and is used as one of the damage features.
This work in [20] proposes a detection framework to differentiate between healthy and damaged states in bridge response data from vehicle passages. Figure 4 shows how NI summarizes the state of the bridge based on bridge sensor data samples. The experiment is conducted initially on a healthy bridge and then on an unhealthy bridge. The scatter plot shows the clustering of NIs calculated from the strain transducers. In Figure 4, H represents the healthy bridge state without any damages. The damage levels , , and are the bridge condition after introducing damage to the structure. The damage levels are in the increasing order of their severity. The concrete bridge deck is saw-cut to introduce the three damage levels as described in [21]. The damage level is a complete saw cut deck damage and hence the NI is closer to 1. However, even at the bridge has not completely failed and we could conduct the experiments with load on the bridge. NI is calculated first, and the feature extraction is performed using SVD. Then healthy feature vectors, denoted by h are stored. Next, we calculate the healthy feature vector mean for POM
After this, we calculate for each data set with a Euclidean norm
The detailed procedure of the usage of NI in BIONIB is explained in the subsequent sections.

Figure 4.
Novelty Index (NI) values plotted for collected data points across four conditions: Healthy (H) and three damage levels (, , ).

5. Proposed Approach: BIONIB
5.1. EOSIO Integration with IoT Data
BIONIB utilizes EOSIO, a secure, transparent, and decentralized platform to store and access NI data from IoT sensors. This ensures data integrity and immutability while facilitating efficient data management and analysis. Bridge IoT sensors collect measurement data, such as strain from bridges. This data is transmitted to a blockchain system for processing and analysis. The collected data undergoes processing to extract relevant features and calculate an NI. Feature extraction technique, SVD is used to extract information from the sensor data. The NI is calculated based on the extracted features to assess the deviation or abnormality of the bridge’s condition from a baseline. A smart contract is developed using the EOSIO Contract Development Toolkit (EOSIO.CDT) [36]. The smart contract includes actions and data structures necessary for adding and retrieving NI data to and from the blockchain. The compiled smart contract is deployed to the EOSIO blockchain using a deployment transaction. This transaction specifies the account deploying the contract. Once deployed, users can interact with the smart contract by invoking its actions. An action within the smart contract is created to add the NI data to the blockchain. This action includes parameters such as the bridge identifier and the calculated NI. The smart contracts are invoked and the action adds the NI data to the blockchain by sending a transaction. The transaction is processed by EOSIO nodes in the network, validated, and included in a block by block producers through the consensus mechanism. Once included in a block and confirmed by subsequent blocks, the transaction becomes immutable and part of the blockchain’s permanent record. Users, applications, or external systems can query the blockchain to retrieve NI data stored by the smart contract. EOSIO APIs enable easy access and transparency to stored data. Nodeos handles the blockchain data persistence layer, peer-to-peer networking, and contract code scheduling. The command ‘cleos’ is a command line tool that interfaces with the REST APIs exposed by nodeos.
Using a smart contract has several advantages such as structured data management, automation, decentralized trust, and efficiency. However, it also comes with some drawbacks like development complexity, execution costs, and maintenance requirements. Conversely, without a smart contract, users may have to rely on centralized systems and experience higher costs and processing times [30].
5.2. Smart Contract EOSIO Using NI
The first step in creating an EOSIO smart contract is writing the contract code in C++, which defines the actions, data structures, and logic that govern the behavior of the smart contract [25]. Once the smart contract code has been developed, it needs to be deployed to the EOSIO blockchain. Deployment involves uploading the compiled contract code to the blockchain network. This step requires an account with the necessary permissions to deploy contracts. Once deployed, the smart contract can be invoked by users or other smart contracts on the blockchain. Invoking a smart contract typically involves calling one of its actions, which triggers the execution of the corresponding code within the contract. When an action is invoked, the EOSIO blockchain executes the corresponding code in the smart contract. This code can read from and write to the blockchain’s state, perform computations, and interact with other contracts and external data sources. During execution, the EOSIO blockchain validates the transaction and ensures that it meets the requirements specified by the smart contract code. Once the transaction is validated and executed, it is included in a block by the block producer nodes on the EOSIO blockchain. The block is then added to the blockchain, and the transaction becomes part of the immutable ledger. During execution, smart contracts can emit events to provide information about their state or the outcome of certain operations. These events can be logged and monitored by external systems or other smart contracts for tracking and auditing purposes. Figure 5 depicts the workflow of the EOSIO smart contract. The EOSIO smart contract is called and deployed using the cleos commands v2.0.13. At the end of the execution of each smart contract, the novelty indices are added to the table, which is confirmed on the blockchain using nodeos v2.0.13. Nodeos is responsible for block producers, blockchain state, transaction validation, and consensus. Algorithm 1 shows the process of collection of IoT data, calculation of NI, and confirming it onto the EOSIO blockchain using a smart contract.
| Algorithm 1 BIONIB |
|
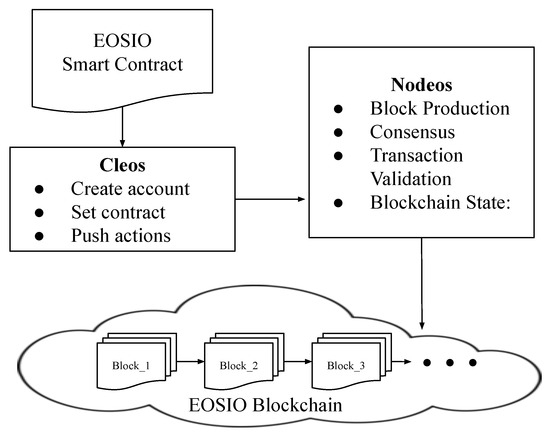
Figure 5.
Step-by-step workflow of EOSIO smart contract integration in BIONIB. This illustration shows how bridge sensor data is processed on the EOSIO blockchain. It highlights key EOSIO components: account creation, contract deployment, action triggering, and block confirmation.
To improve clarity for practitioners, we emphasize EOSIO’s modular structure: nodeos manages consensus and block production, cleos facilitates contract interaction, and EOSIO.CDT enables smart contract development in C++. Each NI is handled via specific addnovelty actions linked to identifiable accounts and timestamps.
The algorithm, BIONIB starts by collecting sensor response data and extracting relevant features. Initially, IoT sensors placed on bridges continuously record structural responses, such as strain. This raw data is then processed using SVD, a dimensionality reduction technique that extracts key damage-sensitive features known as Proper Orthogonal Modes (POMs). From these features, a baseline is established by computing the mean feature vector of healthy-state data, denoted as . To detect abnormal conditions, a Novelty Index (NI) is calculated for each new dataset by measuring the Euclidean distance between the current feature vector and the baseline. This computation effectively quantifies the deviation of the bridge’s structural response from its healthy state. Mathematically, the mean feature vector is calculated as Equation (1) and and the NI is given by Equation (2).
The calculated NI values are transmitted to EOSIO block producer nodes, which are responsible for blockchain operations. Using the EOSIO command-line interface tool cleos, blockchain accounts are created for each bridge or sensor node using the create account command. Then, smart contracts are deployed via set contract, and transactions containing the NI values are submitted using push action.
Each smart contract stores the NI along with metadata such as sensor ID and timestamp. Upon receiving the NI, the smart contract verifies the input, performs authentication, and logs the data into a blockchain table. If the NI value is sufficiently close to 1 (i.e., ), the system flags the bridge as potentially unhealthy and generates a real-time alert.
Once the data is verified, EOSIO’s Delegated Proof-of-Stake (DPoS) consensus mechanism validates the transaction. The data is then permanently recorded on the blockchain by the nodeos module, ensuring both immutability and traceability. This step completes the secure storage process, allowing users and systems to retrieve the NI data on-demand through blockchain queries.
The BIONIB algorithm offers an approach to bridge health monitoring by leveraging the capabilities of the EOSIO blockchain to facilitate secure and efficient data processing and unhealthy bridge detection.
6. Performance Analysis
In this section, we discuss the performance of BIONIB in various scenarios. We begin by discussing the implementation details, followed by a thorough examination of the performance metrics.
6.1. Implementation Details
Our experimental setup leverages real-time sensor data collected from a bridge in Nebraska State, covering multiple days with varying traffic loads and bridge conditions, including both healthy and unhealthy states. Executed on a computer running Ubuntu 18.04, equipped with 6169 MB of base memory, an AMD Ryzen 7 5800H processor, and 16.0 GB RAM, alongside a 64-bit processor architecture, our implementation utilizes Python 3.7, Pandas 1.3.5, Numpy 1.21.6, and Matplotlib 3.5 for NI calculations. the experimental setup is given in Table 2. The integration of the NI within EOSIO smart contracts is facilitated by CPP within the EOSIO mainchain framework.
Table 2.
Experimental Setup.
Comparison of With and Without NI
In BIONIB we show the implementation with NI on IoT data. The following Table 3 summarizes the advantages of using NI instead of storing all the IoT data on the blockchain. Consider a blockchain with N nodes, k accounts created, and s number of IoT sensors. For every epoch of the blockchain, m files from the memory buffer are processed by the smart contract. Each of the m files has data of sensors in its columns. A NI run on m files gives s number of NI values. Let B be the size of the block. Assume that we know all the block details to retrieve data using cleos commands. For example, if we have 51 sensors and 500 files, we get 51 NI values. However, each of the 500 files has 50 data columns and 4396 rows entries making the total data 224,196 values per file. Each of these values with or without an NI is stored on the blockchain ledger in a distributed fashion. Data retrieval is performed using a multi-index table. This uses the find method on the table, which takes the primary key of the row that you want to retrieve and will return an iterator (reference) to the row. The size of multi-index table created depends on the number of actions performed. To remove data from a table, the erase method is used, which takes a reference to the iterator. Table 3 provides a comparison of executing BIONIB with and without NI.
Table 3.
Comparision of BIONIB with and without NI.
Comparing our method with and without the NI can provide valuable insights into the efficiency and effectiveness of our approach. In Table 3, we can see the benefits of incorporating the NI, such as improvements in storage efficiency, data retrieval time, scalability with bridges, and latency per epoch. The proposed scheme significantly enhances storage efficiency by reducing the data stored on the blockchain. This optimization helps to improve the overall system performance by utilizing resources more effectively.
6.2. Performance for Increasing Blockchain Nodes
In this section, we analyze the performance of BIONIB as we increase the number of blockchain nodes. This investigation is crucial to understand how our approach scales as the network infrastructure expands. The EOSIO-based method used in BIONIB confirms two blocks per second. This is consistent throughout the experimentation and is depicted in Figure 6. The blocks confirmed by the blockchain linearly increase. Each block can consist of a varying number of transactions. Figure 7 displays a trend of transaction throughput increasing proportionally with the number of nodes. This observation highlights the scalability of our approach, indicating that it can handle transactions efficiently even in larger network configurations.
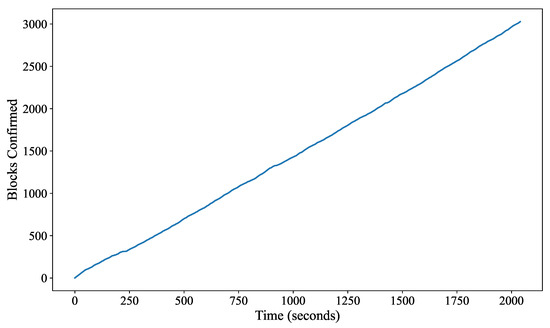
Figure 6.
Performance of BIONIB showing blocks confirmed per second, with a new block confirmed approximately every 0.5 s.
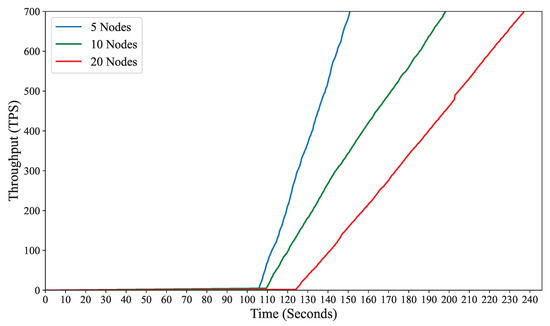
Figure 7.
Performance of BIONIB showing transaction throughput scaling proportionally with an increasing number of blockchain nodes.
Our analysis has revealed some interesting insights into the usage of resources. Figure 8 shows the block CPU usage as a percentage of 5000 μs during the first 30 s of transaction execution. It is remarkable that the CPU usage remains stable despite an increasing number of blockchain nodes. This is demonstrated in Figure 8d. This consistency in CPU usage can be attributed to the parallel processing capability of the EOSIO blockchain framework. By distributing computational tasks across multiple nodes, EOSIO ensures efficient resource utilization, enabling the CPU resources to handle transaction processing demands effectively.
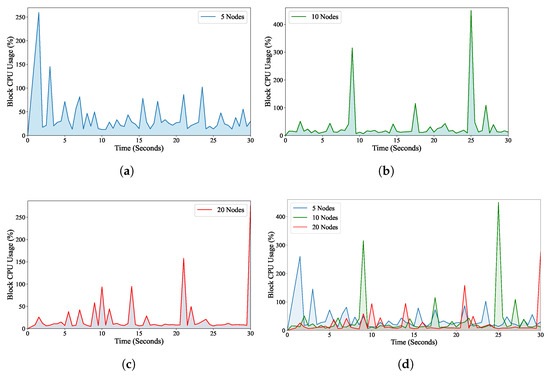
Figure 8.
The percentage of CPU usage for block confirmation is fairly consistent for 5, 10, and 20 blockchain nodes. (a) 5 blockchain nodes, (b) 10 blockchain nodes, (c) 20 blockchain nodes, (d) Comparison of block CPU usage for 5, 10, and 20 blockchain nodes.
In Figure 9, we observe the impact of increasing the number of blockchain nodes on the average latency of the system. As the number of nodes in the blockchain network grows, the process of reaching consensus becomes more complex and time-consuming. Consensus mechanism, DPoS requires all participating nodes to agree on the validity of transactions and the state of the blockchain. With more nodes involved, the consensus algorithm must coordinate a larger number of participants, leading to increased communication overhead and computational requirements. Consequently, the average latency, which measures the time taken for transactions to be confirmed and added to the blockchain, tends to rise as the network expands. This is depicted in Figure 9, where the average latency increases with the number of blockchain nodes. The higher latency observed with more nodes underscores the trade-off between decentralization and transaction speed inherent in blockchain networks. While a larger number of nodes enhances the network’s resilience and security by distributing control among multiple parties, it also introduces delays in transaction processing due to the consensus process’s increased complexity. To enhance blockchain performance, it is important to know the link between node number and latency. Our study of BIONIB with increasing nodes shows it is scalable and efficient. It can handle high transaction throughput and manage resources, making it suitable for large-scale deployments in bridge health monitoring applications. By managing resources, adjusting consensus parameters, and implementing scalability solutions, developers can mitigate latency effects caused by network growth, ensuring efficient transaction processing.
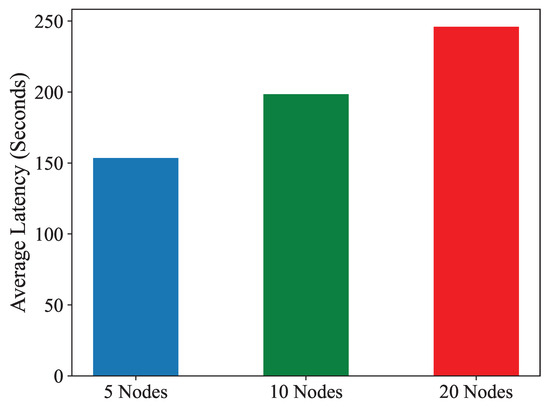
Figure 9.
Average latency of BIONIB for 5, 10, and 20 blockchain nodes, showing increased latency as the number of nodes grows.
6.3. Performance with Increasing of IoT Sensors
In this section, we explore the impact of increasing the number of sensors on the performance of our proposed methodology, BIONIB. This analysis is crucial for understanding how our approach manages changes in data volumes that arise with a growing number of sensors. This is a common scenario in bridge health monitoring applications.
We have observed a clear correlation between the number of sensors and the volume of transactions confirmed by our system, as shown in Figure 10. With each increase in the number of sensors, there is a corresponding rise in the number of transactions processed and confirmed by our method. This observation highlights the system’s capability to handle and process sensor data efficiently, ensuring timely and reliable transaction confirmation even as the data volume escalates. The increasing trend in confirmed transactions demonstrates the scalability and robustness of our approach, proving its ability to adapt to changing data volumes without compromising performance. By systematically scaling the number of sensors, we gain valuable insights into the system’s capacity to accommodate growing data loads, assuring its suitability for real-world deployment scenarios where sensor networks may expand over time. Moreover, the positive relationship between the number of sensors and confirmed transactions underscores the effectiveness of our approach in harnessing sensor data to derive meaningful insights and facilitate informed decision-making in bridge health monitoring. As the number of sensors increases, the volume of data available for analysis also increases, enabling more comprehensive and accurate assessments of bridge health and structural integrity.
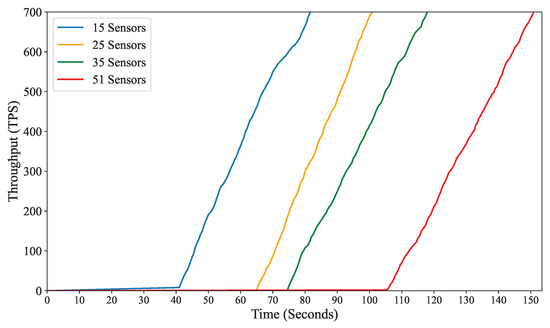
Figure 10.
The throughput versus time of BIONIB is plotted and is observed that the throughput scales with an increasing number of sensors.
In Figure 11, we observe the CPU resource utilization in our system as the number of sensors is scaled. The plot shows a consistent pattern of CPU usage among different sensor configurations, highlighting the robust parallel processing capability of the EOSIO blockchain framework. The stable CPU usage demonstrates the efficiency of the EOSIO blockchain in distributing computational tasks across multiple nodes, ensuring optimal resource utilization even under fluctuating data volumes and network conditions.
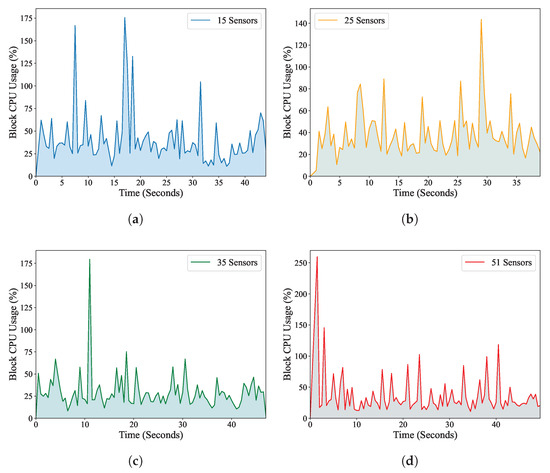
Figure 11.
The percentage of CPU usage for block confirmation is fairly consistent for 15, 25, 35, and 51 bridge IoT sensors. (a) 15 bridge IoT sensors, (b) 25 bridge IoT sensors, (c) 35 bridge IoT sensors, (d) 51 bridge IoT sensors.
This analysis examines the relationship between the number of sensors and the average latency of our system, as shown in Figure 12. The plot shows that as the number of sensors increases, the average latency also rises due to the larger volume of data generated by the growing sensor network. This increase in data volume adds computational overhead, resulting in longer transaction confirmation times. This is partly because of more time taken to calculate the NI with more sensor data. To accommodate increasing data volumes, it is crucial to optimize system resources and network architecture. The observed increase in latency highlights the scalability challenges associated with handling large-scale sensor deployments within decentralized systems. While the EOSIO blockchain framework provides robust parallel processing capabilities, increasing data volumes can increase latency.
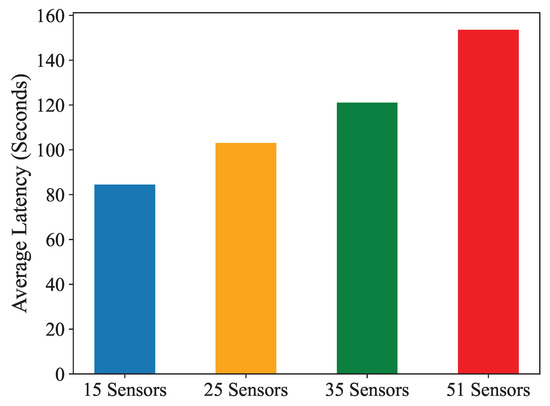
Figure 12.
The average latency is plotted for 15, 25, 35, and 51 bridge IoT sensors. The latency increases with an increase in the IoT sensors.
7. Discussion
We observe a scalability and latency tradeoff. As the number of sensors increases, the system’s scalability is tested by its ability to handle growing data volumes and transaction throughput. However, this scalability may lead to increased latency as processing and validating larger amounts of data can result in longer transaction confirmation times. Another tradeoff exists between resource utilization and performance. The efficient resource utilization of the EOSIO blockchain framework is demonstrated by the consistent CPU usage observed across different sensor configurations. However, stable resource utilization levels may require sacrificing some performance metrics, such as transaction throughput or latency. A balance between maximizing system throughput and minimizing resource consumption needs to be achieved. A tradeoff also exists between data processing efficiency and data volume. An increase in the number of sensors results in a larger volume of data generated, which must be processed and validated by the system. The EOSIO blockchain framework offers robust parallel processing capabilities, but handling large data volumes may introduce latency issues.
In this work, we conducted experiments using EOSIO smart contracts integrated with an NI approach for analyzing bridge sensor data. Our experimentation was conducted within a localized setup. However, for scenarios involving larger-scale data and a higher number of bridges, we propose the utilization of the TELOS implementation of the EOSIO blockchain specifically tailored for IoT data management.
In this study, we focus on storing scalar NI values on the blockchain rather than raw sensor data, which considerably reduces blockchain storage requirements and improves system scalability. However, this design inherently limits the ability to reprocess original sensor data for event validation, forensic investigations, or application of updated damage models—capabilities often required in real-world monitoring scenarios. The NI calculation used here builds upon the established methods in [20,21], which validate the NI as a sensitive and compact damage metric. To balance storage efficiency with forensic needs, potential extensions include integrating off-chain archival storage for raw data, linked via blockchain records, enabling selective retrieval and re-analysis while preserving the benefits of decentralized data integrity on-chain. This trade-off and its impact on practical deployment are discussed in detail to inform future work on hybrid storage architectures combining blockchain and traditional databases.
8. Conclusions
This research demonstrates how EOSIO blockchain technology can be used to monitor the health of bridges. By utilizing data from IoT sensors, a technique called the NI is used to obtain valuable insights. This technique is based on clustering and helps to identify unusual patterns in the sensor data. The integration of smart contracts enhances security and enables predictions based on the NI. The proposed scheme, BIONIB has the potential to securely store and analyze sensor data to enhance bridge health monitoring systems. The effectiveness of the scheme is evaluated by analyzing real-world IoT sensor data from healthy and unhealthy bridges. The evaluation also includes scenarios with varying numbers of sensors. This work contributes to the growing field of blockchain applications, particularly in the infrastructure monitoring context.
In the future, this approach can be extended to multiple bridges throughout the state by leveraging the virtual private blockchain feature of the EOSIO blockchain. The researchers also plan to conduct further analysis beyond NI calculations for bridge health monitoring. In future work, we will incorporate state-of-the-art unsupervised deep learning techniques (e.g., autoencoder-based damage localization) into the BIONIB framework while maintaining blockchain-based security and traceability. Our comparative analysis suggests that BIONIB fills a unique niche by coupling NI-based detection with a decentralized architecture, offering real-time alerts and transparent, verifiable records across sensor nodes.
Author Contributions
Conceptualization, All Authors; methodology, D.S.G. and S.E.A.; software, D.S.G. and R.M.; validation, All authors; formal analysis, D.S.G. and R.M.; investigation, D.S.G., D.K., and S.E.A.; resources, All authors; data curation, S.E.A. and R.M.; writing—original draft preparation, D.S.G.; writing—review and editing, S.E.A. and D.K.; visualization, D.S.G. and R.M.; supervision, D.K. and S.E.A.; project administration, D.K. and S.E.A.; funding acquisition, D.K. and S.E.A. All authors have read and agreed to the published version of the manuscript.
Funding
This work was partially supported by contracts W912HZ21C0060 and W912HZ23C0005 from the U.S. Army Corps of Engineers, Engineering Research and Development Center (ERDC).
Data Availability Statement
The data supporting the findings of this study are available from the authors upon reasonable request.
Conflicts of Interest
The authors declare that they have no conflict of interest.
References
- Sony, S.; Laventure, S.; Sadhu, A. A literature review of next-generation smart sensing technology in structural health monitoring. Struct. Control Health Monit. 2019, 26, e2321. [Google Scholar] [CrossRef]
- Skordilis, E.; Moghaddass, R. A deep reinforcement learning approach for real-time sensor-driven decision making and predictive analytics. Comput. Ind. Eng. 2020, 147, 106600. [Google Scholar] [CrossRef]
- Yi, L.; Deng, X.; Yang, L.T.; Wu, H.; Wang, M.; Situ, Y. Reinforcement-learning-enabled partial confident information coverage for IoT-based bridge structural health monitoring. IEEE Internet Things J. 2020, 8, 3108–3119. [Google Scholar] [CrossRef]
- Xu, J.; Liu, H.; Han, Q. Blockchain technology and smart contract for civil structural health monitoring system. Comput.-Aided Civ. Infrastruct. Eng. 2021, 36, 1288–1305. [Google Scholar] [CrossRef]
- Ali, M.S.; Vecchio, M.; Pincheira, M.; Dolui, K.; Antonelli, F.; Rehmani, M.H. Applications of blockchains in the Internet of Things: A comprehensive survey. IEEE Commun. Surv. Tutorials 2018, 21, 1676–1717. [Google Scholar] [CrossRef]
- Chen, Z.; Zhou, X.; Wang, X.; Dong, L.; Qian, Y. Deployment of a smart structural health monitoring system for long-span arch bridges: A review and a case study. Sensors 2017, 17, 2151. [Google Scholar] [CrossRef]
- Alenazy, W.M. Blockchain-Enabled internet of things for unsupervised structural health monitoring in potential building structures. In Handbook of Research on Innovations and Applications of AI, IoT, and Cognitive Technologies; IGI Global: Hershey, PA, USA, 2021; pp. 158–170. [Google Scholar]
- Abou Jaoude, J.; Saade, R.G. Blockchain applications–usage in different domains. IEEE Access 2019, 7, 45360–45381. [Google Scholar] [CrossRef]
- Wu, M.; Wang, K.; Cai, X.; Guo, S.; Guo, M.; Rong, C. A comprehensive survey of blockchain: From theory to IoT applications and beyond. IEEE Internet Things J. 2019, 6, 8114–8154. [Google Scholar] [CrossRef]
- Bodkhe, U.; Tanwar, S.; Parekh, K.; Khanpara, P.; Tyagi, S.; Kumar, N.; Alazab, M. Blockchain for industry 4.0: A comprehensive review. IEEE Access 2020, 8, 79764–79800. [Google Scholar] [CrossRef]
- Gadiraju, D.S.; Lalitha, V.; Aggarwal, V. Secure regenerating codes for reducing storage and bootstrap costs in sharded blockchains. In Proceedings of the 2020 IEEE International Conference on Blockchain (Blockchain), Rhodes, Greece, 2–6 November 2020; pp. 229–236. [Google Scholar]
- Cai, X.; Geng, S.; Zhang, J.; Wu, D.; Cui, Z.; Zhang, W.; Chen, J. A sharding scheme-based many-objective optimization algorithm for enhancing security in blockchain-enabled industrial internet of things. IEEE Trans. Ind. Inform. 2021, 17, 7650–7658. [Google Scholar] [CrossRef]
- Khan, P.W.; Byun, Y.C.; Park, N. IoT-blockchain enabled optimized provenance system for food industry 4.0 using advanced deep learning. Sensors 2020, 20, 2990. [Google Scholar] [CrossRef]
- Gadiraju, D.S.; Lalitha, V.; Aggarwal, V. An optimization framework based on deep reinforcement learning approaches for prism blockchain. IEEE Trans. Serv. Comput. 2023, 16, 2451–2461. [Google Scholar] [CrossRef]
- Aljuhani, A.; Kumar, P.; Alanazi, R.; Albalawi, T.; Taouali, O.; Islam, A.N.; Kumar, N.; Alazab, M. A Deep Learning Integrated Blockchain Framework for Securing Industrial IoT. IEEE Internet Things J. 2023, 11, 7817–7827. [Google Scholar] [CrossRef]
- Du, A.; Ghavidel, A. Parameterized deep reinforcement learning-enabled maintenance decision-support and life-cycle risk assessment for highway bridge portfolios. Struct. Saf. 2022, 97, 102221. [Google Scholar] [CrossRef]
- Gadiraju, D.S.; Muthiah, S.R.; Khazanchi, D. A Deep Reinforcement Learning based Approach for Bridge Health Maintenance. In Proceedings of the 2023 International Conference on Computational Science and Computational Intelligence (CSCI), Las Vegas, NV, USA, 13–15 December 2023; pp. 43–48. [Google Scholar] [CrossRef]
- Da Silva, S.; Dias Junior, M.; Lopes Junior, V. Structural health monitoring in smart structures through time series analysis. Struct. Health Monit. 2008, 7, 231–244. [Google Scholar] [CrossRef]
- Xiao, F.; Mao, Y.; Tian, G.; Chen, G.S. Partial-Model-Based Damage Identification of Long-Span Steel Truss Bridge Based on Stiffness Separation Method. Struct. Control Health Monit. 2024, 2024, 5530300. [Google Scholar] [CrossRef]
- Ardani, S.; Akintunde, E.; Linzell, D.; Azam, S.E.; Alomari, Q. Evaluating pod-based unsupervised damage identification using controlled damage propagation of out-of-service bridges. Eng. Struct. 2023, 286, 116096. [Google Scholar] [CrossRef]
- Akintunde, E.; Azam, S.E.; Rageh, A.; Linzell, D.G. Unsupervised machine learning for robust bridge damage detection: Full-scale experimental validation. Eng. Struct. 2021, 249, 113250. [Google Scholar] [CrossRef]
- Jo, B.W.; Khan, R.M.A.; Lee, Y.S. Hybrid blockchain and internet-of-things network for underground structure health monitoring. Sensors 2018, 18, 4268. [Google Scholar] [CrossRef]
- Gordan, M.; Ismail, Z.; Mohd Rahim, F.A.; Chao, O.Z.; Ibrahim, Z.; Hashim, H.; Kiong, L.C. Defining a conceptual framework for vibration-based damage detection platforms using blockchain. J. Civ. Eng. Mater. Appl. 2021, 5, 25–33. [Google Scholar]
- Zhang, D.M.; Nie, C.; Zhang, J.Z.; Huang, H.W.; Huang, X. Consortium blockchain-based tunnel data bank for traceable sharing and treatment of structural health monitoring data. Autom. Constr. 2024, 167, 105720. [Google Scholar] [CrossRef]
- Zheng, W.; Zheng, Z.; Dai, H.N.; Chen, X.; Zheng, P. XBlock-EOS: Extracting and exploring blockchain data from EOSIO. Inf. Process. Manag. 2021, 58, 102477. [Google Scholar] [CrossRef]
- Perez, D.; Xu, J.; Livshits, B. Revisiting transactional statistics of high-scalability blockchains. In Proceedings of the ACM Internet Measurement Conference, Virtual, 27–29 October 2020; pp. 535–550. [Google Scholar]
- He, N.; Zhang, R.; Wang, H.; Wu, L.; Luo, X.; Guo, Y.; Yu, T.; Jiang, X. EOSAFE: Security analysis of EOSIO smart contracts. In Proceedings of the 30th USENIX Security Symposium (USENIX Security 21), Vancouver, BC, USA, 11–13 August 2021; pp. 1271–1288. [Google Scholar]
- Liu, J.; Zheng, W.; Lu, D.; Wu, J.; Zheng, Z. From decentralization to oligopoly: A data-driven analysis of decentralization evolution and voting behaviors on EOSIO. IEEE Trans. Comput. Soc. Syst. 2022, 10, 2752–2763. [Google Scholar] [CrossRef]
- Fernández-Carrasco, J.Á.; Echeberria-Barrio, X.; Paredes-García, D.; Zola, F.; Orduna-Urrutia, R. ChronoEOS 2.0: Device Fingerprinting and EOSIO Blockchain Technology for On-Running Forensic Analysis in an IoT Environment. Smart Cities 2023, 6, 897–912. [Google Scholar] [CrossRef]
- He, N.; Wang, H.; Wu, L.; Luo, X.; Guo, Y.; Chen, X. A Survey on EOSIO Systems Security: Vulnerability, Attack, and Mitigation. Front. Comput. Sci. 2025, 19, 196806. [Google Scholar] [CrossRef]
- Gadiraju, D.S.; Aggarwal, V. Prism blockchain enabled Internet of Things with deep reinforcement learning. Blockchain Res. Appl. 2024, 5, 100205. [Google Scholar] [CrossRef]
- Gadiraju, D.S.; Khazanchi, D. Blockchain-Driven Framework for DRL-Controlled UAV Bridge Health Monitoring. IEEE Intell. Syst. 2025, 40, 19–28. [Google Scholar] [CrossRef]
- Pathirage, C.S.N.; Li, J.; Li, L.; Hao, H.; Liu, W.; Ni, P. Structural damage identification based on autoencoder neural networks and deep learning. Eng. Struct. 2018, 172, 13–28. [Google Scholar] [CrossRef]
- Diez, A.; Khoa, N.L.D.; Makki Alamdari, M.; Wang, Y.; Chen, F.; Runcie, P. A clustering approach for structural health monitoring on bridges. J. Civ. Struct. Health Monit. 2016, 6, 429–445. [Google Scholar] [CrossRef]
- Grigg, I. Eos—An Introduction. White Paper. 2017. Available online: https://www.semanticscholar.org/paper/EOS-An-Introduction-Grigg/c7a922dffb06ee1a75e1a5527c557da21b3c1d90 (accessed on 25 September 2025).
- EOSIO. EOSIO GitHub Organization. 2024. Available online: https://github.com/EOSIO (accessed on 25 September 2025).


Disclaimer/Publisher’s Note: The statements, opinions and data contained in all publications are solely those of the individual author(s) and contributor(s) and not of MDPI and/or the editor(s). MDPI and/or the editor(s) disclaim responsibility for any injury to people or property resulting from any ideas, methods, instructions or products referred to in the content. |
© 2025 by the authors. Licensee MDPI, Basel, Switzerland. This article is an open access article distributed under the terms and conditions of the Creative Commons Attribution (CC BY) license (https://creativecommons.org/licenses/by/4.0/).