Article

Effects of Sports Shoe Drop on Walking Biomechanics: A Cross-Sectional Observational Dynamometric Study

by
Raquel Fragua-Blanca
1,
Natalia Tovaruela-Carrión
2,
Paula Cobos-Moreno
3,
Manuel Jesús Tena-León
4 and
Elena Escamilla-Martínez
3,*
1
Department of Nursing, Physiotherapy and Occupational Therapy, Faculty of Health Sciences, University of Castilla-La Mancha, 45600 Talavera de la Reina, Spain
2
Departamento de Podología, Facultad de Enfermería, Fisioterapia y Podología, Universidad de Sevilla, 41009 Sevilla, Spain
3
Departamento de Enfermería, Centro Universitario de Plasencia, Universidad de Extremadura, 10600 Plasencia, Spain
4
Máster Universitario en Podología Deportiva, Universidad Católica de Valencia San Vicente Mártir, 46001 Valencia, Spain
*
Author to whom correspondence should be addressed.
Appl. Sci. 2025, 15(19), 10515; https://doi.org/10.3390/app151910515
Submission received: 28 July 2025 / Revised: 22 September 2025 / Accepted: 22 September 2025 / Published: 28 September 2025
(This article belongs to the Special Issue Applied Biomechanics for Sport Performance and Injury Rehabilitation)

Abstract

Sports footwear is widely used across a range of physical activities. A key factor distinguishing running shoes from other types of footwear is the “drop,” the millimeter difference between the heel and the forefoot. This study aimed to analyze the influence of different drops (0, 5, and 10 mm) on ground reaction forces during walking and to examine the effects of sex and body mass index (BMI) under these conditions. An observational, descriptive, and cross-sectional study was conducted with 117 participants (56 men and 61 women). The Dinascan/IBV® dynamometric platform (Instituto de Biomecánica de Valencia, Valencia, Spain) was used to measure ground reaction forces during walking (braking, take-off, propulsion, and swing forces), walking speed, and stance time. The descriptive analysis revealed comparable values for the left and right limbs, with slightly higher values observed in the right limb. Statistically significant differences were found in stance time, braking force, and swing force between the 0 mm and 10 mm drop conditions. Take-off force showed highly significant differences when comparing the 0–5 mm and 0–10 mm drop conditions. Sex-based differences were observed in all variables at the initial proposed drop condition of 0 mm, except for walking speed, possibly due to anatomical and physiological differences. Significant differences were found in stance time at 0 mm drop, braking force, and propulsion force. Highly significant values were obtained for take-off force and during the swing phase. A strong correlation was found between ground reaction forces and BMI with the different proposed drops in all forces studied, except for the support force, where a moderate correlation was obtained. Although shoe drop was found to influence ground reaction forces in this study, it is one of several factors that affect gait biomechanics. Other footwear characteristics, such as sole stiffness, material composition, weight, and elasticity, also play important roles in walking performance. Therefore, shoe drop should be considered an important but not exclusive parameter when selecting footwear. However, these results are limited to healthy young adults and may not be generalizable to other age groups or populations.

1. Introduction

Human gait is a complex biomechanical process that begins in the first year of life and is influenced by multiple factors, including footwear [1,2]. In recent years, the growing popularity of sports has been accompanied by an increase in lower-limb injuries, which has intensified interest in footwear as both a potential preventive factor and a possible source of risk [3,4].
Walking is a locomotor activity that requires precise coordination of joints and muscles and wearing the appropriate footwear for each sport is crucial for preventing injuries. Features such as cushioning, stability, weight, and movement control can alter the distribution of ground reaction forces and the mechanical load on different musculoskeletal structures [5,6].
One of the most relevant parameters in this context is drop, defined as the difference in millimeters between the height of the heel and the forefoot. According to the literature, drop is commonly classified as high (8–12 mm), medium (4–8 mm), or low (0–4 mm) [3,7].
Some studies suggest that a high drop can reduce the load on the Achilles tendon [8]. Others have noted that a low drop may encourage a more anterior foot strike pattern, altering muscle activation and ground reaction forces [9,10].
To evaluate possible differences in the kinetics of gait, tools like dynamometric platforms are used to measure ground reaction forces across the three axes (x, y, z) and provide quantitative information on load distribution during walking [11]. In this context, the present study aims to analyze the dynamometric differences in gait with different drops (0 mm, 5 mm, and 10 mm), quantifying the ground reaction forces (braking force, propulsion force, take-off force, and swing force) with the three drops studied, analyzing the differences in ground reaction forces by sex, and determining the differences in ground reaction forces based on the body mass index (BMI) using a Dinascan/IBV® dynamometric platform [12,13].
Previous studies have extensively examined the influence of shoe heel height and drop on gait biomechanics, consistently reporting that increases in heel elevation alter plantar pressure distribution and ground reaction forces. Several authors [14,15,16] have further indicated that drops below 5 mm may exert only minimal or negligible effects on gait mechanics. While running biomechanics has been widely investigated—with numerous studies on kinematics and kinetics emphasizing the role of footwear characteristics, including shoe drop [16,17,18]—the specific impact of shoe drop during walking remains comparatively underexplored. This underscores the need for additional research to clarify how shoe drop influences walking biomechanics.
Most research has focused on running-related performance and injury prevention, leaving a gap in knowledge regarding how shoe design features, such as drop, affect walking. Given that walking is the most common daily locomotor activity, understanding these effects is crucial to broaden the scientific evidence and to inform both clinical practice and footwear design.
Our main hypothesis is that differences in drop directly influence the biomechanics of walking, specifically its kinetics.

2. Materials and Methods

2.1. Study Design

An observational, descriptive, and cross-sectional study was conducted in compliance with the ethical principles outlined in the Declaration of Helsinki and the Biomedical Research Act 14/2007. The study design was approved by the University of Extremadura Research Ethics Committee (ID: 137//2023) approved on 28 September 2023. All participants signed informed consent forms to participate in this study.
This study was conducted and reported following the Strengthening the Reporting of Observational Studies in Epidemiology (STROBE) guidelines.

2.2. Sample

To calculate the sample size, the following formula was used:
n = z α 2 2 · s 2 E F 2
S: Estimation of the standard deviation based on this study. The value 0.05 is taken.
Confidence level = 1 − α = 95%, so zα/2 = 1.96.
Error factor (EF): determines the precision with which the mean is to be estimated, that is, the width of the confidence interval.
The value of 0.01 is taken.
Therefore, the final equation that was used was:
n = z α 2 2 · s 2 E F 2 = 1.96 2 · 0.05 2 0.01 2 = 96.04 97
The conclusion reached was that at least 97 cases were required to estimate an average value meeting these requirements.
The sample consisted of 117 participants (56 males and 61 females), students of the Podiatry degree program at the University of Extremadura University Centre of Plasencia. Subjects were between 18 and 28 years old, which may limit the generalization of the results, with a mean age of 21.63 ± 2.4 years, a mean weight of 71.08 ± 14.05 kg, a mean height of 169.29 ± 9.3 cm, and a mean BMI of 25.02 ± 5.59 kg/m2. Inclusion criteria were: (a) age between 18 and 30 years, (b) physical and mental capability to voluntarily participate by signing informed consent, (c) absence of any pathology or surgery affecting normal gait. Exclusion criteria involved not meeting these requirements.

2.3. Data Collection Protocol

For data collection, first of all, we fabricated insoles with varying drops to be studied. The insoles used in this study were custom-fabricated with varying drop heights. Each consisted of a 1.9 mm rigid resin base, a layer of high-density EVA with a Shore A hardness of 70° for drop simulation (5 mm and 10 mm), and a 1 mm micro-perforated top cover for comfort and breathability (Figure 1). The EVA material was selected for its mechanical properties, including high resilience, shock absorption, and deformation resistance, all relevant in simulating realistic gait conditions. The insoles were designed to fit snugly into the shoe, ensuring a stable placement during walking trials.
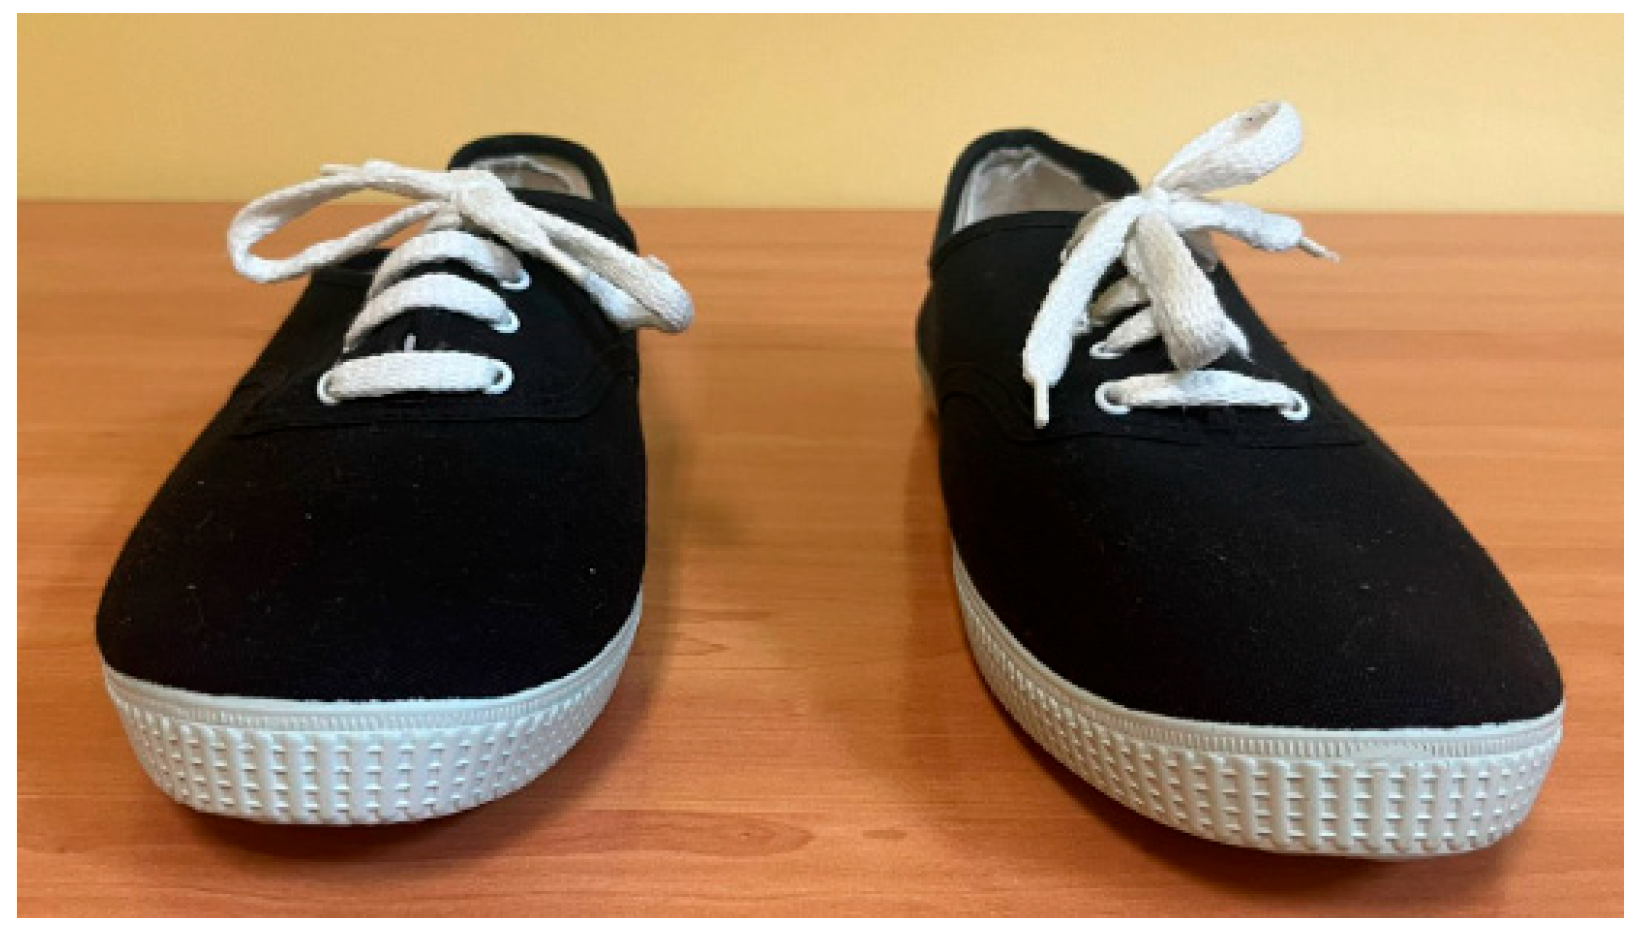
The insoles were placed in standard lace-up canvas shoes (Figure 2) before each measurement. Standard lace-up shoes refer to a generic model without added specific technologies such as cushioning systems or pronation control. These shoes are adjusted to the foot using a traditional lacing system, and the material they are made of is canvas.
This type of shoe was chosen because it was neutral in design, with no initial drop and a minimal structure, lacking motion control elements, arch support, or rigid components. This selection aimed to standardize baseline conditions and minimize external interferences with natural gait mechanics before applying the insoles with different drop heights.
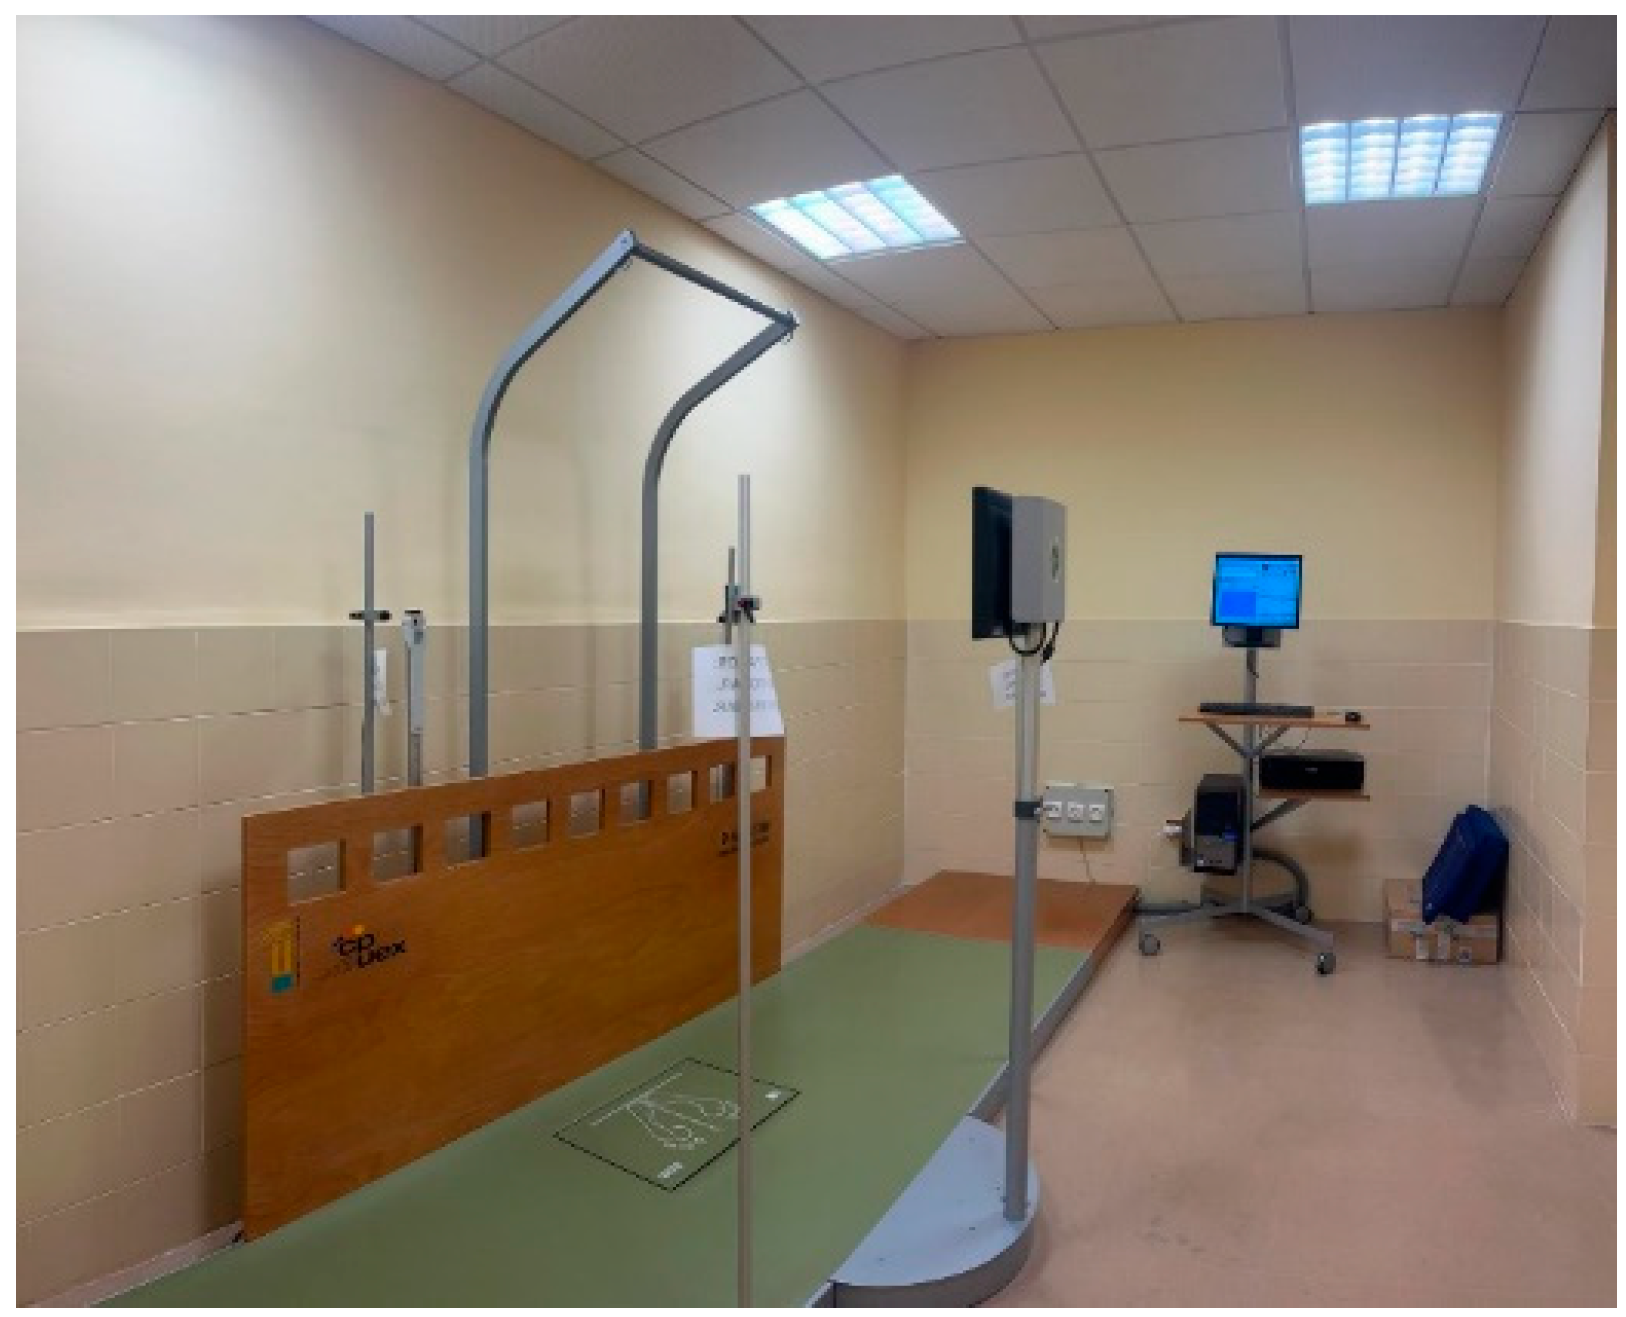
First, we measured 0 mm drop, then 5 mm drop, and finally 10 mm drop. The gait process and ground reaction forces were evaluated using the Dinascan/IBV® P600 force platform (600 × 370 mm active area, 100 mm height, and 25 kg), integrated with the NedAMH/IBV® system (Instituto de Biomecánica de Valencia, Valencia, Spain) (Figure 3). The sampling frequency was 1000 Hz. The platform has a measurement range for vertical forces up to 2500 N and for horizontal forces of ±500 N. The uncertainty is ±10 N for vertical forces and ±25 N for horizontal forces. Accuracy and repeatability for the center of pressure are ±1 mm in the 0–40 mm range and ±2 mm in the 40–200 mm range.
This high sampling rate ensures sufficient temporal resolution to accurately capture dynamic events of the gait cycle.
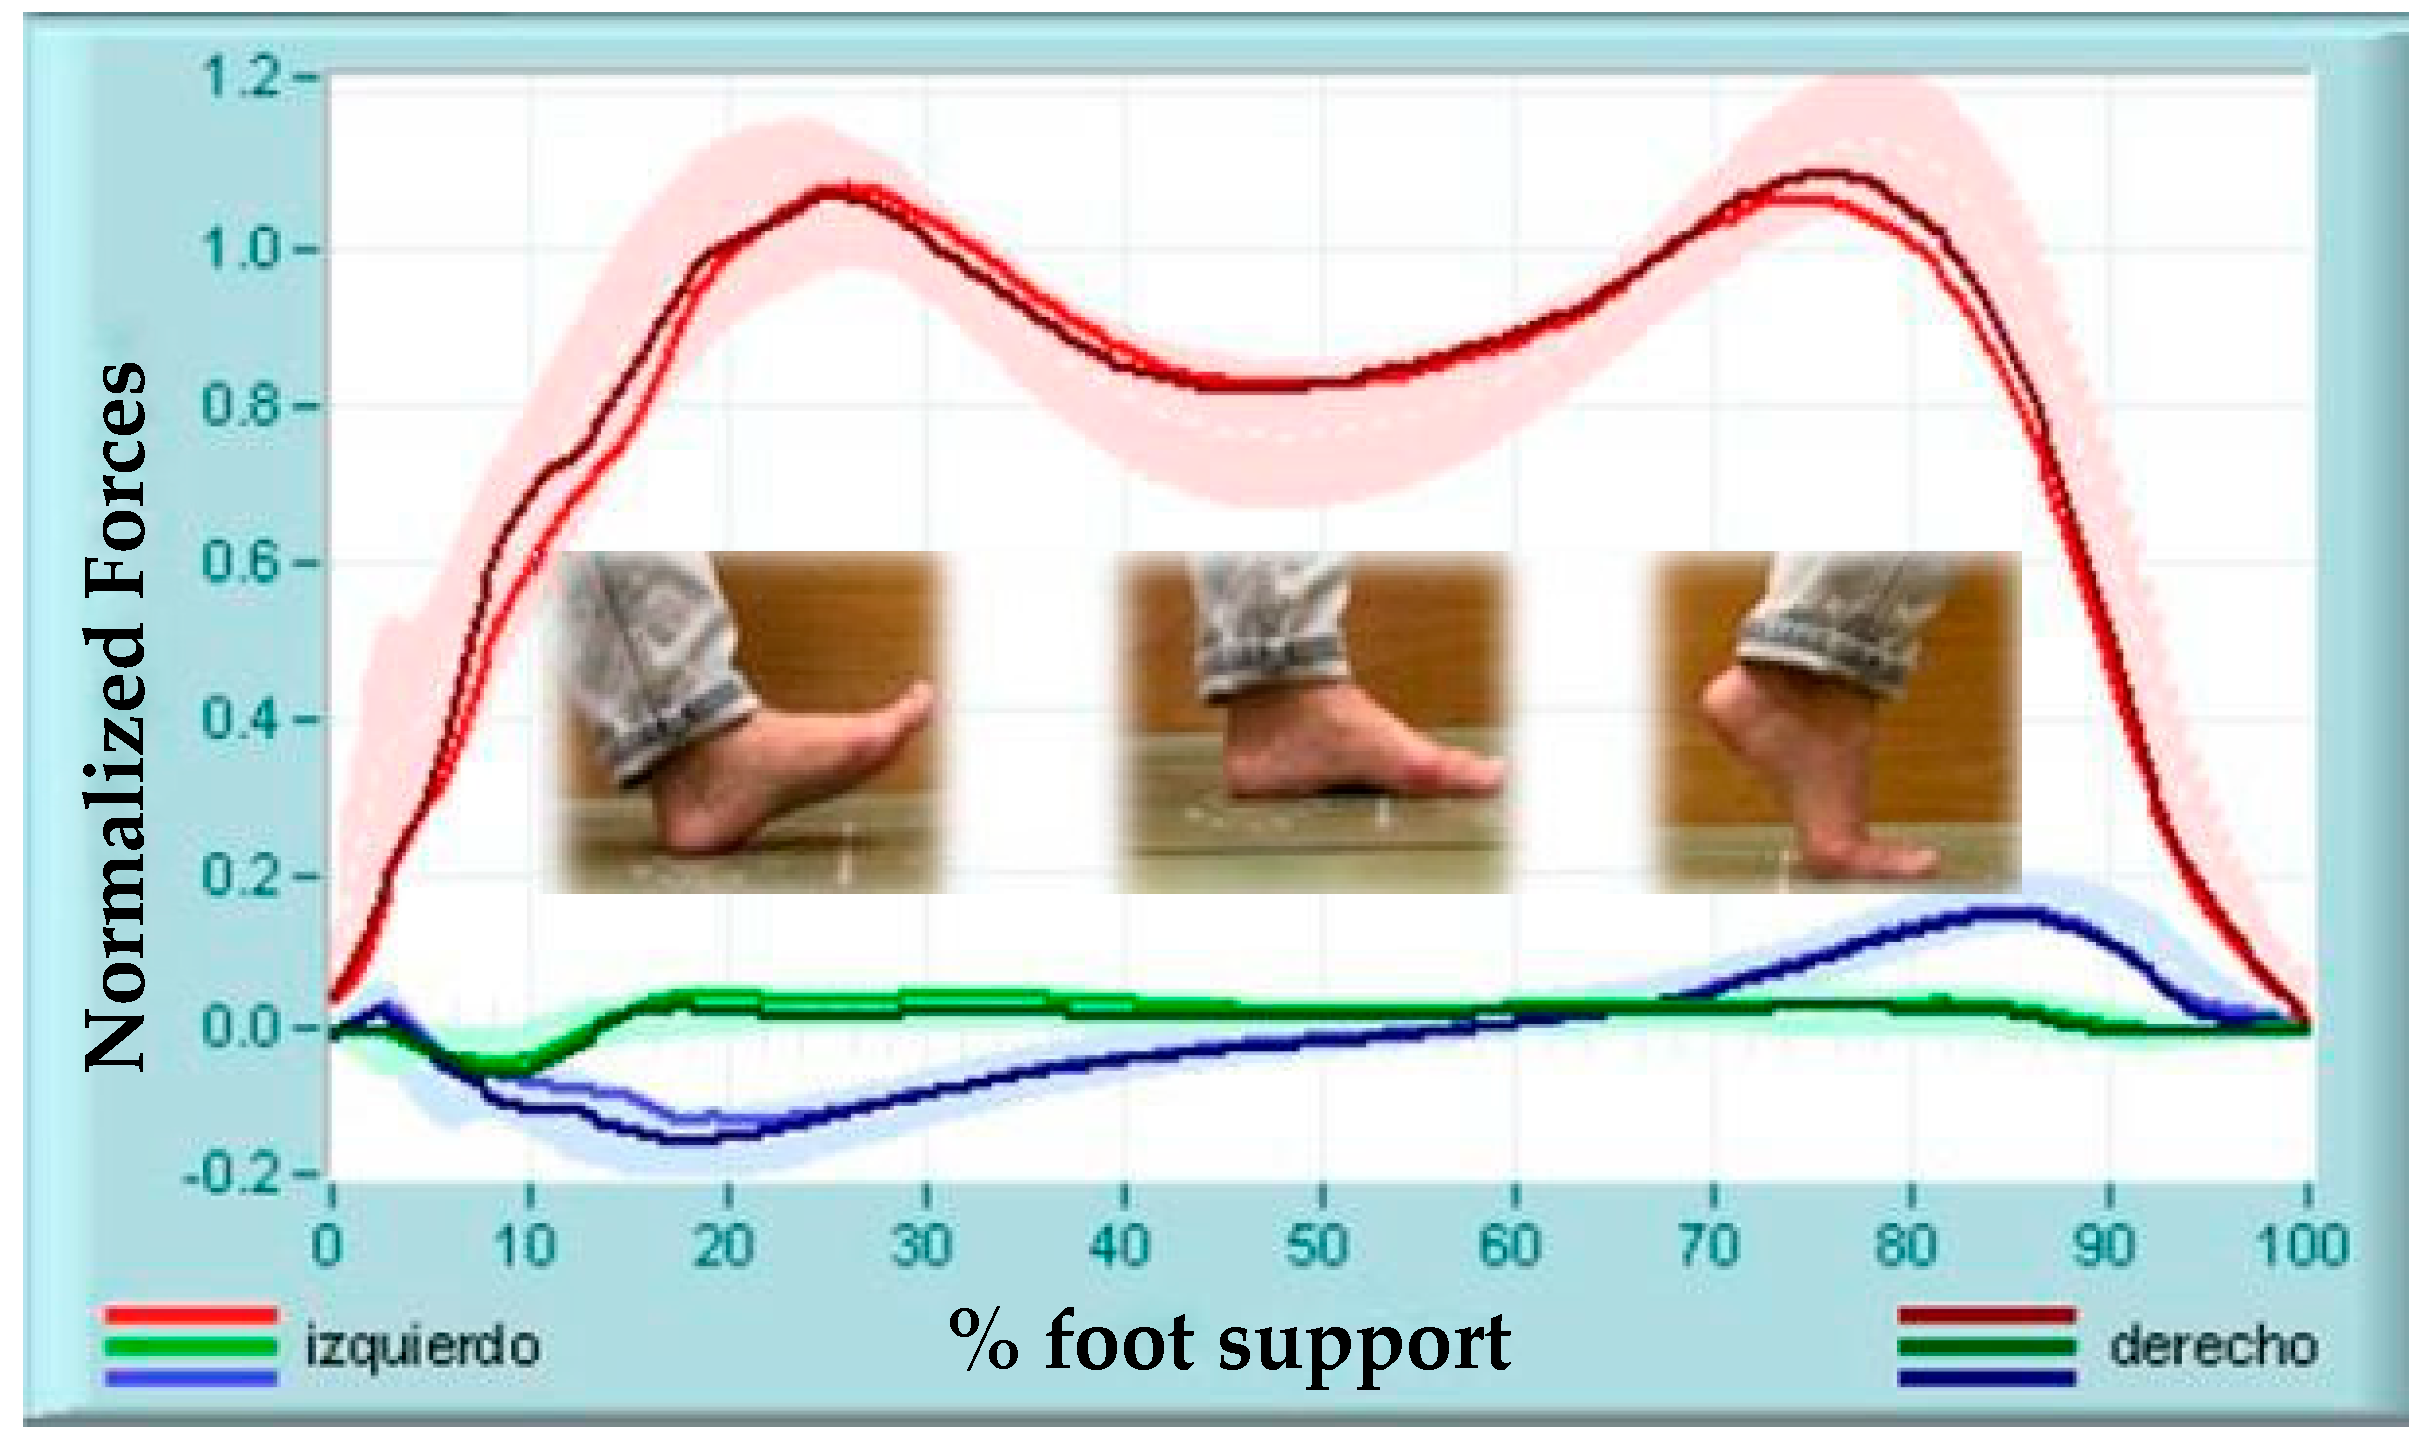
Vertical ground reaction forces were analyzed across all three axes: the X-axis (mediolateral force), the Y-axis (anteroposterior force), and the Z-axis (vertical force), providing a comprehensive characterization of foot–ground interaction during the stance phase of gait.
To identify the gait cycle events, heel strike and toe-off were defined based on the vertical ground reaction force curve obtained from the force platform (Figure 4). Heel strike was determined as the point at which a significant vertical force began to be recorded, indicating the start of the stance phase. Toe-off was defined as the point at which the vertical force decreased to a level signaling the end of this phase.
Vertical force peaks were automatically identified using the NedAMH/IBV software associated with the Dinascan/IBV platform P600 (Instituto de Biomecánica de Valencia, Valencia, Spain) and were manually verified when necessary.
Each participant completed three valid trials for each footwear condition (0 mm, 5 mm, and 10 mm drop). The order of testing was fixed, starting with the condition without drop (0 mm), followed by 5 mm, and finally 10 mm. This fixed sequence may have introduced potential order effects, such as fatigue, adaptation, or learning, which should be taken into account when interpreting the results.
A trial was considered valid if the participant performed the task without interruptions and both feet made appropriate contact on the force platforms. In cases of execution errors or motion artifacts, the trial was repeated to ensure data quality. For each condition, the average of the three valid trials was used for analysis.
Before measurements, the platform was calibrated according to the manufacturer’s guidelines and taking into account the specified sensitivity and error limits, and the subject’s weight was recorded by standing on it. Subjects were then instructed to walk down the walkway at a normal pace to detect their reference walking speed.
Each sample consisted of eight steps (four with the left foot and four with the right foot) following a validated second-step protocol [19], which has been shown to be reliable, maintaining a constant speed (±10% of the recorded reference speed). Measurements only began once the subjects were fully familiarized with both the system and the measurement protocol.
To achieve this, participants were first given an explanation of the measurement protocol, and they practiced the second-step protocol for 5 min beforehand.

2.4. Statistical Analysis

Statistical analysis was conducted using IBM SPSS Statistics 27. First, descriptive statistics were performed, calculating the mean and standard deviation (SD). Data analysis was conducted in a blinded manner to minimize potential bias.
Inferential analysis was conducted to draw conclusions after posing statistical hypotheses regarding the study variables.
The behavior of the data was analyzed using the Kolmogorov–Smirnov test to determine if the data followed a normal distribution and thus determine the most appropriate statistical test to analyze the collected data.
ANOVA and Friedman repeated measures tests were used to observe variations in force values with the three drops used. Subsequently, a post-hoc (pairwise) test was conducted to determine with which drop condition the greatest changes in the plantar support force pattern occurred.
The independent t-test and Mann–Whitney U test for independent samples were carried out to analyze potential differences in ground reaction forces between sexes with the different proposed drops.
A correlational analysis was also performed, calculating the Spearman’s Rho coefficient to analyze the different ground reaction forces with the three proposed drops according to BMI and to determine the intensity and trend in the relationship between the variables.
The significance level was set at p < 0.05.

3. Results

First, a descriptive analysis of the sample was conducted to obtain mean and standard deviation (SD) values (Table 1). Similar data were obtained for the left and right feet, with values slightly higher in the right foot.
Next, ANOVA and the Friedman test for related samples were performed to determine in which variables significant differences existed, followed by pairwise post-hoc tests for variables with p < 0.005, to determine between which drop conditions those differences occurred (Table 2).
No significant differences in speed or propulsion were found in any case. Pairwise comparisons revealed that no significant differences were found between 5 and 10 mm drop conditions, only take-off force differed between 0 and 5 mm drop conditions (p < 0.001), and significant differences were found in all force variables (braking, propulsion, take-off, and swing) when comparing 0 and 10 mm drops (p = 0.015, p = 0.010, p < 0.001, and p = 0.001, respectively) and in stance time (p = 0.015).
Subsequently, we wanted to compare the differences that might exist in ground reaction forces between sexes with the different proposed drops. First, a descriptive analysis was carried out, obtaining the mean, and then the independent samples t-test and the Mann–Whitney U test for independent samples were conducted.
Significant differences were found with 0 drop between both sexes in all the forces studied, as well as in the stance time (Table 3).
Regarding the analysis of ground reaction force (GRF), normalization by body mass was not performed due to the non-normal distribution of body mass index (BMI) in the sample, as evidenced by a significant proportion of participants with BMI values above 30. This characteristic is clinically relevant within the young university population, reflecting an increasing trend toward overweight and obesity. Rather than being considered a limitation, this distribution provides a realistic and current perspective on the impact of BMI on plantar support mechanics, leading us to retain the data without direct normalization. Finally, differences in ground reaction forces according to BMI with the three proposed drops were examined. For this purpose, Spearman’s Rho correlation test was used to assess the relationship and strength of association between ground reaction forces and BMI in relation to the three proposed drops (Table 4).
A strong correlation was found between the ground reaction forces and BMI with the different proposed drops in all the forces studied, except for the support force, where a moderate correlation was obtained.

4. Discussion

The results showed that the maximum and minimum vertical ground reaction forces were similar in both feet, although slightly higher in the right foot. This finding in consistent with previous studies, such as Peters (1988), who attributed these differences to limb dominance [20]. Since gait is a complex action involving biomechanical and neurophysiological factors, the absence of significant bilateral differences allows us to consider the gait pattern symmetric in our sample [21,22].
No significant differences in gait speed were found with increased drop, likely due to the age homogeneity of our young population [23,24,25,26,27]. Changes in stance time observed with different drop heights can be explained by increased plantar flexion at the ankle joint, which prolongs the gait cycle, as supported by Lieberman and Bonacci [28,29,30,31].
Furthermore, braking force was greater with a 10 mm drop than with 0 mm, consistent with studies in runners that relate a greater drop to increased ankle dorsiflexion and ground reaction force at initial contact [7,32,33]. Take-off force, the highest among the forces studied, reflects the greater load borne by the forefoot during this phase and is consistent by Newton’s third law, as applied in dynamometric assessments [34]. Significant differences were found between 0 and 5 mm drop and 0 and 10 mm drop, likely linked to greater initial plantar flexion. Propulsion force, although essential for forward movement, was lower than take-off force, as reported in previous studies [12,35,36]. Swing phase force, contributing to stability during the airborne phase, may increase with greater plantar flexion at initial contact.
Regarding sex differences, significant differences in reaction forces were already observed from the initial no-drop condition, attributable to well-documented anatomical and physiological variations: greater lumbar lordosis in women [37], higher bone density in men [38], and differences in pelvic structure [39]. Velez Vázquez [40] identified significant sex differences in weight, height, lower limb length, and the strength of the quadriceps and gastrocnemius muscles, with higher values in men. On the other hand, muscle flexibility is greater in women due to the presence of estrogen and high levels of relaxing [39]. Therefore, it is not possible to attribute the observed changes solely to drop.
Concerning body mass index, a direct and significant correlation was found with ground reaction forces in all conditions. Specifically, braking force showed a moderate to strong correlation, and propulsion, take-off, and swing forces showed strong correlations with BMI, consistent with Newton’s third law [34]. Clinically, these associations suggest that overweight may increase joint loading and risk of osteoarticular injuries [41].

5. Limitations

This study was conducted in a sample of young adults, limiting generalization to other age groups. Another limitation of the present study is that no correction for multiple comparisons was applied, which may have increased the risk of type I error; thus, the results should be interpreted with caution. Ground reaction forces were analyzed in absolute values without normalization by body mass, which reduces the comparability of our findings with those of other studies and may contribute to the variability observed among participants.
Kinematic, postural, and laterality variables, which could influence ground reaction forces, were not considered and should be addressed in future research. In particular, limb dominance and the identification of the supporting leg during gait were not evaluated in this study; this limitation may affect the interpretation of asymmetries observed between limbs. Although gait speed was controlled, it was not analyzed as an independent variable. Finally, the range of footwear was limited due to restricted collaboration from commercial brands, affecting the diversity of drop types evaluated.
The use of a convenience sample composed exclusively of young students may have introduced selection bias and restricts the generalization of the results. In addition, the fixed testing order (0, 5, and 10 mm) may have led to sequence effects, such as fatigue or adaptation, which should be considered when interpreting the findings.
Additionally, this study only evaluated footwear drops of 0, 5, and 10 mm, without testing negative drops or drops greater than 10 mm, which limits the continuum of the investigation. Future research should consider a broader range of drop values to provide a more comprehensive understanding of their effects on walking biomechanics. Furthermore, shoe size was not analyzed as a variable, despite its potential influence on ground reaction forces and gait dynamics due to differences in foot length and proportions between forefoot and rearfoot. Including shoe size in future studies would be valuable to better elucidate its role in the interaction between footwear and gait biomechanics.

6. Conclusions

These findings provide evidence that shoe drop affects ground reaction forces during walking in healthy young adults. However, they cannot be generalized to other age groups or populations, and further research is required to confirm these results in broader cohorts.
The footwear drop significantly affects ground reaction force values during walking in healthy young adults.
Significant differences in ground reaction forces between sexes were observed, reflecting possible anatomical and physiological influences on biomechanical response.
BMI is positively correlated with the magnitude of ground reaction forces under the tested conditions.

Author Contributions

Conceptualization R.F.-B. and E.E.-M.; methodology, R.F.-B. and E.E.-M.; data curation and formal analysis P.C.-M.; writing—original draft preparation R.F.-B. and M.J.T.-L.; writing—review and editing N.T.-C. All authors have read and agreed to the published version of the manuscript.

Funding

This research received no external funding.

Institutional Review Board Statement

This study was conducted according to the guidelines of the Declaration of Helsinki and approved by the Ethics Committee of University of Extremadura ID: 137//2023 approved on 28 September 2023.

Informed Consent Statement

Informed consent was obtained from all subjects involved in this study.

Data Availability Statement

Data will be made available upon reasonable request to the corresponding author.

Conflicts of Interest

The authors declare no conflicts of interest.

References

  1. Hurtado Padilla, A. Uso de la baropodometría. Ortho-Tips 2006, 2, 255–261. [Google Scholar]
  2. Roberts, M.; Mongeon, D.; Prince, F. Biomechanical parameters for gait analysis: A systematic review of healthy human gait. Phys. Ther. Rehabil. 2017, 4, 6. [Google Scholar] [CrossRef]
  3. Moody, D.; Hunter, I.; Ridge, S.; William Myrer, J. Comparison of Varying Heel to Toe Differences and Cushion to Barefoot Running in Novice Minimalist Runners. Int. J. Exerc. Sci. 2018, 11, 13–19. [Google Scholar] [CrossRef] [PubMed]
  4. Sun, X.; Lam, W.K.; Zhang, X.; Wang, J.; Fu, W. Systematic Review of the Role of Footwear Constructions in Running Biomechanics: Implications for Running-Related Injury and Performance. J. Sports Sci. Med. 2020, 19, 20–37. [Google Scholar] [PubMed]
  5. Gijón Nogueron, G. Factores del calzado deportico de carrera que influyen en la práctica deportiva: Revisión sistemática. Arch. Med. Deporte. 2014, 31, 105–110. [Google Scholar]
  6. Nicolas-Peyrot, M.A.; Lescure, Y.; Perrin, E.; Martinez-Rico, M.; Travouillon, C.; Gijon-Nogueron, G.; Lopezosa-Reca, E. Optimizing Running Mechanics, Effects of Cadence, Footwear, and Orthoses on Force Distribution: A Quasi-Experimental Study. J. Funct. Morphol. Kinesiol. 2025, 10, 89. [Google Scholar] [CrossRef]
  7. Besson, T.; Morio, C.; Millet, G.Y.; Rossi, J. Influence of shoe drop on running kinematics and kinetics in female runners. Eur. J. Sport Sci. 2019, 19, 1320–1327. [Google Scholar] [CrossRef]
  8. Quan, W.; Gao, L.; Xu, D.; Zhou, H.; Korim, T.; Shao, S.; Baker, J.S.; Gu, Y. Simulation of Lower Limb Muscle Activation Using Running Shoes with Different Heel-to-Toe Drops Using Opensim. Healthcare 2023, 11, 1243. [Google Scholar] [CrossRef]
  9. Chen, Y.; Li, J.X.; Wang, L. Influences of heel height on human postural stability and functional mobility between inexperienced and experienced high heel shoe wearers. PeerJ 2020, 8, e10239. [Google Scholar] [CrossRef] [PubMed]
  10. Wan, F.K.W.; Yick, K.L.; Yu, W.W.M. Effects of heel height and high-heel experience on foot stability during quiet standing. Gait Posture 2019, 68, 252–257. [Google Scholar] [CrossRef]
  11. Sánchez Lacuesta, J.; Comín, M.; Prat, J.; Soler, C.; Dejoz, R.; Peris, J.L.; Hoyos, J.V.; Vera, P. Nueva plataforma dinamométrica para el análisis y valoración del rendimiento deportivo. Biomecánica 1993, 1, 51–52. [Google Scholar] [CrossRef]
  12. Sánchez Lacuesta, J.J.; Prat Pastor, J.M.; Hoyos Fuentes, J.V.; Viosca Herrero, E.; Soler Gracia, C.; Comín Clavijo, M.; Lafuente Jorge, R.; Corté i Fabregat, A.; Vera Luna, P. Biomecánica de la Marcha Humana Normal y Patológica; Instituto de Biomecánica de Valencia: Valencia, Spain, 1999. [Google Scholar]
  13. Halliday, D.; Resnick, R.; Walker, J. Fundamentals of Physics; Wiley: Hoboken, NJ, USA, 2013; Volume 10. [Google Scholar]
  14. Li, X.; Lu, Z.; Sun, D.; Xuan, R.; Zheng, Z.; Gu, Y. The Influence of a Shoe’s Heel-Toe Drop on Gait Parameters during the Third Trimester of Pregnancy. Bioengineering 2022, 9, 241. [Google Scholar] [CrossRef] [PubMed]
  15. Jiang, L.; Qu, F.; Yang, Z.; Chen, X.; Gao, X.; Sun, Q.; Huo, B. Heel-to-toe drop effects on biomechanical and muscle synergy responses during uphill walking. Front. Bioeng. Biotechnol. 2024, 12, 1385264. [Google Scholar] [CrossRef] [PubMed]
  16. Zhang, M.; Shi, H.; Liu, H.; Zhou, X. Biomechanical analysis of running in shoes with different heel-to-toe drops. Appl. Sci. 2021, 11, 12144. [Google Scholar] [CrossRef]
  17. Yu, P.; He, Y.; Gu, Y.; Liu, Y.; Xuan, R.; Fernandez, J. Acute Effects of Heel-to-Toe Drop and Speed on Running Biomechanics and Strike Pattern in Male Recreational Runners: Application of Statistical Nonparametric Mapping in Lower Limb Biomechanics. Front. Bioeng. Biotechnol. 2022, 9, 821530. [Google Scholar] [CrossRef]
  18. Sánchez-Ramírez, C.; Ramsey, C.; Palma-Oyarce, V.; Herrera-Hernández, E.; Aedo-Muñoz, E. Heel-to-toe drop of running shoes: A systematic review of its biomechanical effects. Footwear Sci. 2023, 15, 77–101. [Google Scholar] [CrossRef]
  19. Bus, S.A.; de Lange, A. A comparison of the 1-step, 2-step, and 3-step protocols for obtaining barefoot plantar pressure data in the diabetic neuropathic foot. Clin. Biomech. 2005, 20, 892–899. [Google Scholar] [CrossRef]
  20. Peters, M. Footedness: Asymmetries in Foot Preference and Skill and Neuropsychological Assessment of Foot Movement. Psychol. Bull. 1988, 103, 179. [Google Scholar] [CrossRef]
  21. Griffin, M.P.; Olney, S.J.; McBride, I.D. Role of symmetry in gait performance of stroke subjects with hemiplegia. Gait Fosture 1995, 3, 132–142. [Google Scholar] [CrossRef]
  22. Hellige, J. Hemispheric Asymmetry: What’s Right and What’s Left, 3rd ed.; Stephen, M., Ed.; Harvard University Press: Cambridge, MA, USA, 2001. [Google Scholar]
  23. Oberg, T.; Karsznia, A.; Oberg, K. Basic gait parameters: Reference data for normal subjects, 10–79 years of age. J. Rehabil. Res. Dev. 1993, 30, 210–223. [Google Scholar]
  24. Al-Obaidi, S.; Wall, J.C.; Al-Yaqoub, A.; Al-Ghanim, M. Basic gait parameters: A comparison of reference data for normal subjects 20 to 29 years of age from Kuwait and Scandinavia. J. Rehabil. Res. Dev. 2003, 40, 361–366. [Google Scholar] [CrossRef]
  25. Bohannon, R.W.; Williams Andrews, A. Normal walking speed: A descriptive meta-analysis. Physiotherapy 2011, 97, 182–189. [Google Scholar] [CrossRef]
  26. Seidler, R.D.; Bernard, J.A.; Burutolu, T.B.; Fling, B.W.; Gordon, M.T.; Gwin, J.T.; Kwak, Y.; Lipps, D.B. Motor control and aging: Links to age-related brain structural, functional, and biochemical effects. Neurosci. Biobehav. Rev. 2010, 34, 721–733. [Google Scholar] [CrossRef]
  27. Morrison, S.; Colberg, S.R.; Parson, H.K.; Neumann, S.; Handel, R.; Vinik, E.J.; Paulson, J.; Vinik, A.I. Walking-Induced Fatigue Leads to Increased Falls Risk in Older Adults. J. Am. Med. Dir. Assoc. 2016, 17, 402–409. [Google Scholar] [CrossRef]
  28. Lieberman, D.E.; Venkadesan, M.; Werbel, W.A.; Daoud, A.I.; Dandrea, S.; Davis, I.S.; Mang’eNi, R.O.; Pitsiladis, Y. Foot strike patterns and collision forces in habitually barefoot versus shod runners. Nature 2010, 463, 531–535. [Google Scholar] [CrossRef] [PubMed]
  29. Bonacci, J.; Saunders, P.U.; Hicks, A.; Rantalainen, T.; Vicenzino, B.T.; Spratford, W. Running in a minimalist and lightweight shoe is not the same as running barefoot: A biomechanical study. Br. J. Sports Med. 2013, 47, 387–392. [Google Scholar] [CrossRef] [PubMed]
  30. Hall, J.P.L.; Barton, C.; Jones, P.R.; Morrissey, D. The biomechanical differences between barefoot and shod distance running: A systematic review and preliminary meta-analysis. Sports Med. 2013, 43, 1335–1353. [Google Scholar] [CrossRef]
  31. Altman, A.R.; Davis, I.S. Barefoot Running: Biomechanics and Implications for Running Injuries. Curr. Sports Med. Rep. 2012, 11, 244–250. [Google Scholar] [CrossRef]
  32. Squadrone, R.; Rodano, R.; Hamill, J.; Preatoni, E. Acute effect of different minimalist shoes on foot strike pattern and kinematics in rearfoot strikers during running. J. Sports Sci. 2015, 33, 1196–1204. [Google Scholar] [CrossRef]
  33. Tam, N.; Prins, D.; Divekar, N.V.; Lamberts, R.P. Biomechanical analysis of gait waveform data: Exploring differences between shod and barefoot running in habitually shod runners. Gait Posture 2017, 58, 274–279. [Google Scholar] [CrossRef] [PubMed]
  34. Ramírez González, S.; Rodríguez Guerra, D.; Rodríguez Labrada, R. Evaluación de la marcha en pacientes con ataxia espinocerebelosa tipo 2: Fundamentos teóricos. Olimpia 2021, 18, 1–9. [Google Scholar]
  35. Nuñez-Samper, M.; Llanos Alcázar, L.F. Biomecánica, Medicina Y Cirugía Del Pie; Masson: Barcelona, Spain, 2000. [Google Scholar]
  36. Lafuente, R.; Doñate, J.J.; Poveda, R.; García, A.; Soler, C.; Belda, J.M.; Sánchez Lacuesta, J.; Prat, J. Valoración evolutiva de fracturas de calcáneo mediante el análisis biomecánico de la marcha. Análisis de resultados. Mapfre Med. 2002, 13, 275–283. [Google Scholar]
  37. Lelièvre, J.L.J. Patología Del Pie; Masson: Barcelona, Spain, 1993. [Google Scholar]
  38. Riggs, B.L.; Melton, L.J.; Robb, R.A.; Camp, J.J.; Atkinson, E.J.; Peterson, J.M.; Rouleau, P.A.; McCollough, C.H.; Bouxsein, M.L.; Khosla, S. Population-based study of age and sex differences in bone volumetric density, size, geometry, and structure at different skeletal sites. J. Bone Miner. Res. 2004, 19, 1945–1954. [Google Scholar] [CrossRef] [PubMed]
  39. Tórtora Gerard, J.; Derrickson Bryan, H. Principios De Anatomía Y Fisiología, 15th ed.; Editorial Médica Panamericana: Madrid, Spain, 2018. [Google Scholar]
  40. Velez Vázquez, T.; Carbonero López, P.; del Baño Aledo, M.E. Sonographic study of muscular architecture of lower limb musculature: Gender and age variability. Fisioterapia 2022, 44, 6–14. [Google Scholar] [CrossRef]
  41. Alvarez-Nemegyei, J.; Pacheco-Pantoja, E.; González-Salazar, M.; López-Villanueva, R.F.; May-Kim, S.; Martínez-Vargas, L.; Quintal-Gutiérrez, D. Asociación entre sobrepeso/obesidad y estado clínico en artritis reumatoide. Reumatol. Clin. 2020, 16, 462–467. [Google Scholar] [CrossRef] [PubMed]
Figure 1. Insoles used during data collection, from left to right: 0 mm, 5 mm, and 10 mm drop.
Applsci 15 10515 g001
Figure 2. Standard lace-up canvas shoes used during data collection.
Applsci 15 10515 g002
Figure 3. Dinascan/IBV® force platform.
Applsci 15 10515 g003
Figure 4. Representative ground reaction force (GRF) curves recorded during gait, illustrating the vertical, anterior–posterior, and medial–lateral components across the stance phase.
Applsci 15 10515 g004
Table 1. Sample descriptive statistical analysis.
p-Value0 mm5 mm10 mm
MeanSDMeanSDMeanSD
Speed (m/s)0.725 21.190.091.190.091.180.08
Stance time (s)0.013 20.730.060.740.050.740.05
Braking force (N)0.010 1107.229.0109.126.2110.629.2
Propulsion force (N)0.559 2128.031.8128.631.4138.4117.9
Take-off force (N)<0.001 1763.3146.6771.5148.1774.7148.7
Swing force (N)0.002 2551.3120.8549.7121.1543.8119.0
1 Repeated measures ANOVA. 2 Friedman test for related samples for two-factor rank variance analysis.
Table 2. Significance and pairwise post-hoc comparison results.
p-ValueDrop
0–5 mm5–10 mm0–10 mm
Speed (m/s)0.725 2---
Stance time (s)0.013 20.139>0.9990.015
Braking force (N)0.010 10.1610.2410.010
Propulsion force (N)0.559 2---
Take-off force (N)<0.001 1<0.0010.143<0.001
Swing force (N)0.002 20.1500.3500.001
1 Repeated measures ANOVA. 2 Friedman test for related samples for two-factor rank variance analysis.
Table 3. Analysis of ground reaction forces based on sex.
Drop (mm)MenWomen
MeanMeanp-Value
Speed (m/s)01.191.180.585 2
51.191.180.560 1
101.191.180.678 1
Stance time (s)00.740.730.047 2
50.750.730.013 1
100.750.730.001 1
Braking force (N)0112.7102.00.046 1
5114.4104.20.034 1
10118.1103.70.007 1
Propulsion force (N)0136.3120.30.004 2
5137.0120.80.003 2
10134.6141.80.031 2
Take-off force (N)0821.9709.4<0.001 2
5833.7714.5<0.001 2
10835.8718.6<0.001 2
Swing force (N)0610.0497.5<0.001 2
5605.0498.8<0.001 2
10600.1492.1<0.001 2
1 Independent samples t-test. 2 Mann–Whitney U test for independent samples.
Table 4. Correlation coefficients obtained by relating the different proposed drops with the BMI.
VariablesCorrelation Coefficient
Drop
0 mm5 mm10 mm
Braking force (N)0.677 **0.676 **0.733 **
Propulsion force (N)0.742 **0.759 **0.771 **
Take-off force (N)0.809 **0.804 **0.812 **
Swing force (N)0.780 **0.778 **0.771 **
Correlation coefficients are based on Spearman’s Rho. ** p < 0.01 (statistically significant).
Disclaimer/Publisher’s Note: The statements, opinions and data contained in all publications are solely those of the individual author(s) and contributor(s) and not of MDPI and/or the editor(s). MDPI and/or the editor(s) disclaim responsibility for any injury to people or property resulting from any ideas, methods, instructions or products referred to in the content.