Article

Reactive Oxygen Species-Mediated Oral Cancer Cells Treatment Using Photosensitizer-Combined Carbon Dots via Apoptosis–Ferroptosis Synergistic Therapy

1
Department of Pediatric Dentistry, Dental and Life Science Institute, School of Dentistry, Pusan National University, Yangsan 50612, Republic of Korea
2
Department of Oral Pathology, Dental and Life Science Institute, School of Dentistry, Pusan National University, Yangsan 50612, Republic of Korea
3
Department of Dental Materials, Dental and Life Science Institute, School of Dentistry, Pusan National University, Yangsan 50612, Republic of Korea
4
Department of Bioscience Research, College of Dentistry, University of Tennessee Health Science Center, Memphis, TN 38103, USA
5
Department of Dental Pharmacology, Dental and Life Science Institute, School of Dentistry, Pusan National University, Yangsan 50612, Republic of Korea
*
Authors to whom correspondence should be addressed.
Appl. Sci. 2025, 15(19), 10446; https://doi.org/10.3390/app151910446
Submission received: 8 September 2025 / Revised: 24 September 2025 / Accepted: 24 September 2025 / Published: 26 September 2025
(This article belongs to the Section Applied Dentistry and Oral Sciences)

Abstract

In this study, the applicability of carbon dots (CDs) for the treatment of oral cancer cells in vitro was assessed under laser irradiation. For the study, CDs were synthesized using an amino acid via heat treatment and then combined with a photosensitizer. The absorbance and photoluminescence of CDs were measured. The production of reactive oxygen species (ROS) was evaluated using assay agents. The glutathione (GSH) content of the test solutions was evaluated. The viability of normal and cancer cells was evaluated using CDs at different concentrations under laser irradiation. Live/dead cells and intracellular lipid peroxidation (LPO) were observed after treatment. According to the assays, the production of •OH, •O2, and 1O2 was spectroscopically observed, which was reflected by the change in their peak absorbance. GSH was depleted mostly during light irradiation. Cancer cells were eliminated without leaving visible live cells, whereas normal cells were minimally affected. Intracellular LPO was confirmed in cells by green fluorescence, which was emitted from an oxidized assay dye. Conclusively, the amino acid-based photosensitizer-combined CDs eliminated approximately 70% of the cancer cells in vitro under laser irradiation, with no visible live cells. Based on these assays, ROS production may induce cell death via synergistic apoptosis–ferroptosis therapy.

1. Introduction

Head and neck squamous cell carcinoma (HNSCCs) is the sixth most common cancer worldwide (with approximately 900,000 cases and a mortality rate of 40–50%) [1,2]. This tumor occurs on the mucosal surfaces of the epithelial cells. Among HNSCCs, oral squamous cell carcinoma (OSCC) occurs in the oral epithelium, with approximately 400,000 cases and a 45% mortality rate [3]. Although smoking and alcohol consumption are well-known carcinogenic risk factors, their incidence varies geographically depending on differences in exposure, lifestyle, and living standards [4,5]. Unlike many other cancers, OSCC occurs mainly in the open oral cavity, and any abnormality can be visually monitored with care.
If OSCC occurs, it is treated with well-established guidelines, from surgery to chemotherapy, immunotherapy, and radiotherapy, with benefits, negative aspects, and sometimes controversy. Prevention is a primary, easy, and simple approach to prevent OSCC in the oral cavity [6]. Many studies have reported the feasibility of using nanoparticles to treat various cancers. Among the studied nanoparticles, carbon dots (CDs) have been extensively studied [7,8,9]. CDs can be synthesized in diverse ways, ranging from one-pot synthesis to multi-complex synthesis. Among these, the bottom-up method using precursor resources for heat treatment is a simple approach.
According to previous studies, the application of CDs for antitumor treatment depends on the extent of tumor damage [10,11,12]. Apoptosis induced by reactive oxygen species (ROS) is widely reported to be involved in cell death. ROS are highly active oxygen molecules that induce cellular damage via oxidative stress. At high ROS levels, cell damage is accompanied by cell shrinkage, blebbing of the membrane, DNA fragmentation, and cell death [13,14]. A newly identified iron-dependent cell death mechanism has been reported for iron-conjugated CDs. Unlike apoptosis, ferroptosis involves intracellular lipid peroxidation (LPO) induced by ROS [15,16]. Intracellular ROS produced through iron-containing CDs via the Fenton reaction or iron-free Fenton-like reaction can form lipid radicals that damage cells. In addition, if ROS degrade cellular glutathione (GSH), they downregulate glutathione peroxidase (GPx), a free radical scavenger, leading to LPO upregulation. Downregulated GPx is related to lower levels of GPx4, which neutralizes harmful ROS, and cell death can occur through the upregulation of LPO.
Photosensitizers (PSs) are chromophores that generate ROS upon light absorption at a specific wavelength and transform energy into the desired reactants [17,18]. The photodynamic effect occurs between PS, light, and oxygen, producing ROS through electron transfer (type I) and/or energy transfer (type II). ROS actively destroy abnormal cells, such as cancer cells. Many PSs have been introduced, among which chlorin e6 (Ce6) has been widely applied after being coupled with other CDs for antitumor treatment.
CDs are highly valuable owing to their many advantages, such as tunable photoluminescence, low toxicity, and biocompatibility. They can be synthesized using readily available, inexpensive carbon sources, making them cost-effective. Furthermore, their surfaces can be easily functionalized with various chemicals. Various surface functional groups, including hydroxyl (-OH), carboxyl (-COOH), carbonyl (-CO), and amino (-NH2) groups, on the CD surface act as active sites to enhance CD solubility in water and bind to other molecules [19,20]. Among carbon sources, amino acids are useful because they contain both amino and carboxylic functional groups and perform many functions, such as protein synthesis, tissue repair, and nutrient absorption [21,22]. Cysteine is an amino acid that may be involved in hair growth and skin aging reduction. Unlike many other amino acids, cysteine (C3H7NO2S) contains sulfur (S) in the form of a thiol group, in addition to carbon and nitrogen, and can form heteroatom CDs when used as a source material. This study aimed to evaluate the applicability of amino acid-based PS-combined CDs for in vitro oral cancer treatment. Through this evaluation, the potential antitumor mechanisms were investigated.

2. Materials and Methods

2.1. Synthesis of CDs

The CDs used for the tests were synthesized as follows: Briefly, 1000 mg of L-cysteine powder (Samchun, Seoul, Korea) was dissolved in 20 mL of deionized water, the pH was adjusted to 8–9 using NaOH, and the solution was transferred to a Teflon-lined stainless-steel autoclave, sealed, and heated to 100 °C for 22 h in a furnace. After cooling, the solution was centrifuged at 5000 rpm for 10 min and dried overnight (referred to as CS). In a 2.3 mL of deionized water, 20 mg of CS powder and 0.2 mg of chlorine e6 (Ce6) was mixed. Due to the low solubility of Ce6 in water, Ce6 was dissolved in 0.2 mL of DMSO. The resulting mixed solution was stirred for 6 h, filtered through a 0.45 μm membrane, and dried (referred to as CS-Ce6). All chemical reagents were purchased from Sigma-Aldrich (St. Louis, MO, USA) unless otherwise specified.

2.2. Cell Culture

Two cell lines (HSC3 and HEK293) were used in this study. The human tongue squamous carcinoma cell line (HSC3) was obtained from the Japanese Cancer Research Resources Bank and cultured in Dulbecco’s modified Eagle’s medium (DMEM) F12 supplemented with 10% heat-inactivated fetal bovine serum and 1% penicillin/streptomycin. Human embryonic kidney cell lines (HEK293) were obtained from the Korean Cell Line Bank and cultured in DMEM. After culturing, all cells were maintained in a 5% CO2 atmosphere at 37 °C.

2.3. Cell Viability Test

To assess cell viability, cells were seeded in 96-well plates (1 × 10⁴ cells/well) and incubated for 12 h before treatment. The cells were then treated with the CD solution at the desired concentrations for 24 h (HEK293 cells, without light irradiation). For CS-Ce6, HSC3 cells were treated with CDs at different concentrations and 100 μM H2O2 without or with 0.1 μg/mL ferrostatin-1 (Fer-1) and incubated for 4 h, then without or with laser (LVI Technology Inc., Yongin, Korea) irradiation for 5 min at 660 nm and 50 mW/cm2 intensity, and they were additionally incubated for 20 h. The culture medium was replaced with fresh medium containing 10% CCK-8 solution (DOJINDO, Kumamoto, Japan) and incubated for 1 h. The absorbance of the cells in each well was measured at 450 nm using a microplate reader (BioTek Synergy HTX; Agilent, Santa Clara, CA, USA).
After the cell viability test, the cells were observed under an optical microscope (Nikon; Eclipse Ts2, Tokyo, Japan).

2.4. Characteristics of CS-Ce6

The absorbance of CS-Ce6 and Ce6 was measured using the same microplate reader. The fluorescence emitted by CS-Ce6 at different excitation wavelengths was measured using a spectrofluorometer (Cary Eclipse, Agilent, Santa Clara, CA, USA).

2.5. Evaluation of ROS Generation

The Fenton-like activity of CS-Ce6 was evaluated using 3,3′,5,5′-tetramethylbenzidine (TMB) colorimetric assay. A working solution containing 0.01 mg/mL of TMB, 100 μM H2O2, and 150 ppm of CS-Ce6 in phosphate citrate buffer was prepared. The absorbance of the reaction buffer was measured at different time points after laser irradiation using the same microplate reader.
Superoxide anion (•O2) generation was evaluated using a nitroblue tetrazolium (NBT) assay. The assay solutions were prepared by adding NBT (0.2 mM), NADH (0.5 mM), 100 μM H2O2, and CS-Ce6 (200 ppm) to DMSO. The solution was irradiated, and the corresponding absorbance was measured using the same microplate reader at λ = 530 nm at different time points during irradiation. A solution without CDs was used as a control.
Singlet oxygen (1O2) generation was evaluated using p-nitrosodimethylaniline-imidazole (RNO-ID) assays. A stock solution was prepared by adding 0.22 mg RNO and 16.3 mg to 30 mL deionized water. After stirring for 10 min, 400 μL of the as-prepared stock solution and 100 μM H2O2 were mixed with 200 ppm of CS-Ce6, and the mixture was irradiated. Optical density was measured using the same microplate reader at different time points during irradiation. A solution without CDs was used as a control.

2.6. Evaluation of GSH Depletion

GSH depletion was evaluated after mixing CS-Ce6 (200 ppm) and GSH (1 mM) in 100 μM H2O2. Subsequently, it was mixed with 100 μM DTNB and irradiated for 5 min. The absorbance at 410 nm was measured using the same microplate reader at different time points (during and after the termination of light irradiation).

2.7. Live/Dead Cell Staining Assay

Live/dead staining was performed under cell viability test conditions. Cells were seeded in 96-well plates (1 × 10⁴ cells/well) and incubated for 12 h. Each 500 μL cell suspension (1 × 10⁵ cells/mL) was treated with CDs at the desired concentration in 100 μM H2O2 solution, incubated for 4 h, laser irradiated for 5 min at 660 nm with 50 mW/cm2 intensity, and then incubated for 20 h. The cells were then washed with PBS several times and stained with Calcein-AM/PI (propidium iodide) dye for 20 min (Calcein-AM [1 μL; 5 μM], PI [2 μL; 50 μg/mL]). After incubation for 20 min in the dark condition, they were observed using a confocal microscope (LSM700, Carl Zeiss, Jena, Germany). In the microscopic images, live and dead cells appeared green and red, respectively.

2.8. Intracellular LPO Detection

HSC3 cells were seeded evenly in 24-well plates at a density of 5 × 10⁴ cells/well and incubated for 4 h after transfection. The cells were then treated with PBS and CS-Ce6 (150 ppm) and laser-irradiated for 5 min. The cells were then stained with C11-BODIPY581/591 dye (8 μM) for 30 min at 37 °C and washed three times with PBS. Finally, a confocal microscope was used to obtain fluorescence images of the treated cells.

2.9. Statistical Analysis

The results from the cell viability test of HSC3 between CS and CS-Ce6 were analyzed using the t-test. p value < 0.05 was considered significant.

3. Results

The light absorbance spectra of the synthesized CDs (CS and CS-Ce6) and Ce6 are shown in Figure 1A. CS showed a decreasing slope from the UV to the visible light range, whereas CS-Ce6 showed three peaks at 380–450 nm, 500 nm, and 600–700 nm. These three peaks matched those of Ce6. The photoluminescence (PL) of CS-Ce6 obtained at different excitation wavelengths is shown in Figure 1B. Two different PL peaks were observed at 400–600 and 600–700 nm. The peak position at 600–700 nm did not change except intensity, despite varying the excitation wavelength.
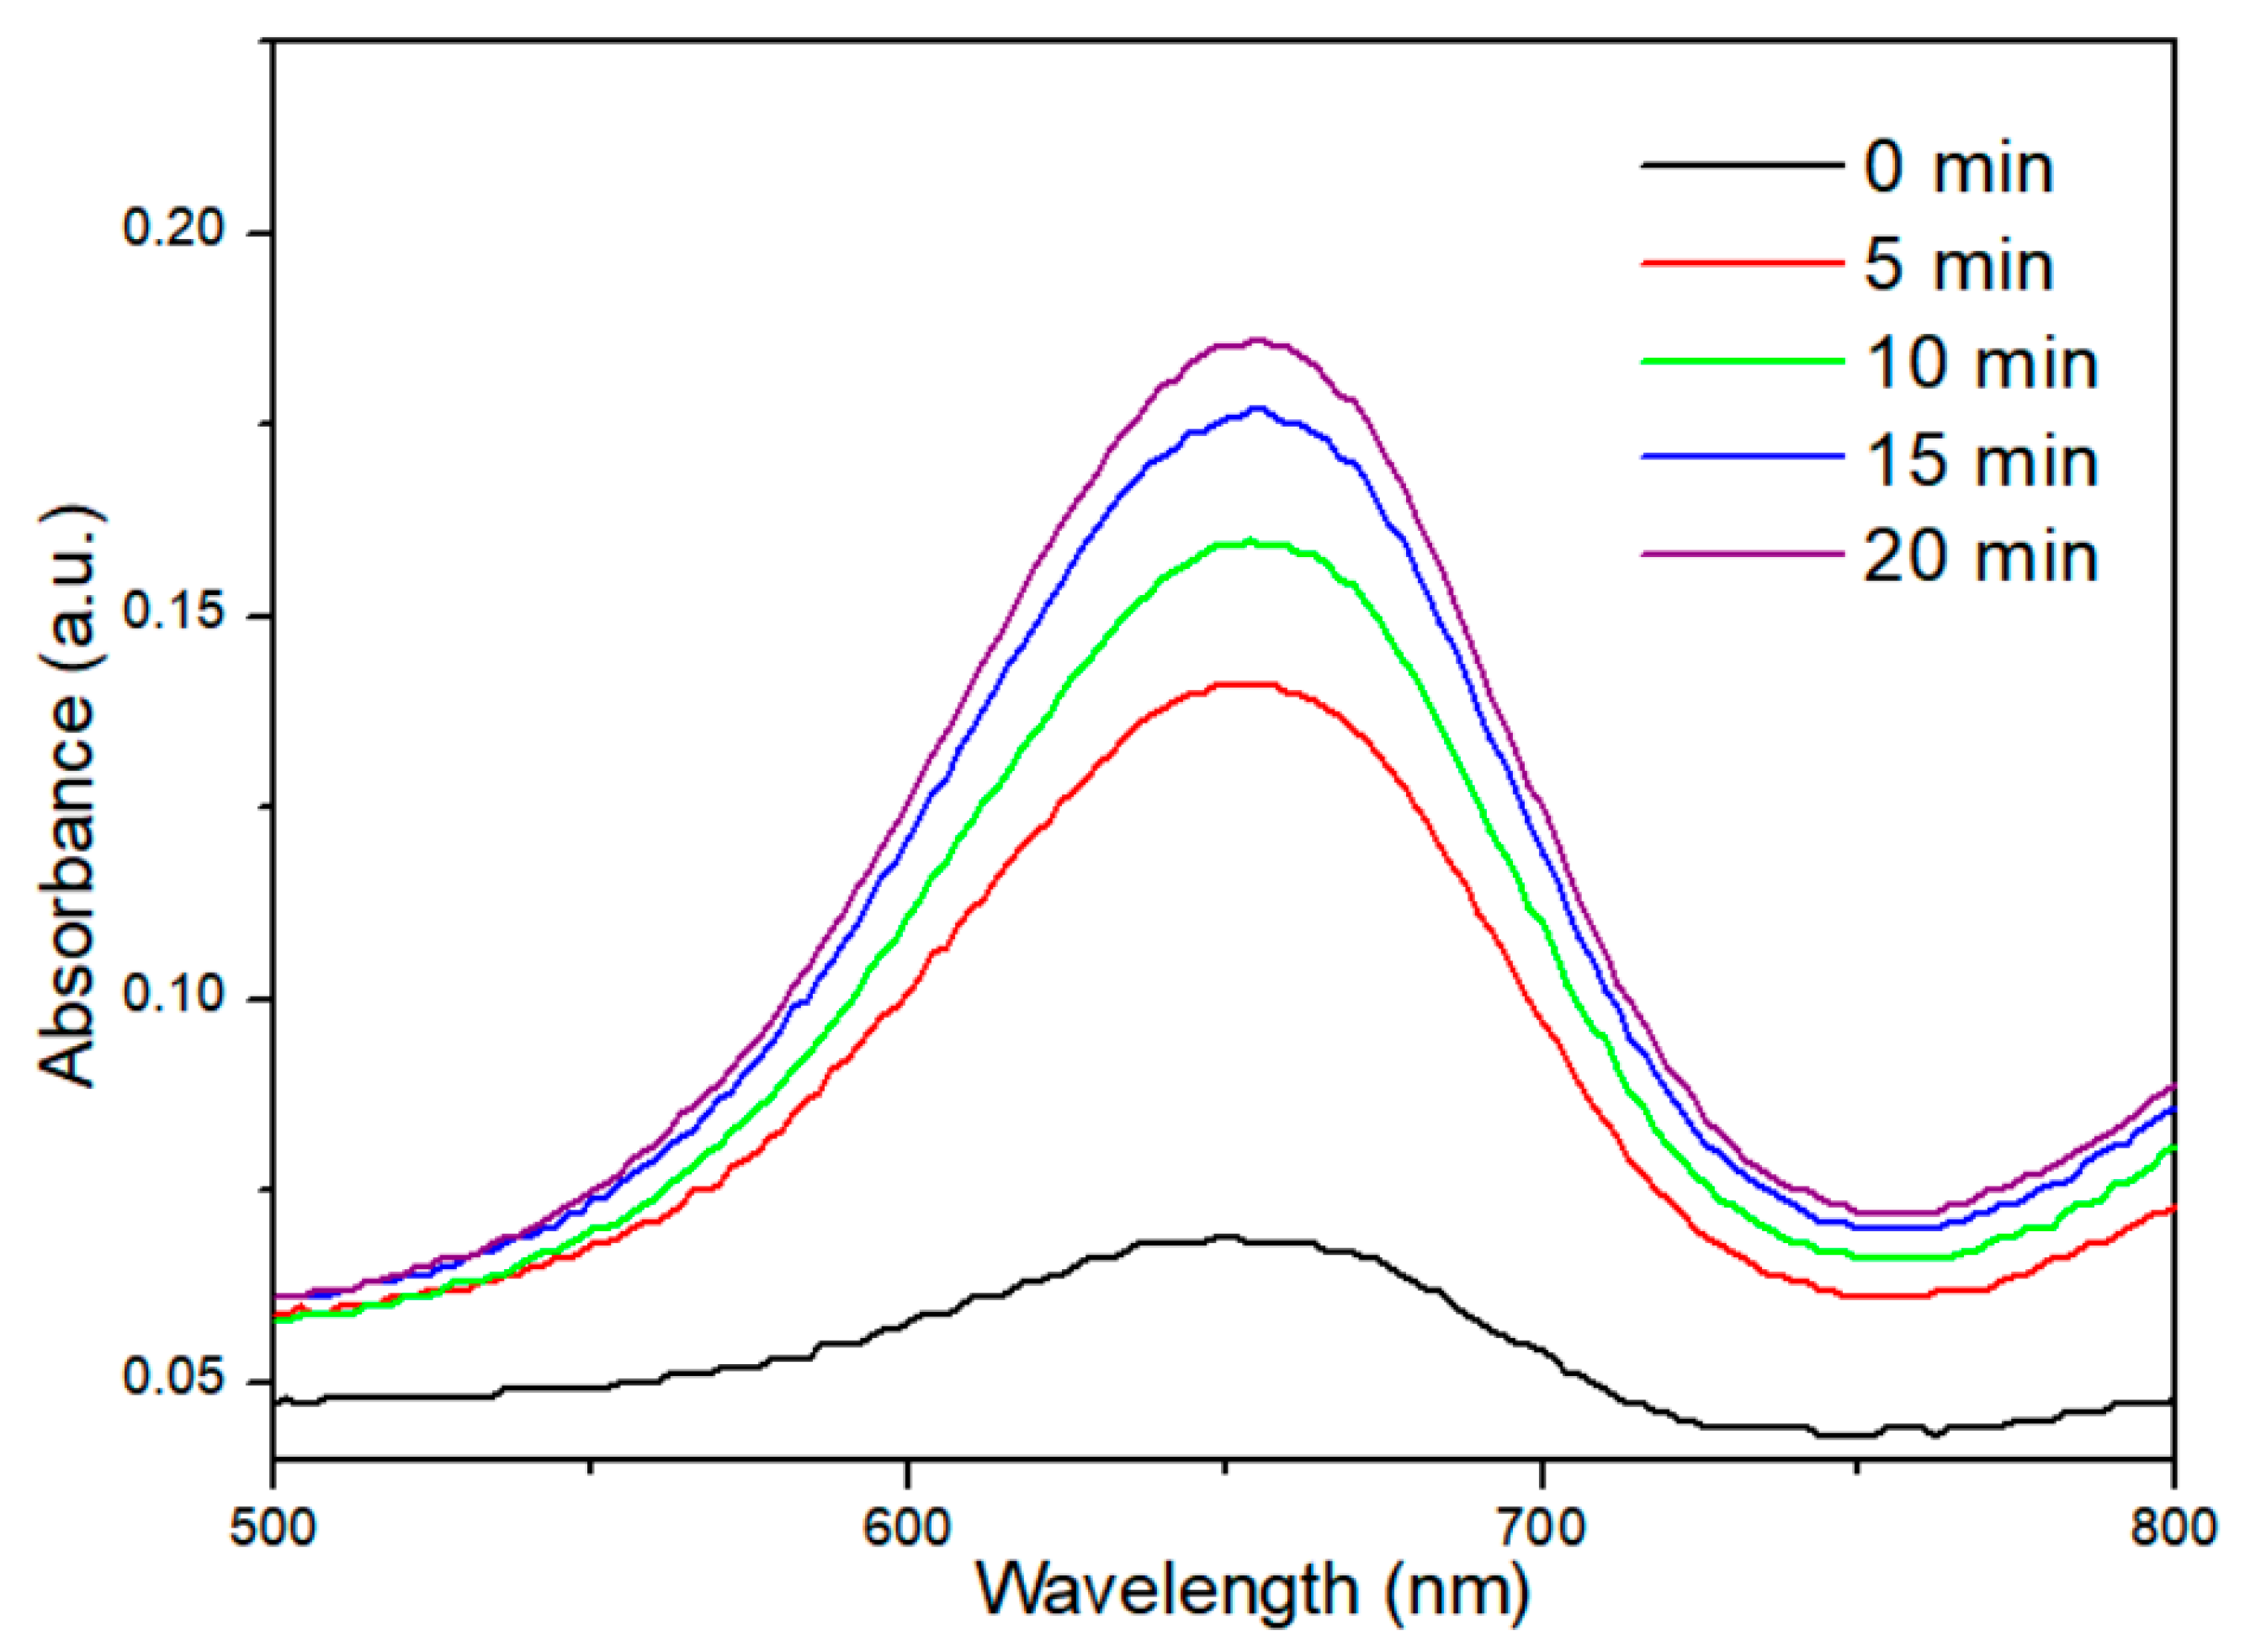
The absorbance of TMB treated with CS-Ce6 for different irradiation times is shown in Figure 2. The peak intensity of the initial TMB absorbance near 650 nm increased gradually with increasing laser irradiation time.
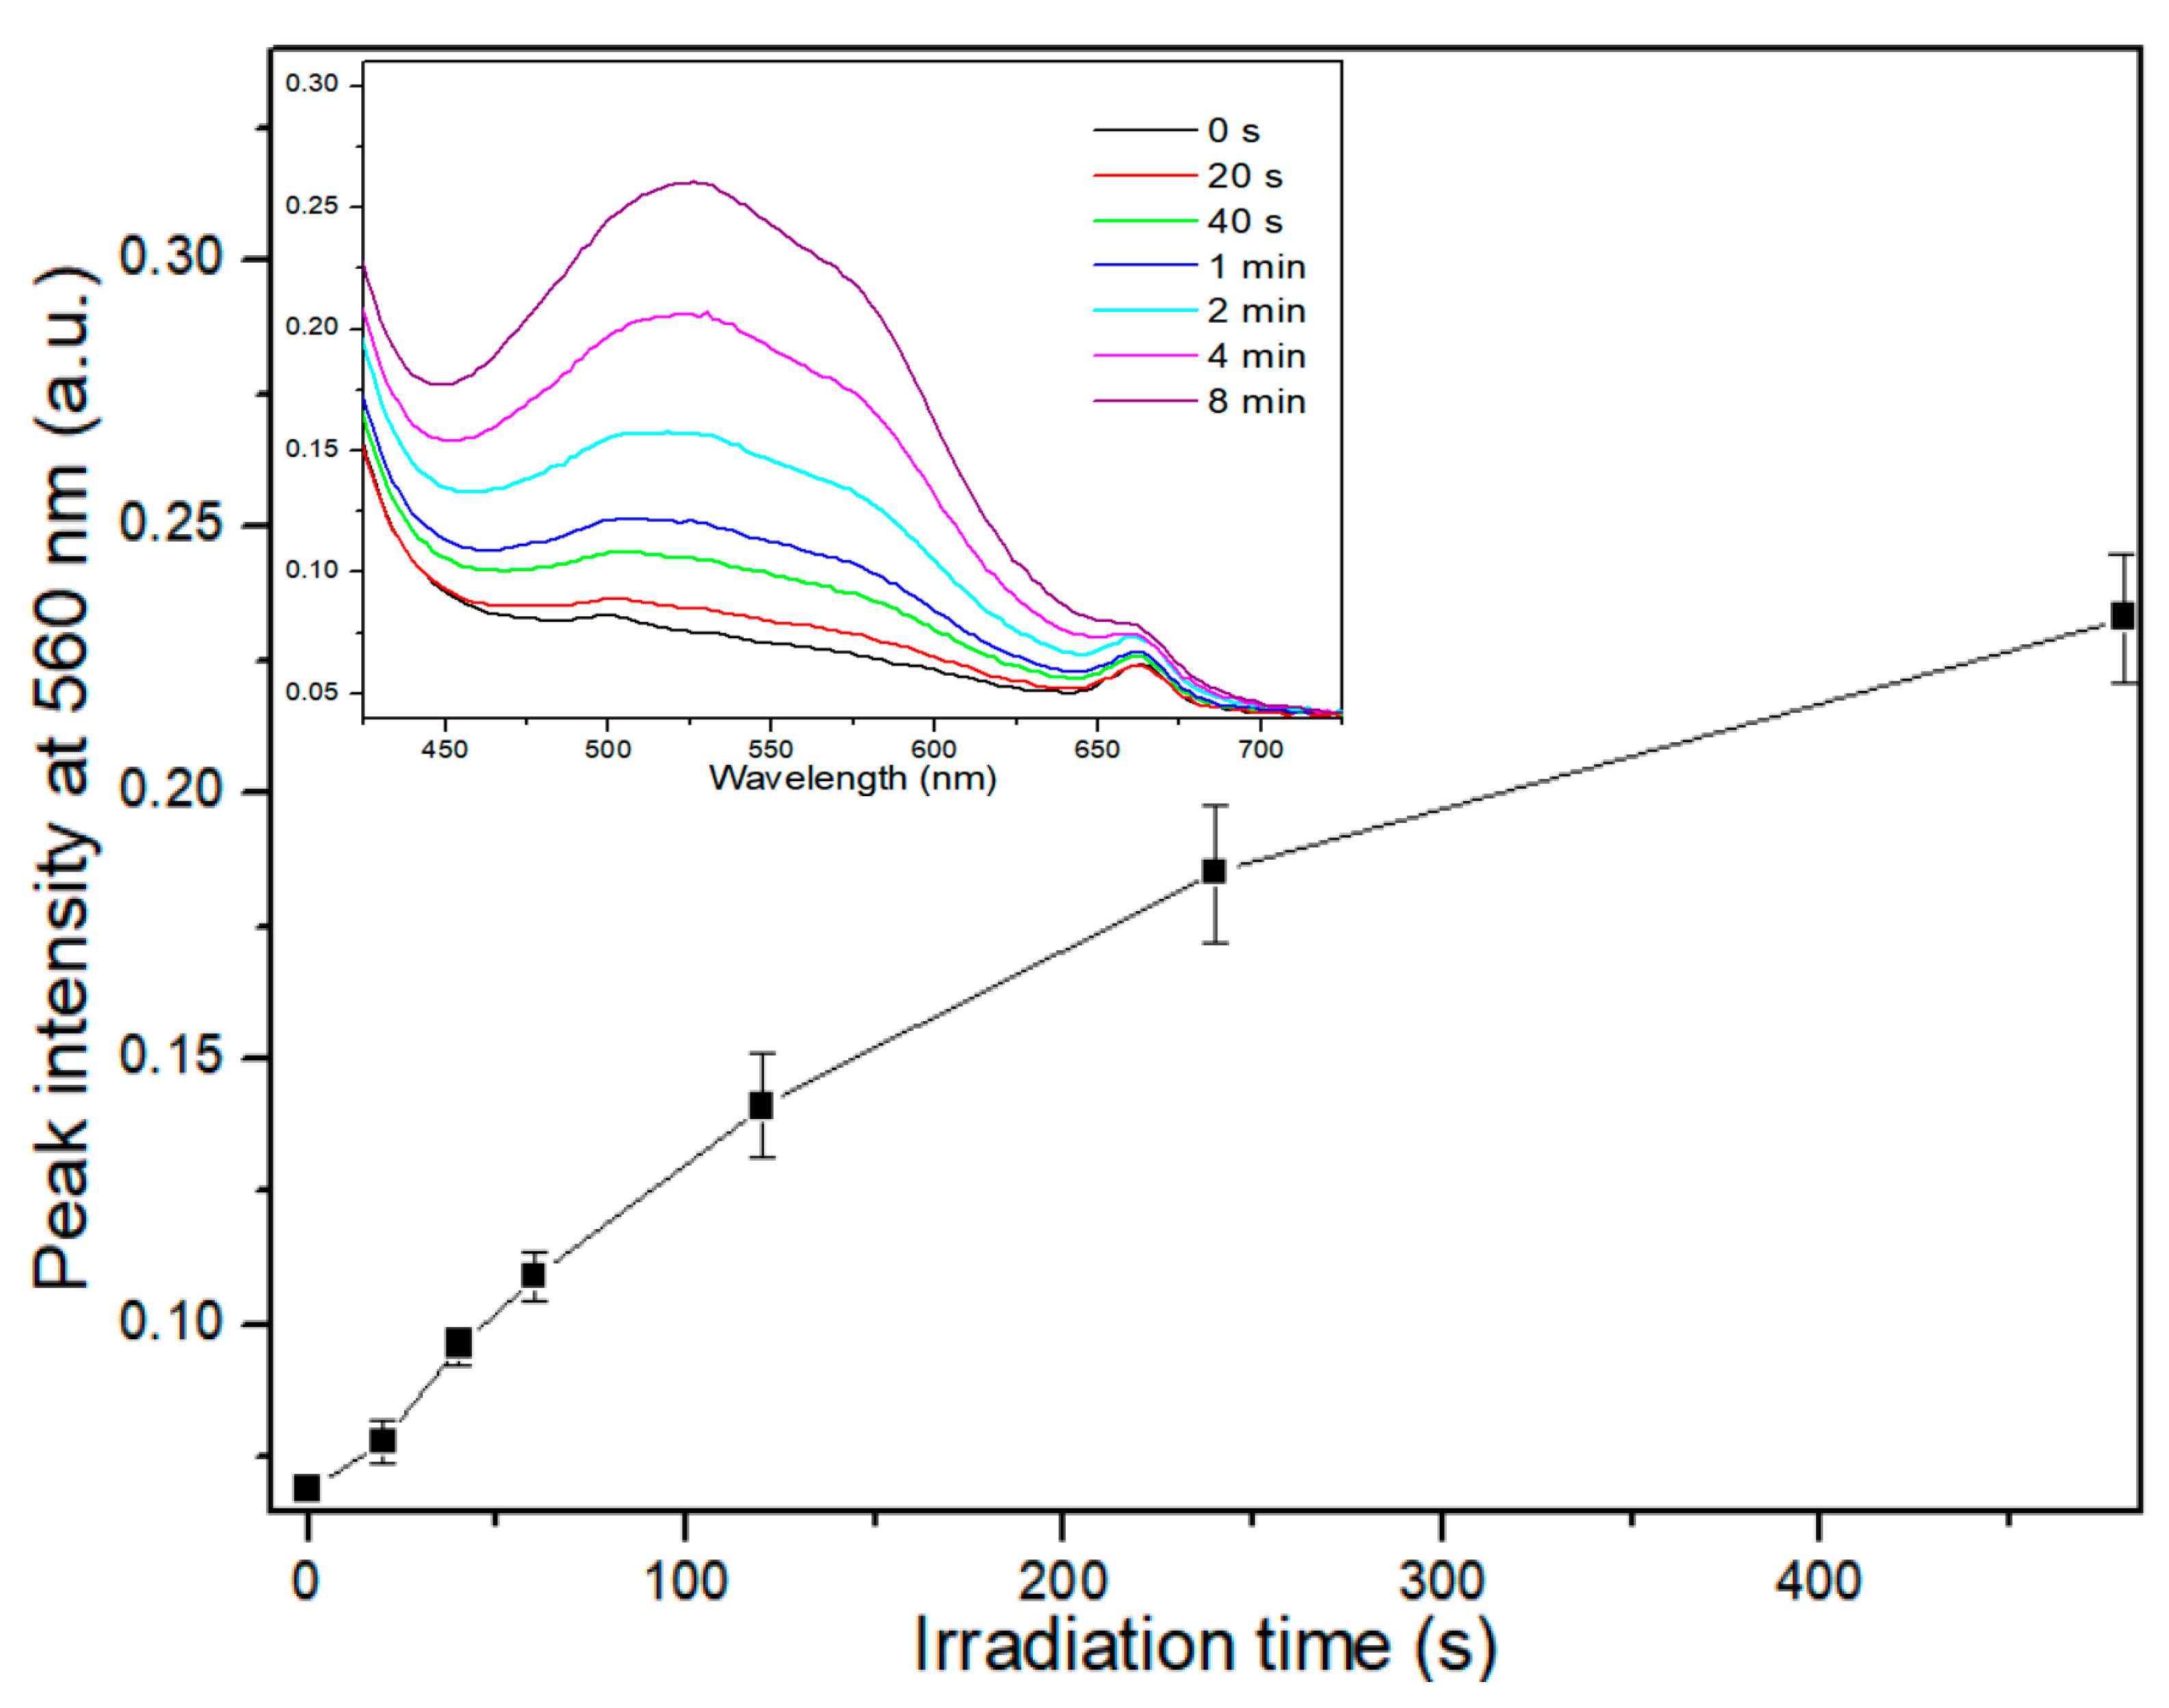
The results of the NBT assay are shown in Figure 3. For CS-Ce6, the initial NBT spectrum near the baseline gradually increased at 450–650 nm, with two peaks near 530 and 560 nm, with increasing irradiation time (Figure 3 inset). The increase in peak absorbance gradually slowed as the irradiation time increased.
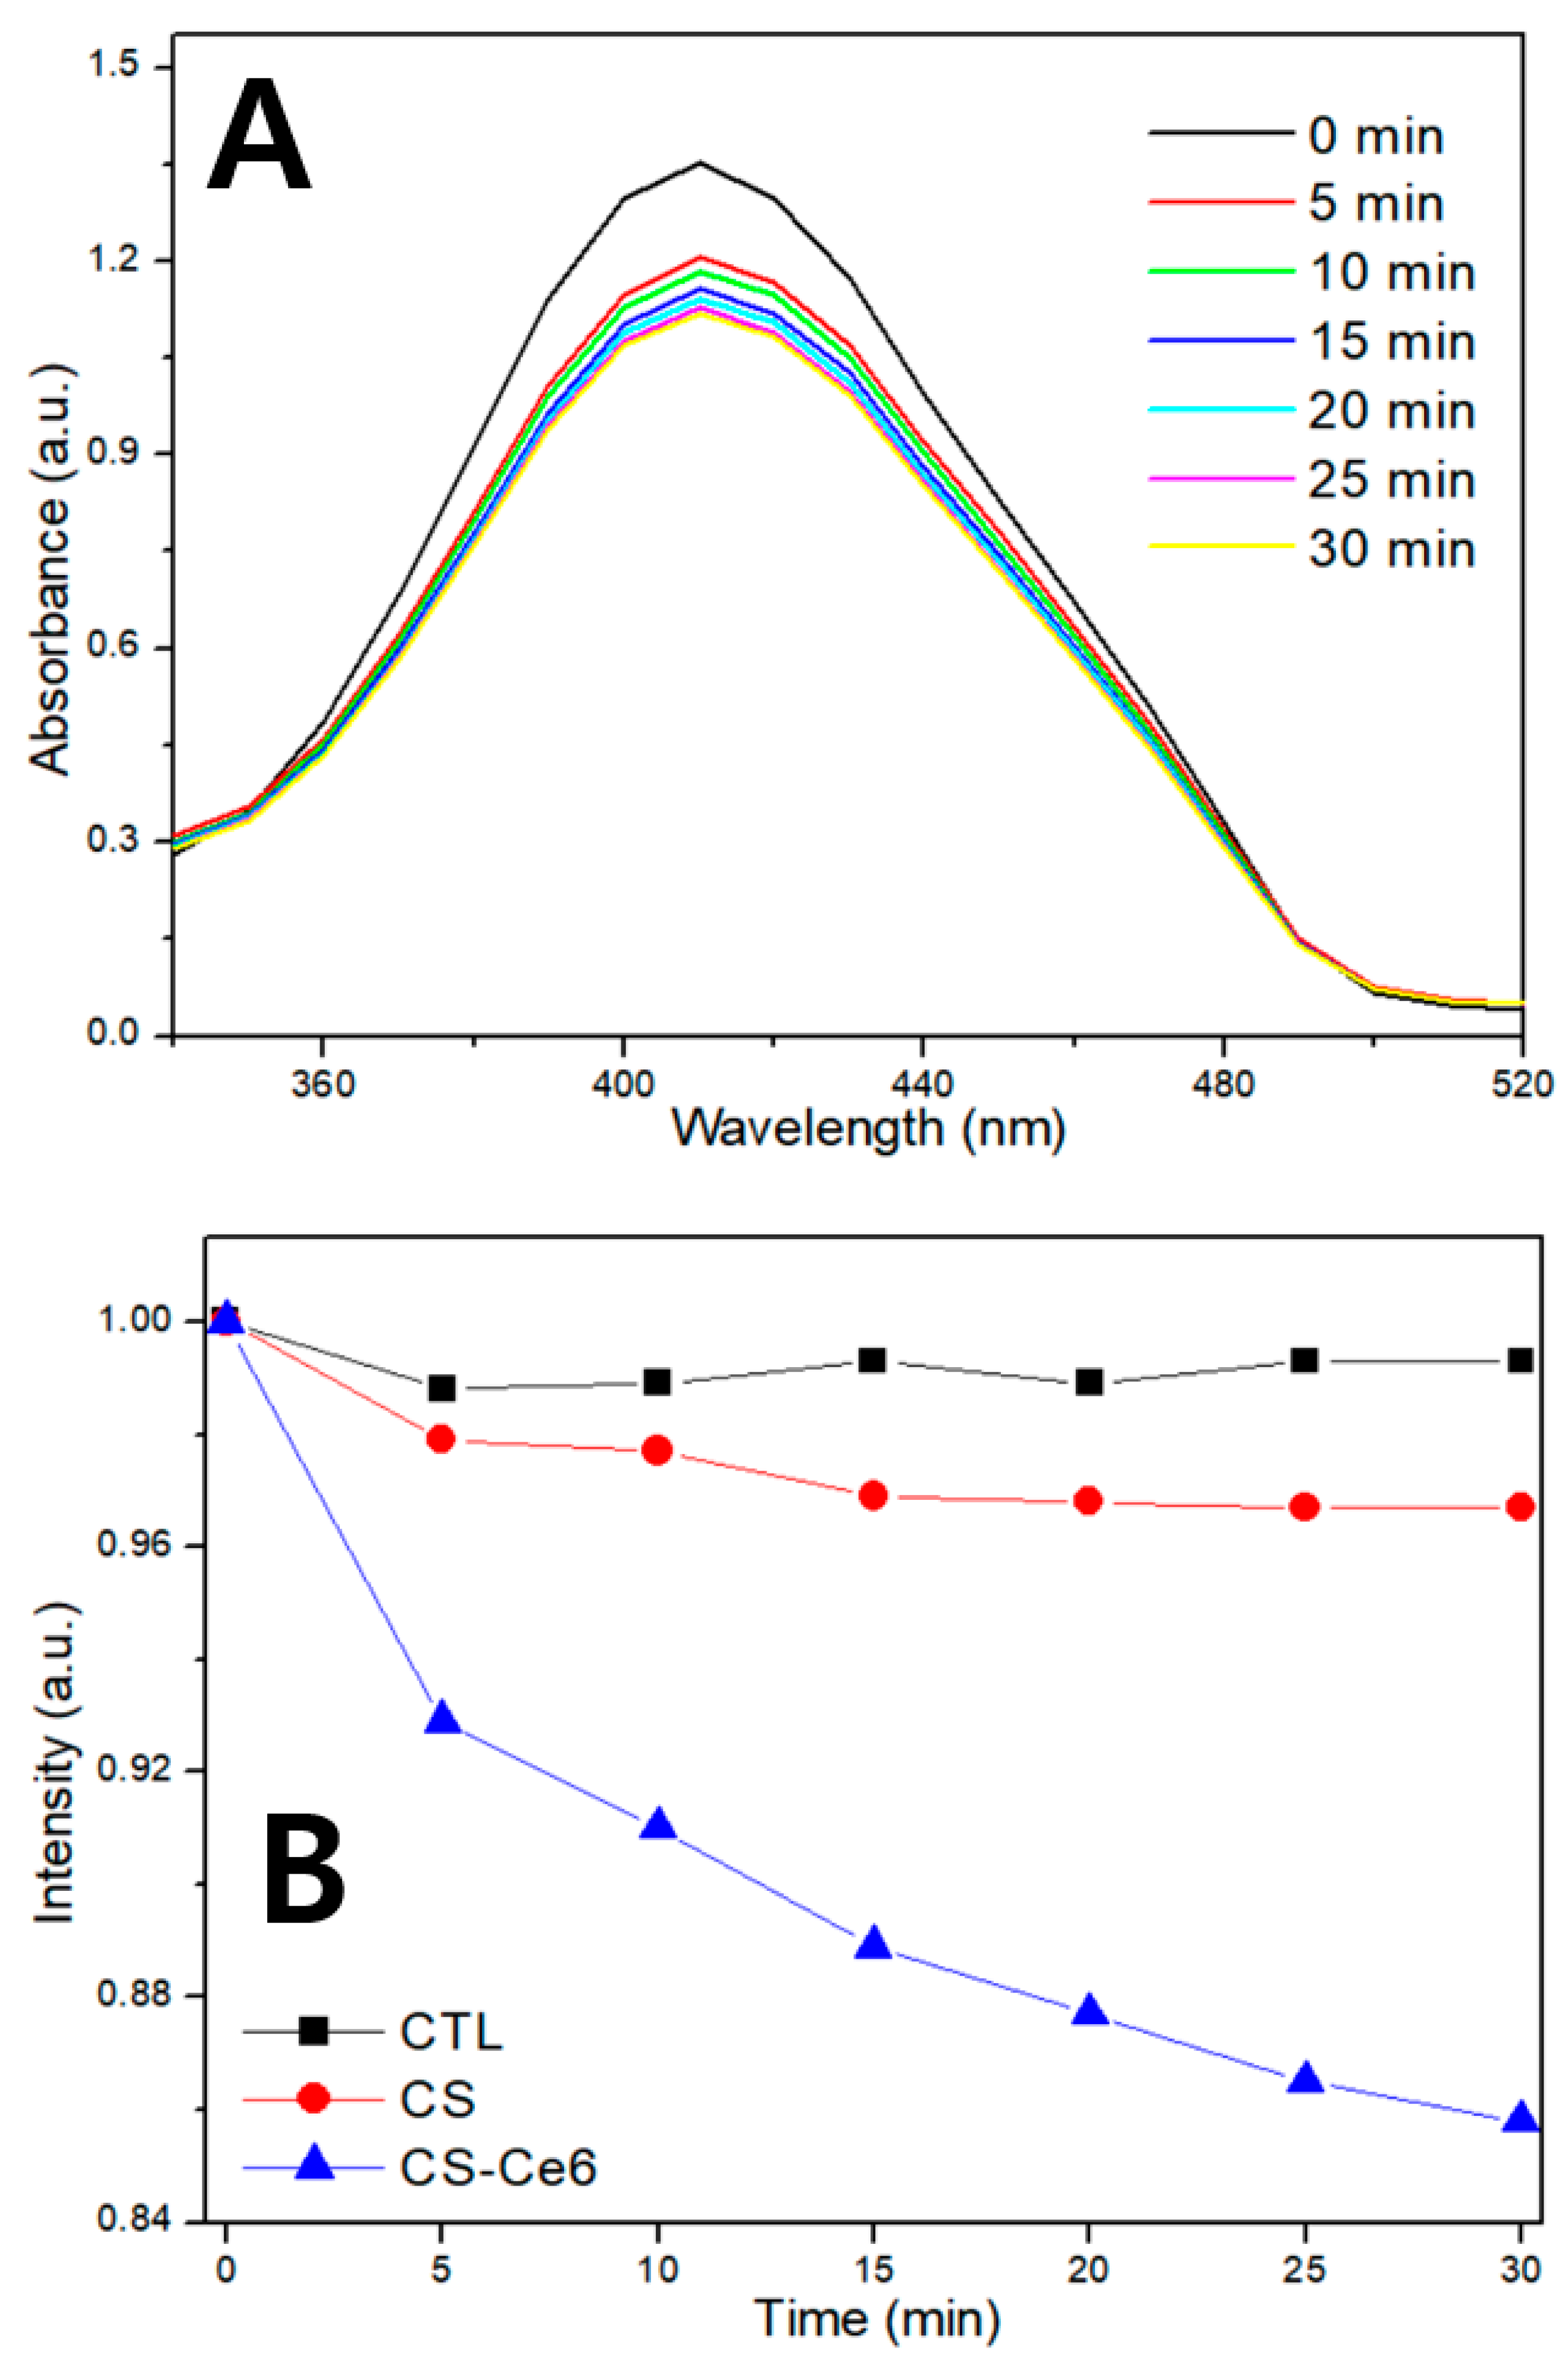
The results of the RNO-ID assay are shown in Figure 4. For CS-Ce6, the absorbance peak near 430 nm (Figure 4A) decreased significantly during the first 5 min of irradiation and then decreased slightly as irradiation time increased (Figure 4B). However, the peak intensity of absorption spectrum of CS exhibited minor change as irradiation time increased.
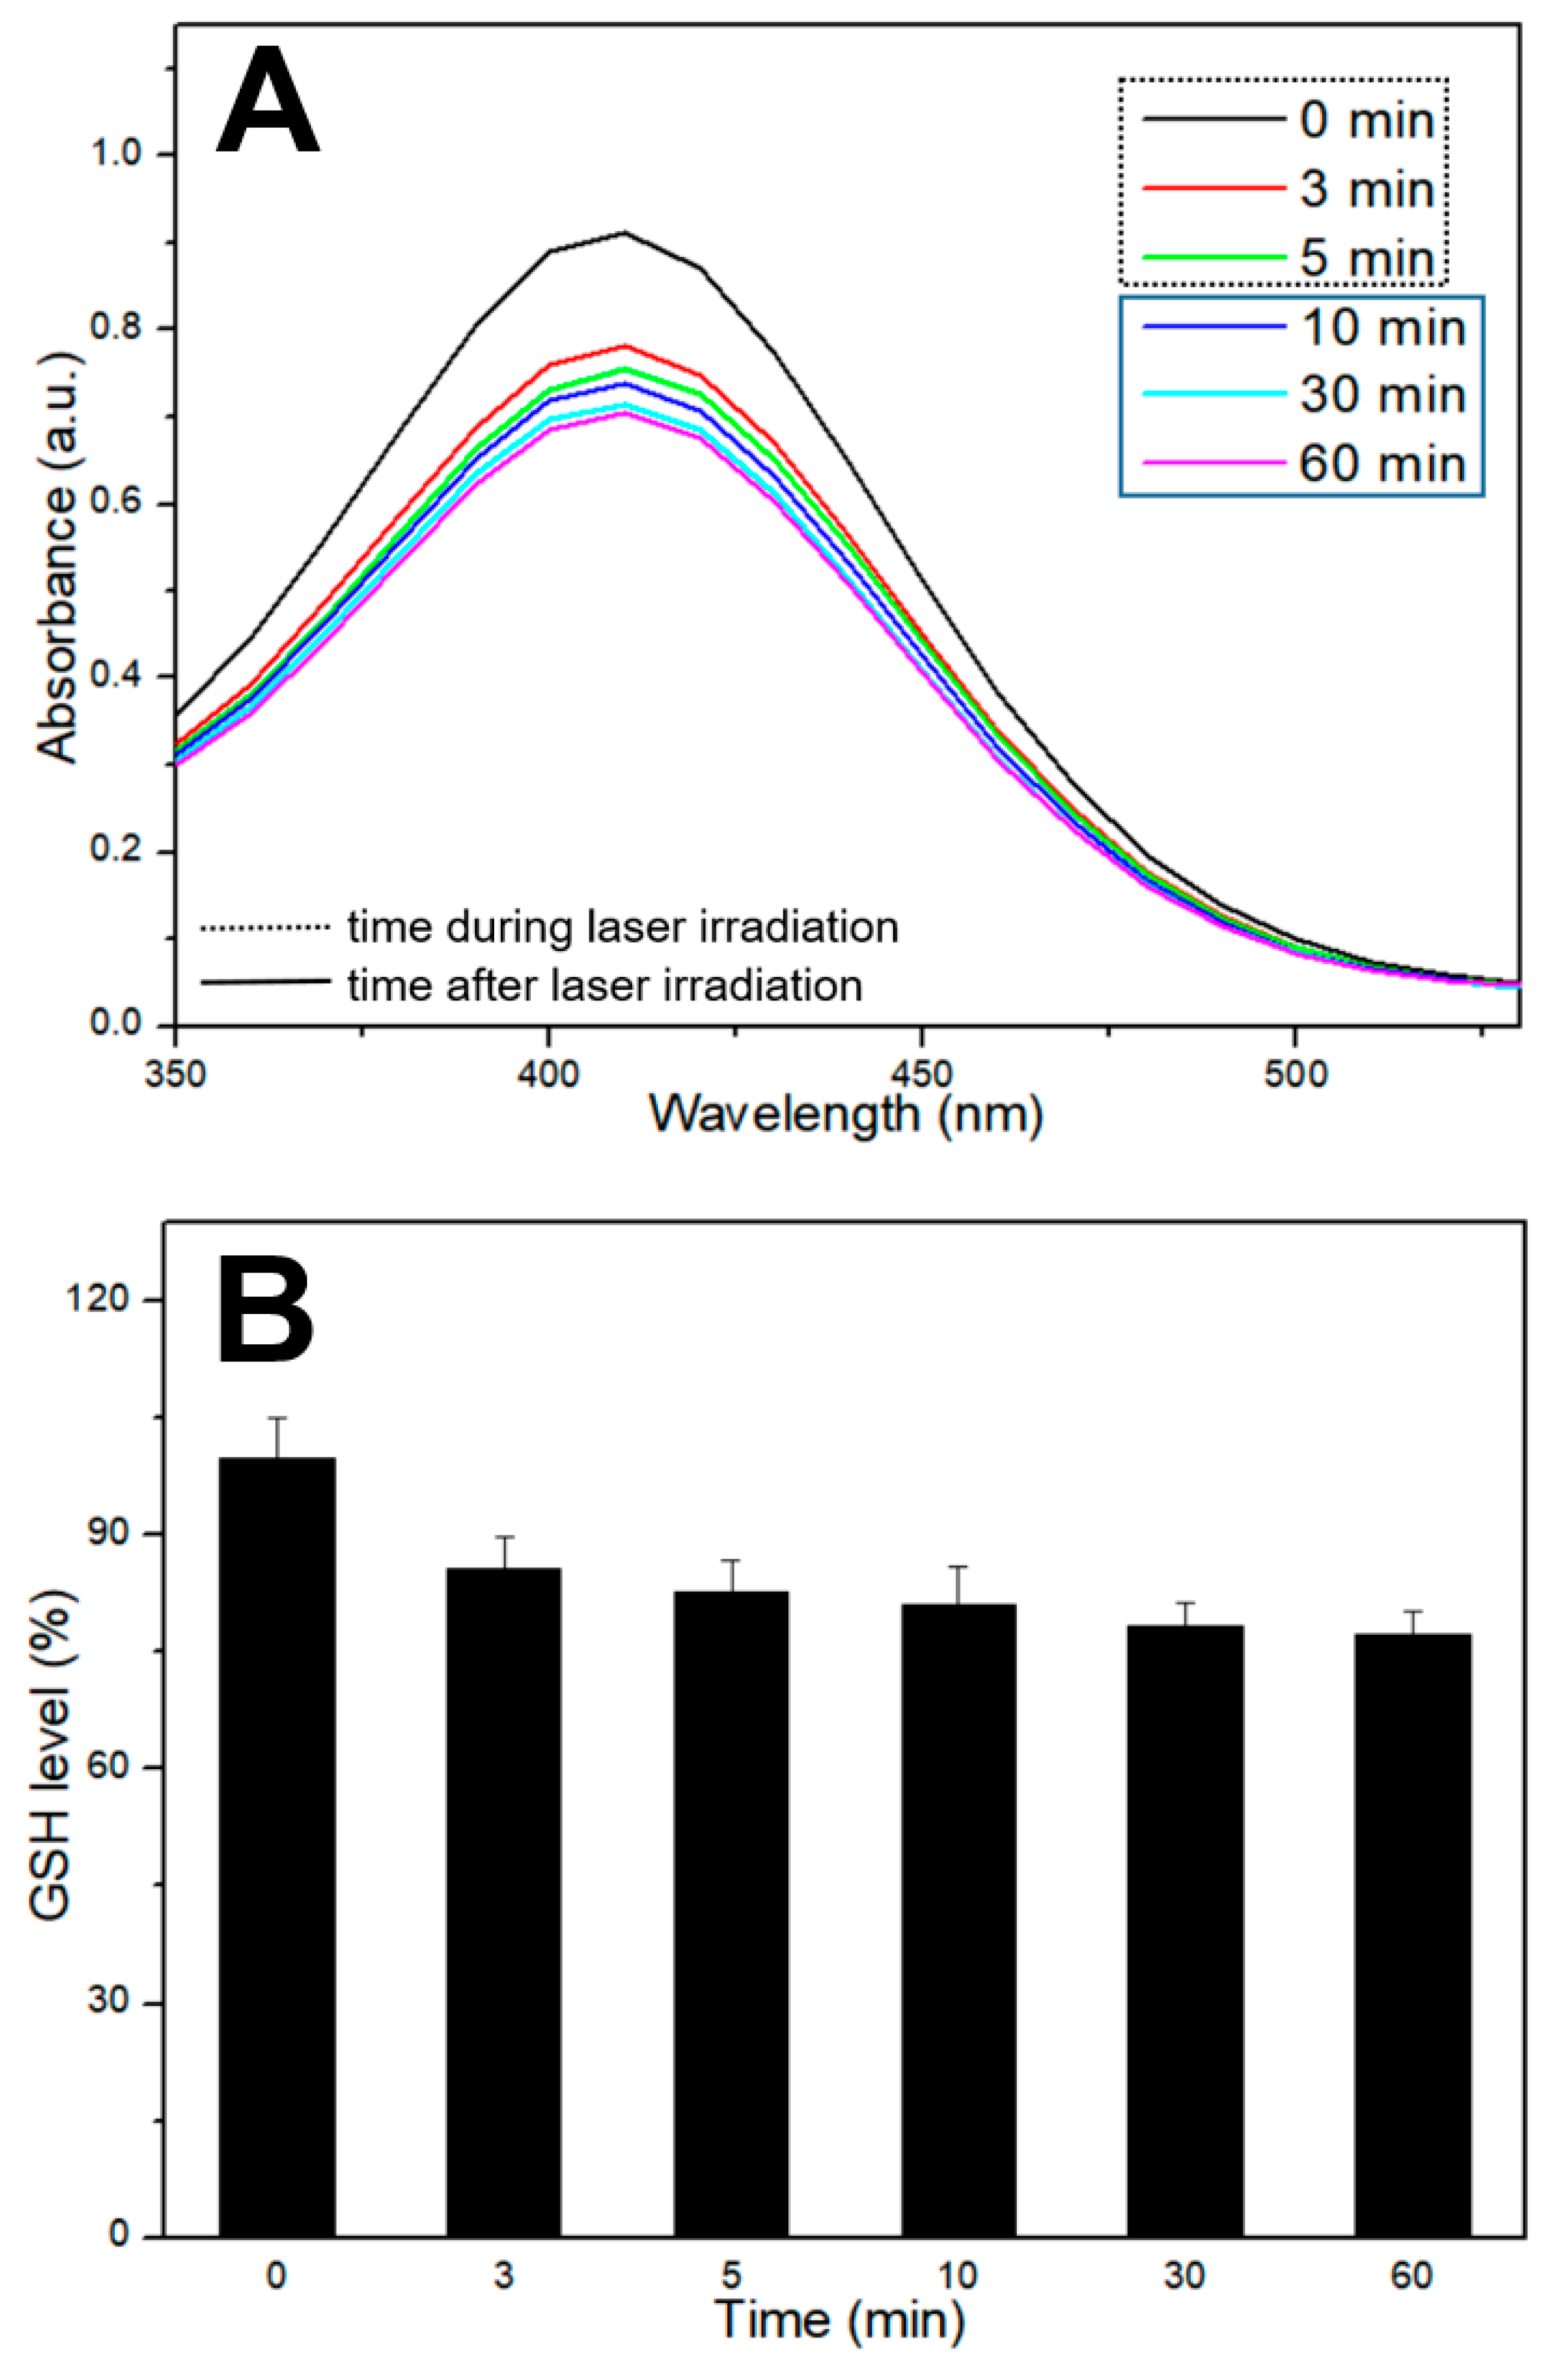
The results of the GSH assay under different conditions are shown in Figure 5. The initial absorbance of the assay solution showed a significant decrease in the peak intensity near 410 nm during light irradiation for 5 min, and after the termination of light irradiation, the decrease in the peak intensity slowed with time.
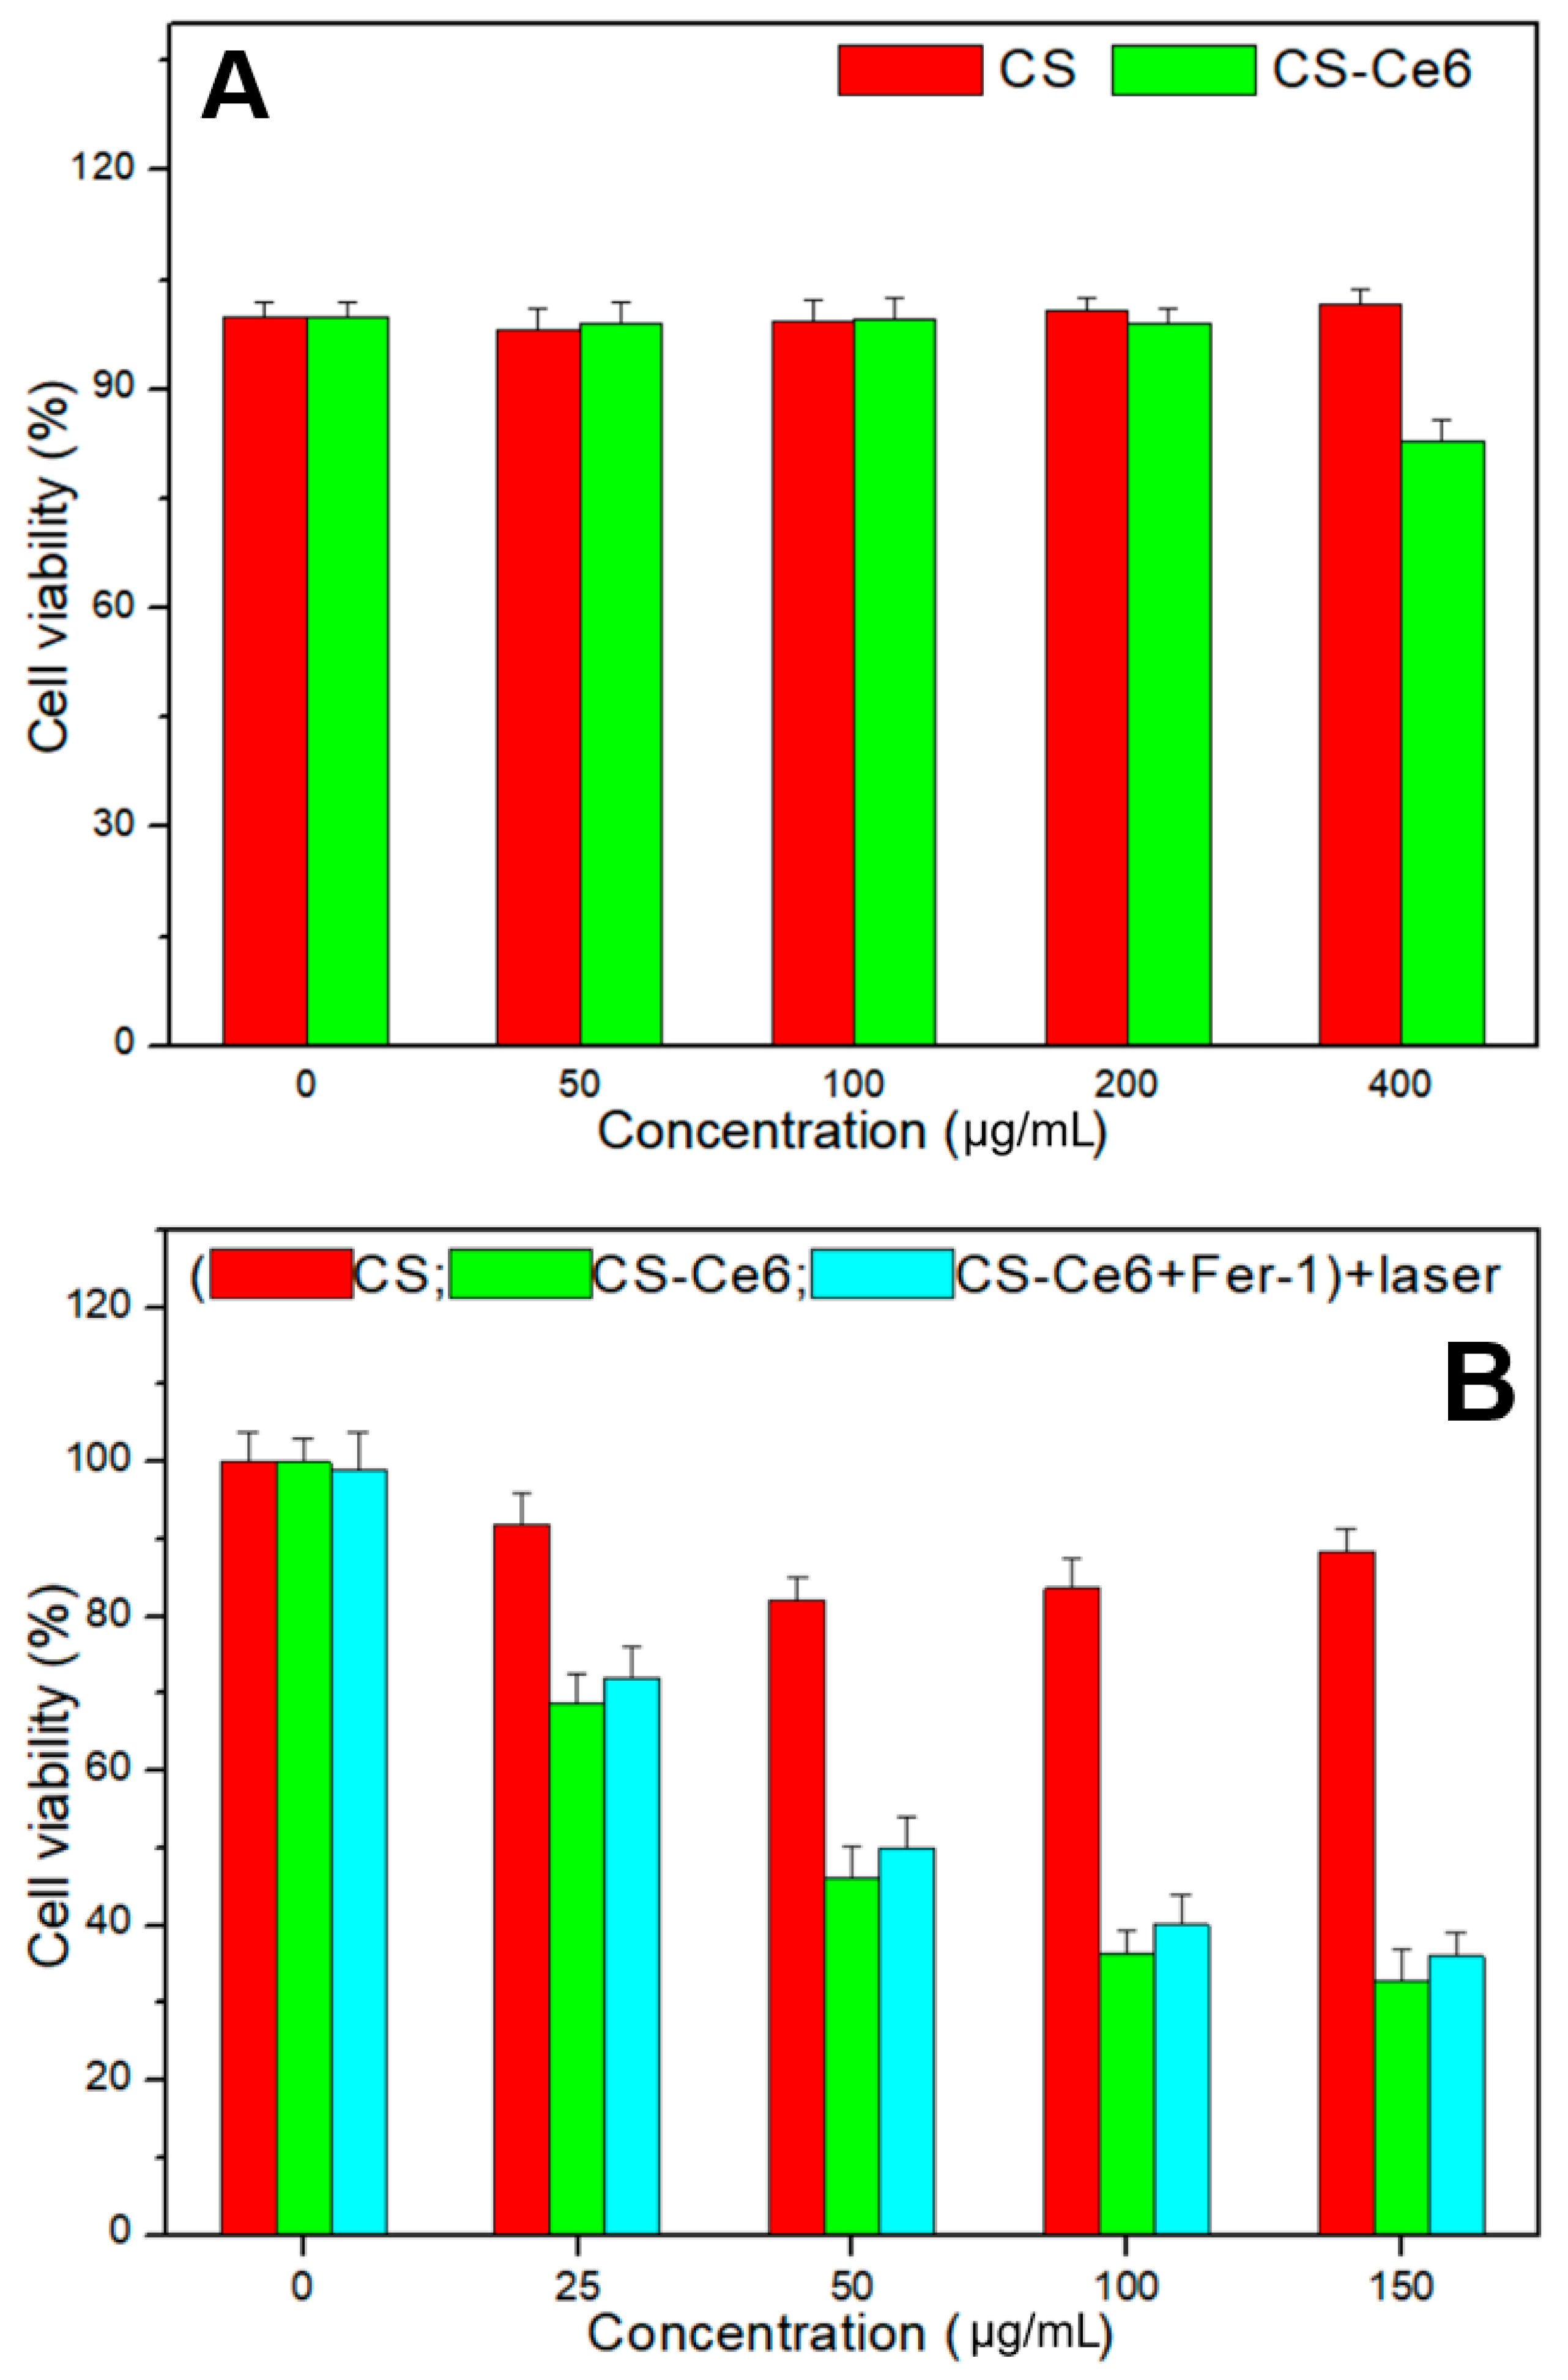
Figure 6 shows the viability of normal (HEK293; Figure 6A) and oral cancer cells (HSC3; Figure 6B) after treatment with CS and CS-Ce6. In HEK293 cells, CS-Ce6 caused negligible damage up to 200 ppm and less than 20% damage at 400 ppm. In the case of HSC3, CS caused only 12% damage at a concentration of 150 ppm under 660 nm of laser irradiation conditions. However, CS-Ce6 caused a significantly different cell viability (p < 0.05) with 67% damage under these conditions. Fer-1 co-treated with HSC3 showed higher cell viability compared to that of not-Fer-1 treated.
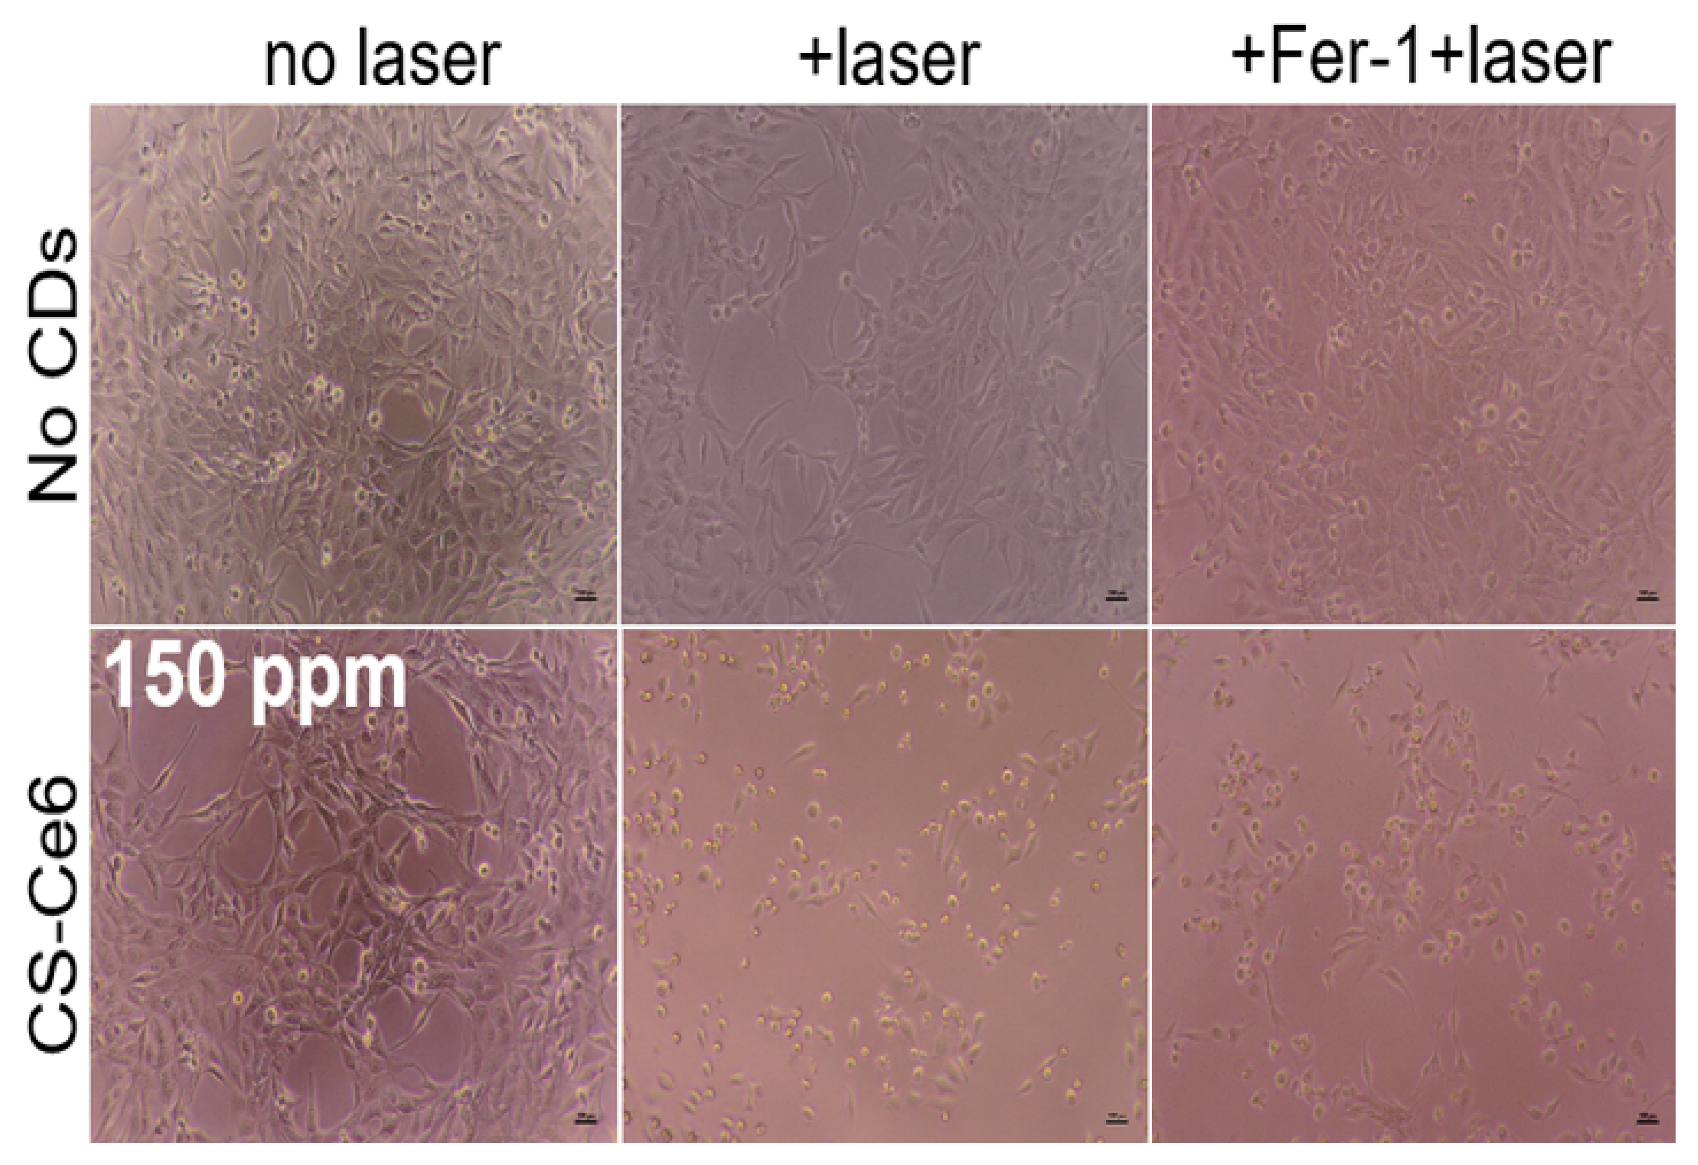
Optical microscope images of the treated HSC3 cells are shown in Figure 7. Before treatment, each cell exhibited normal and well-defined morphology. When cells were treated with 150 ppm CS-Ce6 and laser irradiation, no visible normal cells were observed, except for dead cells with a granular shape. However, when the cells were co-treated with Fer-1, some live cells were visible, along with dead cells with a granular shape.
Confocal microscope images of live/dead cells stained with calcein-AM/PI are shown in Figure 8. Non-fluorescent calcein-AM is converted into a fluorescent form in live cells, producing green fluorescence. PI can only enter cells with compromised or damaged membranes and produce red fluorescence. Cells treated with 150 ppm CS-Ce6 and laser irradiation showed many red fluorescent spots due to PI staining.
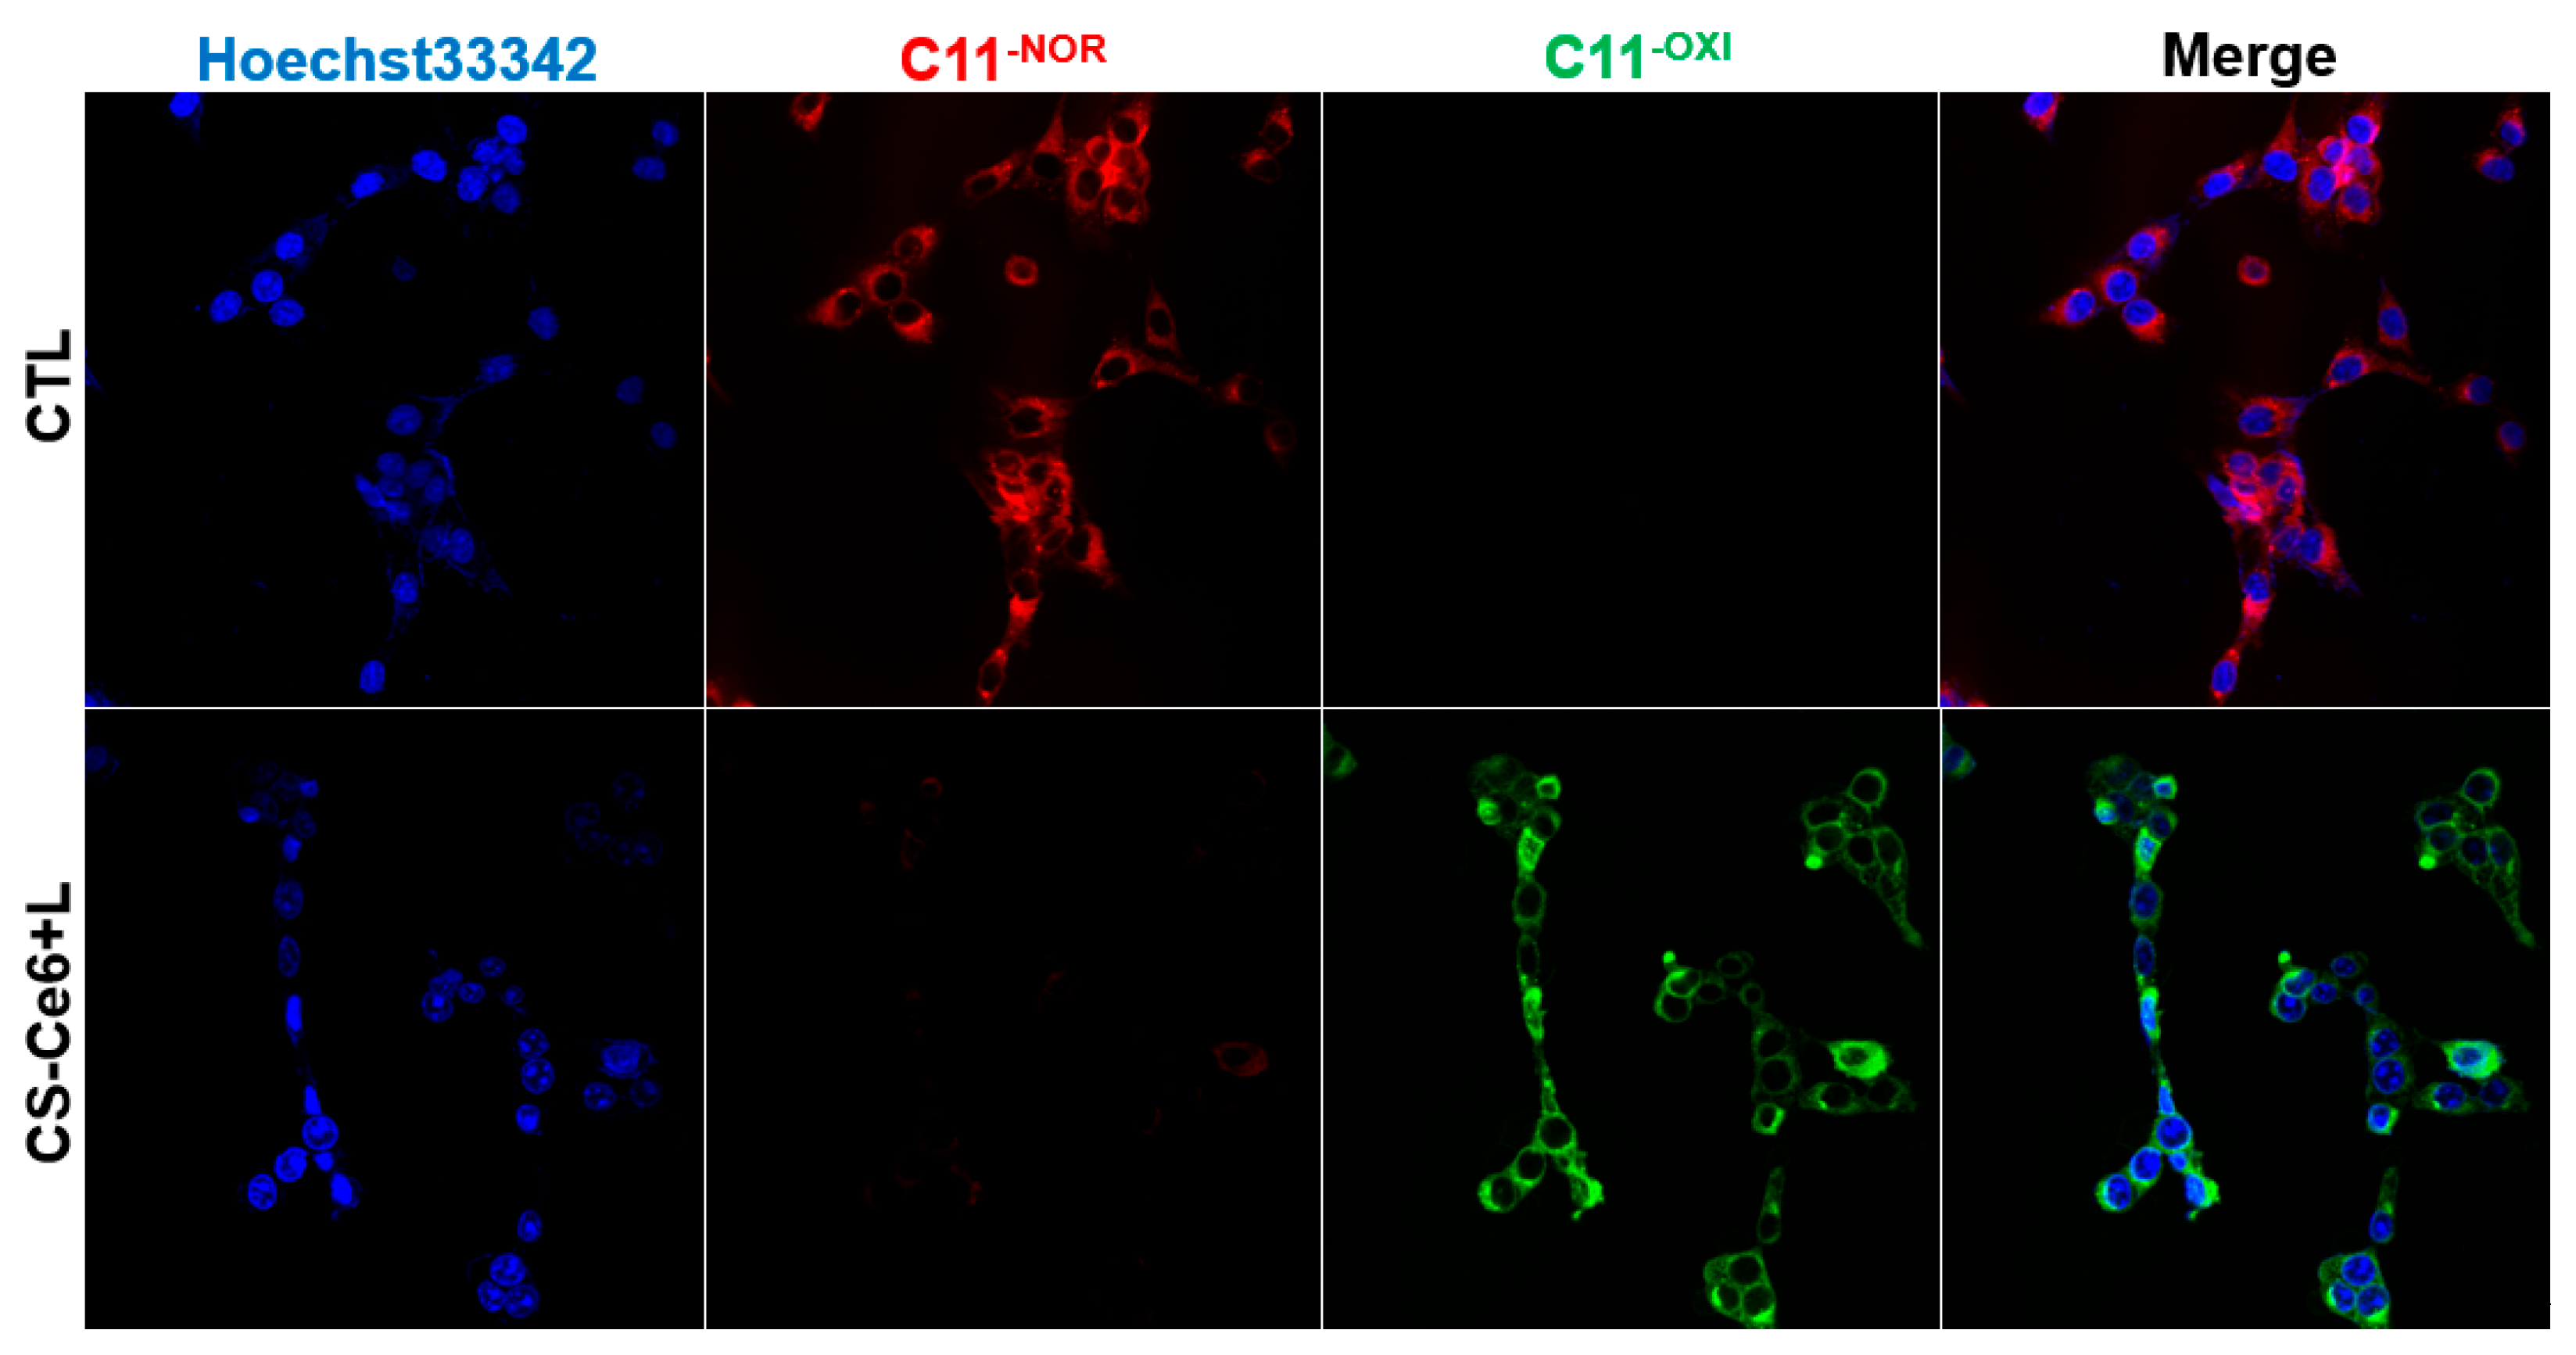
Intracellular LPO accumulation in HSC3 cells was observed using the C11-BODIPY581/591 dye (Figure 9). CTL (control; no CDs but laser irradiation) cells exhibited red fluorescence, whereas cells treated with CS-Ce6 and laser irradiation exhibited green fluorescence, indicating LPO formation.

4. Discussion

Cancer remains one of the most formidable diseases yet to be conquered. Despite tremendous research and development efforts, many cancers remain beyond our control. Many studies have tested the usefulness of CDs in fighting cancer. As an extensive family of carbon allotropes, CDs have been extensively used in antitumor treatments. Among the characteristic features of antitumor activity, ROS production is particularly challenging. ROS are highly active and induce cellular damage via oxidative stress. In this study, three different ROS (•OH, •O2, and 1O2) were identified using assays.
To identify •OH, TMB was used as peroxidase substrate. Depending on the concentration, the transparent or yellow TMB changes to blue (oxTMB), which has an absorption peak at 650 nm when oxidized by •OH [23]. TMB can be oxidized in the presence of a peroxidase enzyme, such as horseradish peroxidase, and H2O2, by peroxidase-like activity. In addition, TMB can be oxidized by •OH if existed anyhow. Generally, •OH is produced through the Fenton reaction via the interaction between Fe and H2O2. However, CDs are also known to produce •OH by breaking H2O2 via a Fenton-like reaction without the use of Fe or Cu [24,25]. In this study, the CS-Ce6-treated H2O2-containing TMB solution increased its absorbance with the laser irradiation time, and the increment was high during the initial laser irradiation for 5 min. This result may indicate the gradual production of •OH during laser irradiation via a Fenton-like reaction involving CS-Ce6.
Oxidase (OXD) is an enzyme that uses oxygen or H2O2 as an electron acceptor in an oxidation–reduction reaction, which enables the production of superoxide anion (•O2). The formation of •O2 can be assessed spectroscopically using the NBT assay [26,27]. NBT is in an oxidized state and has a yellow color, which changes to blue upon interaction with •O2. As a reducing agent, •O2 produces insoluble blue formazan by donating electrons to NBT. The production of •O2 by CS-Ce6 through OXD-like activity in the H2O2 substrate was manifested by the change in peak absorbance at 450–650 nm. The increased peak intensity over time reflects the increased formation of •O2, which results in the formation of blue formazan.
The RNO-ID assay enables spectroscopic detection of 1O2 production [28,29]. ID traps 1O2, and RNO degrades if it interacts with the trapped 1O2. As a result of degradation, the peak absorbance decreased as the laser irradiation time increased, indicating the production of 1O2 with time. Ce6 used in this study is a photosensitizer with a strong absorption peak near 402 nm and a mild absorption peak near 662 nm. It becomes excited upon light absorption and produces ROS using the surrounding oxygen. Various ROS are produced during the photodynamic process, which involves the interaction of a photosensitizer with light and oxygen. Through energy transfer from the excited photosensitizer to stable triplet oxygen, 1O2 can be produced (type II). Other ROS, such as •O2, H2O2, and •OH, can be produced directly or indirectly through electron transfer to the surrounding oxygen, depending on the surrounding environment (type I). As shown, the decrease in absorbance intensity during the first 5 min of irradiation was high and then decreased somewhat linearly, although the irradiation time increased several times. This may be related to the amount of available oxygen. As ROS production depends significantly on environmental oxygen, a constant oxygen supply is necessary to warrant consistent ROS production (i.e., a decrease in the intensity).
GSH depletion during laser irradiation was assessed using the DTNB assay. The characteristic feature of GSH depletion is presented as the change of 2-nitro-5-thiobenzoic acid (TNB) absorbance, which has an absorption peak at approximately 412 nm [30,31]. When GSH reacts with colorless DTNB, it breaks the disulfide bond in DTNB and forms a glutathione-TNB adduct and yellow TNB. The observed initial absorption spectrum of the assay solution is that of TNB. In this situation, if there is ROS, TNB can be oxidized to DTNB, causing a decrease in initial peak absorbance at 412 nm, which means gradual decrease in yellow TNB and increase in colorless DTNB. Also, the amino groups on the CD surface interact with GSH, promoting the transfer of electrons from the thiol group (-SH) of GSH to oxygen, thereby creating GSSG. In this study, the depletion reached approximately 18% after 5 min of irradiation, slowed with time, and reached 21% after 1 h of irradiation. If GSH is degraded by ROS, it decreases the activity of GPx and GPx4, which are cellular antioxidants, leading to an increase in the accumulation of lipid peroxides [32,33]. Lipid peroxides can damage cells and disrupt cellular process, causing cell death which is known as ferroptosis via lipid peroxidation (LPO) [32,33]. LPO is a chain reaction that involves interactions between ROS and lipids, the formation of lipid radicals and the production of toxic lipid peroxides, and resultant cell damage. Accumulated lipid peroxides on cell membranes regulate cell death and are characterized by the oxidation of C11-BODIPY581/591 in the intracellular LPO detection test, which manifests as green fluorescence in treated cells [34,35].
The viability of HSC3 cells was tested in the presence and absence of Fer-1. As a radical-trapping agent, Fer-1 inhibits ROS accumulation and LPO-associated ferroptosis [36,37]. Inhibition of ferroptosis by Fer-1 increased the viability of HSC3 cells after co-treatment with Fer-1 [38,39]. Glutathione depletion triggered by ROS downregulates cellular antioxidant enzymes, upregulates intracellular LPO, and increases cell death by ferroptosis, as indicated by the green fluorescence emitted from cell-permeated oxidized C11-BODIPY581/591 within HSC3 cells.

5. Conclusions

Within the limitations of this in vitro study, CS-Ce6 induced high levels of cancer cell death upon laser irradiation. According to the assay tests, CS-Ce6 produced various ROS (•OH, •O2, 1O2) and depleted glutathione under 100 μM H2O2 and laser irradiation conditions. CS-Ce6 achieved high cancer cell elimination at 100–150 ppm concentration, and according to optical microscopy, with no visible live cells. However, normal cells were minimally damaged up to 200 ppm. ROS production may lead to apoptotic and ferroptotic cell death via LPO accumulation. Overall, CS-Ce6 achieved effective antitumor applicability by inducing a synergistic apoptosis–ferroptosis therapy.

Author Contributions

S.-Y.P.: Writing—original draft, methodology, investigation, data curation; M.-H.R.: writing—original draft, investigation, data curation; W.K.: methodology, investigation, data curation; F.G.-G.: review and editing, comment; Y.H.K.: conceptualization, methodology, validation, funding acquisition; H.-O.J.: writing–review and editing, methodology, supervision. All authors have read and agreed to the published version of the manuscript.

Funding

This work was supported by the National Research Foundation of Korea (NRF) grant funded by the Korean government (Ministry of Science and ICT) (No. 2022R1A2C2005011).

Data Availability Statement

The data supporting the conclusions of this article will be available by the authors on reasonable request.

Conflicts of Interest

The authors declare no conflicts of interest.

References

  1. Peltanova, B.; Raudensk, M.; Masarik, M. Effect of tumor microenvironment on pathogenesis of the head and neck squamous cell carcinoma: A systematic review. Mol. Cancer 2019, 18, 63. [Google Scholar] [CrossRef]
  2. Johnson, D.E.; Burtness, B.; Leemans, C.R.; Lui, V.W.Y.; Bauman, J.E.; Grandis, J.R. Head and neck squamous cell carcinoma. Nat. Rev. Dis. Primers 2020, 6, 92. [Google Scholar] [CrossRef]
  3. Badwelan, M.; Muaddi, H.; Ahmed, A.; Lee, K.T.; Tran, S.D. Oral squamous cell carcinoma and concomitant primary tumors, what do we know? A review of the literature. Curr. Oncol. 2023, 30, 3721–3734. [Google Scholar] [CrossRef]
  4. Liu, H.; Yu, Z.; Xu, Z.; Liu, T.; Liu, W. A scientometric study of tobacco and alcohol use as risk factors for oral cavity health. J. Dent. Sci. 2023, 18, 1883–1888. [Google Scholar] [CrossRef]
  5. Jiang, X.; Wu, J.; Wang, J.; Huang, R. Tobacco and oral squamous cell carcinoma: A review of carcinogenic pathways. Tob. Induc. Dis. 2019, 17, 29. [Google Scholar] [CrossRef]
  6. D’souza, S.; Addepalli, V. Preventive measures in oral cancer: An overview. Biomed. Pharmacother. 2018, 107, 72–80. [Google Scholar] [CrossRef] [PubMed]
  7. Niculescu, A.G.; Grumezescu, A.M. Novel tumor-targeting nanoparticles for cancer treatment—A review. Int. J. Mol. Sci. 2022, 23, 5253. [Google Scholar] [CrossRef]
  8. Gavas, S.; Quazi, S.; Karpiński, T.M. Nanoparticles for cancer therapy: Current progress and challenges. Nanoscale Res. Lett. 2021, 16, 173. [Google Scholar] [CrossRef] [PubMed]
  9. Bajpai, S.; Tiwary, S.K.; Sonker, M.; Joshi, A.; Gupta, V.; Kumar, Y.; Shreyash, N.; Biswas, S. Recent advances in nanoparticle-based cancer treatment: A review. ACS Appl. Nano Mater. 2021, 4, 6441–6470. [Google Scholar] [CrossRef]
  10. Zhang, Q.; Luo, Q.; Liu, Z.; Sun, M.; Dong, X. Nano-ROS-generating approaches to cancer dynamic therapy: Lessons from nanoparticles. Chem. Eng. J. 2023, 457, 141225. [Google Scholar] [CrossRef]
  11. Sanati, M.; Afshari, A.R.; Kesharwani, P.; Sukhorukov, V.N.; Sahebkar, A. Recent trends in the application of nanoparticles in cancer therapy: The involvement of oxidative stress. J. Control. Release 2022, 348, 287–304. [Google Scholar] [CrossRef] [PubMed]
  12. Glorieux, C.; Liu, S.; Trachootham, D.; Huang, P. Targeting ROS in cancer: Rationale and strategies. Nat. Rev. Drug Discov. 2024, 23, 583–606. [Google Scholar] [CrossRef]
  13. Tang, D.; Kang, R.; Vanden Berghe, T.; Vandenabeele, P.; Kroemer, G. The molecular machinery of regulated cell death. Cell Res. 2019, 29, 347–364. [Google Scholar] [CrossRef]
  14. Ai, Y.; Meng, Y.; Yan, B.; Zhou, Q.; Wang, X. The biochemical pathways of apoptotic, necroptotic, pyroptotic, and ferroptotic cell death. Mol. Cell 2024, 84, 170–179. [Google Scholar] [CrossRef] [PubMed]
  15. Li, D.; Li, Y. The interaction between ferroptosis and lipid metabolism in cancer. Sig. Transduct. Target Ther. 2020, 5, 108. [Google Scholar] [CrossRef]
  16. Lei, G.; Zhuang, L.; Gan, B. Targeting ferroptosis as a vulnerability in cancer. Nat. Rev. Cancer 2022, 22, 381–396. [Google Scholar] [CrossRef]
  17. Li, X.; Lovell, J.F.; Yoon, J.; Chen, X. Clinical development and potential of photothermal and photodynamic therapies for cancer. Nat. Rev. Clin. Oncol. 2020, 17, 657–674. [Google Scholar] [CrossRef]
  18. Brown, S.B.; Brown, E.A.; Walker, I. The present and future role of photodynamic therapy in cancer treatment. Lancet Oncol. 2004, 5, 497–508. [Google Scholar] [CrossRef]
  19. Csapó, E.; Wojnicki, M. Carbon Quantum Dots: The Role of Surface Functional Groups and Proposed Mechanisms for Metal Ion Sensing. Inorganics 2023, 11, 262. [Google Scholar] [CrossRef]
  20. Singh, H.; Razzaghi, M.; Ghorbanpoor, H.; Ebrahimi, A.; Avci, H.; Akbari, M.; Hassan, S. Carbon dots in drug delivery and therapeutic applications. Adv. Drug Deliv. Rev. 2025, 224, 115644. [Google Scholar] [CrossRef]
  21. Ling, Z.N.; Jiang, Y.F.; Ru, J.N.; Lu, J.H.; Ding, B.; Wu, J. Amino acid metabolism in health and disease. Sig. Transduct. Target Ther. 2023, 8, 345. [Google Scholar] [CrossRef]
  22. Kelly, B.; Pearce, E.L. Amino Assets: How Amino Acids Support Immunity. Cell Metab. 2020, 32, 154–175. [Google Scholar] [CrossRef]
  23. Cao, C.; Wang, X.; Yang, N.; Song, X.; Dong, X. Recent advances of cancer chemodynamic therapy based on Fenton/Fenton-like chemistry. Chem. Sci. 2022, 13, 863–889. [Google Scholar] [CrossRef]
  24. Cao, W.; Jin, M.; Yang, K.; Chen, B.; Xiong, M.; Li, X.; Cao, G. Fenton/Fenton-like metal-based nanomaterials combine with oxidase for synergistic tumor therapy. J. Nanobiotechnol. 2021, 19, 325. [Google Scholar] [CrossRef]
  25. Wang, N.; Zeng, Q.; Zhang, R.; Xing, D.; Zhang, T. Eradication of solid tumors by chemodynamic theranostics with H2O2-catalyzed hydroxyl radical burst. Theranostics 2021, 11, 2334–2348. [Google Scholar] [CrossRef]
  26. Zhao, H.; Zhang, R.; Yan, X.; Fan, K. Superoxide dismutase nanozymes: An emerging star for anti-oxidation. J. Mater. Chem. B 2021, 9, 6939–6957. [Google Scholar] [CrossRef]
  27. Li, Y.; Fu, R.; Duan, Z.; Zhu, C.; Fan, D. Artificial Nonenzymatic Antioxidant MXene Nanosheet-Anchored Injectable Hydrogel as a Mild Photothermal-Controlled Oxygen Release Platform for Diabetic Wound Healing. ACS Nano 2022, 16, 7486–7502. [Google Scholar] [CrossRef] [PubMed]
  28. Pandey, N.K.; Chudal, L.; Phan, J.; Lin, L.; Johnson, O.; Xing, M.; Liu, J.P.; Li, H.; Huang, X.; Shu, Y.; et al. A facile method for the synthesis of copper-cysteamine nanoparticles and study of ROS production for cancer treatment. J. Mater. Chem. B 2019, 7, 6630–6642. [Google Scholar] [CrossRef] [PubMed]
  29. Liu, H.; Yu, C.; Lyu, M.; Lyu, S.; Hu, L.; Xiao, E.; Xu, P. Novel albumin-binding photodynamic agent EB-Ppa for targeted fluorescent imaging guided tumour photodynamic therapy. RSC Adv. 2023, 13, 3534–3540. [Google Scholar] [CrossRef]
  30. Landino, L.M.; Mall, C.B.; Nicklay, J.J.; Dutcher, S.K.; Moynihan, K.L. Oxidation of 5-thio-2-nitrobenzoic acid, by the biologically-relevant oxidants peroxynitrite anion, hydrogen peroxide and hypochlorous acid. Nitric Oxide 2007, 18, 11–18. [Google Scholar] [CrossRef] [PubMed]
  31. Wang, J.; Zhang, X.; Liu, Y.; Wang, Z.; Wang, P.; Zheng, Z.; Cheng, H.; Dai, Y.; Huang, B. Enhanced singlet oxygen production over a photocatalytic stable metal organic framework composed of porphyrin and Ag. J. Colloid Interface Sci. 2021, 602, 300–306. [Google Scholar] [CrossRef]
  32. Li, J.; Cao, F.; Yin, H.; Huang, Z.; Lin, Z.; Mao, N.; Sun, B.; Wang, G. Ferroptosis: Past, present and future. Cell Death Dis. 2020, 11, 88. [Google Scholar] [CrossRef]
  33. Zhang, W.; Liu, Y.; Liao, Y.; Zhu, C.; Zou, Z. GPX4, ferroptosis, and diseases. Biomed. Pharmacother. 2024, 174, 116512. [Google Scholar] [CrossRef]
  34. Roeck, B.F.; Nasudivar, S.L.; Vorndran, M.R.H.; Schueller, L.; Yapici, F.I.; Rübsam, M.; von Karstedt, S.; Niessen, C.M.; Garcia-Saez, A.J. Ferroptosis spreads to neighboring cells via plasma membrane contacts. Nat. Commun. 2025, 16, 2951. [Google Scholar] [CrossRef]
  35. Su, L.J.; Zhang, J.H.; Gomez, H.; Murugan, R.; Hong, X.; Xu, D.; Jiang, F.; Peng, Z.Y. Reactive Oxygen Species-Induced Lipid Peroxidation in Apoptosis, Autophagy, and Ferroptosis. Oxid. Med. Cell. Longev. 2019, 2019, 5080843. [Google Scholar] [CrossRef] [PubMed]
  36. Jiao, T.; Chen, Y.; Sun, H.; Yang, L. Targeting ferroptosis as a potential prevention and treatment strategy for aging-related diseases. Pharmacol. Res. 2024, 208, 107370. [Google Scholar] [CrossRef] [PubMed]
  37. Wang, B.; Wang, Y.; Zhang, J.; Hu, C.; Jiang, J.; Li, Y.; Peng, Z. ROS-induced lipid peroxidation modulates cell death outcome: Mechanisms behind apoptosis, autophagy, and ferroptosis. Arch. Toxicol. 2023, 97, 1439–1451. [Google Scholar] [CrossRef] [PubMed]
  38. Yao, L.; Zhao, M.M.; Luo, Q.W.; Zhang, Y.C.; Liu, T.T.; Yang, Z.; Liao, M.; Tu, P.; Zeng, K.W. Carbon Quantum Dots-Based Nanozyme from Coffee Induces Cancer Cell Ferroptosis to Activate Antitumor Immunity. ACS Nano 2022, 16, 9228–9239. [Google Scholar] [CrossRef]
  39. Zhang, X.; Zhang, Y.; Lv, X.; Zhang, P.; Xiao, C.; Chen, X. DNA-Free Guanosine-Based Polymer Nanoreactors with Multienzyme Activities for Ferroptosis-Apoptosis Combined Antitumor Therapy. ACS Nano 2024, 18, 3531–33544. [Google Scholar] [CrossRef]
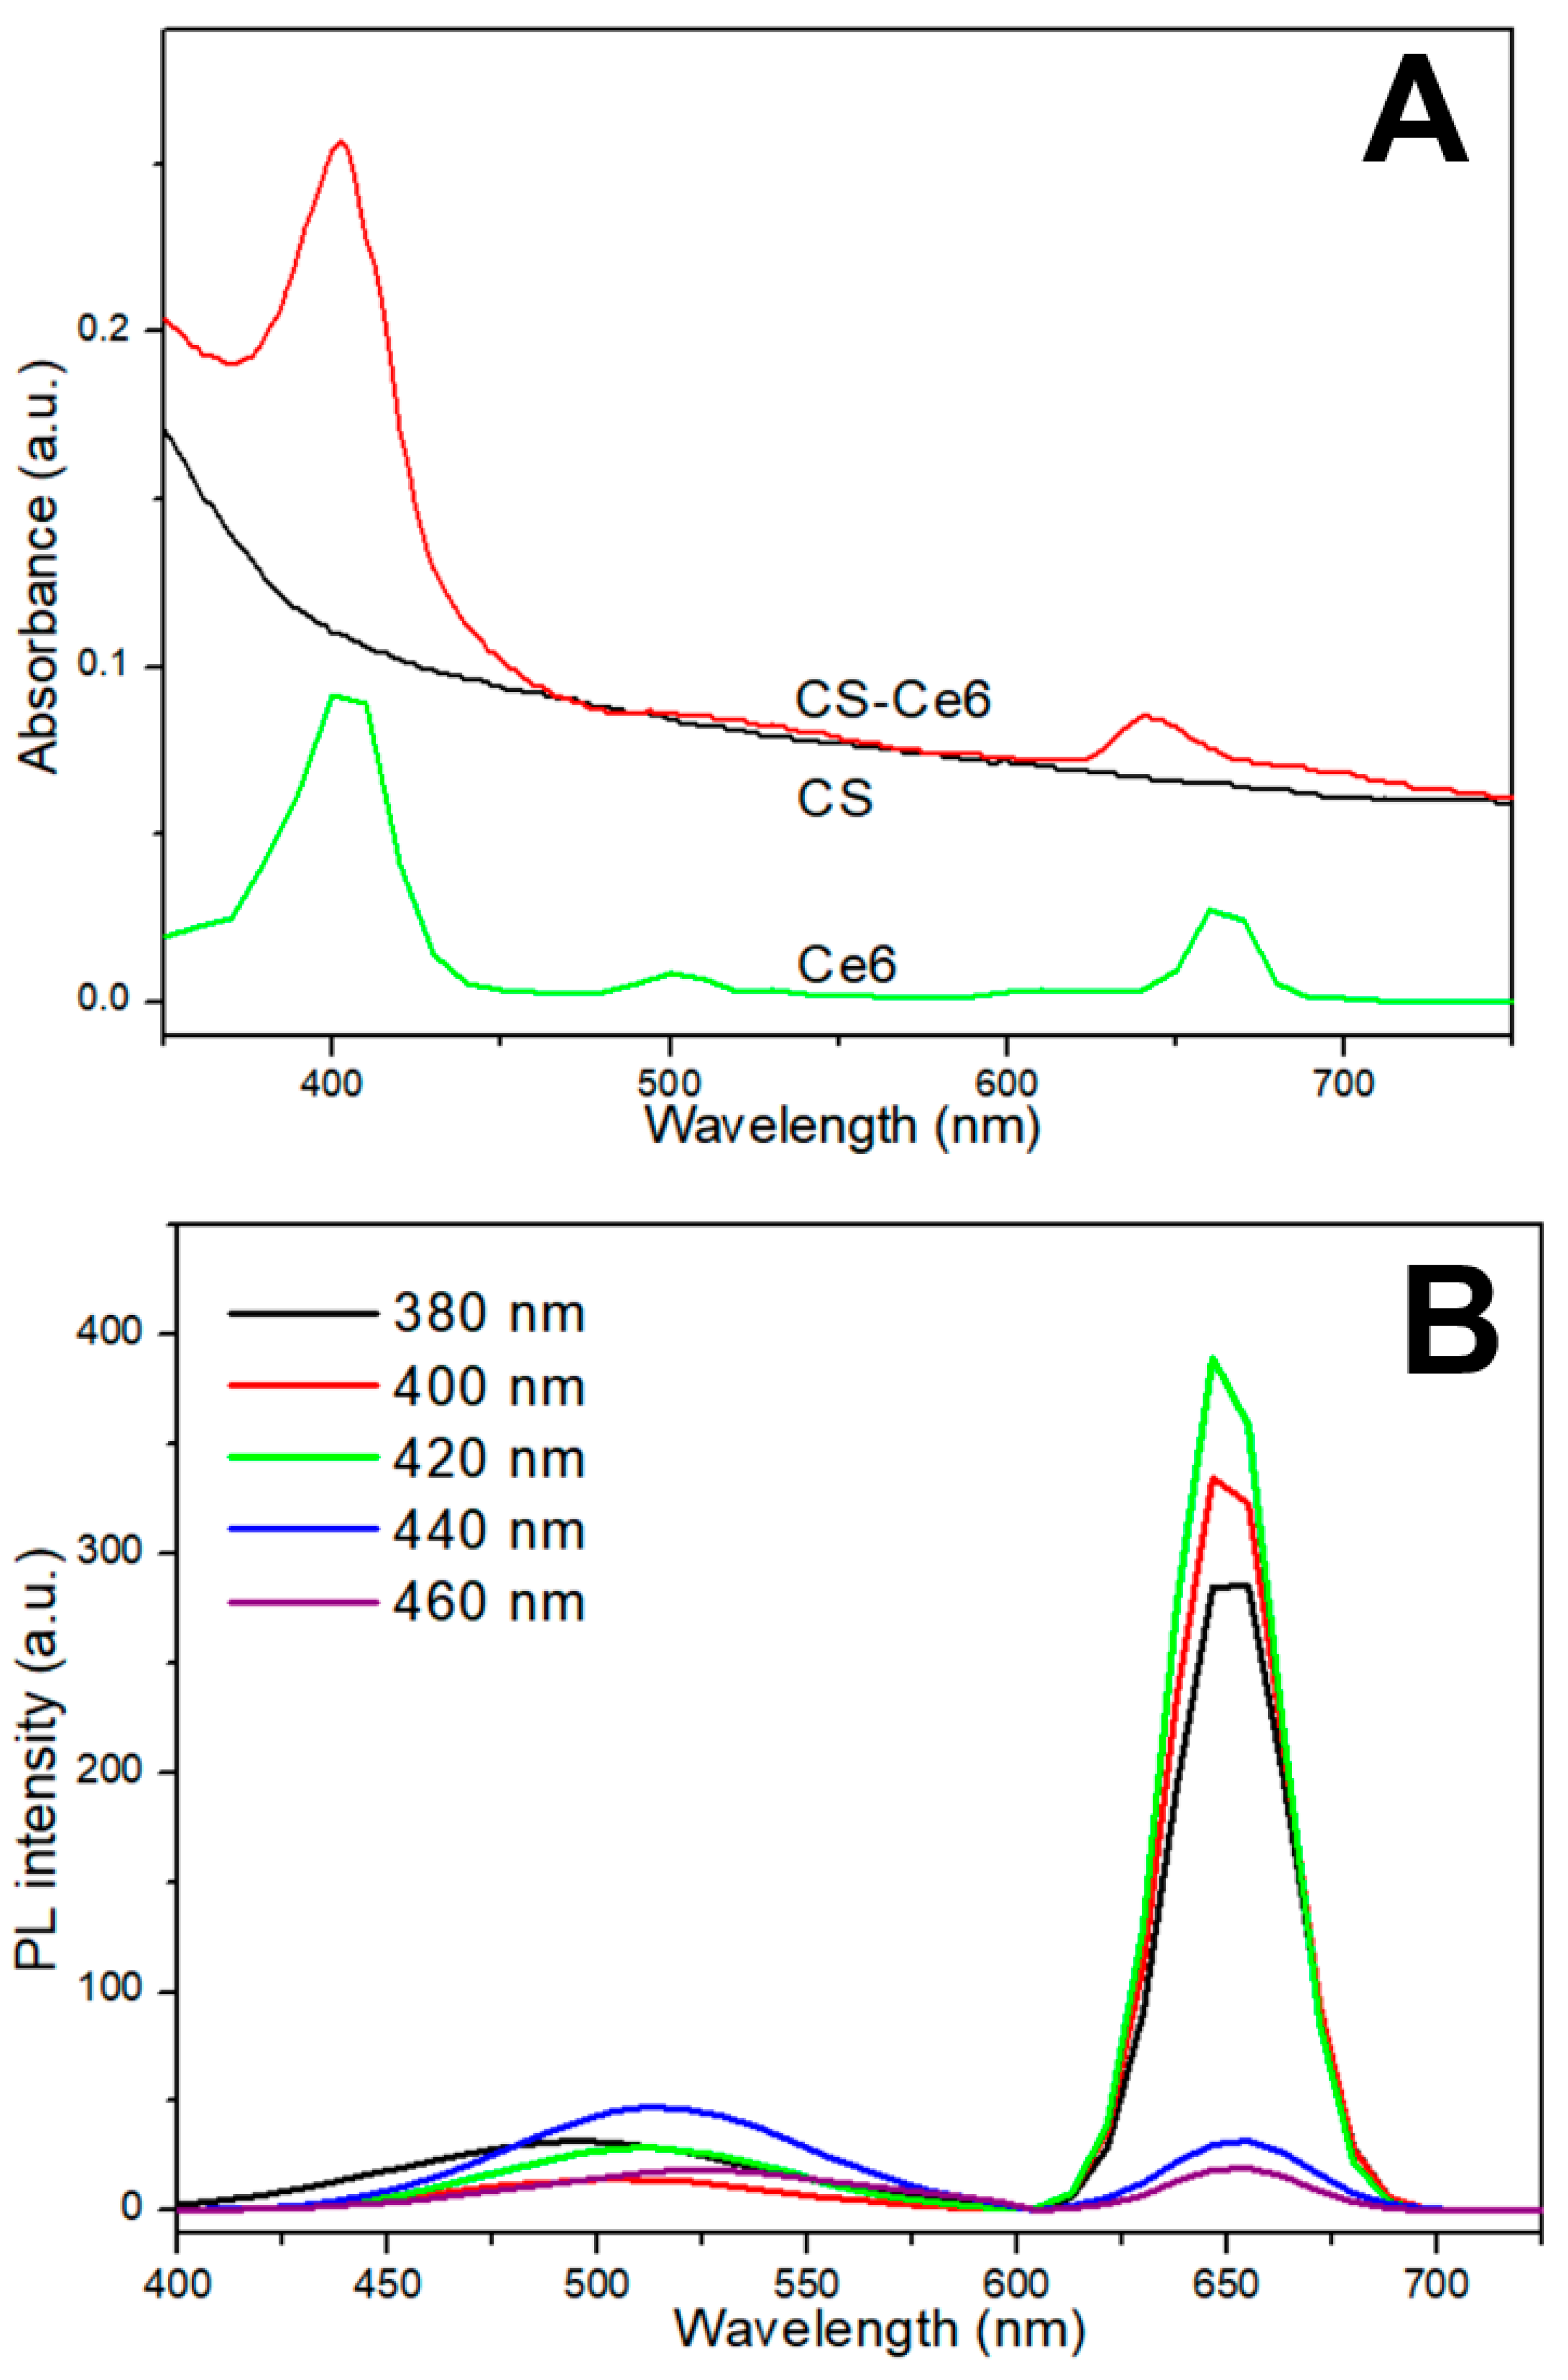
Figure 1. (A) Light absorbance of carbon dots (CDs) and fluorescence spectrum of CS-Ce6 at different excitation wavelengths; (B) Emitted photoluminescence (PL) from CS-Ce6 by different excitation lights.
Applsci 15 10446 g001
Figure 2. Absorbance of the 3,3′,5,5′-tetramethylbenzidine (TMB) assay solution upon light irradiation at different time points.
Applsci 15 10446 g002
Figure 3. Absorbance of the nitroblue tetrazolium (NBT) assay solution upon light irradiation at different time points (Figure 3 inset) and the changes in peak intensity during laser irradiation. As the light irradiation time increased, the peak absorbance increased within seconds.
Applsci 15 10446 g003
Figure 4. Result of p-nitrosodimethylaniline-imidazole (RNO-ID) assay (A). For CS-Ce6, the absorbance decreased significantly during the first 5 min of irradiation and then somewhat linearly decreased as the irradiation time increased, whereas CS exhibited minor change in the absorption intensity despite laser irradiation (B).
Applsci 15 10446 g004
Figure 5. Absorbance of the glutathione assay solution. (A) The initial absorption spectrum shows a significant decrease in the peak intensity near 410 nm after 5 min of light irradiation; (B) However, after the termination of light irradiation, the decrease in peak intensity slowed with time.
Applsci 15 10446 g005
Figure 6. Cell viability of normal (human embryonic kidney cell; HEK293) and oral cancer (human tongue squamous carcinoma cell; HSC3) cells at different concentrations of CDs. CS-Ce6 damaged about 20% of normal cells at a concentration of 400 ppm (A), while achieving approximately 70% cancer cell death at a concentration of 150 ppm under laser irradiation conditions. Ferrostatin-1 (Fer-1) inhibits ferroptosis, and cell viability increases after co-treatment with Fer-1 (B).
Applsci 15 10446 g006
Figure 7. Optical microscope images of the treated HSC3. After treatment of CS-Ce6 with laser, there are no visible live cells except dead cells. However, when the cells are co-treated with Fer-1, both live and dead cells are visible.
Applsci 15 10446 g007
Figure 8. Confocal microscope images of the cells after live/dead assay using calcein-AM/propidium iodide (PI) staining. Cells treated with CS-Ce6 and laser irradiation show red fluorescent spots owing to PI staining, indicating the death of the treated cells.
Applsci 15 10446 g008
Figure 9. Intracellular lipid peroxidation (LPO) accumulation in HSC3 cells. Produced ROS oxidize C11-BODIPY581/591, which emit green fluorescence, indicating LPO accumulation and cell death through ferroptosis.
Applsci 15 10446 g009
Disclaimer/Publisher’s Note: The statements, opinions and data contained in all publications are solely those of the individual author(s) and contributor(s) and not of MDPI and/or the editor(s). MDPI and/or the editor(s) disclaim responsibility for any injury to people or property resulting from any ideas, methods, instructions or products referred to in the content.