1. Introduction
Automotive exhaust manifolds operate under harsh thermo-mechanical conditions, including elevated temperatures, cyclic internal pressure, and dynamic loading from engine vibrations. These combined effects generate significant thermal stresses and strains, which may initiate fatigue cracks and ultimately compromise the structural integrity of the component. Improving manifold durability is therefore critical for ensuring engine reliability, reducing maintenance costs, and meeting increasingly strict emission regulations.
A large body of research has been dedicated to the structural assessment of exhaust manifolds under combined thermo-mechanical loading using numerical simulations.
FEM-based approaches: Ashouri [
1] investigated low-cycle fatigue in coated manifolds using elastoviscoplastic modeling, while Liu et al. [
2] analyzed crack propagation in ductile cast iron manifolds under thermo-mechanical fatigue using the Sehitoglu damage model. Barbieri et al. [
3] highlighted the influence of thermal mean stress and vibration fatigue on motorcycle exhaust systems. Further FEM studies have focused on improving the performance of exhaust systems through design optimization and material selection under thermal loads (Liu et al. [
4]), as well as the development of simulation programs to predict crack growth under service conditions (Lee et al. [
5]). Sasikumar et al. [
6] performed fatigue life estimations of mounting brackets with the FEM and validated them experimentally, while Ahmad et al. [
7] conducted a thermo-mechanical analysis of austenitic stainless-steel manifolds (AISI 321) to assess stress responses and modal characteristics.
Energy-based fracture mechanics: The J-integral is widely recognized as a robust, path-independent measure of the energy release rate, suitable for elastic–plastic conditions. It has been successfully applied to characterize crack driving forces under mixed-mode and nonlinear loading, with several studies demonstrating its relevance for gas turbine and automotive components (Rui F. Martins et al. [
8]; Cebula et al. [
9]; Yi et al. [
10]; Salehnejad et al. [
11]).
XFEM for crack propagation: Recent advancements have focused on the Extended Finite Element Method (XFEM) for modeling crack growth without remeshing. Xiong et al. [
12] simulated fatigue crack growth under coupled thermal and mechanical loads, while Bergara et al. [
13] validated the XFEM predictions against experimental data under multiaxial stress fields. Sun et al. [
14] and Sedmak et al. [
15] further confirmed the XFEM’s robustness for modeling evolving discontinuities and fatigue crack propagation in welded joints and heterogeneous materials.
Collectively, these studies confirm that the FEM is effective for identifying critical stress zones, and the XFEM provides a powerful tool for simulating crack propagation in complex, thermo-mechanically loaded structures.
Despite significant progress, several gaps remain in the literature. Most studies treat the identification of critical zones and the modeling of crack propagation as separate steps, without integrating them into a unified workflow. In addition, realistic thermo-mechanical loading conditions, including combined cyclic pressure and temperature variations, are often simplified, potentially limiting the accuracy of fatigue life predictions. Finally, the use of fracture parameters such as the J-integral is not always systematically linked to fatigue assessment, leaving an opportunity to establish a more comprehensive durability prediction methodology.
The present work aims to address these gaps by developing a unified FEM–XFEM framework for damage assessment and fatigue life prediction for an automotive exhaust manifold. In the first stage, a hybrid meshing strategy is employed and the classical FEM is used to evaluate stress and strain distributions, extract Von Mises stress maps, and identify the most critical regions for crack initiation. In the second stage, the XFEM combined with the J-integral is used to model crack propagation from a semi-elliptical defect introduced in the critical zone, eliminating the need for remeshing and ensuring numerical stability.
Finally, fatigue life is predicted using the Smith–Watson–Topper (SWT) strain–life approach, accounting for mean stress effects and cyclic plasticity. Two loading scenarios (quasi-pulsating and fully reversed) are evaluated to ensure a conservative durability assessment. This unified FEM–XFEM framework provides a robust methodology for identifying critical zones and simulating crack growth, supporting design optimization and improved reliability under severe thermo-mechanical loading.
2. Methodology
A robust numerical analysis requires a thorough understanding of the physical problem under investigation. This foundational knowledge is essential for selecting appropriate element types and modeling strategies capable of accurately capturing the system’s geometry, material behavior, and boundary interactions. The central objective of this research is to construct a detailed and reliable simulation model of the exhaust manifold that enables both structural analysis and fracture mechanics evaluation under thermo-mechanical loading.
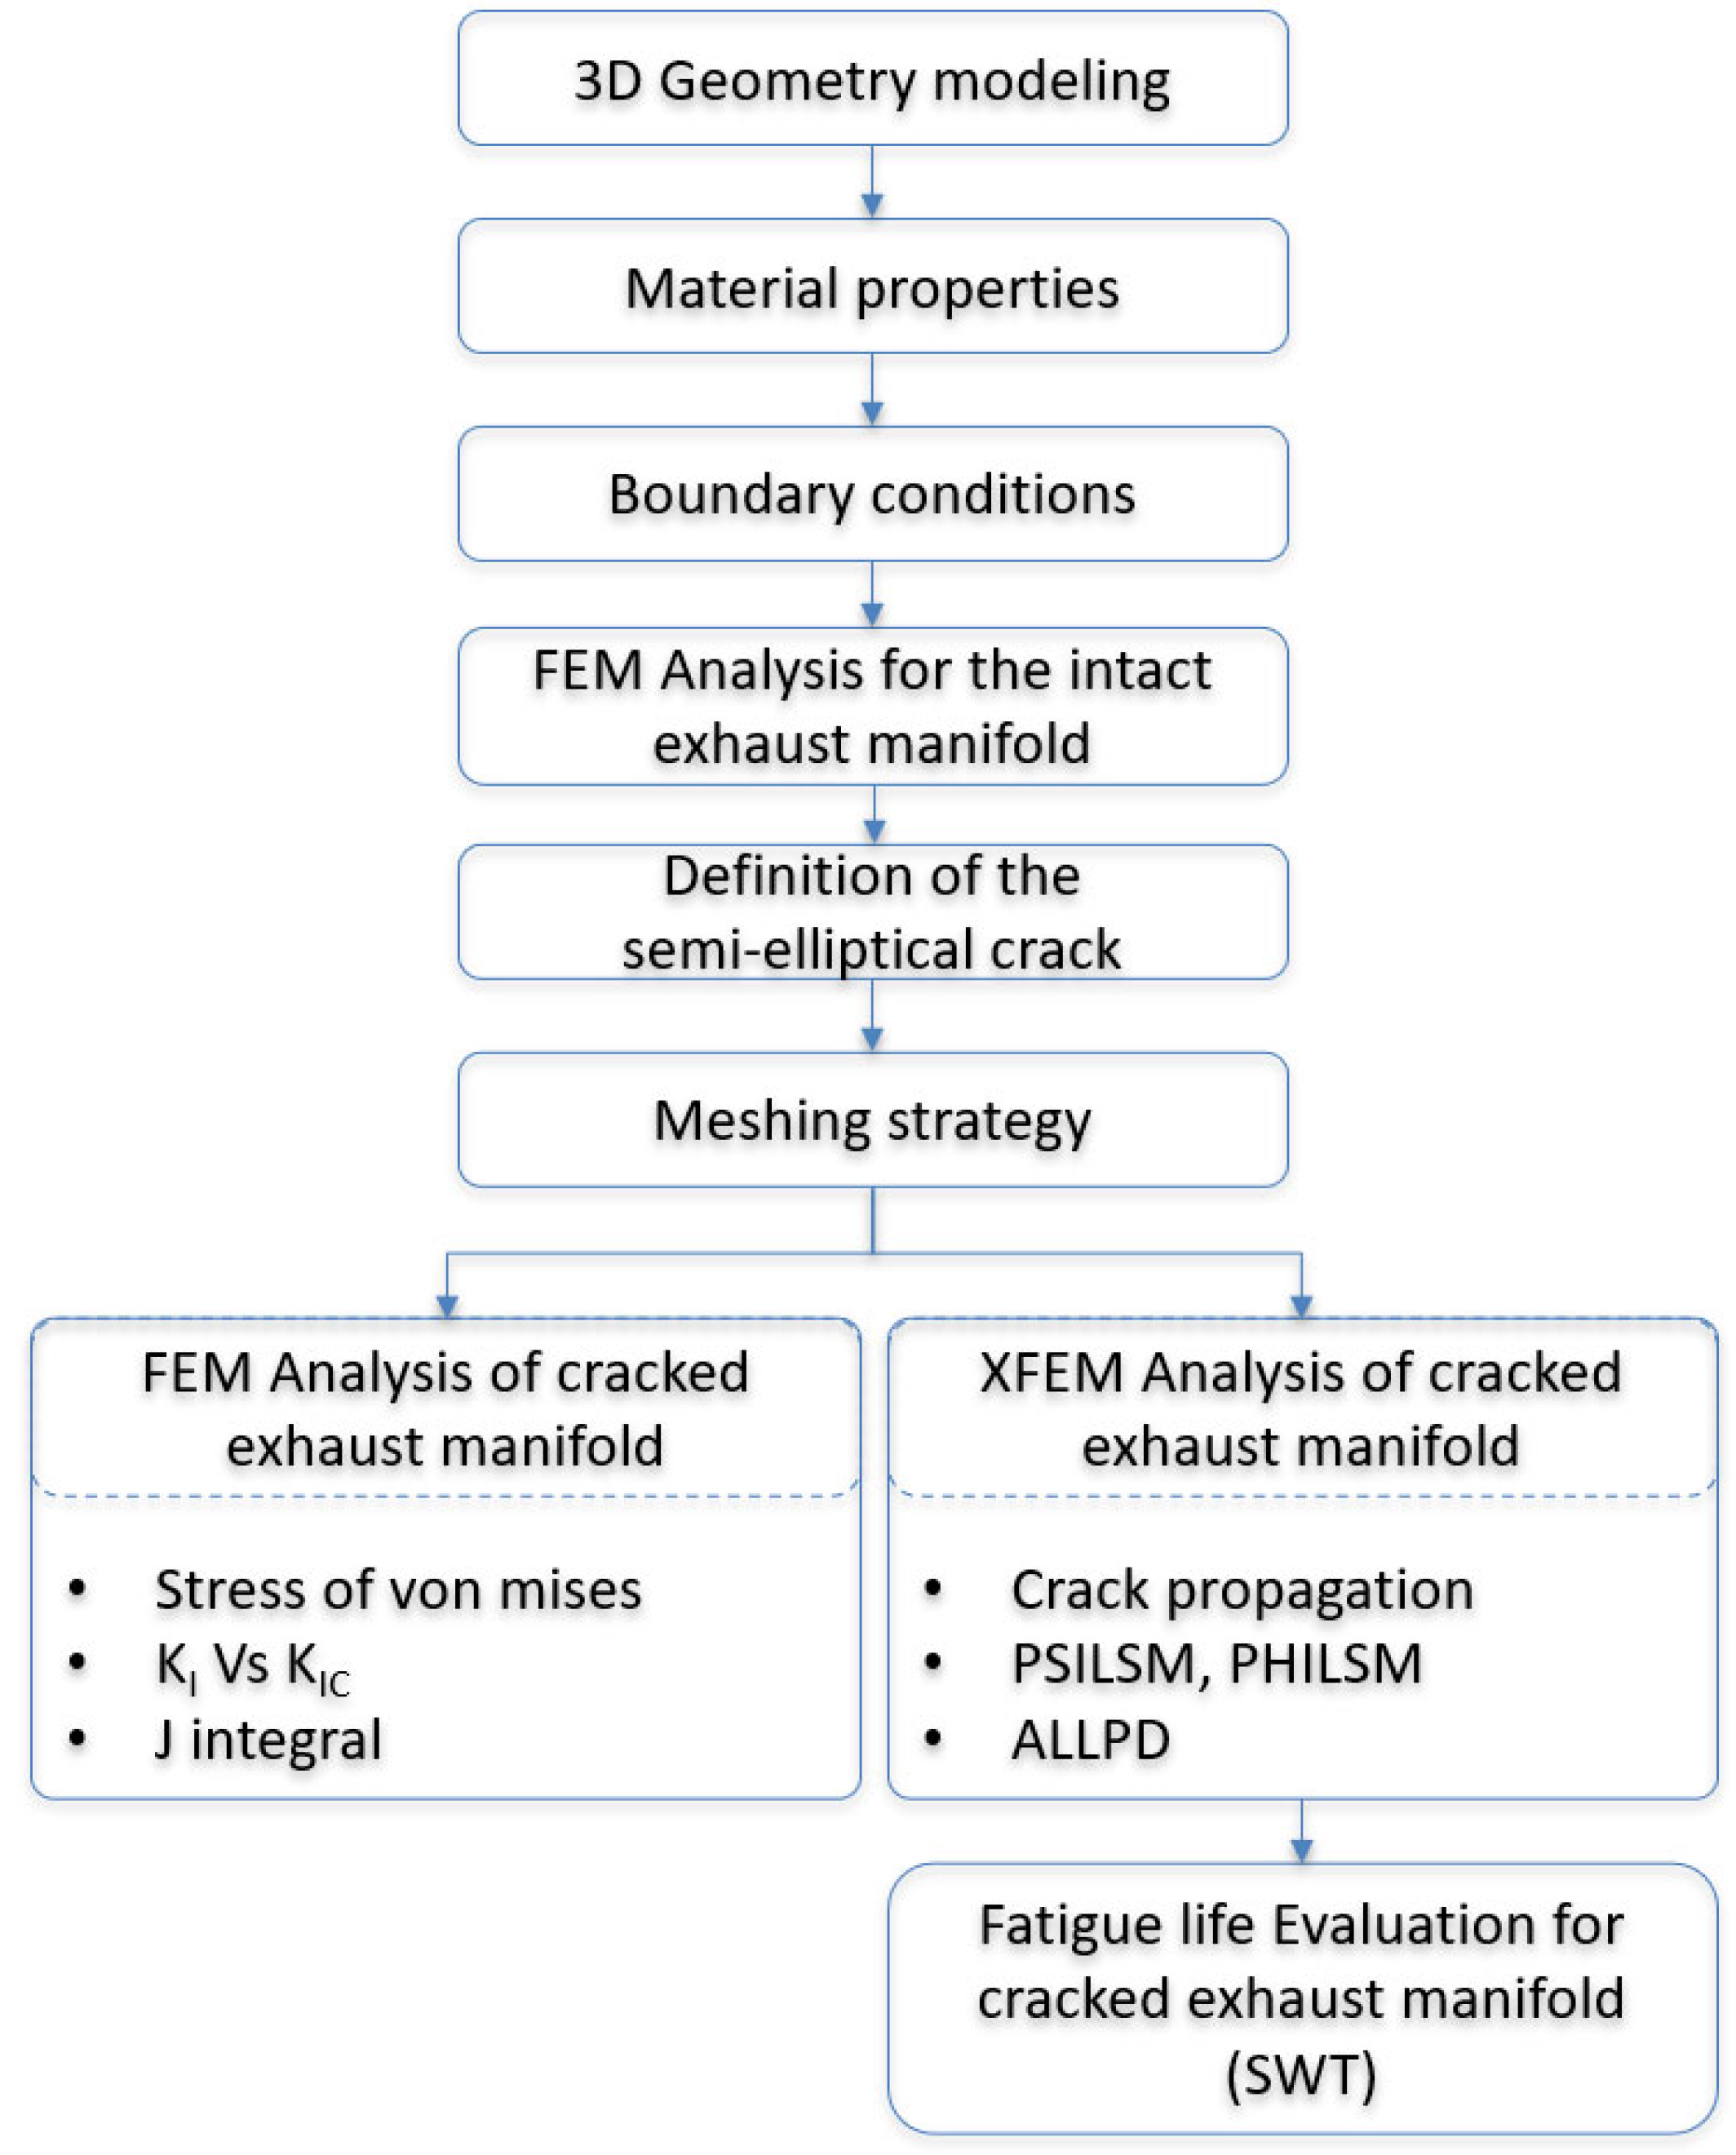
The main steps for analyzing the structural behavior of the exhaust manifold under thermo-mechanical loading are summarized in the flowchart presented in
Figure 1.
The methodology is organized into two complementary phases involving classical FEM and XFEM approaches. First, the geometry of the manifold is designed using CATIA V5 R21 software, followed by a refined mesh generation process, particularly in the vicinity of the potential crack region. Material properties are defined as temperature-dependent and nonlinear, accounting for elastoplastic behavior.
Boundary conditions include internal pressure and thermal loads, which are applied by the engine’s operating cycles. A semi-elliptical surface crack is then introduced in the most critical zone identified from normal stress distributions. Two separate analyses are performed:
FEM crack analysis is used to evaluate stress and strain fields and the Von Mises distribution, and to compute the stress intensity factors (SIFs) for Mode I.
The XFEM-based crack analysis enables the simulation of crack propagation without the need for remeshing, offering significant advantages for components with complex geometries. Fracture parameters such as the J-integral and accumulated plastic dissipation (ALLPD) are computed based on enriched element formulations. The Maximum Principal Stress Criterion is also applied to evaluate the conditions under which crack initiation is likely to occur. Furthermore, several post-processing indicators, including PHILSM and PSILSM, are extracted to monitor crack evolution and assess local damage. Finally, fatigue life is predicted using the Smith–Watson–Topper (SWT) parameter, which accounts for mean stress effects and cyclic plasticity. The local elastic–plastic strain amplitude is computed using the cyclic Ramberg–Osgood relation, and two loading cases (quasi-pulsating R ≈ 0 and fully reversed R = −1) are considered to provide a conservative durability assessment.
3. Mathematical Modeling
In the case of the automotive exhaust manifold, the temperature distribution is governed by Fourier’s law of heat conduction, which relates the heat flux vector
q to the temperature gradient ∇
T [
16]:
where k is the temperature-dependent thermal conductivity of the manifold material.
By combining Fourier’s law with the principle of energy conservation, the governing equation of steady-state heat conduction is obtained [
17]:
where
Q denotes the internal heat generation per unit volume.
This equation was solved using the finite element method in Abaqus to determine the temperature distribution within the manifold walls under the applied boundary conditions.
The computed temperature field was then coupled with the mechanical model through the thermal strain term,
[
18], where
is the coefficient of thermal expansion. This ensures a fully coupled thermo-mechanical framework for fatigue life assessment of the exhaust manifold.
The structural and fatigue behavior of the exhaust manifold is analyzed using a coupled numerical framework that integrates classical FEM, XFEM, and fracture mechanics models. This section outlines the mathematical formulations underpinning the simulation workflow.
In structural mechanics, the weak (variational) form of the equilibrium equation is written as follows [
19]:
where
: The domain of the structure.
The components of the Cauchy stress.
The components of the strain.
: The displacement components.
: The body force vector.
: Prescribed tractions on the boundary .
: Virtual displacements (test functions).
This equation is then discretized using shape functions
over finite elements, leading to the global matrix system [
19]:
where
[K]: The global stiffness matrix.
[U]: The nodal displacement vector.
[F]: The external force vector.
In fracture analysis using the FEM, the J-integral is commonly employed to evaluate the energy release rate at the crack tip. It can also be used to estimate the corresponding stress intensity factor, providing critical information for crack growth prediction.
To model crack discontinuities without remeshing, the displacement field is enriched using the XFEM as follows [
20]:
where
Sets of all nodes, nodes intersected by the crack, and crack-tip nodes, respectively;
: Heaviside step function, defined as
where Γ represents the geometry of the crack and x is a point in the domain.
These enrichment terms enable the numerical model to reproduce the stress singularity and discontinuity induced by the crack, without altering the mesh.
The fracture driving force was evaluated using the energy release rate via the J-integral, computed in Abaqus using the domain integral method [
21]:
where
This criterion determines whether the crack propagates under a given thermo-mechanical load.
The Smith–Watson–Topper (SWT) model further enhances fatigue life prediction by integrating both maximum stress (
σmax) and strain amplitude (
εa) into a unified damage parameter. This model is particularly useful for capturing the interaction between strain-based and stress-based failure modes in exhaust manifolds, which experience both thermal cycling and vibrational stresses as follows [
22]:
where
σmax: Maximum stress (σmax = εe + εp).
: Fatigue strength coefficient (MPa), representing the stress level at failure after one reversal (i.e., 2Nf = 1) in a purely elastic case.
: Fatigue ductility coefficient.
b: Fatigue strength exponent.
c: Fatigue ductility exponent.
In the SWT model, the product of the maximum stress and the strain amplitude is used to account for mean stress effects. The model assumes that, for a given fatigue life, the parameter
remains constant despite variations in maximum stress and strain amplitude. This damage parameter was initially introduced to describe crack propagation behavior and has proven particularly effective for predicting fatigue in gray cast iron [
23].
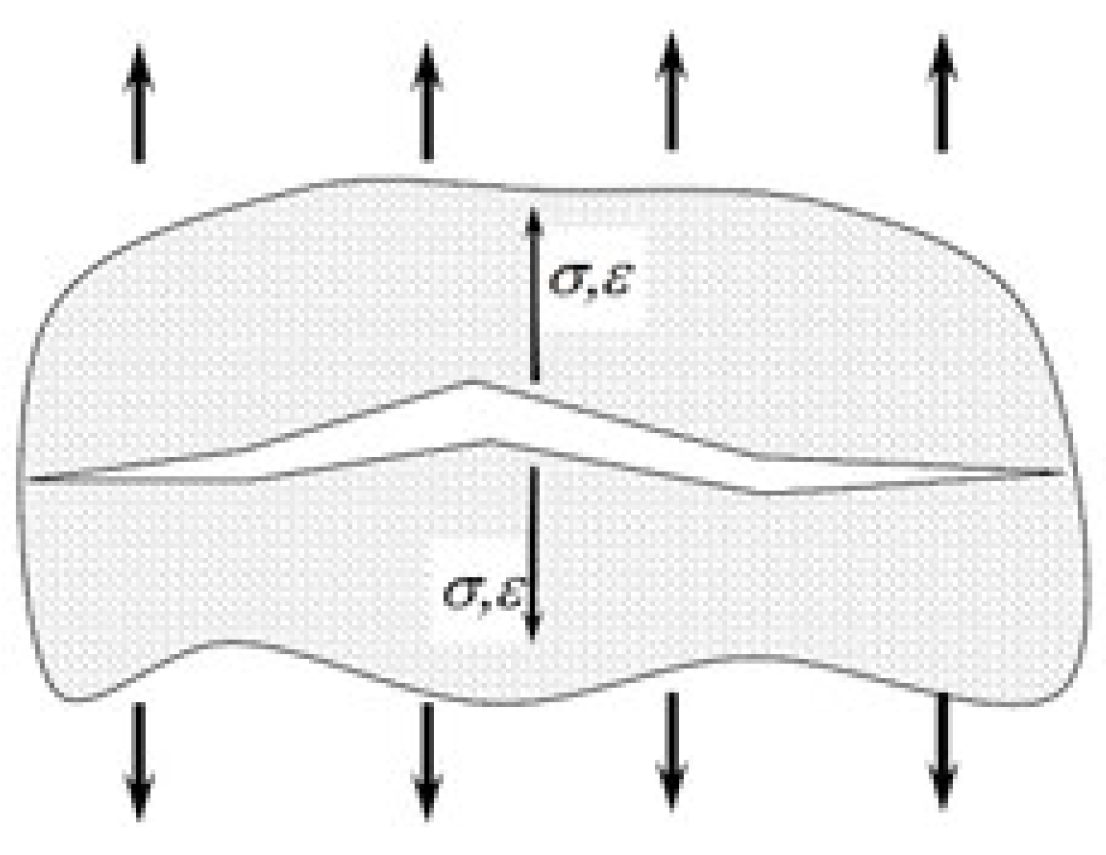
The graphical interpretation of the Smith–Watson–Topper (SWT) parameter is shown in
Figure 2, where the fatigue damage is defined as the product of the maximum normal stress and the strain amplitude on the critical plane. This visual representation highlights the coupling between stress and strain fields under uniaxial cyclic loading with non-zero mean stress.
4. Exhaust Manifold Analysis
The geometry of the exhaust manifold used in this study was designed specifically to support structural analysis under combined thermal and mechanical loading conditions. Modeled in CATIA, the manifold features a tubular configuration with smooth, curved runners that converge into a common collector, representing a typical architecture found in performance-grade stainless steel systems. This design was chosen to reflect realistic constraints encountered in automotive applications, particularly in terms of material distribution, wall thickness, and flange integration. The manifold geometry was prepared to accommodate the application of both mechanical and thermal boundary conditions, including fixed support zones at the mounting flanges and internal surfaces suitable for applying a cyclic pressure load. Additionally, the model supports the definition of crack placement zones aligned with areas of maximum stress concentration under thermo-mechanical fatigue. Its topology allows for mesh refinement around potential fracture paths and stress singularities, which is essential for high-fidelity FEM and XFEM simulations. The model was also structured to replicate the conditions necessary for the application of predefined temperature fields, pressure cycling, and constraint interactions.
4.1. Exhaust Manifold Design
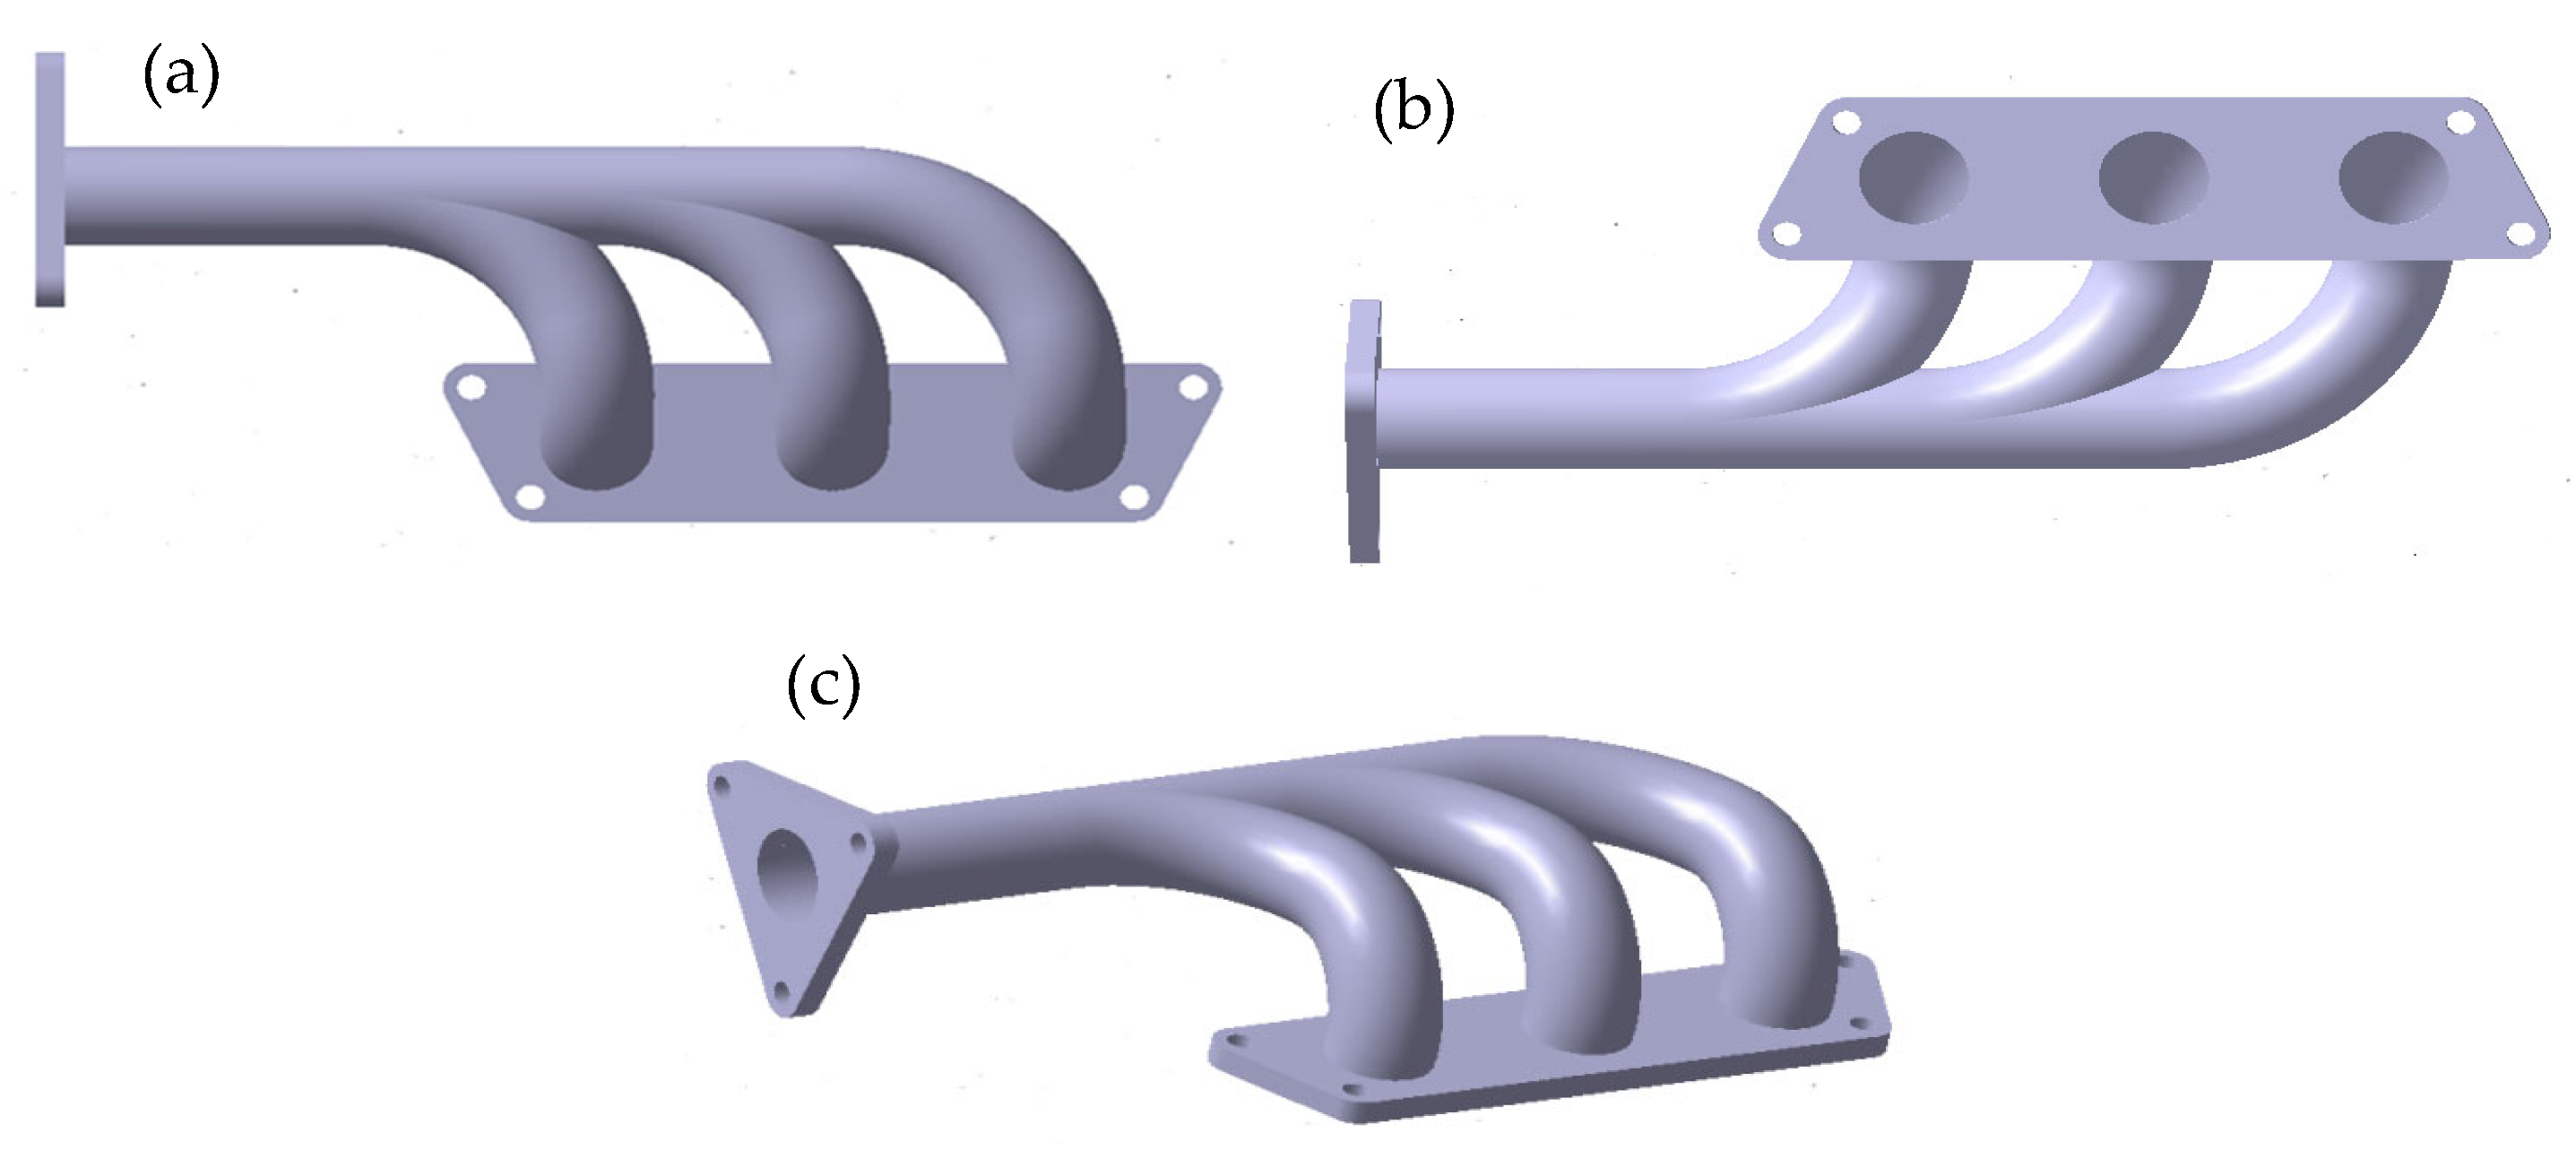
The three manifold views shown in
Figure 3 (top, bottom, and isometric) provide a comprehensive spatial reference for identifying critical regions and understanding the interactions between geometry, loading conditions, and failure behavior throughout the simulation process.
Additionally, the wall thickness of the exhaust manifold was set to 1 mm, as is commonly adopted in thin-walled exhaust system designs. This choice is consistent with several studies in the literature [
25,
26] that have used 1 mm metal sheets in exhaust manifolds to optimize thermal resistance, structural integrity, and weight.
4.2. Thermo-Mechanical Material Behavior and Damage Modeling
To ensure the accuracy of structural simulations under thermo-mechanical loading, the material behavior of the exhaust manifold was defined using temperature-dependent properties that reflect the physical degradation mechanisms observed during service. The selected material is Austenitic Stainless Steel 321, a titanium-stabilized stainless steel widely used in high-temperature automotive components, particularly exhaust systems.
Austenitic Stainless Steel 321 is known for its excellent oxidation resistance, good fatigue and creep strength, and ability to maintain mechanical integrity up to approximately 900 °C. Its widespread application in exhaust manifolds is well-documented in the literature, particularly in the works of Manohar & Krishnaraj [
27], who demonstrated that this alloy outperforms cast iron and mild steel under thermal cycling due to its ductility and resistance to intergranular corrosion.
In the context of finite element modeling, the material was defined as homogeneous and isotropic, a valid and commonly adopted assumption for austenitic stainless steels in numerous applications. This isotropic behavior implies that the material’s mechanical and thermal properties are the same in all directions, a simplification that facilitates computation while remaining sufficiently accurate for stress analysis in components where the microstructure is not directionally aligned.
The simulations were conducted within the temperature-dependent elastoplastic domain as mentioned in
Table 1, which enables the representation of both the reversible elastic behavior and irreversible plastic deformation of the material under thermo-mechanical loading. This framework is particularly suitable for exhaust manifolds subjected to high thermal gradients and cyclic mechanical loads, where stress levels exceed the yield limit, causing plastic strain accumulation and material softening in critical zones such as crack tips and mounting areas.
Temperature-dependent properties were implemented for the following:
Elastic behavior (Young’s modulus, Poisson’s ratio):
Plastic yield (yield stress, plastic strain):
To accurately capture the mechanical behavior of the manifold material under thermo-mechanical loading, temperature-dependent plastic yield behavior is implemented in the simulation. As shown in
Table 2, the yield stress decreases significantly with increasing temperature, while the corresponding plastic strain increases, illustrating the material’s reduced load-bearing capacity under elevated thermal conditions.
As illustrated in
Table 3, thermal conductivity significantly decreases with rising temperature, a trend commonly observed in ferrous materials, cast iron, and stainless steel. This reduction in conductivity affects the manifold’s ability to dissipate heat, which could result in localized overheating and the concentration of thermal stress.
Conversely,
Table 4 illustrates the specific heat capacity (
Cp), which shows a marked increase with temperature. This trend indicates that the material has a greater capacity to absorb heat without experiencing a rapid temperature rise. This property is particularly significant in the context of cyclic thermal loading, as it affects the component’s response to heat pulses and its subsequent cooling over time.
The thermal properties emphasize the importance of thermo-mechanical coupling in simulation and support the identification of fatigue-prone zones. In particular, the coefficient of thermal expansion (α = 1.12 × 10
−5 K
−1) [
28] governs the thermally induced strains
, which directly contribute to stress development under the cyclic heating and cooling of the manifold. The density of the material (7.77 × 10
−6 kg/mm
3) is critical for evaluating thermal inertia and dynamic loading under vibratory conditions, although it does not directly affect the steady-state conduction analysis.
The boundary conditions and thermal property trends used in this study were drawn from the reference benchmark of Rombo Oskar [
28].
Damage initiation and fracture energy via the Max Principal Stress Criterion and Benzeggagh–Kenane (BK) energy-based formulation.
To evaluate fracture behavior, damage initiation and propagation were modeled using two complementary formulations:
The Max Principal Stress Criterion was used to detect the onset of crack initiation, which is particularly suitable for brittle failure mechanisms.
Crack propagation was governed by the Benzeggagh–Kenane (BK) energy-based law [
29], which distinguishes between fracture modes I, II, and III based on directional energy contributions.
As shown in
Table 5 fracture energy values were assigned as follows:
- ○
GI = 40 N/mm for normal opening (Mode I).
- ○
GII = 30 N/mm for in-plane shearing (Mode II).
- ○
GIII = 30 N/mm for out-of-plane shearing (Mode III).
Table 5.
Fracture energy parameters (BK model).
Table 5.
Fracture energy parameters (BK model).
| Mode | Fracture Energy (N/mm) |
|---|
| Mode I (Normal Opening) | 40 |
| Mode II (Shear—1st Direction) | 30 |
| Mode III (Shear—2nd Direction) | 30 |
The BK formulation introduces a mode-mixity parameter
(typically 1.2–1.6) [
30] that governs the contribution of shear to fracture energy dissipation. This is particularly useful for simulating real-world crack trajectories that deviate from pure Mode I.
4.3. Boundary Conditions and Loading
4.3.1. Pressure Boundary Condition
To accurately simulate the dynamic behavior of the exhaust manifold under engine operating conditions, a time-dependent tabular pressure load was applied to the internal surface of the manifold as illustrated in
Figure 4. This pressure profile alternates between positive and negative phases, simulating combustion pulses and exhaust backflow over time. The pressure amplitude was set to ±2 MPa [
31], based on values observed in high-performance engines.
Such cyclic loading effectively represents the thermo-mechanical fatigue effects induced by pressure pulsations, enabling a more realistic prediction of stress and crack propagation behavior in exhaust manifolds. This shows the evolution of internal pressure over time, as used in the FEM and XFEM simulations.
4.3.2. Temperature Boundary Condition
To simulate the thermal effects experienced by the exhaust manifold under real engine conditions, a stepwise, predefined temperature field was applied to the internal surface of the component. This distribution reflects the typical thermal gradient generated by the flow of hot exhaust gases from the engine toward the outlet.
The temperature was assigned in three distinct zones [
1]:
Three inlets zone (adjacent to the engine flange): T = 800 °C
Middle section: T = 700 °C
Outlet zone (tail pipe): T = 600 °C
This spatial temperature variation captures the progressive heat dissipation along the manifold, inducing realistic thermal gradients that significantly influence the development of thermal stress and fatigue behavior. Applying such zonal thermal loading enhances the accuracy of the numerical analysis, particularly for predicting hot-spot regions and assessing potential areas of material degradation.
This modeling approach is consistent with methodologies reported in the literature, such as those presented by Ashouri [
1], where similar predefined thermal fields were used to evaluate low-cycle fatigue life in coated and uncoated exhaust manifolds.
4.3.3. Mechanical Boundary Condition
To accurately represent the physical constraints of the exhaust manifold in real engine conditions, fixed boundary conditions were applied at the mounting flange regions [
32], simulating the rigid attachment of the component to the engine block via bolted connections. All translational degrees of freedom (Ux, Uy, and Uz) were restricted on the inner faces of the mounting lugs, thereby preventing displacement and enabling a realistic transfer of both thermal and pressure-induced stresses throughout the structure.
These fully clamped boundary conditions reflect the high mechanical stiffness of bolted steel interfaces, which play a critical role in anchoring the manifold under engine-induced vibrations. This constraint setup not only stabilizes the simulation but also mirrors the physical interactions observed in operational environments.
The combined definition of mechanical and thermal boundary conditions was essential for accurately capturing the coupled stress fields responsible for fatigue and crack initiation in the manifold. This setup serves as the foundation for the FEM and XFEM analyses presented in the following sections.
4.4. Meshing Strategy and Element Type Selection
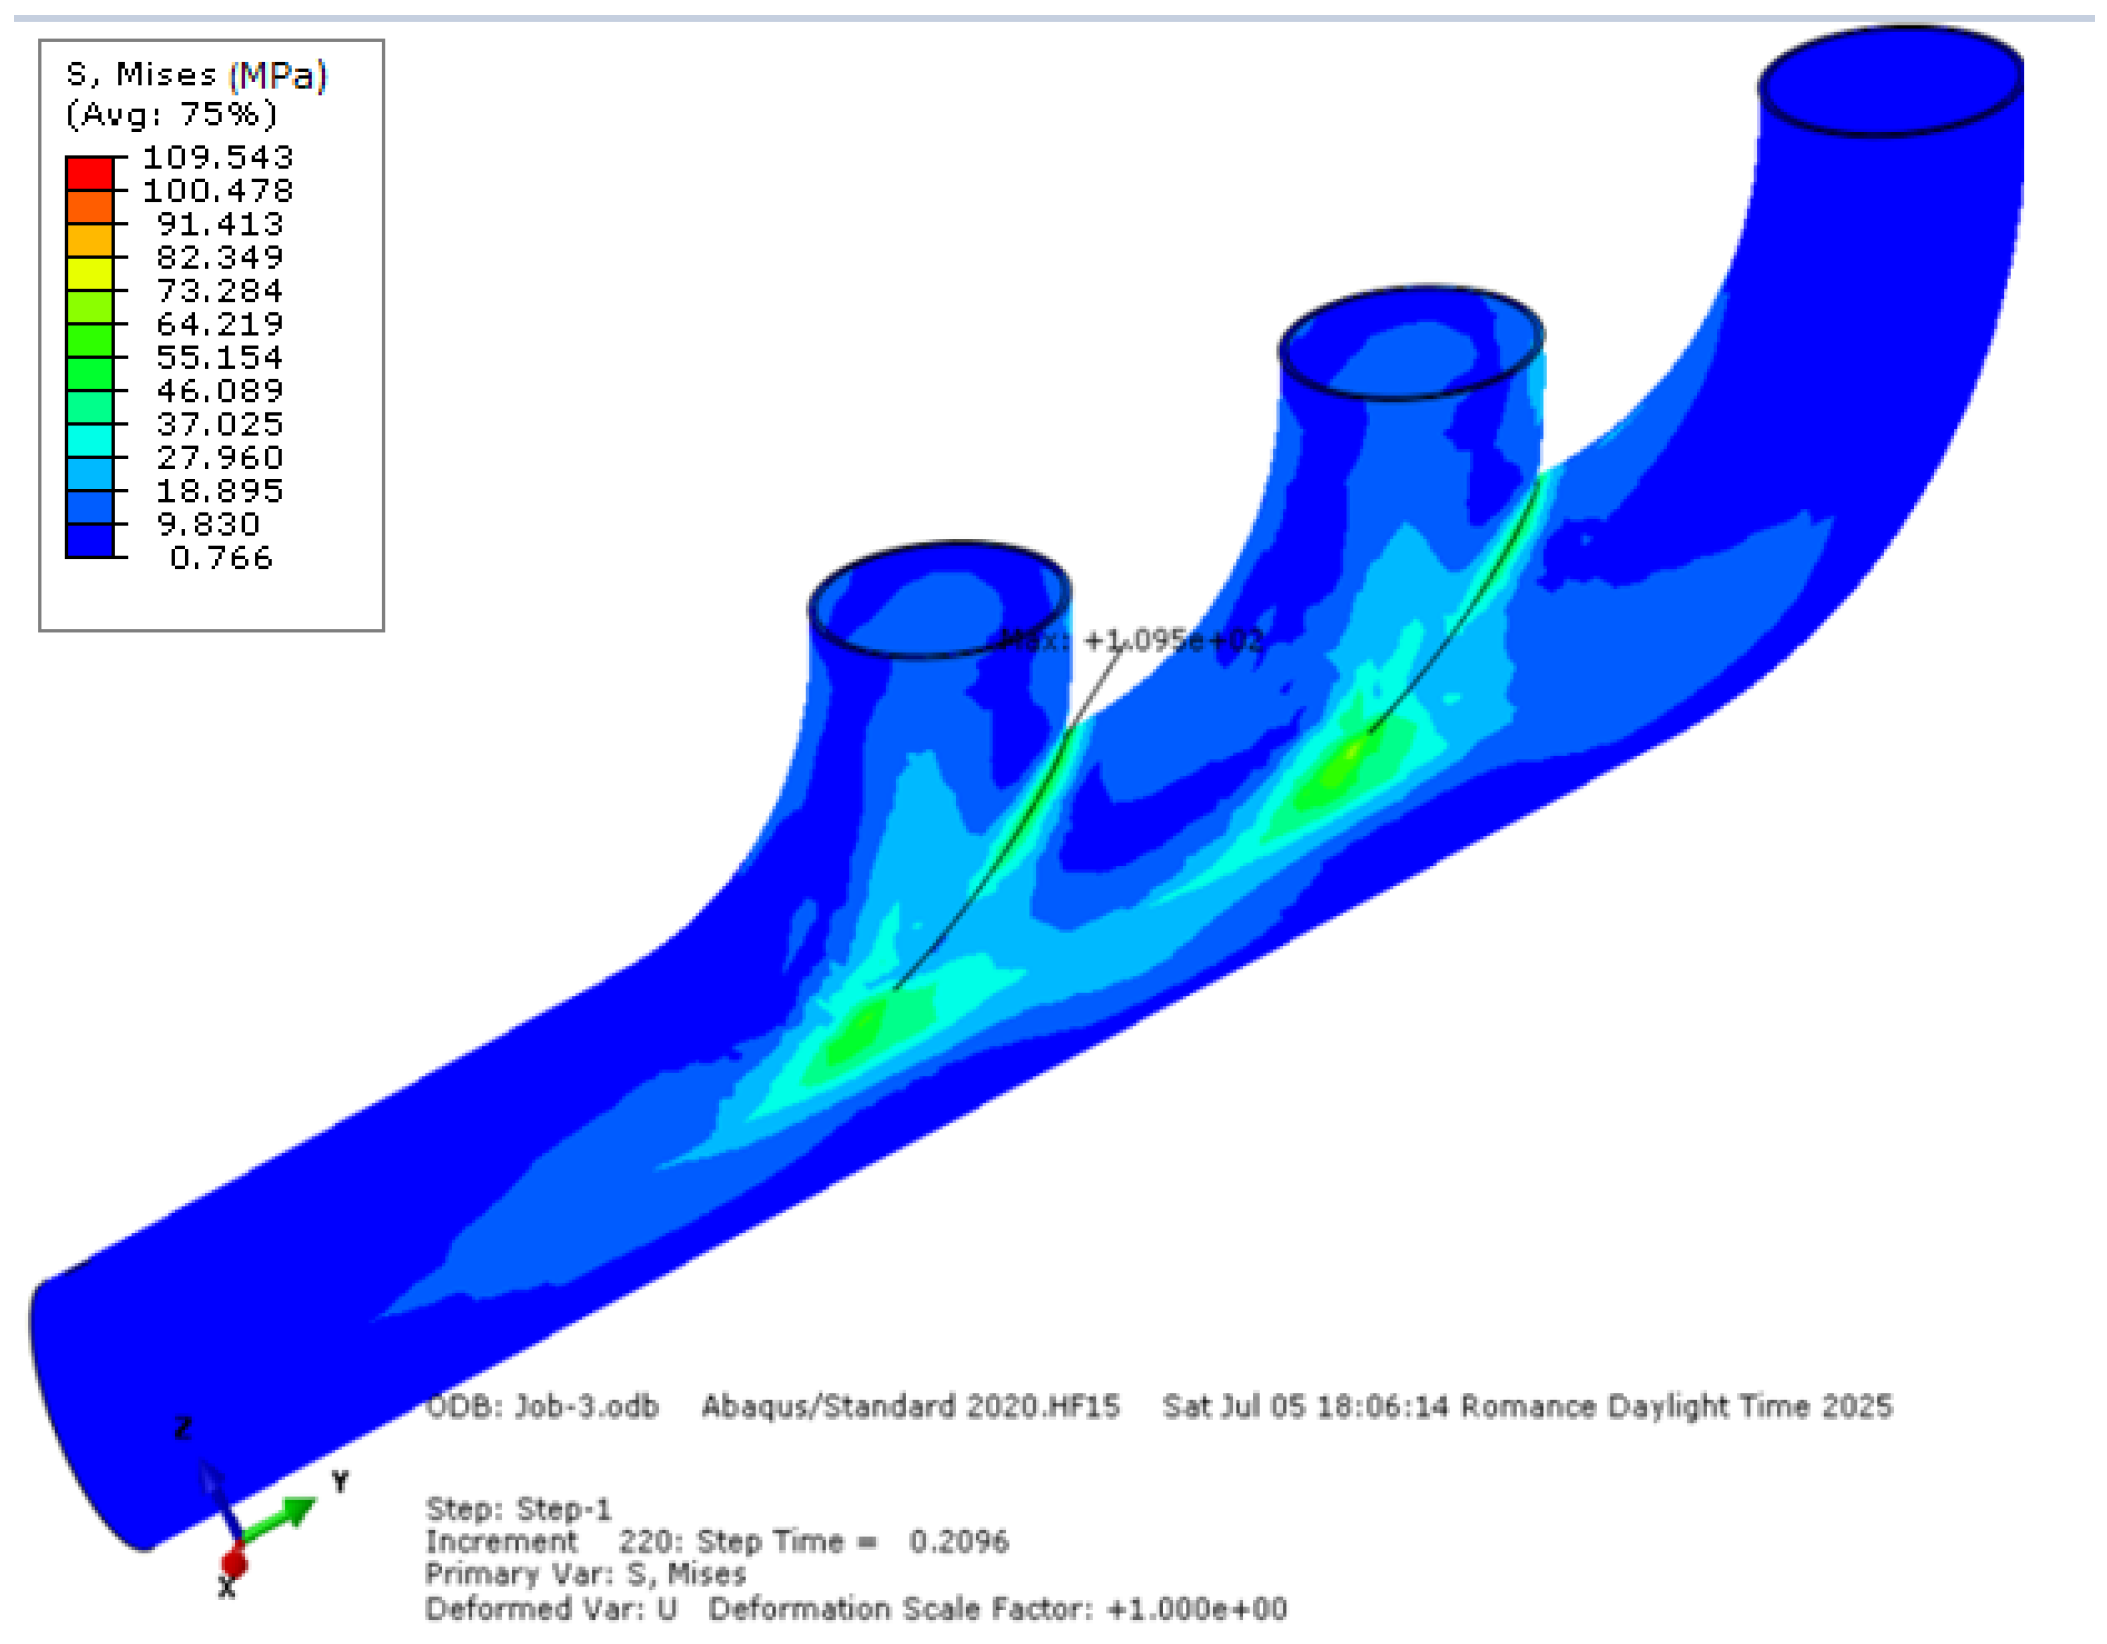
Before implementing the crack in the model, a preliminary FEM simulation was conducted on the exhaust manifold without a crack to identify regions of elevated stress under thermo-mechanical loading.
The Von Mises stress map obtained is shown in
Figure 5, highlighting critical zones where high stress concentrations occur due to geometric transitions and load transfer effects.
The region exhibiting the maximum Von Mises stress—reaching up to 109 MPa—is located near the junction between the collector branches, which justifies the selection of this zone for crack placement in both the FEM and XFEM models.
This strategic positioning ensures a physically realistic simulation of crack propagation, originating from the most vulnerable and failure-prone area of the structure.
To accurately capture the stress concentration effects and fracture behavior in this critical region, a hybrid meshing strategy was adopted.
The global mesh of the structure (Zone A) shown in
Figure 6 was generated using linear tetrahedral elements (C3D4), which were chosen for their adaptability and ability to represent the complex exhaust manifold geometry.
To accurately resolve the stress singularity near the crack tip, a localized mesh refinement was implemented in Zone B, designated as the “crack box.” This region was discretized using a structured hexahedral mesh with concentric rings of C3D8R elements, providing excellent resolution of the stress and displacement fields around the semi-elliptical surface crack.
The crack dimensions, with a depth of a = 0.5 mm and a surface length of 2c = 8 mm, were selected to reflect incipient surface flaws observed in experimental studies on stainless steel structures under thermal fatigue, particularly in curved or welded zones. This configuration corresponds to a realistic early-stage crack as validated by Shahani et al. (2010) [
33], who experimentally analyzed fatigue crack growth in pipes and demonstrated that semi-elliptical cracks with low a/c ratios remain physically representative of real-world crack propagation behavior.
As detailed in
Table 6, the selected aspect ratio a/c = 0.125 falls within the experimentally validated range for stable surface crack growth. To support an accurate evaluation of the J-integral and stress intensity factors (SIFs), the mesh around the crack front was refined with 20 radial divisions and a maximum radial mesh size of 0.3 mm, ensuring sufficient angular resolution for convergence and energy release rate calculations.
This hybrid strategy, combining a coarser global mesh with refined crack-front meshing, strikes an optimal balance between numerical accuracy and computational efficiency, as recommended in the best practices for 3D nonlinear fracture simulations under thermo-mechanical loading.
The mesh outline was defined with 20 radial divisions to provide sufficient angular resolution around the elliptical crack front. This ensures accurate computation of the J-integral and SIFs in subsequent fracture analysis. The meshing strategy also allows for the definition of multiple contours, which are necessary for convergence studies and to evaluate the energy release rate accurately.
This hybrid meshing approach coarse-grains globally and refines locally, optimizing the balance between numerical accuracy and computational cost, which is particularly critical for 3D fracture analyses involving nonlinear material behavior and thermo-mechanical loading.
To ensure accurate stress and fracture analysis in the exhaust manifold, a high-quality mesh was constructed with particular attention to local refinement around the crack front. The meshing strategy was designed to strike a balance between computational efficiency and the need for precise resolution in critical regions.
This analysis relies on a temperature-dependent elastoplastic constitutive law, which accurately represents the material’s response to combined thermal and mechanical loads.
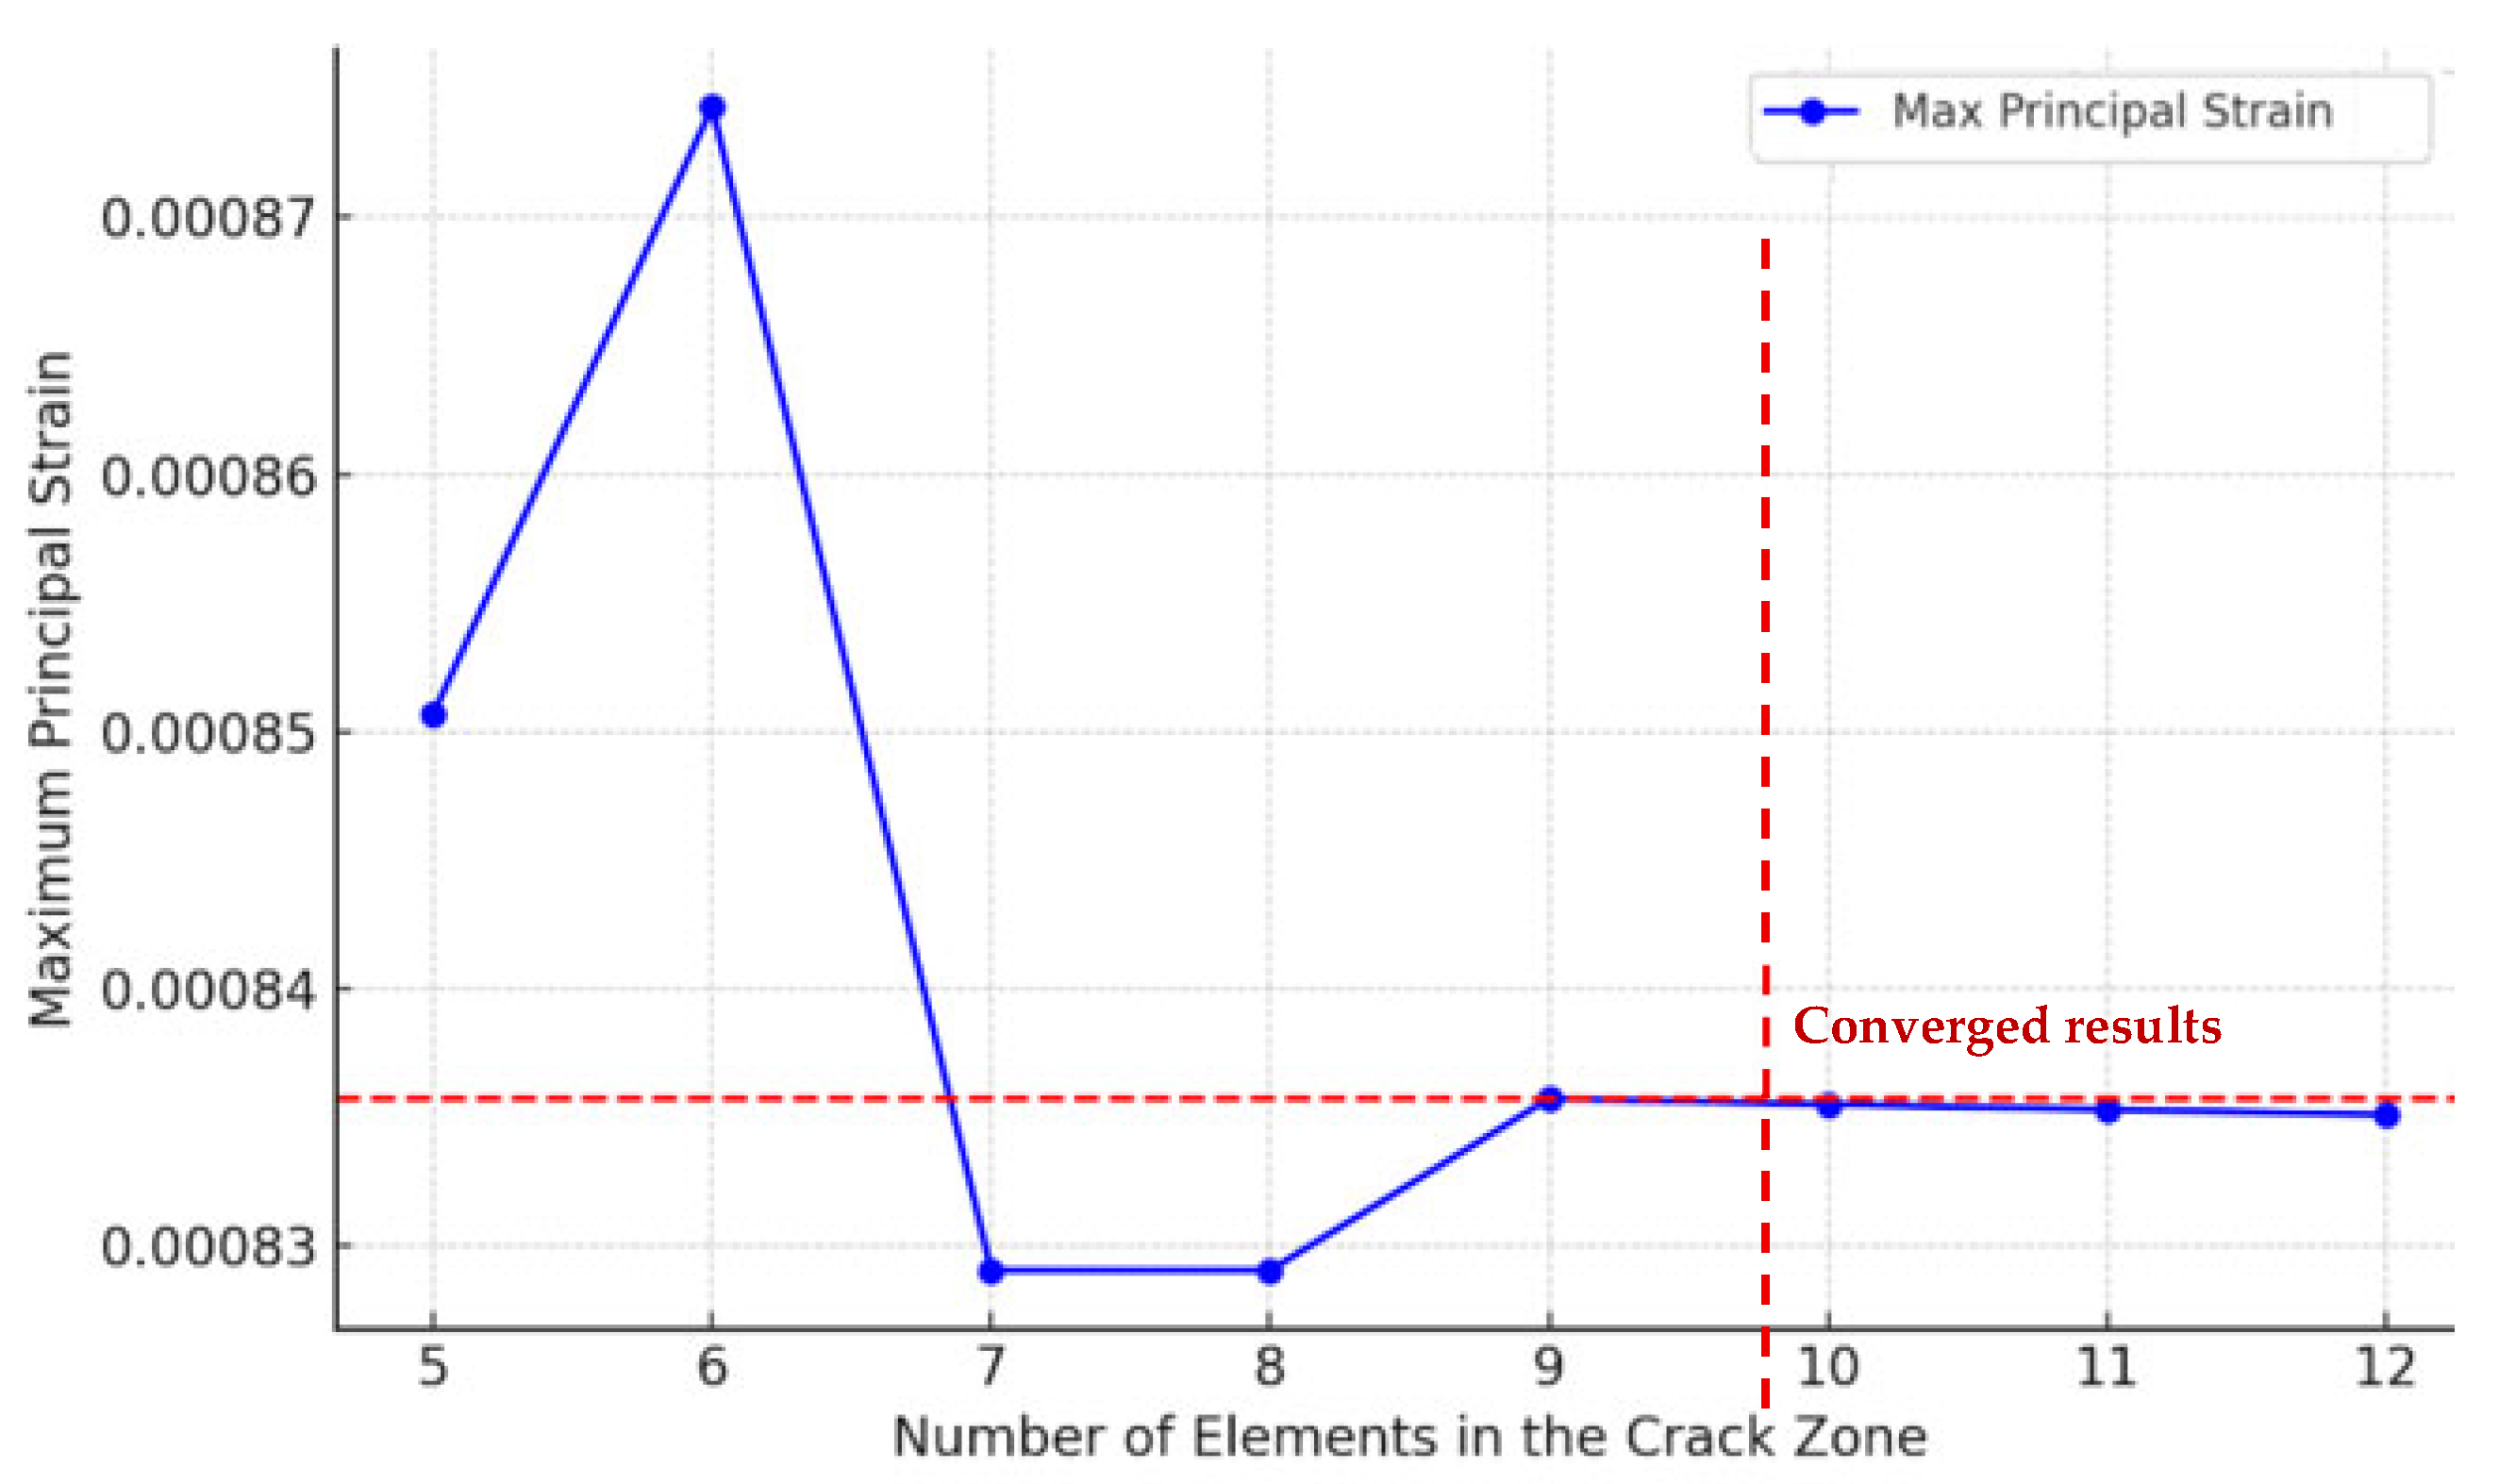
To assess the influence of mesh density on the accuracy of the simulation results, a mesh sensitivity study was carried out. The analysis focused on the region surrounding the crack, where element counts ranging from 5 to 12 were tested.
For each configuration, the maximum principal strain and Von Mises stress were extracted at the same integration point to ensure consistency. The stress values shown in
Table 7 remain constant at 167 MPa across all cases, suggesting that the stress field is well-resolved even with relatively coarse meshes. However, the principal strain displayed slight variations between configurations. From seven elements onward, the strain variation fell below 1% compared to the result obtained using the most refined mesh (nine elements), indicating that numerical convergence had been achieved. Based on these observations, the mesh with at least seven elements was selected for subsequent analysis as it provides an optimal balance between computational cost and result accuracy.
To better illustrate the convergence behavior and highlight the trend visually, the values were plotted in the graph below in
Figure 7. This convergence plot provides a more intuitive understanding of the mesh influence, emphasizing that minimal changes occur beyond seven elements. The horizontal reference line corresponding to the result at nine elements further confirms that numerical stabilization has been achieved.
The final finite element model comprises a total of 23,710 elements and 46,843 nodes, obtained using a hybrid meshing strategy combining second-order and first-order elements. The global domain is meshed predominantly with 22,942 quadratic tetrahedral elements (C3D10), which offer superior accuracy compared to linear tetrahedral elements (C3D4) and provide a better representation of the manifold’s complex curved geometry. To resolve the stress singularity near the crack tip, a refined structured mesh was implemented within the crack box region using 768 linear hexahedral elements with reduced integration (C3D8R). This local refinement ensures sufficient resolution for accurate computation of the J-integral and stress intensity factors, as recommended for 3D fracture simulations under thermo-mechanical loading.
As illustrated in
Figure 6, a localized mesh refinement was implemented in the vicinity of the semi-elliptical surface crack. The crack tip region was meshed with fine concentric rings of quadratic elements to properly capture the stress singularity and ensure the path independence of the J-integral evaluation. Element sizes in this area were reduced to less than 0.2 mm, while a coarser mesh was retained in the far field to reduce the overall computational cost.
The resulting mesh configuration meets the requirements for convergence, ensuring the reliability of the stress and fracture analyses that follow.
5. FEM Analysis—Results and Discussion
The FEA was carried out using a 3D solid model of the exhaust manifold under thermo-mechanical loading. The material was defined with a temperature-dependent elastoplastic constitutive law, allowing the simulation to capture both elastic and plastic responses under high stress and temperature gradients. This modeling framework enables an accurate representation of the mechanical behavior around critical regions, especially in the vicinity of the crack tip, where localized plastic deformation and stress concentration are expected to drive fatigue and fracture phenomena.
5.1. Von Mises Stress Analysis
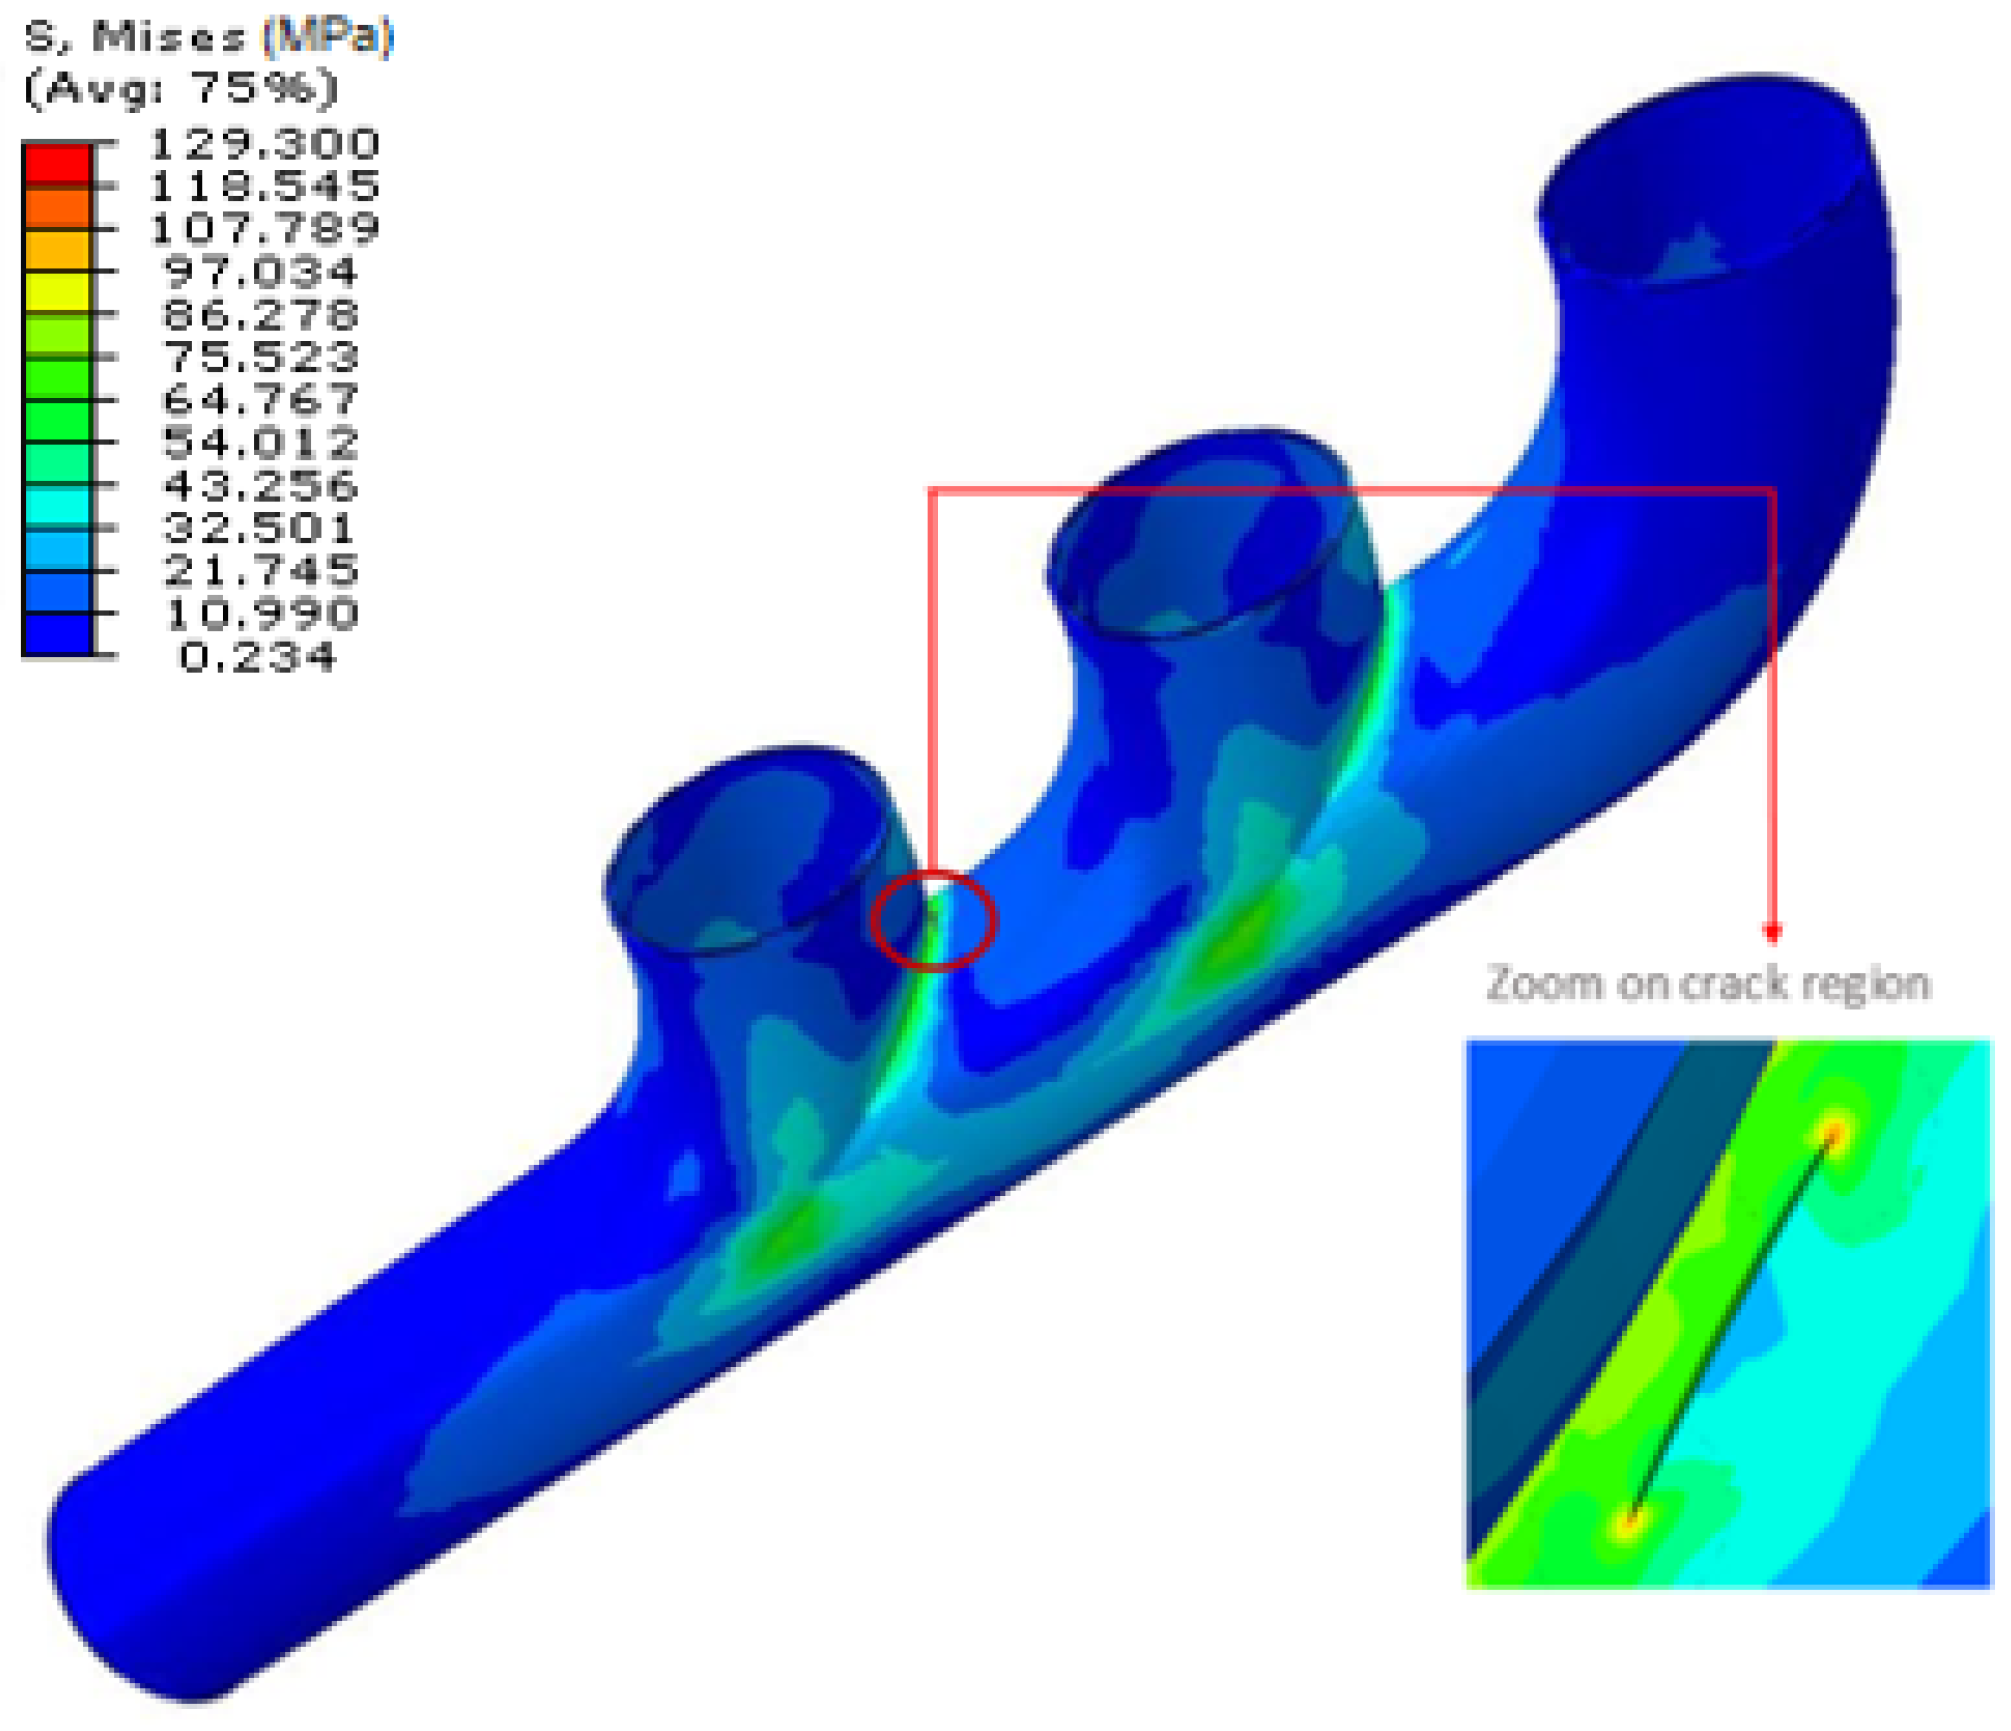
The stress distribution obtained from the finite element analysis provides valuable insight into the mechanical behavior of the cracked exhaust manifold under combined thermo-mechanical loading. The presence of the predefined surface crack leads to a pronounced intensification of stresses in its vicinity as shown in
Figure 8, reflecting the typical fracture behavior observed in fatigue-prone components. The crack tip region exhibits steep stress gradients that are indicative of potential crack propagation paths.
The zoomed view of the crack zone shows a sharp stress gradient aligned with the crack front, indicating localized plastic deformation or potential crack propagation paths. The Von Mises stress reaches a peak in the vicinity of the crack tip, a typical behavior that confirms this region as structurally critical. This outcome validates the decision to place the crack in this location for further investigation into fatigue and fracture.
The stress magnitude in the critical area approaches 117 MPa, which is significantly higher than the average background stress observed in less constrained regions. The stress gradually dissipates away from the crack front, confirming the localized nature of the structural discontinuity’s effect.
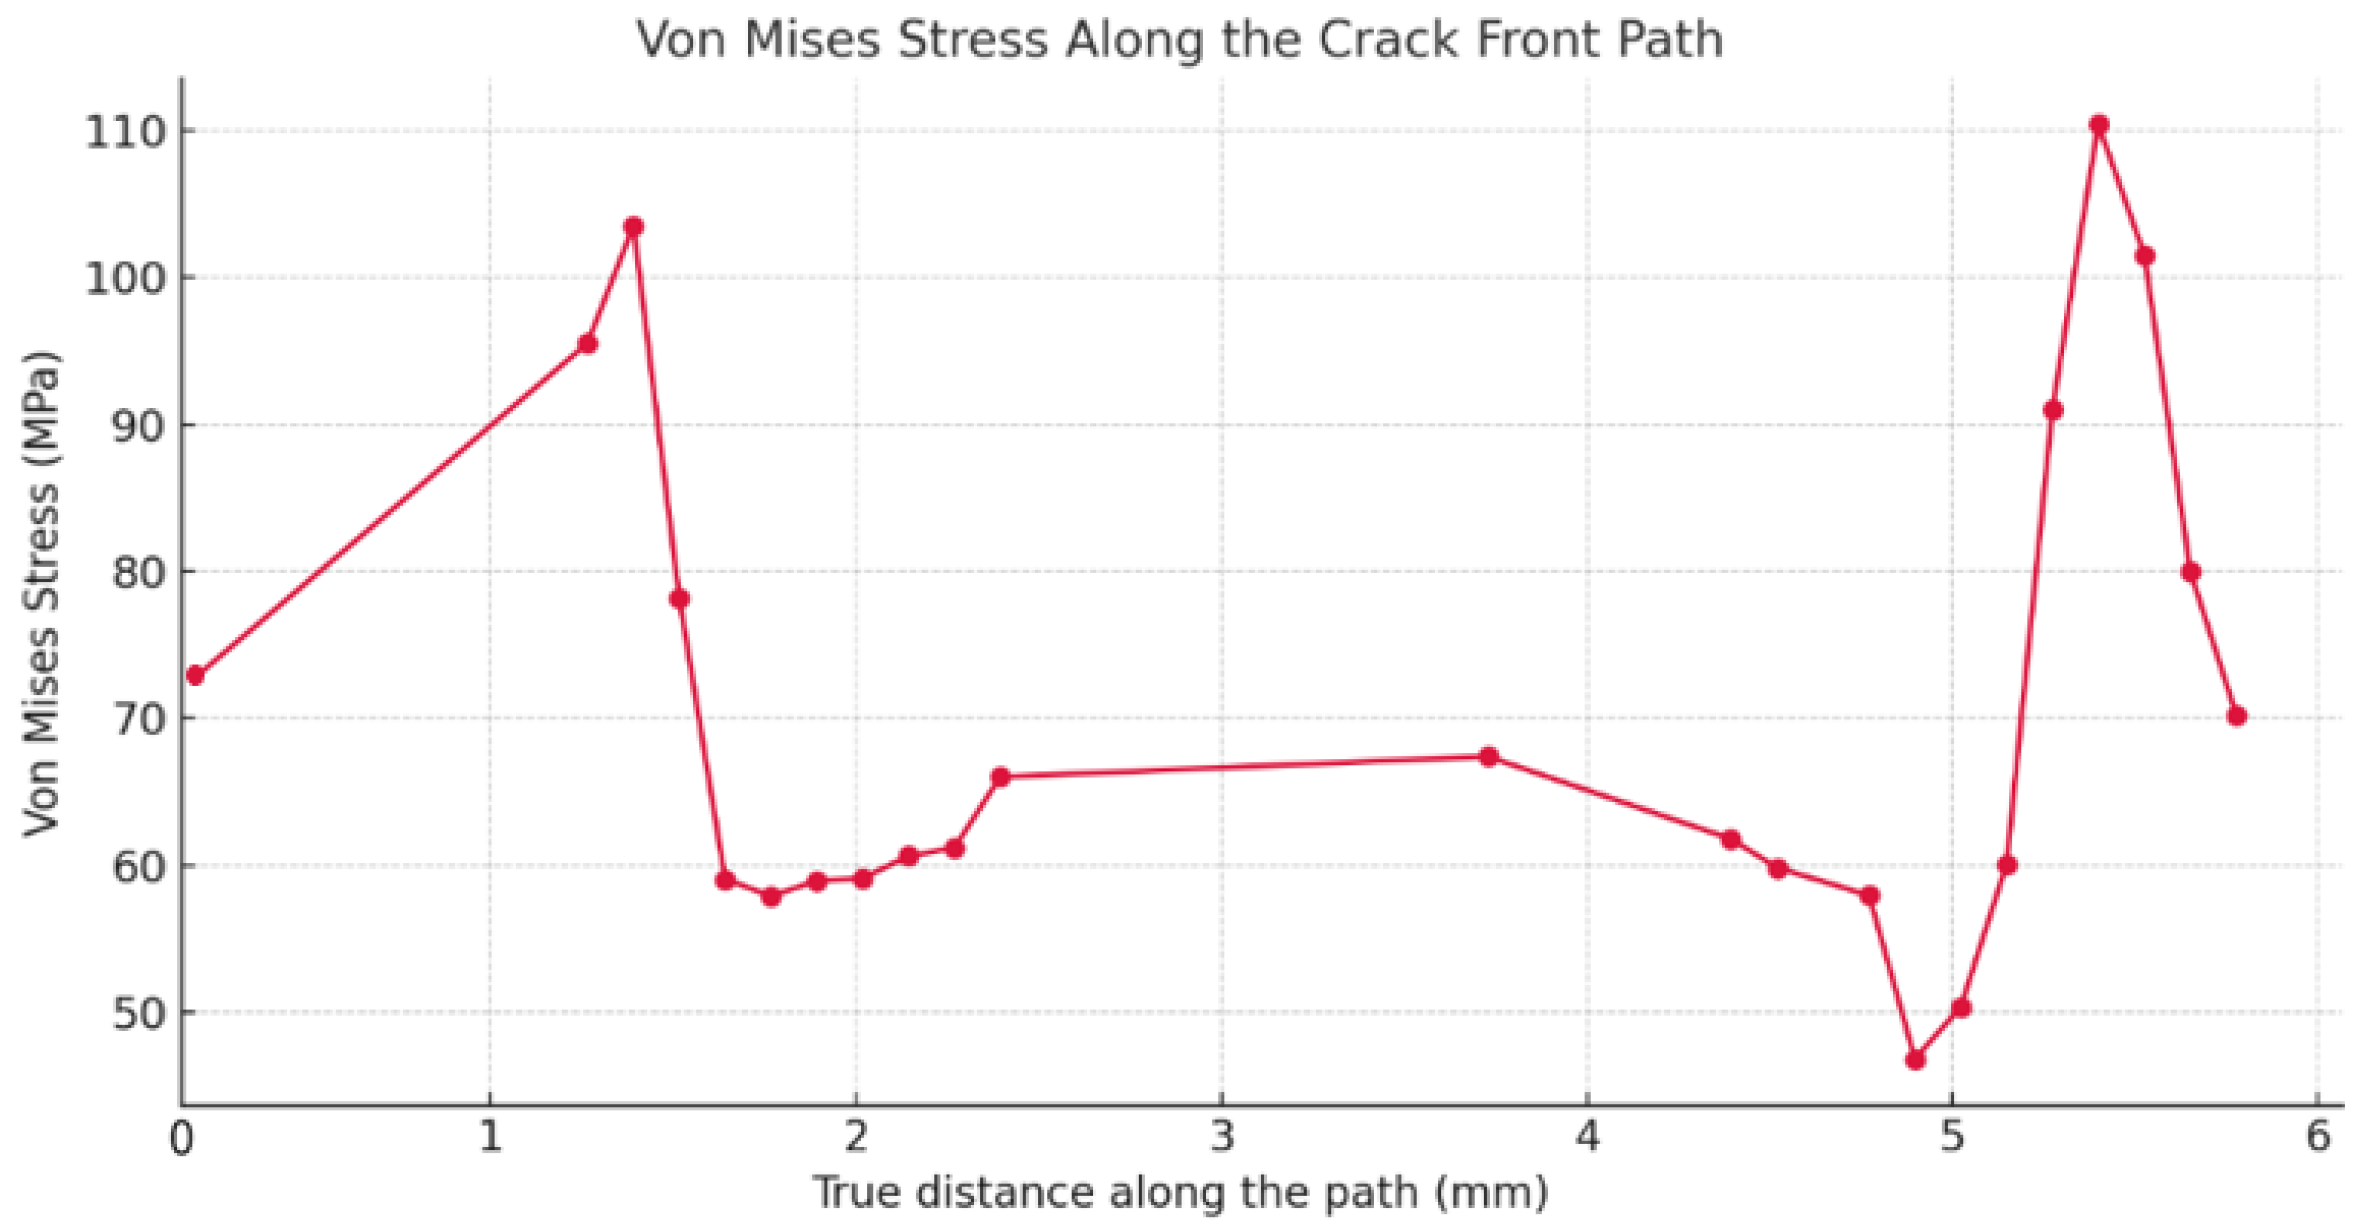
The distribution of Von Mises stress along the front of a semi-elliptical surface crack is presented in
Figure 9. The data was extracted using a manually defined custom node list along the crack front, which ensures high precision in capturing local variations in stress, particularly around the most critical regions.
The plot reveals two prominent stress peaks located at both extremities of the crack front, with values exceeding 110 MPa. These peaks reflect the expected stress concentration zones at the crack tips. In contrast, the intermediate region shows lower stress levels, which are typical in such geometries. The use of a manually defined node list, as opposed to an automated or uniform path definition, allows for a more accurate representation of the actual mesh and crack shape. This method improves the reliability of fracture mechanics post-processing, particularly for J-integral evaluations, and provides a robust framework for assessing crack-tip behavior under complex thermo-mechanical loading conditions.
5.2. Displacement Field Analysis
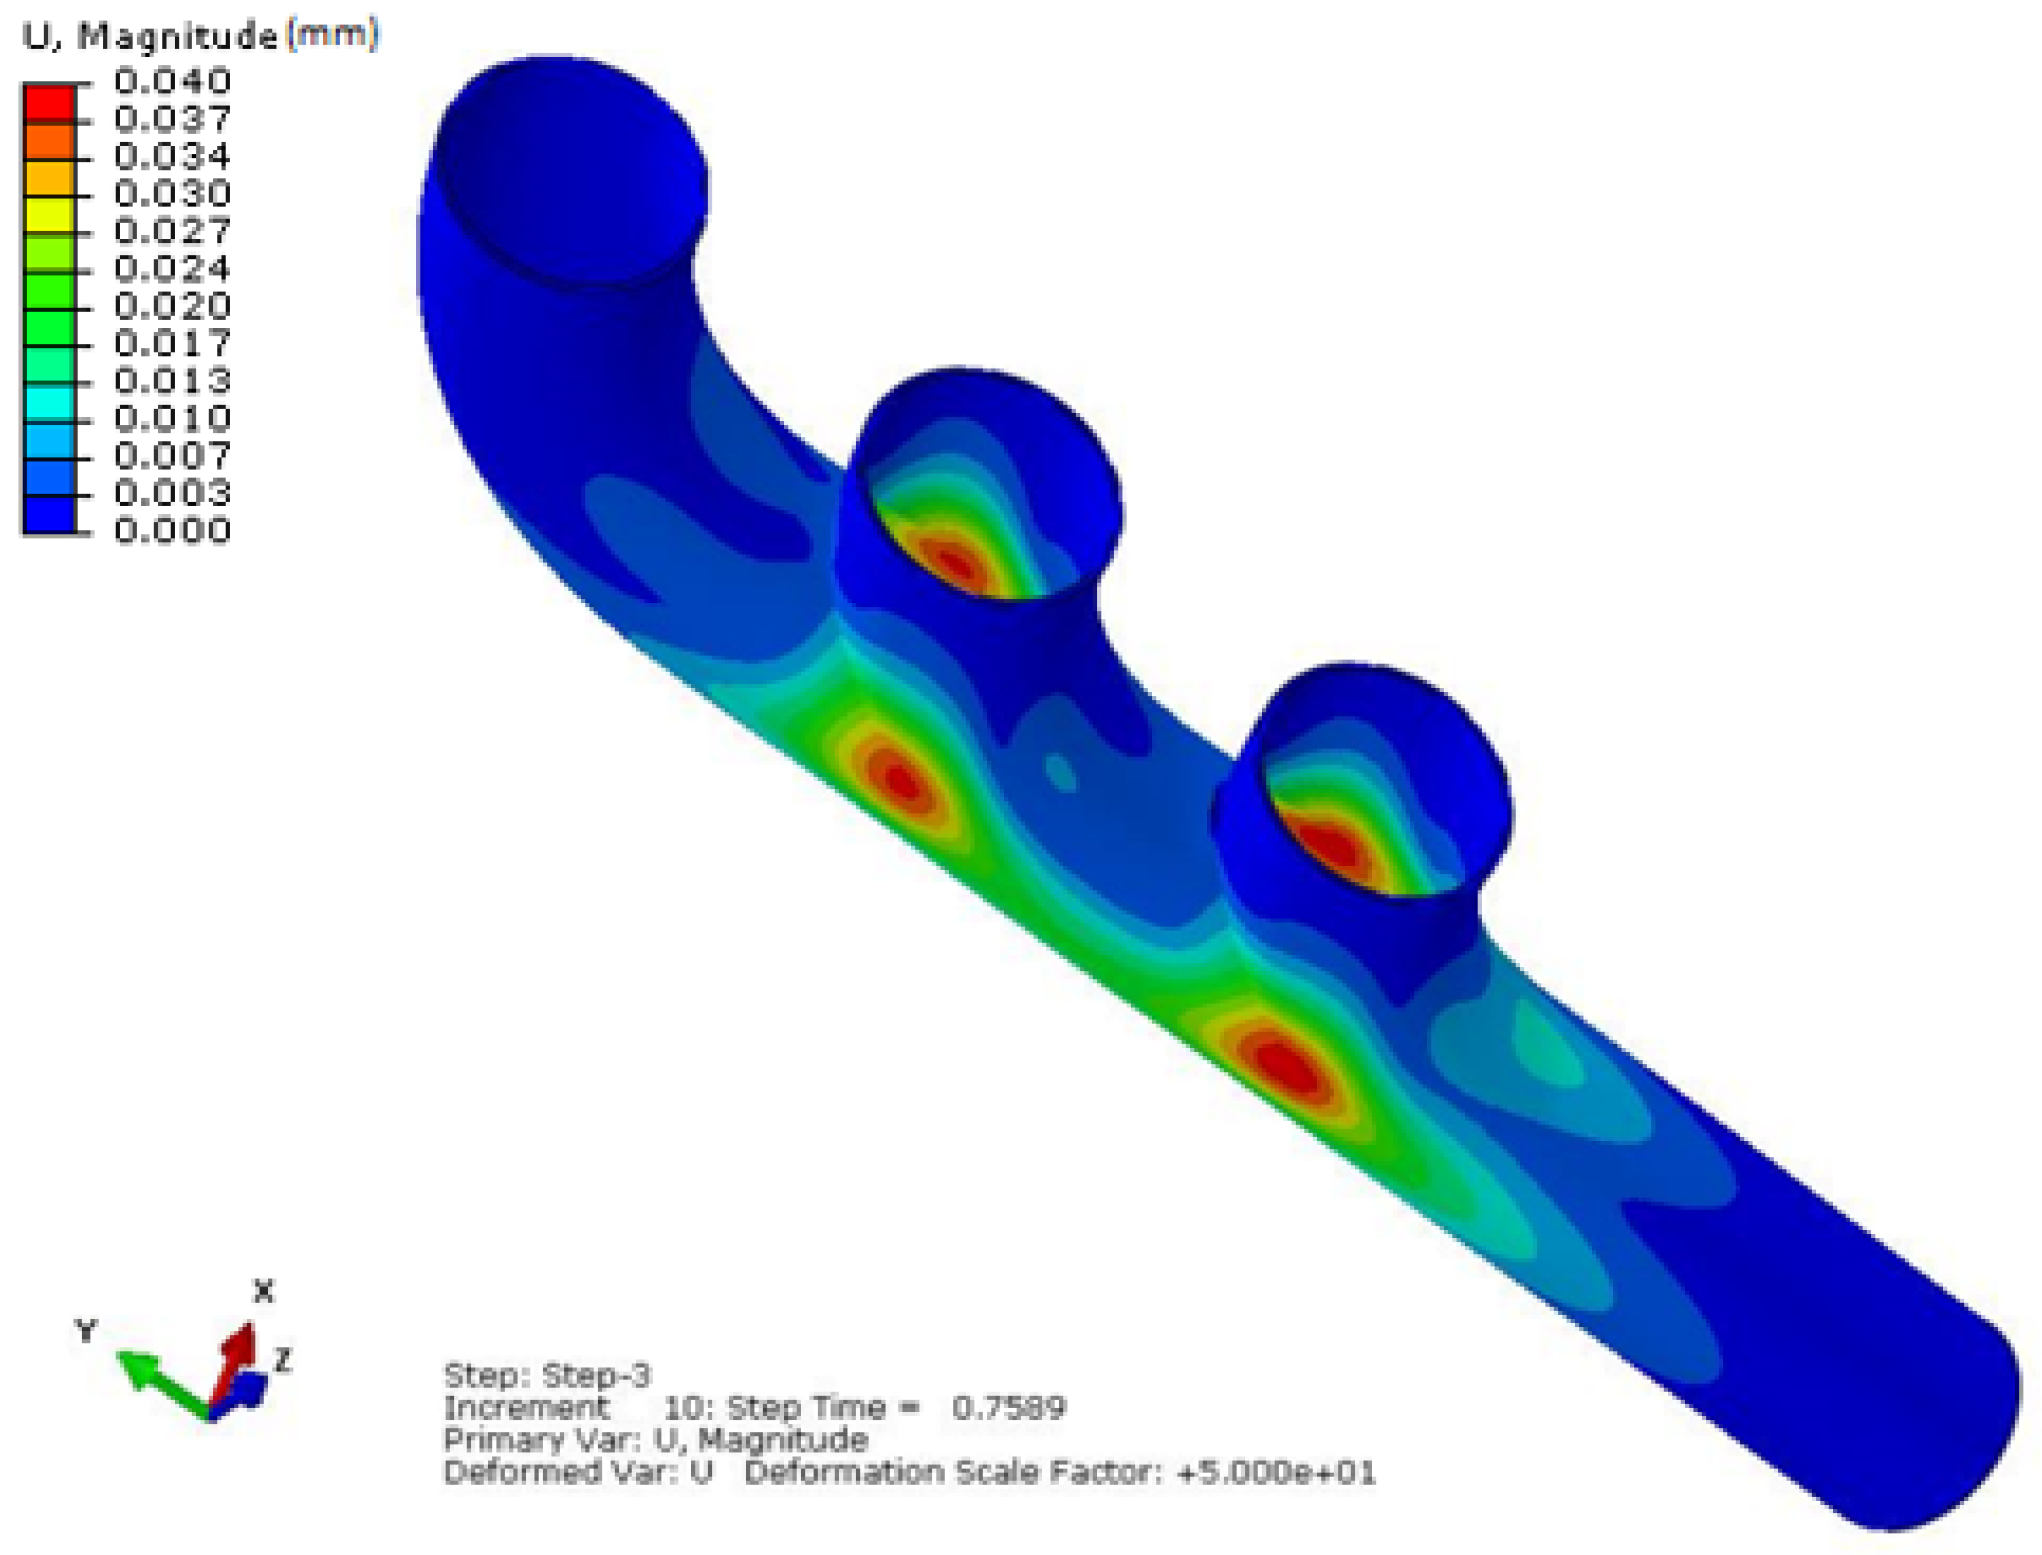
The displacement field (U, Magnitude) at the peak loading time, t = 0.7589 s, shown in
Figure 10, reveals the regions of maximum structural deformation induced by internal pressure and thermal effects. The result highlights zones with the highest total displacement, typically located near the mounting flanges and junctions, where thermal expansion and pressure loading are most critical.
This contour plot illustrates the total displacement magnitude throughout the exhaust manifold during the thermo-mechanical loading step. The most pronounced displacements are concentrated near the junctions between the vertical branches and the main duct, particularly at the lower curvature zones. These regions correspond to areas of reduced mechanical constraint and increased thermal expansion freedom, resulting in higher deformation. Despite the apparent deformation field, the maximum displacement reaches approximately 4.04 × 10⁻² mm, and remains within acceptable limits, suggesting that structural integrity is maintained. It is also notable that displacement is not maximal at the presumed crack location, which confirms that local strain energy release and stress concentration are more reliably assessed through fracture criteria rather than global displacement metrics.
5.3. Crack Propagation and Fracture Analysis
KI vs. KIC Comparison
In this section, stress intensity factors (SIFs) were determined using the energy-based approach previously introduced, where the Mode I stress intensity factor KI is derived from the J-integral and the temperature-dependent effective Young’s modulus.
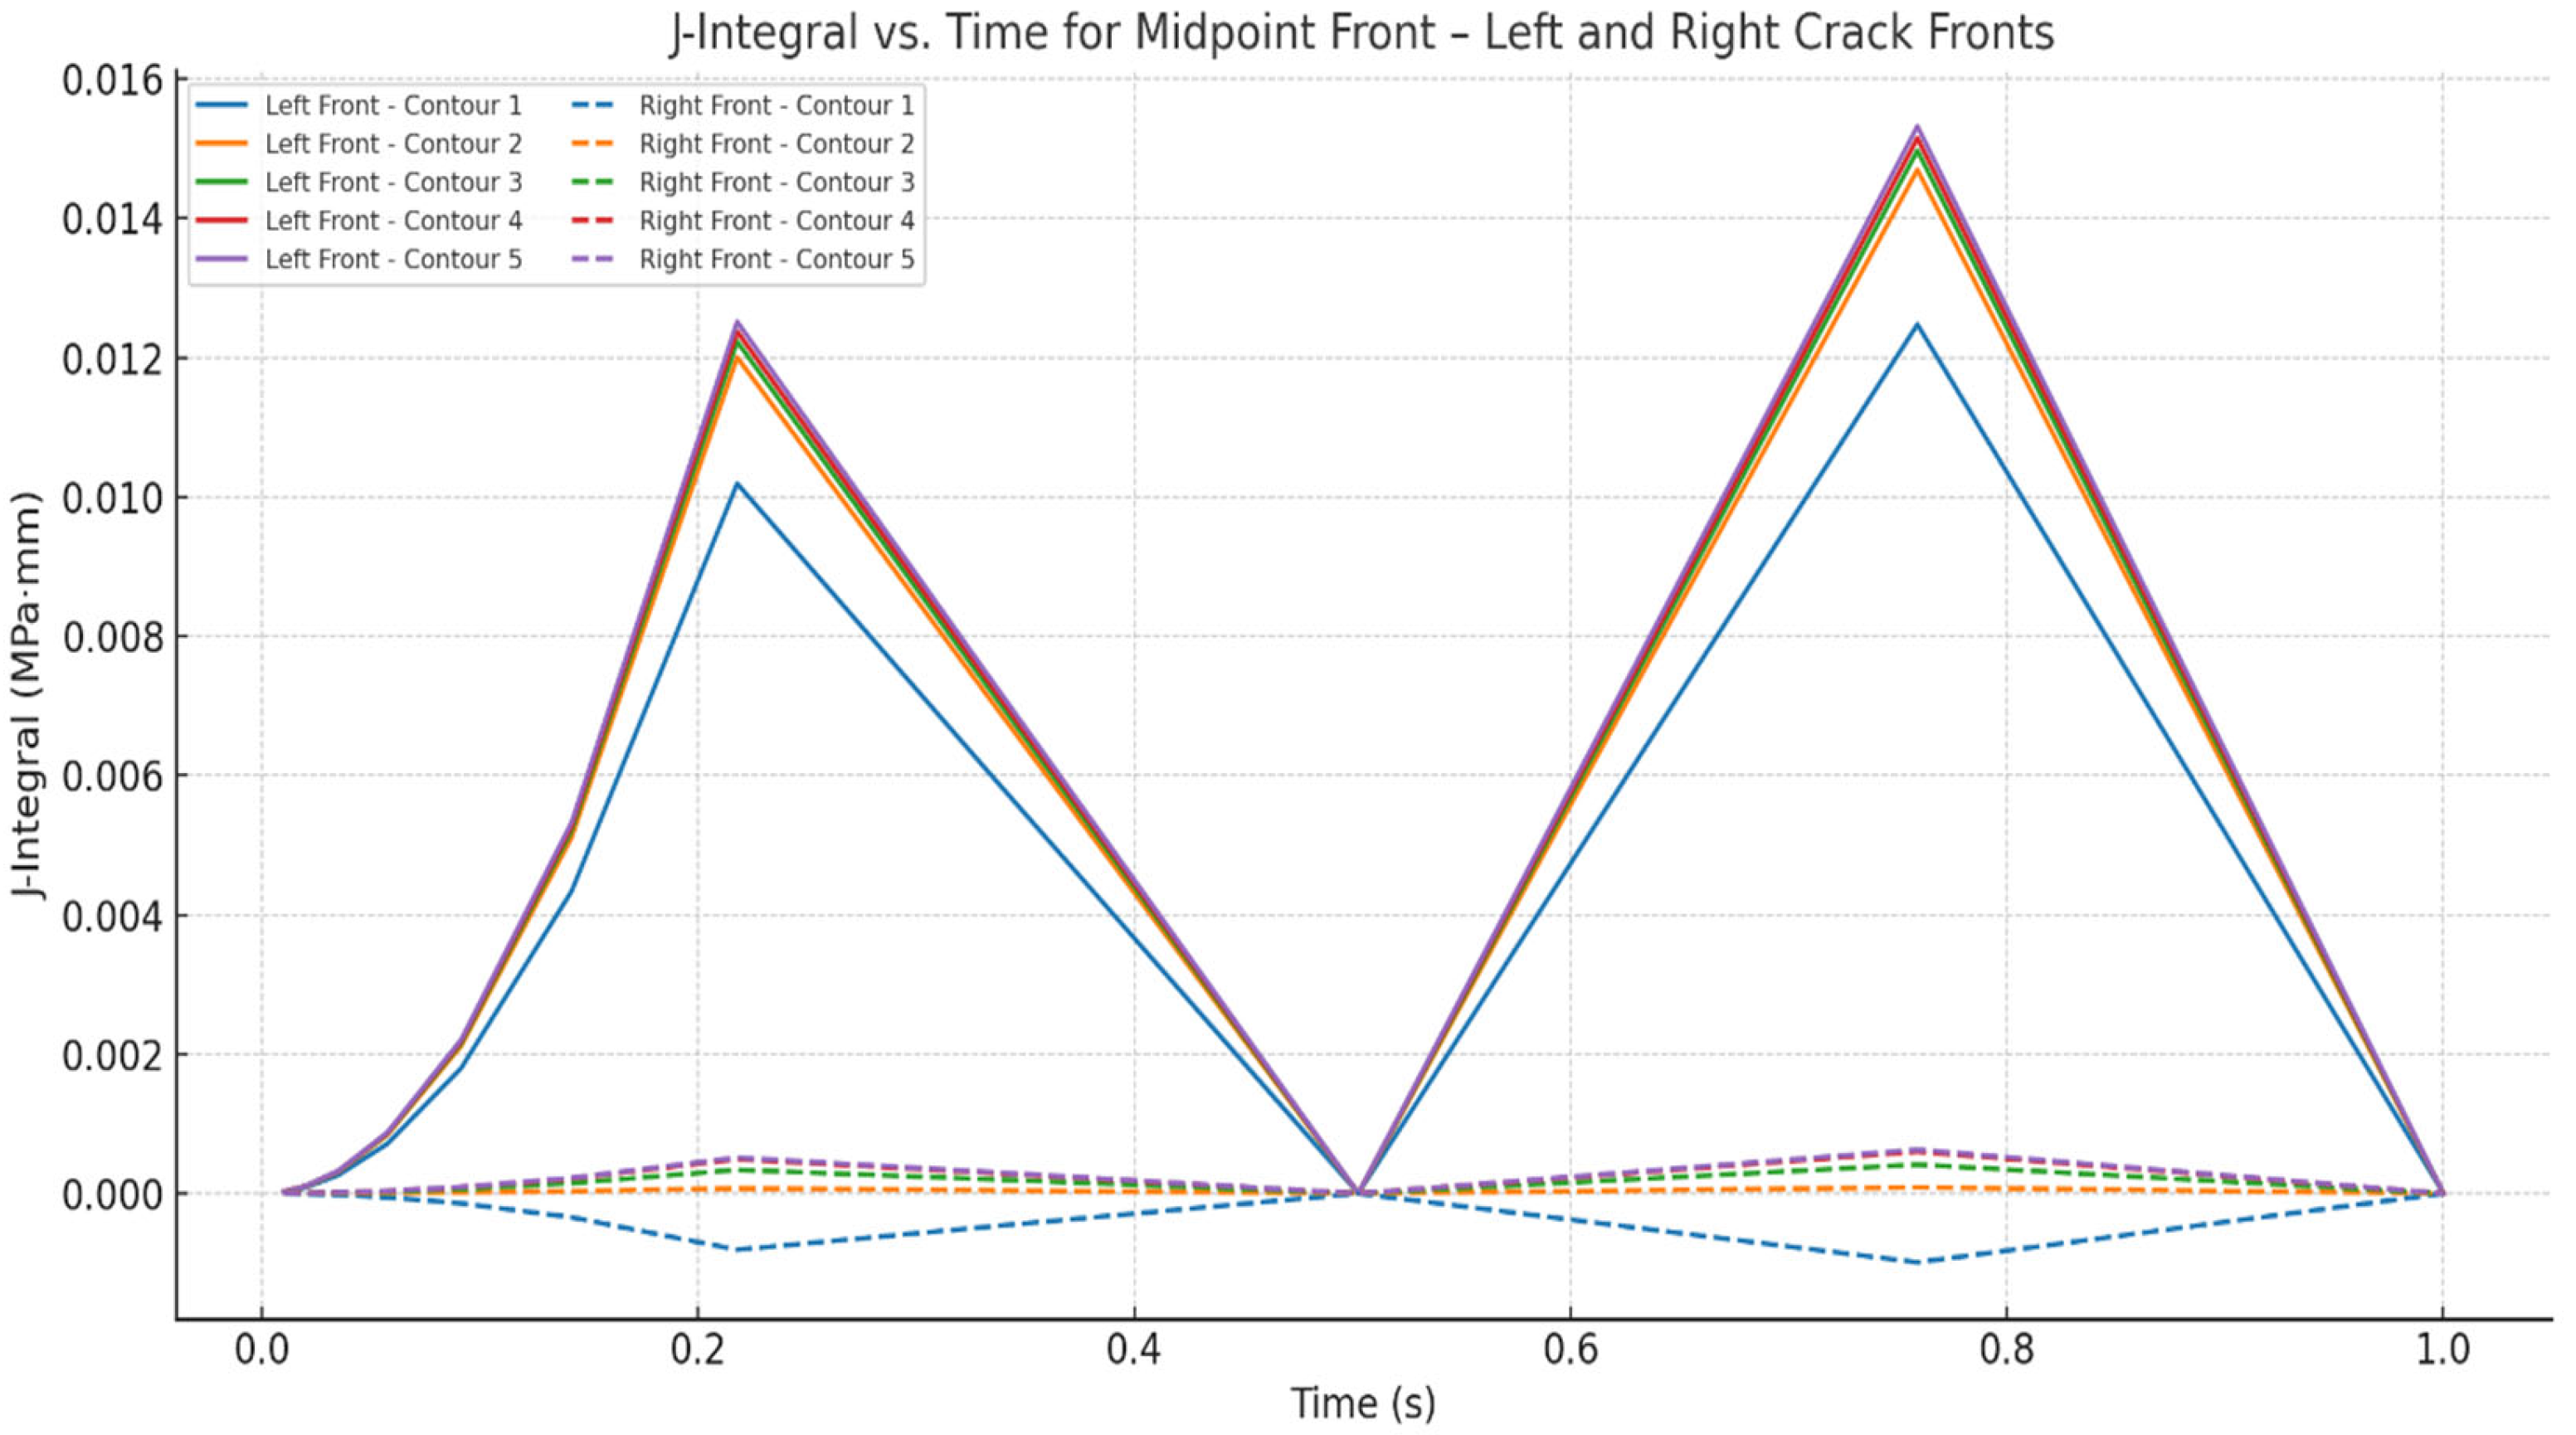
To evaluate the risk of crack propagation, the Mode I stress intensity factor (KI) was calculated at the midpoint of the Left Crack Front, based on the J-integral values extracted from Contours 3 to 5 at two critical loading times: t = 0.217 s and t = 0.758 s. The average J-integral values at these times are J1 = 0.012 × 10⁻³ MPa.m and J2 = 0.015 × 10⁻³ MPa.m, respectively.
The effective Young’s modulus for plane strain conditions was calculated using
Using these values, stress intensity factors were determined as follows:
This analysis is conducted under elastic–plastic fracture conditions using the J-integral as the crack driving parameter. Here, J represents the energy release rate, and E’ is the effective Young’s modulus accounting for plane strain conditions. The values of J were extracted from the J-integral contours computed near the crack front at each time step, and the corresponding temperature-dependent Young’s moduli were used to calculate KI for different thermal conditions.
As observed in
Table 8, the K
I values increase with temperature, reflecting the combined effect of elevated thermal stress and reduced material stiffness at high temperatures. Between the two time points, K
I values rise as the applied load and crack driving force intensify over time. This trend is consistent with the progressive loading and thermal expansion imposed on the structure.
To evaluate the risk of crack propagation, the Mode I stress intensity factor (KI) was calculated at the midpoint of the Left Crack Front, based on the J-integral values extracted from Contours 3 to 5 at two critical loading times: t = 0.217 s and t = 0.758 s. The average J-integral values at these times are J1 = 4.48636 × 10⁻⁷ MPa. m and J2 = 5.47911 × 10⁻⁷ MPa. m, respectively.
To assess crack propagation, the computed stress intensity factors (K
I) were compared with the fracture toughness of AISI 321 stainless steel. Experimental J
Ic data for this alloy at elevated temperatures, reported by Nakajima et al. [
34], were converted into equivalent toughness values using
. The results indicate ranges between approximately [90, 120] MPa√m at room temperature, [95, 115] MPa√m at 300 °C, and [75, 100] MPa√m at 500 °C. Although direct measurements at 600–800 °C are scarce, it is well established that the fracture toughness of austenitic stainless steels decreases with temperature; therefore, a conservative reduction was applied, yielding estimated values of [65, 85] MPa√m at 600 °C and [55, 75] MPa√m at 700 °C. Compared to these reference values, the computed K
I in
Table 8 and
Table 9 (maximum 26.35 MPa√m at 700 °C) remains well below the material toughness across the investigated temperature range. This demonstrates that, under the applied thermo-mechanical loading, the crack does not reach the critical condition for unstable propagation, ensuring structural integrity of the exhaust manifold.
The graph in
Figure 11 illustrates the evolution of the J-integral at the midpoints of the Left and Right Crack Fronts over two load cycles. The values were extracted at five successive contours around the crack tip following the Abaqus domain integral procedure. The loading peaks occur at t ≈ 0.217 s and t ≈ 0.759 s, corresponding to the maxima of the applied cyclic internal pressure.
At the Left Crack Front, the J-integral increases consistently with contour number, and the outer contours (3–5) show stable and convergent behavior. This ensures reliable evaluation of the crack driving force, with peak J values reached during load maxima. In contrast, the Right Crack Front exhibits lower J-integral values; occasional negative values at inner contours (1–2) are attributed to local unloading effects or numerical artifacts, but the outer contours recover stability. Overall, the Left Crack Front is subjected to a higher crack driving force, indicating a greater susceptibility to crack propagation from this side. For subsequent stress intensity factor calculations, the convergent contours (3–5) were retained.
6. XFEM Analysis
Following the FEM analysis, which helped identify high-stress zones and assess the exhaust manifold’s behavior under thermo-mechanical loads, it became clear that a more advanced modeling approach was needed to accurately capture crack initiation and growth.
While the FEM is well-suited for global stress evaluation, it struggles to model evolving discontinuities such as cracks—especially in complex geometries—since it requires mesh conformity to the crack path and frequent remeshing during propagation. These limitations significantly increase computational cost and reduce modeling flexibility.
To address this, we implemented the Extended Finite Element Method (XFEM). Unlike the conventional FEM, the XFEM enriches the displacement field to allow cracks to be modeled independently of the mesh structure. This mesh independence makes it particularly well-suited for exhaust manifolds, where crack paths are irregular and hard to predict.
Moreover, the XFEM enables accurate post-processing of fracture mechanics parameters such as the J-integral and stress intensity factors (KI, KII, and KIII) using domain integrals. It also supports advanced fatigue analysis under cyclic thermo-mechanical loading. Crack initiation can be governed by a Maximum Principal Stress Criterion, while propagation is modeled using energy-based laws like the Benzeggagh–Kenane criterion, ideal for mixed-mode fractures.
Overall, the XFEM offers a robust and efficient framework for simulating crack behavior under realistic service conditions, making it a valuable extension of our structural analysis.
6.1. Crack Modeling and Partition Strategy
The definition of the XFEM crack domain is a key step in setting up the simulation framework for fracture analysis. In this context, a specific region within the exhaust manifold geometry has been selected based on its susceptibility to high stress concentrations and thermo-mechanical fatigue. The location is chosen to ensure that the crack initiates and evolves in a physically meaningful and computationally stable area, consistent with the component’s structural behavior.
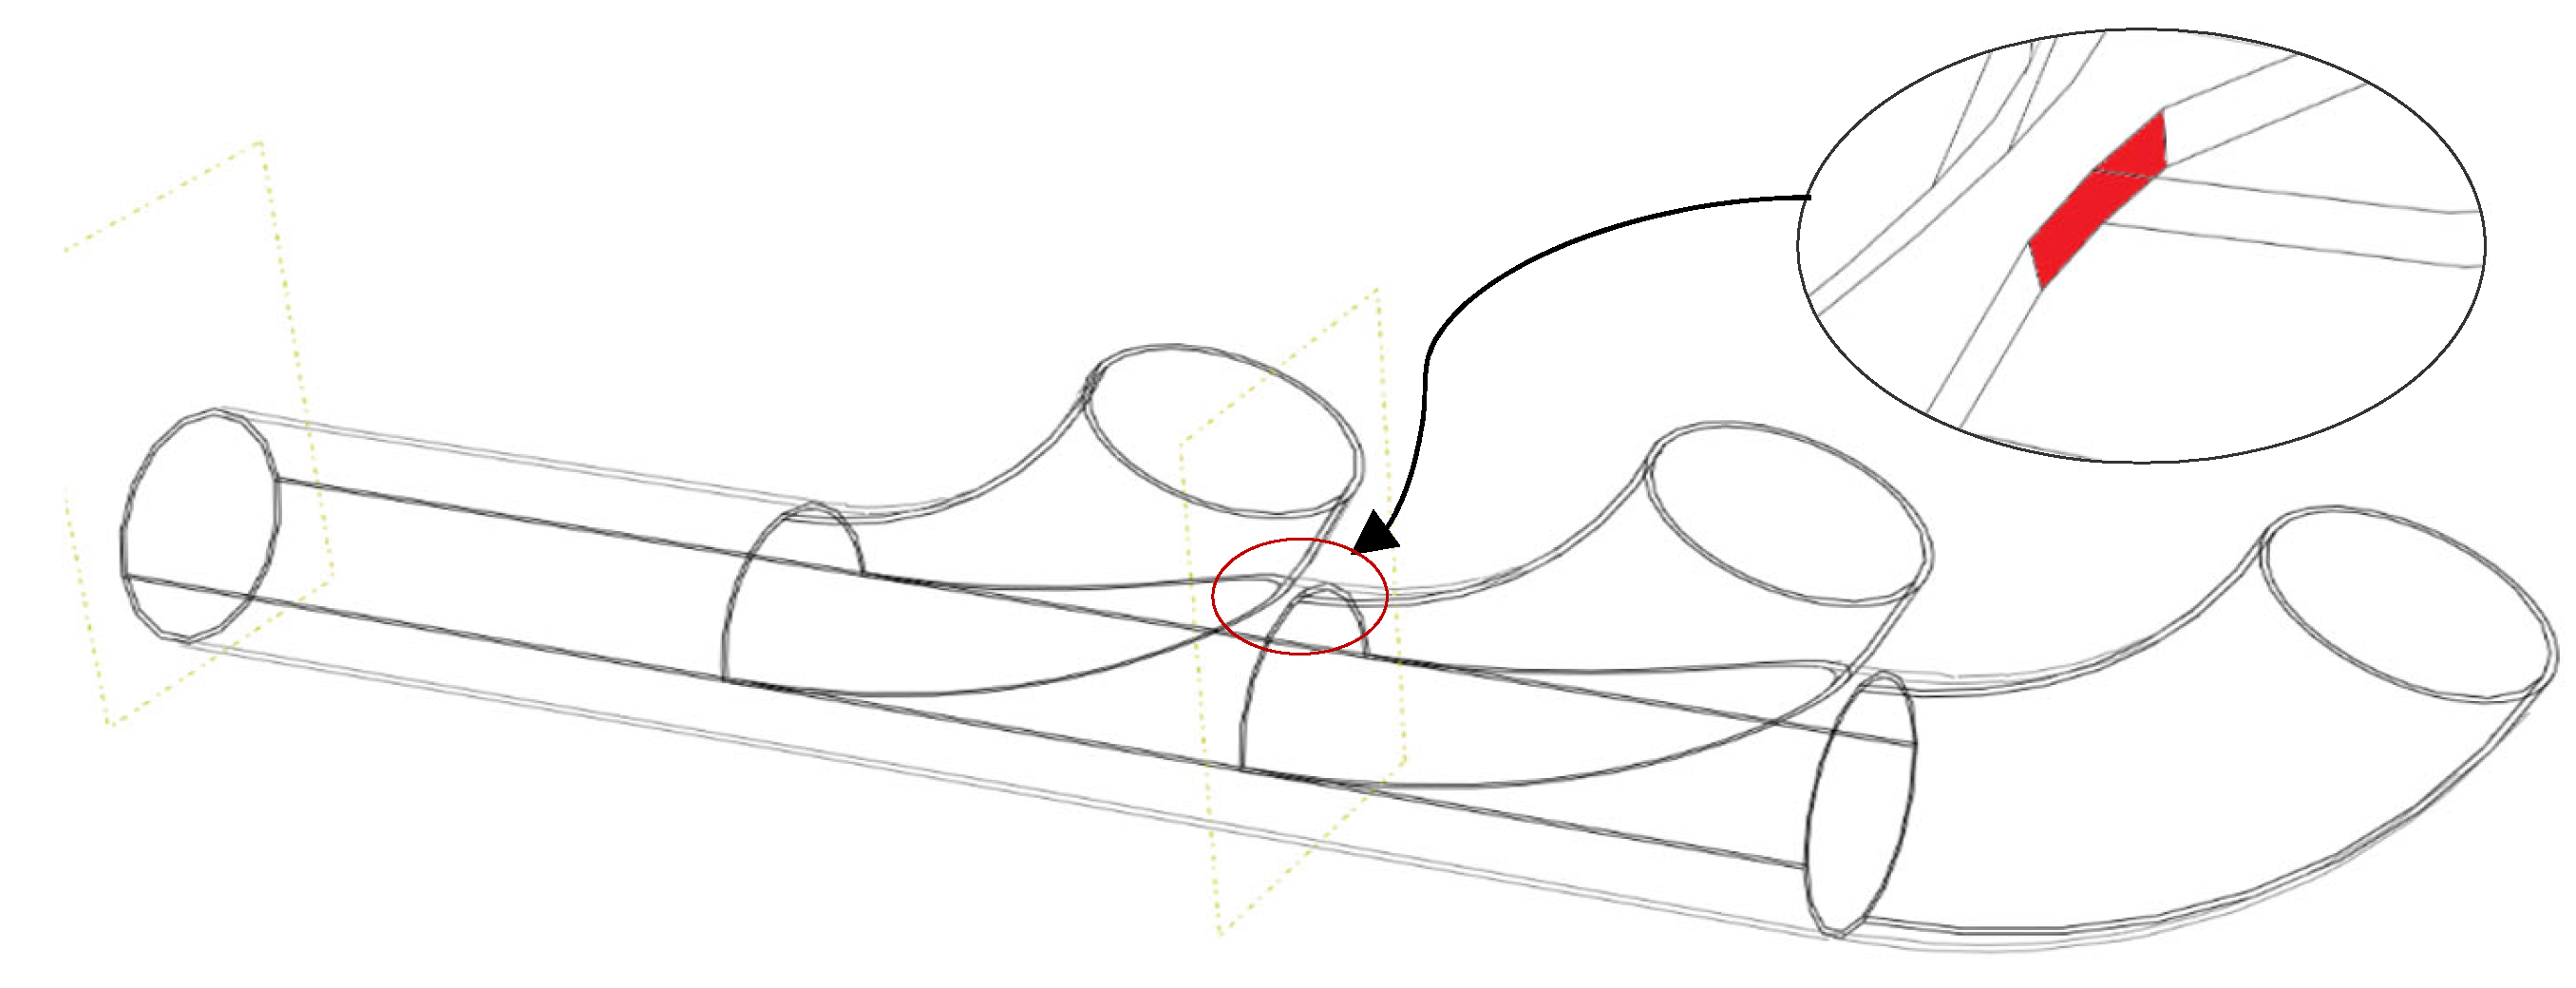
The critical area, as illustrated in
Figure 12, delineates the XFEM crack domain. A highlighted red partition identifies the designated sub-volume for crack initiation and propagation. Although the region of maximum curvature is typically associated with the highest stress concentration due to geometric discontinuities and thermal loading, the crack domain was deliberately positioned adjacent to this zone rather than directly within it. This strategic placement was implemented to mitigate potential mesh distortion and convergence issues during the simulation process.
The enriched volume spans a length of 4 mm, with a thickness of 1 mm, following the wall curvature of the manifold. This crack region is centered around the outlet junction where thermo-mechanical stresses typically peak.
This slight offset still captures the effects of local stress concentration, as the surrounding area remains subject to significant thermo-mechanical gradients. The choice of location offers a compromise between physical accuracy and numerical stability, enabling the use of the XFEM without compromising mesh quality. Preliminary FEM simulations confirmed that this nearby region also undergoes appreciable stress levels under operating conditions, justifying its selection for crack initiation.
The zoomed view highlights the placement strategy and delineates the region of intersection where stress localization is expected, enabling the effective simulation of crack propagation behavior.
The XFEM simulation was conducted under combined thermal and mechanical loading, using an internal pressure of ±2 MPa applied cyclically, as previously detailed. The material behavior was defined using a temperature-dependent elastoplastic constitutive law, with mechanical properties such as Young’s modulus, Poisson’s ratio, and yield strength varying with temperature, as summarized in
Table 1 and
Table 2.
6.2. Step Configuration and Numerical Stabilization
In this study, a thermo-mechanical cyclic simulation was carried out using Abaqus/Standard to analyze the plastic behavior of the exhaust manifold under variable loading conditions. A general static step with nonlinear geometry (NLGEOM = ON) was selected to account for geometric nonlinearities arising from large deformations and crack evolution, which are modeled using the XFEM.
To improve numerical stability under nonlinear loading–unloading conditions, automatic stabilization was activated. This option was applied using the “Specify damping factor” method, which introduces a small artificial damping term that dissipates energy proportionally to the strain rate. Such an approach enhances the robustness of the solution, particularly in regions susceptible to local instabilities, including crack tips or areas with sharp plasticity gradients. Following previous studies, where damping factors in the range of 1.0 × 10
−5 to 5.0 × 10
−5 were shown to ensure convergence without distorting the physical results [
35], a damping coefficient of 0.0002 was adopted in this work. This value provided stable convergence while having a negligible influence on the physical response of the structure.
6.3. STATUSXFEM Analysis
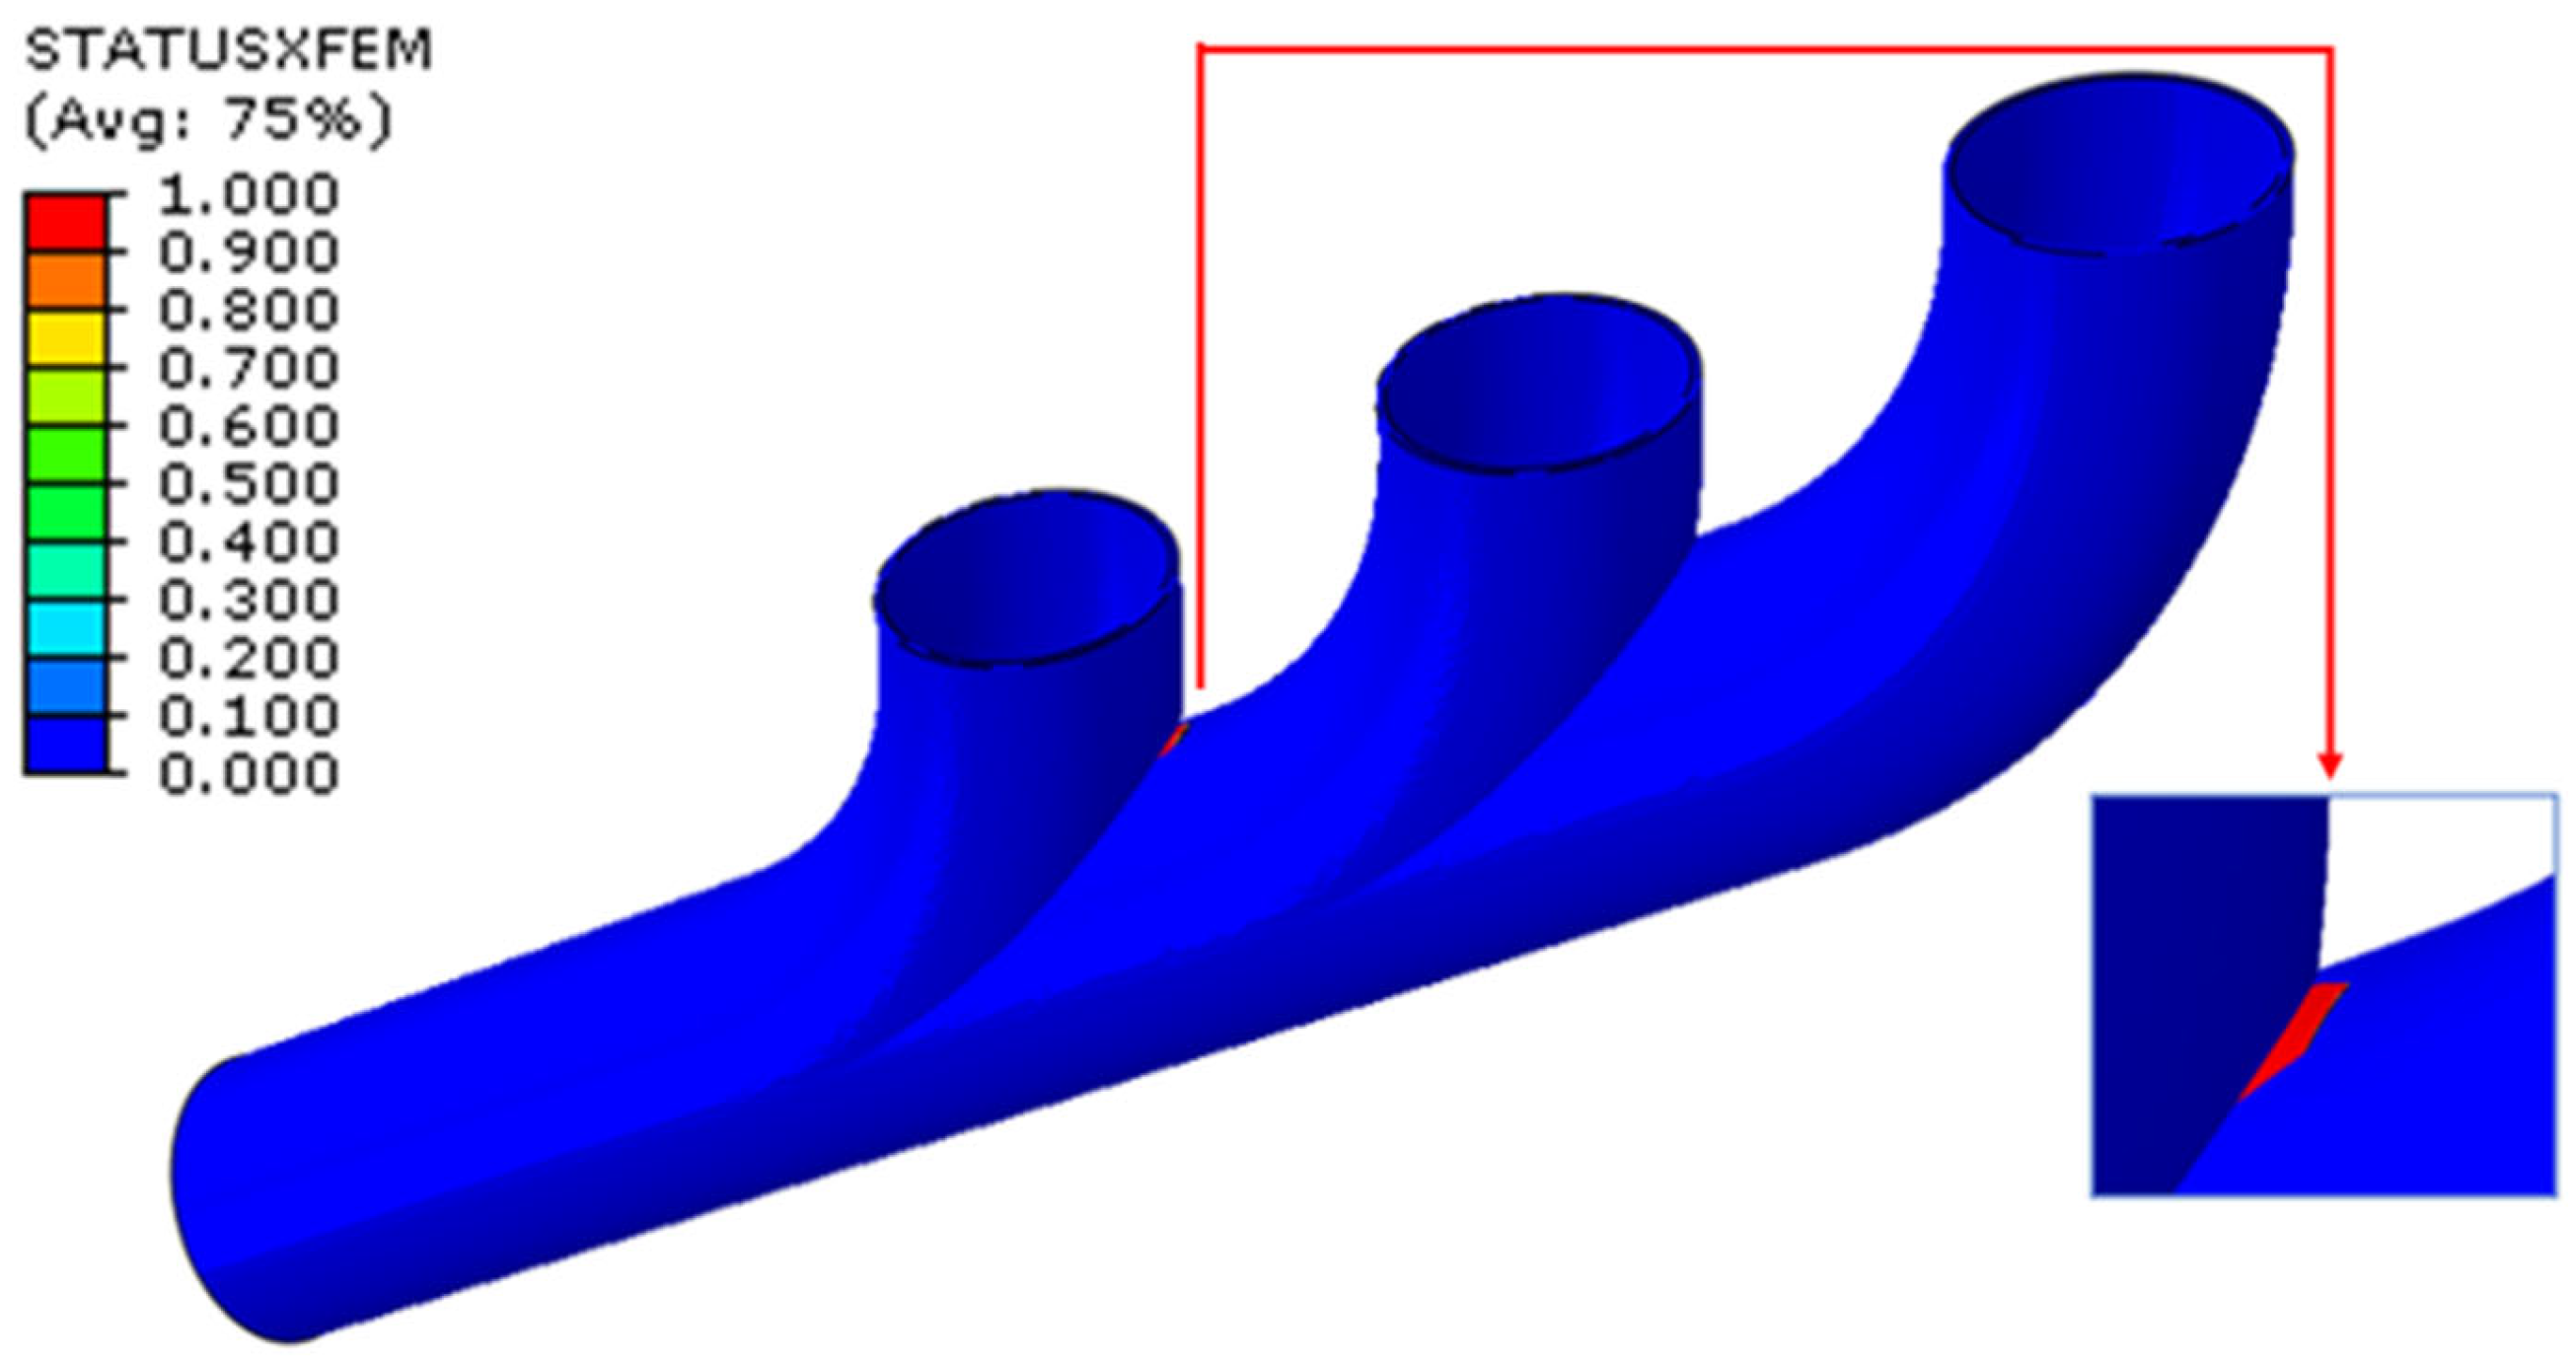
The XFEM-based simulation provides insight into the spatial evolution of damage within the exhaust manifold under thermo-mechanical loading. The variable STATUSXFEM, used as a post-processing indicator, represents the normalized damage level within enriched elements: a value of 0 indicates intact material, while a value of 1 corresponds to complete degradation. The XFEM-based representation of damage progression in the exhaust manifold geometry is shown in
Figure 13. The plotted variable, STATUSXFEM, reflects the normalized damage status in each enriched element.
In this case, the damage is localized near the initiation site of a semi-elliptical surface crack, with several elements showing intermediate damage levels, suggesting partial evolution rather than complete failure.
The zoomed-in detail reveals the progression path within the wall thickness, without full-through cracking. This demonstrates the capability of the XFEM to model crack initiation and partial propagation under thermo-mechanical loads while avoiding remeshing. These insights are crucial for assessing structural durability and anticipating failure under cyclic conditions typical of exhaust systems.
6.4. Von Mises Stress vs. Equivalent Plastic Strain Analysis
The curve shown in
Figure 14 depicts the local material response in terms of Von Mises stress versus equivalent plastic strain (PEEQ) at a point near the crack front in the exhaust manifold.
The use of PEEQ is particularly relevant in this context, as it provides a scalar measure of accumulated plastic deformation, integrating the irreversible strain energy experienced by the material under cyclic and thermo-mechanical loading. It is widely used in finite element simulations to assess plasticity-driven damage, especially in regions undergoing multiaxial loading conditions, such as near crack tips.
The observed curve represents the typical stress–strain response of a material subjected to localized loading near a crack front.
Initially, the stress rises sharply with negligible plastic strain, corresponding to the elastic regime governed by the material’s Young’s modulus. This phase is characterized by a nearly linear relationship between stress and strain, indicative of an undamaged, fully elastic response.
As plastic deformation initiates, the curve transitions into a strain-hardening regime, where the stress continues to increase with increasing plastic strain. This behavior reflects the material’s ability to undergo plastic accommodation and accumulate irreversible deformation prior to failure. The curve reaches its maximum at approximately 291 MPa for a plastic strain of about 0.008, which corresponds to the local tensile strength limit of the material under plane strain conditions.
Beyond this peak, a single, abrupt drop in stress is observed, which marks the onset of damage. This reduction is not attributed to classical material softening, but rather to the activation of damage initiation mechanisms, as defined in the material model (e.g., MAXPSCRT criterion). Once the critical stress and strain thresholds are reached, the damage evolution law, typically energy-based, begins to degrade the material stiffness progressively. The resulting loss in structural integrity leads to a rapid decrease in the stress-carrying capacity of the element, illustrating a localized failure process representative of crack propagation in ductile materials.
This drop is therefore indicative of a localized rupture event, confirming the propagation of damage or crack growth, particularly in thermo-mechanical conditions where stress concentrations and material fatigue are critical.
6.5. Crack Propagation Visualization: PHILSM and PSILSM
The contour map shown in
Figure 15 presents the contour map of the PHILSM field (level set function φ), as computed from the XFEM simulation of a semi-elliptical surface crack within the exhaust manifold structure. The PHILSM variable represents the signed distance from each point to the crack front and is used to define the position and evolution of the crack within the enriched domain. In this visualization, φ = 0 identifies the exact location of the active crack front.
The distribution of the PHILSM level set field φ displayed in
Figure 15 is shown on both the external surface (left) and internal cross-section (right) of the exhaust manifold. The PHILSM function represents the signed distance to the crack surface, with the zero-level set (φ = 0) identifying the active crack front.
The external view illustrates the surface crack propagation, while the internal view reveals how the crack extends through the wall thickness. This dual representation confirms the 3D nature of the crack captured by XFEM and ensures that crack evolution is accurately simulated both on the surface and within the internal material volume.
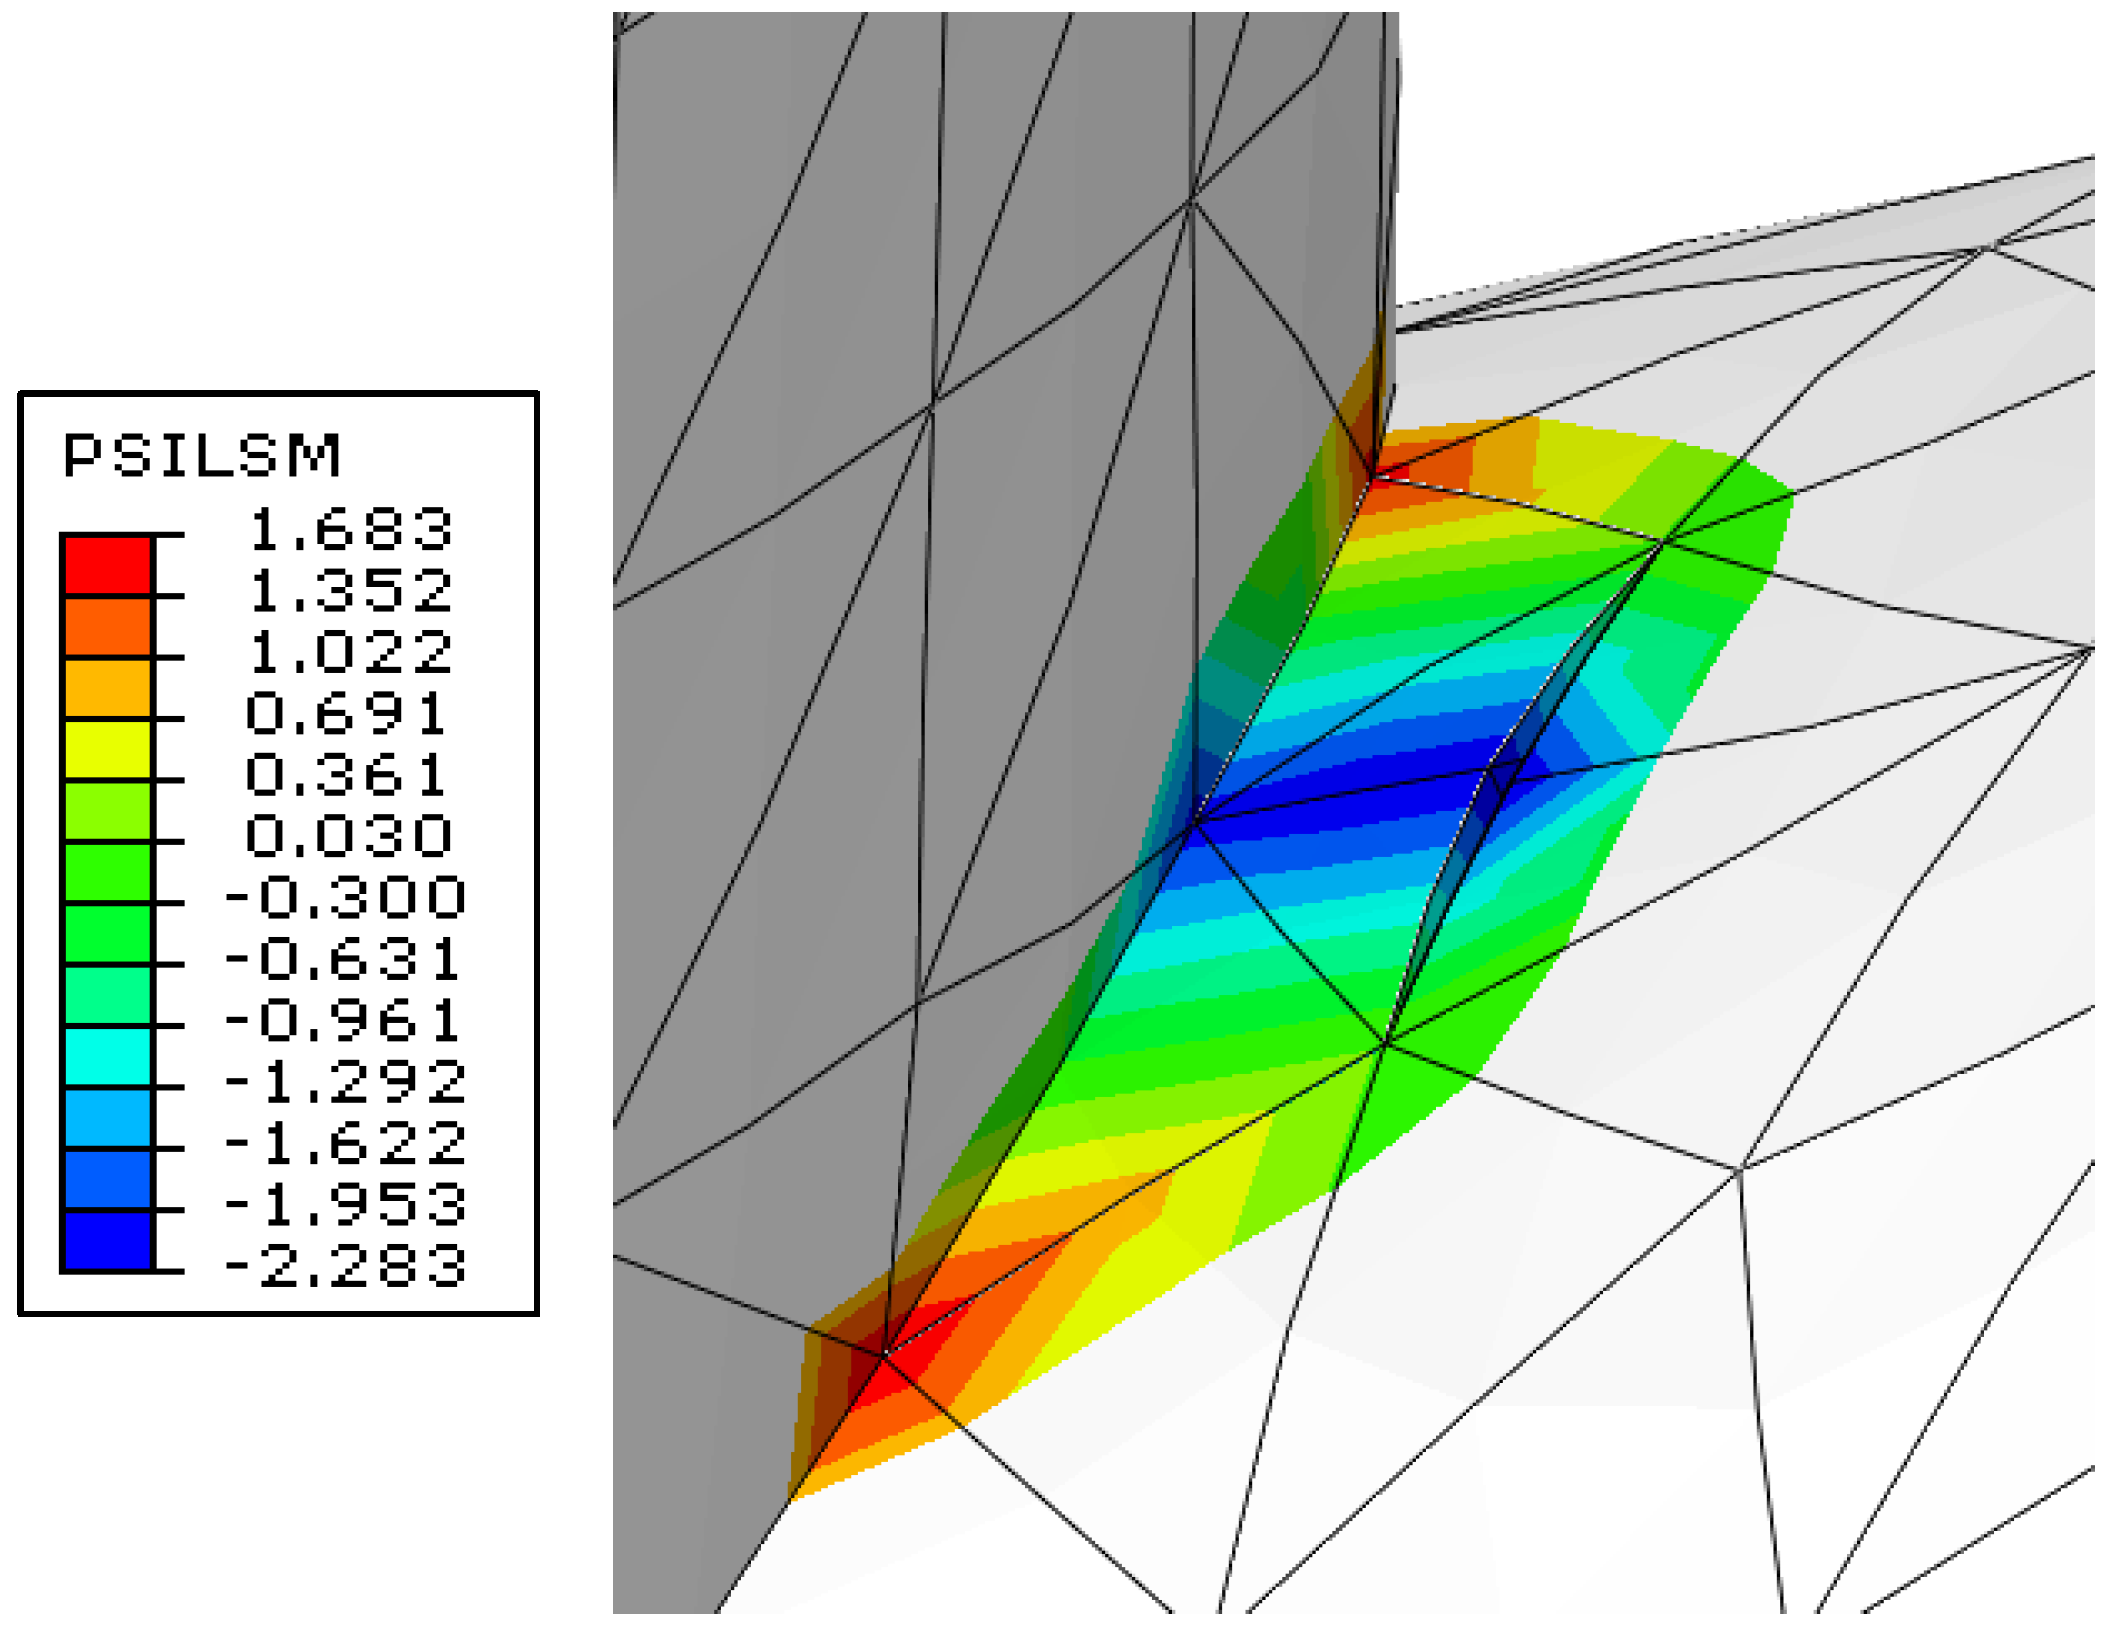
The level set field ψ (PSILSM) as presented in
Figure 16 serves to display the distribution obtained from the XFEM simulation, which represents the signed distance to the crack surface (or crack plane) across the enriched region of the exhaust manifold. Unlike PHILSM, which tracks the front of the crack, PSILSM is used to define the geometric location of the entire crack surface, making it essential for accurately embedding the discontinuity in the finite element domain without the need for remeshing.
The values of the PSILSM field in this simulation range from a minimum of −2.283 to a maximum of +1.683, as indicated by the legend. The zero-level set (ψ = 0) defines the crack plane itself and is typically situated where the color transitions from green to orange in the figure. Nodes with negative ψ values (in shades of blue to green) are located below or behind the crack surface, while positive values (yellow to red) correspond to points above or in front of the crack surface, depending on the orientation of the enrichment.
This smooth gradient across the crack surface shows that the XFEM enrichment has been correctly applied and that the crack has been successfully embedded in the model geometry, without the need for mesh modification. It also highlights the capacity of the level set method to describe cracks in curved and complex surfaces, such as those encountered in exhaust manifold systems subject to thermo-mechanical fatigue.
In terms of physical interpretation, the PSILSM field defines the local discontinuity surface, which is internally used by Abaqus to construct the Heaviside enrichment functions. These enrichment functions allow the displacement field to be split across the crack, enabling accurate representation of displacement jumps, stress redistribution, and potential crack opening modes.
Together with the PHILSM field (which localizes the crack front), the PSILSM field ensures a complete and mathematically robust definition of the crack geometry. This enables the precise calculation of fracture parameters such as the stress intensity factors (KI, KII, and KIII), J-integral, and crack growth direction. Accurate representation of ψ is particularly important when evaluating crack propagation paths or assessing interaction between crack surfaces and applied load conditions.
This figure, therefore, confirms the correct spatial embedding of the crack plane within the model and forms the geometric foundation for subsequent fracture mechanics analysis.
In this study, crack initiation is governed by the Maximum Principal Stress Criterion (MAXPS), which is commonly used in fracture mechanics to predict the onset of brittle or quasi-brittle failure.
The criterion postulates that damage initiates when the maximum principal stress σ1 at a given material point reaches or exceeds a predefined critical value , which is either determined experimentally or assumed based on material standards; if then damage initiates.
The use of σ1, rather than σ2 or σ3, is justified by the fact that crack initiation is primarily driven by the dominant tensile stress, especially under thermo-mechanical loading conditions such as those found in exhaust manifolds. In this context, σ1 captures the most critical normal stress acting on potential crack planes, which governs Mode I crack opening. Conversely, σ2 or σ3 generally represent lower or compressive stresses and have a lesser role in driving tensile damage.
This criterion is particularly suitable for thermo-mechanically loaded components like exhaust manifolds, where tensile stresses dominate due to thermal gradients and internal pressure.
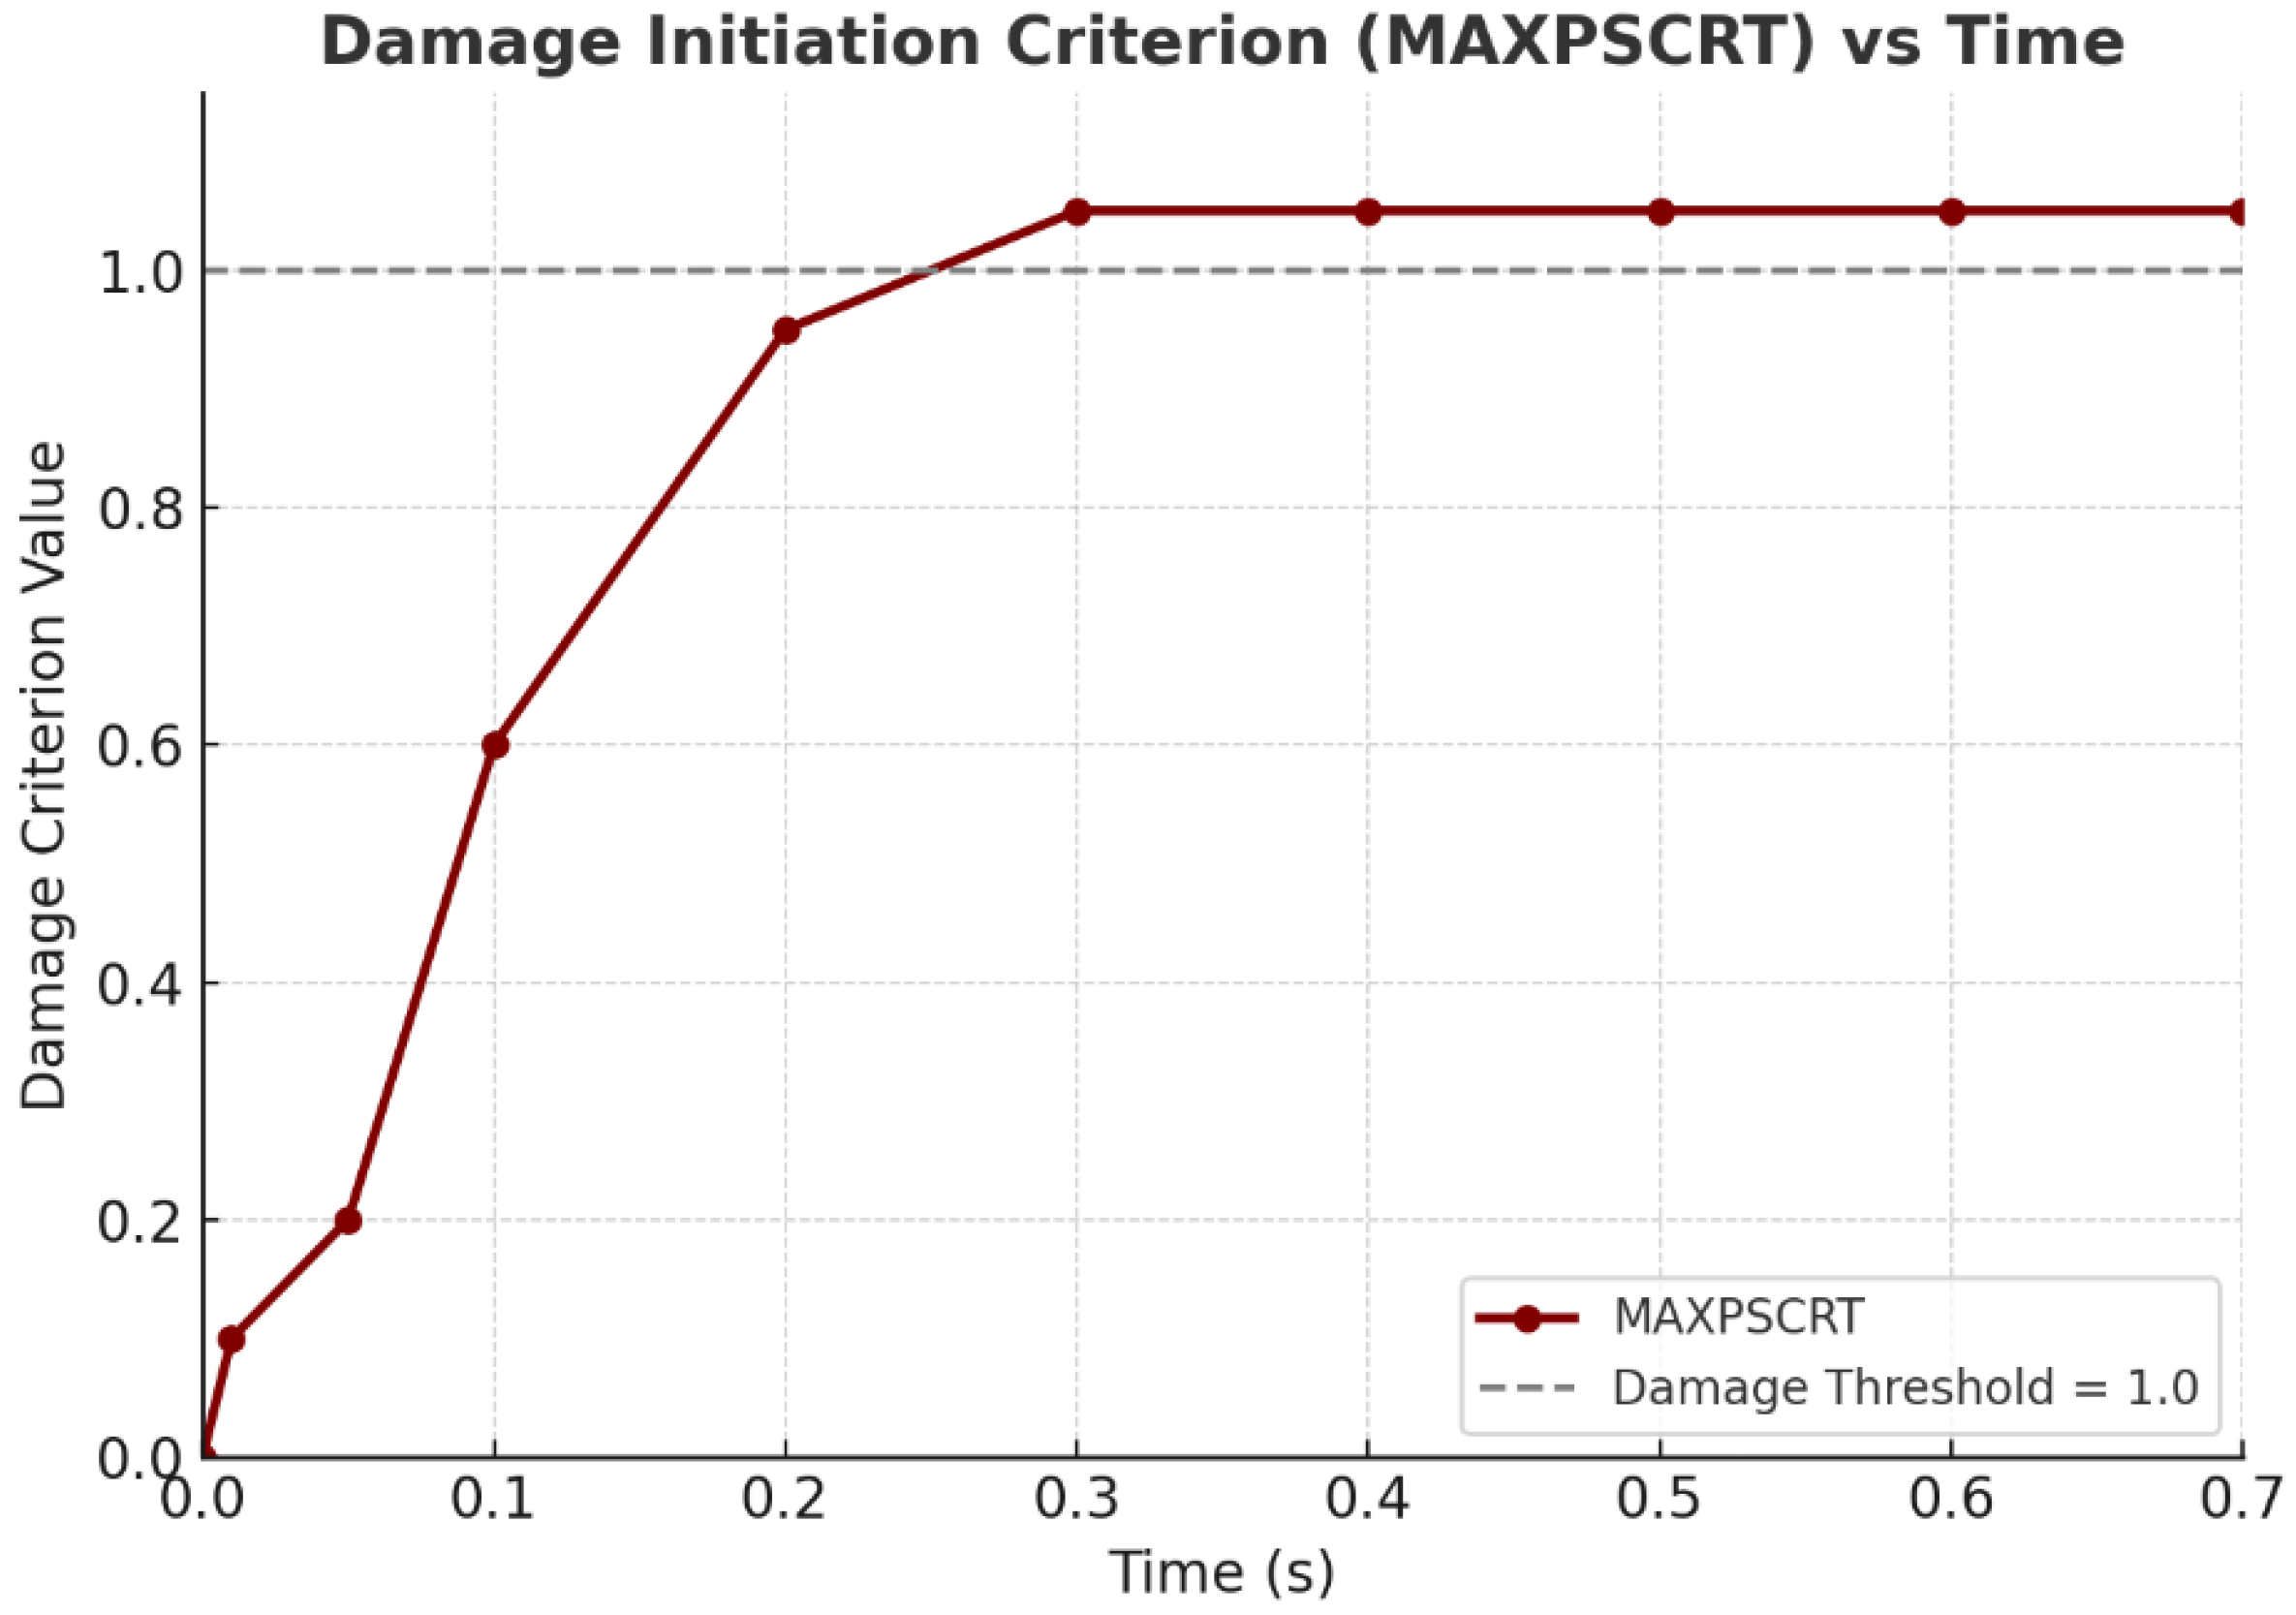
In Abaqus, this condition is implemented through the internal scalar variable MAXPSCRT, defined as the ratio
This normalization facilitates tracking of the damage threshold in post-processing:
When MAXPSCRT < 1, the material remains intact.
When MAXPSCRT ≥ 1, damage is considered to initiate at that location.
In this work, the critical value was set to
= 350 MPa, and was selected based on the mechanical properties of Austenitic Stainless Steel 321, which exhibits an ultimate tensile strength (UTS) of approximately 620 MPa and a yield strength of around 240–250 MPa, as reported in material databases and the literature [
36]. This choice represents a conservative threshold, positioned between the yield point and UTS, to anticipate early-stage damage under thermo-mechanical loading before plastic collapse occurs. It is also consistent with fatigue design practices, where critical stresses are typically defined at 40–60% of the UTS to ensure safe crack initiation criteria in cyclic loading scenarios.
To accurately simulate mixed-mode fractures, Benzeggagh–Kenane (BK) mixed-mode behavior was employed [
37,
38]. This widely adopted formulation calculates the effective fracture energy G
c under combined loading using the following expression:
where
represent the energy release rates for normal and shear modes, and
η is the BK power coefficient, set here to 1.5. This allows for a gradual and physically consistent transition between tensile- and shear-driven fracture mechanisms, which is particularly important for ductile metals subjected to thermo-mechanical loading.
The curve in
Figure 17 shows a progressive increase during the early loading phase, reaching the normalized threshold value of 1.0 at approximately 0.25 s. This crossing indicates that the critical stress condition for damage onset has been satisfied, and crack initiation is therefore triggered according to the Maximum Principal Stress Criterion. Following this point, the criterion exceeds unity and remains stable, confirming that the stress level remains in the damage-active regime. This sustained value suggests that the surrounding material continues to experience critical tensile stress, which supports the progression of damage and potential crack growth.
The stability of the curve after initiation further suggests that the structural configuration and loading maintain a persistent high-stress state, making the region highly susceptible to fracture propagation. These results validate the appropriateness of the selected initiation criterion and highlight the effectiveness of the XFEM framework in capturing crack initiation phenomena under complex loading conditions.
7. Fatigue Life Estimation Based on XFEM Stress Results
To evaluate the durability of the exhaust manifold under realistic service conditions, a fatigue life assessment was performed using the stress and strain fields obtained from the XFEM simulation. The component is subjected to cyclic thermal and pressure loads, leading to repeated thermo-mechanical stress cycles, since the local maximum stress at the crack front (σmax ≈ 165.6 MPa) approaches the temperature-dependent yield strength of AISI 321 stainless steel (σy (700 °C) ≈ 196 MPa).
Consequently, a strain–life methodology based on the Smith–Watson–Topper (SWT) parameter was adopted, which is recommended in the literature for cases where mean stress effects and local plasticity must be considered, and the local elastic–plastic strain amplitude was computed from the XFEM stress history using the cyclic Ramberg–Osgood relationship [
39]:
where
E(T) is the temperature-dependent Young’s modulus,
K′ represents the cyclic strength coefficient, which quantifies the material’s resistance to cyclic plastic deformation, and n′ is the cyclic strain-hardening exponent, describing the degree of cyclic hardening during repeated loading. For austenitic stainless steels at an elevated temperature, conservative values of K′ = 600 MPa and n′ = 0.15 were adopted, consistent with the estimation method from Marohnić et al. [
40] for high-alloy steels.
The SWT parameter was then calculated using Equation (9), where
, b are the Basquin parameters for AISI 321 obtained from Sun et al. [
41] at 350 °C. Since experimental fatigue data for AISI 321 at 700 °C are scarce, these parameters were conservatively reduced by 30% to reflect the degradation of fatigue strength at elevated temperatures. Similarly, the Coffin–Manson parameters
and c were taken from Li et al. [
42] (2020) for uncoated AISI 321, providing a realistic description of the cyclic plastic strain component under high-temperature conditions.
The input stress data used for the fatigue life prediction were directly extracted from the XFEM simulation results. The maximum cyclic Von Mises stresses were recorded at eight integration points surrounding the predefined semi-elliptical surface crack. Among these, the critical hotspot exhibited a peak stress of σmax = 165.6 MPa, with a corresponding minimum stress close to zero during unloading, leading to a stress ratio of R ≈ 0. For a conservative assessment, two scenarios were considered:
- i.
quasi-pulsating loading case (R ≈ 0) where the alternating stress amplitude is taken as
- ii.
a fully reversed case (R = −1), where represents the most severe possible loading condition.
The results are summarized in
Table 10. They indicate that, even when considering local plasticity and mean stress effects, the predicted fatigue lives remain in the range of 3.8 × 10
8 cycles (pulsating load) to 6.7 × 10
7 cycles (fully reversed), which confirms that the component is operating in the high-cycle fatigue regime.
The fatigue life predictions obtained using the SWT parameter highlight the strong sensitivity of the exhaust manifold to the imposed loading conditions:
With a stress amplitude of 82.8 MPa, the corresponding strain amplitude is very low (6.92 × 10⁻⁴), which keeps the SWT parameter at a moderate value (0.115). This leads to a predicted fatigue life of ~3.8 × 10⁸ cycles, confirming that under mild loading with low mean stress effects, the component is able to sustain a very high number of cycles before failure.
In this severe loading scenario, the stress amplitude reaches 165.6 MPa, nearly approaching the high-temperature yield strength of AISI 321. The local strain amplitude increases significantly (1.57 × 10⁻³), to almost three times higher than in the pulsating case, and the SWT parameter doubles (0.260). As a result, the fatigue life drastically decreases to ~6.7 × 10⁷ cycles, which still corresponds to high-cycle fatigue, but clearly indicates that reversed loading accelerates damage initiation and propagation.
The predicted fatigue life under fully reversed loading is reduced by approximately 82% compared to the quasi-pulsating case. This underlines the critical role of the stress ratio in thermo-mechanical fatigue assessments and emphasizes that the most conservative design should always consider the fully reversed scenario as the limiting case.
Although these results are purely numerical, the predicted fatigue lives are consistent with ranges reported in the literature for thermo-mechanical fatigue of austenitic stainless steels, which increases the confidence in the proposed methodology.
These results not only validate the accuracy of the numerical model, but also support the identification of critical initiation zones, informing future efforts in design optimization, material selection, and fatigue life extension strategies.
To complement the stress-based fatigue life analysis,
Figure 18 presents the evolution of plastic dissipation energy (ALLPD) over time for the entire model. This energy reflects the cumulative plastic work dissipated due to irreversible deformation, which is a relevant indicator in thermo-mechanical fatigue contexts where plasticity may significantly influence crack initiation.
As shown in the curve, plastic dissipation begins sharply around t ≈ 0.14 s, indicating the onset of plastic deformation in the material. From that point, the dissipation rapidly increases and then stabilizes near 80.76, suggesting that the majority of plastic work occurs early in the loading cycle, likely corresponding to a localized accumulation at the crack front.
The integration of this energy-based perspective enriches the fatigue life estimation by confirming the transition from a purely elastic response to elastic–plastic behavior. This aligns with the observed stress amplitude range (164–165.6 MPa), which approaches or exceeds the yield strength of austenitic stainless steel.
Moreover, literature such as Ashouri [
1] has shown that plastic dissipation per cycle can be correlated with fatigue life predictions, especially under low-cycle fatigue (LCF) and thermo-mechanical fatigue conditions. In this study, even though the XFEM approach does not directly compute fatigue damage via energy criteria, the evolution of plastic dissipation validates the stress-based life assessment and supports the presence of early damage localization.
8. Conclusions
This study presented a comprehensive structural and fracture analysis of an automotive exhaust manifold under realistic thermo-mechanical loading. A combined FEM–XFEM framework was implemented to first identify critical stress zones and then simulate crack initiation and growth without remeshing.
The FEM results highlighted significant stress concentration near the collector junction, justifying the placement of a semi-elliptical surface crack in this region. The hybrid mesh ensured convergence of the stress, strain, and J-integral results, providing reliable fracture parameters. The computed Mode I stress intensity factors (KI) remained below the temperature-dependent fracture toughness range of AISI 321 (55–75 MPa√m at 700 °C), confirming that unstable crack growth was not triggered under the applied loads.
To overcome the limitations of a purely stress-based approach, fatigue life was reassessed using a strain–life methodology based on the Smith–Watson–Topper (SWT) parameter. This allowed proper consideration of mean stress effects and cyclic plasticity. The recalculated fatigue lives ranged from 6.7 × 10⁷ cycles (fully reversed) to 3.8 × 10⁸ cycles (quasi-pulsating), consistent with the high-cycle fatigue regime reported in the literature for AISI 321.
Overall, the results demonstrate that the presence of a surface crack leads to a substantial reduction in durability, emphasizing the need for accurate fracture modeling in exhaust manifold design. The proposed unified FEM–XFEM methodology, supported by temperature-dependent material data and an energy-based fatigue assessment, provides a robust and physically consistent framework for predicting failure initiation and guiding design optimization under realistic engine operating conditions.
Future work will focus on experimental validation of the numerical predictions and thermo-mechanical fatigue testing of AISI 321 manifolds to further strengthen the correlation between simulation results and real-world performance.
