1. Introduction
The study of vibrotactile perception, which has boomed in recent years with the development of haptic technologies for interactions with different digital devices such as video games, is also gaining much interest in musical perception [
1]. The aim of this work is to develop an augmented experience that enhances music immersion and could provide valuable support for people with hearing impairments, providing a sensory alternative through tactile vibrations [
2].
Indeed, the tactile and auditory senses closely participate in perceiving mechanical vibrations. Both senses have receptors sensitive to pressure changes and can process vibrations. For example, low-frequency tactile vibrations have been shown to activate both the tactile and auditory systems [
3,
4], and the simultaneous presentation of auditory and tactile vibrations modifies the perception of auditory or tactile frequencies in isolation [
5,
6]. The tactile perception of vibrations is based on the sensitivity of very quickly adapting skin mechanoreceptors, mainly Pacinian corpuscles, which are activated with frequencies between 50 and 1000 Hz, with maximum sensitivity in 200–400 Hz and with minimal skin deformations of 1 Amstrong [
7]. Although the neurological mechanisms that encode information about tactile vibration are not yet clearly identified, some authors consider that mechanoreceptors in the skin encode vibrotactile information similarly to the encoding of sound waves in the cochlea of the auditory system. For example, a complex tone would be decomposed into its component frequencies, contributing to a tactile perception of the timbre based on the intensities of each band [
8,
9]. The brain would then process the information of both vibrotactile and auditory channels along a common central neural pathway [
10], with characteristics such as rhythm or pitch variations processed through a perceptual mechanism specific to each characteristic [
11]. This auditory–tactile integration would occur early and close to primary sensory areas [
10].
Generally, studies on vibrotactile musical perception are based on the presentation of vibrations in the subjects’ fingertips, the palms of their hands, or the soles of their feet, when they refer to pitch perception [
1,
12,
13]. For a global musical experience, studies are based on vibrating devices such as jackets, chairs, or backrests [
1]. Initially, the studies focused on the perception of rhythm, showing that a tactile vibration reproducing a sound vibration is very satisfactory for following the rhythm, with a quality of experience very similar to the auditory one, and enables people with hearing loss to play in musical groups and synchronize correctly with the rest of the group [
13,
14,
15]. Regarding timbre, it has been shown that it is possible to discriminate different waveforms [
9] or musical timbres presented vibrotactically [
8]. The authors of [
16] showed that tactile input could influence timbre perception, suggesting that incorporating tactile stimulation and auditory signals could have important implications for deaf or hard-of-hearing people.
In [
12], the authors studied the discrimination of the tones of the Western musical scale by applying tactile vibrations with the pure frequency of each tone to the fingertips and soles of the feet of the subjects. These areas have a higher density of Pacinian receptors responsible for detecting vibratory stimuli [
17]. The results of their research show that the range of musical notes that can be considered for the vibrotactile presentation of music includes from note C1 (32.70 Hz) to note G5 (783.99 Hz) [
12,
13]. In [
13], the same authors studied the relative pitch discrimination of two notes, applying tactile vibrations on the fingertip over a range of notes from C3 to B4, using intervals up to 12 semitones. The results showed that larger pitch intervals were easier to identify correctly than smaller intervals (for intervals of 4 to 12 semitones, the success rates were >70% correct, while for intervals smaller than 3 semitones, the success rate was <60%). This result is consistent with [
18], which shows that the absolute just noticeable difference for vibrotactile frequency increases as the frequency rises, from approximately 9.7 Hz at 50 Hz to 27.2 Hz at 200 Hz.
Based on this potential for vibrotactile perception of musical parameters, a new field of research based on the multimodal experience of music has been developing in recent years. The objective is no longer to listen to the music but to “feel” the music, to facilitate access to music for people with hearing loss and to offer the general public a richer music experience. Different wearable devices, such as bracelets, jackets, or belts, aim to map the acoustic musical signal to a vibrotactile signal [
1]. The challenge in this type of device is how to effectively map musical parameters (pitch, rhythm, timbre, etc.) to a vibrotactile pattern. As mentioned, rhythm is the more accessible parameter to transmit, but efforts to transmit tone do not achieve good results and generally generate sensations of indeterminate vibration [
19]. For example, the harmonics of a tone can generate a tingling sensation when translated into tactile vibration [
20]. Another approach frequently used for transmitting pitch is to encode pitch information in a spatial tactile dimension by applying different frequency bands to different areas of the skin with multiple actuators [
1,
21,
22,
23,
24].
In this study, the authors aimed to approach the problem of vibrotactile music perception, exploring the perception of basic musical building blocks in Western music. Consonant and dissonant tone relationships are essential components of Western tonal music, which continue to dominate in concert halls and popular music [
25]. Consonant and dissonant intervals are well-defined in Western tonal music theory: a consonant musical interval produces a sensation of rest, and a dissonant musical interval produces a feeling of sound tension. Examples of consonant intervals in the context of tonal music theory are the intervals of the octave (for example, C3–C4), the perfect fifth (for example, C3–G3), and the perfect fourth (for example, C3–F3). Dissonant intervals include the intervals of the second (for example, C2–D2) and the seventh (for example, D2–C3), both major and minor. The origin of this preference for consonant intervals, which is already observed at very early ages [
26], is the subject of study at a neurobiological level based on EEG recordings and functional imaging [
25]. Consonant intervals have many common harmonics and synchronously activate more nerve fibers in the auditory system than dissonant intervals. The latter have few common harmonics and cause unsynchronized activations or interference, which can give rise to annoying sound sensations. The authors of [
25] compiled different studies showing that this synchronized neuronal activity extends to the pitch processing mechanisms, so the origin of the preference for consonant intervals would be in this low-level sensory processing. Another characteristic of music perception is the immediate recognition of the emotional tone of a musical excerpt, occurring in less than two seconds, even with a simple chord [
27,
28]. In addition to this neurobiological tendency, studies show that training enhances music chord discrimination. Musicians had a greater facility in chord discrimination in Western music than non-professionals [
29,
30] and are particularly sensitive to dissonance [
31].
In [
32], the author studied superimposed vibrations at different frequency ranges to find appropriate vibrotactile stimuli for digital devices. The vibrations emulated notes with a fundamental frequency and some harmonics. Participants perceived the pairs of tactile vibrations that coincide with a perfect fifth or fourth separated by an octave as more consonant.
We present here an experimental work based on the central hypothesis that consonant and dissonant musical intervals can be perceived at the tactile level in a similar way they are perceived at the auditory level, as long as the tactile channel’s perceptual conditions are considered, for example, using tactile vibrations, preferably in the range C1–G5 established by [
12,
13], and intervals in the range of 4 to 12 semitones, as they are better perceived according to [
13].
Devices that can generate a very accurate vibration must be used, as deviations of a few hertz in the tone frequency can change the character of the interval. We consider musical segments of 2 s, which is enough time to perceive the emotional tonality of the chords [
28], assuming that this includes the perception of dissonance and consonance. This duration is also suitable for the vibrotactile presentation as the Pacinian corpuscles adapt very quickly, responding to changes in the stimulus, not to its sustained presence [
7].
The remainder of this paper is organised as follows:
Section 2 describes the materials and methods of the study,
Section 3 analyses the obtained results,
Section 4 presents a discussion on these results, and finally,
Section 5 offers the conclusions and future research directions.
2. Materials and Methods
2.1. Participants
A total of 30 participants were recruited, 10 females and 20 males, aged between 24 and 65 (M = 38.7, SD = 12.86), 10% with a high school degree and 90% with a college degree.
For musical knowledge, two levels were specified:
A total of 22 participants (73.3%) reported being Level 1, and they will be referred to as Group Level 1, and 8 participants (26.7%) reported being Level 2, and they will be referred to as Group Level 2.
All participants were informed of the study’s objective and general procedure. They signed an informed consent form approved by the Bioethical Committee of the Carlos III University of Madrid, approved on 11 April of 2024, under ID document: S65bbiCnHT. They filled out a survey concerning demographic information, level of studies, and musical knowledge.
Table 1 summarises the characteristics of the participants and levels.
2.2. Materials
2.2.1. Stimuli
A total of 28 samples of two-second length were generated using MuseScore free software, set to grand piano timbre. Each sample contained an interval of two notes played simultaneously for 2 s. The number of intervals was limited to 28 intervals, as the perception threshold for vibration increases faster than the auditory threshold over time due to prolonged stimulation [
33].
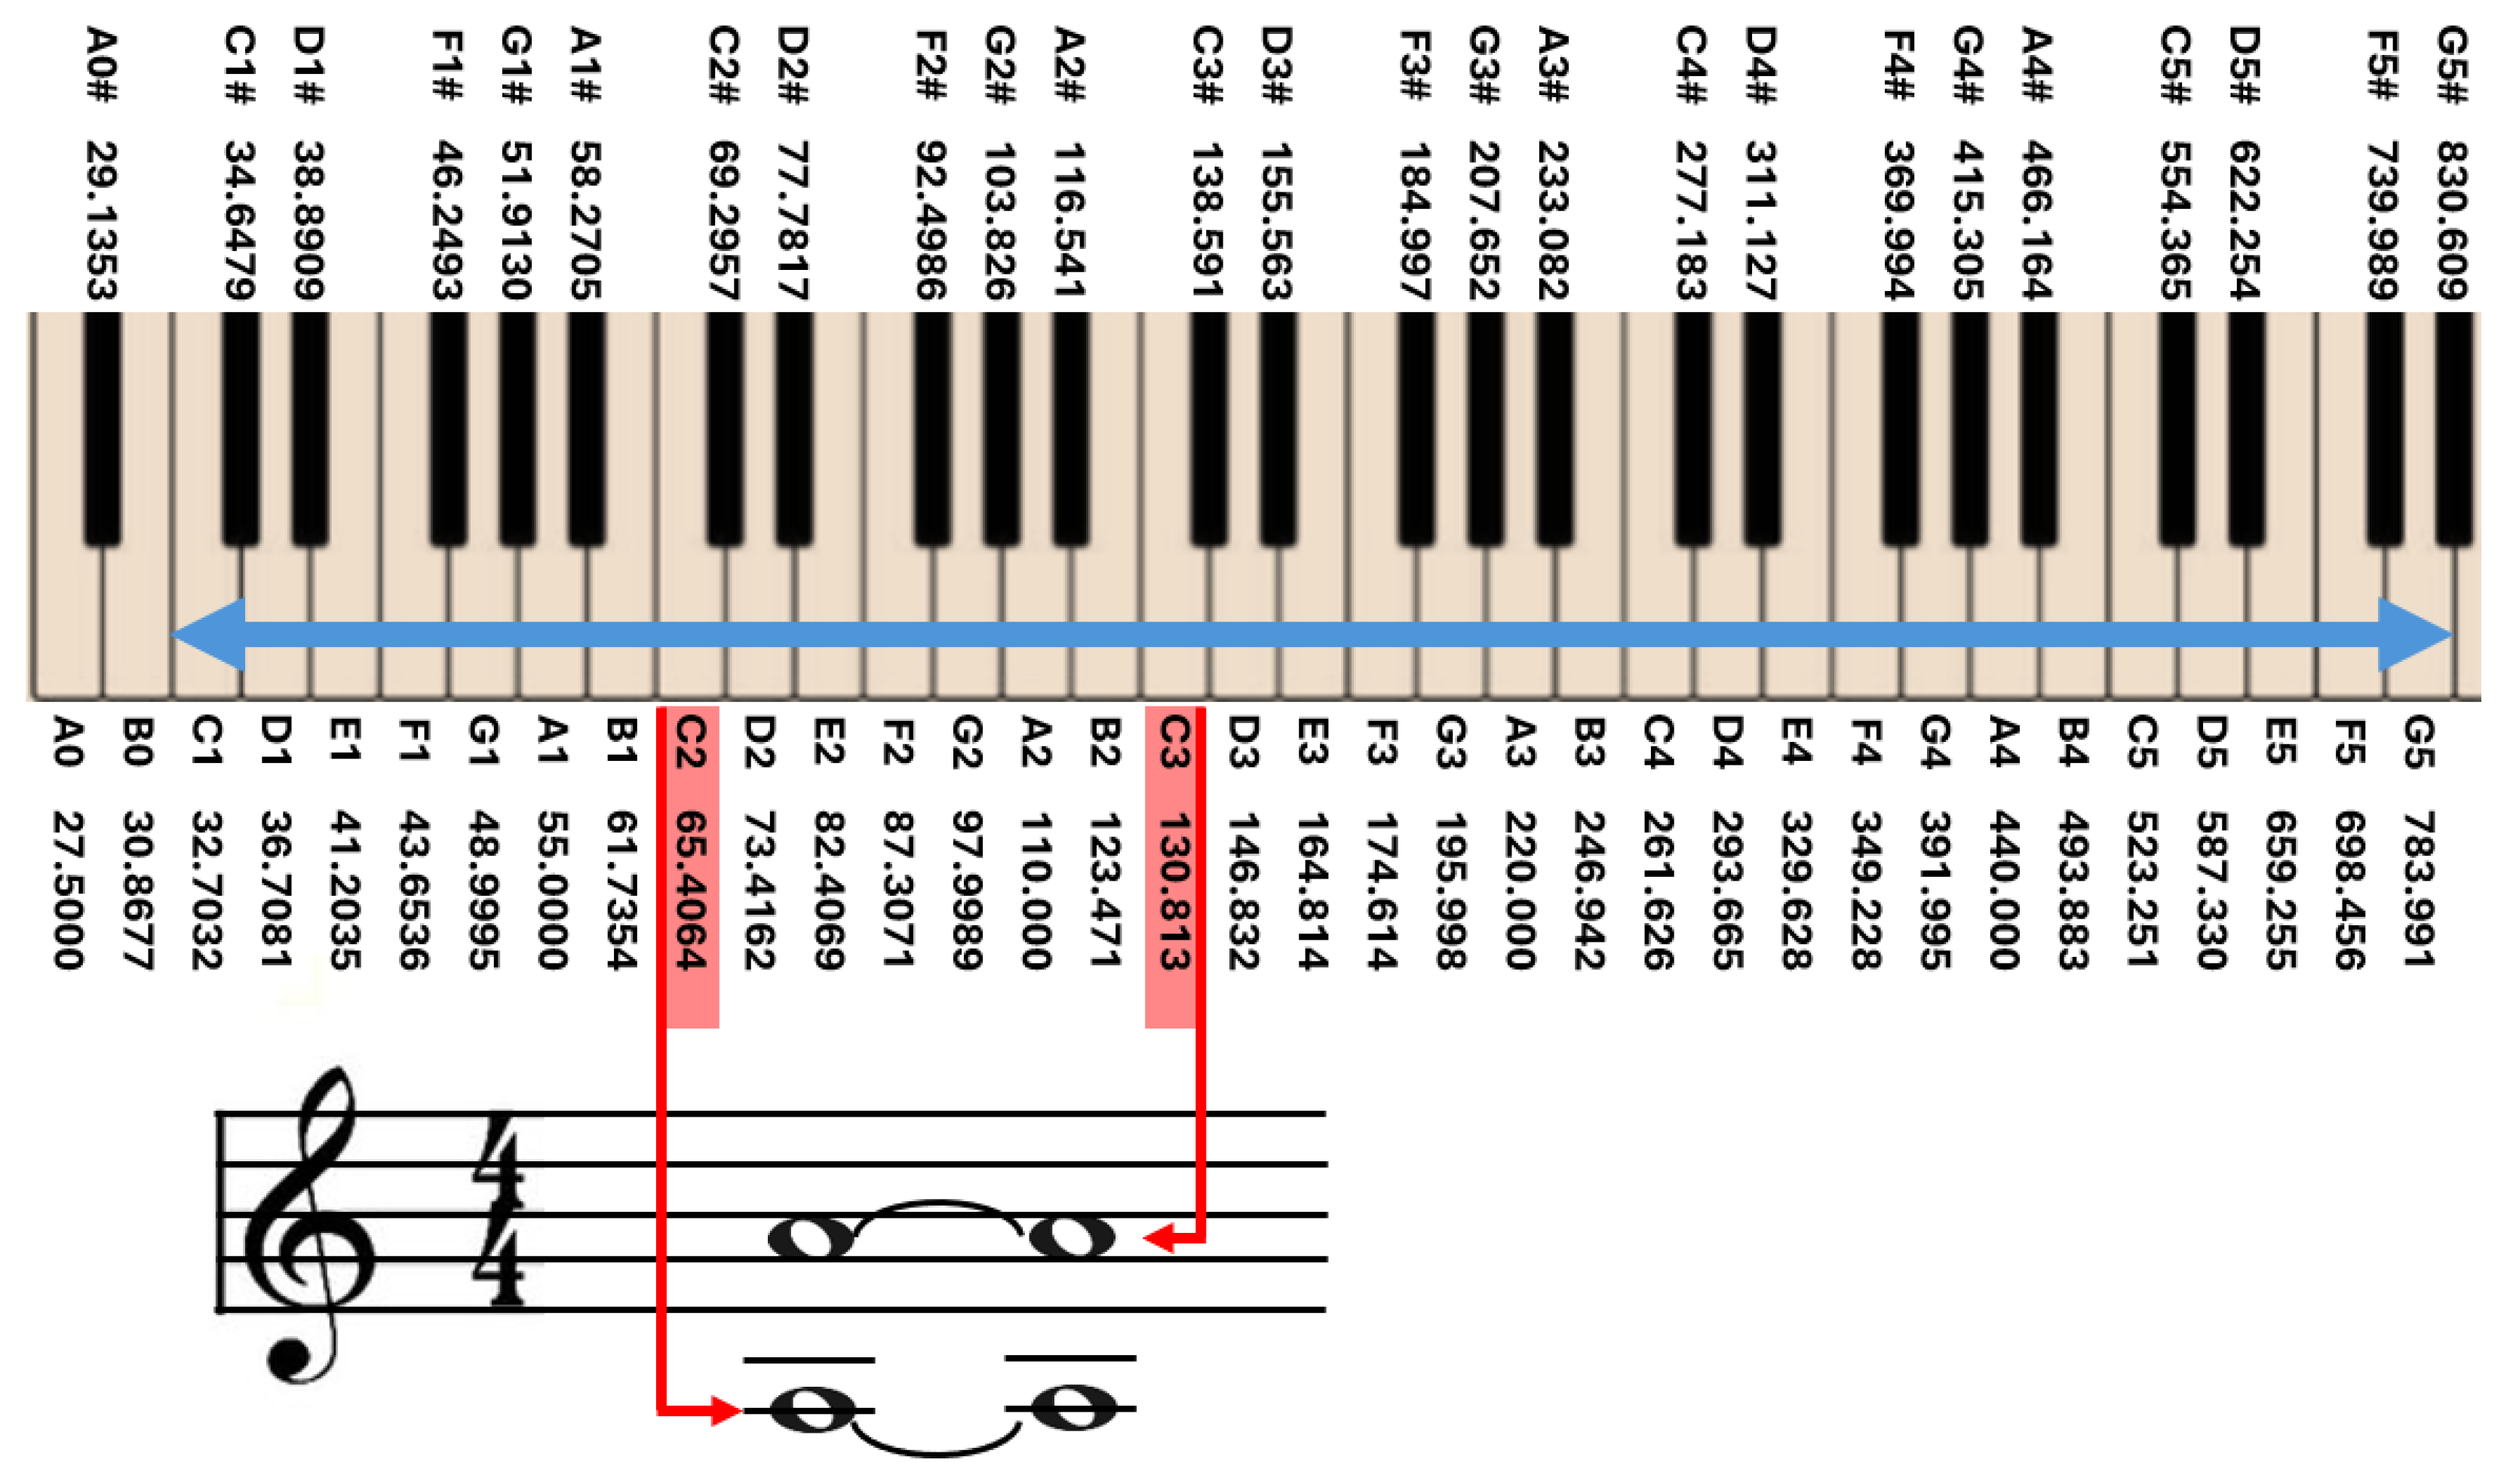
Figure 1 shows an example of the musical excerpts used to generate the intervals with MuseScore software. A total of 14 intervals were consonant, and 14 were dissonant intervals, as shown in
Table 2.
For the consonant intervals, perfect octave intervals (12 semitones), perfect fourth intervals (5 semitones), and perfect fifth intervals (7 semitones) were chosen, as they are considered perfectly consonant from the point of view of music theory. Some compound intervals, fifth intervals plus an octave (19 semitones), were also included to see if more distance than 12 semitones (the maximum interval distance studied in [
13]) between the two notes of the interval facilitated perception, as suggested by the study [
32]. From the point of view of tonal music theory, adding an octave does not alter the character of the interval.
The second and seventh intervals were chosen for the dissonant intervals. All second intervals were compound intervals, and an octave was added between the two notes of the interval, according to [
13] studies, which found many limitations in the perceptions for intervals smaller than three semitones (minor third).
The volume of the sample set was normalised for loudness using Audacity software to ensure that the maximum volume of the exported audio files was consistent. This allows the loudest point in each of the 28 samples to reach the highest possible level without distortion while maintaining the dynamic range and overall sound quality. The frequency range was between 65.40 (C2) and 783.991 Hz (G5).
2.2.2. Hardware
A laptop with an integrated sound card was used for playing back and system synchronisation. Speakers were used for auditory stimulation.
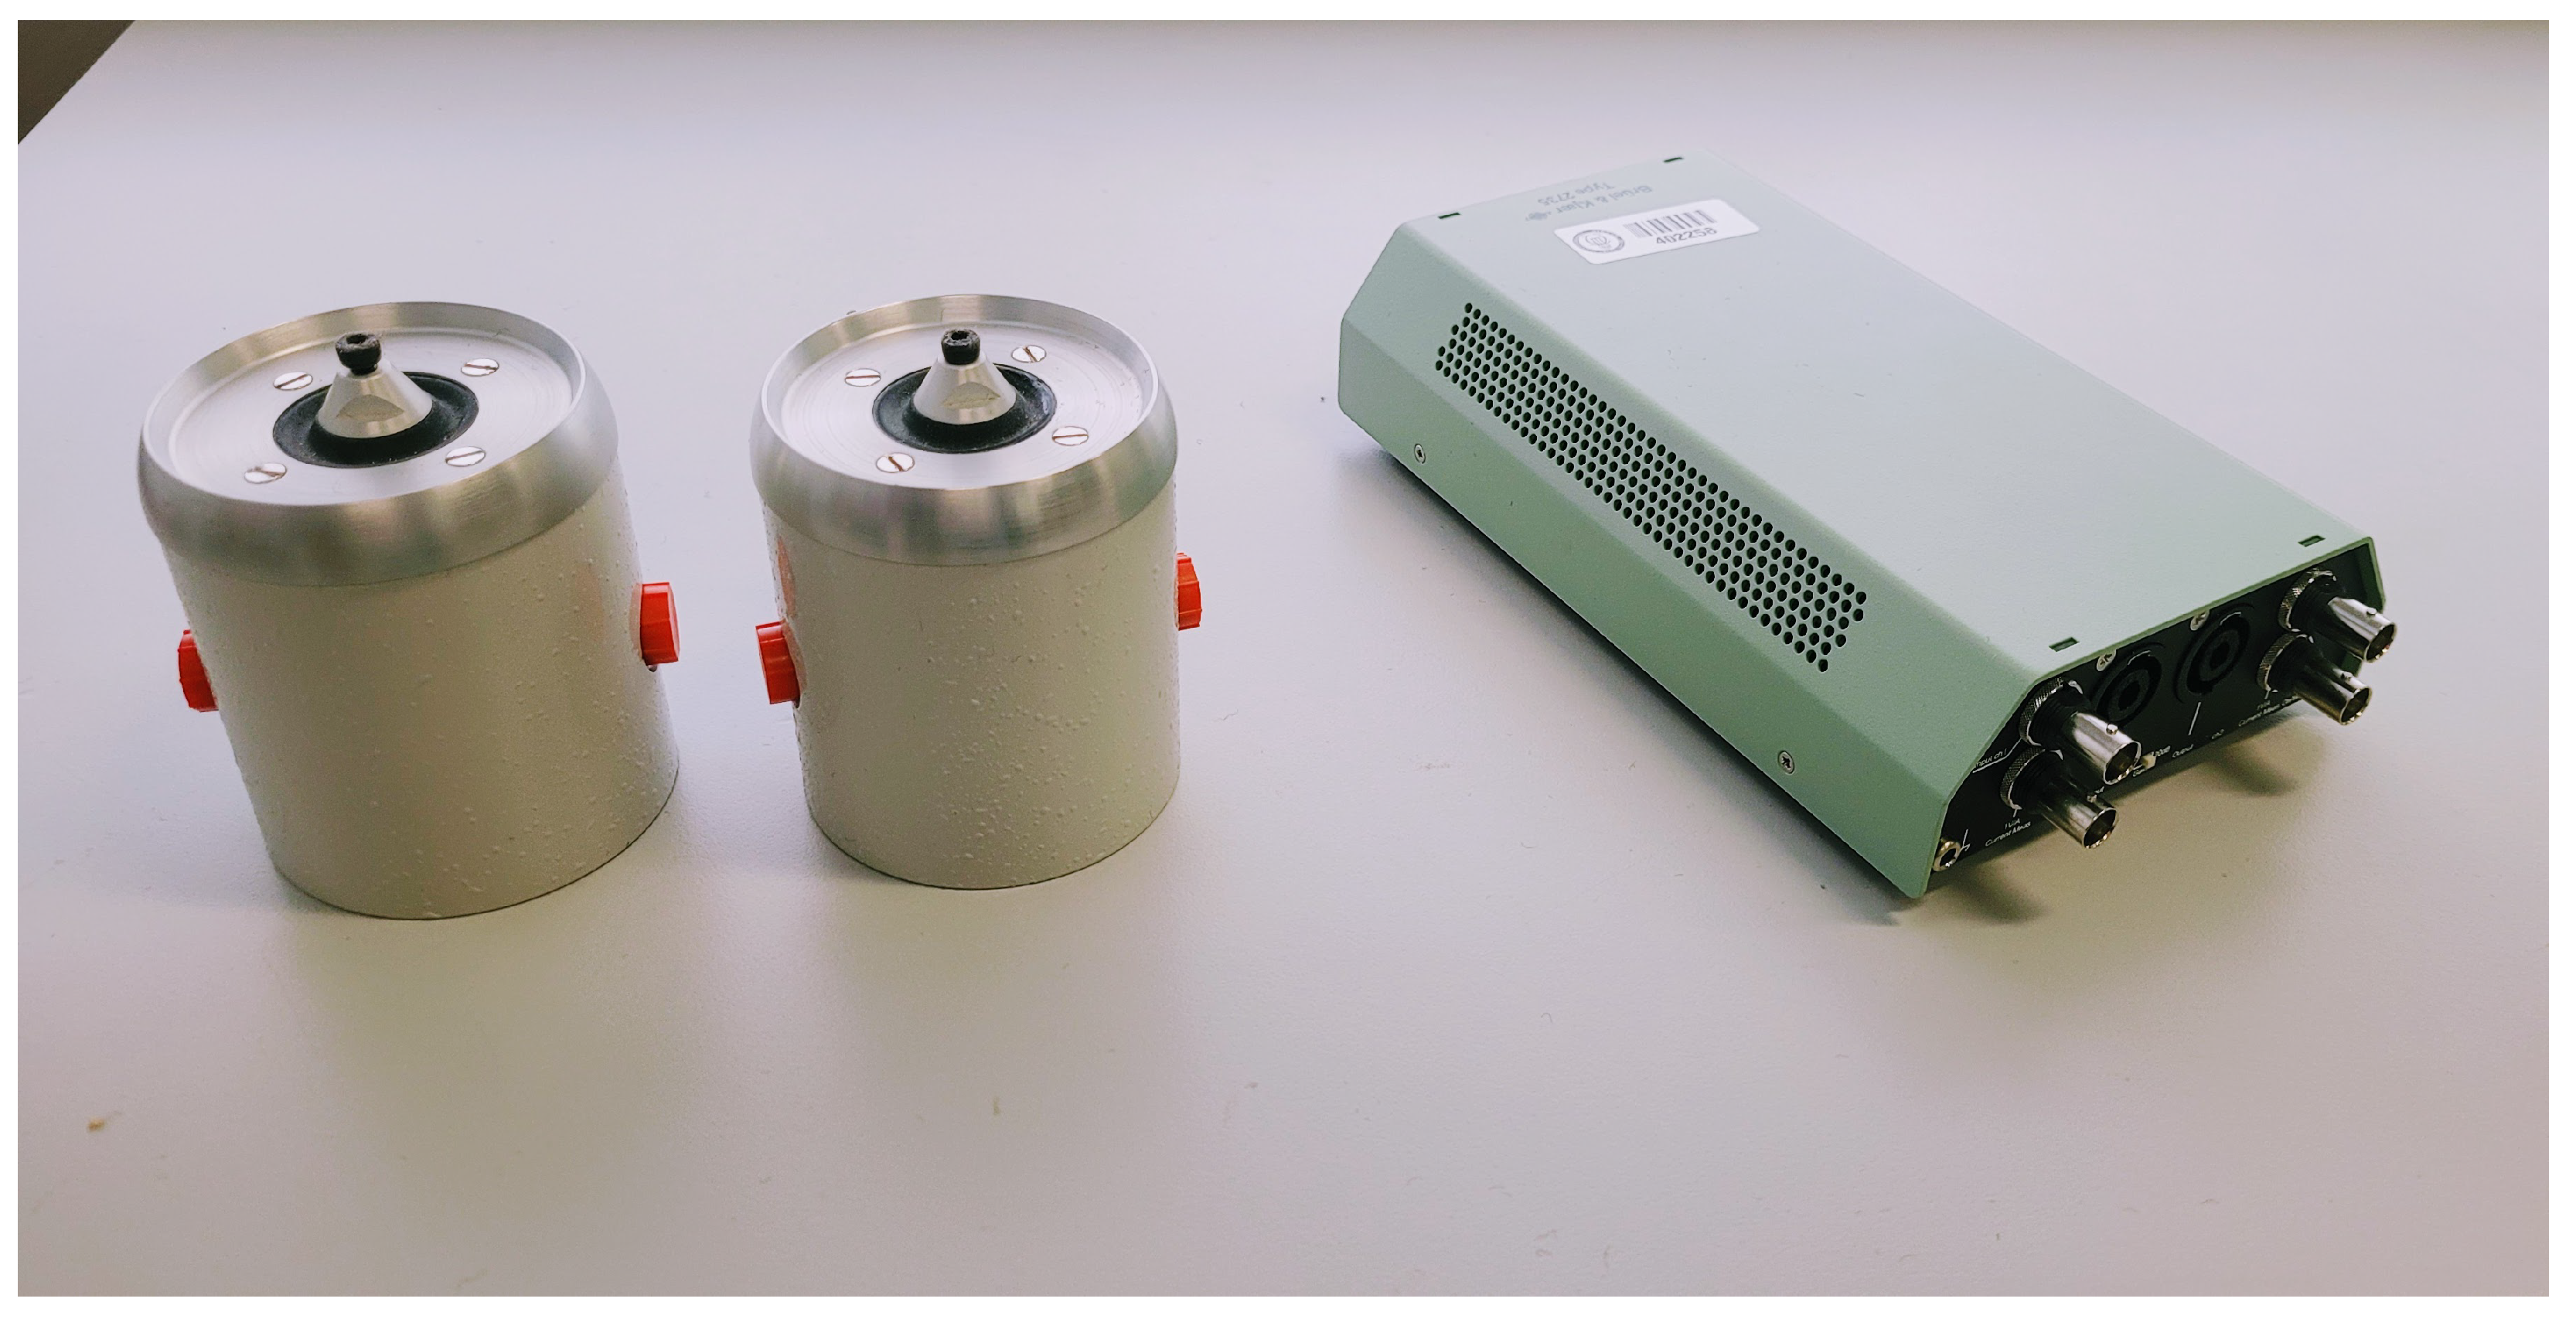
To generate the tactile stimulus, 2 LDS 201/3 shakers and a model 2735 signal amplifier from the Brüel&Kjaer (B&K) (San Sebastián de los Reyes 28703, Spain) brand were used; see
Figure 2. These shakers achieve varied and precise vibrational patterns. Their working frequency range is 5 to 13,000 Hz, covering our work frequency range (the harmonic distortion in this range being less than 0.1%). As for force, they can generate sinusoidal force peaks of up to 17.8 N.
The amplifier was configured with a gain of 20 dB, ensuring a vibration of sufficient strength without being annoying. To this end, a standard configuration was established, previously tested among the members of the research team, so that the vibration was comfortable and sufficient to clearly perceive the vibrations.
The pad of the middle finger has the highest density of Pacinian corpuscles, which are capable of spatial summation, with stimuli detection improving with a more stimulated surface [
34].
To transmit the vibration to the participants’ middle fingertips, we screwed an extender to the head of the shaker. The head had a surface area of 8 mm2, to which a thin circular felt pad, 1 cm in diameter, was glued. The purpose of this pad was to increase the stimulation surface and comfort for the participants.
As these shakers work with voice coils, hearing the signal that excites them is possible, so avoiding their acoustic radiation was necessary. The tactile stimulation system was isolated using an acoustic enclosure for both actuators to mitigate this situation, reducing acoustic radiation and unwanted vibrations.
In addition, volunteers were provided with earplugs, with an attenuation of 26–27 dB, and extra insulation using hearing protection ear muffs, with an attenuation of 94–105 dB, providing a joint attenuation of 120 to 132 dB.
2.3. Method
The participants were invited to individual sessions in a dedicated, quiet room. To minimise noise and distractions, only the participant and two investigators were present. One investigator was responsible for executing the test procedures, while the second investigator ensured a secure and uninterrupted environment. The participants were asked to sit on a chair facing the table where the system was installed.
We considered two conditions for the experiment:
Before starting the test, the details of the procedure and conditions were explained to the participants, and a practice test series was conducted with five consonant samples and five dissonant samples presented both vibrotactically and aurally, indicating to each volunteer which type of interval was being stimulated. Once the participant declared they were prepared, the test started.
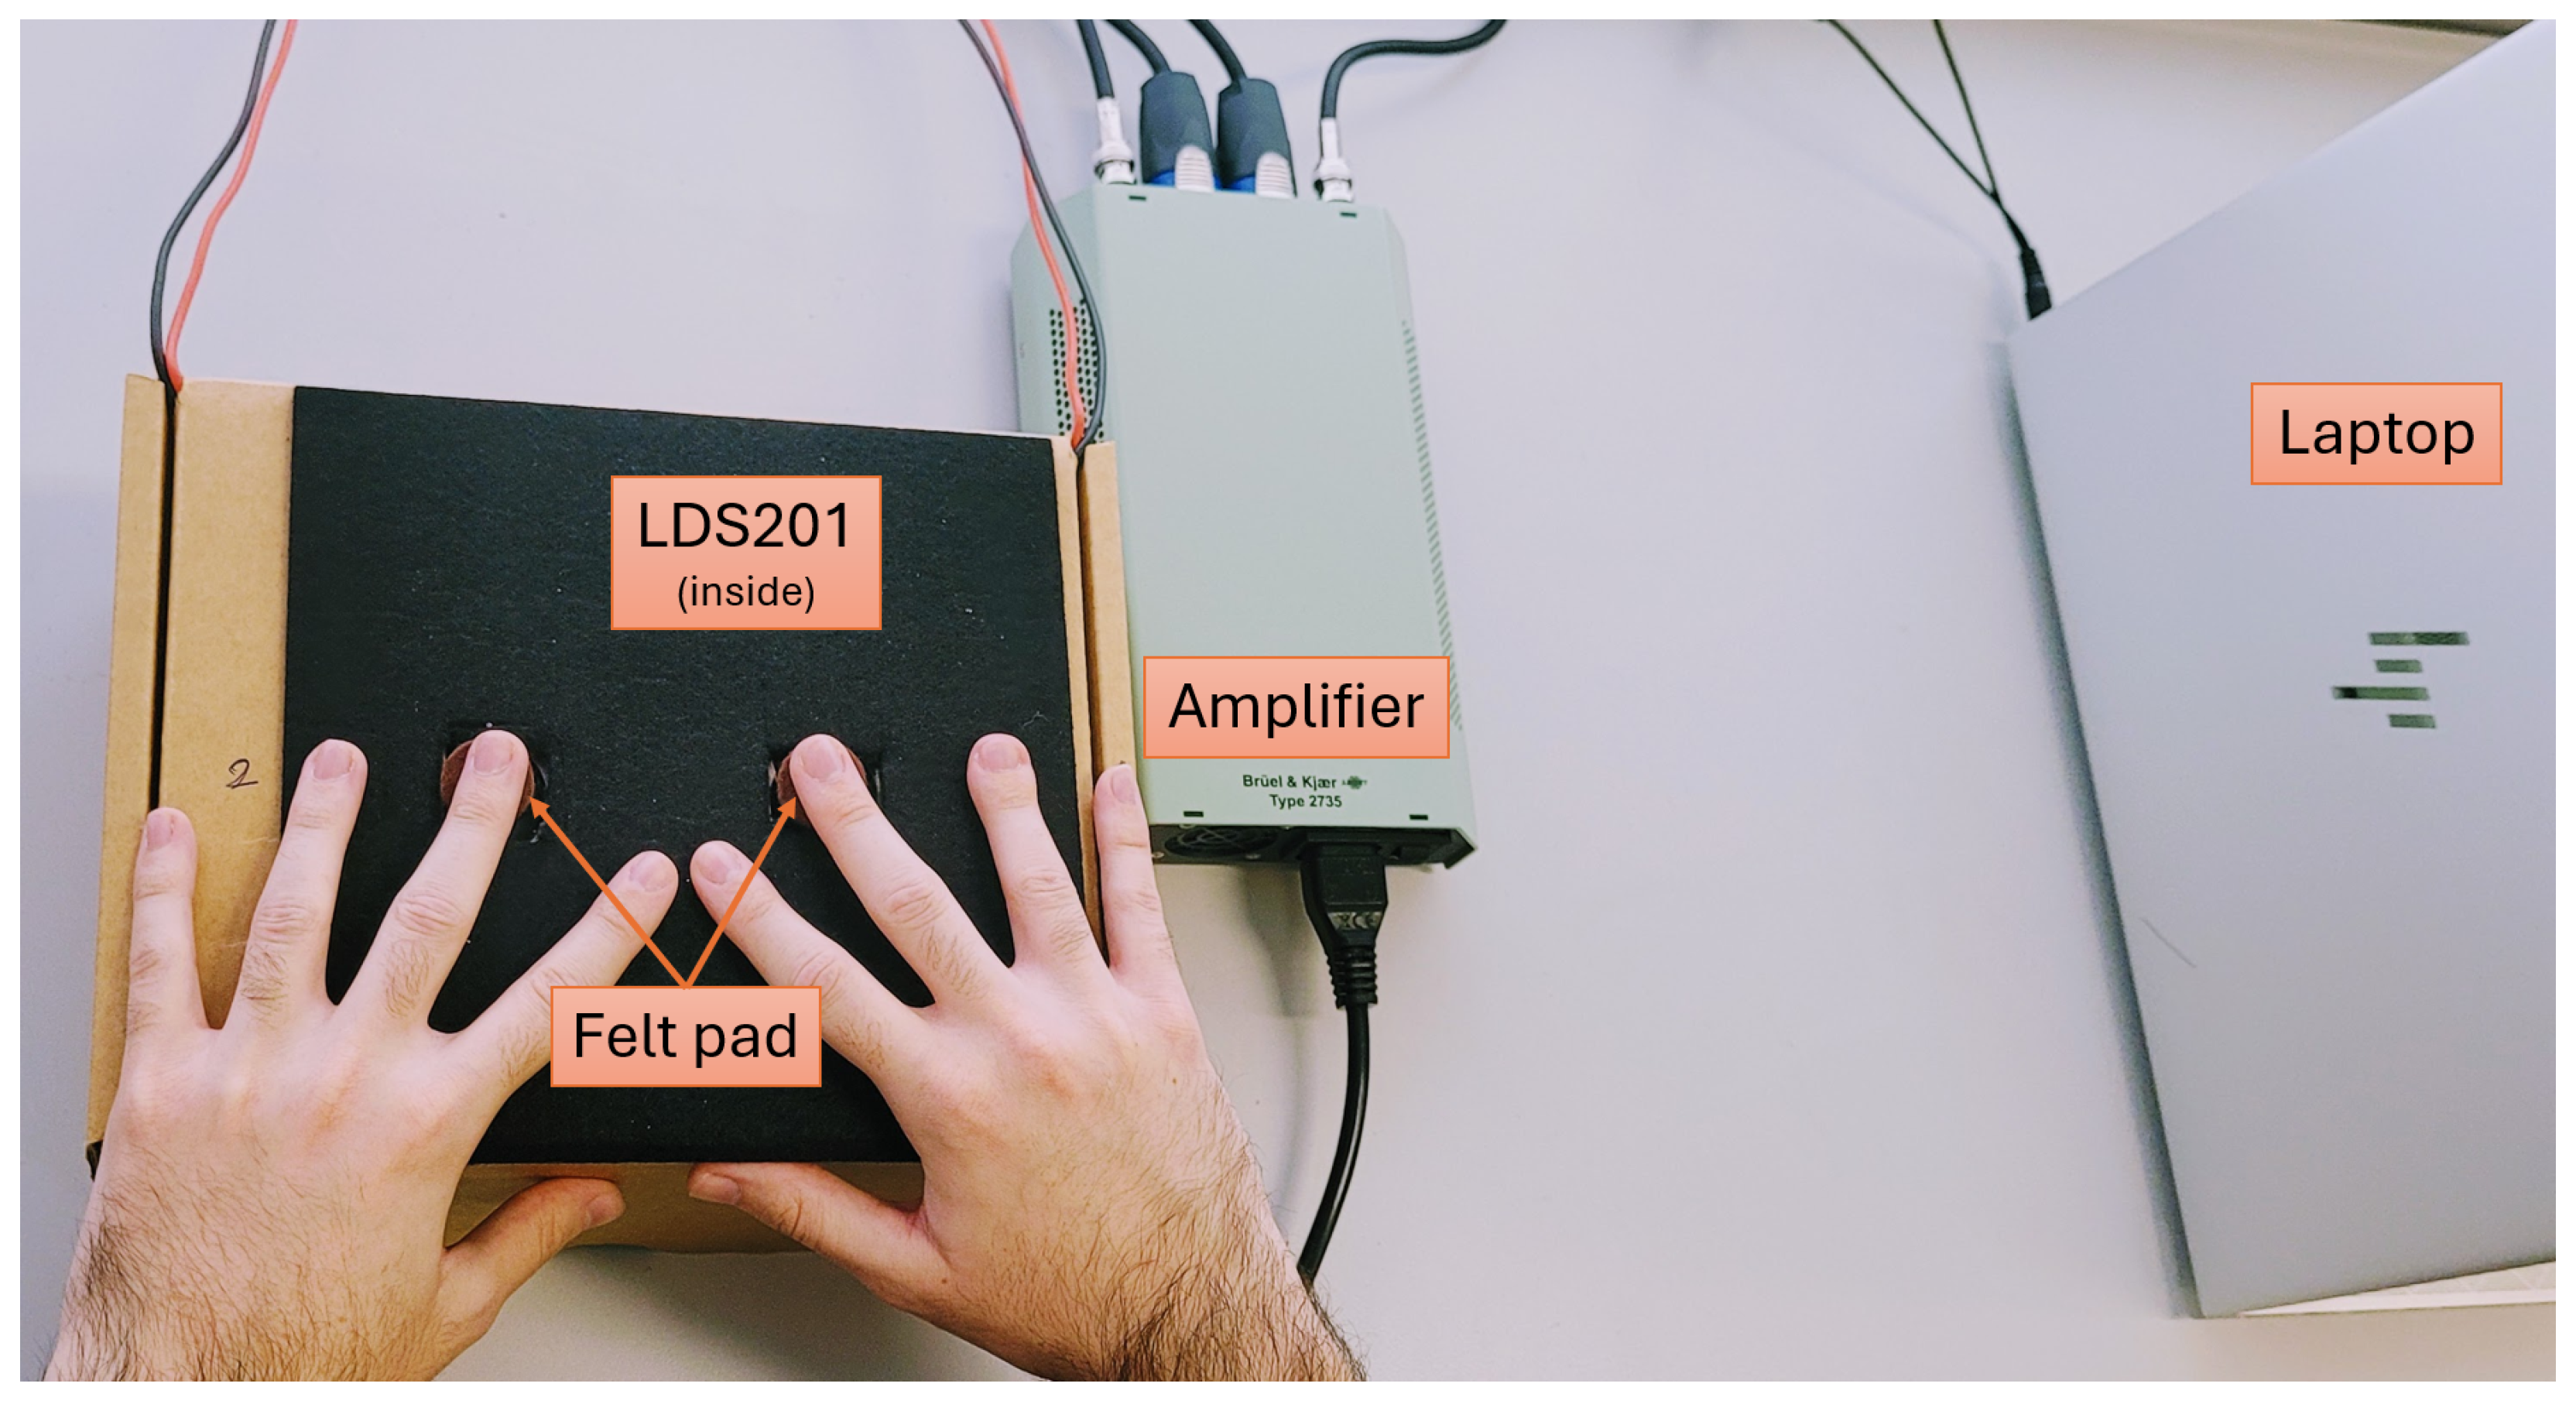
The 28 samples of consonant and dissonant intervals were presented in random order, first in the Vibrotactile Condition. In this condition, the participant was asked to put on earplugs and a helmet, and it was verified that they could not hear anything. The participant placed the pads of the middle fingers on the vibrators; see
Figure 3.
When the two-second sample was played with the corresponding musical interval, the participant felt the corresponding vibration in the pads of the middle fingers. After each interval presentation, the participant had to decide whether it was a consonant or a dissonant interval, using a single word (“relax”, “tension”) as the answer. The words “relax” and “tension” were employed according to tonal musical theory, which considers that a dissonant interval produces “tension”, while a consonant interval produces restfulness, relaxation. Each answer was registered in the application. If in doubt, the participant may have requested that the same sample be repeated once more. There was a brief break after the presentation of half of the samples. Once the tactile test was completed, the participant was asked to remove the headphones and earplugs.
Then, the procedure was repeated similarly in the Auditory Condition. In this condition, the same 28 samples of consonant and dissonant intervals were presented in random order. The participant listened to the samples and, after each sample, decided whether it was a consonant or a dissonant interval, and just in case of doubt, they could ask to listen to the sample only once again. Each answer was registered in the application.
A complete test for a participant took around 15 min in total. This included completing the demographic survey and informed consent, which took around 5 min; initial training and explanation of the research, which took around 2 s per sample; 4 s between samples; 1 min for resting in the middle of each test; and around 2 min for resting between different tests.
3. Results
We registered the total number of times each participant correctly identified whether an interval was consonant or dissonant from the 28 samples. The scores were registered for the two Conditions, Auditory and Vibrotactile. We obtained 30 scores for each condition.
All statistical tests were conducted with an alpha level of 0.05.
A normal distribution could be assumed for each dataset of 30 scores. In the Auditory Condition, the Shapiro–Wilk test did not show a significant departure from normality (W(30) = 0.96, p = 0.313). In the Vibrotactile Condition, the Shapiro–Wilk test did not show a significant departure from normality (W(30) = 0.98, p = 0.868).
On average, participants correctly identified 20.5 (
SD = 3.37) intervals in the Auditory Condition (73.33% correct) and 18.53 (
SD = 3.21) intervals in the Vibrotactile Condition (66.19%). For both conditions, the binomial test shows that the number of correctly identified intervals is significantly higher than chance (
p < 0.001).
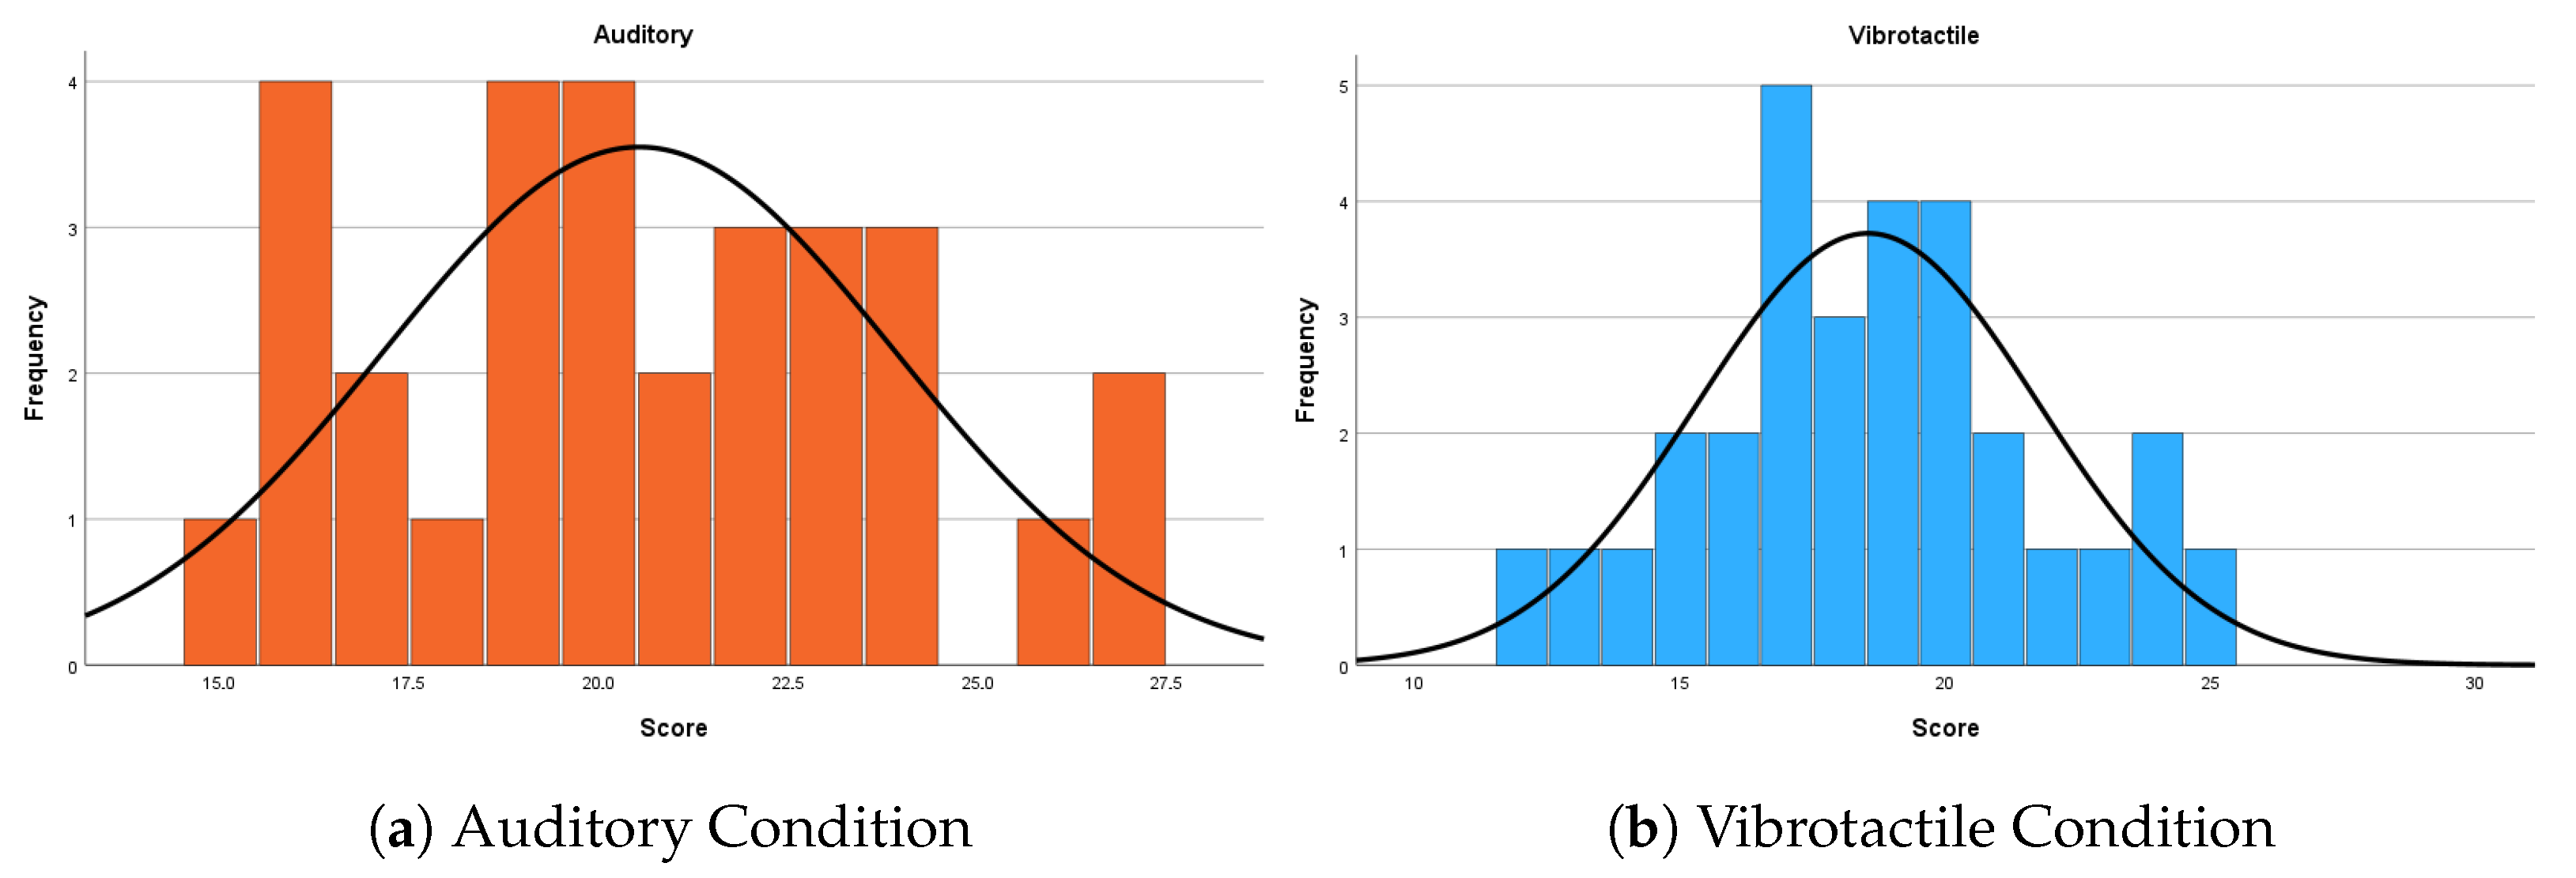
Figure 4 shows a histogram of these results. From here on, the following colour coding will be used: blue for the Vibrotactile Condition and orange for the Auditory Condition.
A paired t-test was performed to compare the samples of both conditions. The results show that there is a small significant difference between the Auditory Condition (M = 20.53, SD = 3.37) and Vibrotactile Condition (M = 18.53, SD = 3.21) (t(29) = 2.50, p = 0.018, Cohen’s d = 0.46).
Additionally, an independent-sample
t-test was conducted to compare the accuracy scores in the Auditory Condition between participants of Group Level 1 (N = 22,
M = 19.41,
SD = 2.77) and Group Level 2 (N = 8,
M = 23.63,
SD = 3.02). In both cases, the Shapiro–Wilk test did not show a significant departure from normality, (
W(22) = 0.94,
p = 0.242 and
W(8) = 0.91,
p = 0.375). Levene’s test for equality of variances was not statistically significant (
F(1, 28) = 0.01,
p = 0.927), indicating that the assumption of homogeneity of variances was met. Results revealed a statistically significant difference in auditory scores between the two groups (
t(28) = −3.60,
p = 0.001). Group Level 2 showed significantly higher performance in the Audio Condition compared to participants of Group Level 1.
Figure 5 shows a histogram of this data, with separate graphs for the Level 1 and Level 2 responses.
In the Vibrotactile Condition, the results of the independent-sample
t-test were in Group Level 1 (N = 22,
M = 18.64,
SD = 3.61) and Group Level 2 (N = 8,
M = 18.25,
SD = 1.91). In both cases, the Shapiro–Wilk test did not show a significant departure from normality (
W(22) = 0.98,
p = 0.861 and
W(8) = 0.98,
p = 0.933). Levene’s test for equality of variances was not statistically significant (
F(1,28) = 3.46,
p = 0.074), indicating that the assumption of homogeneity of variances was met. The results revealed no statistically significant difference in vibration scores between the two groups (
t(28) = 0.297,
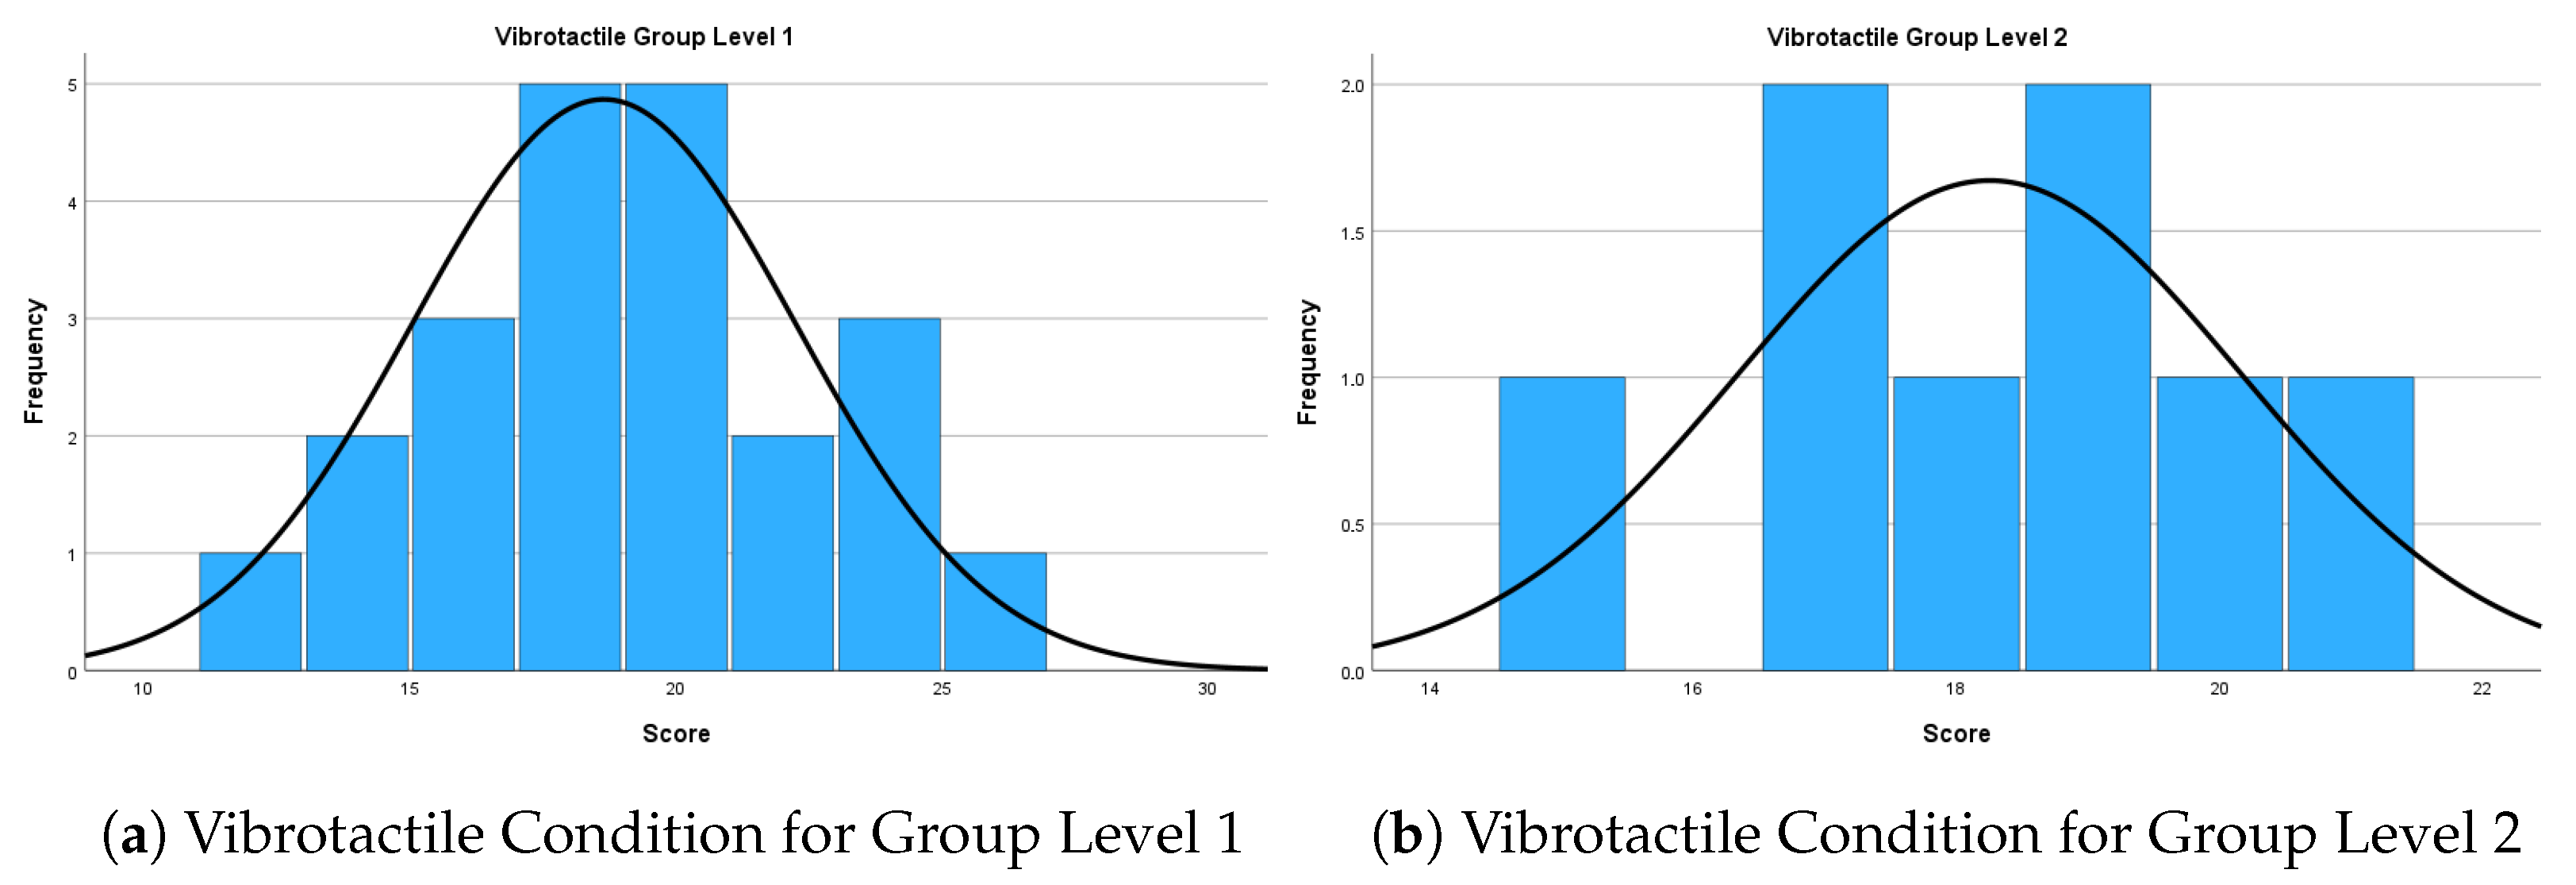
p = 0.777). This suggests that the level of musical knowledge did not influence performance in the Vibrotactile Condition.
Figure 6 shows a histogram of this data, with separate graphs for the Level 1 and Level 2 responses.
Considering only the results of Group Level 1 (basic musical knowledge), the paired t-test shows that there is a small non-significant difference (t(21) = 0.88, p = 0.389) between the Auditory (M = 19.4, SD = 2.8) and Vibrotactile (M = 18.6, SD = 3.6) Conditions.
On the other hand, considering only the results of Group Level 2 (musically trained), the paired test shows that there is a significant large difference (t(7) = 4.62, p = 0.002, Cohen’s d = 1.63) between the Auditory (M = 23.63, SD = 3.02) and Vibrotactile (M = 18.25, SD = 1.91) Conditions.
These results are summarised in
Table 3.
Additionally, the responses were analysed by interval, with descriptive analysis and a binomial test performed on each interval. The results are shown in
Table 4 and
Table 5.
The p-values derived from the binomial test for each interval are shown ordered from highest to lowest mean value for the Auditory and Vibrotactile Conditions, respectively. A p-value of less than 0.05 (p < 0.05) indicates that the interval differs in a statistically significant way from what would be expected by chance alone.
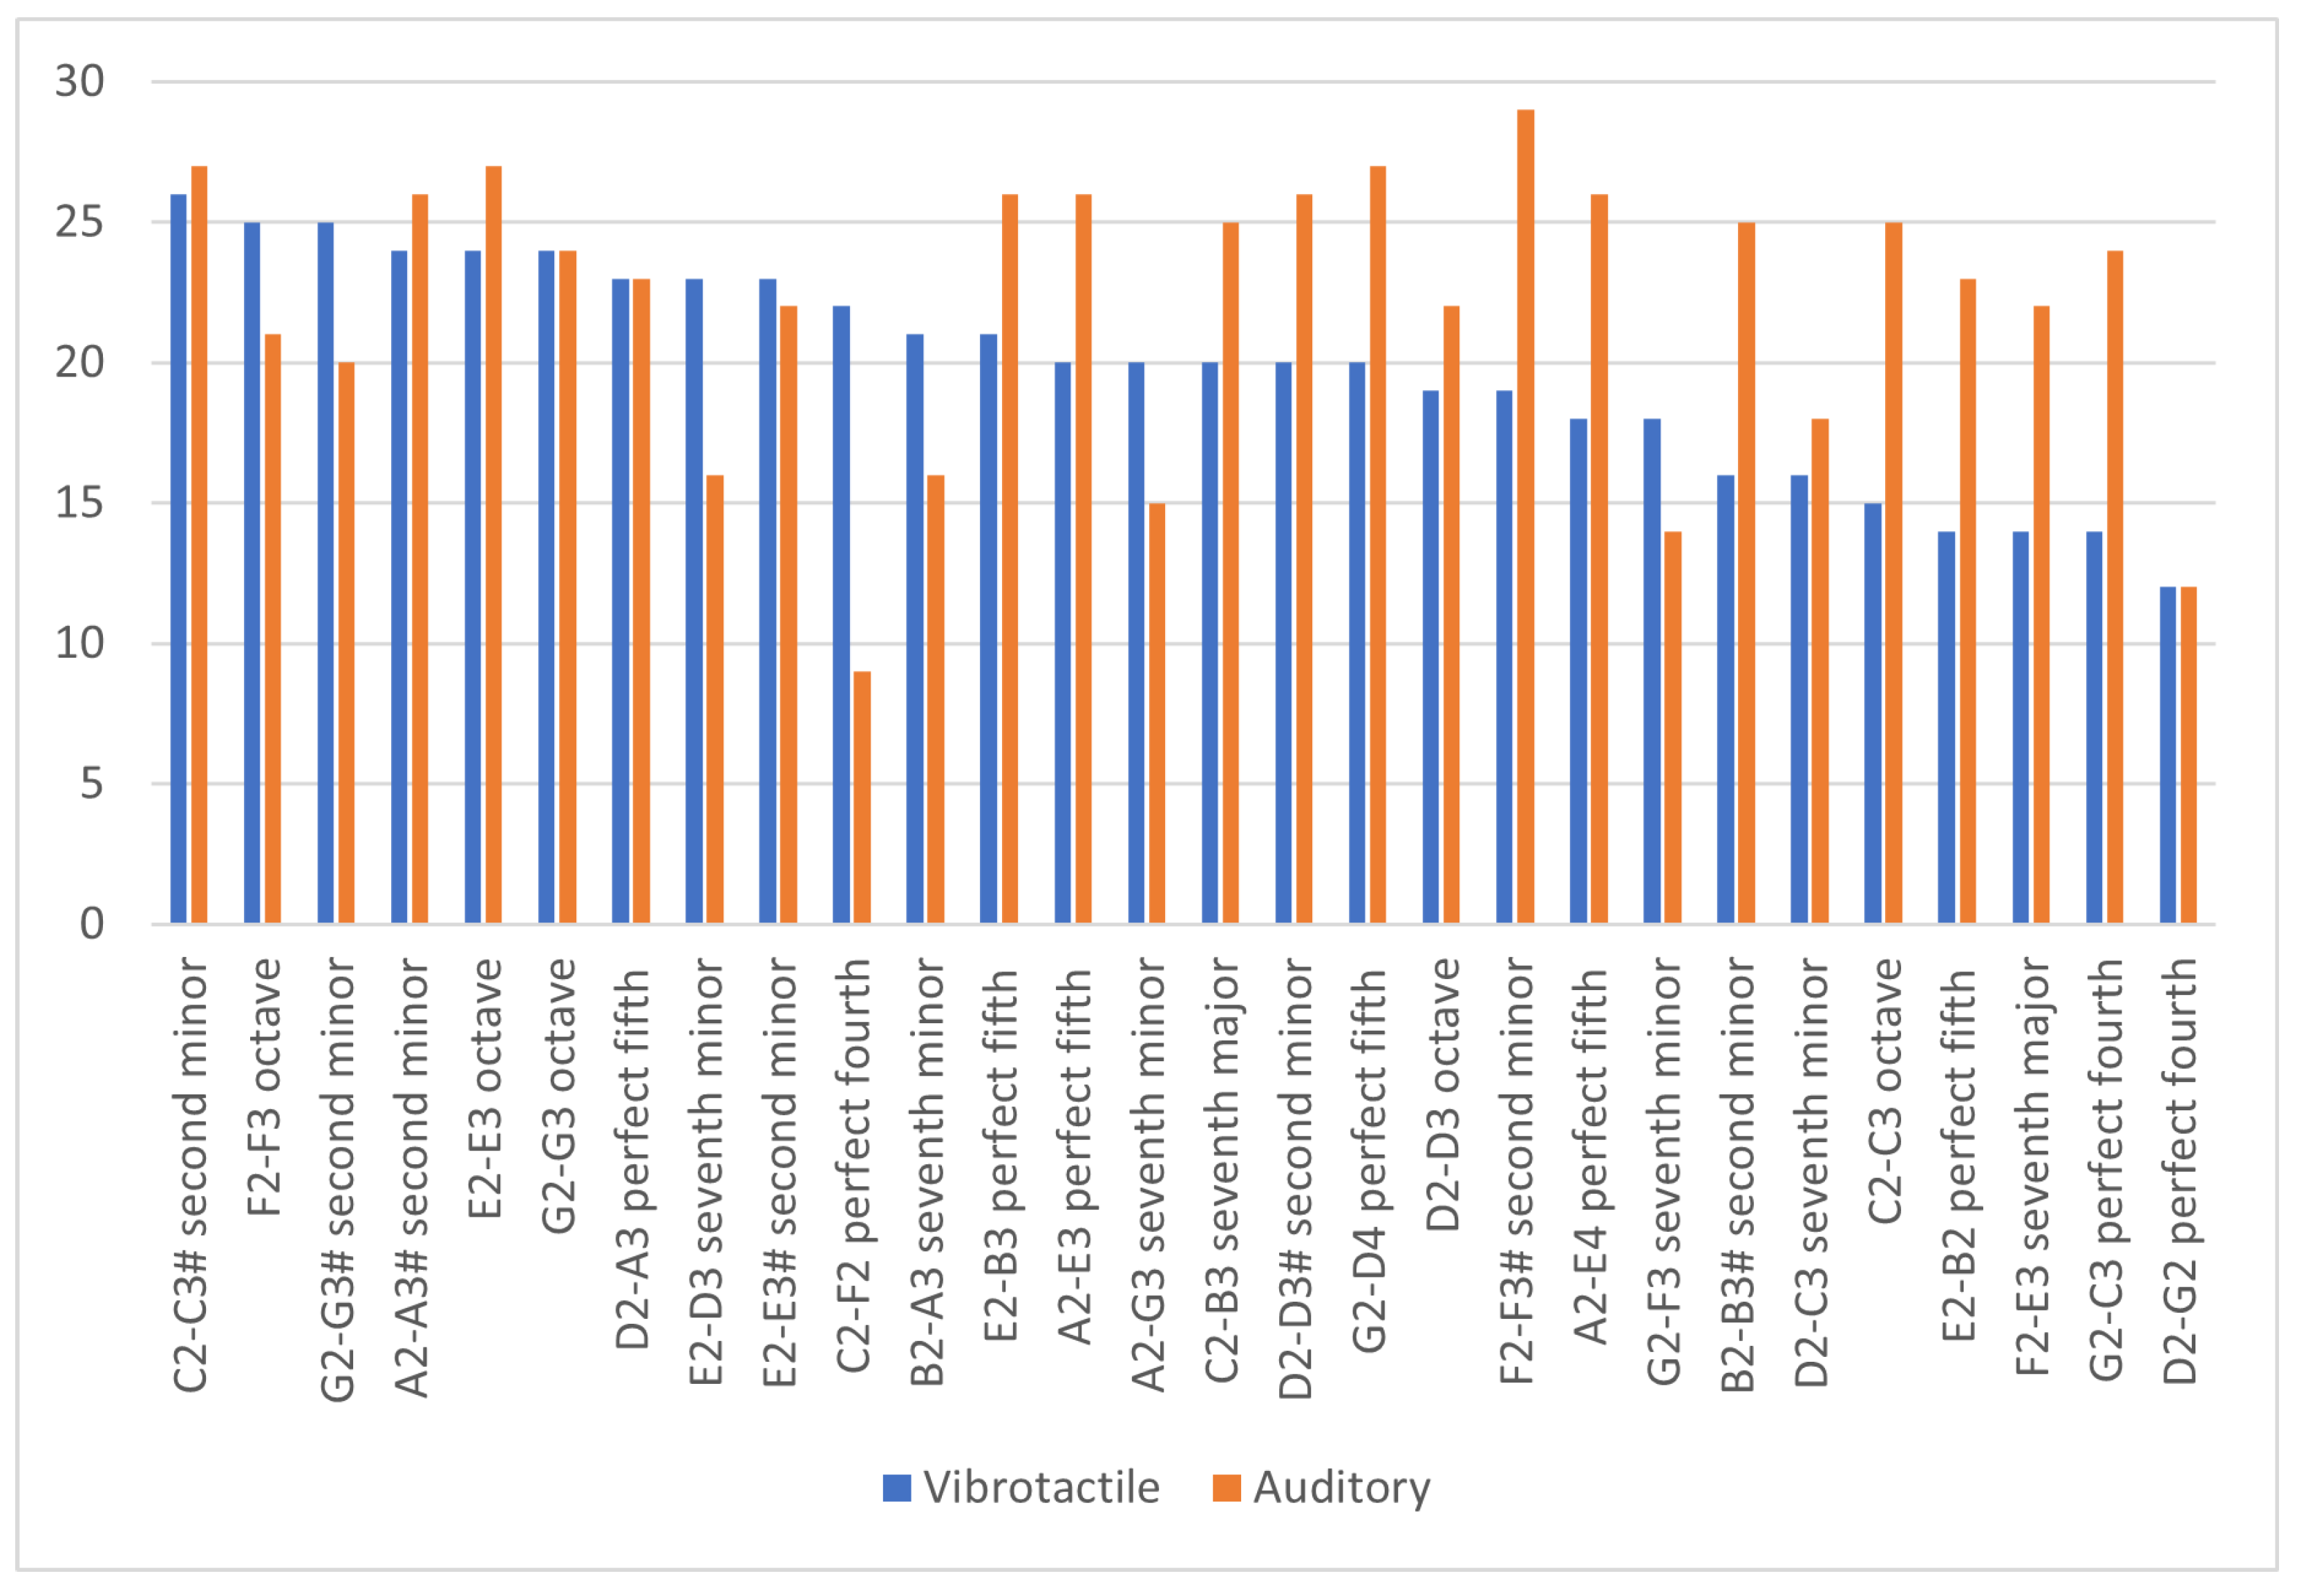
Figure 7 shows the number of correct answers for each interval in each condition, the Vibrotactile Condition and Auditory Condition. The intervals have been ordered from the highest to the lowest number of correct answers in the Vibrotactile Condition.
Results of the Pearson correlation about intervals indicated that there is a non-significant small positive relationship between Auditory and Vibrotactile Condition scores (r(26) = 0.126, p = 0.522). Similarly, the Pearson correlation for Group Level 1 indicates that there is a non-significant small positive relationship between Auditory and Vibrotactile Condition scores (r(26) = 0.035, p = 0.8600). For Group Level 2, the Pearson correlation indicates that there is a non-significant medium positive relationship between Auditory and Vibrotactile Condition scores (r(26) = 0.301, p = 0.120).
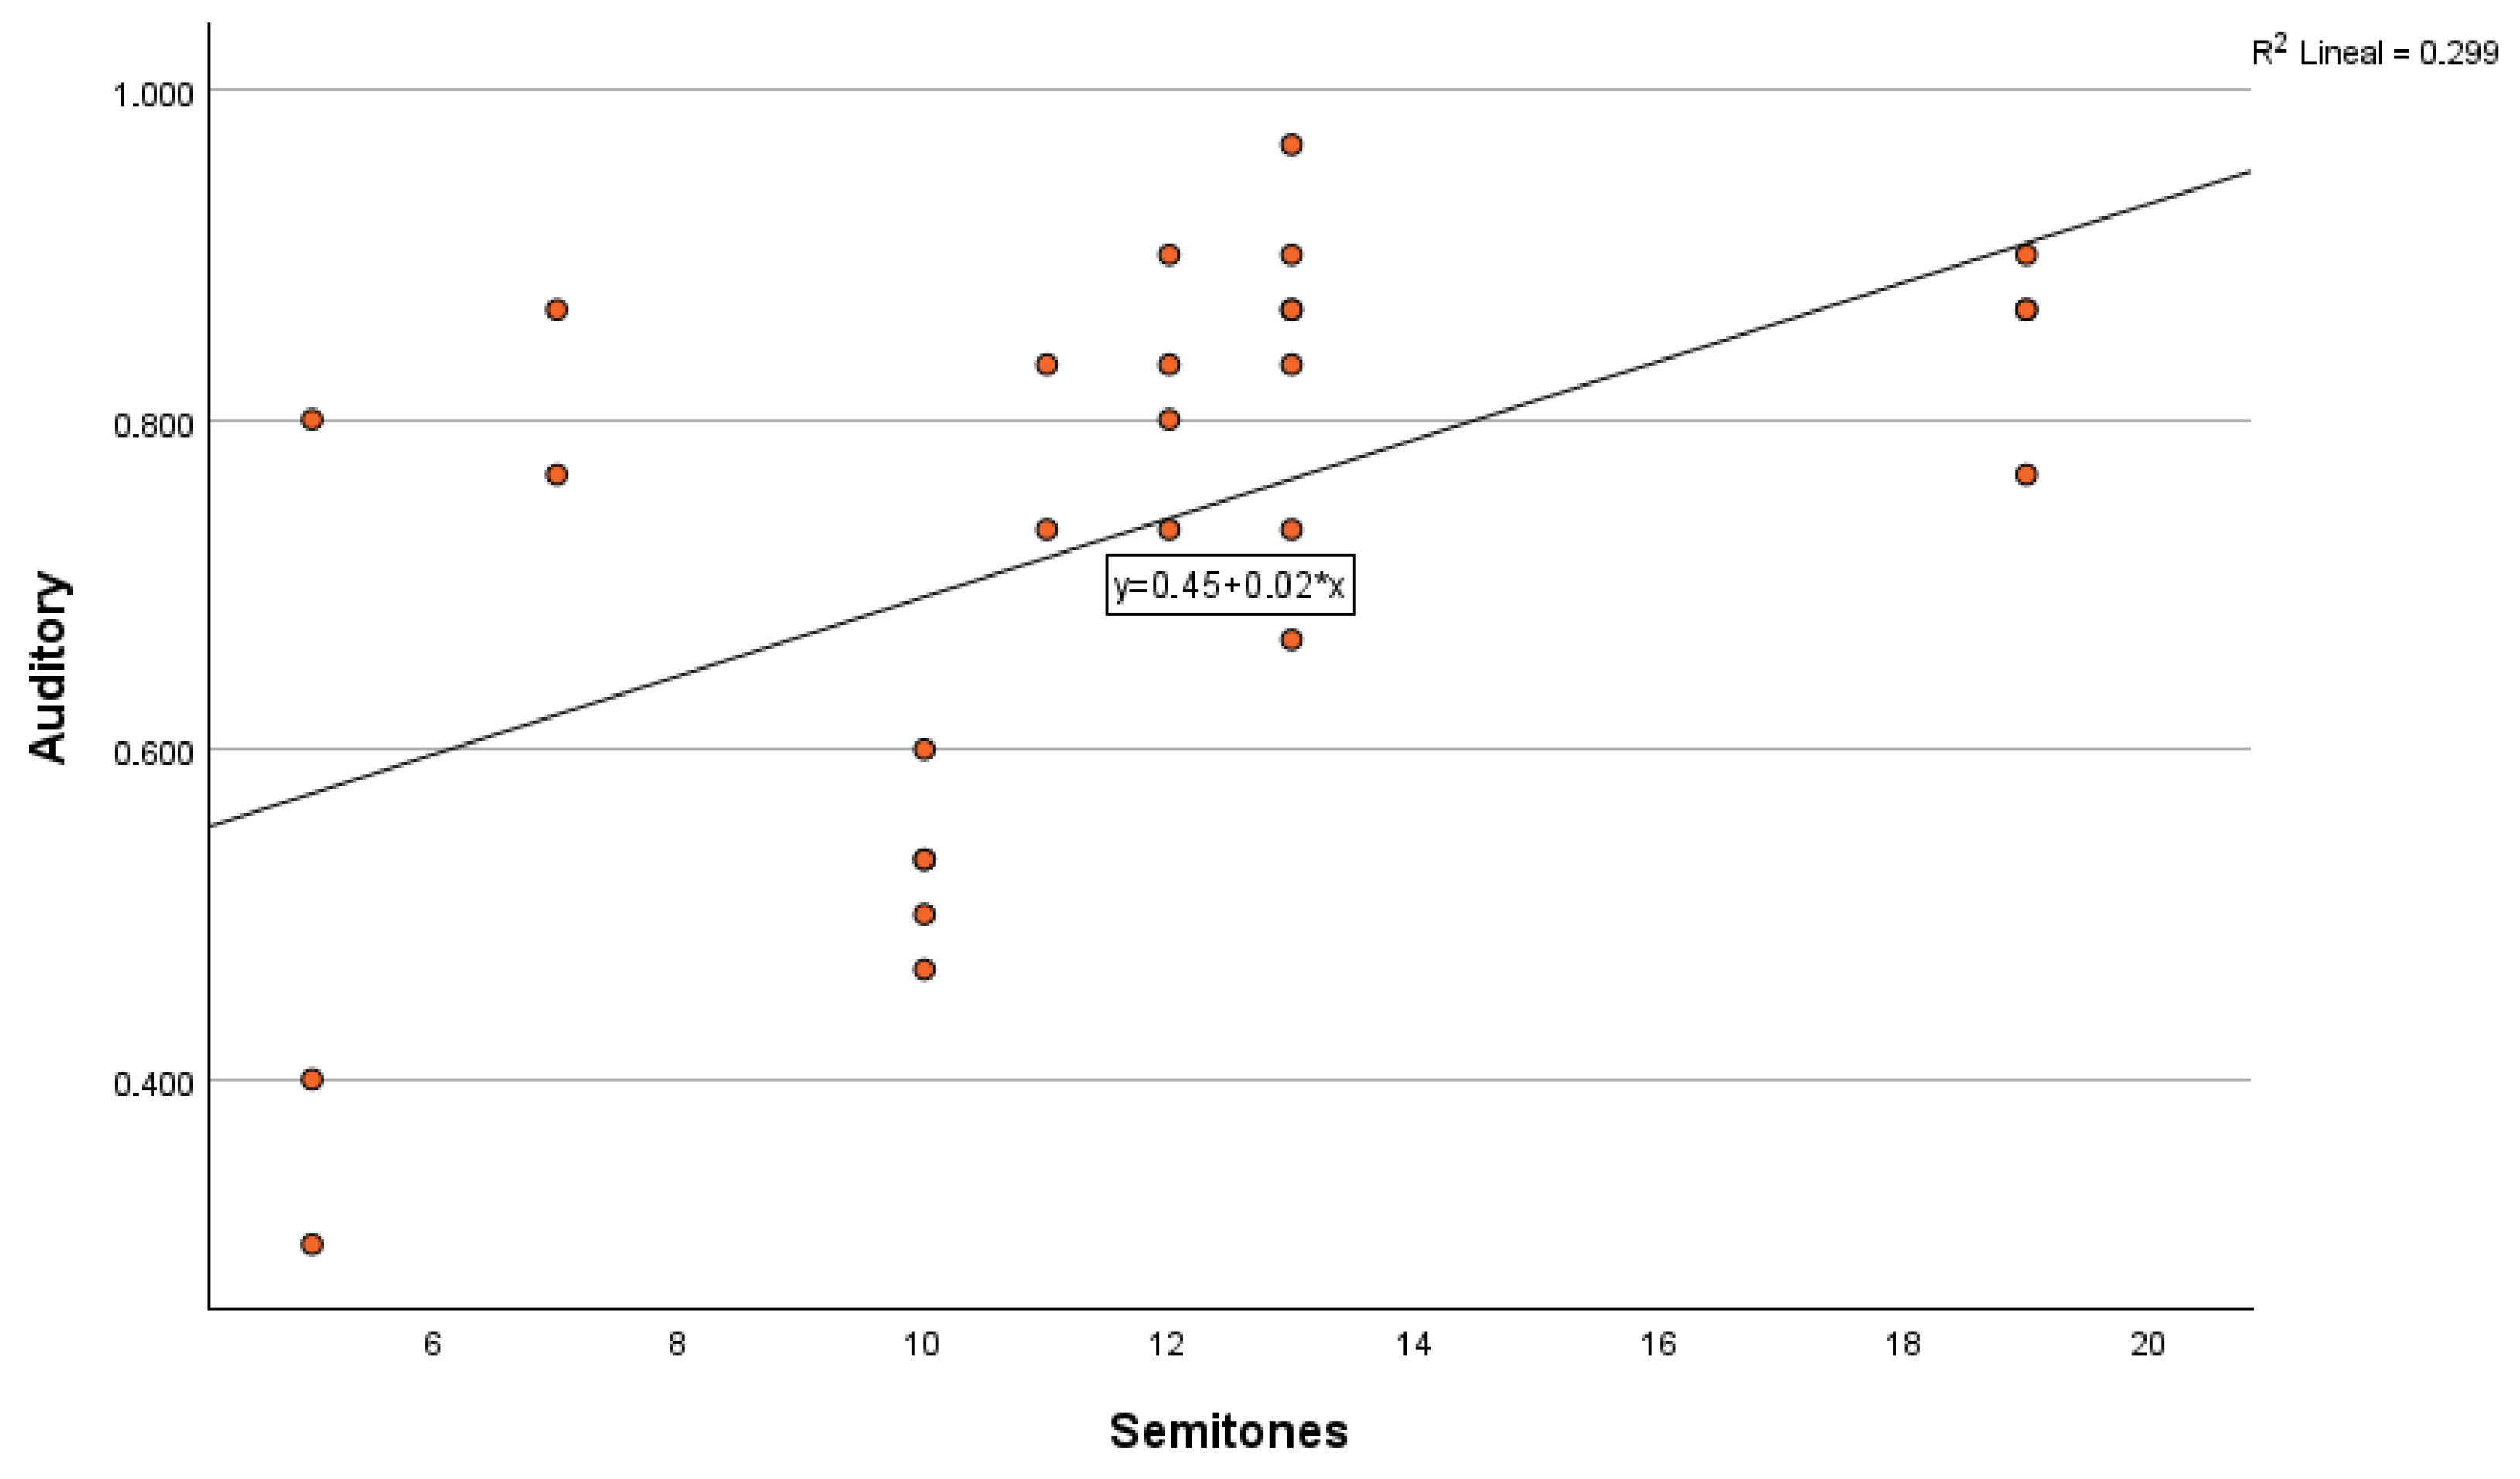
Studying the number of semitones in each interval, results of the Spearman correlation indicated that there is a significant large positive relationship between the number of semitones and Auditory Condition scores (
r(26) = 0.603,
p < 0.001). A scatter plot for these results is shown in
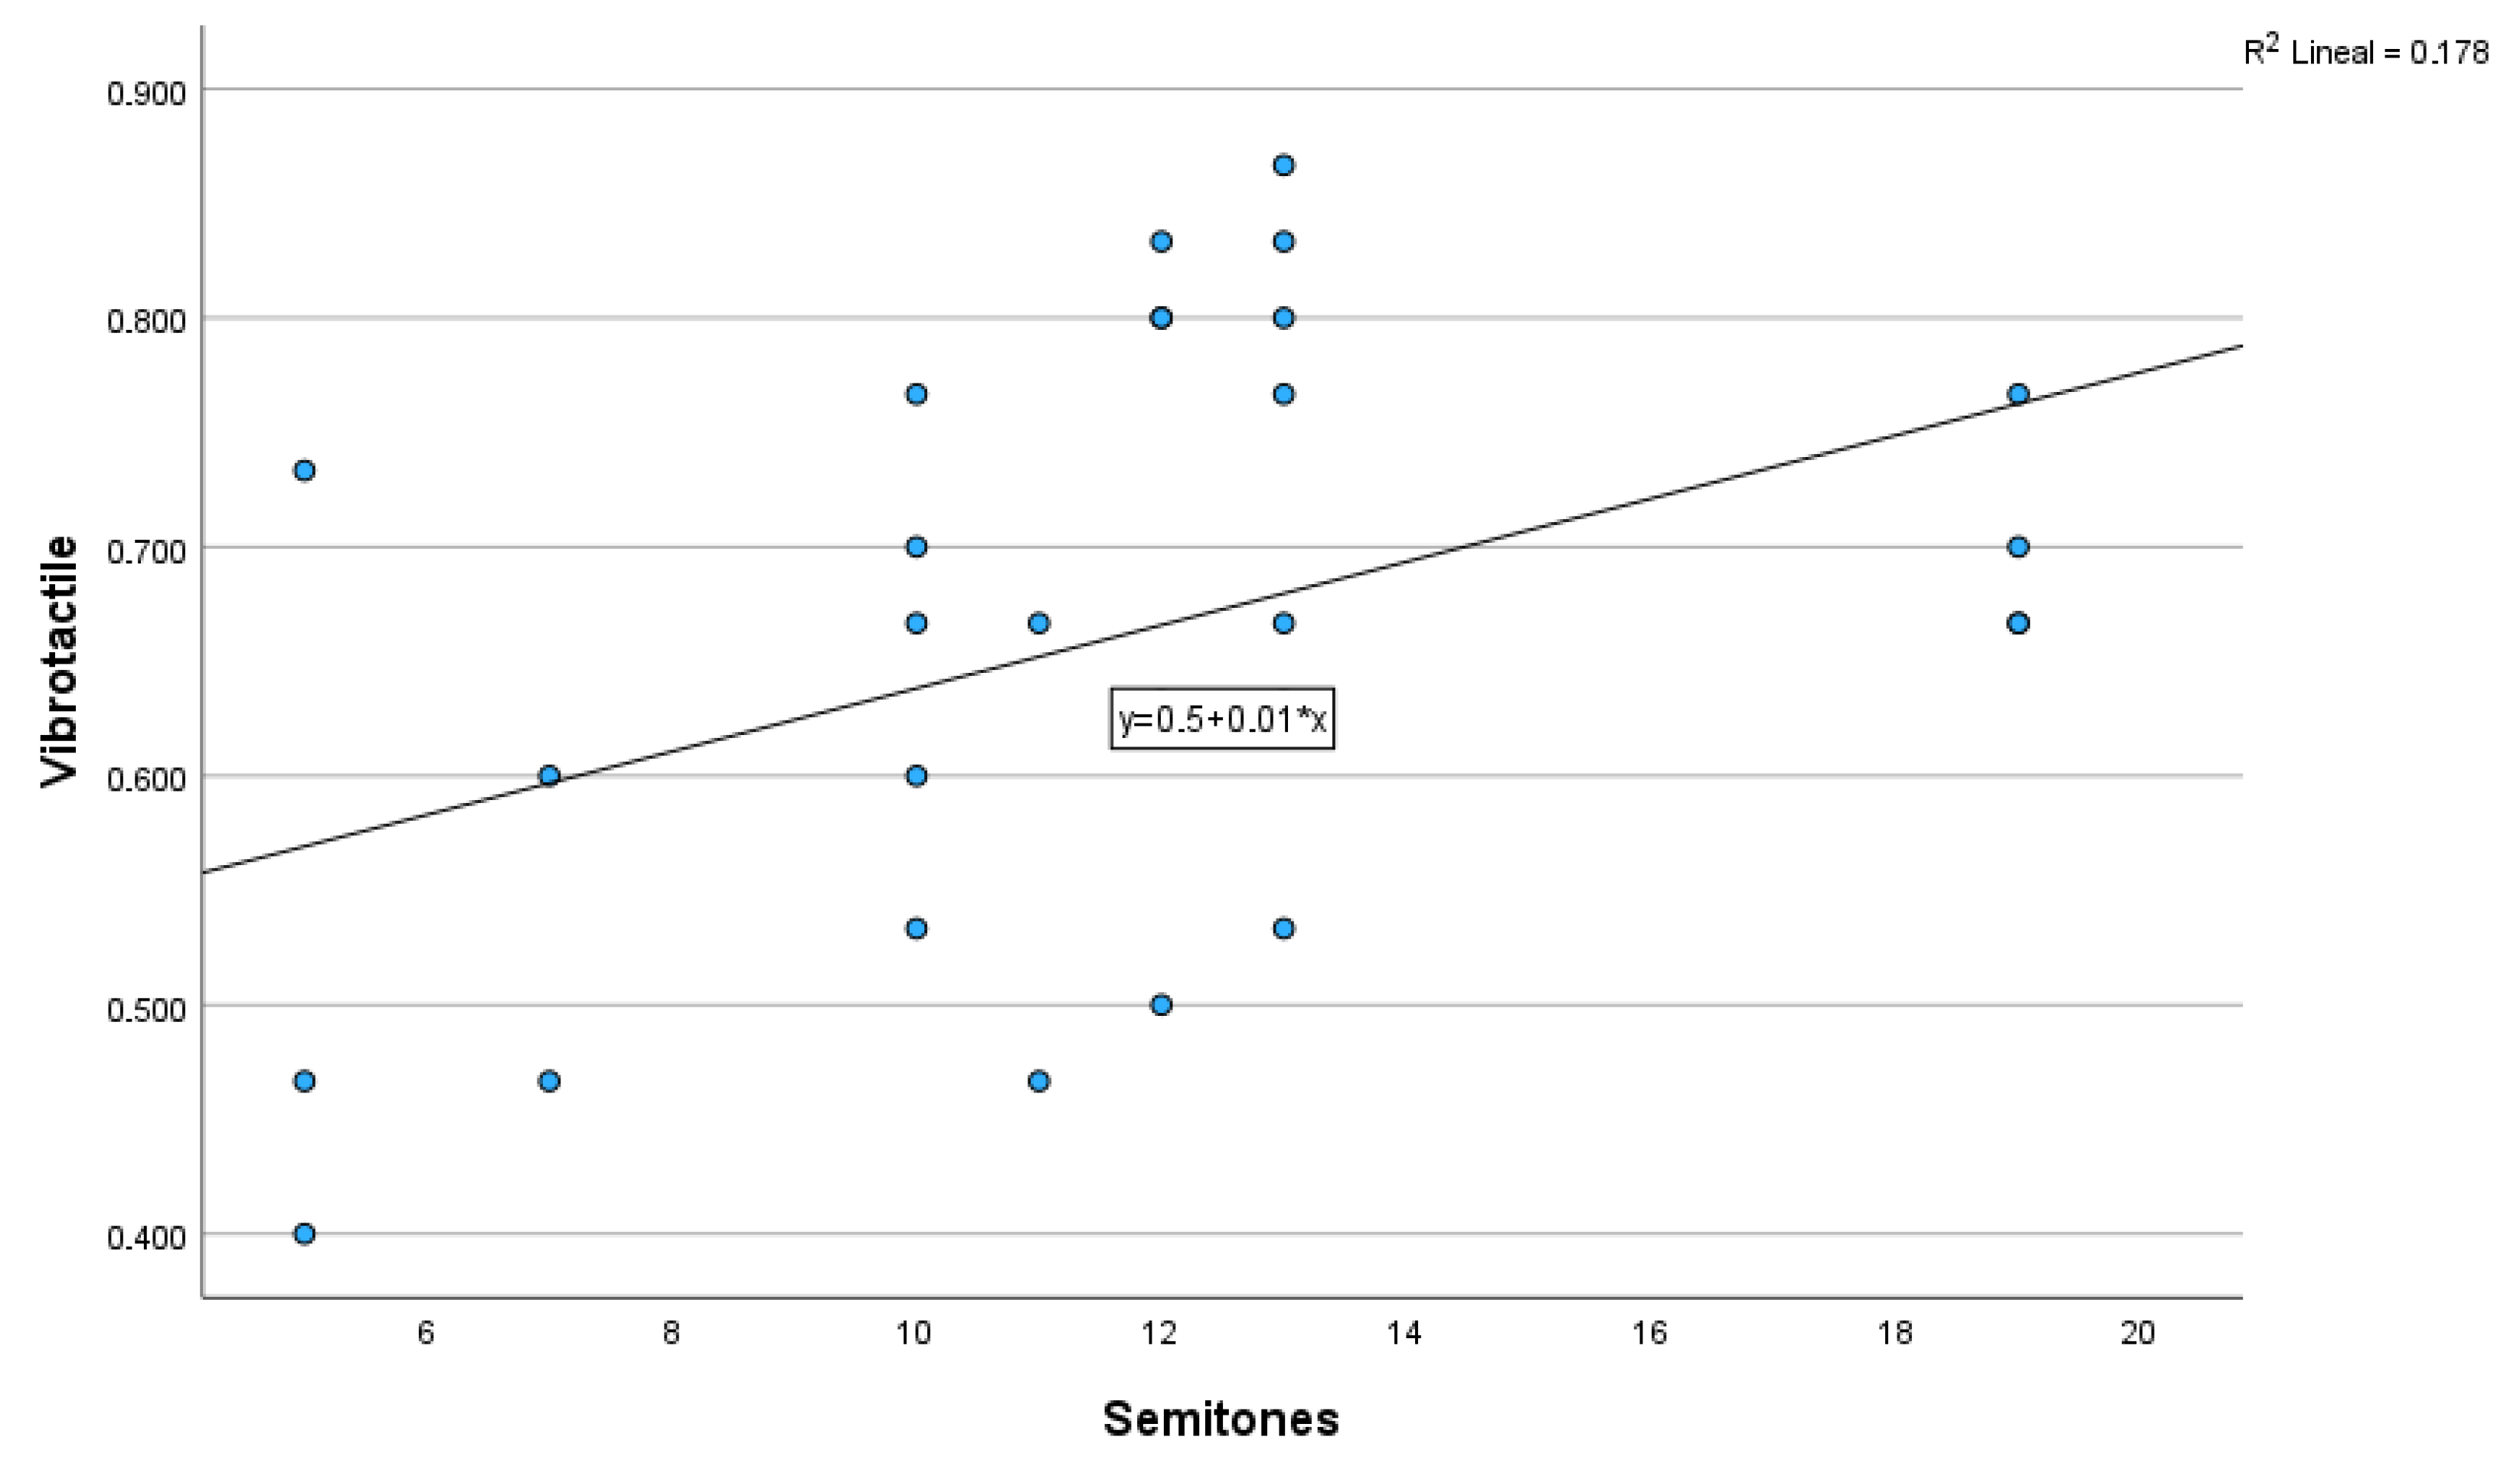
Figure 8. The same test in the Vibrotactile Condition indicated that there is a significant medium positive relationship between the number of semitones and Vibrotactile Condition scores (
r(26) = 0.425,
p = 0.024). A scatter plot for these results is shown in
Figure 9.
Table 6 summarises these data, adding the results for Group Level 1 and Group Level 2 in each condition. The results are significant for all cases, except for the Level 2 group in the Vibrotactile Condition.
4. Discussion
The results show that the number of correctly identified intervals in the Vibrotactile Condition is significantly higher than chance, confirming the initial hypothesis that consonant and dissonant musical intervals can also be perceived at the tactile level as they are perceived at the auditory level.
The results in the Vibrotactile Condition are similar in Group Level 1 and Group Level 2 (see
Table 3). The differences exist in the Auditory Condition, where participants with specific musical training recognise intervals more effectively. The better performance of Group Level 2 in the Auditory Condition aligns with the studies showing that training enhances Western music chord discrimination, with musicians having more facility in audio chord discrimination than non-professionals [
29,
30]. We would also expect a better performance of Group Level 2 in the Vibrotactile Condition, as tactile interaction with an instrument is essential for musicians who integrate vibrotactile information from their instruments, such as the violin and piano, while playing [
35].
Still, the level of musical knowledge did not influence performance in the Vibrotactile Condition. Similar behaviour was reported in [
13], where no significant difference between amateur and professional musicians results was found when using the fingertips for relative pitch discrimination and, after training, results improved in both groups, suggesting that training is an essential factor for vibrotactile performance, as it occurs in our study in the Auditory Condition.
When no such specific training is present and only Group Level 1 participants are considered, there is no significant difference in the number of intervals correctly recognised in both conditions (see
Table 3). Indeed, the two-second excerpts were long enough for this detection, as it occurs in auditory perception [
28]. Some intervals generated an immediate response, while participants hesitated or requested that the interval be repeated in others. Unfortunately, these data on response time or the number of repetitions before answering per interval were not recorded. However, it would be interesting to investigate whether immediacy in detecting the type of interval is associated with better recognition.
Regarding the analysis by intervals, we have found significant statistical results indicating that the distance between the two notes of the interval affects the perception of consonance/dissonance vibrotactilely. We can point out some tendencies, as shown in Spearman correlation (see
Figure 9 and
Table 6). Moreover,
Table 5 shows that the better recognised intervals in the Vibrotactile condition—C2–C3# (13 semitones), F2–F3 (12 semitones), G2–G3# (13 semitones), A2–A3# (13 semitones), E2–E3 (12 semitones), G2–G3 (12 semitones), D2–A3 (19 semitones), E2–D3 (10 semitones), E2–E3# (13 semitones)—have more than 10 semitones, while the worst recognised have a smaller number of semitones—E2–B2 (7 semitones), G2–C3 (5 semitones), D2–G2 (5 semitones). This tendency is in accordance with [
32], where participants found greater consonancy in larger intervals.
In the Auditory Condition, the results are likewise related to the number of semitones as the type of interval. The seventh minor interval is the worst recognised, while the second minor and perfect fifth intervals are better recognised (
Table 4 and
Table 6,
Figure 8).
The case of the interval C2–F2 (perfect fourth) shows a particular behaviour, as it is much better recognised in the Vibrotactile Condition than in the Auditory Condition. This discrepancy may be because this interval is formed by the lowest notes of all the intervals: C2 corresponds to a frequency of 65.41 Hz and F2 to a frequency of 87.31 Hz. In this study, we focused on Pacini mechanoreceptors, activating at frequencies between 50 and 1000 Hz, with a maximum sensitivity around 200–300 Hz [
7]. But to explain this result, we may consider Meissner’s superficial mechanoreceptors, which are rapidly adapting and have maximum sensitivity to tactile vibrations in the frequency range between 5 and 50 Hz and are also present in the middle fingertip. They generate a fluttering sensation, similar to that produced when sliding a finger over a rough surface [
7].
In the subsequent stages, we will examine these tendencies in depth, studying the perception of detailed characteristics of the intervals as distance in semitones, frequency range, and considering the different mechanoreceptors that can be activated, which could result in a different quality perception. We will also consider different sequences of training sessions to determine the influence of training.
Very specific vibrators that offer precise vibrations are needed, such as those used in this study. Indeed, an interval C2–C3 is consonant, while an interval C2–C3# is dissonant, the difference between them being about eight hertz (the frequency on a piano of the C3 note is 130.813 Hz and the C3# note is 138.591 Hz). This makes the results of this study or future studies in this line difficult to extend to wearable devices. Devices designed to communicate musical information vibrotactilely generally use actuators in a lightweight design that cannot achieve this precision [
1,
36]. For example, DMAs (Dual Mode Actuators) are heavy and require a significant amount of current; VCAs (Voice Coil Actuators) are also heavy and large. Coin motors are small and versatile for use in wearables, but they can only transmit a resonant frequency. The requirements of precise vibrations make it challenging to design wearable devices that can communicate this information accurately and be used practically.
5. Conclusions
The results show that consonant and dissonant musical intervals can also be perceived at the tactile level as they are perceived at the auditory level and that there is no significant difference in the number of intervals correctly recognised in the Vibrotactile Condition and the Auditory Condition when participants have no musical training.
Differences appear in the perception of different types of intervals between both conditions, vibrotactile perception being more sensitive to larger intervals of more than ten semitones, and presenting particular sensibility to frequencies between 50 and 100 Hz. In the Auditory Condition, the results are related to the number of semitones, becoming more sensitive from eleven semitones onwards, and the type of interval, possibly due to the influence of auditory musical training.
The concept of consonant intervals is at the origin of the Western musical tonal system, with the relationships between consonant and dissonant tones providing the basis for melody and harmony. If the perception of consonances is tactilely similar to auditory perception, the possibility of transmitting the melodic and harmonic basis of Western music vibrotactically opens up, offering a wide range of options for investigation.
